climate-driven uncertainties in modeling terrestrial gross...
TRANSCRIPT

Climate-driven uncertainties in modeling terrestrial grossprimary production: a site level to global-scale analysisRAHUL BARMAN1 , ATUL K . JA IN 1 and MIAOLING LIANG1 , 2
1Department of Atmospheric Sciences, University of Illinois at Urbana-Champaign, Urbana, IL, USA
Abstract
We used a land surface model to quantify the causes and extents of biases in terrestrial gross primary production
(GPP) due to the use of meteorological reanalysis datasets. We first calibrated the model using meteorology and eddy
covariance data from 25 flux tower sites ranging from the tropics to the northern high latitudes and subsequently
repeated the site simulations using two reanalysis datasets: NCEP/NCAR and CRUNCEP. The results show that at
most sites, the reanalysis-driven GPP bias was significantly positive with respect to the observed meteorology-driven
simulations. Notably, the absolute GPP bias was highest at the tropical evergreen tree sites, averaging up to ca.
0.45 kg C m�2 yr�1 across sites (ca. 15% of site level GPP). At the northern mid-/high-latitude broadleaf deciduous
and the needleleaf evergreen tree sites, the corresponding annual GPP biases were up to 20%. For the nontree sites,
average annual biases of up to ca. 20–30% were simulated within savanna, grassland, and shrubland vegetation
types. At the tree sites, the biases in short-wave radiation and humidity strongly influenced the GPP biases, while the
nontree sites were more affected by biases in factors controlling water stress (precipitation, humidity, and air temper-
ature). In this study, we also discuss the influence of seasonal patterns of meteorological biases on GPP. Finally, using
model simulations for the global land surface, we discuss the potential impacts of site-level reanalysis-driven biases
on the global estimates of GPP. In a broader context, our results can have important consequences on other terrestrial
ecosystem fluxes (e.g., net primary production, net ecosystem production, energy/water fluxes) and reservoirs (e.g.,
soil carbon stocks). In a complementary study (Barman et al., 2013), we extend the present analysis for latent and sen-
sible heat fluxes, thus consistently integrating the analysis of climate-driven uncertainties in carbon, energy, and
water fluxes using a single modeling framework.
Keywords: gross primary production (GPP), Integrated Science Assessment Model (ISAM), land surface model, uncertainty
Received 7 May 2013; revised version received 5 September 2013 and accepted 8 September 2013
Introduction
The response of the terrestrial vegetation to climate is
currently being investigated using both measurements
and models. In conjunction with data-driven methods
that provide valuable insights into biospheric responses
to environmental changes (Law et al., 2002; Beer et al.,
2010; Yi et al., 2010; Jung et al., 2011), land surface mod-
els (LSMs) are being used for further hypothesis testing
(Sellers et al., 1996a,b). LSMs are also especially impor-
tant – for coupling to climate and earth system models
to determine future changes (Denman et al., 2007;
Meehl et al., 2007). However, substantial uncertainties
remain in current model estimates of terrestrial carbon,
energy, and water fluxes, and it is becoming increasingly
necessary to quantify and reduce these uncertainties
(Ahlstr€om et al., 2012; Wang & Dickinson, 2012).
One important uncertainty in the models arises from
inaccuracies in input datasets itself, such as from mete-
orological forcings (i.e., climate). While photosynthetic
assimilation in LSMs are governed based on mechanis-
tic processes and parameterizations (Farquhar et al.,
1980; Ball, 1987; Collatz et al., 1991, 1992; Dai et al.,
2004; Bonan et al., 2011), the climatic/environmental
controls determine the specific response and seasonali-
ty of ecosystem productivity (Churkina & Running,
1998; Law et al., 2002; Nemani et al., 2003; Beer et al.,
2010). For example, climate influences GPP through
changes in solar radiation, precipitation, atmospheric
temperature, and humidity (controls vapor pressure
deficit) that determine the supply of light, water, and
nutrient availability to plant cells. The response of GPP
to warming is usually positive at low temperatures and
reduces at higher temperatures, and generally increas-
ing with photosynthetically active radiation, and
decreasing with increases in vapor pressure deficit
[e.g., see Fig. 2 of (Bonan et al., 2011). On a longer
timescale, climatic regimes also often determine the
2 Present address: Civil and Environmental Engineering, Princeton
University, Princeton, NJ, USA
Correspondence: Rahul Barman, tel. + 217 372 7134, fax + 217 372
1752, e-mail: [email protected];
Atul K. Jain, tel. + 217 333 2128, fax + 217 372 1752, e-mail:
© 2013 John Wiley & Sons Ltd 1
Global Change Biology (2014), doi: 10.1111/gcb.12474
Global Change Biology

photosynthetic pathway adopted by plant species (Still
et al., 2003). Indeed, the strength of meteorological driv-
ers in influencing the terrestrial GPP has been docu-
mented previous studies. For example, a study over
Europe (Jung et al., 2007) using several terrestrial bio-
sphere models showed that different meteorological
reanalysis datasets produced comparable changes in
GPP with that due to different models. At a global
scale, Zhao et al. (2006) showed that MODIS-derived
GPP ranged from ca. 101–125 GtC yr�1 (where GtC is
gigatonne of carbon = 1015 g C) based on the choice of
three reanalysis datasets. In LSMs with coupled biogeo-
chemistry, these uncertainties in GPP are most likely to
produce significant differences in subsequent carbon
fluxes (e.g., net primary production (NPP), net ecosys-
tem exchange (NEE), and litter fall), and in soil carbon
reservoirs. In addition, given such documented uncer-
tainties in GPP based on meteorological inputs (at
regional to global scales), corresponding impacts on
LSM-derived energy and water fluxes from vegetation
also warrant careful study.
To systematically quantify the modeling uncertain-
ties based on reanalysis data, a key question is: what
are the uncertainties in the aforementioned fluxes after
calibrating a LSM using ground-based observational
data, such as from FLUXNET (Baldocchi et al., 2001).
Ecosystem-level measurements of above-canopy car-
bon, energy, and water fluxes, along with ancillary
meteorological measurements are currently available at
numerous FLUXNET sites (Baldocchi, 2008). To reliably
use LSMs, the benefits of using such data for model cal-
ibration havepreviously been established (Friend et al.,
2007; St€ockli et al., 2008; Williams et al., 2009; Blyth
et al., 2010). In this context, consistently calibrating a
LSM requires the use of observed site meteorology
(model input) in tandem with eddy covariance data
(model output for evaluation) (e.g., St€ockli et al., 2008).
However, for subsequent regional/global applications,
the biases in meteorology fields in reanalysis datasets
(Fekete et al., 2004; Zhao et al., 2006) are most likely to
result in biased modeled fluxes.
Here, we investigate such biases in canopy fluxes
from reanalysis datasets using one particular LSM – the
Integrated Science Assessment Model (ISAM). The cur-
rent ISAM combines the existing biogeochemical com-
ponents of the model (Yang et al., 2009; Jain et al., 2009,
2013) with detailed biogeophysical schemes selectively
adapted from several other LSMs [details in this paper;
(Barman et al., 2013; El-Masri et al., 2013; Song et al.,
2013). The original goal of this integration was to extend
the capability of ISAM for use in an earth system model
(Barman et al., 2011). A previous iteration of this model
has been used in model-data intercomparison studies
elsewhere (Huntzinger et al., 2012; Richardson et al.,
2012; Schaefer et al., 2012; Kauwe et al., 2013). Here, we
further improved the model based on FLUXNET data
and used it to analyze the climate-driven biases in mod-
eled GPP, latent heat (LE), and sensible heat (H) fluxes.
We subdivided the entire analysis into two complemen-
tary studies; in the current part, we focus on GPP and
present the impacts on LE andH in Barman et al. (2013).
Our specific objectives are as follows: (i) to present
the calibration of key vegetation parameters influencing
GPP, derived from model optimization at 25 FLUXNET
sites; (ii) to analyze the climate-driven uncertainties in
GPP directly at the site-level using two reanalysis data-
sets as inputs: CRUNCEP and NCEP/NCAR (refer-
ences in Methods); (iii) to determine the dominant
meteorological controls causing the model biases; and
(iv) to discuss the corresponding impacts on global-
scale modeling of GPP. Differing from previous studies
based on FLUXNET data using statistical and/or diag-
nostic techniques (Law et al., 2002; Beer et al., 2010; Yi
et al., 2010; Jung et al., 2011), our use of a LSM frame-
work enables us to investigate the causes of these biases
due to both environmental (abiotic) and plant func-
tional/physiological (biotic) controls. Additionally, the
site-level analysis adopted here allows us to consis-
tently compare the modeled GPP biases with the driver
reanalysis biases. Finally, comparable regional/global
studies have focused on GPP uncertainties (Zhao et al.,
2006; Jung et al., 2007); and the integrated analysis of
uncertainties in GPP, energy/water fluxes using the
same model framework – such as presented in our
studies [the current study, and Barman et al. (2013)] has
not yet been documented in literature.
Materials and methods
GPP and Carbon cycle components in ISAM
ISAM simulates carbon, energy, and water fluxes at half-
hourly to hourly time steps. In the following sections, we
briefly summarize the photosynthesis-related schemes and
parameters in ISAM. Further details of carbon cycle processes
in ISAM, including the representation of energy/water com-
ponents are also available in other studies (Barman et al., 2013;
El-Masri et al., 2013; Song et al., 2013).
Photosynthesis in the model is based on a coupled ‘leaf tem-
perature – photosynthesis – stomatal conductance’ scheme
(Dai et al., 2004). This utilizes leaf-level photosynthesis for the
C3 (Farquhar et al., 1980; Collatz et al., 1991) and the C4
(Collatz et al., 1992) enzyme-kinetic pathways. The stomatal
conductance implementation is a variant of the Ball–Berry
model (Ball, 1987; Collatz et al., 1991). Leaf-level photosynthe-
sis and stomatal conductance are scaled to the canopy level
separately for sun and shaded leaves, using sun/shade
canopy Leaf Area Index (LAI) fractions and scaling parame-
ters to represent extinction of nitrogen and light through the
© 2013 John Wiley & Sons Ltd, Global Change Biology, doi: 10.1111/gcb.12474
2 R. BARMAN et al.

vertical canopy (Dai et al., 2004). We revised the ‘two-stream’
scheme of Dai et al. (2004) by implementing the treatment of
diffuse radiation from Bonan et al. (2011); this reduces biases
in shaded leaf photosynthesis. A day-length correction factor
on Vcmax (maximum carboxylation rate) was also included
(Bonan et al., 2011). Formulations of soil moisture availability
in ISAM adapted from Oleson et al. (2008) and further modi-
fied based on El Maayar et al. (2009). LAI in ISAM is pre-
scribed; however, for the herbaceous biomes, we additionally
constrain the phenology to reduce biases in leaf onset/fall per-
iod (El-Masri et al., 2013). In the prognostic C-N configuration,
GPP in ISAM is modified through the feedback of N-availabil-
ity and is obtained by dynamically comparing plant N-
demand and supply (El-Masri et al., 2013). In the diagnostic C-
N configuration, we directly prescribe N-limited Vcmax (i.e.,
Voptcmax 25fðNÞ) (Kattge et al., 2009).
Data
FLUXNET data. We used eddy covariance data and ancillary
meteorology from 25 sites from the FLUXNET network
(Table 1, Fig. S1). The geographic range of the chosen sites span
across North and South America (Table 1), varying in latitudes
from approximately 22°S–71°N. The North American sites used
here are a subset of the North American Carbon Program
(NACP) site synthesis (Schwalm et al., 2010a; Schaefer et al.,
2012), while the South American sites are a part of the Large-
Scale Biosphere-Atmosphere Experiment in Amazonia (LBA)
model intercomparison project (El-Masri et al., 2013). In ISAM
(the LSM used in this study), functionally similar vegetation
types in the global land surface are grouped into a finite num-
ber of plant functional types (PFTs). To optimize the model per-
formance for global applications, we used strategic sampling
by picking sites representative of major ecoclimatological types
in the global land surface. Our chosen sites encompass the fol-
lowing PFTs used in the model: tropical broadleaf evergreen
tree (Trop.BET) and broadleaf deciduous tree (Trop.BDT), tem-
perate broadleaf deciduous tree (Temp.BDT), needleleaf ever-
green tree (NET), savanna, grass, shrub, tundra, and pasture
(Table 1). From the available number of sites in the NACP and
the LBA syntheses, we selected sites that contained uninter-
rupted meteorological records during the study period, with
low instability in the partitioning algorithm of NEE to GPP, and
with reasonable energy balance characteristics (also see,
Barman et al., 2013). Because our primary goal was to investi-
gate climate-driven uncertainties in ecosystem fluxes, we lim-
ited the current study to sites without dominant anthropogenic
disturbances, such as harvesting (e.g., Sakai et al., 2004), clear-
cutting and stand-replacing fire (e.g., Krishnan et al., 2009; Zha
et al., 2009). Therefore, we also did not include any crop sites in
this study (due to the presence of harvesting, rotation practices,
and other crop-specific processes); detailed representation of
crop-specific processes in ISAM has been documented in Song
et al. (2013). Overall, our synthesis represents a total of 84
site-years of data measured from 1997 to 2004.
Half-hourly/hourly time-series data for consistently gap-
filled meteorology (Ricciuto et al., 2009) and GPP were avail-
able at the chosen sites (see, supplementary text S1). At sites
where the total gap exceeds 15% for the data record (see, foot-
note of Table 1), we used published GPP estimates based on
flux tower data (rather than filling the GPP gaps ourselves).
For the NACP sites, the random and partitioning uncertainties
in GPP were also available in the data. We computed these
uncertainties for the LBA sites based on available schemes
from literature (supplementary text S1). For all sites, we first
combined the half-hourly/hourly random and partitioning
uncertainties in quadrature and subsequently aggregated to
annual timescales (� Uncertainty in Table 1). Note that the
actual annual random uncertainties are most likely to be lower
than our estimates – due to compensation from positive and
negative uncertainties (Richardson et al., 2006; Baldocchi,
2008; Lasslop et al., 2008). However, we did not find any sta-
tistical schemes in literature quantifying this reduction; hence,
the � Uncertainty shown in Table 1 can only be used as the
maximum range in random uncertainties. Also, we did not
adjust the biases in flux tower GPP arising from lack of energy
balance closure; hence, GPP estimates from sites with poor
energy balance may be more uncertain (Wilson et al., 2002).
Finally, there are varying degrees of confidence intervals
around the FLUXNET estimates itself; notably, while the com-
putation of GPP and respiration provided by the FLUXNET
database (used here) are carried out for uniformity, the flux
partitioning provided by site principal investigators may be
different than that from the database. However, this is
expected to have minimal consequences for the results and
implications of this study.
Forcing data and model experimental setup. We performed
three off-line ISAM simulations at every flux tower site: (i)
ISAM-FLUXNET – using the observed site-level meteorology,
(ii) ISAM-NCEP – using the NCEP/NCAR reanalysis (Qian
et al., 2006), and (iii) ISAM-CRUNCEP – using the CRUNCEP
reanalysis (Viovy & Ciais, 2009; Wei et al., 2013). For the two
latter simulations, we extracted the required site-level meteo-
rological variables from the reanalysis datasets corresponding
to the location of each flux tower (supplementary text S2). The
NCEP/NCAR reanalysis has been widely used in LSM-related
studies (e.g., Bonan et al., 2011, 2012), and in remote sensing
applications (Nemani et al., 2003; Zhao et al., 2006; Zhao &
Running, 2010). The CRUNCEP reanalysis is a newer product,
being used in several ongoing model Intercomparison projects
such as the MsTMIP (Multi-scale Synthesis and Terrestrial
Model Intercomparison Project) (http://nacp.ornl.gov/
MsTMIP.shtml), and the TRENDY (http://dgvm.ceh.ac.uk/;
Sitch et al., 2008).
We first used the ISAM-FLUXNET simulations for model
optimization. Next, utilizing the site-specific ISAM-FLUXNET
simulations as the reference (‘control’), we calculated the biases
in GPP from the two reanalysis-driven simulations (ISAM-
NCEP and ISAM-CRUNCEP). Here, firstly, we acknowledge
that such direct comparison of flux tower meteorology with
those derived from coarse resolution reanalyses has its limita-
tions. Nonetheless, spatial coherence of biases in reanalysis has
been established (e.g., Zhao et al., 2006), and site-scale meteo-
rology has been used to evaluate/improve global reanalysis
data (Weedon et al., 2011) supporting the basis of our study.
© 2013 John Wiley & Sons Ltd, Global Change Biology, doi: 10.1111/gcb.12474
CLIMATE-DRIVEN UNCERTAINTIES IN GPP 3

Table 1 FLUXNET sites used in this study*
Site Code Site Name
Lon
[�E]Lat
[�N]
Hgt
[m] Years (Total)
Max
LAI
GPP [kg C m�2 yr�1]
Site/Data
ReferenceISAM**
FLUXNET†
Mean‡
� Uncertainty§
Tropical Broadleaf Evergreen Tree (Trop.BET)
LBA-Km34 Manaus KM34 �60.25 �2.75 50 2002–2004 (3) 6.0 3.03 2.90 � N.A El-Masri et al. (2013)
LBA-Km67 Santarem KM67 �55.25 �3.25 63 2003–2004 (2) 5.6 2.94 3.10 � 0.63 El-Masri et al. (2013)
LBA-Km83 Santarem KM83 �55.25 �3.25 64 2001–2003 (3) 5.3 2.89 2.70 � 0.61 El-Masri et al. (2013)
LBA-Rja Reserva Jaru �62.25 �10.25 60 2000–2001 (2) 5.5 2.94 3.00 � 0.64 El-Masri et al. (2013)
Tropical Deciduous Evergreen Tree (Trop.BDT)
LBA-Ban Bananal Island �50.25 �10.25 40 2004–2004 (1) 5.2 2.66 2.70 � 0.63 El-Masri et al. (2013)
Temperate Broadleaf Deciduous Tree (Temp.BDT)
CA-Oas South OldAspen �106.25 53.25 39 1997–2004 (8) 5.0 1.01 1.07 � 0.30 Kljun et al. (2007)
US-Syv Sylvania
Wilderness
�89.75 45.75 36 2002–2004 (3) 7.6 1.14 1.03 � 0.30 Desai et al. (2005)
US-WCr Willow Creek �122.25 45.75 68 1999–2004 (6) 7.3 1.11 0.95 � 0.30 Cook et al. (2004)
Needleleaf Evergreen Tree (NET)
CA-Gro Groundhog River �82.25 47.75 30 2004–2004 (1) 5.0 0.88 0.98 � 0.29 McCaughey et al.
(2006)
CA-Obs South
OldBlackSpruce
�105.25 53.75 39 2000–2004 (5) 3.1 0.68 0.78 � 0.26 Kljun et al. (2007)
CA-Ojp South OldJackPine �104.75 53.75 28 2000–2003 (4) 3.4 0.71 0.60 � 0.25 Kljun et al. (2007)
CA-Qfo East OldSpruce �74.75 49.25 25 2004–2004 (1) 3.6 0.67 0.64 � 0.25 Bergeron et al. (2007)
US-Me3 Metolius 2nd
YoungPine
�121.75 44.25 30 2004–2004 (1) 4.1 0.82 0.88 � 0.27 Vickers et al. (2009)
US-NR1 Niwot Ridge �105.75 39.75 30 1999–2004 (6) 3.4 0.67 0.80 � 0.27 Monson et al. (2002)
Savanna
US-Ton Tonzi Ranch �121.25 38.25 30 2002–2004 (3) 4.3 0.85 0.92 � 0.24 Ma et al. (2007)
LBA-Pdg Reserva
Pe-de-Gigante
�47.75 �21.75 21 2001–2003 (3) 3.4 1.46 1.30 � 0.30 El-Masri et al. (2013)
Grass
CA-Let Lethbridge �113.25 49.25 4 1999–2004 (6) 2.8 0.34 0.49 � 0.21 Flanagan and
Adkinson (2011)
US-Shd¶ Shidler Tallgrass �96.75 36.75 4.5 1998–1999 (2) 4.5 1.71 1.72 � 0.27 Suyker et al. (2003)
US-Var Vaira Ranch �121.25 38.25 2.5 2001–2004 (4) 4.3 0.84 0.67 � 0.23 Ma et al. (2007)
CA-Mer Mer Bleue �75.75 45.25 3 1999–2004 (6) 6.3 0.74 0.57 � 0.25 Roulet et al. (2007)
US-Los Lost Creek �90.25 45.75 35 2001–2004 (4) 7.1 0.69 0.78 � 0.23 Sulman et al. (2009)
US-SO2 Sky Oaks Old �116.75 33.25 6 1999–2004 (6) 2.9 0.71 0.73 � 0.20 Luo et al. (2007)
Tundra
US-Atq Atqasuk �157.25 70.25 4.5 2004–2004 (1) 1.5 0.16 N.A.� N.A. –
US-Brw Barrow �156.75 71.25 4.5 2001–2001 (1) 1.5 0.16 0.14 � N.A. Eugster et al. (2000)
Pasture
LBA-Fns¶ Fazenda Nossa
Senhora
�62.75 �11.25 8.5 2000–2001 (2) 5.5 2.12 2.20 � 0.29 El-Masri et al. (2013)
*Lon (longitude) and Lat (latitude) are corresponding to the 5° 9 0.5° land grid cell center used in the model simulations. Hgt is the
approximate height of the flux measurements above the surface (also used as the reference height in the model). Max LAI is the
monthly maximum LAI data at each site.
**Model simulated GPP (ISAM-FLUXNET).
© 2013 John Wiley & Sons Ltd, Global Change Biology, doi: 10.1111/gcb.12474
4 R. BARMAN et al.

Henceforth, we do not seek to reestablish these biases; rather
our goal is to relate their impacts on corresponding GPP esti-
mates. Secondly, due to the difference in spatial resolution
between the NCEP/NCAR and the CRUNCEP source datasets
(ca. 2.5° 9 1.9° and 0.5° 9 0.5°, respectively; see supplemen-
tary text S2), different spatial interpolation schemes are also
likely to contribute to the resulting GPP uncertainties/biases.
However, a spatial comparison between them showed consis-
tent and regional-scale relative differences (Fig. S2); such differ-
ences are most likely to dominate the model response over
those due to different interpolation schemes.
For each simulation, we prescribed the site-specific LAI cli-
matology based on GIMMS (provided in the MsTMIP driver
datasets). We used soil texture (sand/clay) from site records
when available, else we used data from the global Interna-
tional Geosphere-Biosphere Program (IGBP) Global Soil Data
Task Group (2000). Soil properties in ISAM also vary with soil
organic carbon concentrations, which we obtained from the
0.5�90.5� Harmonized World Soil Database (HWSD) (FAO/
IIASA/ISRIC/ISSCAS/JRC, 2012) . For model spin-up, we ini-
tialized each simulation using arbitrary initial conditions:
soil/vegetation temperature of 274.15 K, soil water at field
capacity, and the absence of snow and leaf dew. Because the
use of a prognostic C-N model configuration (available in
ISAM) requires long spin-up times [in the order of thousands
of years, e.g., Koven et al. (2013)], we used a diagnostic C-N
approach in this study whereby the effect of N-limitation on
photosynthesis is calibrated into the carboxylation parameter
(i.e., direct use of Voptcmax 25fðNÞ, see the section below for
details). Consequently, we spun up each site for a total of 100
years by repeating available meteorology and atmospheric
[CO2], to obtain steady state (Fig. S3).
ISAM calibration and evaluation of GPP. Using the
observed meteorological input at sites, we adjusted several
PFT-specific parameters to optimize the model performance
with FLUXNET eddy covariance data. For PFTs with multiple
flux tower sites in Table 1, we used independent sites for
model optimization and evaluation. Prior to model calibration,
initial estimates of tunable PFT parameters for ISAM were
generally obtained from literature (Collatz et al., 1991, 1992;
Sellers et al., 1996a,b; Schenk & Jackson, 2002a,b;). Beginning
with these, we used the ‘trial and error’ approach of parame-
ter adjustment to concurrently optimize the GPP, latent heat,
and sensible heat fluxes from ISAM with the corresponding
flux tower estimates. A similar model calibration approach
has also been used in previous studies using the ISAM frame-
work (El-Masri et al., 2013; Song et al., 2013). We note that sev-
eral systematic model optimization methods are currently
available (e.g., Raupach et al., 2005; Williams et al., 2009);
nonetheless, for the specific objectives of this study, it was suf-
ficient to use the current approach.
The values of key photosynthetic and morphological
parameters related to GPP, postmodel calibration is listed in
Table 2. Additional parameters related to energy/water fluxes
(e.g., stomatal conductance parameters, canopy optical prop-
erties, etc.) are described in our companion study (Barman
et al., 2013). Following model optimization, the ISAM esti-
mated annual mean GPP was within the ‘Mean � Uncer-
tainty’ estimates from FLUXNET (Table 1; Fig. 1). At most
sites, the modeled annual mean GPP difference was ≤10–15%of the annual FLUXNET mean.
The modeled GPP was strongly dependent on the carboxyl-
ation parameter Voptcmax 25fðNÞ. In the calibrated model, the val-
ues of Voptcmax 25fðNÞ for various PFTs (Table 2) are generally
consistent with those from the TRY database (Kattge et al.,
2009, 2011). Here, the tropical and temperate tree PFTs were
exceptions, where our values are much higher: for example,
for Trop.BET, Kattge et al. (2009): 41, ISAM: 83. However, the
corresponding values used in ISAM are still within the range
of other measured estimates, for example, 94 (Beerling &
Quick, 1995), and species dependent values >100 (Kattge &
Knorr, 2007).
For the high-latitude ecosystems (e.g., NET, tundra, etc.),
we also added a low-temperature stress on rubisco-dependent
assimilation following the recommendation of Schaefer et al.
(2012). In the original CoLM and CLM models (Common Land
Model and Community Land Model, respectively) based on
which photosynthesis schemes are adapted in ISAM, such a
low-temperature constraint was only imposed on the C4 PFTs
(Dai et al., 2004; Bonan et al., 2011). We implemented an analo-
gous constraint on the cold region C3 PFTs (using parameter
hlti in Table 2), which reduced the generally positive winter-
time GPP bias that were also prevalent in many NACP synthe-
sis models (Schaefer et al., 2012). Subsequently, this
optimization of the temperature response also allowed us to
use more realistic Voptcmax 25fðNÞ for cold region PFTs in the
model [consistent with Kattge et al. (2009)].
†For the US and Canada (CA-) sites, half-hourly flux data are available from the North American Carbon Project (NACP) Synthesis
(Schaefer et al., 2012); For LBA sites, flux data are available from: www.lbaeco.org/lbaeco/data.htm.
‡Sites where total missing data exceeds 15% for the years used in this study, the annual GPP budget are from published FLUXNET
estimates. These sites and data references are: US-SO2 (Falge et al., 2002); LBA-Km34, LBA-Km67, LBA-Km83, LBA-Rja, LBA-Ban,
LBA-Pdg, LBA-Fns [(El-Masri et al., 2013), and references cited therein); US-Syv (Desai et al., 2005). Note that the published GPP
data may not be corresponding to the exact years used in this study; however, they typically represent the annual budget of GPP
which may be sufficient for model evaluation. Sites without sufficient FLUXNET data or published GPP estimates are listed as NA,
not available.
§Uncertainty calculations are using FLUXNET half-hourly/hourly data, aggregated annually to maximum uncertainty ranges. For
details on schemes/methods used, please refer to supplementary textS1. Uncertainty calculations could not be computed for sites
where photosynthetically active radiation (PPFD) data were not available from FLUXNET (listed as NA, not available).
¶Mixed C3/C4 site: US-Shd - simulated as 45% C3/55% C4 based on species composition from Suyker et al. (2003); LBA-Fns - pre-
dominantly C4 species grasses (Andreae et al., 2002), and was simulated as purely C4.
© 2013 John Wiley & Sons Ltd, Global Change Biology, doi: 10.1111/gcb.12474
CLIMATE-DRIVEN UNCERTAINTIES IN GPP 5

Another key morphological PFT control influencing GPP is
the root structure. In ISAM, we used static root depth/profile
for individual PFTs, based on Schenk & Jackson (2002a). How-
ever, the rooting depths of tropical trees (Trop.BET/BDT)
from the aforementioned study appear to be shallow (e.g.,
50% rooting depth: D50 = 15 cm); hence, we used a D50 ca.
80 cm (corresponding D95 ca. 4 m) for Trop.BET/BDT to
improve the modeled GPP. Use of deep roots for tropical trees
is consistent with other field estimates [e.g., mean root depth
>3 m in Schenk & Jackson (2002b), and very deep roots of
>7 m in Canadell et al. (1996)]. In addition, we also increased
the D50 for savanna and shrub PFTs. To accommodate the
deep roots, the maximum hydrologically active soil column
depth used in ISAM was extended to 6 m [original value
implemented in the model was 3.5 m based on CLM3.5
(Oleson et al., 2008)].Table
2Key
PFT-dep
enden
tparam
etersforISAM
calibration.Only
thePFTswithav
ailable
site
data(from
Tab
le1)
aresh
own
Param
eters*
PFT
Trop.BET
Trop.BDT
Tem
p.BDT
NET
Sav
anna
Grass
Shrub
Tundra
Pasture
Vopt
cmax
25fðN
Þ[lmol/m
2/s]
8394
8162
70(C
3)35†(C
4)
70(C
3)35
(C4)
4050
70†(C3)35
(C4)
e[m
ol-CO
2/mol-quan
ta]
0.08
0.08
0.06
0.06
0.06
(C3)0.04†(C
4)
0.06
(C3)0.04
(C4)
0.06
0.06
0.06
†(C
3)0.04
(C4)
hhti[K
]31
331
131
130
830
830
831
330
330
8
hlti[K
]NR‡
NR‡
275
275
NR‡(C
3)28
1†(C
4)
275(C3)28
1(C4)
275
275
NR‡(C3)28
1(C4)
Kn[-]
0.5
0.5
0.5
0.5
0.5
0.5
0.5
0.5
0.5
D50[cm]
8080
2112
507
509
7
c[-]
�1.632
�1.681
�1.835
�1.880
�1.798
�1.176
�1.909
�2.621
�1.176
D95[cm]
D509
(1/0.95
–1)
1/c
*Descriptionofparam
eters:V
opt
cmax
25fðN
Þ–Nitrogen
-downregulatedmax
imum
rubisco
capacityat
topofcanopyat
25°C
per
leaf
area;e–Intrinsicquan
tum
yield;hh
ti–one-half
pointofhigh-tem
perature
inhibitionfunction;hlti–one-halfpointoflow-tem
perature
inhibitionfunction;Kn–coefficien
tofleaf
nitrogen
allocationwithin
canopy;D
50–50
%
rootingdep
th;c–dim
ensionless
rootsh
apeparam
eter;D
95–95
%rootingdep
th.Defi
nitionofV
opt
cmax
25fðN
Þisbased
onBonan
etal.(201
1);defi
nitionsofe,hh
ti,hlti,an
dKnare
based
onDai
etal.(20
04);defi
nitionsofD
50,c,an
dD
95arebased
onSch
enk&
Jackson(200
2a).
†Defau
ltmodel
valuewas
notderived
from
model
calibration,becau
seofunav
ailabilityofcorrespondingPFTsites.
‡NR,Notrequired
forthisPFT;an
donly
implemen
tedforcold
regionC3PFTs.
Fig. 1 Mean annual GPP at FLUXNET sites used in this
study, for observational/flux data and model simulations
(ISAM-FLUXNET, ISAM-CRUNCEP, and ISAM-NCEP). ‘FLUX-
NET max uncertainty’ denotes the � uncertainty range from
Table 1.
© 2013 John Wiley & Sons Ltd, Global Change Biology, doi: 10.1111/gcb.12474
6 R. BARMAN et al.

Results
Site-level reanalysis-driven uncertainties in GPP
At each site, the model estimated mean annual GPP
using the three sets of simulations are shown in Fig. 1.
Using these, we computed the mean annual GPP biases
in the ISAM-NCEP and the ISAM-CRUNCEP simula-
tions with respect the ISAM-FLUXNET simulations.
Here, we subsequently refer to these as DGPP (Fig. 2a).
The results show that at most sites mean annual DGPP
was positive, indicating an overestimation of GPP in
the both the reanalysis-driven simulations. Only in 4 of
50 simulations (25 sites 9 2 reanalysis), the correspond-
ing DGPP was negative (Table S1). Overall, for the
Trop.BET (4 sites), the mean annual DGPP was ca. 0.45
kg C m�2 yr�1 using both the reanalysis datasets,
resulting in ca. 15% overestimation of ISAM-FLUXNET
GPP (Table 3). The mean annual DGPP resulted in
17–19% overestimation of ISAM-FLUXNET GPP in the
Temp.BDT (3 sites), and 11–18% for the NET (6 sites).
Similarly, depending on the reanalysis meteorology
used, an average annual DGPP of up to 20% was simu-
lated at the savanna sites (2 sites), up to 31% at the
grass sites (3 sites), and up to 21% at the shrub sites (3
sites). In the remainder of this section, we discuss the
driving factors and underlying mechanisms of these
biases at the site-level and/or PFT level as appropriate.
Tree/Forest (Trop.BET/BDT, Temp.BDT, NET)
Corresponding to the positive DGPP at the individual
Trop.BET/BDT sites (Fig. 2a), the input biases in mean
annual temperature (DTavg), solar radiation (DSrad),and specific humidity (DQ) were also positive (Fig. 2b-
d). From a daily climatological perspective, persistent
DGPP were simulated for the Trop.BET throughout the
year corresponding to predominantly +DTavg, +DSradand +DQ in both the reanalysis datasets (Fig. 3). We
examined if there were any single meteorological fac-
tors dominating the GPP response/biases in these eco-
systems. In this context, a simple univariate regression
utilizing daily level model data from all the Trop.BET/
BDT simulations produced weak R2 for GPP vs. single
(a) (b) (c) (d) (e)
Fig. 2 (a) Site-level mean annual GPP biases (DGPP) in the reanalysis-driven simulations (ISAM-CRUNCEP, ISAM-NCEP), computed
with respect to the respective ISAM-FLUXNET simulations. DISAM-NCEP = ISAM-NCEP – ISAM-FLUXNET, DISAM-CRUN-
CEP = ISAM-CRUNCEP – ISAM-FLUXNET. Note: negative DGPP at US-NR1 (using ISAM-CRUNCEP) and at US-SO2 (using ISAM-
NCEP) < �0.1 kg C m�2 yr�1 were clipped from the figure axis. (b–e) Mean annual biases in input meteorology variables: (b) DTavg,(c) DSrad, (d) DQ, and (e) DPrecip.
© 2013 John Wiley & Sons Ltd, Global Change Biology, doi: 10.1111/gcb.12474
CLIMATE-DRIVEN UNCERTAINTIES IN GPP 7

meteorology variables (R2: GPP vs. Tavg: 0.13, GPP vs.
Srad: 0.22, GPP vs. Q: 0.30; see Fig. S4a), showing that
no single variable dominating the GPP response.
Previously, other modeling studies also showed that
productivity in ecosystems is generally a result of non-
linear interactions of several meteorological and envi-
ronmental factors (including LAI, soil properties, and
hydrology); hence, a generic dependence between GPP
and a single environmental control may not be
expected (e.g., Churkina & Running, 1998). Nonethe-
less, in the model simulations using the observed mete-
orology (ISAM-FLUXNET), there were large decreases
in daily GPP coincident with reductions in daily Srad
and Tavg at the individual Trop.BET/BDT sites (Fig.
S5). Such reductions of Srad and Tavg in the FLUXNET
meteorology data (most likely due to cloudy events)
were not present in the reanalysis datasets. Conse-
quently, the associated daily reductions in GPP were
also absent. Aggregated annually, such reductions in
daily GPP in the ISAM-FLUXNET simulations signifi-
cantly contributed to the positive annual DGPP in the
reanalysis-driven simulations. In addition, the mean
annual DQ in the NCEP/NCAR was also consistently
positive (generally true at other sites as well), which
Table 3 Site averaged annual GPP and biases, grouped by
PFTs. DCRUNCEP = ISAM-CRUNCEP – ISAM-FLUXNET,
DNCEP = ISAM-NCEP – ISAM-FLUXNET. The values in
parenthesis are percentage differences of GPP with respect toI-
SAM-FLUXNET
PFT Sites
GPP [kg C m�2 yr�1]
ISAM-
FLUXNET DCRUNCEP DNCEP
Trop.BET 4 2.95 0.44(15) 0.45(15)
Trop.BDT 1 2.66 0.05(2) 0.15(6)
Temp.BDT 3 1.09 0.21(19) 0.19(17)
NET 6 0.74 0.08(11) 0.13(18)
Savanna 2 1.14 0.13(11) 0.23(20)
Grass 3 0.96 0.20(21) 0.30(31)
Shrub 3 0.71 0.15(21) �0.05(�7)
Tundra 2 0.16 0.01(7) 0.00(2)
Pasture 1 2.12 0.08(4) 0.18(8)
Fig. 3 Analysis for tree PFTs (Trop.BET, Trop.BDT, Temp.BDT, and NET): daily climatology of reanalysis-driven DGPP, DTavg, DSrad
and DQ – all averaged over the available number of sites (n) for each PFT. All the biases (D) were calculated with respect to the ISAM-
FLUXNET counterpart. Each row corresponds to a PFT group (name on left corner). Each column shows a variable (name on top). For
each subplot, the x-axis is the ‘Day of year’ and the y-axis is the respective variable.
© 2013 John Wiley & Sons Ltd, Global Change Biology, doi: 10.1111/gcb.12474
8 R. BARMAN et al.

helped to alleviate the atmospheric vapor pressure defi-
cit (VPD), thereby further increasing the +DGPP.
The GPP at the Trop.BET/BDT sites did not appear
to be water stressed from precipitation (during the ana-
lyzed years), as shown by the lack of root water stress
at the annual scale (modeled annual mean soil water
availability factor (bt) ca. 1, Fig. 4). This was also fur-
ther indicated by the lack of correlation between GPP
and annual total precipitation (Precip) across the Trop.-
BET/BDT sites (Fig. S4b). Hence, for these sites, the
water availability was not a factor in controlling the
GPP biases. Indeed, at two of the Trop.BET sites (LBA-
Km34, LBA-Rja), where mean annual DPrecip was nega-
tive in both the CRUNCEP and the NCEP/NCAR, the
resulting DGPP were still largely positive (Fig. 2a, e).
Hence, based on our analysis, the +DGPP for the Trop.-
BET/BDT are most likely to be robust irrespective of
the � annual DPrecip in the reanalysis datasets.
In contrast to the seasonally persistent DGPP Trop.-
BET/BDT sites, the reanalysis-driven DGPP for the
Temp.BDT (3 sites) and NET (6 sites) were confined
during the growing season, with maximum positive
biases during the peak of the growing season (Fig. 3).
However, similar to the Trop.BET/BDT, the simulated
+DGPP at the individual Temp.BDT and NET sites
could firstly be attributed to the presence of many days
with low Srad in the observed FLUXNET meteorology
data – a major factor in the resulting +DSrad (Fig. 3).
Annually, the mean +DSrad of ca. 10–30 W/m2 were
present at individual Temp.BDT and NET sites in the
CRUNCEP data, and very small +DSrad in NCEP/
NCAR (Fig. 2c). Nonetheless, during the growing sea-
son, the mean DSrad were significantly positive in both
the reanalysis datasets, with maximum amplitudes dur-
ing the peak of the growing season (Fig. 3). Overall, at
the Temp.BDT and NET sites, larger +DQ in the
NCEP/NCAR favored increased +DGPP in ISAM-
NCEP, while a larger +DSrad in the CRUNCEP
increased +DGPP in ISAM-CRUNCEP by more than off-
setting the impacts of slightly negative DQ (individual
sites: Fig. 2; PFT averages: Fig. 3).
The Temp.BDT and NET sites were also character-
ized by water stress (e.g., bt ranging from ca. 0.5–0.75 in
the ISAM-FLUXNET simulations, see Fig. 4). Note that,
the water stress in the model is dependent on Precip
(determining total input water), Tavg (controlling soil
freeze/thaw processes and hence availability of liquid
water), and other factors. Hence, depending on the
amount of annual Precip input using the reanalysis
datasets, the � DPrecip may alleviate/strengthen the
water stress, impacting DGPP in these ecosystems. This
was, for example, clearly evident at the US-Me3 NET
site where larger +DPrecip in the reanalysis datasets
favored large +DGPP (Fig. 2) by alleviating the water
stress (Fig. 4). A strong water stress was also evident at
the US-NR1 NET site using the CRUNCEP data (bt ca.0.37, Fig. 4), which was the only forest/tree site in our
study to simulate a negative DGPP (-34% in comparison
with ISAM-FLUXNET, Table S1). This was most likely
driven by both the large �DPrecip and �DQ at this site.
Nontree and herbaceous (Savanna, Grass, Shrub, Tundra,
Pasture). As opposed to the usually consistent seasonal-
ity of DGPP within the forest/tree PFT sites, large dif-
ferences in seasonality and magnitudes of DGPP were
simulated across individual sites within this category
(Fig. 5). These differences could be attributed to the lar-
ger North/South range of geographical location of sites
within a PFT, plant physiological differences in C3 vs.
C4 pathways, as well as on the direction (sign) of
specific meteorological biases. For example, of the two
contrasting savanna sites (US-Ton, LBA-Pdg), the
Fig. 4 Modeled annual mean soil water availability factor (bt) at each site. A value of 1 implies no soil moisture stress on photosynthe-
sis, while 0 implies no available water to plant roots.
© 2013 John Wiley & Sons Ltd, Global Change Biology, doi: 10.1111/gcb.12474
CLIMATE-DRIVEN UNCERTAINTIES IN GPP 9
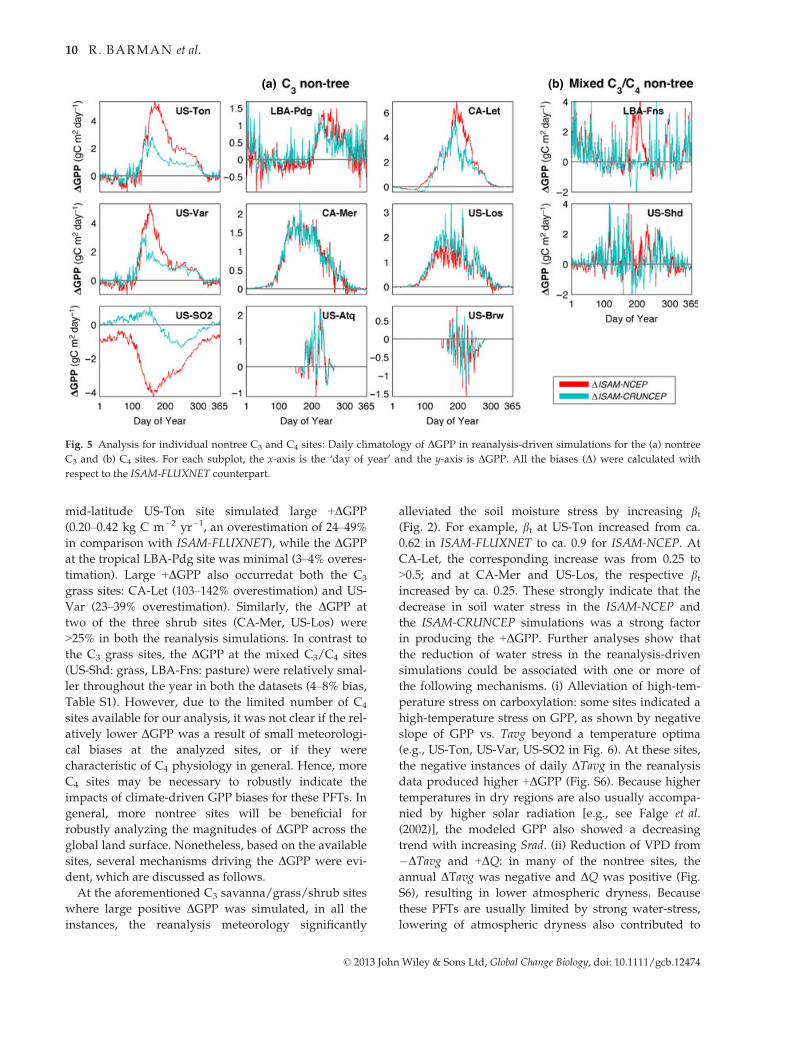
mid-latitude US-Ton site simulated large +DGPP
(0.20–0.42 kg C m�2 yr�1, an overestimation of 24–49%in comparison with ISAM-FLUXNET), while the DGPP
at the tropical LBA-Pdg site was minimal (3–4% overes-
timation). Large +DGPP also occurredat both the C3
grass sites: CA-Let (103–142% overestimation) and US-
Var (23–39% overestimation). Similarly, the DGPP at
two of the three shrub sites (CA-Mer, US-Los) were
>25% in both the reanalysis simulations. In contrast to
the C3 grass sites, the DGPP at the mixed C3/C4 sites
(US-Shd: grass, LBA-Fns: pasture) were relatively smal-
ler throughout the year in both the datasets (4–8% bias,
Table S1). However, due to the limited number of C4
sites available for our analysis, it was not clear if the rel-
atively lower DGPP was a result of small meteorologi-
cal biases at the analyzed sites, or if they were
characteristic of C4 physiology in general. Hence, more
C4 sites may be necessary to robustly indicate the
impacts of climate-driven GPP biases for these PFTs. In
general, more nontree sites will be beneficial for
robustly analyzing the magnitudes of DGPP across the
global land surface. Nonetheless, based on the available
sites, several mechanisms driving the DGPP were evi-
dent, which are discussed as follows.
At the aforementioned C3 savanna/grass/shrub sites
where large positive DGPP was simulated, in all the
instances, the reanalysis meteorology significantly
alleviated the soil moisture stress by increasing bt(Fig. 2). For example, bt at US-Ton increased from ca.
0.62 in ISAM-FLUXNET to ca. 0.9 for ISAM-NCEP. At
CA-Let, the corresponding increase was from 0.25 to
>0.5; and at CA-Mer and US-Los, the respective btincreased by ca. 0.25. These strongly indicate that the
decrease in soil water stress in the ISAM-NCEP and
the ISAM-CRUNCEP simulations was a strong factor
in producing the +DGPP. Further analyses show that
the reduction of water stress in the reanalysis-driven
simulations could be associated with one or more of
the following mechanisms. (i) Alleviation of high-tem-
perature stress on carboxylation: some sites indicated a
high-temperature stress on GPP, as shown by negative
slope of GPP vs. Tavg beyond a temperature optima
(e.g., US-Ton, US-Var, US-SO2 in Fig. 6). At these sites,
the negative instances of daily DTavg in the reanalysis
data produced higher +DGPP (Fig. S6). Because higher
temperatures in dry regions are also usually accompa-
nied by higher solar radiation [e.g., see Falge et al.
(2002)], the modeled GPP also showed a decreasing
trend with increasing Srad. (ii) Reduction of VPD from
�DTavg and +DQ: in many of the nontree sites, the
annual DTavg was negative and DQ was positive (Fig.
S6), resulting in lower atmospheric dryness. Because
these PFTs are usually limited by strong water-stress,
lowering of atmospheric dryness also contributed to
(a) (b)
Fig. 5 Analysis for individual nontree C3 and C4 sites: Daily climatology of DGPP in reanalysis-driven simulations for the (a) nontree
C3 and (b) C4 sites. For each subplot, the x-axis is the ‘day of year’ and the y-axis is DGPP. All the biases (D) were calculated with
respect to the ISAM-FLUXNET counterpart.
© 2013 John Wiley & Sons Ltd, Global Change Biology, doi: 10.1111/gcb.12474
10 R. BARMAN et al.

the increase in GPP. (iii) Annual +DPrecip to directly
supplement the soil moisture: for example, at US-Ton,
CA-Let, US-Var, CA-Mer, US-SO2 (Fig. 6). For exam-
ple, at US-Ton, the DPrecip of 0.4 m m�2 yr�1 in the
NCEP/NCAR strongly contributed to the correspond-
ing mean annual DGPP of 49%. Among the savanna/
shrub/grass sites, only the US-SO2 shrub site simu-
lated a very negative DGPP using NCEP/NCAR. At
this site, the dominant drivers of the DGPP were the
mean annual �DPrecip (ca. �0.25 m m�2 yr�1), as well
as the mean annual +DTavg (5 °C) that increased atmo-
spheric VPD. Note that, due to the very large �DGPP
at US-SO2 using NCEP/NCAR, the averaged DGPP
from 3 shrub sites used in this study was negative
(Table 3).
Finally, in the extreme high-latitude tundra sites
(US-Atq, US-Brw), the DTavg appeared to provide the
dominant control over DGPP. At US-Brw, even in the
presence of significantly positive mean annual DSrad in
both the reanalysis datasets, the large negative DTavg in
both the datasets (ca. �2.5 °C, Fig. 2) resulted in nega-
tive DGPP (accompanied by increase in soil water
stress). On the other hand, at US-Atq, the correspond-
ing mean annual DTavg and DGPP were both positive.
Global uncertainties in modeled GPP
As opposed to the site-level analysis, it is not possible
to accurately quantify the global-extent of climate-dri-
ven GPP biases in a LSM framework due to the lack of
Fig. 6 Analysis for C3 sites (only a subset of the sites are shown): daily climatology of GPP vs. Tavg, Srad and Q, respectively, (left
group); yearly GPP vs. Precip (right group). Each row of subplots corresponds to an individual site (site name on left corner). For each
subplot, the x-axis is the respective column variable (name on top) and the y-axis is the GPP. Note the use of daily vs. annual timescales
in the individual GPP-meteorology plots. Because GPP responds to changes in Tavg, Srad and Q on an hourly to subdaily timescale,
these respective variables were plotted using daily model output; Precip (which controls soil water availability) influences GPP on
monthly to annual timescales, and hence, annual model output was used for the GPP vs. Precip plot.
© 2013 John Wiley & Sons Ltd, Global Change Biology, doi: 10.1111/gcb.12474
CLIMATE-DRIVEN UNCERTAINTIES IN GPP 11

required global scale data (i.e., observed subdaily mete-
orology data at all model grid cells) to do so. Nonethe-
less, it may still be possible to assess the overall
consistencies and differences in the reanalysis-driven
GPP in a LSM by comparing with other observationally
derived estimates. Here, an important caveat is that for
global comparisons, other sources of uncertainty are
also present, such as the land-use and land-cover
change datasets (Meiyappan & Jain, 2012), the accuracy
of LAI datasets (Lawrence & Chase, 2007), the presence
of multiple crop types and rotation practices (i.e.,
human influence).Notably, although ISAM contains
representation of specific crop processes such as har-
vest, corn-soybean rotation, etc. (Song et al., 2013), in
this study, we used a single PFT for global crops
(though retaining the observed C3/C4distribution in
the model; see, Fig. S7). This is because the global land
cover dataset used here only contains ‘generic’ crops
(Meiyappan & Jain, 2012), and specific crop types have
not yet been implanted for the global application of the
model (similar to most other LSMs). The effects of such
simplifications require extensive evaluation, and here,
we only focus on the meteorological aspect of the GPP
biases/uncertainties.
We compared the mean annual GPP during
2000–2004 from the ISAM-NCEP and the ISAM-CRUN-
CEP simulations with two different sources for globally
gridded GPP: (i) FLUXNET-MTE (Jung et al., 2011), and
(ii) MODIS (MOD17) (Zhao et al., 2006; Zhao &
Running, 2010) (Fig. 7). For consistency, all the GPP
estimates (ISAM, FLXNET-MTE, and MODIS) were
compared based on the 0.5° 9 0.5° ISAM land mask,
and any nonvegetated grid cells were removed from all
the sources (based on the vegetation mask in Fig. S8).
The resulting zonally averaged mean annual GPP esti-
mates are shown in Fig. 8, which forms the basis for
this discussion.
Globally, the relative GPP difference between ISAM-
NCEP and ISAM-CRUNCEP was only ca. 4 GtC yr�1,
the ISAM-NCEP being slightly higher than the ISAM-
CRUNCEP (Fig. 8a). However, because both the reanal-
ysis-driven simulations were positively and similarly
biased with respect to the site-level ISAM-FLUXNET
simulations, the relatively small GPP differences using
the two reanalysis datasets does not imply good agree-
ment with observations at a global scale. This was
evident when we compared our estimates with one of
the MODIS-derived GPP estimates that used a daily
(a) (b)
(c) (d)
Fig. 7 Maps of mean annual estimates of GPP, for two reanalysis-driven model simulations (ISAM-CRUNCEP (a), ISAM-NCEP (b))
and observationally derived datasets [FLUXNET-MTE (c), MODIS-DAO (d)]. All the results are based on averaged output for
2000–2004 and are only for vegetated land surfaces (Fig. S8).
© 2013 John Wiley & Sons Ltd, Global Change Biology, doi: 10.1111/gcb.12474
12 R. BARMAN et al.

reanalysis with small meteorological biases (Zhao et al.,
2006) (MODIS-DAO in Fig. 8a-b). In comparison with
this data, the ISAM simulations overestimated GPP
across the tropical/subtropical to the northern high-
latitudes, with maximum differences of ca.
0.5 kg C m�2 yr�1 at the deep tropics (also consistent
with our site-level biases). Only between 20–40°S (with
low-vegetation coverage), the ISAM simulations under-
estimated GPP relative to the MODIS-DAO-derived
estimates (see, Fig. 8b). However, here, we note that the
southernmost site used in our analysis (LBA-Pdg) was
located at ca. 21.75°S (with all other sites being north-
ward of ca. 11°S); hence, more Southern Hemispheric
flux tower sites need to be utilized in our model calibra-
tion, to better quantify flux biases in this region. Glob-
ally, using the NCEP-NCER dataset, Zhao et al. (2006)
also simulated a much higher GPP vs. that using the
NASA-DAO meteorology (ca. 125 GtC yr�1 vs.
108 GtC yr�1, respectively). In comparison with their
study, our ISAM-derived GPP using NCEP/NCAR (ca.
130 GtC yr�1) compared favorably. Here, assuming
a + 10–20% bias in the reanalysis-driven global GPP
using ISAM (representative of site-level GPP
biases), our corresponding ‘bias-corrected’ GPP would
reduce to ca. 105–118 GtC yr�1. These ‘bias-corrected’
GPP from ISAM were consistent with the MODIS
estimates of ca. 108 GtC yr�1 using the NASA-DAO
meteorology.
The global GPP from FLUXNET-MTE (ca.
117 GtC yr�1) was higher in comparison with MODIS-
DAO (Fig. 8a, b). Still, the GPP from ISAM-NCEP was
ca. 10% higher than that from FLUXNET-MTE. In com-
parison with MODIS-DAO, one likely reason for the
higher tropical GPP in FLUXNET-MTE is the higher
coverage of C4 herbaceous PFTs in the tropics in the lat-
ter dataset (i.e., causing more productivity). In this
study, we used the land cover distribution from Mei-
yappan & Jain (2012), which contains lower C4vegeta-
tion fraction in the tropics (Fig. S7) than that used in
FLUXNET-MTE [see, supplementary Fig. 6 from Beer
et al. (2010)]. This most likely did offset the GPP differ-
ences between FLUXNET-MTE and ISAM in the tro-
pics. Another potential reason may be due to the use of
different meteorology to generate the FLUXNET-MTE
product, which may be subjected to meteorological
biases/differences in comparison with NASA-DAO as
well as the reanalysis datasets used in our study.
Discussion
In this study, we adopted a site-level approach to inves-
tigate the reanalysis-driven GPP biases using a LSM
framework and analyzed the role of biotic and environ-
mental factors in the vegetation response. To achieve
this, we first calibrated and evaluated the model for
various PFTs using site-level eddy covariance and
meteorology data. We subsequently applied the model
at the same sites using two reanalysis meteorological
datasets (the NCEP/NCAR and the CRUNCEP) to
assess the extents of annual and seasonal GPP biases
with respect to the FLUXNET meteorology simulations
(referred to as DGPP). Quantification of seasonal biases
in simulated GPP is especially important, as it can help
to explain problems in simulating seasonal changes in
NEE (Schaefer et al., 2012).
Using the ISAM as the modeling tool, the results
show that at most sites (and PFTs) both the NCEP/
NCAR and CRUNCEP significantly overestimated the
GPP, resulting in DGPPof up to ca. 0.45 kg C m�2 yr�1
for the tropical forest PFTs (Fig. 2). For other PFTs,
even though the magnitude of the DGPP was smaller
than those for the tropical forests, the% bias in GPP
was significant: i.e., up to +10–20% for the Temp.BDT
(a)
(b)
Fig. 8 (a) Zonally averaged mean annual estimates for GPP, for
two reanalysis-driven model simulations (ISAM-CRUNCEP and
ISAM-NCEP) and observationally derived data (FLUXNET-
MTE, and MODIS-DAO). All the results are based on averaged
output for 2000–2004 and are only for vegetated land surfaces
(Fig. S8). The fractional land area (vegetated) at each latitude is
shown as a gray scale, where darker shades represent more veg-
etated areas. (b) Zonally averaged GPP difference with respect
to MODIS based on results from (a).
© 2013 John Wiley & Sons Ltd, Global Change Biology, doi: 10.1111/gcb.12474
CLIMATE-DRIVEN UNCERTAINTIES IN GPP 13

and NET, and up to ca. +20–30% for savanna, grass-
land, and shrubland (Table 3). Here, one relevant ques-
tion is, can we choose a preferred reanalysis dataset for
model forcing between the NCEP/NCAR and the
CRUNCEP? Because both the reanalysis datasets pro-
duced similarly (positive) biased GPP, one may not be
preferred over the other. Nonetheless, in Barman et al.
(2013), we show that the CRUNCEP-driven latent and
sensible heat fluxes were generally in better agreement
than the NCEP/NCAR counterpartswhen compared
with the FLUXNET estimates. Hence, for the overall
estimation of carbon, energy, and water fluxes, we
recommend the use of CRUNCEP data for subsequent
global applications of the ISAM.
At the Trop.BET/BDT sites, major contributions to
the simulated +DGPP were from the +DSrad in both the
reanalysis datasets. Indeed, as also shown in our fur-
ther analysis (Fig. S9), in all ecosystems, the increases
in +DGPP were majorly contributed by the sun-lit can-
opy, due to enhanced radiation levels at the top of the
canopy. Using the observed meteorology data in the
model, the Trop.BET/BDT showed strong radiation
limitation on GPP during cloudy days, which was also
consistent with results from site-level field experiments
conducted in the Amazon forest (e.g., Graham et al.,
2003). For the Temp.BDT/NET, the +DSrad in CRUN-
CEP and the +DQ in NCEP/NCAR during the growing
season played key roles in producing the respective
GPP biases in these PFTS. Here we also note that, even
though the GPP at Temp.BDT and NET have been pre-
viously characterized as temperature-limited (e.g., Fal-
ge et al., 2002; Law et al., 2002), the annual DGPP were
still positive at the sites with annual negative DTavg(exception: US-NR1). This is most likely because: (i)
much of the daily negative DTavg may occur during
the winter (Fig. 3 for Temp.BDT and NET) when the
GPP and DGPP are negligible, and (ii) the overall sea-
sonality of daily temperature is very large in the mid-/
high-latitude sites (<�20 °C to >25 °C; see, Fig. 4a),
and hence, a small negative annual DTavg in the reanal-
ysis data may not sufficiently decrease the GPP to off-
set the +DGPP from +DSrad and/or +DQ. Such a model
response is also consistent with Beer et al. (2010), who
suggested that the changes in GPP in boreal and tem-
perate forests were robust against small variations in
temperature. An implication of this result is that
the annual mean DTavg may not be a proper indicator
for the reanalysis-driven annual DGPP in these
ecosystems.
At the C3 savanna/grass/shrub sites, the environ-
mental factors controlling water stress (i.e., Tavg, Q,
Precip) dominated the resulting GPP biases. For these
PFTs, the reanalysis meteorology produced notably
+DGPP (except at the US-SO2 shrub site, which was
strongly limited by annual Precip in the NCEP/NCAR
reanalysis data). In comparison with the positive and
generally significant DGPP at the C3 nontree sites, the
biases at the analyzed C4 sites (savanna, grass) were
relatively minimal. However, it was not clear if the
low DGPP would be representative of other sites/
regions of dominant C4 vegetation – due to the lim-
ited number of C4 sites available for our analysis
(both for model calibration and evaluation). Finally, at
the very high-latitude tundra sites, the mean annual
DTavg in both the reanalysis datasets sites controlled
the sign of the DGPP (absolute magnitude generally
small). In any case, because the total contribution
from the tundra toward the global GPP is very small
(1.6 GtC yr�1, or <1.5% of global) (Beer et al., 2010),
the DGPP from tundra may be inconsequential for
global estimates.
We recognize several potential limitations in our
results, arising due to existing limitations in model
structure and parameters. Firstly, due to the use of pre-
scribed LAI climatology in ISAM, it is restricting to sim-
ulate the inter-annual variability of GPP. To reduce this
limitation, implementation of dynamic LAI schemes in
ISAM is currently in progress. Secondly, the use of sta-
tic root profiles in ISAM introduces limitations in mod-
eling of soil water stress, and vegetation acclimation to
water stress. Dynamic roots are especially important in
the drier tropical and subtropical nontree ecosystems
(e.g., C3/C4 grass, C3/C4 savanna, C3/C4 pasture, and
shrubs) that have shallow root depths and where roots
may vary seasonally (e.g., Arora & Boer, 2003). Besides
the root profiles, the accuracy of soil moisture schemes
used in the model are also important because soil water
availability and water stress play significant roles in
our results. Currently, there are known limitations
(Zeng & Decker, 2009) of the numerical scheme used in
ISAM [originally adapted from Oleson et al. (2008),
which is used in CLM3.5]. There are other potentially
important climate-driven biotic effects that are not
included in this study, such as the temperature acclima-
tion of photosynthesis (Kattge & Knorr, 2007). In the
future, improvements in these and other aspects that
are common to many LSMs (Schaefer et al., 2012) are
expected to improve the modeling of carbon cycle pro-
cesses in ISAM. There are also impacts from limited
flux tower data availability and access. For example,
only a few nontree PFT sites (i.e. fewer sites per PFT)
were used in this study. As previously discussed, this
imposed several limitations in our model calibration
and evaluation. We particularly note the scarcity of C4
and subtropical sites, which did limit our ability to tune
multiple PFT-specific parameters for such vegetation
types. From the perspective of modeling the global ter-
restrial carbon cycle, it is very important to properly
© 2013 John Wiley & Sons Ltd, Global Change Biology, doi: 10.1111/gcb.12474
14 R. BARMAN et al.

constrain and quantify climate-driven GPP biases in C4
vegetation, because the C4 vegetation covers a large
expanse of the global land surface and has large contri-
bution (>20%) to global GPP (Beer et al., 2010). These
considerations generally indicate that more nontree
sites will be beneficial for robustly calibrating carbon
cycle processes in ISAM, and subsequently for analyz-
ing the magnitudes of carbon flux biases across the glo-
bal land surface. Previously, another study by Schwalm
et al. (2010b) also suggested that larger numbers of flux
tower sites are required globally to robustly analyze the
drought sensitivity of vegetation types such as crop-
land, shrubland, and savanna and that additional flux
towers are required for all vegetation types in Africa
and Asia. In general, other model-data intercomparison
studies have found that current ecosystem models can
better simulate GPP and NEE at forest sites than at
grassland sites (Schwalm et al., 2010a; Schaefer et al.,
2012).
While we investigated the impacts of reanalysis data
on GPP at site level, the overarching goal of such a
study is ultimately to understand the consequences for
global applications. Because estimates of globally grid-
ded GPP are usually derived using meteorological
reanalysis datasets, the resulting total GPP are also
most likely to contain climate-driven biases within
themselves. While it is not possible to exactly quantify
the global total GPP biases in a LSM framework using
reanalysis datasets, our site-level results suggest that
these biases are expected to be of significance for the
global GPP estimates. Overall, the extent of annual GPP
biases using our LSM framework appear to be gener-
ally consistent with the work of Zhao et al. (2006) (MO-
DIS derived GPP). In this context, we showed that
assuming a range of +10–20% overall bias in our global
GPP estimates (ISAM-NCEP ca. 130 GtC yr�1, ISAM-
CRUNCEP ca. 126 GtC yr�1), the corresponding ‘bias-
corrected’ GPP be reduced to ca. 105–118 GtC yr�1.
These estimates are closer to the observationally
derived estimates of MODIS-DAO ca. 108 GtC yr�1
and FLUXNET-MTE ca. 117 GtC yr�1. However, here,
we should point out that beyond the similarities in glo-
bal GPP estimates between this study and Zhao et al.
(2006), the driving factors for DGPP may sometimes be
different using our LSM-based approach. For example,
because their ‘light use efficiency’–based GPP model is
a linear function of VPD, their GPP biases were often
predominantly determined by VPD biases. Henceforth,
due to the nonlinear dependence of VPD on Tavg, a rel-
atively small Tavg bias could substantially influence the
GPP bias in their analysis. In contrast, the ‘Ball–Berry’scheme used in our analysis does not directly use VPD
for GPP calculations; rather, the GPP is coupled directly
with humidity, temperature, soil water stress, and leaf
stomatal conductance. Hence, the DGPP in our results
were not as strongly determined by DTavg. Nonethe-
less, the role of DTavg remains important in our simula-
tions in modeling soil water availability (from freeze/
thaw processes), as well as for the temperature stress
on leaf carboxylation.
The sensitivity of LSM-estimated GPP to meteorol-
ogy, as demonstrated in this study, highlights the
importance of using standardized meteorological forc-
ings in various LSM intercomparison projects to consis-
tently compare the model performance. Because many
projection studies using LSMs make use of earth system
model (ESM) output of meteorological variables, the
resulting carbon estimates should also be dependent on
the accuracy of the ESM output. Similarly, the currently
available globally gridded GPP ‘datasets’ based on
FLUXNET data [e.g., Beer et al. (2010), Jung et al.
(2011)] that were up-scaled using global meteorology
products, should also contain a component of climate-
driven biases. However, we cannot speculate on the
magnitudes of GPP biases therein, as they are likely to
depend on both the meteorology dataset, as well as the
diagnostic method used for globally interpolating the
GPP.
Finally, within the framework of a LSM, the GPP
biases are also directly and indirectly coupled to cor-
responding biases in energy and water fluxes (Barman
et al., 2013), with potentially important impacts on soil
hydrology and energetics. Uncertainties/biases in
these model processes (including their seasonal biases)
should also impact other carbon fluxes such as net
primary production and net ecosystem production, as
well as modeled soil carbon pools. Especially in the
mid- and high-latitude regions where plant respiration
and soil decomposition rates are slower, the extent of
GPP biases as shown in this study may be expected to
significantly affect the litter fall and the soil carbon
accumulation processes. In future studies, it will be
important to investigate these in detail, to explain and
to quantitatively reduce the current uncertainties in
modeling carbon and energy/water cycle processes in
LSMs.
Acknowledgements
This study was partly supported by the National Aeronauticsand Space Administration (NASA) Land Cover and Land UseChange Program (No. NNX08AK75G), and U.S. Department ofEnergy (DOE) Office of Science (DOE-DE-SC0006706). RB wasfunded by the NASA Earth and Space Science Fellowship(NNX11AP85H). We thank Dr. Bassil El-Masri and Yang Songfor contributing in various stages our model development. Wespecially thank the FLUXNET community and the P.I.s of thesites used in this study, for their continuous efforts of data col-lection.
© 2013 John Wiley & Sons Ltd, Global Change Biology, doi: 10.1111/gcb.12474
CLIMATE-DRIVEN UNCERTAINTIES IN GPP 15

References
Ahlstr€om A, Schurgers G, Arneth A, Smith B (2012) Robustness and uncertainty in
terrestrial ecosystem carbon response to CMIP5 climate change projections. Envi-
ronmental Research Letters, 7, 044008.
Andreae M, Artaxo P, Brandao C, Carswell F, Ciccioli P, Da Costa A, Grace J (2002)
Biogeochemical cycling of carbon, water, energy, trace gases, and aerosols in
amazonia: the LBA-EUSTACH experiments. Journal of Geophysical Research: Atmo-
spheres (1984–2012), 107, LBA 331-1–LBA 33-25.
Arora VK, Boer GJ (2003) A representation of variable root distribution in dynamic
vegetation models. Earth Interactions, 7, 1–9.
Baldocchi D (2008) TURNER REVIEW no. 15′.breathing’of the terrestrial biosphere:
lessons learned from a global network of carbon dioxide flux measurement sys-
tems. Australian Journal of Botany, 56, 1–26.
Baldocchi D, Falge E, Gu L, Olson R, Hollinger D, Running S, Evans R (2001) FLUX-
NET: a new tool to study the temporal and spatial variability of ecosystem-scale
carbon dioxide, water vapor, and energy flux densities. Bulletin of the American
Meteorological Society, 82, 2415–2434.
Ball J (1987) A model predicting stomatal conductance and its contribution to the con-
trol of photosynthesis under different environmental conditions. Prog Photosyn-
thesis Res Proc Int Congress 7th, Providence. 10-15 Aug 1986. Vol 4. Kluwer,
Boston. pp. 221–224.
Barman R, Hoffman FM, Lawrence DM, Song Y, Meiyappan P, Jain AK, Vertenstein
M (2011) Studying uncertainties in climate-terrestrial biogeochemical feedbacks in
the northern high latitudes using a flexible earth system modeling framework.
AGU Fall Meeting Abstracts, 1 04.
Barman R, Jain AK, Liang M (2013) Climate-driven uncertainties in modeling terres-
trial energy and water fluxes: a site-level to global scale analysis. Global Change
Biology, doi: 10.1111/gcb.12473.
Beer C, Reichstein M, Tomelleri E, Ciais P, Jung M, Carvalhais N, Bonan GB (2010)
Terrestrial gross carbon dioxide uptake: global distribution and covariation with
climate. Science, 329, 834–838.
Beerling D, Quick W (1995) A new technique for estimating rates of carboxylation
and electron transport in leaves of C3 plants for use in dynamic global vegetation
models. Global Change Biology, 1, 289–294.
Bergeron O, Margolis HA, Black TA, Coursolle C, Dunn AL, Barr AG, Wofsy SC
(2007) Comparison of carbon dioxide fluxes over three boreal black spruce forests
in Canada. Global Change Biology, 13, 89–107.
Blyth E, Clark D, Ellis R, Huntingford C, Los S, Pryor M, Sitch S (2010) A comprehen-
sive set of benchmark tests for a land surface model of simultaneous fluxes of
water and carbon at both the global and seasonal scale. Model Dev Discuss, 3,
1829–1859.
Bonan GB, Lawrence PJ, Oleson KW, Levis S, Jung M, Reichstein M, Swenson SC
(2011) Improving canopy processes in the community land model version 4
(CLM4) using global flux fields empirically inferred from FLUXNET data. Journal
of Geophysical Research, 116, G02014.
Bonan GB, Oleson KW, Fisher RA, Lasslop G, Reichstein M (2012) Reconciling leaf
physiological traits and canopy flux data: Use of the TRY and FLUXNET databases
in the community land model version 4. Journal of Geophysical Research: Biogeo-
sciences (2005–2012), 117, G02026, doi: 10.1029/2011JG001913.
Canadell J, Jackson R, Ehleringer J, Mooney H, Sala O, Schulze E (1996) Maximum
rooting depth of vegetation types at the global scale. Oecologia, 108, 583–595.
Churkina G, Running SW (1998) Contrasting climatic controls on the estimated pro-
ductivity of global terrestrial biomes. Ecosystems, 1, 206–215.
Collatz GJ, Ball JT, Grivet C, Berry JA (1991) Physiological and environmental regula-
tion of stomatal conductance, photosynthesis and transpiration: a model that
includes a laminar boundary layer. Agricultural and Forest Meteorology, 54,
107–136.
Collatz GJ, Ribas-Carbo M, Berry J (1992) Coupled photosynthesis-stomatal conduc-
tance model for leaves of C4 plants. Functional Plant Biology, 19, 519–538.
Cook BD, Davis KJ, Wang W, Desai A, Berger BW, Teclaw RM, Yi C (2004) Carbon
exchange and venting anomalies in an upland deciduous forest in northern wis-
consin USA. Agricultural and Forest Meteorology, 126, 271–295.
Dai Y, Dickinson RE, Wang Y (2004) A two-big-leaf model for canopy temperature,
photosynthesis, and stomatal conductance. Journal of Climate, 17, 2281–2299.
Denman KL, Brasseur G, Chidthaisong A, Ciais P, Cox PM, Dickinson RE, Jacob D
(2007) Couplings between changes in the climate system and biogeochemistry. Cli-
mate Change, 2007, 541–584.
Desai AR, Bolstad PV, Cook BD, Davis KJ, Carey EV (2005) Comparing net ecosystem
exchange of carbon dioxide between an old-growth and mature forest in the upper
midwest USA. Agricultural and Forest Meteorology, 128, 33–55.
El Maayar M, Price DT, Chen JM (2009) Simulating daily, monthly and annual water
balances in a land surface model using alternative root water uptake schemes.
Advances in Water Resources, 32, 1444–1459.
El-Masri B, Barman R, Meiyappan P, Song Y, Liang M, Jain AK (2013) Carbon
dynamics in the amazonian basin: integration of eddy covariance and ecophysio-
logical data with a land surface model. Agricultural and Forest Meteorology, 19,
1759–1779.
Eugster W, Rouse WR, Pielke RA Sr, Mcfadden JP, Baldocchi DD, Kittel TG, Vaganov
E (2000) Land–atmosphere energy exchange in arctic tundra and boreal forest:
available data and feedbacks to climate. Global Change Biology, 6, 84–115.
Falge E, Baldocchi D, Tenhunen J, Aubinet M, Bakwin P, Berbigier P, Davis KJ (2002)
Seasonality of ecosystem respiration and gross primary production as derived
from FLUXNET measurements. Agricultural and Forest Meteorology, 113, 53–74.
FAO/IIASA/ISRIC/ISSCAS/JRC. (2012) Harmonized World Soil Database (version
1.10), FAO, Rome, Italy and IIASA, Laxenburg, Austria.
Farquhar G, Von Caemmerer SV, Berry J (1980) A biochemical model of photosyn-
thetic CO2 assimilation in leaves of C3 species. Planta, 149, 78–90.
Fekete BM, V€or€osmarty CJ, Roads JO, Willmott CJ (2004) Uncertainties in precipita-
tion and their impacts on runoff estimates. Journal of Climate, 17, 294–304.
Flanagan LB, Adkinson AC (2011) Interacting controls on productivity in a northern
Great Plains grassland and implications for response to ENSO events. Global
Change Biology, 17, 3293–3311.
Friend AD, Arneth A, Kiang NY, Lomas M, Ogee J, R€odenbeck C, Viovy N (2007)
FLUXNET and modelling the global carbon cycle. Global Change Biology, 13,
610–633.
Global Soil Data Task Group. (2000) Global Gridded Surfaces of Selected Soil Charac-
teristics (IGBP-DIS). Available at [http://www.daac.ornl.gov] from Oak Ridge
National Laboratory Distributed Active Archive Center, Oak Ridge, Tennessee,
USA doi: 10.3334/ORNLDAAC/569.
Graham EA, Mulkey SS, Kitajima K, Phillips NG, Wright SJ (2003) Cloud cover limits
net CO2 uptake and growth of a rainforest tree during tropical rainy seasons. Pro-
ceedings of the National Academy of Sciences, 100, 572–576.
Huntzinger D, Post WM, Wei Y, Michalak A, West TO, Jacobson A, Hayes D (2012)
North american carbon program (NACP) regional interim synthesis: terrestrial
biospheric model intercomparison. Ecological Modelling, 232, 144–157.
Jain A, Yang X, Kheshgi H, McGuire AD, Post W, Kicklighter D (2009) Nitrogen atten-
uation of terrestrial carbon cycle response to global environmental factors. Global
Biogeochemical Cycles, 23, GB4028, doi: 10.1029/2009GB003519.
Jain AK, Meiyappan P, Song Y, House JI (2013) CO2 emissions from land-use change
affected more by nitrogen cycle, than by the choice of land-cover data. Global
Change Biology, 19, 2893–2906.
Jung M, Vetter M, Herold M, Churkina G, Reichstein M, Zaehle S, Chen Y (2007)
Uncertainties of modeling gross primary productivity over europe: a systematic
study on the effects of using different drivers and terrestrial biosphere models.
Global Biogeochemical Cycles, 21, GB4021, doi: 10.1029/2006GB002915.
Jung M, Reichstein M, Margolis HA, Cescatti A, Richardson AD, Arain MA, Chen J
(2011) Global patterns of land-atmosphere fluxes of carbon dioxide, latent heat,
and sensible heat derived from eddy covariance, satellite, and meteorological
observations. Journal of Geophysical Research: Biogeosciences (2005–2012), 116,
doi: 10.1029/2010JG001566.
Kattge J, Knorr W (2007) Temperature acclimation in a biochemical model of
photosynthesis: a reanalysis of data from 36 species. Plant, Cell & Environment, 30,
1176–1190.
Kattge J, Knorr W, Raddatz T, Wirth C (2009) Quantifying photosynthetic capacity
and its relationship to leaf nitrogen content for global-scale terrestrial biosphere
models. Global Change Biology, 15, 976–991.
Kattge J, Diaz S, Lavorel S, Prentice I, Leadley P, B€onisch G, Wright I (2011) TRY–a
global database of plant traits. Global Change Biology, 17, 2905–2935.
Kauwe MG, Medlyn BE, Zaehle S, Walker AP, Dietze MC, Hickler T, Prentice C(2013)
Forest water use and water use efficiency at elevated CO2: a model-data intercom-
parison at two contrasting temperate forest FACE sites. Global Change Biology,
1759–1779, doi: 10.1111/gcb.12164.
Kljun N, Black T, Griffis T, Barr A, Gaumont-Guay D, Morgenstern K, Nesic Z (2007)
Response of net ecosystem productivity of three boreal forest stands to drought.
Ecosystems, 10, 1039–1055.
Koven C, Riley W, Subin Z, Tang J, Torn M, Collins W, Swenson S (2013) The effect of
vertically-resolved soil biogeochemistry and alternate soil C and N models on C
dynamics of CLM4. Biogeosciences Discussions, 10, 7201–7256.
Krishnan P, Black TA, Jassal RS, Chen B, Nesic Z (2009) Interannual variability of the
carbon balance of three different-aged Douglas-fir stands in the pacific northwest.
© 2013 John Wiley & Sons Ltd, Global Change Biology, doi: 10.1111/gcb.12474
16 R. BARMAN et al.

Journal of Geophysical Research: Biogeosciences (2005–2012), 114, G04011,
doi: 10.1029/2008JG000912.
Lasslop G, Reichstein M, Kattge J, Papale D (2008) Influences of observation errors in
eddy flux data on inverse model parameter estimation. Biogeosciences Discussions,
5, 751–785.
Law B, Falge E, Gu LV, Baldocchi D, Bakwin P, Berbigier P, Fuentes J (2002) Environ-
mental controls over carbon dioxide and water vapor exchange of terrestrial vege-
tation. Agricultural and Forest Meteorology, 113, 97–120.
Lawrence PJ, Chase TN (2007) Representing a new MODIS consistent land surface in
the community land model (CLM 3.0). Journal of Geophysical Research: Biogeosciences
(2005–2012), 112, G01023, doi: 10.1029/2006JG000168.
Luo H, Oechel WC, Hastings SJ, Zulueta R, Qian Y, Kwon H (2007) Mature semi-
arid chaparral ecosystems can be a significant sink. Global Change Biology, 13,
386–396.
Ma S, Baldocchi DD, Xu L, Hehn T (2007) Inter-annual variability in carbon dioxide
exchange of an oak/grass savanna and open grassland in california. Agricultural
and Forest Meteorology, 147, 157–171.
McCaughey J, Pejam M, Arain M, Cameron D (2006) Carbon dioxide and energy
fluxes from a boreal mixedwood forest ecosystem in ontario, canada. Agricultural
and Forest Meteorology, 140, 79–96.
Meehl GA, Stocker TF, Collins WD et al. (2007) Global climate projections. In: Climate
Change 2007: The Physical Science Basis. Contribution of Working Group I to the Fourth
Assessment Report of the Intergovernmental Panel on Climate Change (eds Solomon S,
Qin D, Manning M, Chen Z, Marquis M, Averyt KB, Tignor M, Miller HL).
Cambridge University Press, Cambridge, UK.
Meiyappan P, Jain AK (2012) Three distinct global estimates of historical land-cover
change and land-use conversions for over 200 years. Frontiers of Earth Science, 6,
122–139.
Monson R, Turnipseed A, Sparks J, Harley P, Scott-Denton L, Sparks K, Huxman T
(2002) Carbon sequestration in a high-elevation, subalpine forest. Global Change
Biology, 8, 459–478.
Nemani RR, Keeling CD, Hashimoto H, Jolly WM, Piper SC, Tucker CJ, Running SW
(2003) Climate-driven increases in global terrestrial net primary production from
1982 to 1999. Science, 300, 1560–1563.
Oleson K, Niu G, Yang Z, Lawrence D, Thornton P, Lawrence P, Levis S (2008)
Improvements to the community land model and their impact on the hydrological
cycle. Journal of Geophysical Research: Biogeosciences (2005–2012), 113, G1.
Qian T, Dai A, Trenberth KE, Oleson KW (2006) Simulation of global land surface
conditions from 1948 to 2004 Part I: forcing data and evaluations. Journal of Hydro-
meteorology, 7, 953–975.
Raupach M, Rayner P, Barrett D, DeFries R, HeimannM, Ojima D, Schmullius C (2005)
Model–data synthesis in terrestrial carbon observation: methods, data requirements
and data uncertainty specifications. Global Change Biology, 11, 378–397.
Ricciuto D, Thornton P, Schaefer K, Cook R, Davis K (2009) How uncertainty in gap-
filled meteorological input forcing at eddy covariance sites impacts modeled car-
bon and energy flux. AGU Fall Meeting Abstracts, 1 03.
Richardson AD, Hollinger DY, Burba GG, Davis KJ, Flanagan LB, Katul GG, Suyker
AE (2006) A multi-site analysis of random error in tower-based measurements of
carbon and energy fluxes. Agricultural and Forest Meteorology, 136, 1–18.
Richardson AD, Anderson RS, Arain MA, Barr AG, Bohrer G, Chen G, Desai AR
(2012) Terrestrial biosphere models need better representation of vegetation phe-
nology: results from the north american carbon program site synthesis. Global
Change Biology, 18, 566–584.
Roulet NT, Lafleur PM, Richard PJH, Moore TR, Humphreys ER, Bubier J (2007) Con-
temporary carbon balance and late Holocene carbon accumulation in a northern
peatland. Global Change Biology, 13, 397–411.
Sakai RK, Fitzjarrald DR, Moraes OL, Staebler RM, Acevedo OC, Czikowsky MJ, Mir-
anda V (2004) Land-use change effects on local energy, water, and carbon balances
in an amazonian agricultural field. Global Change Biology, 10, 895–907.
Schaefer K, Schwalm CR, Williams C et al. (2012) A model-data comparison of gross
primary productivity: results from the north american carbon program site synthe-
sis. Journal of Geophysical Research: Biogeosciences (2005–2012), 117, G03010,
doi: 10.1029/2012JG001960.
Schenk HJ, Jackson RB (2002a) The global biogeography of roots. Ecological Mono-
graphs, 72, 311–328.
Schenk HJ, Jackson RB (2002b) Rooting depths, lateral root spreads and below-
ground/above-ground allometries of plants in water-limited ecosystems. Journal of
Ecology, 90, 480–494.
Schwalm CR, Williams CA, Schaefer K, Anderson R, Arain MA, Verma SB (2010a) A
model-data intercomparison of CO2 exchange across North America: results from
the North American Carbon Program site synthesis, Journal of Geophysical Research
115, G00H05, doi: 10.1029/2009JG001229.
Schwalm CR, Williams CA, Schaefer K, Arneth A, Bonal D, Richardson AD (2010b)
Assimilation exceeds respiration sensitivity to drought: a FLUXNET synthesis.
Global Change Biol, 16, 657–670. doi:10.1111/j.1365-2486.2009.01991.x.
Sellers P, Randall D, Collatz G, Berry J, Field C, Dazlich D, Bounoua L (1996a) A
revised land surface parameterization (SiB2) for atmospheric GCMs. part I: model
formulation. Journal of Climate, 9, 676–705.
Sellers PJ, Tucker CJ, Collatz GJ, Los SO, Justice CO, Dazlich DA, Randall DA (1996b)
A revised land surface parameterization (SiB2) for atmospheric GCMs. part II: the
generation of global fields of terrestrial biophysical parameters from satellite data.
Journal of Climate, 9, 706–737.
Sitch S, Huntingford C, Gedney N, Levy P, Lomas M, Piao S, Friedlingstein P (2008)
Evaluation of the terrestrial carbon cycle, future plant geography and climate-car-
bon cycle feedbacks using five dynamic global vegetation models (DGVMs). Global
Change Biology, 14, 2015–2039.
Song Y, Jain A, McIsaac G (2013) Implementation of dynamic crop growth processes
into a land surface model: evaluation of energy, water and carbon fluxes under
corn and soybean rotation. Biogeosciences Discussions, 10, 9897–9945.
Still CJ, Berry JA, Collatz GJ, DeFries RS (2003) Global distribution of C3 and C4 vege-
tation: carbon cycle implications. Global Biogeochemical Cycles, 17, 1006–1020.
St€ockli R, Lawrence D, Niu G, Oleson K, Thornton P, Yang Z, Running S (2008) Use
of FLUXNET in the community land model development. Journal of Geophysical
Research: Biogeosciences (2005–2012), 113, G01025, doi: 10.1029/2007JG000562.
Sulman BN, Desai AR, Cook BD, Saliendra N, Mackay DS (2009) Contrasting carbon
dioxide fluxes between a drying shrub wetland in Northern Wisconsin, USA, and
nearby forests. Biogeosciences, 6, 1115–1126.
Suyker AE, Verma SB, Burba GG (2003) Interannual variability in net CO2 exchange
of a native tallgrass prairie. Global Change Biology, 9, 255–265.
Vickers D, Thomas C, Pettijohn C, Martin J, Law BE (2009) Influence of disturbance
and water stress on sequestration of atmospheric carbon dioxide by ponderosa
pine forests. Agricultural and Forest Meteorology, 22, 111–114.
Viovy N, Ciais P (2009) A combined dataset for ecosystem modelling, Available at:
http://dods.extra.cea.fr/data/p529viov/cruncep/readme.htm. (Accessed March
2011).
Wang K, Dickinson RE (2012) A review of global terrestrial evapotranspiration: obser-
vation, modeling, climatology, and climatic variability. Reviews of Geophysics, 50,
RG2005, doi: 10.1029/2011RG000373.
Weedon G, Gomes S, Viterbo P, Shuttleworth W, Blyth E, €Osterle H, Best M (2011)
Creation of the WATCH forcing data and its use to assess global and regional ref-
erence crop evaporation over land during the twentieth century. Journal of Hydro-
meteorology, 12, 823–848.
Wei Y, Liu S, Post WM et al. (2013) ‘The North American Carbon Program (NACP)
Multi-Scale Synthesis and Terrestrial Model Intercomparison (MsTMIP) Project:
environmental Driver Data,’ Journal of Geoscientific Model Development Discussion, 6,
5375–5422.
Williams M, Richardson A, Reichstein M, Stoy P, Peylin P, Verbeeck H, Kattge J
(2009) Improving land surface models with FLUXNET data. Biogeosciences, 6,
1341–1359.
Wilson K, Goldstein A, Falge E, Aubinet M, Baldocchi D, Berbigier P, Field C (2002)
Energy balance closure at FLUXNET sites. Agricultural and Forest Meteorology, 113,
223–243.
Yang X, Wittig V, Jain A, Post W (2009) Integration of Nitrogen Dynamics into a
Global Terrestrial Ecosystem Model. Global Biogeochem Cycles, 23, GB4028,
doi: 10.1029/2009GB003519.
Yi C, Ricciuto D, Li R, Wolbeck J, Xu X, Nilsson M, Arain MA (2010) Climate control
of terrestrial carbon exchange across biomes and continents. Environmental
Research Letters, 5, 034007.
Zeng X, Decker M (2009) Improving the numerical solution of soil moisture-based
Richards equation for land models with a deep or shallow water table. J Hydrome-
teor, 10, 308–319.
Zha T, Barr AG, Black T, Mccaughey JH, Bhatti J, Hawthorne I, Shashkov A (2009)
Carbon sequestration in boreal jack pine stands following harvesting. Global
Change Biology, 15, 1475–1487.
Zhao M, Running SW (2010) Drought-induced reduction in global terrestrial net pri-
mary production from 2000 through 2009. Science, 329, 940–943.
Zhao M, Running SW, Nemani RR (2006) Sensitivity of moderate resolution imaging
spectroradiometer (MODIS) terrestrial primary production to the accuracy of
meteorological reanalyses. Journal of Geophysical Research: Biogeosciences
(2005–2012), 111, G01002.
© 2013 John Wiley & Sons Ltd, Global Change Biology, doi: 10.1111/gcb.12474
CLIMATE-DRIVEN UNCERTAINTIES IN GPP 17

Supporting Information
Additional Supporting Information may be found in the online version of this article:
Data S1. GPP SOM.pdf contains.Data S2. Meteorology from global/reanalysis datasets.Table S1. Mean annual GPP biases (DGPP) in the ISAM-CRUNCEP and the ISAM-NCEP simulations at each site. DCRUN-CEP = ISAM-CRUNCEP – ISAM-FLUXNET; DNCEP = ISAM-NCEP – ISAMFLUXNET.Figure S1. Geographical distribution of FLUXNET sites used in this study.Figure S2. Relative differences in mean annual meteorology variables between two global reanalyses datasets used in this study.Figure S3. Spin-up of deep soil temperature (TSoil50 m) at each site vs. years of spin-up at each site. The initial soil temperature is1�C (i.e., 274.15 K).Figure S4. Analysis for tree PFTs (Trop.BET, Trop.BDT, Temp.BDT, NET): (a) Daily GPP vs. daily meteorology for Tavg, Srad andQ. The R2 for each regression fit (line denoted as: All) were calculated using data from all the simulations. (b) Annual GPP vs.annual total Precip for different simulations, along with the respective R2.Figure S5. Analysis for individual Trop.BET and Trop.BDT sites: Daily climatology of GPP and corresponding Tavg, Srad and Q.Each row of subplots corresponds to an individual site (site name on left corner). Each column shows a respective variable (GPP,Tavg, Srad, Q). For each subplot, the x-axis is the ‘day of year,’ and the y-axis is the respective variable.Figure S6. Analysis for individual nontree C3 sites: Daily climatology of biases (D) in reanalyses-driven climatology of GPP, Tavg,Srad, and Q. Each row of subplots corresponds to an individual site (site name on left corner). Each column shows a respective vari-able (DGPP, DTavg, DSrad, DQ). For each subplot, the x-axis is the ‘day of year,’ and the y-axis is the respective variable. All thebiases (D) were calculated with respect to the ISAM-FLUXNET counterpart.Figure S7. Map of C4 fraction in herbaceous plant functional types, for (a) savanna, grass, and pasture, and (b) crop.Figure S8. Map of vegetated land area mask used for the comparison of GPP estimates. For consistency, nonvegetated (i.e., barrenland, desert, glacier, water body) grid cells were removed from all the GPP estimates (ISAM, FLUXNET-MTE, MODIS) during theconstruction of respective zonal means.Figure S9. Partitioning of site-level GPP biases into sunlit and shaded components.
© 2013 John Wiley & Sons Ltd, Global Change Biology, doi: 10.1111/gcb.12474
18 R. BARMAN et al.