climate, coal and capital – status of the global commons · 15. cheap and abundant coal is the...
TRANSCRIPT
Climate, Coal and Capital –Status of the Global Commons
Prof. Dr. Ottmar Edenhofer
Pontifical Gregorian UniversityRome, 7-8 March 2018
2
www.mcc-berlin.net/klimabuch
available now:

Emissions are rising.
3
Quelle: Peters et al. (2017)
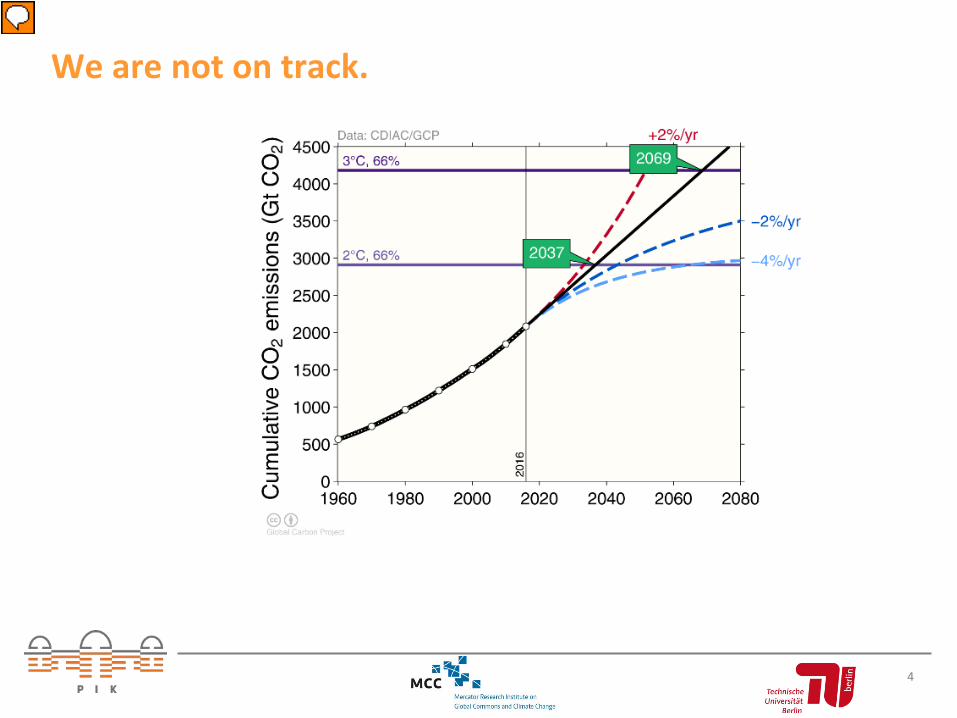
We are not on track.
4
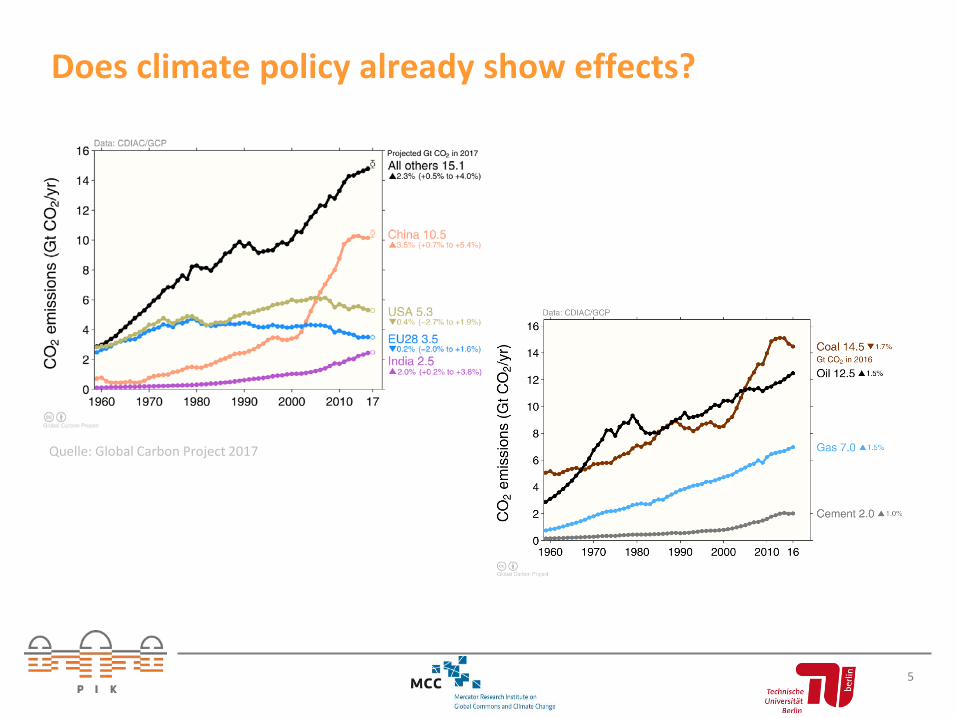
Does climate policy already show effects?
5
Quelle: Global Carbon Project 2017
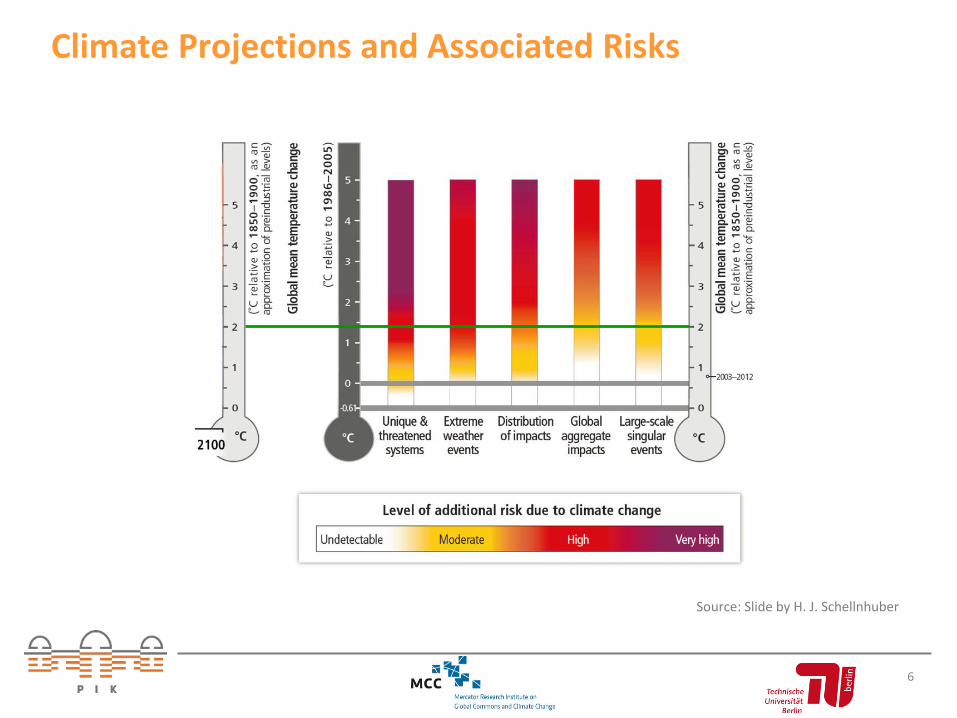
Climate Projections and Associated Risks
6
Source: Slide by H. J. Schellnhuber
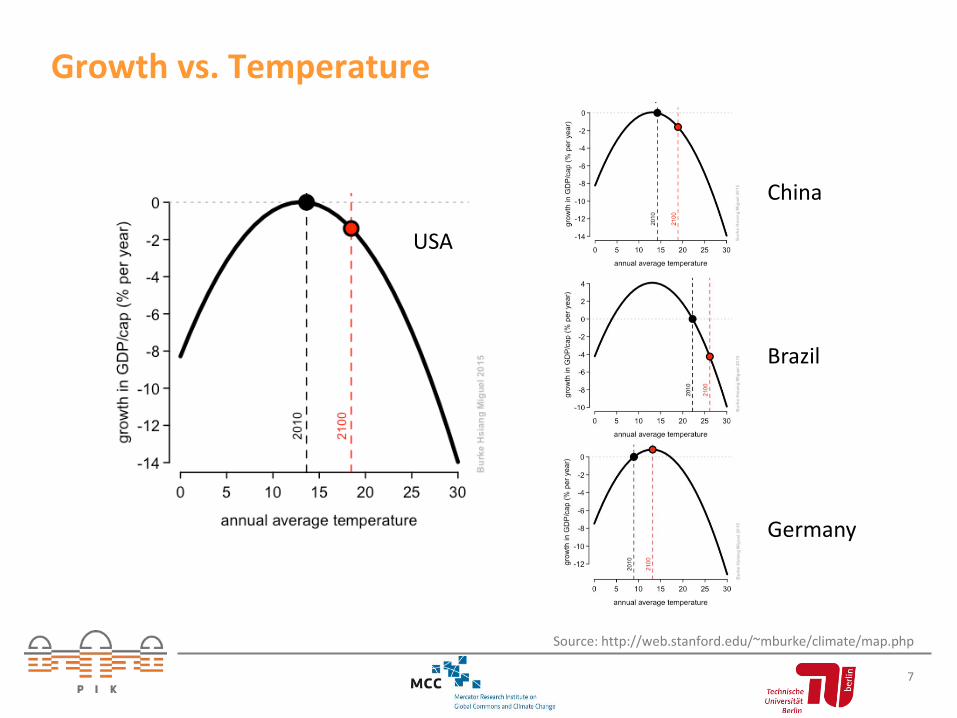
Growth vs. Temperature
7
China
USA
Brazil
Germany
Source: http://web.stanford.edu/~mburke/climate/map.php
8
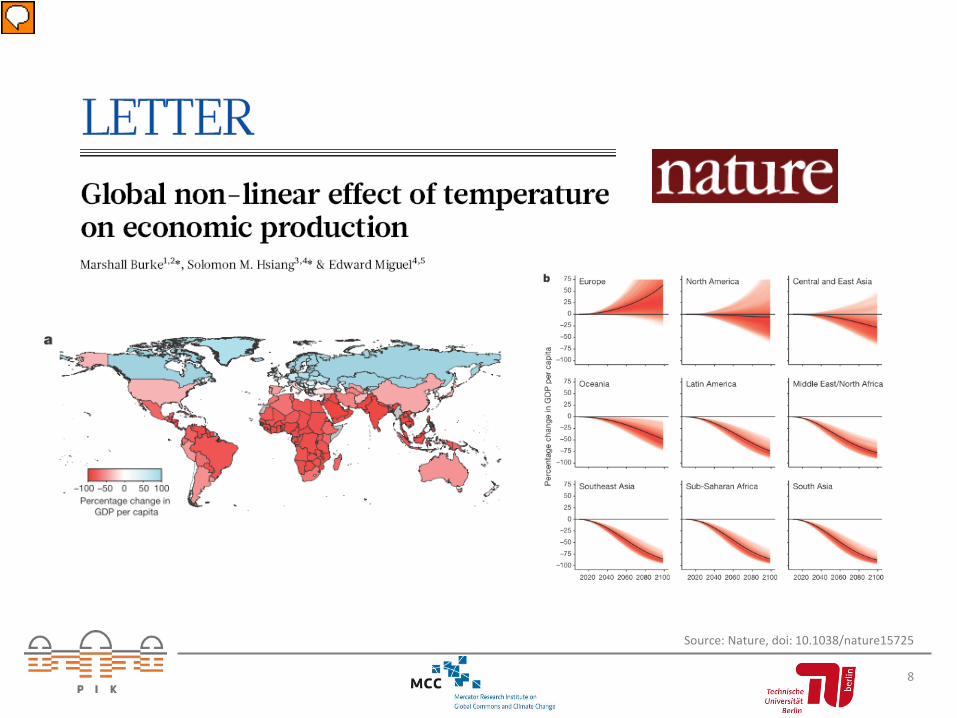
Source: Nature, doi: 10.1038/nature15725
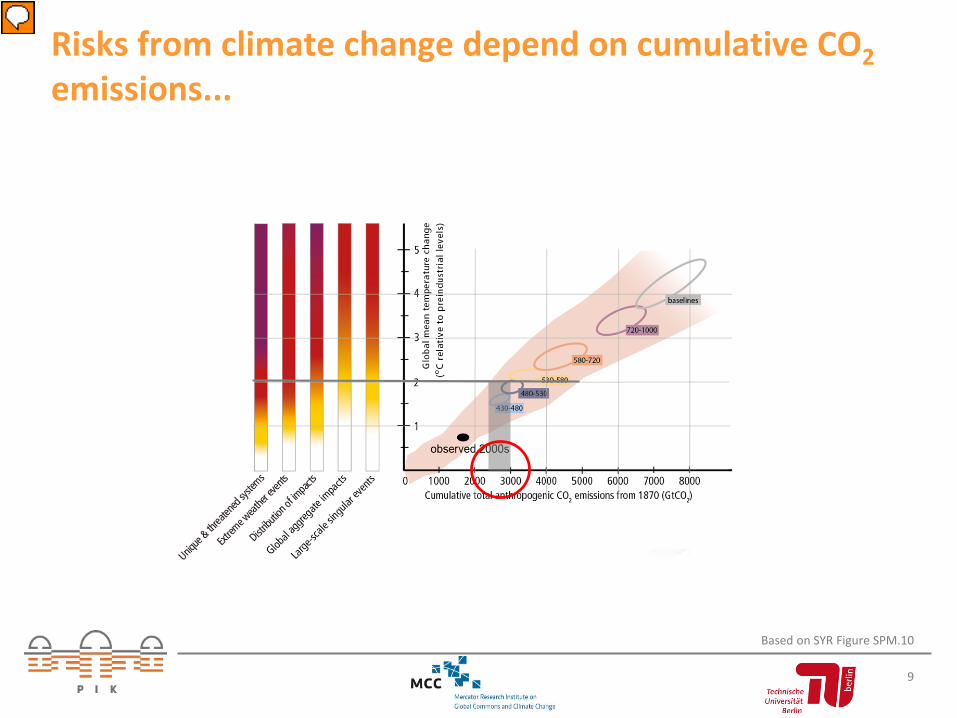
Risks from climate change depend on cumulative CO2emissions...
9
Based on SYR Figure SPM.10
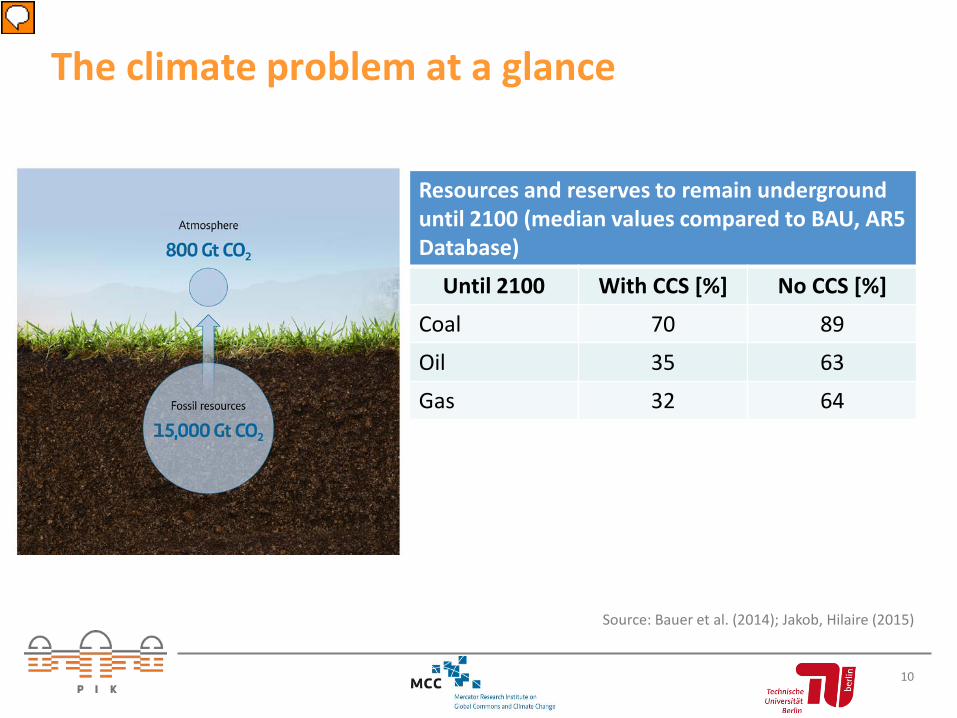
The climate problem at a glance
10
Source: Bauer et al. (2014); Jakob, Hilaire (2015)
Resources and reserves to remain underground until 2100 (median values compared to BAU, AR5 Database)
Until 2100 With CCS [%] No CCS [%]
Coal 70 89
Oil 35 63
Gas 32 64
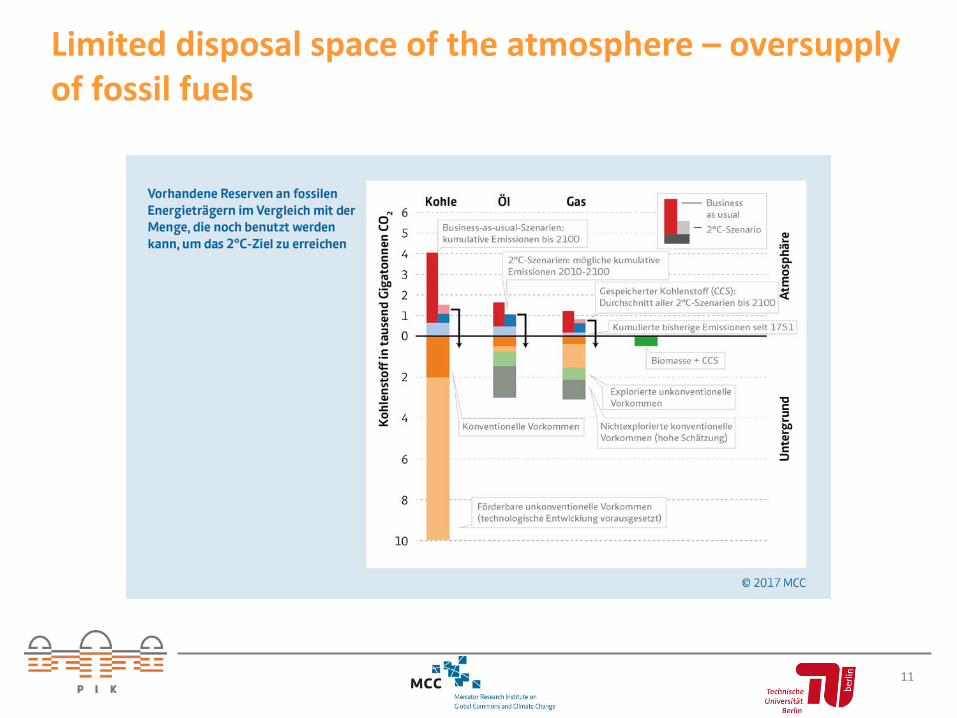
Limited disposal space of the atmosphere – oversupply of fossil fuels
11
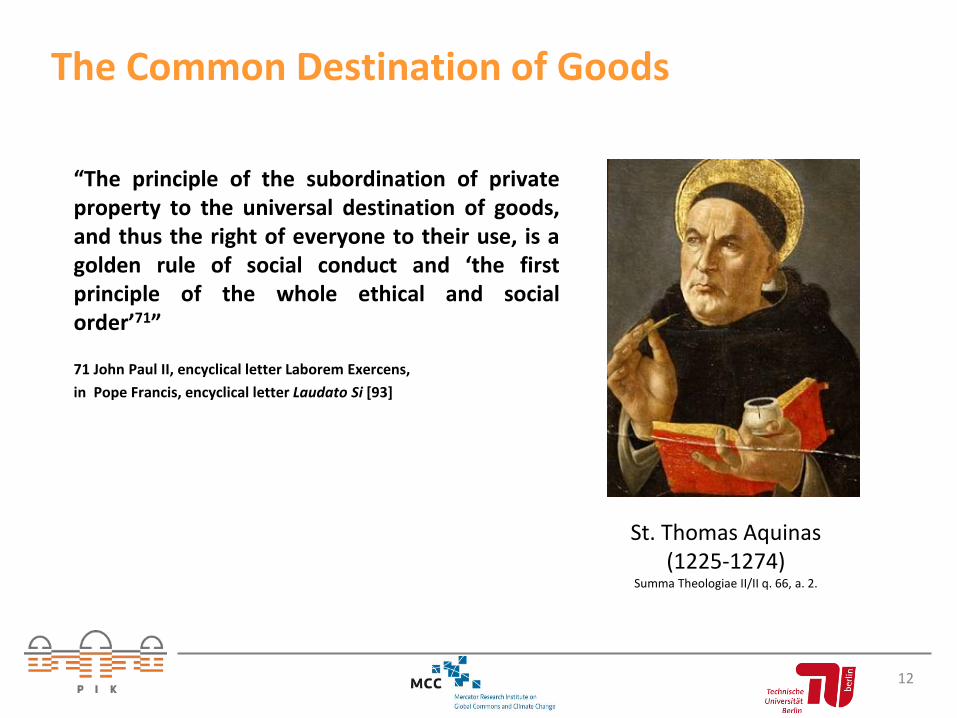
The Common Destination of Goods
12
“The principle of the subordination of privateproperty to the universal destination of goods,and thus the right of everyone to their use, is agolden rule of social conduct and ‘the firstprinciple of the whole ethical and socialorder’71”
71 John Paul II, encyclical letter Laborem Exercens,in Pope Francis, encyclical letter Laudato Si [93]
St. Thomas Aquinas (1225-1274)
Summa Theologiae II/II q. 66, a. 2.
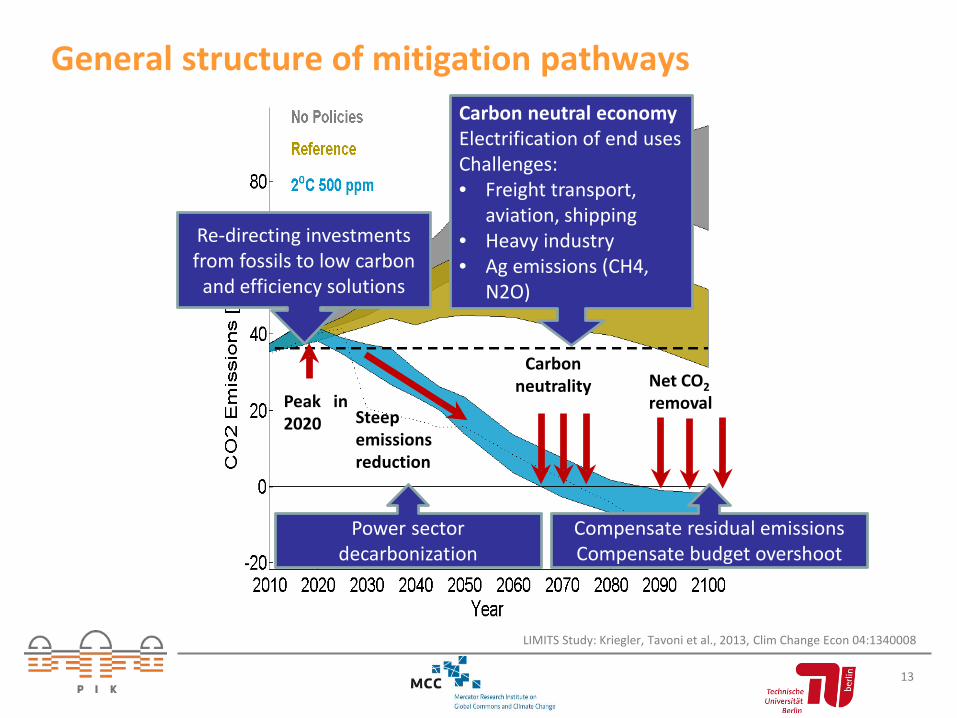
Peak in 2020 Steep
emissionsreduction
Carbon neutrality Net CO2
removal
Re-directing investmentsfrom fossils to low carbon
and efficiency solutions
Power sectordecarbonization
Carbon neutral economyElectrification of end usesChallenges: • Freight transport,
aviation, shipping• Heavy industry• Ag emissions (CH4,
N2O)
Compensate residual emissionsCompensate budget overshoot
General structure of mitigation pathways
13
LIMITS Study: Kriegler, Tavoni et al., 2013, Clim Change Econ 04:1340008
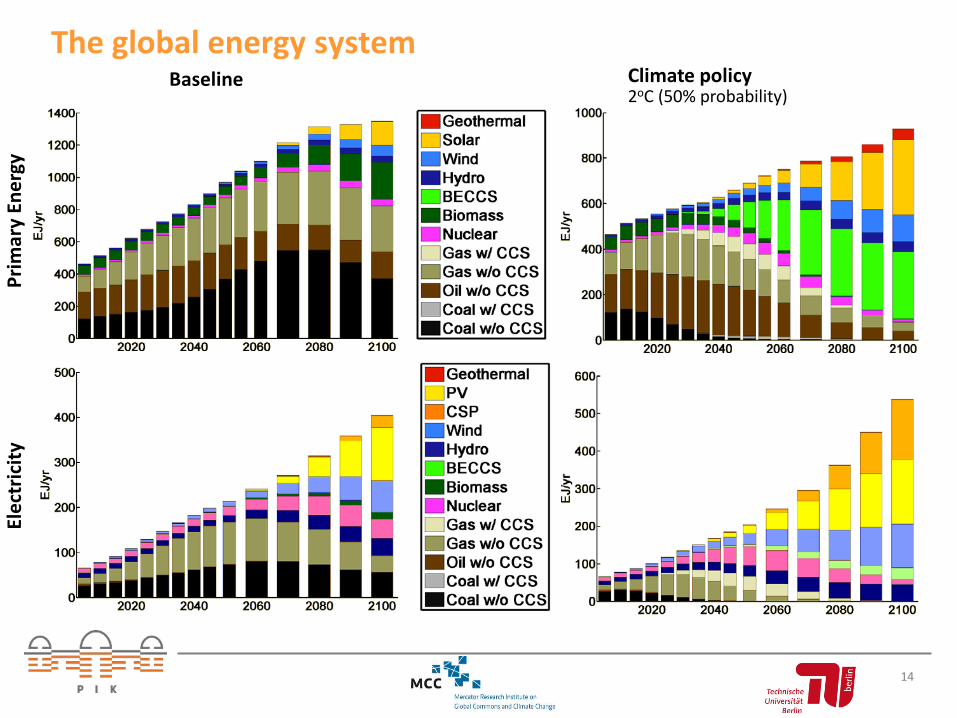
The global energy systemBaseline
Prim
ary
Ener
gy
Climate policy2oC (50% probability)
Elec
tric
ity
14
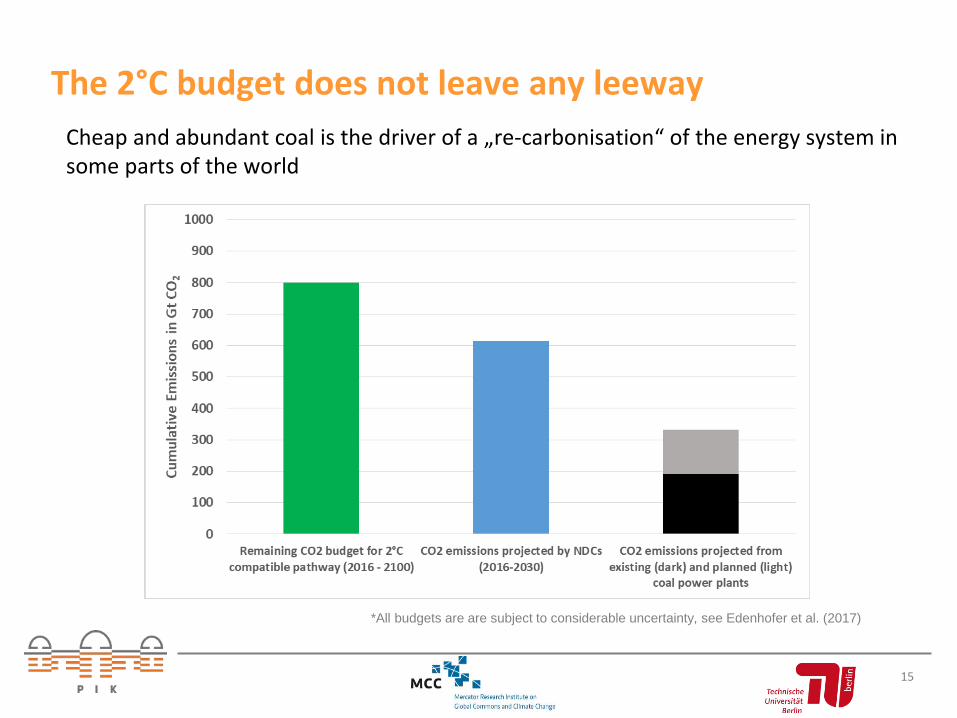
The 2°C budget does not leave any leeway
15
Cheap and abundant coal is the driver of a „re-carbonisation“ of the energy system in some parts of the world
*All budgets are are subject to considerable uncertainty, see Edenhofer et al. (2017)
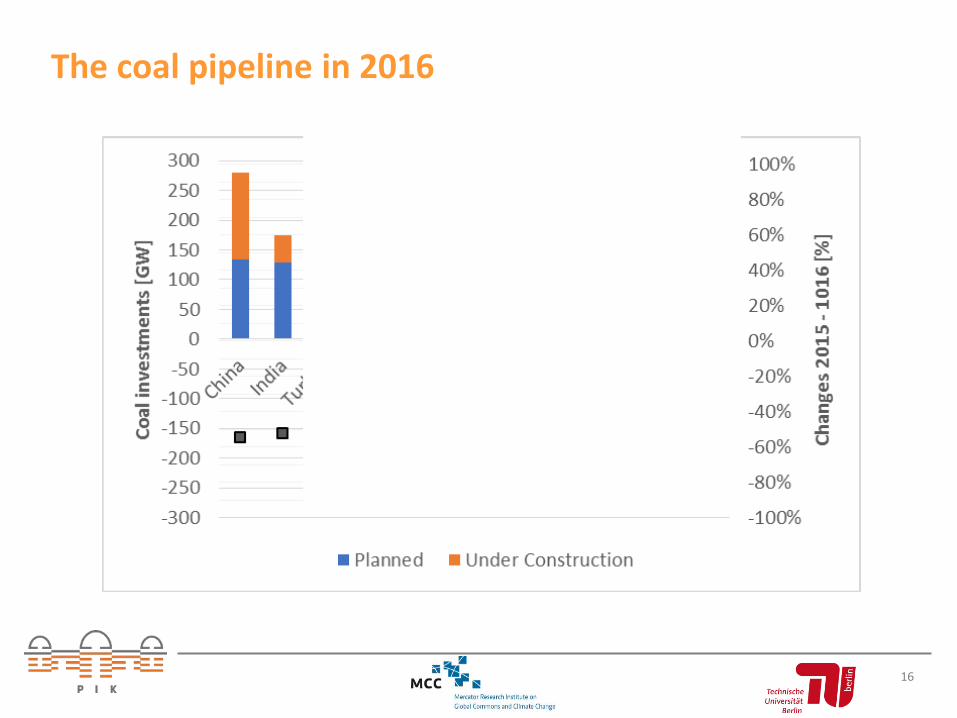
The coal pipeline in 2016
16
Egypt: +784%
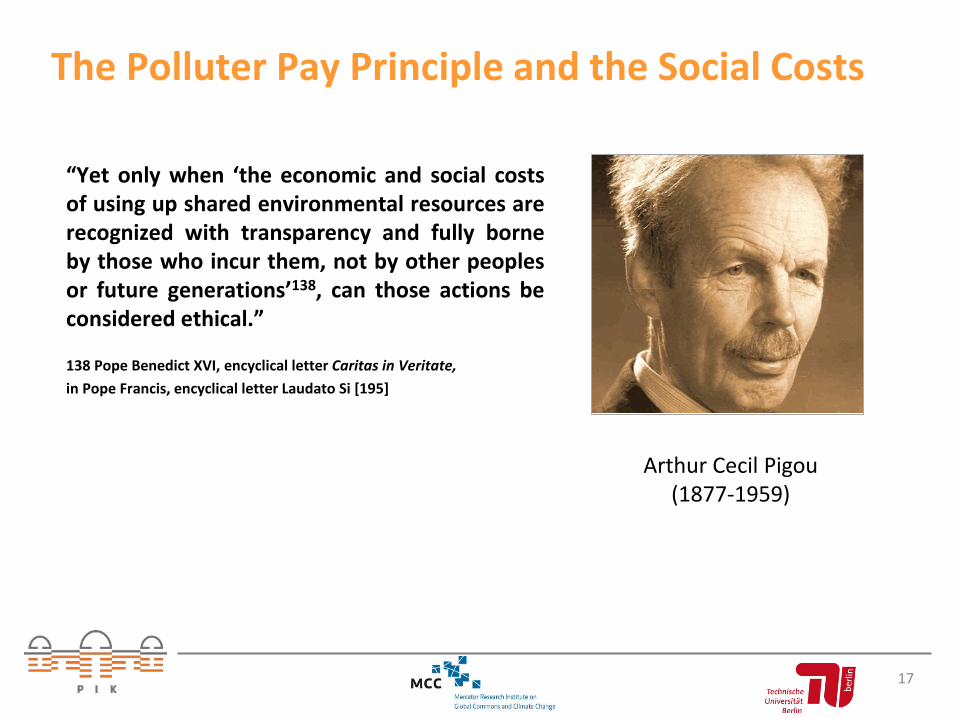
The Polluter Pay Principle and the Social Costs
17
“Yet only when ‘the economic and social costsof using up shared environmental resources arerecognized with transparency and fully borneby those who incur them, not by other peoplesor future generations’138, can those actions beconsidered ethical.”
138 Pope Benedict XVI, encyclical letter Caritas in Veritate, in Pope Francis, encyclical letter Laudato Si [195]
Arthur Cecil Pigou(1877-1959)
Report of the High-Level Commission on Carbon Prices
18
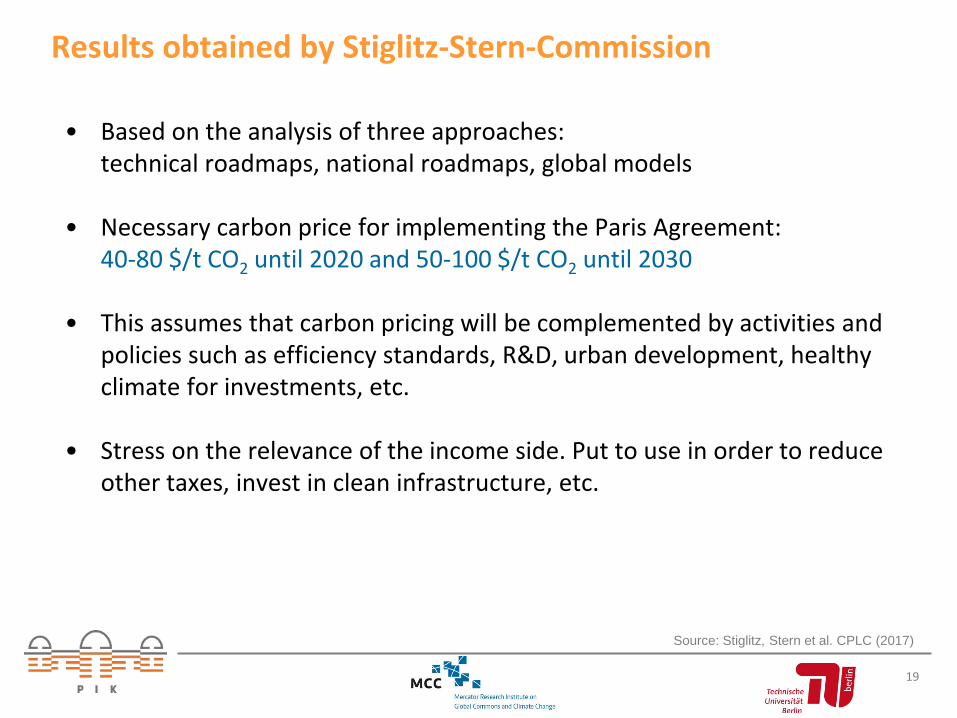
Results obtained by Stiglitz-Stern-Commission
19
• Based on the analysis of three approaches:technical roadmaps, national roadmaps, global models
• Necessary carbon price for implementing the Paris Agreement: 40-80 $/t CO2 until 2020 and 50-100 $/t CO2 until 2030
• This assumes that carbon pricing will be complemented by activities andpolicies such as efficiency standards, R&D, urban development, healthyclimate for investments, etc.
• Stress on the relevance of the income side. Put to use in order to reduceother taxes, invest in clean infrastructure, etc.
Source: Stiglitz, Stern et al. CPLC (2017)
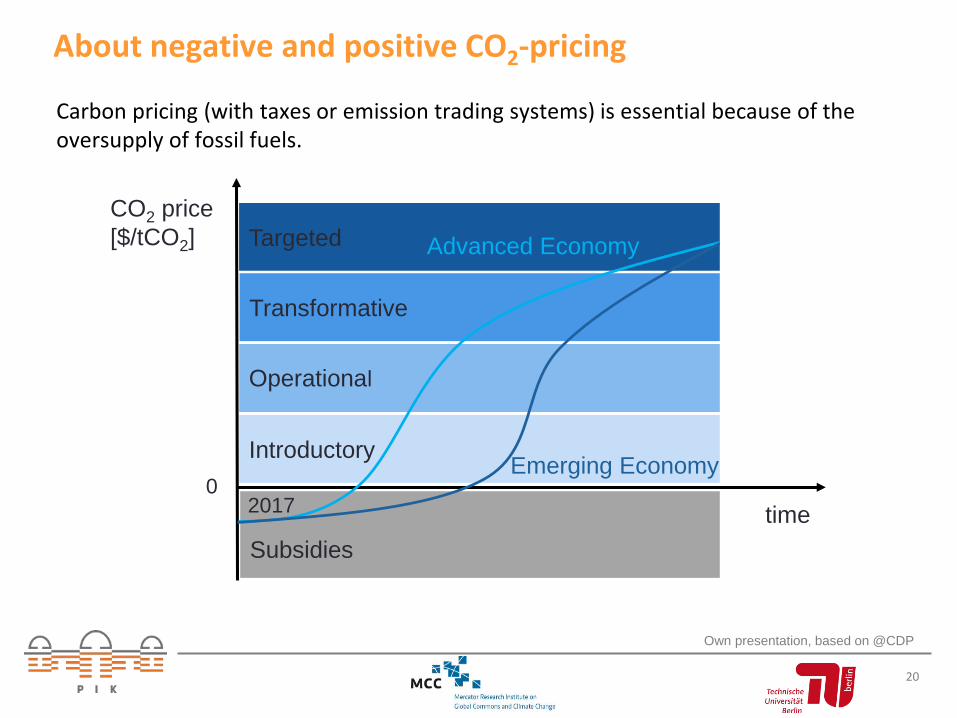
About negative and positive CO2-pricing
Carbon pricing (with taxes or emission trading systems) is essential because of the oversupply of fossil fuels.
Own presentation, based on @CDP
0
Subsidies
Introductory
Targeted
Transformative
Operational
CO2 price[$/tCO2]
2017
Advanced Economy
Emerging Economy
time
20
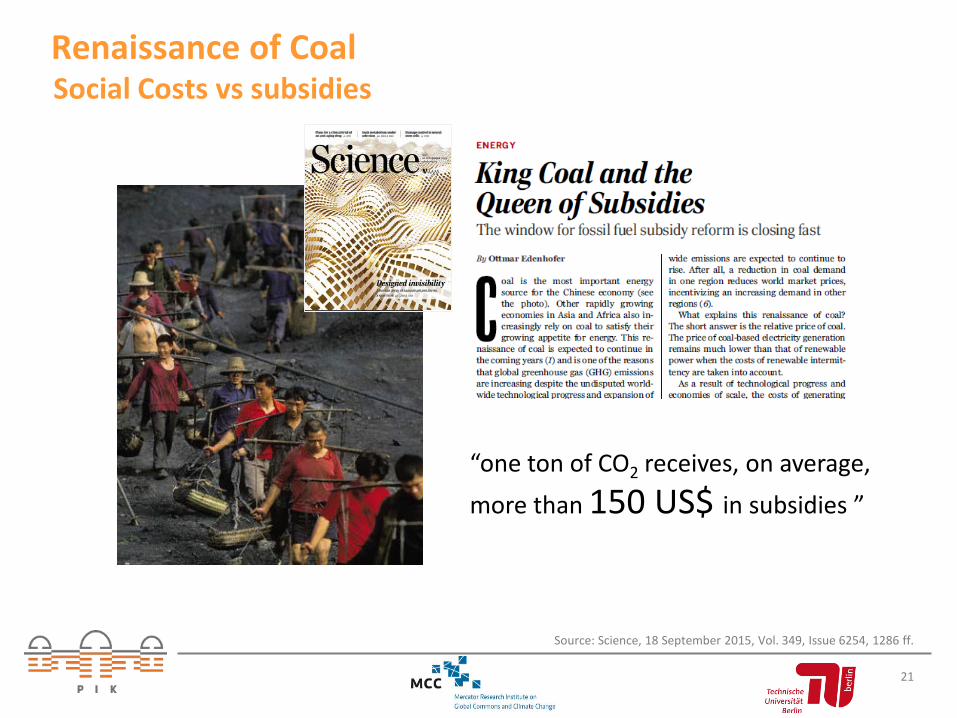
Renaissance of CoalSocial Costs vs subsidies
21
“one ton of CO2 receives, on average, more than 150 US$ in subsidies ”
Source: Science, 18 September 2015, Vol. 349, Issue 6254, 1286 ff.
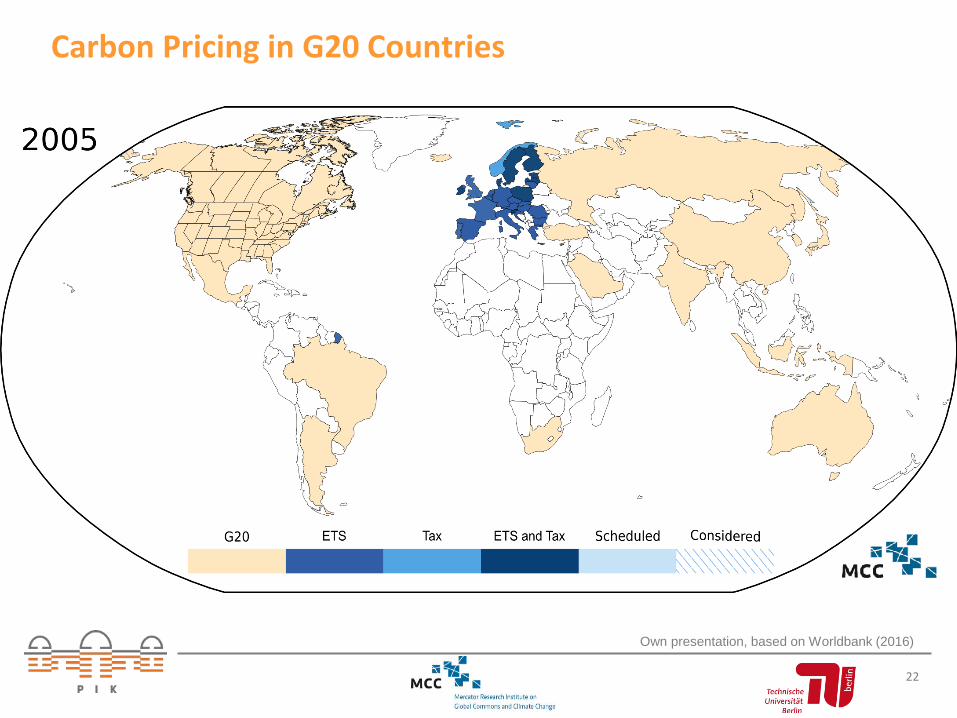
Carbon Pricing in G20 Countries
Own presentation, based on Worldbank (2016)
22
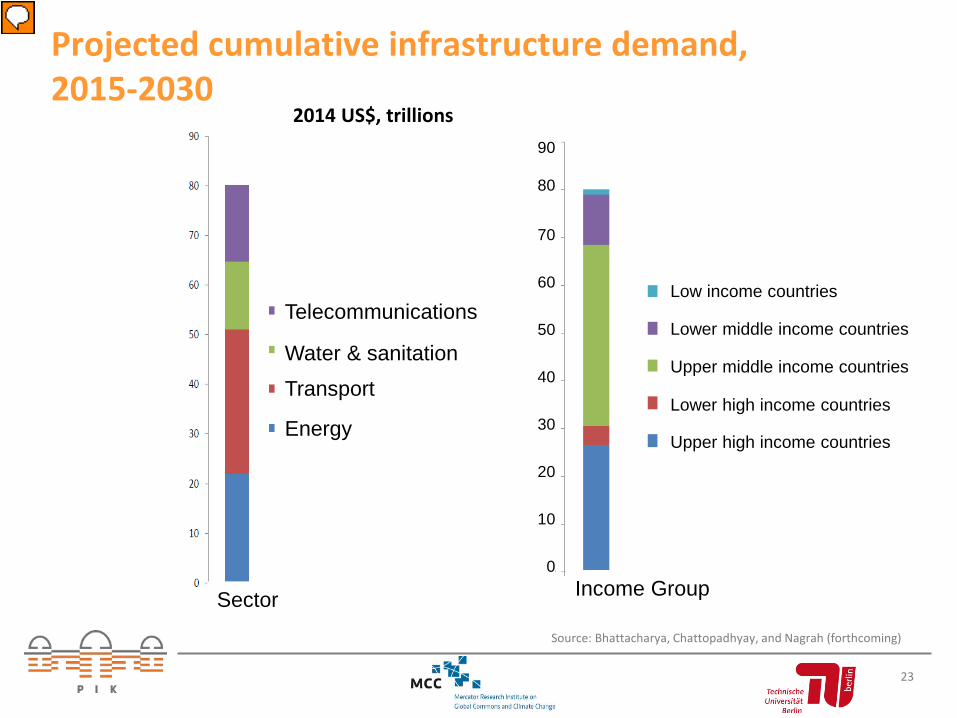
Projected cumulative infrastructure demand, 2015-2030
23
2014 US$, trillions
Source: Bhattacharya, Chattopadhyay, and Nagrah (forthcoming)
Sector
Telecommunications
Transport
Energy
Income Group
9090
80
70
60
50
40
30
20
10
0
Water & sanitation
Low income countries
Lower middle income countries
Upper middle income countries
Lower high income countries
Upper high income countries
Conclusions
• Unabated climate change will cause high economic costs; the cost ofmitigating climate change will be substantially smaller.
• The necessary reduction of global carbon emissions could be regulatedefficiently by introducing carbon price on emissions.
• Weak INDCs as well as the observed renaissance of coal are inconsistentwith the 2°C target.
• Allocation of the investments necessary for decarbonization is a jointchallenge for climate policy and the financial system.
24
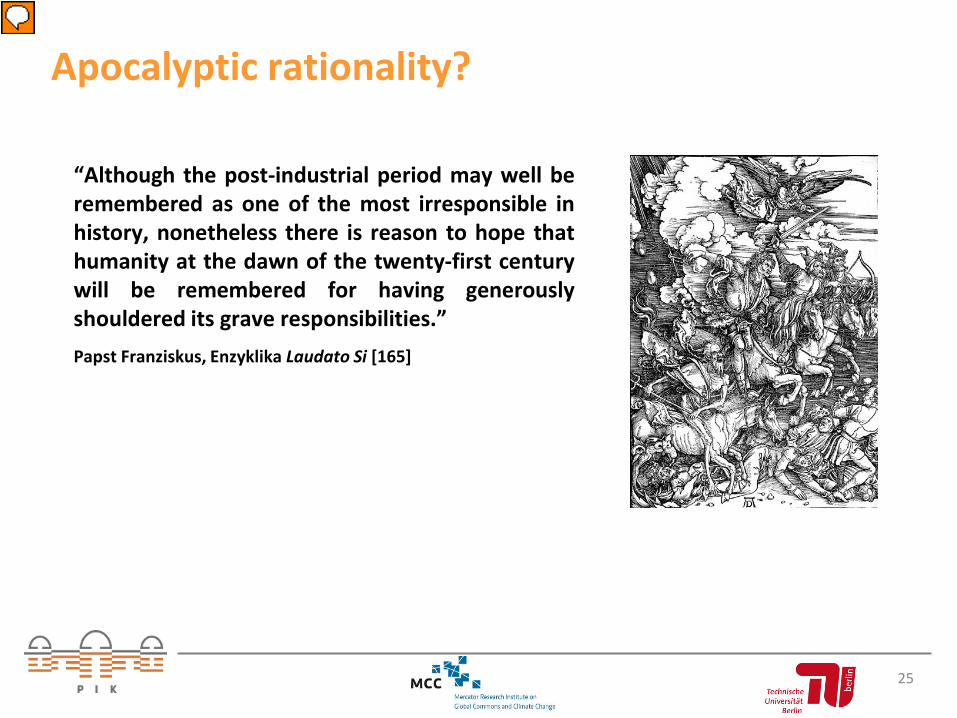
Apocalyptic rationality?
25
“Although the post-industrial period may well beremembered as one of the most irresponsible inhistory, nonetheless there is reason to hope thathumanity at the dawn of the twenty-first centurywill be remembered for having generouslyshouldered its grave responsibilities.”Papst Franziskus, Enzyklika Laudato Si [165]