climate classification for the simulation of thermally ...orbit.dtu.dk/files/68467948/p_1481.pdf ·...
TRANSCRIPT
General rights Copyright and moral rights for the publications made accessible in the public portal are retained by the authors and/or other copyright owners and it is a condition of accessing publications that users recognise and abide by the legal requirements associated with these rights.
• Users may download and print one copy of any publication from the public portal for the purpose of private study or research. • You may not further distribute the material or use it for any profit-making activity or commercial gain • You may freely distribute the URL identifying the publication in the public portal
If you believe that this document breaches copyright please contact us providing details, and we will remove access to the work immediately and investigate your claim.
Downloaded from orbit.dtu.dk on: Jun 19, 2018
Climate classification for the simulation of thermally activated building systems(TABS)
Behrendt, Benjamin; Christensen, Jørgen Erik
Published in:Proceedings of BS2013
Publication date:2013
Document VersionPublisher's PDF, also known as Version of record
Link back to DTU Orbit
Citation (APA):Behrendt, B., & Christensen, J. E. (2013). Climate classification for the simulation of thermally activated buildingsystems (TABS). In Proceedings of BS2013 (pp. 3614-3621). IBPSA.

CLIMATE CLASSIFICATION FOR THE SIMULATION OFTHERMALLY ACTIVATED BUILDING SYSTEMS (TABS)
Benjamin Behrendt, Jørgen ChristensenDepartment of Civil EngineeringTechnical University of Denmark
ABSTRACTThermally activated building systems (TABS) providehigh temperature cooling and low temperature heatingwhich has a better efficiency compared to traditionalheating and cooling solutions. Additionally the mod-erate required temperature levels for heating and cool-ing create the opportunity to use alternative (sustain-able) energy sources that would otherwise be insuffi-cient.The design of TABS is however challenging and mostoften requires a complete simulation of the building.The standard ISO 11855-4 (2011) suggests a simpli-fied sizing method for TABS. The results howeveromit condensation risk entirely. The proposed cli-mate classification should fill this gap by providing themissing data in a simple manner.
INTRODUCTIONTABS are low temperature heating and high tempera-ture cooling systems. This has a number of advantagesif compared to conventional systems. The requiredtemperature levels are more favorable for the use inconjunction with sustainable energy sources such asfor instance ground heat exchangers, solar energy (col-lectors), heat pumps, low temperature district heatingand others. The use of TABS can considerably de-crease the primary energy demand of a building whileat the same time maintaining or even improve the com-fort in the building.The utilization of TABS for cooling of buildings intro-duces one problem that is mostly foreign to air basedcooling systems: Condensation within occupied space.Even though in office buildings the internal humid-ity load is mostly within acceptable limits the prob-lem could still arise depending on the external envi-ronment.During the design of TABS it is therefore importantto evaluate the risk of condensation within the build-ing. If a complete building simulation is undertakenmost building simulation tools today recognize poten-tial condensation risks and notify the user. Since sim-ulations of the like are however time consuming it isof considerable value if the usability of TABS couldbe quickly assessed in a simplified approach. To thisend the ISO 11855-4 (2011) suggests the use of a sim-plified simulation method. This type of simulationhowever does not consider humidity at all but focusessolely on thermal performance. A possible result of
a simulation with such tool could be that the build-ing may be sufficiently cooled by TABS, a full build-ing simulation would however reveal that the systemwould likely cause condensation on the controlled sur-faces.To identify this risk it would be beneficial if a cli-mate classification for the use of TABS would exist.This is however not the case as most available cli-mate classifications consider precipitation but not hu-midity (relative or total). The Koppen-Geiger (Kot-tek et al., 2006) or the ASHRAE Climate classification(ASHRAE, 2010) are to examples for well establishedsystems, in terms of simulating TABS they are how-ever not quite fitting the needs.The suggested climate classification is greatly simpli-fied if compared with other established systems suchas the Koppen-Geiger or the ASHRAE classificationbut it incorporates the two important key variables forTABS. The proposed system is based on a combinationof degree days and the outside dew point temperature.Compared to the afore mentioned classifications it of-fers less climatic zones but in return they are closermodeled to the problem at hand.The current classification is only based on 54 locationsin Europe hence its resolution is still too low in someareas. It can however already be used to get a first es-timate of what should be expected of a TABS systemused in the area.The method had been tested on a simple office build-ing that has been simulated in various locations (e.g.climate zones) and it has been found that the methodworks as intended.
Problem statementThe intention is to create a simple climate classifica-tion to determine the usability of TABS for a modernbuilding (in accordance to current building standards)throughout Europe (and eventually worldwide). Thefollowing points should be answered through the clas-sification. The classification should provide a quickanswer to the questions:Does the building need . . .
. . . a heating system?
. . . a cooling system?
. . . a heating and cooling system?
. . . no dehumidification?
. . . intermittent dehumidification?
. . . continuous dehumidification?
Proceedings of BS2013: 13th Conference of International Building Performance Simulation Association, Chambéry, France, August 26-28
- 3614 -
In conjunction with the simplified approach for the siz-ing of TABS as suggested in ISO 11855-4 (2011) thiswill provide a method to evaluate the usability of tabs.
EXISTING CLIMATE CLASSIFICATIONSA number of already existing climate classificationshave been considered but due to different shortcom-ings they could not be used.One of the most promising climate classifications wasthe Koppen-Geiger system. In the end this systemcould not be used due to high differences within oneclimatic zone making it impossible to use it for theevaluation of TABS. It also had shortcomings in rela-tion to the provided humidity data.Another system that had been considered is theASHRAE Climate Zones. However in this case insuf-ficient data was provided as climate data only includesprecipitation in the USA and humidity is completelyomitted. However the ASHRAE Climate Zones havebeen used in a previous study (Love and Tian, 2009)comparing the use of TABS to a VAV and radiatorbased system with regard to energy savings. Only UScities have been included in this study.The degree day method has been used in previousSince the operation of TABS can be greatly limited byhumidity it is important to have a system that pays at-tention to this aspect. The new introduced system asa combination of heating and cooling degree days aswell as humidity can achieve this.
THE NEW CLIMATE CLASSIFICATIONDegree days are defined as the difference of the basetemperature and the average daily or hourly outdoortemperature. After both, heating and cooling degreeday calculations are explained, the used base tempera-ture is discussed in detail.
Heating Degree DaysHeating Degree Days (HDD) are calculated by defin-ing a base temperature, from which the average dailyor hourly outdoor temperature is subtracted. If thevalue is positive, it is added to the sum of heatingdegree days. This is repeated for every day or hourthroughout the year. Equation 1 shows the heating de-gree day calculation using average daily temperaturesbased on hourly temperatures. Equation 2 shows theheating degree day calculation using hourly tempera-tures. Thus the key difference is that Equation 1 onlyadds to the HDD if the daily average outdoor temper-ature is below the base temperature whereas Equation2 adds to the HDD every time the hourly outdoor tem-perature is below the base temperature.The high thermal mass of TABS causes the systemto have a high time constant. This high time con-stant makes it practically impossible to actively reactto short term changes in heating demand. For this rea-son Equation 1 is the appropriate choice. Short termchanges in heating demand are compensated throughself regulation of TABS. This self regulation is a com-
bination of two things. First the difference in heat ca-pacity of air and typical building materials (e.g. con-crete) and second the changing temperature differencebetween the air and the active surfaces.
HDD =365X
j=1
Tb �
P24i=1 Tj,i
24
!+
(1)
HDD =365X
j=1
P24i=1(Tb � Tj,i)+
24(2)
Cooling Degree DaysCooling Degree Days (CDD) are calculated very sim-ilar to heating degree days. A base temperature is de-fined which is then subtracted from the average dailyor hourly outdoor temperature. If the value is positiveit is added to the sum of cooling degree days. Thisis repeated for every day or hour throughout the year.Equation 3 shows the cooling degree calculation usingaverage daily temperatures based on hourly tempera-tures. Equation 4 shows the cooling degree day calcu-lation using hourly temperatures.For calculating CDD Equation 3 has been used. Theargument is the same as for the calculation of HDD.
CDD =365X
j=1
P24i=1 Tj,i
24� Tb
!+
(3)
CDD =365X
j=1
P24i=1(Tj,i � Tb)+
24(4)
Base TemperatureIn general, the base temperature - or balance pointtemperature - is the outside air temperature at whichweather-related energy demand would be zero includ-ing any gains from occupants, solar radiation, lighting,equipment, etc. - i.e. the average gains are equal to theaverage heat loss of the building in the given period.Or in simpler terms: No system (heating or cooling)is required, if the outside temperature is equal to thebase temperature. This can also be seen from Equa-tion 5 (ASHRAE, 2001).
qgain = h · (Ti � Tb) (5)
Tb = Ti �qgainh
(6)
This shows that it is impossible to have one standard-ized base temperature as buildings vary in there con-struction (heat loss coefficient), location and use (aver-age gains from equipment, occupants, solar radiation,etc.) as well as desired indoor temperature (thermalcomfort requirements).
Proceedings of BS2013: 13th Conference of International Building Performance Simulation Association, Chambéry, France, August 26-28
- 3615 -
In addition different base temperatures are currentlyused in different countries. In Denmark 17�C are com-monly used as base temperature for heating degreedays with a minimum indoor temperature of 20�C. Theremaining 3�C are assumed to be provided through in-ternal and external heat gains. (ASHRAE, 2001; Cap-pelen, 2002) The same base temperature is used insome European countries, in others, like the UnitedKingdom and Germany the used base temperaturesare with 15.5�C and 15�C respectively considerablylower. The USA on the other hand use a higher basetemperature of 18.3�C (Energy Lens n.d.; Butala &Prek 2010) for the calculation of cooling degree daysless countries have set a base temperature. ASHRAEuses a base temperature of only 10�C, assuming thatthe remaining heat to reach thermal comfort is sup-plied through a combination of internal and externalgains (ASHRAE, 2001).For the new climate classification the base temperatureused for heating degree days is 18�C and for coolingdegree days is 13�C. Compared to the suggestion byLaustsen (2008) only four climatic zones have beendefined as illustrated in Table 1.
Table 1: Criteria for the four different thermal cli-mates, based on heating and cooling degree days witha base temperature of 18�C for HDD and 13�C forCDD, based on Laustsen (2008).
Climate Heating CoolingHeating based 2000 HDD CDD < 1000Combined 2000 HDD 1000 CDDModerate HDD < 2000 CDD < 1000Cooling based HDD < 2000 1000 CDD
Humidity considerationsFor cooling with TABS it is important to consider thepossibility of condensation on controlled surfaces aswell as inside of the construction. Where the firstis easily spotted, the latter is not as easy to observe.Condensation inside of the slab might lead to futureproblems and should therefore be avoided. This makeslow dew-point temperatures of 14�C interesting. Un-der extreme conditions it could otherwise happen thatmold starts to grow on the controlled surfaces.Due to thermal comfort requirements (neglecting pos-sible radiant asymmetries) the floor surface tempera-tures should not be lower than 19�C and wall surfacesshould not be cooled below 17�C (Babiak et al., 2007).The presented climate classification distinguishesthree different humidity scenarios.
• No dehumidification - In this case humiditylevels are not likely to cause any problems, evenwithout any dehumidification.
• Intermittent dehumidification - The instal-lation of a dehumidification unit is required.However the unit will not need to be operatedthroughout the cooling season.
• Continuous dehumidification - During thecooling period the indoor humidity needs to becontrolled most of the time.
Within the 54 evaluated cities (52 in Europe, 2 inNorth-Africa) no case has been found where contin-uous dehumidification would be necessary. As can beseen in Table 2 there are however locations like AbuDhabi, United Arab Emirates, that do require continu-ous dehumidification.
Degree Days and humidity combined
The new system is now a combination of the four ther-mal zones with the three humidity scenarios. Thisgenerates a theoretical total of twelve climate zones.Based on the 54 European cities that have been evalu-ated for the classification not all of these zones can befound in Europe. Table 2 shows an example city foreach of the climate zones. If no example is given nooccurrence of this combination has been found so far.
Table 2: Example cities for each defined category (ifany) using base temperatures of 18�C for HDD and13�C for CDD
Climate No DehumidificationHeating based Copenhagen, Denmark
HDD: 3562, CDD: 308Combined Bucharest, Romania
HDD: 3029, CDD: 1071Moderate Porto, Portugal
HDD: 1506, CDD: 870Cooling based Madrid, Spain
HDD: 1964, CDD: 1407Climate Intermittent DehumidificationHeating based Strasbourg, France
HDD: 2947, CDD: 650Combined Milan, Italy
HDD: 2640, CDD: 1064Moderate -Cooling based Athens, Greece
HDD: 1112, CDD: 2120Climate Continues DehumidificationHeating based -Combined -Moderate -Cooling based Abu Dhabi, UAE
HDD: 24, CDD: 5159
SYSTEM VALIDATIONIn order to validate the established system a numberof simulations have been done in BSim. The refer-ence Building used for this study is the same as hasbeen used for an earlier simulation tool comparison byBehrendt et al. (2011). Its dimensions can be seen infigure 1. The building is well insulated and has goodglassing and external shading.
Proceedings of BS2013: 13th Conference of International Building Performance Simulation Association, Chambéry, France, August 26-28
- 3616 -
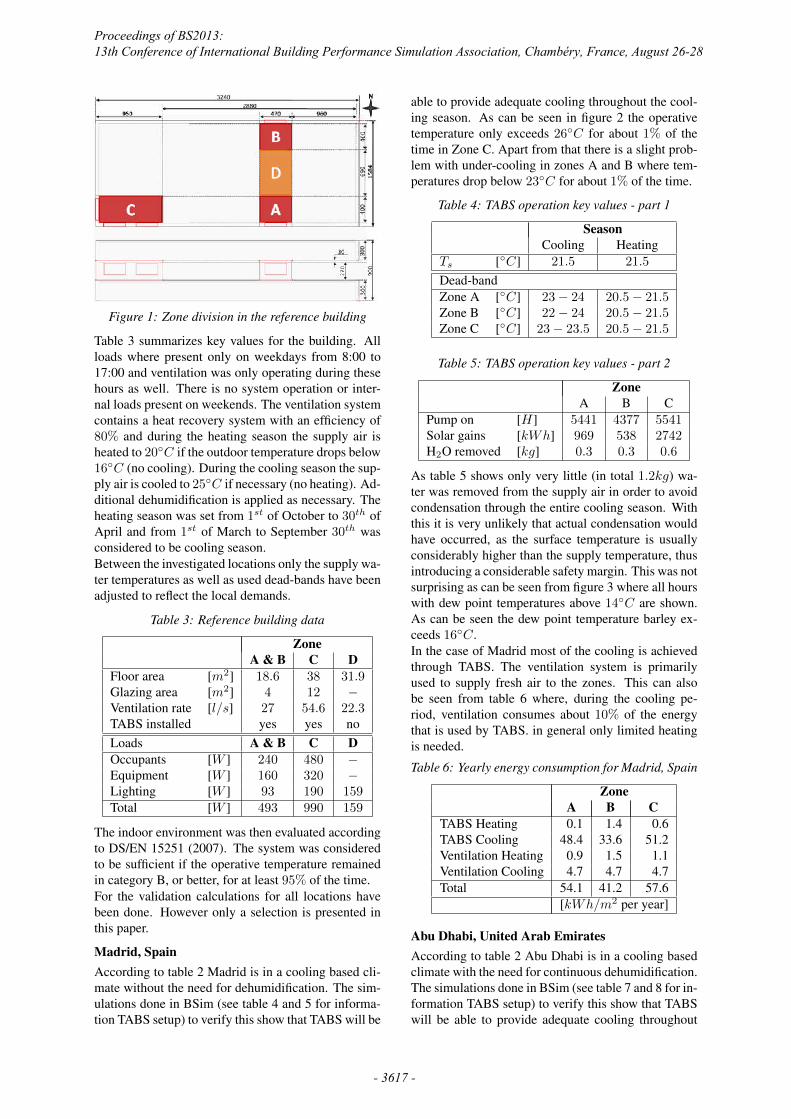
Figure 1: Zone division in the reference building
Table 3 summarizes key values for the building. Allloads where present only on weekdays from 8:00 to17:00 and ventilation was only operating during thesehours as well. There is no system operation or inter-nal loads present on weekends. The ventilation systemcontains a heat recovery system with an efficiency of80% and during the heating season the supply air isheated to 20�C if the outdoor temperature drops below16�C (no cooling). During the cooling season the sup-ply air is cooled to 25�C if necessary (no heating). Ad-ditional dehumidification is applied as necessary. Theheating season was set from 1st of October to 30th ofApril and from 1st of March to September 30th wasconsidered to be cooling season.Between the investigated locations only the supply wa-ter temperatures as well as used dead-bands have beenadjusted to reflect the local demands.
Table 3: Reference building data
ZoneA & B C D
Floor area [m2] 18.6 38 31.9Glazing area [m2] 4 12 �Ventilation rate [l/s] 27 54.6 22.3TABS installed yes yes noLoads A & B C DOccupants [W ] 240 480 �Equipment [W ] 160 320 �Lighting [W ] 93 190 159Total [W ] 493 990 159
The indoor environment was then evaluated accordingto DS/EN 15251 (2007). The system was consideredto be sufficient if the operative temperature remainedin category B, or better, for at least 95% of the time.For the validation calculations for all locations havebeen done. However only a selection is presented inthis paper.
Madrid, SpainAccording to table 2 Madrid is in a cooling based cli-mate without the need for dehumidification. The sim-ulations done in BSim (see table 4 and 5 for informa-tion TABS setup) to verify this show that TABS will be
able to provide adequate cooling throughout the cool-ing season. As can be seen in figure 2 the operativetemperature only exceeds 26�C for about 1% of thetime in Zone C. Apart from that there is a slight prob-lem with under-cooling in zones A and B where tem-peratures drop below 23�C for about 1% of the time.
Table 4: TABS operation key values - part 1
SeasonCooling Heating
Ts [�C] 21.5 21.5
Dead-bandZone A [�C] 23� 24 20.5� 21.5Zone B [�C] 22� 24 20.5� 21.5Zone C [�C] 23� 23.5 20.5� 21.5
Table 5: TABS operation key values - part 2
ZoneA B C
Pump on [H] 5441 4377 5541Solar gains [kWh] 969 538 2742H2O removed [kg] 0.3 0.3 0.6
As table 5 shows only very little (in total 1.2kg) wa-ter was removed from the supply air in order to avoidcondensation through the entire cooling season. Withthis it is very unlikely that actual condensation wouldhave occurred, as the surface temperature is usuallyconsiderably higher than the supply temperature, thusintroducing a considerable safety margin. This was notsurprising as can be seen from figure 3 where all hourswith dew point temperatures above 14�C are shown.As can be seen the dew point temperature barley ex-ceeds 16�C.In the case of Madrid most of the cooling is achievedthrough TABS. The ventilation system is primarilyused to supply fresh air to the zones. This can alsobe seen from table 6 where, during the cooling pe-riod, ventilation consumes about 10% of the energythat is used by TABS. in general only limited heatingis needed.
Table 6: Yearly energy consumption for Madrid, Spain
ZoneA B C
TABS Heating 0.1 1.4 0.6TABS Cooling 48.4 33.6 51.2Ventilation Heating 0.9 1.5 1.1Ventilation Cooling 4.7 4.7 4.7Total 54.1 41.2 57.6
[kWh/m2 per year]
Abu Dhabi, United Arab EmiratesAccording to table 2 Abu Dhabi is in a cooling basedclimate with the need for continuous dehumidification.The simulations done in BSim (see table 7 and 8 for in-formation TABS setup) to verify this show that TABSwill be able to provide adequate cooling throughout
Proceedings of BS2013: 13th Conference of International Building Performance Simulation Association, Chambéry, France, August 26-28
- 3617 -
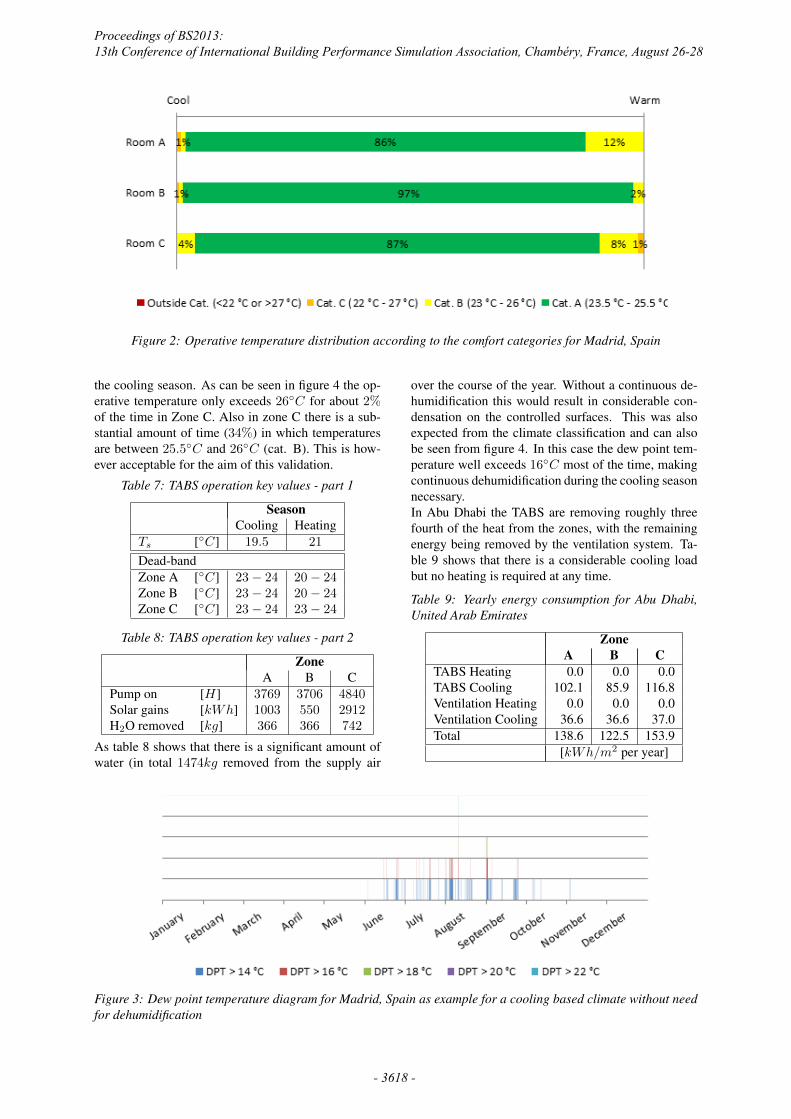
Figure 2: Operative temperature distribution according to the comfort categories for Madrid, Spain
the cooling season. As can be seen in figure 4 the op-erative temperature only exceeds 26�C for about 2%of the time in Zone C. Also in zone C there is a sub-stantial amount of time (34%) in which temperaturesare between 25.5�C and 26�C (cat. B). This is how-ever acceptable for the aim of this validation.
Table 7: TABS operation key values - part 1
SeasonCooling Heating
Ts [�C] 19.5 21
Dead-bandZone A [�C] 23� 24 20� 24Zone B [�C] 23� 24 20� 24Zone C [�C] 23� 24 23� 24
Table 8: TABS operation key values - part 2
ZoneA B C
Pump on [H] 3769 3706 4840Solar gains [kWh] 1003 550 2912H2O removed [kg] 366 366 742
As table 8 shows that there is a significant amount ofwater (in total 1474kg removed from the supply air
over the course of the year. Without a continuous de-humidification this would result in considerable con-densation on the controlled surfaces. This was alsoexpected from the climate classification and can alsobe seen from figure 4. In this case the dew point tem-perature well exceeds 16�C most of the time, makingcontinuous dehumidification during the cooling seasonnecessary.In Abu Dhabi the TABS are removing roughly threefourth of the heat from the zones, with the remainingenergy being removed by the ventilation system. Ta-ble 9 shows that there is a considerable cooling loadbut no heating is required at any time.
Table 9: Yearly energy consumption for Abu Dhabi,United Arab Emirates
ZoneA B C
TABS Heating 0.0 0.0 0.0TABS Cooling 102.1 85.9 116.8Ventilation Heating 0.0 0.0 0.0Ventilation Cooling 36.6 36.6 37.0Total 138.6 122.5 153.9
[kWh/m2 per year]
Figure 3: Dew point temperature diagram for Madrid, Spain as example for a cooling based climate without needfor dehumidification
Proceedings of BS2013: 13th Conference of International Building Performance Simulation Association, Chambéry, France, August 26-28
- 3618 -
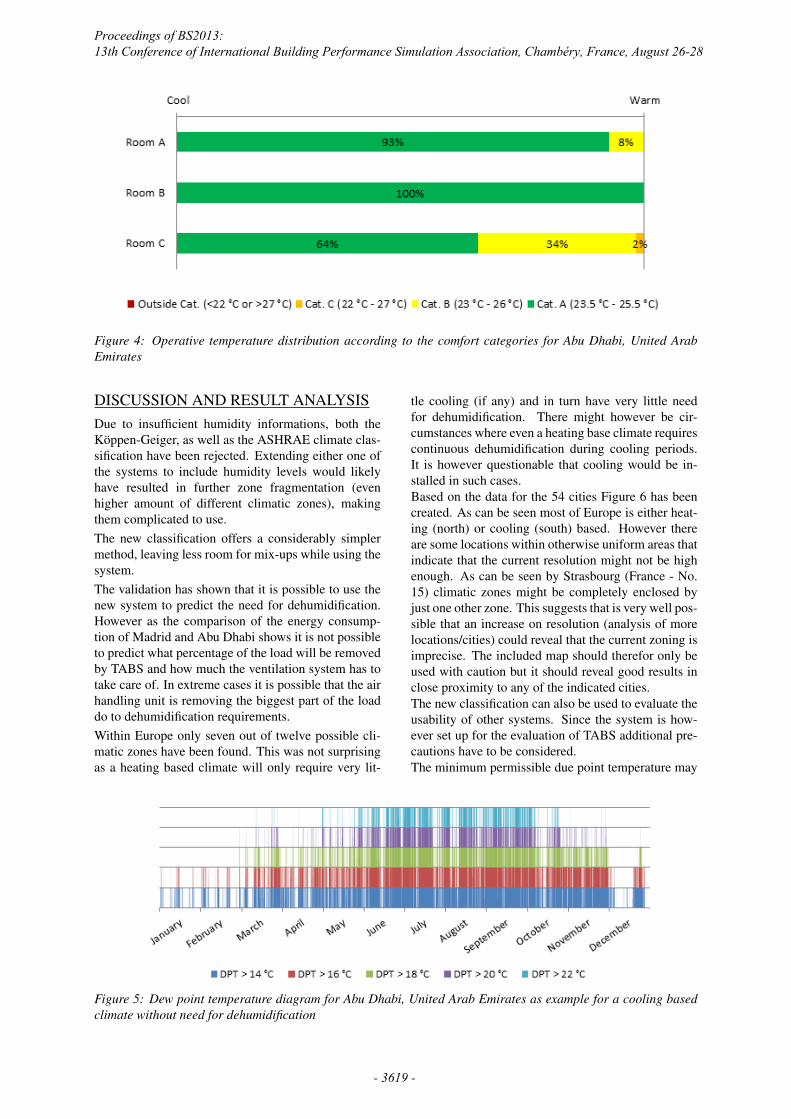
Figure 4: Operative temperature distribution according to the comfort categories for Abu Dhabi, United ArabEmirates
DISCUSSION AND RESULT ANALYSISDue to insufficient humidity informations, both theKoppen-Geiger, as well as the ASHRAE climate clas-sification have been rejected. Extending either one ofthe systems to include humidity levels would likelyhave resulted in further zone fragmentation (evenhigher amount of different climatic zones), makingthem complicated to use.The new classification offers a considerably simplermethod, leaving less room for mix-ups while using thesystem.The validation has shown that it is possible to use thenew system to predict the need for dehumidification.However as the comparison of the energy consump-tion of Madrid and Abu Dhabi shows it is not possibleto predict what percentage of the load will be removedby TABS and how much the ventilation system has totake care of. In extreme cases it is possible that the airhandling unit is removing the biggest part of the loaddo to dehumidification requirements.Within Europe only seven out of twelve possible cli-matic zones have been found. This was not surprisingas a heating based climate will only require very lit-
tle cooling (if any) and in turn have very little needfor dehumidification. There might however be cir-cumstances where even a heating base climate requirescontinuous dehumidification during cooling periods.It is however questionable that cooling would be in-stalled in such cases.Based on the data for the 54 cities Figure 6 has beencreated. As can be seen most of Europe is either heat-ing (north) or cooling (south) based. However thereare some locations within otherwise uniform areas thatindicate that the current resolution might not be highenough. As can be seen by Strasbourg (France - No.15) climatic zones might be completely enclosed byjust one other zone. This suggests that is very well pos-sible that an increase on resolution (analysis of morelocations/cities) could reveal that the current zoning isimprecise. The included map should therefor only beused with caution but it should reveal good results inclose proximity to any of the indicated cities.The new classification can also be used to evaluate theusability of other systems. Since the system is how-ever set up for the evaluation of TABS additional pre-cautions have to be considered.The minimum permissible due point temperature may
Figure 5: Dew point temperature diagram for Abu Dhabi, United Arab Emirates as example for a cooling basedclimate without need for dehumidification
Proceedings of BS2013: 13th Conference of International Building Performance Simulation Association, Chambéry, France, August 26-28
- 3619 -
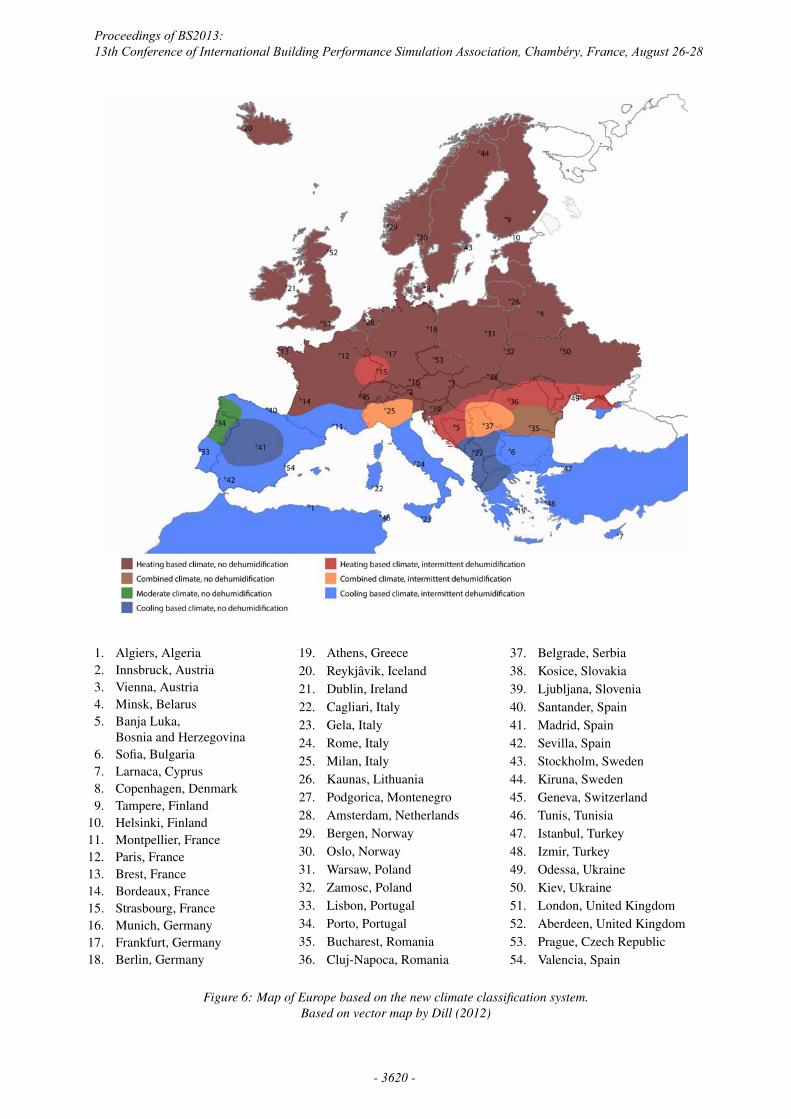
1. Algiers, Algeria2. Innsbruck, Austria3. Vienna, Austria4. Minsk, Belarus5. Banja Luka,
Bosnia and Herzegovina6. Sofia, Bulgaria7. Larnaca, Cyprus8. Copenhagen, Denmark9. Tampere, Finland
10. Helsinki, Finland11. Montpellier, France12. Paris, France13. Brest, France14. Bordeaux, France15. Strasbourg, France16. Munich, Germany17. Frankfurt, Germany18. Berlin, Germany
19. Athens, Greece20. Reykjavik, Iceland21. Dublin, Ireland22. Cagliari, Italy23. Gela, Italy24. Rome, Italy25. Milan, Italy26. Kaunas, Lithuania27. Podgorica, Montenegro28. Amsterdam, Netherlands29. Bergen, Norway30. Oslo, Norway31. Warsaw, Poland32. Zamosc, Poland33. Lisbon, Portugal34. Porto, Portugal35. Bucharest, Romania36. Cluj-Napoca, Romania
37. Belgrade, Serbia38. Kosice, Slovakia39. Ljubljana, Slovenia40. Santander, Spain41. Madrid, Spain42. Sevilla, Spain43. Stockholm, Sweden44. Kiruna, Sweden45. Geneva, Switzerland46. Tunis, Tunisia47. Istanbul, Turkey48. Izmir, Turkey49. Odessa, Ukraine50. Kiev, Ukraine51. London, United Kingdom52. Aberdeen, United Kingdom53. Prague, Czech Republic54. Valencia, Spain
Figure 6: Map of Europe based on the new climate classification system.Based on vector map by Dill (2012)
Proceedings of BS2013: 13th Conference of International Building Performance Simulation Association, Chambéry, France, August 26-28
- 3620 -
differ greatly from one system to another. For exam-ple a chilled beam might already cause condensationon its surfaces while no condensation occurs for TABSwhen operated at the same supply temperature. How-ever, in this case chilled beams would (with otherwiseequivalent geometric properties) have a higher coolingcapacity due to its better heat transfer.Another problem for the use with systems other thanTABS could be the choice made for the calculation ofHDD and CDD. For systems with low thermal inertiaEquations 2 and 4 would be more appropriate to cal-culate HDD and CDD rather than the here used Equa-tions 1 and 3.
CONCLUSIONFor evaluating the use of TABS in different climates,a method for classifying the climates involving heat-ing and cooling degree days and the outdoor dew-pointtemperature has been put forward and a map of Eu-rope divided into 7 of 12 possible climate zones hasbeen created. The method is simple and works as in-tended. In conjunction with a simplified sizing methodfor TABS as suggested in ISO 11855-4 (2011) it ispossible to estimate the capabilities of TABS under thegiven circumstances without the need of a full blownbuilding simulation. This can save time and money asit can be done at early design stages with very littleeffort.The current classification should however be furtherrefined. The currently used base temperatures mightnot be the best choice for modern buildings. The im-proved insulation and glazing that is required due tocurrent building codes in many countries has a signifi-cant influence on the buildings base temperature. Dueto different valid building standards around the worldit might be necessary to adjust the base temperatureaccordingly to get the best results.
NOMENCLATURE
h = heat loss coefficient of thebuilding envelope [W/K]
Tb = base temperature [�C]
Ti = average indoor temperature [�C]
Tj,i = outdoor temp. of hour i on day j [�C]
Ts =Supply water temperature [�C]
qgain = average gains from equipment,occupants, the sun, etc. [W ]
X(. . .)+ = only add to sum if bracket positiv
REFERENCESASHRAE 2001. ASHRAE Handbook Fundamentals
(S-I). American Society of heating, Refrigerationand Air-Conditining Engineers, Inc.
ASHRAE 2010. ASHRAE 90.1 Energy standard for
buildings except low-rise residential buildings (S-I). American Society of heating, Refrigeration andAir-Conditining Engineers, Inc.
Babiak, J., Olesen, B. W., and Petrs, D. 2007. Lowtemperature heating and high temperature cooling.REHVA.
Behrendt, B. M., Raimando, D., Zhang, Y., Schwarz,S., Christensen, J. E., and Olesen, B. W. 2011. Asystem for the comparison of tools for the simula-tion of water-based radiant heating and cooling sys-tems. In 12th Conference of International BuildingPerformance Simulation Association, pages 1025–1032.
Cappelen, J. 2002. Graddage hører vinteren til @ON-LINE Available at: http://www.dmi.dk/
dmi/graddage_horer_vinteren_til [Ac-cessed March 29, 2012].
Dill, E. 2012. Vector maps of eu-rope @ONLINE Available at: http:
//www.vecteezy.com/map-vector/
5918-vector-maps-of-europe [AccessedJuly 23, 2012].
DS/EN 15251 2007. Indoor environmental input pa-rameters for design and assessment of energy per-formance of buildings addressing indoor air quality,thermal environment, lighting and acoustics.
ISO 11855-4 2011. Building environment design —design, dimensioning, installation and control ofthe embedded radiant heating and cooling systems—part 4: Dimensioning and calculation of the dy-namic heating and cooling capacity for tabs.
Kottek, M., Grieser, J., Beck, C., Rudolf, B., andRubel, F. 2006. World map of the koppen-geigerclimate classification updated. MeteorologischeZeitschrift.
Laustsen, J. 2008. Energy efficiency requirements inbuilding codes, energy efficiency policies for newbuildings: Iea information paper. Technical report,International Energy Agency.
Love, J. and Tian, Z. 2009. Application of radiantcooling in different climates: Assessment of officebuildings through simulation. In 11th InternationalIBPSA Conference, page 2220–2227.
Proceedings of BS2013: 13th Conference of International Building Performance Simulation Association, Chambéry, France, August 26-28
- 3621 -