climate change projections of precipitation and reference ... · pdf fileand coastal algeria,...
TRANSCRIPT
INTERNATIONAL JOURNAL OF CLIMATOLOGYInt. J. Climatol. (2013)Published online in Wiley Online Library(wileyonlinelibrary.com) DOI: 10.1002/joc.3650
Climate change projections of precipitation and referenceevapotranspiration for the Middle East and Northern Africa
until 2050
Wilco Terink,* Walter Willem Immerzeel and Peter DroogersFutureWater, Wageningen, The Netherlands
ABSTRACT: The Middle East and North Africa (MENA) region can be considered as the most water-scarce region ofthe world. The Intergovernmental Panel on Climate Change projects strong changes in climate across MENA, furtherexacerbating pressure on available water resources. The objective of this study is to undertake a climate change assessmentfor 22 MENA countries in order to quantify the problems these countries may encounter up to 2050. To evaluate climatechange in MENA, nine global circulation models representing two future periods (2020–2030 and 2040–2050) werestatistically downscaled and compared with a current climate, defined as the period 2000–2009. Besides precipitation onlythis study also focuses on change in water demand by vegetation reference evapotranspiration (ETref). It was found thatfor both future periods the annual precipitation sum will decrease for the majority of countries, with decreases of 15–20%for the latter period. For some countries, e.g. Djibouti and Yemen, an increase in annual precipitation of 15–20% wasfound. The annual ETref shows an increase for all countries for both future periods, with the strongest increases for thelatter period. For the extreme situation, it was found that the minimum monthly and annual precipitation sum does notbecome smaller in the future climate. It in fact increases. In contrast, the maximum monthly and annual ETref increasesfor all countries. This indicates that projected changes in demand are likely to have a more adverse effect than changes insupply. Spatial analysis showed that the largest precipitation decreases are to be found in southern Egypt, Morocco, centraland coastal Algeria, Tunisia, central Libya, Syria, and central and eastern Iran. A case study for Morocco revealed thatthe potential water deficit, which is already apparent for the current climate, becomes even larger for the future climate.Copyright 2013 Royal Meteorological Society
KEY WORDS MENA; Africa; Middle East; climate change; precipitation; reference evapotranspiration; GCM; downscaling
Received 14 May 2012; Accepted 17 December 2012
1. Introduction
The Middle East and Northern Africa (MENA) regioncan be considered as the most water-scarce region ofthe world. Large-scale water management problems arealready apparent in the region. Aquifers are overpumped,water quality is deteriorating, and water supply and irriga-tion services are often rationed – with consequences forhuman health, agricultural productivity, and the environ-ment. According to Roudi-Fahimi and Kent (2007), theMENA region’s population stood at 432 million in 2007,and is projected to reach nearly 700 million by 2050. Thisalone would lead to a fall in per capita water availabilityby almost 40% by 2050. Moreover, climate change willaffect weather and precipitation patterns with the conse-quence that the MENA region may see more frequentand severe droughts. The Fourth Assessment Report ofthe Intergovernmental Panel on Climate Change (IPCC)(IPCC, 2007) projects strong changes in climate acrossthe MENA region. Temperature increases combined with
* Correspondence to: W. Terink, FutureWater, Costerweg 1V, 6702 AAWageningen, The Netherlands. E-mail: [email protected]
substantial decreases in precipitation are projected. Anincrease in temperature results in a higher evapotranspi-ration demand and will, in combination with a decreasein precipitation, severely stress the water resources in theregion. According to Christensen et al. (2007), regionalprojections in Africa can be summarized as follows: (1)all of Africa is likely to warm during the 21st century,(2) warming is very likely to be larger than the global,annual mean warming throughout the continent and inall seasons, with drier subtropical regions warming morethan the moister tropics, (3) annual rainfall is likely todecrease in much of Mediterranean Africa and north-ern Sahara, and (4) there is likely to be an increase inannual rainfall in East Africa. As stressed by the IPCC(2007) and Christensen et al. (2007), it is clear that theavailable water resources in the MENA region will bealtered owing to the effects of climate change. However,these studies, amongst many other ones, have a ratherspecific focus and do not cover important aspects rel-evant for further research and decision making. Theseshortcomings can be summarized as follows: (1) focuson the continental or regional scale (e.g. Giorgi andFrancisco, 2000a; Christensen et al., 2007) rather than
Copyright 2013 Royal Meteorological Society
W. TERINK et al.
on country (or sub-country) scale, (2) analysis basedon annual totals (e.g. Arnell et al., 2003) rather thanon seasonal and/or monthly values, (3) focus on watersupply (rainfall) and warming (temperature) (e.g. Paethand Hense, 2004; Anyah and Semazzi, 2007; Immerzeel,2008; Shongwe et al., 2009, 2011; Hurkmans et al., 2010;Terink et al., 2010) rather than on combined supply anddemand change (evapotranspiration), and finally (4) sin-gle global circulation model (GCM) selection (e.g. Zwiersand Kharin, 1997; Giorgi and Francisco, 2000b; Anyahand Semazzi, 2007; Hurkmans et al., 2010) instead ofusing multiple GCMs. For the MENA region, there isa strong need for a complete picture of the impact ofclimate change taking into account these four aspects.
The overall objective of this study is to undertakea climate change assessment for the MENA countriesby analysing the change in precipitation and referenceevapotranspiration (ETref) in order to stress the water-related problems these countries may encounter around2050.
Although the IPCC report provides a good indicationfor possible magnitude of climate change, there are someinherent shortcomings related to the continental scale ofthe analysis that we attempt to overcome in this study.Therefore, this study is unique in its approach because(1) we use an ensemble of nine GCMs and statisticallydownscale the model outputs using a high-resolutionreference dataset, (2) we focus on the combined supply(precipitation) and demand (ETref) change instead ofonly on the demand and warming (temperature), (3) weassess intra-annual change in precipitation and ETref withthe aim to identify critical periods with regard to wateravailability, and (4) we aggregate and present resultsat the country level, which is the appropriate scale forinterventions.
The results of this approach are very valuable fora range of other applications from impact and adap-tation assessment to water planners. A demonstrationof this approach from this specific case is presentedin Immerzeel et al. (2012) and Droogers et al. (2012).The first study will evaluate the water availability in theMENA region around 2050 using the PCRGLOB-WBhydrological model (van Beek and Bierkens, 2009). Thesecond study will focus on the water supply to meet thegrowing water need, the various options to meet this need,and associated marginal cost of water supply.
2. Study area, data, and methodology
2.1. Study area
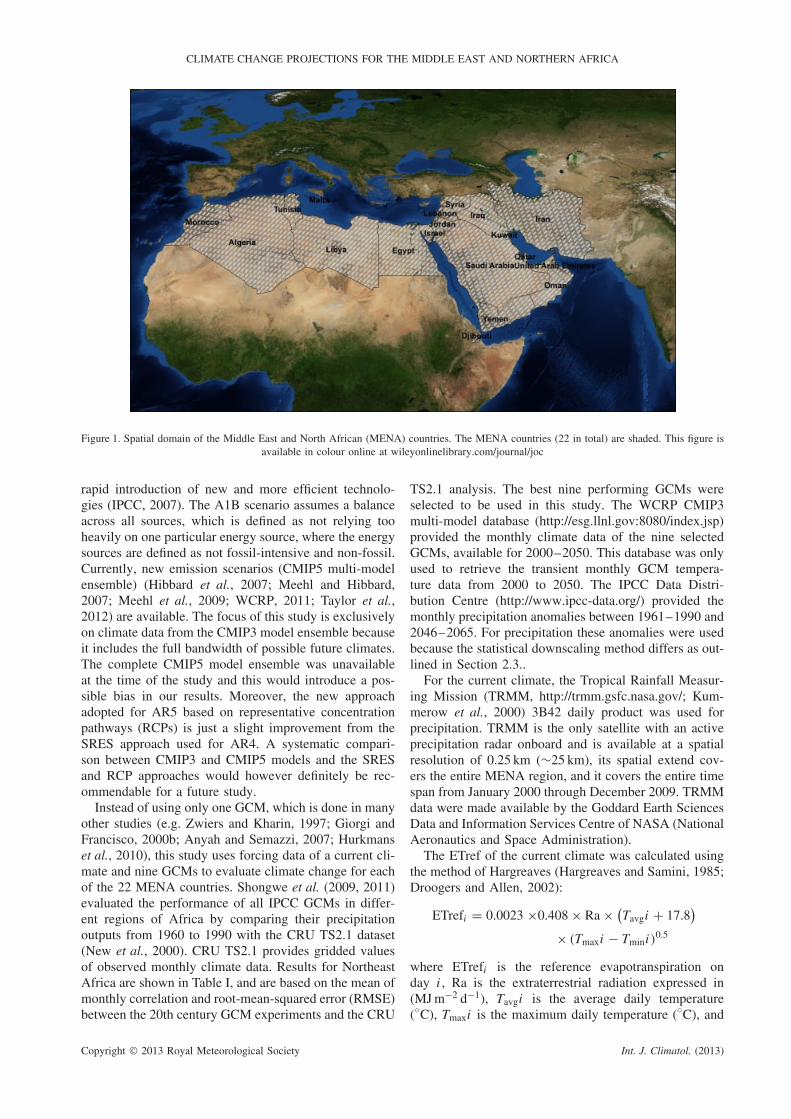
The MENA region (Figure 1) with 22 countries is locatedin the middle east and northern part of Africa. It is aneconomically diverse region that includes both oil-richcountries in the Gulf and countries that are resourcescarce in relation to population, such as Egypt, Morocco,and Yemen. The region is diverse in its landscapes andclimates, from the snowy peaks of the Atlas Mountains tothe empty quarter of the Arabian Peninsula. The MENA
region can be classified according to the aridity index,which is defined as the ratio between precipitation andETref. On the basis of this index, the largest part ofMENA can be classified as hyper-arid (<0.05) (WorldBank, 2007). This hyper-arid area includes the inland inNorthern Africa (Algeria, Libya, and Egypt). The coastalareas of Northern Africa, Iran, and the Western coastalregion of the Middle East are defined as arid to semi-arid.Humid areas are found in the northern parts of Morocco,Algeria, Tunisia, Iraq, and Iran, and the western part ofSyria and Lebanon.
Population densities in MENA are largest in semi-aridto humid regions, or where irrigation systems are present.Irrigation systems are mainly concentrated in the NileDelta in Egypt, where it covers 60–80% of the surfacearea (World Bank, 2007), in the central part of Iraq, andscattered throughout Iran. Despite the presence of somehumid regions and irrigation systems, the MENA regionfaces many challenges.
The largest challenge in the MENA region is thatcountries have to manage an unusual combination of alow annual precipitation that is at the same time highlyvariable. Three groups of countries can be identified:
1 Countries that on average have adequate quantities ofrenewable water, but the within-country and within-year variations are problematically large. These includeDjibouti, Iran, Lebanon, Morocco, Tunisia, and theWest Bank.
2 Countries with consistently low levels of renewablewater resources. Therefore, these countries are highlydependent on non-renewable groundwater sources andsupplies by desalination of sea water. These countriesinclude Bahrain, Gaza, Jordan, Kuwait, Libya, Oman,Qatar, Saudi Arabia, the United Arab Emirates, andYemen.
3 Countries that mainly dependent on the inflow of trans-boundary rivers such as the Nile, the Tigris, and theEuphrates. These countries include Syria, Iraq, andEgypt (World Bank, 2007).
Because the MENA region is the most water-scarceregion of the world, good water management is essen-tial. According to World Bank (2007), most of theMENA region’s countries cannot meet their current waterdemand, and the situation is to get worse because of cli-mate change and population increase.
2.2. Data
This study compares a current climate, which is definedas the period 2000–2009, with two future climate peri-ods: 2020–2030 and 2040–2050. Climate change in theMENA region is evaluated using the A1B GHG emissionscenario, which is a scenario of one of the four IPCCscenario families (A1, A2, B1, and B2) (SRES, 2000).This scenario was chosen because it is the most likelyscenario; it assumes a world of rapid economic growth,a global population that peaks in mid-century, and a
Copyright 2013 Royal Meteorological Society Int. J. Climatol. (2013)
CLIMATE CHANGE PROJECTIONS FOR THE MIDDLE EAST AND NORTHERN AFRICA
Figure 1. Spatial domain of the Middle East and North African (MENA) countries. The MENA countries (22 in total) are shaded. This figure isavailable in colour online at wileyonlinelibrary.com/journal/joc
rapid introduction of new and more efficient technolo-gies (IPCC, 2007). The A1B scenario assumes a balanceacross all sources, which is defined as not relying tooheavily on one particular energy source, where the energysources are defined as not fossil-intensive and non-fossil.Currently, new emission scenarios (CMIP5 multi-modelensemble) (Hibbard et al., 2007; Meehl and Hibbard,2007; Meehl et al., 2009; WCRP, 2011; Taylor et al.,2012) are available. The focus of this study is exclusivelyon climate data from the CMIP3 model ensemble becauseit includes the full bandwidth of possible future climates.The complete CMIP5 model ensemble was unavailableat the time of the study and this would introduce a pos-sible bias in our results. Moreover, the new approachadopted for AR5 based on representative concentrationpathways (RCPs) is just a slight improvement from theSRES approach used for AR4. A systematic compari-son between CMIP3 and CMIP5 models and the SRESand RCP approaches would however definitely be rec-ommendable for a future study.
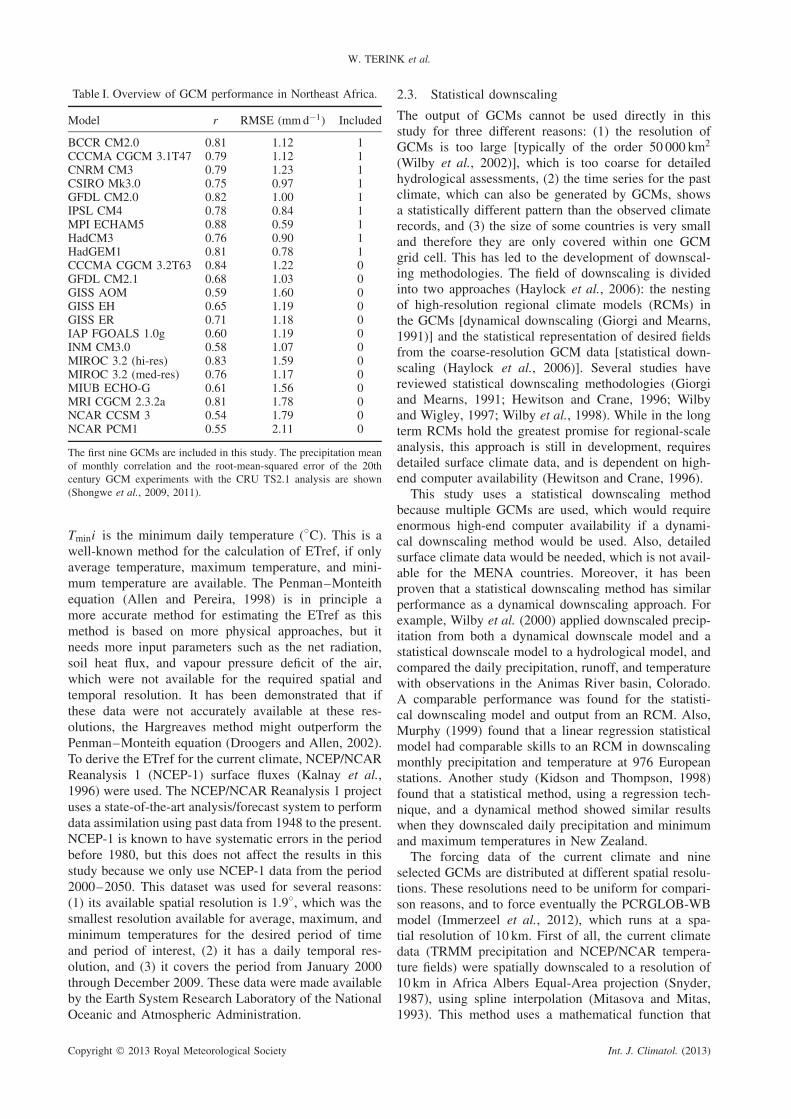
Instead of using only one GCM, which is done in manyother studies (e.g. Zwiers and Kharin, 1997; Giorgi andFrancisco, 2000b; Anyah and Semazzi, 2007; Hurkmanset al., 2010), this study uses forcing data of a current cli-mate and nine GCMs to evaluate climate change for eachof the 22 MENA countries. Shongwe et al. (2009, 2011)evaluated the performance of all IPCC GCMs in differ-ent regions of Africa by comparing their precipitationoutputs from 1960 to 1990 with the CRU TS2.1 dataset(New et al., 2000). CRU TS2.1 provides gridded valuesof observed monthly climate data. Results for NortheastAfrica are shown in Table I, and are based on the mean ofmonthly correlation and root-mean-squared error (RMSE)between the 20th century GCM experiments and the CRU
TS2.1 analysis. The best nine performing GCMs wereselected to be used in this study. The WCRP CMIP3multi-model database (http://esg.llnl.gov:8080/index.jsp)provided the monthly climate data of the nine selectedGCMs, available for 2000–2050. This database was onlyused to retrieve the transient monthly GCM tempera-ture data from 2000 to 2050. The IPCC Data Distri-bution Centre (http://www.ipcc-data.org/) provided themonthly precipitation anomalies between 1961–1990 and2046–2065. For precipitation these anomalies were usedbecause the statistical downscaling method differs as out-lined in Section 2.3..
For the current climate, the Tropical Rainfall Measur-ing Mission (TRMM, http://trmm.gsfc.nasa.gov/; Kum-merow et al., 2000) 3B42 daily product was used forprecipitation. TRMM is the only satellite with an activeprecipitation radar onboard and is available at a spatialresolution of 0.25 km (∼25 km), its spatial extend cov-ers the entire MENA region, and it covers the entire timespan from January 2000 through December 2009. TRMMdata were made available by the Goddard Earth SciencesData and Information Services Centre of NASA (NationalAeronautics and Space Administration).
The ETref of the current climate was calculated usingthe method of Hargreaves (Hargreaves and Samini, 1985;Droogers and Allen, 2002):
ETrefi = 0.0023 ×0.408 × Ra × (Tavgi + 17.8
)
× (Tmaxi − Tmini )0.5
where ETrefi is the reference evapotranspiration onday i , Ra is the extraterrestrial radiation expressed in(MJ m−2 d−1), Tavgi is the average daily temperature(◦C), Tmaxi is the maximum daily temperature (◦C), and
Copyright 2013 Royal Meteorological Society Int. J. Climatol. (2013)
W. TERINK et al.
Table I. Overview of GCM performance in Northeast Africa.
Model r RMSE (mm d−1) Included
BCCR CM2.0 0.81 1.12 1CCCMA CGCM 3.1T47 0.79 1.12 1CNRM CM3 0.79 1.23 1CSIRO Mk3.0 0.75 0.97 1GFDL CM2.0 0.82 1.00 1IPSL CM4 0.78 0.84 1MPI ECHAM5 0.88 0.59 1HadCM3 0.76 0.90 1HadGEM1 0.81 0.78 1CCCMA CGCM 3.2T63 0.84 1.22 0GFDL CM2.1 0.68 1.03 0GISS AOM 0.59 1.60 0GISS EH 0.65 1.19 0GISS ER 0.71 1.18 0IAP FGOALS 1.0g 0.60 1.19 0INM CM3.0 0.58 1.07 0MIROC 3.2 (hi-res) 0.83 1.59 0MIROC 3.2 (med-res) 0.76 1.17 0MIUB ECHO-G 0.61 1.56 0MRI CGCM 2.3.2a 0.81 1.78 0NCAR CCSM 3 0.54 1.79 0NCAR PCM1 0.55 2.11 0
The first nine GCMs are included in this study. The precipitation meanof monthly correlation and the root-mean-squared error of the 20thcentury GCM experiments with the CRU TS2.1 analysis are shown(Shongwe et al., 2009, 2011).
Tmini is the minimum daily temperature (◦C). This is awell-known method for the calculation of ETref, if onlyaverage temperature, maximum temperature, and mini-mum temperature are available. The Penman–Monteithequation (Allen and Pereira, 1998) is in principle amore accurate method for estimating the ETref as thismethod is based on more physical approaches, but itneeds more input parameters such as the net radiation,soil heat flux, and vapour pressure deficit of the air,which were not available for the required spatial andtemporal resolution. It has been demonstrated that ifthese data were not accurately available at these res-olutions, the Hargreaves method might outperform thePenman–Monteith equation (Droogers and Allen, 2002).To derive the ETref for the current climate, NCEP/NCARReanalysis 1 (NCEP-1) surface fluxes (Kalnay et al.,1996) were used. The NCEP/NCAR Reanalysis 1 projectuses a state-of-the-art analysis/forecast system to performdata assimilation using past data from 1948 to the present.NCEP-1 is known to have systematic errors in the periodbefore 1980, but this does not affect the results in thisstudy because we only use NCEP-1 data from the period2000–2050. This dataset was used for several reasons:(1) its available spatial resolution is 1.9◦, which was thesmallest resolution available for average, maximum, andminimum temperatures for the desired period of timeand period of interest, (2) it has a daily temporal res-olution, and (3) it covers the period from January 2000through December 2009. These data were made availableby the Earth System Research Laboratory of the NationalOceanic and Atmospheric Administration.
2.3. Statistical downscaling
The output of GCMs cannot be used directly in thisstudy for three different reasons: (1) the resolution ofGCMs is too large [typically of the order 50 000 km2
(Wilby et al., 2002)], which is too coarse for detailedhydrological assessments, (2) the time series for the pastclimate, which can also be generated by GCMs, showsa statistically different pattern than the observed climaterecords, and (3) the size of some countries is very smalland therefore they are only covered within one GCMgrid cell. This has led to the development of downscal-ing methodologies. The field of downscaling is dividedinto two approaches (Haylock et al., 2006): the nestingof high-resolution regional climate models (RCMs) inthe GCMs [dynamical downscaling (Giorgi and Mearns,1991)] and the statistical representation of desired fieldsfrom the coarse-resolution GCM data [statistical down-scaling (Haylock et al., 2006)]. Several studies havereviewed statistical downscaling methodologies (Giorgiand Mearns, 1991; Hewitson and Crane, 1996; Wilbyand Wigley, 1997; Wilby et al., 1998). While in the longterm RCMs hold the greatest promise for regional-scaleanalysis, this approach is still in development, requiresdetailed surface climate data, and is dependent on high-end computer availability (Hewitson and Crane, 1996).
This study uses a statistical downscaling methodbecause multiple GCMs are used, which would requireenormous high-end computer availability if a dynami-cal downscaling method would be used. Also, detailedsurface climate data would be needed, which is not avail-able for the MENA countries. Moreover, it has beenproven that a statistical downscaling method has similarperformance as a dynamical downscaling approach. Forexample, Wilby et al. (2000) applied downscaled precip-itation from both a dynamical downscale model and astatistical downscale model to a hydrological model, andcompared the daily precipitation, runoff, and temperaturewith observations in the Animas River basin, Colorado.A comparable performance was found for the statisti-cal downscaling model and output from an RCM. Also,Murphy (1999) found that a linear regression statisticalmodel had comparable skills to an RCM in downscalingmonthly precipitation and temperature at 976 Europeanstations. Another study (Kidson and Thompson, 1998)found that a statistical method, using a regression tech-nique, and a dynamical method showed similar resultswhen they downscaled daily precipitation and minimumand maximum temperatures in New Zealand.
The forcing data of the current climate and nineselected GCMs are distributed at different spatial resolu-tions. These resolutions need to be uniform for compari-son reasons, and to force eventually the PCRGLOB-WBmodel (Immerzeel et al., 2012), which runs at a spa-tial resolution of 10 km. First of all, the current climatedata (TRMM precipitation and NCEP/NCAR tempera-ture fields) were spatially downscaled to a resolution of10 km in Africa Albers Equal-Area projection (Snyder,1987), using spline interpolation (Mitasova and Mitas,1993). This method uses a mathematical function that
Copyright 2013 Royal Meteorological Society Int. J. Climatol. (2013)
CLIMATE CHANGE PROJECTIONS FOR THE MIDDLE EAST AND NORTHERN AFRICA
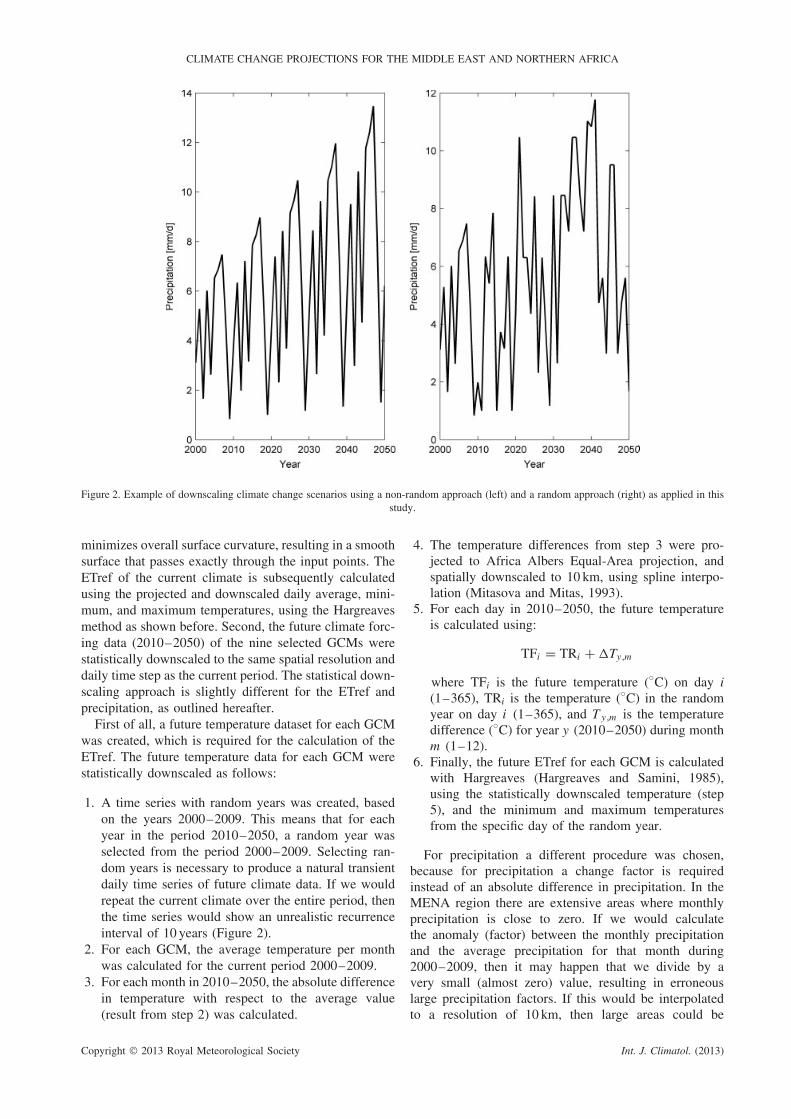
Figure 2. Example of downscaling climate change scenarios using a non-random approach (left) and a random approach (right) as applied in thisstudy.
minimizes overall surface curvature, resulting in a smoothsurface that passes exactly through the input points. TheETref of the current climate is subsequently calculatedusing the projected and downscaled daily average, mini-mum, and maximum temperatures, using the Hargreavesmethod as shown before. Second, the future climate forc-ing data (2010–2050) of the nine selected GCMs werestatistically downscaled to the same spatial resolution anddaily time step as the current period. The statistical down-scaling approach is slightly different for the ETref andprecipitation, as outlined hereafter.
First of all, a future temperature dataset for each GCMwas created, which is required for the calculation of theETref. The future temperature data for each GCM werestatistically downscaled as follows:
1. A time series with random years was created, basedon the years 2000–2009. This means that for eachyear in the period 2010–2050, a random year wasselected from the period 2000–2009. Selecting ran-dom years is necessary to produce a natural transientdaily time series of future climate data. If we wouldrepeat the current climate over the entire period, thenthe time series would show an unrealistic recurrenceinterval of 10 years (Figure 2).
2. For each GCM, the average temperature per monthwas calculated for the current period 2000–2009.
3. For each month in 2010–2050, the absolute differencein temperature with respect to the average value(result from step 2) was calculated.
4. The temperature differences from step 3 were pro-jected to Africa Albers Equal-Area projection, andspatially downscaled to 10 km, using spline interpo-lation (Mitasova and Mitas, 1993).
5. For each day in 2010–2050, the future temperatureis calculated using:
TFi = TRi + �Ty ,m
where TFi is the future temperature (◦C) on day i(1–365), TRi is the temperature (◦C) in the randomyear on day i (1–365), and T y ,m is the temperaturedifference (◦C) for year y (2010–2050) during monthm (1–12).
6. Finally, the future ETref for each GCM is calculatedwith Hargreaves (Hargreaves and Samini, 1985),using the statistically downscaled temperature (step5), and the minimum and maximum temperaturesfrom the specific day of the random year.
For precipitation a different procedure was chosen,because for precipitation a change factor is requiredinstead of an absolute difference in precipitation. In theMENA region there are extensive areas where monthlyprecipitation is close to zero. If we would calculatethe anomaly (factor) between the monthly precipitationand the average precipitation for that month during2000–2009, then it may happen that we divide by avery small (almost zero) value, resulting in erroneouslarge precipitation factors. If this would be interpolatedto a resolution of 10 km, then large areas could be
Copyright 2013 Royal Meteorological Society Int. J. Climatol. (2013)
W. TERINK et al.
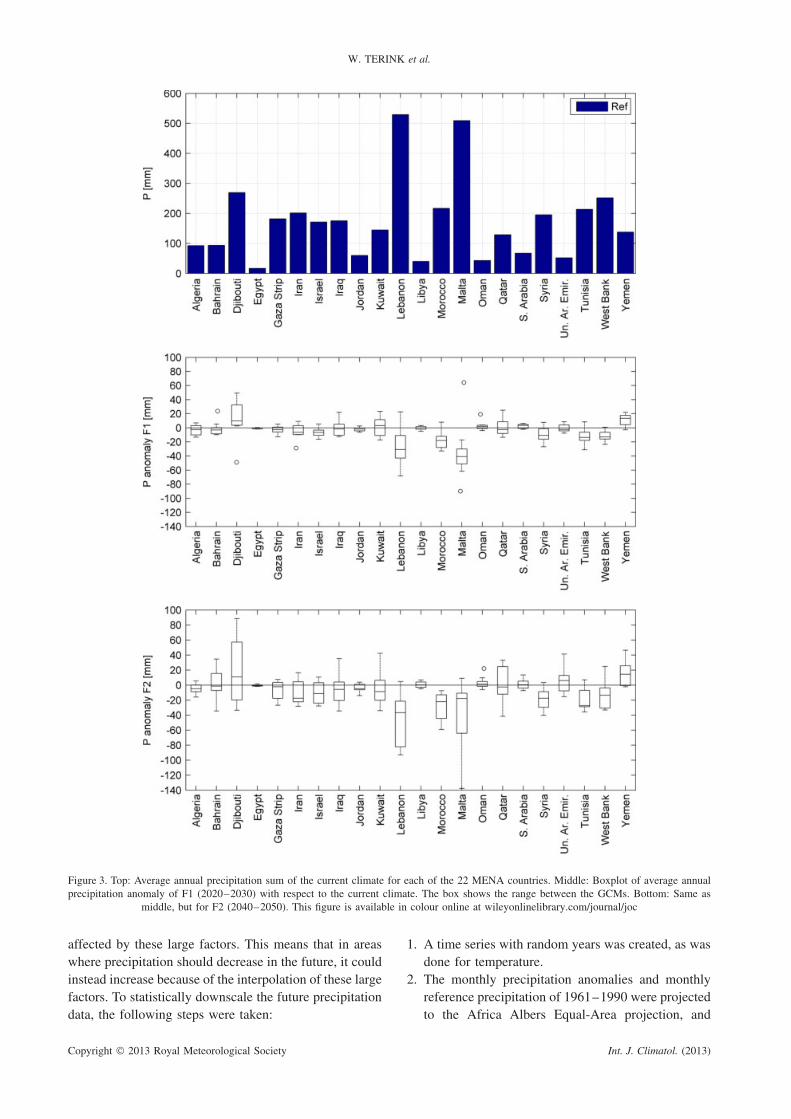
Figure 3. Top: Average annual precipitation sum of the current climate for each of the 22 MENA countries. Middle: Boxplot of average annualprecipitation anomaly of F1 (2020–2030) with respect to the current climate. The box shows the range between the GCMs. Bottom: Same as
middle, but for F2 (2040–2050). This figure is available in colour online at wileyonlinelibrary.com/journal/joc
affected by these large factors. This means that in areaswhere precipitation should decrease in the future, it couldinstead increase because of the interpolation of these largefactors. To statistically downscale the future precipitationdata, the following steps were taken:
1. A time series with random years was created, as wasdone for temperature.
2. The monthly precipitation anomalies and monthlyreference precipitation of 1961–1990 were projectedto the Africa Albers Equal-Area projection, and
Copyright 2013 Royal Meteorological Society Int. J. Climatol. (2013)
CLIMATE CHANGE PROJECTIONS FOR THE MIDDLE EAST AND NORTHERN AFRICA
spatially downscaled to 10 km, using spline inter-polation.
3. Consecutively, for each month (1–12), a correctionfactor for that month was calculated by dividingthe anomalies by the reference precipitation for thatmonth. This factor, however, is representative forthe anomaly from 1961–1990 to 2046–2065, whichis a period of approximately 80 years in length. Anannual correction factor was determined assumingthat the change for precipitation occurs linearly intime.
4. Finally, the future precipitation for each GCM iscalculated using:
PFi = PRi + (PRi × (y − 2009) × Pfacm)
where PFi is the future precipitation (mm) on day i(1–365), PRi is the precipitation in a random year onday i (1–365), y is a future year (2010–2050), andPfacm is the precipitation factor in month m (1–12).
3. Results
3.1. Average annual precipitation
The annual change in precipitation for each of the 22MENA countries has been analysed in Figure 3. Figure 3(top) shows the average annual precipitation sum for thecurrent climate (2000–2009) for each of the 22 MENAcountries. The middle of Figure 3 shows the anoma-lies of F1 (2020–2030), whereas the anomalies of F2(2040–2050) are shown in the bottom of Figure 3. Theanomalies in these boxplots show the range between theGCMs. On the basis of these results, it is clear that mostcountries will experience a decrease in precipitation forF1 and F2, with the largest decreases found for F2. Somecountries, however, e.g. Yemen and Djibouti, are pro-jected to have an increase in annual presentation. Yemenappears to receive 15 mm (11%) more precipitation for F1and F2, and Djibouti 10 mm (4%) more precipitation forboth F1 and F2. This is a very positive development forYemen because the country is already low on precipita-tion (140 mm annual). Countries with the largest decreasein precipitation are Lebanon, Morocco, and Malta. Con-sidering the median of GCMs, this decrease is for F130 mm (6%) for Lebanon, 18 mm (8%) for Morocco, and40 mm (8%) for Malta. Decreases for F2 are in the orderof 38 mm (7%) for Lebanon, 20 mm (9%) for Morocco,and 20 mm (4%) for Malta. Climate predictions for thefar future are more uncertain than climate predictionsfor the near future. This uncertainty is reflected in therange between the GCMs, which is larger for F2 than forF1. If we consider the 25th percentile of GCMs of F2,then we notice a decrease of 45 mm (20%) for Morocco,80 mm (16%) for Lebanon, and 65 mm (13%) for Malta.Morocco will become very vulnerable to climate changein the future, because currently Morocco already has alow annual precipitation sum, which will become evensmaller based on these projections. Also, Algeria has a
low annual precipitation sum (90 mm) for the current cli-mate. With a decrease of 10 mm (11%) for both F1 andF2, Algeria is also vulnerable to climate change. It isinteresting that for some countries, the range in GCM pre-dictions is relatively small, e.g. for Egypt, Jordan, Libya,and Oman. This means that the uncertainty in climatepredictions is considerably smaller for these countries.Egypt, being the country with the smallest annual precipi-tation sum, can expect hardly any change in precipitation.Besides this, Egypt is also fed by the river Nile, meaningthat this country is less depending on precipitation withinthe country.
3.2. Average annual ETref
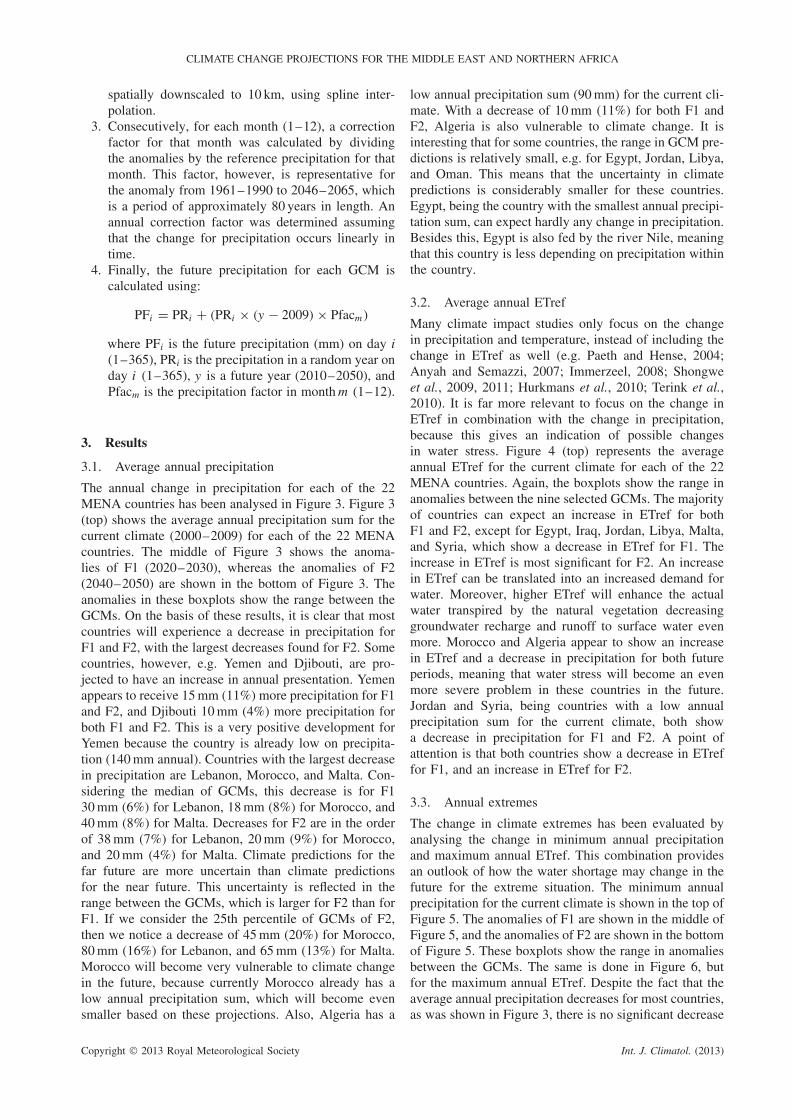
Many climate impact studies only focus on the changein precipitation and temperature, instead of including thechange in ETref as well (e.g. Paeth and Hense, 2004;Anyah and Semazzi, 2007; Immerzeel, 2008; Shongweet al., 2009, 2011; Hurkmans et al., 2010; Terink et al.,2010). It is far more relevant to focus on the change inETref in combination with the change in precipitation,because this gives an indication of possible changesin water stress. Figure 4 (top) represents the averageannual ETref for the current climate for each of the 22MENA countries. Again, the boxplots show the range inanomalies between the nine selected GCMs. The majorityof countries can expect an increase in ETref for bothF1 and F2, except for Egypt, Iraq, Jordan, Libya, Malta,and Syria, which show a decrease in ETref for F1. Theincrease in ETref is most significant for F2. An increasein ETref can be translated into an increased demand forwater. Moreover, higher ETref will enhance the actualwater transpired by the natural vegetation decreasinggroundwater recharge and runoff to surface water evenmore. Morocco and Algeria appear to show an increasein ETref and a decrease in precipitation for both futureperiods, meaning that water stress will become an evenmore severe problem in these countries in the future.Jordan and Syria, being countries with a low annualprecipitation sum for the current climate, both showa decrease in precipitation for F1 and F2. A point ofattention is that both countries show a decrease in ETreffor F1, and an increase in ETref for F2.
3.3. Annual extremes
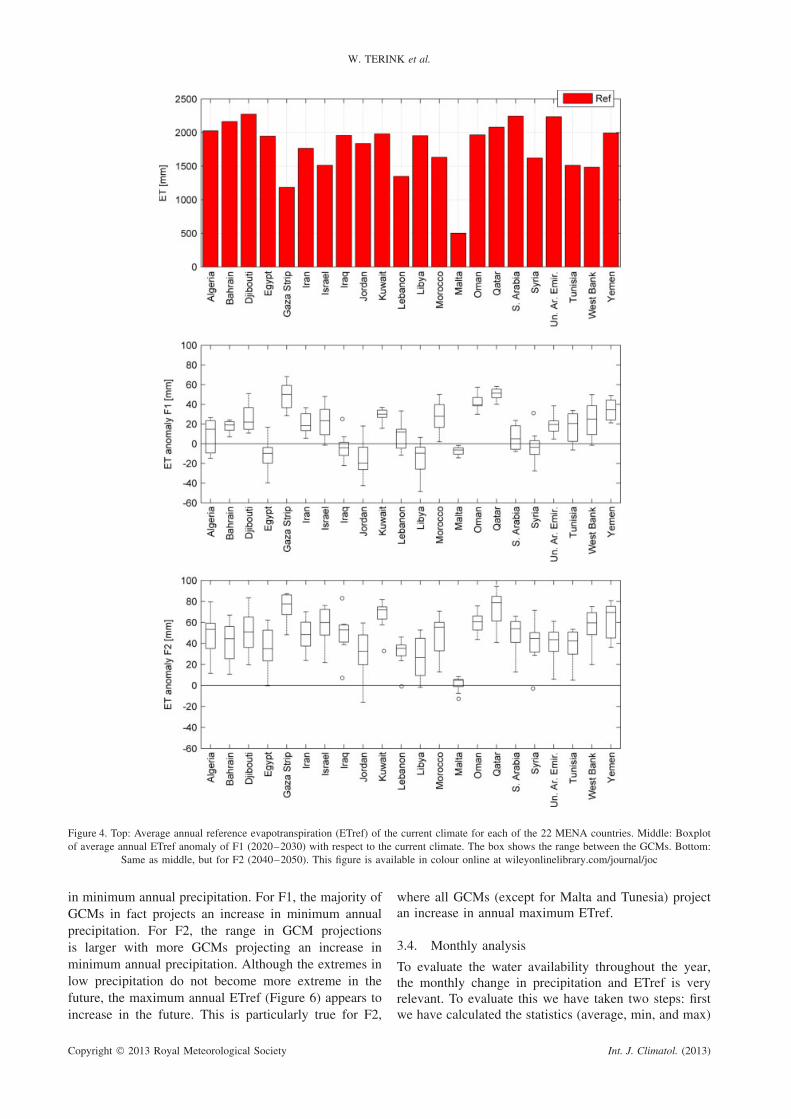
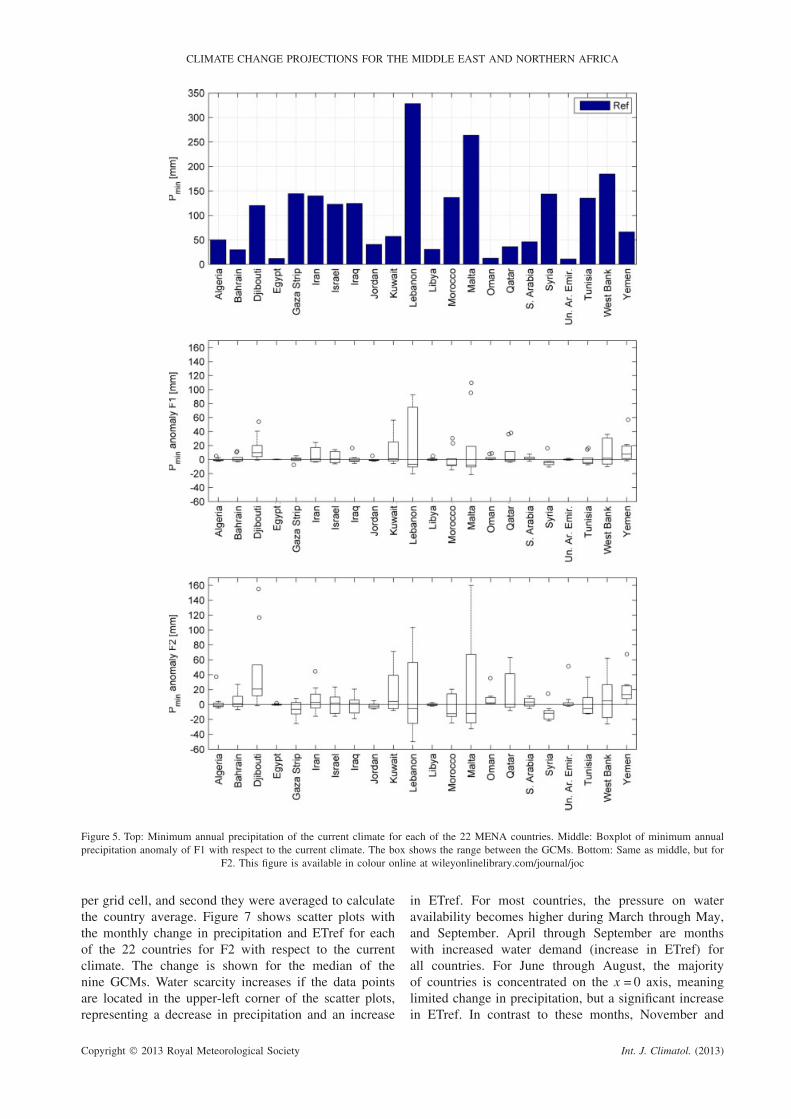
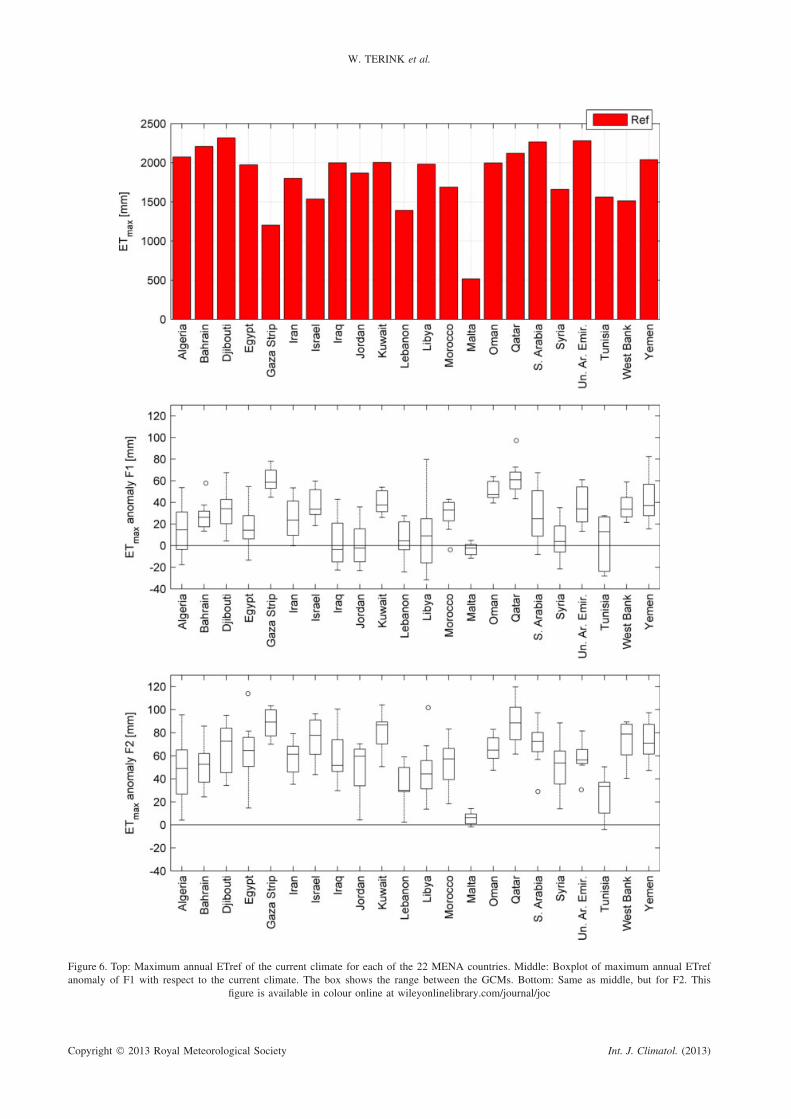
The change in climate extremes has been evaluated byanalysing the change in minimum annual precipitationand maximum annual ETref. This combination providesan outlook of how the water shortage may change in thefuture for the extreme situation. The minimum annualprecipitation for the current climate is shown in the top ofFigure 5. The anomalies of F1 are shown in the middle ofFigure 5, and the anomalies of F2 are shown in the bottomof Figure 5. These boxplots show the range in anomaliesbetween the GCMs. The same is done in Figure 6, butfor the maximum annual ETref. Despite the fact that theaverage annual precipitation decreases for most countries,as was shown in Figure 3, there is no significant decrease
Copyright 2013 Royal Meteorological Society Int. J. Climatol. (2013)
W. TERINK et al.
Figure 4. Top: Average annual reference evapotranspiration (ETref) of the current climate for each of the 22 MENA countries. Middle: Boxplotof average annual ETref anomaly of F1 (2020–2030) with respect to the current climate. The box shows the range between the GCMs. Bottom:
Same as middle, but for F2 (2040–2050). This figure is available in colour online at wileyonlinelibrary.com/journal/joc
in minimum annual precipitation. For F1, the majority ofGCMs in fact projects an increase in minimum annualprecipitation. For F2, the range in GCM projectionsis larger with more GCMs projecting an increase inminimum annual precipitation. Although the extremes inlow precipitation do not become more extreme in thefuture, the maximum annual ETref (Figure 6) appears toincrease in the future. This is particularly true for F2,
where all GCMs (except for Malta and Tunesia) projectan increase in annual maximum ETref.
3.4. Monthly analysis
To evaluate the water availability throughout the year,the monthly change in precipitation and ETref is veryrelevant. To evaluate this we have taken two steps: firstwe have calculated the statistics (average, min, and max)
Copyright 2013 Royal Meteorological Society Int. J. Climatol. (2013)
CLIMATE CHANGE PROJECTIONS FOR THE MIDDLE EAST AND NORTHERN AFRICA
Figure 5. Top: Minimum annual precipitation of the current climate for each of the 22 MENA countries. Middle: Boxplot of minimum annualprecipitation anomaly of F1 with respect to the current climate. The box shows the range between the GCMs. Bottom: Same as middle, but for
F2. This figure is available in colour online at wileyonlinelibrary.com/journal/joc
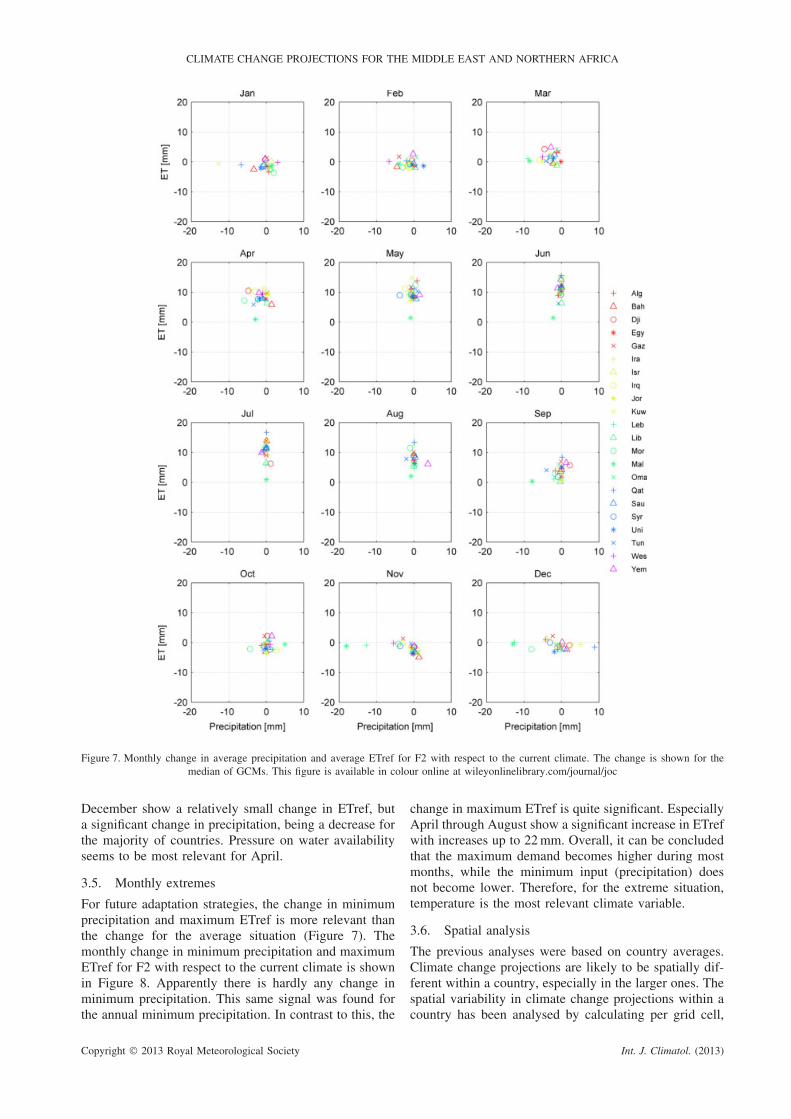
per grid cell, and second they were averaged to calculatethe country average. Figure 7 shows scatter plots withthe monthly change in precipitation and ETref for eachof the 22 countries for F2 with respect to the currentclimate. The change is shown for the median of thenine GCMs. Water scarcity increases if the data pointsare located in the upper-left corner of the scatter plots,representing a decrease in precipitation and an increase
in ETref. For most countries, the pressure on wateravailability becomes higher during March through May,and September. April through September are monthswith increased water demand (increase in ETref) forall countries. For June through August, the majorityof countries is concentrated on the x = 0 axis, meaninglimited change in precipitation, but a significant increasein ETref. In contrast to these months, November and
Copyright 2013 Royal Meteorological Society Int. J. Climatol. (2013)
W. TERINK et al.
Figure 6. Top: Maximum annual ETref of the current climate for each of the 22 MENA countries. Middle: Boxplot of maximum annual ETrefanomaly of F1 with respect to the current climate. The box shows the range between the GCMs. Bottom: Same as middle, but for F2. This
figure is available in colour online at wileyonlinelibrary.com/journal/joc
Copyright 2013 Royal Meteorological Society Int. J. Climatol. (2013)
CLIMATE CHANGE PROJECTIONS FOR THE MIDDLE EAST AND NORTHERN AFRICA
Figure 7. Monthly change in average precipitation and average ETref for F2 with respect to the current climate. The change is shown for themedian of GCMs. This figure is available in colour online at wileyonlinelibrary.com/journal/joc
December show a relatively small change in ETref, buta significant change in precipitation, being a decrease forthe majority of countries. Pressure on water availabilityseems to be most relevant for April.
3.5. Monthly extremes
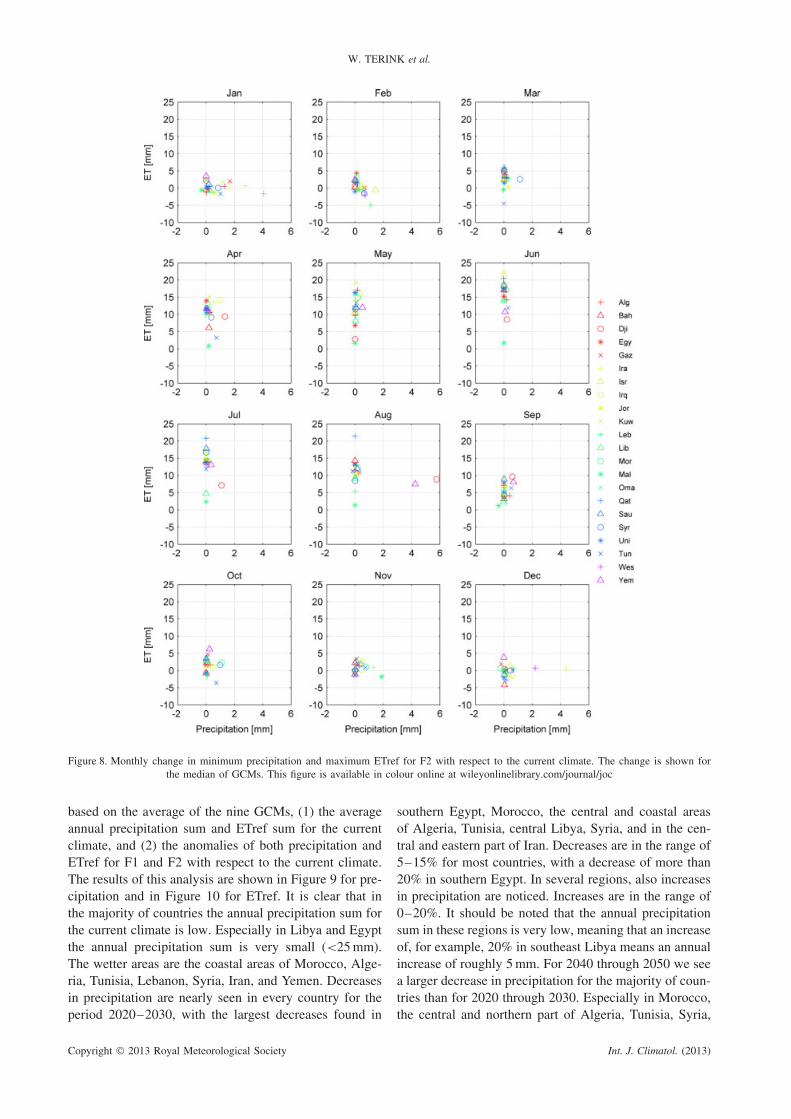
For future adaptation strategies, the change in minimumprecipitation and maximum ETref is more relevant thanthe change for the average situation (Figure 7). Themonthly change in minimum precipitation and maximumETref for F2 with respect to the current climate is shownin Figure 8. Apparently there is hardly any change inminimum precipitation. This same signal was found forthe annual minimum precipitation. In contrast to this, the
change in maximum ETref is quite significant. EspeciallyApril through August show a significant increase in ETrefwith increases up to 22 mm. Overall, it can be concludedthat the maximum demand becomes higher during mostmonths, while the minimum input (precipitation) doesnot become lower. Therefore, for the extreme situation,temperature is the most relevant climate variable.
3.6. Spatial analysis
The previous analyses were based on country averages.Climate change projections are likely to be spatially dif-ferent within a country, especially in the larger ones. Thespatial variability in climate change projections within acountry has been analysed by calculating per grid cell,
Copyright 2013 Royal Meteorological Society Int. J. Climatol. (2013)
W. TERINK et al.
Figure 8. Monthly change in minimum precipitation and maximum ETref for F2 with respect to the current climate. The change is shown forthe median of GCMs. This figure is available in colour online at wileyonlinelibrary.com/journal/joc
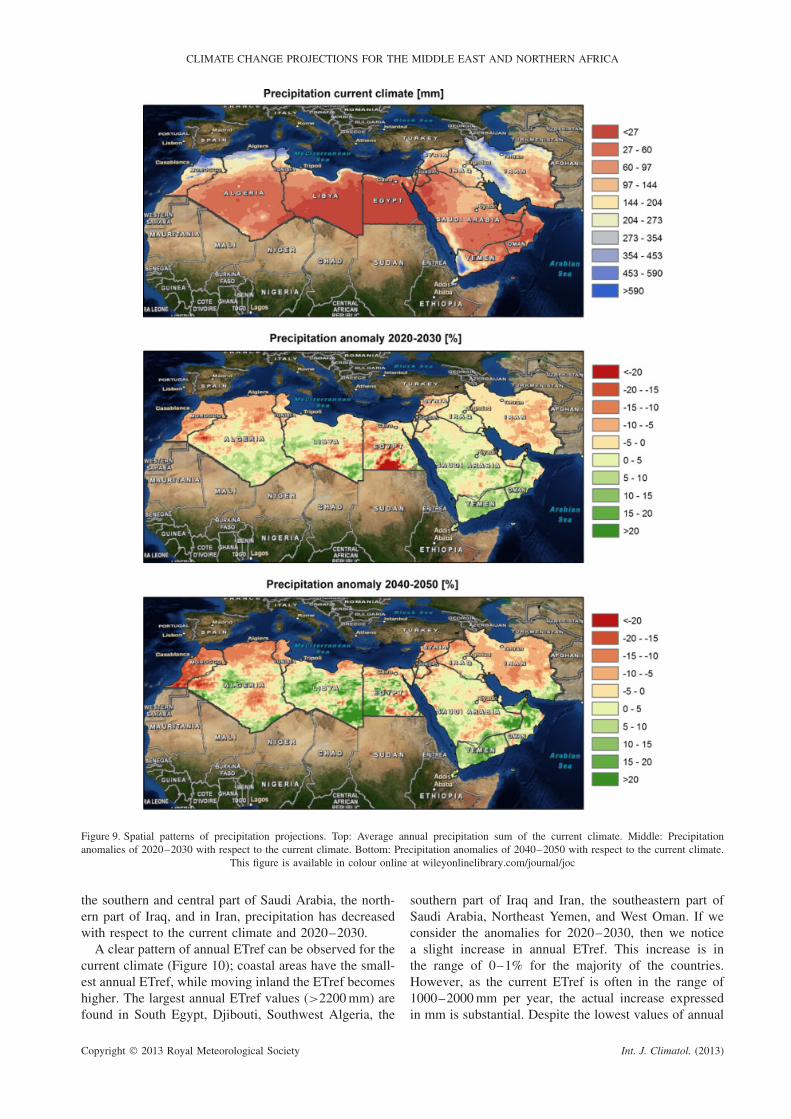
based on the average of the nine GCMs, (1) the averageannual precipitation sum and ETref sum for the currentclimate, and (2) the anomalies of both precipitation andETref for F1 and F2 with respect to the current climate.The results of this analysis are shown in Figure 9 for pre-cipitation and in Figure 10 for ETref. It is clear that inthe majority of countries the annual precipitation sum forthe current climate is low. Especially in Libya and Egyptthe annual precipitation sum is very small (<25 mm).The wetter areas are the coastal areas of Morocco, Alge-ria, Tunisia, Lebanon, Syria, Iran, and Yemen. Decreasesin precipitation are nearly seen in every country for theperiod 2020–2030, with the largest decreases found in
southern Egypt, Morocco, the central and coastal areasof Algeria, Tunisia, central Libya, Syria, and in the cen-tral and eastern part of Iran. Decreases are in the range of5–15% for most countries, with a decrease of more than20% in southern Egypt. In several regions, also increasesin precipitation are noticed. Increases are in the range of0–20%. It should be noted that the annual precipitationsum in these regions is very low, meaning that an increaseof, for example, 20% in southeast Libya means an annualincrease of roughly 5 mm. For 2040 through 2050 we seea larger decrease in precipitation for the majority of coun-tries than for 2020 through 2030. Especially in Morocco,the central and northern part of Algeria, Tunisia, Syria,
Copyright 2013 Royal Meteorological Society Int. J. Climatol. (2013)
CLIMATE CHANGE PROJECTIONS FOR THE MIDDLE EAST AND NORTHERN AFRICA
Figure 9. Spatial patterns of precipitation projections. Top: Average annual precipitation sum of the current climate. Middle: Precipitationanomalies of 2020–2030 with respect to the current climate. Bottom: Precipitation anomalies of 2040–2050 with respect to the current climate.
This figure is available in colour online at wileyonlinelibrary.com/journal/joc
the southern and central part of Saudi Arabia, the north-ern part of Iraq, and in Iran, precipitation has decreasedwith respect to the current climate and 2020–2030.
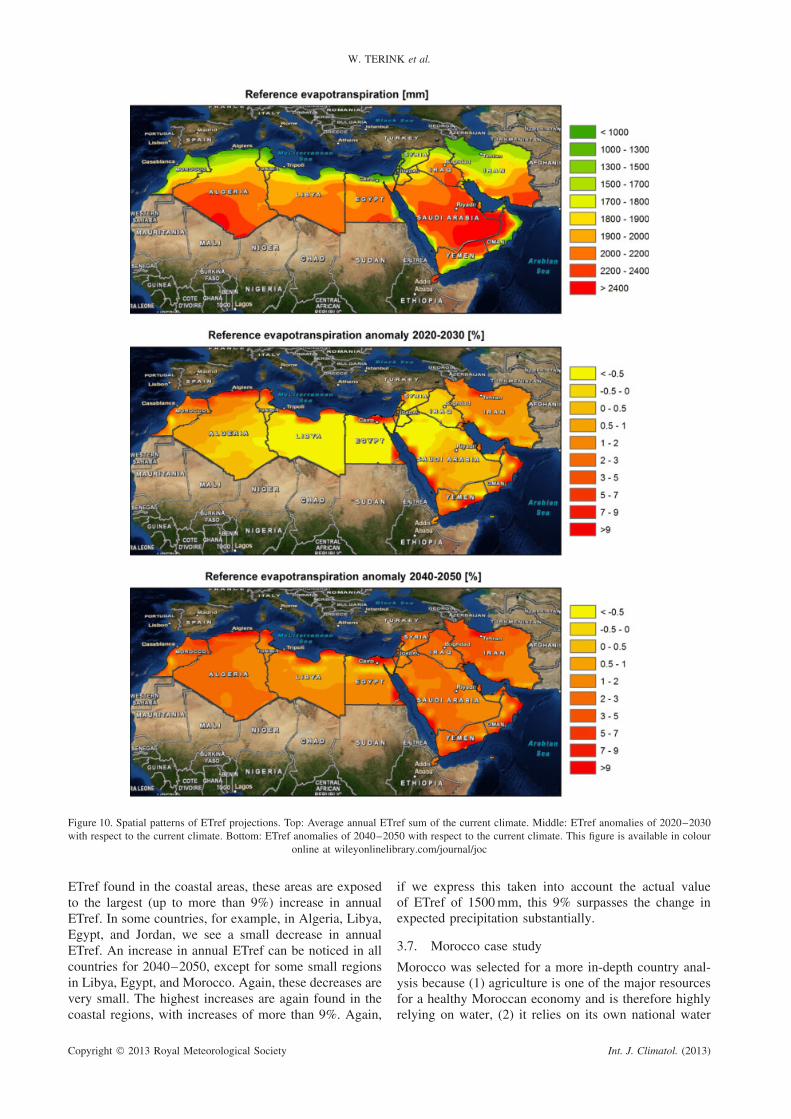
A clear pattern of annual ETref can be observed for thecurrent climate (Figure 10); coastal areas have the small-est annual ETref, while moving inland the ETref becomeshigher. The largest annual ETref values (>2200 mm) arefound in South Egypt, Djibouti, Southwest Algeria, the
southern part of Iraq and Iran, the southeastern part ofSaudi Arabia, Northeast Yemen, and West Oman. If weconsider the anomalies for 2020–2030, then we noticea slight increase in annual ETref. This increase is inthe range of 0–1% for the majority of the countries.However, as the current ETref is often in the range of1000–2000 mm per year, the actual increase expressedin mm is substantial. Despite the lowest values of annual
Copyright 2013 Royal Meteorological Society Int. J. Climatol. (2013)
W. TERINK et al.
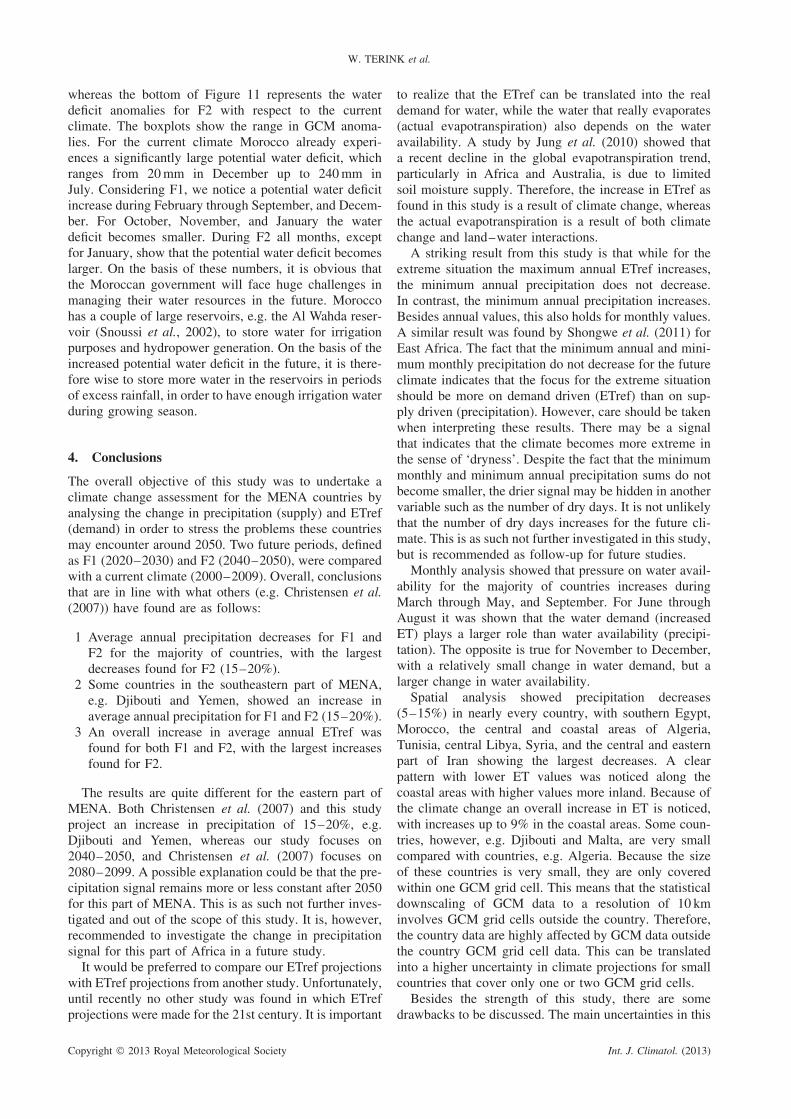
Figure 10. Spatial patterns of ETref projections. Top: Average annual ETref sum of the current climate. Middle: ETref anomalies of 2020–2030with respect to the current climate. Bottom: ETref anomalies of 2040–2050 with respect to the current climate. This figure is available in colour
online at wileyonlinelibrary.com/journal/joc
ETref found in the coastal areas, these areas are exposedto the largest (up to more than 9%) increase in annualETref. In some countries, for example, in Algeria, Libya,Egypt, and Jordan, we see a small decrease in annualETref. An increase in annual ETref can be noticed in allcountries for 2040–2050, except for some small regionsin Libya, Egypt, and Morocco. Again, these decreases arevery small. The highest increases are again found in thecoastal regions, with increases of more than 9%. Again,
if we express this taken into account the actual valueof ETref of 1500 mm, this 9% surpasses the change inexpected precipitation substantially.
3.7. Morocco case study
Morocco was selected for a more in-depth country anal-ysis because (1) agriculture is one of the major resourcesfor a healthy Moroccan economy and is therefore highlyrelying on water, (2) it relies on its own national water
Copyright 2013 Royal Meteorological Society Int. J. Climatol. (2013)
CLIMATE CHANGE PROJECTIONS FOR THE MIDDLE EAST AND NORTHERN AFRICA
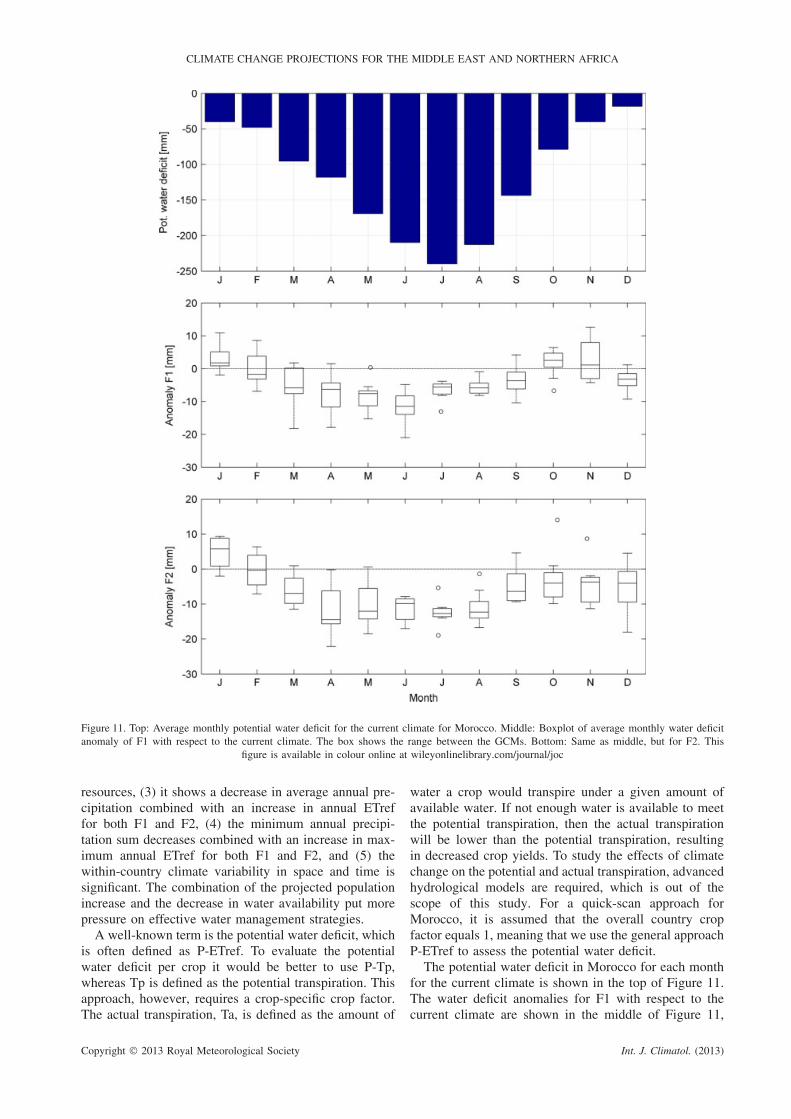
Figure 11. Top: Average monthly potential water deficit for the current climate for Morocco. Middle: Boxplot of average monthly water deficitanomaly of F1 with respect to the current climate. The box shows the range between the GCMs. Bottom: Same as middle, but for F2. This
figure is available in colour online at wileyonlinelibrary.com/journal/joc
resources, (3) it shows a decrease in average annual pre-cipitation combined with an increase in annual ETreffor both F1 and F2, (4) the minimum annual precipi-tation sum decreases combined with an increase in max-imum annual ETref for both F1 and F2, and (5) thewithin-country climate variability in space and time issignificant. The combination of the projected populationincrease and the decrease in water availability put morepressure on effective water management strategies.
A well-known term is the potential water deficit, whichis often defined as P-ETref. To evaluate the potentialwater deficit per crop it would be better to use P-Tp,whereas Tp is defined as the potential transpiration. Thisapproach, however, requires a crop-specific crop factor.The actual transpiration, Ta, is defined as the amount of
water a crop would transpire under a given amount ofavailable water. If not enough water is available to meetthe potential transpiration, then the actual transpirationwill be lower than the potential transpiration, resultingin decreased crop yields. To study the effects of climatechange on the potential and actual transpiration, advancedhydrological models are required, which is out of thescope of this study. For a quick-scan approach forMorocco, it is assumed that the overall country cropfactor equals 1, meaning that we use the general approachP-ETref to assess the potential water deficit.
The potential water deficit in Morocco for each monthfor the current climate is shown in the top of Figure 11.The water deficit anomalies for F1 with respect to thecurrent climate are shown in the middle of Figure 11,
Copyright 2013 Royal Meteorological Society Int. J. Climatol. (2013)
W. TERINK et al.
whereas the bottom of Figure 11 represents the waterdeficit anomalies for F2 with respect to the currentclimate. The boxplots show the range in GCM anoma-lies. For the current climate Morocco already experi-ences a significantly large potential water deficit, whichranges from 20 mm in December up to 240 mm inJuly. Considering F1, we notice a potential water deficitincrease during February through September, and Decem-ber. For October, November, and January the waterdeficit becomes smaller. During F2 all months, exceptfor January, show that the potential water deficit becomeslarger. On the basis of these numbers, it is obvious thatthe Moroccan government will face huge challenges inmanaging their water resources in the future. Moroccohas a couple of large reservoirs, e.g. the Al Wahda reser-voir (Snoussi et al., 2002), to store water for irrigationpurposes and hydropower generation. On the basis of theincreased potential water deficit in the future, it is there-fore wise to store more water in the reservoirs in periodsof excess rainfall, in order to have enough irrigation waterduring growing season.
4. Conclusions
The overall objective of this study was to undertake aclimate change assessment for the MENA countries byanalysing the change in precipitation (supply) and ETref(demand) in order to stress the problems these countriesmay encounter around 2050. Two future periods, definedas F1 (2020–2030) and F2 (2040–2050), were comparedwith a current climate (2000–2009). Overall, conclusionsthat are in line with what others (e.g. Christensen et al.(2007)) have found are as follows:
1 Average annual precipitation decreases for F1 andF2 for the majority of countries, with the largestdecreases found for F2 (15–20%).
2 Some countries in the southeastern part of MENA,e.g. Djibouti and Yemen, showed an increase inaverage annual precipitation for F1 and F2 (15–20%).
3 An overall increase in average annual ETref wasfound for both F1 and F2, with the largest increasesfound for F2.
The results are quite different for the eastern part ofMENA. Both Christensen et al. (2007) and this studyproject an increase in precipitation of 15–20%, e.g.Djibouti and Yemen, whereas our study focuses on2040–2050, and Christensen et al. (2007) focuses on2080–2099. A possible explanation could be that the pre-cipitation signal remains more or less constant after 2050for this part of MENA. This is as such not further inves-tigated and out of the scope of this study. It is, however,recommended to investigate the change in precipitationsignal for this part of Africa in a future study.
It would be preferred to compare our ETref projectionswith ETref projections from another study. Unfortunately,until recently no other study was found in which ETrefprojections were made for the 21st century. It is important
to realize that the ETref can be translated into the realdemand for water, while the water that really evaporates(actual evapotranspiration) also depends on the wateravailability. A study by Jung et al. (2010) showed thata recent decline in the global evapotranspiration trend,particularly in Africa and Australia, is due to limitedsoil moisture supply. Therefore, the increase in ETref asfound in this study is a result of climate change, whereasthe actual evapotranspiration is a result of both climatechange and land–water interactions.
A striking result from this study is that while for theextreme situation the maximum annual ETref increases,the minimum annual precipitation does not decrease.In contrast, the minimum annual precipitation increases.Besides annual values, this also holds for monthly values.A similar result was found by Shongwe et al. (2011) forEast Africa. The fact that the minimum annual and mini-mum monthly precipitation do not decrease for the futureclimate indicates that the focus for the extreme situationshould be more on demand driven (ETref) than on sup-ply driven (precipitation). However, care should be takenwhen interpreting these results. There may be a signalthat indicates that the climate becomes more extreme inthe sense of ‘dryness’. Despite the fact that the minimummonthly and minimum annual precipitation sums do notbecome smaller, the drier signal may be hidden in anothervariable such as the number of dry days. It is not unlikelythat the number of dry days increases for the future cli-mate. This is as such not further investigated in this study,but is recommended as follow-up for future studies.
Monthly analysis showed that pressure on water avail-ability for the majority of countries increases duringMarch through May, and September. For June throughAugust it was shown that the water demand (increasedET) plays a larger role than water availability (precipi-tation). The opposite is true for November to December,with a relatively small change in water demand, but alarger change in water availability.
Spatial analysis showed precipitation decreases(5–15%) in nearly every country, with southern Egypt,Morocco, the central and coastal areas of Algeria,Tunisia, central Libya, Syria, and the central and easternpart of Iran showing the largest decreases. A clearpattern with lower ET values was noticed along thecoastal areas with higher values more inland. Because ofthe climate change an overall increase in ET is noticed,with increases up to 9% in the coastal areas. Some coun-tries, however, e.g. Djibouti and Malta, are very smallcompared with countries, e.g. Algeria. Because the sizeof these countries is very small, they are only coveredwithin one GCM grid cell. This means that the statisticaldownscaling of GCM data to a resolution of 10 kminvolves GCM grid cells outside the country. Therefore,the country data are highly affected by GCM data outsidethe country GCM grid cell data. This can be translatedinto a higher uncertainty in climate projections for smallcountries that cover only one or two GCM grid cells.
Besides the strength of this study, there are somedrawbacks to be discussed. The main uncertainties in this
Copyright 2013 Royal Meteorological Society Int. J. Climatol. (2013)
CLIMATE CHANGE PROJECTIONS FOR THE MIDDLE EAST AND NORTHERN AFRICA
climate impact study, among other climate studies, arethe GCMs used in climate studies. A major issue withGCMs is that vegetation feedbacks and feedbacks fromdust aerosol production are not included in the globalmodels (Hulme et al., 2001; Christensen et al., 2007).Also, possible future land surface modifications are nottaken into account in GCM projections. This incorporatesa certain amount of error in the GCM projections, whichwill further accumulate when downscaling to a smallerresolution. Therefore, an interesting follow-up would beto evaluate the impacts of land use change in combinationwith climate change on water availability in MENA inthe future. This would also involve improving GCMs bythe implementation of vegetation feedbacks.
This study uses climate data of the CMIP3 multi-modelensemble. Currently, new emission scenarios (CMIP5multi-model ensemble) (Hibbard et al., 2007; Meehl andHibbard, 2007; Meehl et al., 2009; WCRP, 2011; Tayloret al., 2012) are available. These scenarios are not used inthis study, because the focus of this study is exclusivelyon climate data from the CMIP3 model ensemble becauseit includes the full bandwidth of possible future climates.Moreover, the complete CMIP5 model ensemble wasunavailable at the time of the study and this wouldintroduce a possible bias in our results. Finally, thenew approach adopted for AR5 based on RCPs is justa slight improvement from the SRES approach usedfor AR4. A systematic comparison between CMIP3 andCMIP5 models and the SRES and RCP approaches wouldhowever definitely be recommendable for a future study.
It is well known that the change in surface variablescan be related to the behaviour of large-scale circulations,e.g. ENSO (El Nino – Southern Oscillation) (Palmeret al., 1992; Ward, 1992; Fontaine et al., 1995, 1998;Janicot et al., 1998; Neelin et al., 1998) and the AfricanEasterly Jet (Parker et al., 2005, 2008; Redelspergeret al., 2006; Dezfuli and Nicholson, 2010). Accordingto Yeshanew and Jury (2007), the Sahelian climate ofNorthern Africa is characterized by a decadal rhythm,whereas the mountainous eastern and equatorial regionsof Africa exhibit interannual cycles. Yeshanew and Jury(2007) also found that ENSO-modulated zonal circula-tions over the Atlantic Pacific sector are important fordecadal variations, and that they create a climatic polar-ity between South America and tropical North Africa. Itis likely that climate change will have repercussions onlarge-scale circulation patterns, which may consequentlyinfluence Africa’s climate. This assessment is far beyondthe scope of this study, but it is recommended to focusfuture research on this topic.
For policy makers it is relevant to know how muchwater is available currently and in the future, and whatadaption strategies are available at what cost to overcomethe possible projected water shortage. Therefore, twobeneficial studies are required:
• A study that addresses water availability using ahydrological model (Immerzeel et al., 2012); thisinvolves relevant hydrological processes, e.g. inflow
from upstream basins, reservoir storage, irrigationwater supply, and routing of streamflow, which arenot incorporated in this study.
• A study that evaluates adaption strategies and theirimplementation costs in order to overcome possiblewater shortages in the future (Droogers et al., 2012).
References
Allen R, Pereira L. 1998. Crop evapotranspiration. Guidelines forcomputing crop water requirements. FAO Irrigation and DrainagePaper 56.
Anyah R, Semazzi F. 2007. Variability of East African rainfallbased on multiyear RegCM3 simulations. International Journal ofClimatology 27: 357–371. DOI: 10.1002/joc.1401.
Arnell N, Hudson D, Jones R. 2003. Climate change scenariosfrom a regional climate model: estimating change in runoff insouthern Africa. Journal of Geophysical Research 108: 4519. DOI:10.1029/2002JD002782.
Christensen J, Hewitson B, Busuioc A, Chen A, Gao X, Held I, JonesR, Kolli R, Kwon WT, Laprise R, Rueda VM, Mearns L, MenendezC, Raisanen J, Rinke A, Sarr A, Whetton P. 2007. Regional ClimateProjections. In Climate Change 2007: The Physical Science Basis.Contribution of Working Group I to the Fourth Assessment Reportof the Intergovernmental Panel on Climate Change, Solomon S, QinD, Manning M, Chen Z, Marquis M, Averyt KB, Tignor M, MillerHL (eds). Cambridge University Press: Cambridge, United Kingdomand New York, NY.
Dezfuli AK, Nicholson SE. 2010. A note on long-term variations ofthe African easterly jet. International Journal of Climatology 31(13):2049–2054. DOI: 10.1002/joc.2209.
Droogers P, Allen R. 2002. Estimating reference evapotranspirationunder inaccurate data conditions. Irrigation and Drainage Systems16(1): 33–45. DOI: 10.1023/A:1015508322413.
Droogers P, Immerzeel WW, Terink W, Hoogeveen J, Bierkens M, vanBeek R, Debele B. 2012. Water resources trends in Middle East andNorth Africa towards 2050. Hydrology and Earth System Sciences16: 1–14. DOI: 10.5194/hess-16-1-2012.
Fontaine B, Janicot S, Moron V. 1995. Rainfall anomaly patterns andwind field signals over West Africa in August (1958–1989). Journalof Climate 8: 1503–1510.
Fontaine B, Trzaska I, Janicot S. 1998. Evolution of the relationshipbetween near global and Atlantic SST mode and the rainy season inWest Africa: statistical analyses and sensitivity experiments. ClimateDynamics 14: 353–368.
Giorgi F, Francisco R. 2000a. Evaluating uncertainties in the predictionof regional climate change. Geophysical Research Letters 27(9):1295–1298. DOI: 10.1029/1999GL011016.
Giorgi F, Francisco R. 2000b. Uncertainties in regional climate changeprediction: a regional analysis of ensemble simulations with theHADCM2 coupled AOGCM. Climate Dynamics 16(2–3): 169–182.DOI: 10.1029/1999GL011016.
Giorgi F, Mearns L. 1991. Approaches to the simulation of regionalclimate change: a review. Reviews of Geophysics 29(2): 191–216.DOI: 10.1029/90RG02636.
Hargreaves G, Samini Z. 1985. Reference crop evapotranspiration fromtemperature. Applied Engineering in Agriculture 1(2): 96–99.
Haylock R, Cawley G, Harpham C, Wilby R, Goodess C. 2006.Downscaling heavy precipitation over the United Kingdom: acomparison of dynamical and statistical methods and their futurescenarios. International Journal of Climatology 26(10): 1397–1415.DOI: 10.1002/joc.1318.
Hewitson B, Crane R. 1996. Climate downscaling: techniques andapplication. Climate Research 7: 85–95. DOI: 10.3354/cr0007085.
Hibbard KA, Meehl GA, Cox P, Friedlingstein P. 2007. A strategyfor climate change stabilization experiments. Eos 88: 217. DOI:10.1029/2007EO200002.
Hulme M, Doherty R, Ngara T, New M, Lister D. 2001. African climatechange: 1900–2100. Climate Research 17: 145–168.
Hurkmans R, Terink W, Uijlenhoet R, Torfs P, Jacob D, Troch PA.2010. Changes in streamflow dynamics in the Rhine Basin underthree high-resolution regional climate scenarios. Journal of Climate23: 679–699. DOI: 10.1175/2009JCLI3066.1.
Copyright 2013 Royal Meteorological Society Int. J. Climatol. (2013)
W. TERINK et al.
Immerzeel WW. 2008. Historical trends and future predictions ofclimate variability in the Brahmaputra basin. International Journalof Climatology 28: 243–254. DOI: 10.1002/joc.1528.
Immerzeel WW, Droogers P, Terink W, van Beek R, Bierkens MFP.2012. Water Resources Management .
IPCC. 2007. Climate Change 2007: Synthesis Report. IPCC 2007.Technical report, IPCC.
Janicot S, Harxallah A, Fontaine B, Moron V. 1998. WestAfricanmonsoon dynamic and eastern equatorial Atlantic and Pacific SSTanomalies (1970–1988). Journal of Climate 11: 1874–1882.
Jung M, Reichstein M, Ciais P, Seneviratne S, Sheffield J, GouldenM, Bonan G, Cescatti A, Chen J, de Jeu R, Dolman A, Eugster W,Gerten D, Gianelle D, Gobron N, Heinke J, Kimball J, Law B, Mon-tagnani L, Mu Q, Mueller B, Oleson K, Papale D, Richardson A,Roupsard O. 2010. Recent decline in the global land evapotranspi-ration trend due to limited moisture supply. Nature 467: 951–954.
Kalnay E, Kanamitsu M, Kistler R, Collins W, Deaven D, GandinL, Iredell M, Saha S, White G, Woollen J, Zhu Y, Chelliah M,Ebisuzaki W, Higgins W, Janowiak J, Mo K, Wang JCR, LeetmaaA, Reynolds R, Jenne R, Joseph D. 1996. The NCEP/NCAR 40-yearreanalysis project. Bulletin of the American Meteorological Society77: 437–470.
Kidson J, Thompson C. 1998. A comparison of statistical and model-based downscaling techniques for estimating local climate variations.Journal of Climate 11(4): 735–753. http://dx.doi.org/10.1175/1520-0442(1998)011<0735:ACOSAM>2.0.CO;2.
Kummerow C, Simpson J, Thiele O, Barnes W, Chang A, StockerE, Adler R, Hou A, Kakar R, Wentz F, Ashcroft P, Kozu T,Hong Y, Iguchi KOT, Kuroiwa H, Im E, Haddad Z, HuffmanG, Ferrier B, Olson W, Zipser E, Smith E, Wilheit T, North G,Krishnamurti T, Nakamur K. 2000. The status of the Tropical Rain-fall Measuring Mission (TRMM) after two years in orbit. Journalof Applied Meteorology 39(12): 1965–1982. DOI: 10.1175/1520-0450(2001)040<1965:TSOTTR>2.0.CO;2.
Meehl GA, Hibbard KA. 2007. A strategy for climate change stabiliza-tion experiments with AOGCMs and ESMs. WCRP Informal ReportNo. 3/2007, ICPO Publication No. 112, IGBP Report No. 57. WorldClimate Research Programme: Geneva, 35pp.
Meehl GA, Goddard L, Murphy J, Stouffer RJ, Boer G, DanabasogluG, Dixon K, Giorgetta MA, Greene AM, Hawkins E, Hegerl G,Karoly D, Keenlyside N, Kimoto M, Kirtman B, Navarra A, PulwartyR, Smith D, Stammer D, Stockdale T. 2009. Decadal prediction.Bulletin of the American Meteorological Society 90: 1467–1485.DOI: 10.1175/2009BAMS2778.1.
Mitasova H, Mitas L. 1993. Interpolation by regularized spline withtension: I. Theory and implementation. Mathematical Geology 25(6):641–655. DOI: 10.1007/BF00893171.
Murphy J. 1999. An evaluation of statistical and dynamical tech-niques for downscaling local climate. Journal of Climate 12(8):2556–2284. http://dx.doi.org/10.1175/1520-0442(1999)012<2256:AEOSAD>2.0.CO;2.
Neelin JD, Battisti DS, Hirst AC, Jin FF, Wakata Y, Yamagata T,Zebiak SE. 1998. ENSO theory. Journal of Geophysical Research103(C7): 14261–14290.
New M, Hulme M, Jones P. 2000. Representing twentieth-centuryspace-time climate variability. Part II: Development of 1901–96monthly grids of terrestrial surface climate. Journal of Climate13(13): 2217–2238. http://dx.doi.org/10.1175/1520-0442(2000)013<2217:RTCSTC>2.0.CO;2.
Paeth H, Hense A. 2004. SST versus climate change signals inWest African rainfall: 20th-century variations and future projec-tions. Climatic Change 65(1–2): 179–208. DOI: 10.1023/B:CLIM.0000037508.88115.8a.
Palmer TN, Brankovic C, Viterbo P, Miller MJ. 1992. Modeling theinterannual variation of summer monsoon. Journal of Climate 5:299–417.
Parker DJ, Thorncroft CD, Burton RR, Diongue-Niang A. 2005.Analysis of the African easterly jet using aircraft observationsfrom the JET2000 experiment. Quarterly Journal of the RoyalMeteorological Society 131(608): 1461–1482.
Parker DJ, Fink A, Janicot S, Ngamini JB, Douglas M, AfiesimamaE, Agusti-Panareda A, Beljaars A, Did’e F, Diedhiou A, Lebel T,
Polcher J, Redelsperger JL, Thorncroft CD, Wilson GA. 2008. TheAMMA radiosonde program and its implications for the futureof atmospheric monitoring over Africa. Bulletin of the AmericanMeteorological Society 89: 1015–1027.
Redelsperger JL, Thorncroft CD, Diedhiou A, Lebel T, ParkerDJ, Polcher J. 2006. African Monsoon Multidisciplinary Analysis(AMMA): an international research project and field campaign. Bul-letin of the American Meteorological Society 87: 1739–1746.
Roudi-Fahimi F, Kent M. 2007. Challenges and opportunities – thepopulation of the Middle East and North Africa. Population Bulletin62(2): 5.
Shongwe M, van Oldenborgh G, van den Hurk B, de Boer B,Coelho C, van Aalst M. 2009. Projected changes in mean andextreme precipitation in Africa under global warming. Part I: South-ern Africa. Journal of Climate 22: 3819–3837. 10.1175/2009JCLI2317.1.
Shongwe M, van Oldenborgh G, van den Hurk B, van Aalst M. 2011.Projected changes in mean and extreme precipitation in Africa underglobal warming, Part II: East Africa. Journal of Climate 24(11):3718–3733. DOI: http://dx.doi.org/10.1175/2010JCLI2883.1.
Snoussi M, Haıda S, Imassi S. 2002. Effects of the construction ofdams on the water and sediment fluxes of the Moulouya and theSebou Rivers, Morocco. Regional Environmental Change 3(1–3):5–12. DOI: 10.1007/s10113-001-0035-7.
Snyder JP. 1987. Map Projections – A Working Manual. U .S. Geo-logical Survey Professional Paper 1395. U.S. Government PrintingOffice: Washington, DC, 98–103.
SRES. 2000. IPCC Special Report Emission Scenarios. Summary forPolicy makers. Intergovernmental Panel on Climate Change. ISBN:92-9169-113-5.
Taylor KE, Stouffer RJ, Meehl GA. 2012. An Overview of CMIP5and the experiment design. Bulletin of the American MeteorologicalSociety 93: 485–498. DOI: 10.1175/BAMS-D-11-00094.1.
Terink W, Hurkmans RTWL, Torfs PJJF, Uijlenhoet R. 2010. Evalua-tion of a bias correction method applied to downscaled precipitationand temperature reanalysis data for the Rhine basin. Hydrologicaland Earth System Sciences 14: 687–703.
Van Beek LPH, Bierkens MFP. 2009. The global hydrological modelPCR-GLOBWB: conceptualization, parameterization and verifica-tion. Report, Department of Physical Geography, Utrecht Univer-sity, Utrecht, The Netherlands, http://vanbeek.geo.uu.nl/suppinfo/vanbeekbierkens2009.pdf.
Ward MN. 1992. Worldwide ocean-atmosphere surface fields andSahelian rainfall variability. Journal of Climate 5: 454–475.
WCRP. 2011. WCRP Coupled Model Intercomparison Project – Phase5 – CMIP5. CLIVAR Exchanges. Special issue. 16(2).
Wilby R, Wigley T. 1997. Downscaling general circulation modeloutput: a review of methods and limitations. Progress in PhysicalGeography 21(4): 530–548. DOI: 10.1177/030913339702100403.
Wilby R, Wigley T, Conway D, Jones P, Hewitson B, Main J,Wilks D. 1998. Statistical downscaling of general circulation modeloutput: a comparison of methods. Water Resources Research 34(11):2995–3008.
Wilby R, Hay L, Gutowski W Jr, Arrit R, Takle E, Pan Z, LeavesleyG, Clark M. 2000. Hydrological responses to dynamically andstatistically downscaled climate model output. Geophysical ResearchLetter 27(8): 1199–1202.
Wilby R, Dawson C, Barrow E. 2002. SDSM – a decision support toolfor the assessment of regional climate change impacts. Environmen-tal Modelling & Software 17(2): 147–159. DOI: http://dx.doi.org/10.1016/S1364-8152(01)00060-3.
World Bank. 2007. Making the most of scarcity. Accountability forbetter water management results in the Middle East and North Africa.MENA Development Report, World Bank. DOI: 10.1596/978-0-8213-6925-8.
Yeshanew A, Jury MR. 2007. North African climate variability. Part2: Tropical circulation systems. Theoretical and Applied Climatology89: 37–49.
Zwiers F, Kharin V. 1997. Changes in the extremes of the cli-mate simulated by CCC GCM2 under CO2 doubling. Jour-nal of Climate 11(9): 2200–2222. http://dx.doi.org/10.1175/1520-0442(1998)011<2200:CITEOT>2.0.CO;2.
Copyright 2013 Royal Meteorological Society Int. J. Climatol. (2013)