climate change impacts of oil palm plantations: a … change impacts of oil palm plantations: a...
TRANSCRIPT

Climate Change impacts of Oil Palm Plantations: A Review of Peat Swamp Forests’ Conversion in Indonesia
Syed Aziz Ur REHMAN*1, Supiandi SABIHAM1, Untung SUDADI1, Syaiful ANWAR1
1 Department of Soil Science and Land Resources, Bogor Agriculture University, Bogor 16680, Indonesia
Abstract
Indonesia possess rich biodiversity with abundant natural resources such as tropical rain and peat swamp forests, oil and gas deposits, and fertile soils just to name a few. The state policies on natural resource management were decentralized and the power and local autonomy rights were given to provincial and district governments. This resulted in an enormous expansion of oil palm plantations across the country especially over the last three decades. On the one hand it boosted the country’s economy by bringing foreign money reserves, but on the other hand has led to severe deforestation, shifting cultivation, peat swamp forests conversion and land degradation. Thus, due to the severity of these environmental consequences and associated climate change implications, oil palm development has received significant attention from all stakeholders and is the subject of global debate. This paper aims to discuss the results of various studies regarding emissions of GHGs from oil palm plantations in Indonesia and highlights the fundamental methodologies followed in assessing GHGs emissions. We found throughout contradictions in the reported rates of oil palm encroachment over peatland and GHG emissions.The former because of diverse methodologies followed in each study i.e. different amounts of time spent in the field, Sscales of study area, Aanalytical techniques in GIS (Ddata sets and supplementary Rremote Ssensing); and the later because of both differences in instrumentation and underlying principles; such as indirect GHG assessments from subsurface drainage(level of water table), subsidence, soil and biomass carbon stock differences, autotrophic and heterotrophic respiration, Cclose Cchamber methods, Eeddy Ccovariance techniques and utilization of Mmicrometeorological stations.Finally,the review concludes that, almost all studies demonstrates a linear increase in oil palm plantations and proclaimsa net negative climate change negative impact due to conversion from Ppeat swamp forests to oil palm plantations. Therefore, it is being recommended that the pre-existing GHG inventories data should be further worked out to developa ‘standard carbon sequestration model for peatlands’, supported byupdated countrywide peatlands mappingand policy reforms which should addressboth economic development from the oil palm sector and consider mitigation of GHGs emissions from peatlands.
Keywords: climate change, deforestation, GHG emissions, oil palm, Peat swamp Forests
Introduction Tropics cover around 440,000 km2 or 11% of the global peatland area, of which most are concentrated in insular Southeast Asia; in some areas these peat deposits are up to 20 m thick with surface areas about 250,000 km2(Page et al., 2011). There are a range of ecosystem functions and societal benefits associated with the tropical peatlands of insular Southeast Asia, most recently including provision of habitat to endangered fauna due to decline in the pre-

existing lowland forests above mineral soils (Morrogh-Bernard et al., 2003). Furthermore, the carbon stocks of these peatlands are as high as 70 Gt (Page et al., 2011), which is nine times higher than the carbon that was emitted into the atmosphere by fossil fuel combustion in 2006; which was up to 8 Gt as estimated by the Intergovernmental Panel on Climate Change (IPCC) (IPCC, 2007). The Southeast Asian peatlands experienced only minor exploitation by indigenous people before the establishment and development of large-scale industrial plantations (Rieley& Page, 2005). However, in the past three decades peat swamp forest has suffered an accelerated deforestation and land clearance activities due to the establishment of industrial plantations, compounded by the latest conversion techniques, overwhelming demands for agricultural commodities and shortage of mineral soils for agriculture, leading to increased human pressure on peatland areas. Plantation establishment involves drainage and land preparation works therefore, since the 1980s we see an increase in distorted landscapes and poor smallholder segmentation in the logged peatlands (Page et al., 2009). This conversion of peatlands has caused regional and global debates about oil palm plantations having serious social and environmental consequences (Hooijer et al., 2006). Peat accumulation and storage process in the tropics has been adversely effected by anthropogenic activities which isare a cumulative function of peatland hydrology, ecology and landscape morphology (Page et al., 1999). Conversion of peatlands to agriculture requires drainage i.e. avoiding inundation and involves civil works leading to constructions of road networks, waterways and railways tracks etc. which ultimately leads to lowering of the water table and creates aerobic conditions thereby accelerating oxidation, nitrogen mineralization and microbial activities (Hirano et al., 2007). This leads to elevated CO2loss by peat decomposition and accelerates greenhouse gas (GHG) emissions to the atmosphere (Couwenberg et al., 2010). Such logging activities causes the humid tropical forests to be highly prone to forest fires and desiccation because of wood loss and opened canopy (Siegert et al., 2001). These fires are less frequent but are potentially disastrous causing abrupt changes in the peatland involving carbon stocks burning and settingsending enormous emissions of GHGs into the atmosphere (Heil et al., 2006). Thus at national level resource management and policy development regarding peatlands, it is inevitable to explore the social and environmental implication of peatland conversion to oil palm plantations along with understanding of its historical development. Historical and current Oil palm development in Indonesia In Indonesia, the island of Sumatra has the largest absolute extent of oil palm plantations (see tTable. 1) on peat i.e. 1.4 Mha(29%), followed by Kalimantan with 307,515 ha(11%), and Papua with 1,727 ha(Gunarso., et al., 2013). Projections of additional land demand for oil palm production in 2020 range from 1 to 28Mha in Indonesia (Wicke., et al., 2011). An overall, majority (62%) of the industrial plantations isare located on the island of Sumatra,which containstwo-thirds (69%) of oil palm cultivation; 70% of all industrial plantations have been established since 2000 and only 4% of the current plantation area existed in 1990 (Miettinen., et

al 2012a). The projected annual global demand for biodiesel is 24 thousand million liters by 2017, up from nearly 11 thousand million at the end of 2007 and less than 1 thousand million in 2000 (reference?). If this demand were to be met from oil palm alone, the additional area of plantations needed would be 4.6 million hectares by 2017 assuming a yield of 5830 liters of palm oil ha-1yr-1(Sheil., et al., 2009). Carlson., et al.(2012) assessed previous and project future plantation expansion under five scenarios by using a spatially explicit land change(carbon bookkeeping model), parameterized by high-resolution satellite time series and informed by socioeconomic surveys.;fFire was the primary proximate cause of 1989–2008 deforestation (93%) and net carbon emissions (69%) from 2007–2008, oil palm directly caused 27% of total and 40% of peatland deforestation, shifting to 69% of peatlands deforestation from(2008–2011). This implies that by 2020 nearly 40% of regional and 35% of community lands will be cleared for oil palm, generating 26% of net carbon emissions. The Rresults of Hansen., et al.(2009) showed a dramatic reduction in forest clearing rate from a 1990s average value of 1.78 Mhayr−1 to an average rate of 0.71 Mhayr−1 from 2000 to 2005. However, annual forest cover loss indicator maps revealed a near monotonic increase in forest clearing from a low rate in 2000 to higher in 2005. Results illustrated a dramatic downturn in forest clearing at the turn of the century followed by a steady resurgence thereafter to levels estimated to exceed 1 Mha yr−1 by 2005. The lowlands of Sumatra and Kalimantan were the site of more than 70% of total forest clearing within Indonesia for both epochs; over 40% of the lowland forests of these island groups were cleared from 1990 to 2005. Carlson., et al.(2013) reported oil palm development across Kalimantan as 538,346 km2 from 1990 to 2010, and project expansion to 2020 within government-allocated leases. Using Landsat satellite analyses to discern multiple land covers, coupled with above and below-ground carbon accounting,the first high resolution carbon flux estimates from Kalimantan plantations waswere developed. From 1990 to 2010, 90% of lands converted to oil palm were forested (47% intact, 22% logged, 21% agroforests). By 2010, 87% of total oil palm area (31,640 km2) occurred on mineral soils, and these plantations contributed 65–75% of 1990–2010 net oil palm emissions (i.e.0.020–0.024 GtC yr-1). Although oil palm expanded 278% from 2000 to 2010, 79% of allocated leases remained undeveloped. By 2020, full lease development would convert 93,844 km2 (90% forested lands, including 41% intact forests) to oil pam plantations. Oil palm would then occupy 34% of lowlands outside protected areas. Plantations expansion in Kalimantan alone is projected to contribute 18–22% (0.12–0.15 Gt Cyr-1) of Indonesia’s 2020 CO2-equivalent emissions. Table 1. Comparison of three studies focusing on oil palm plantations on peat
Omar et al., 2010 Gunarso et al., 2013 Miettinen et al.,
2012a Total Peat Area(ha)
Indonesia (excluding Papua) 13,043,026 13,003,105
Sumatra 6436649 7,212,798 7,234,069
Kalimantans 4778004 5,830,228 5,769,036
Total Peat Area 15,188,056 15,492,164
Oil palm in 2010
Indonesia (excluding Papua) 1,704,975 1,285,221
Comment [A1]: Not in references
Sumatra 1,395,733 1,026,922
Kalimantan 307,515 258,299
Total 2,421,478 2,129,154
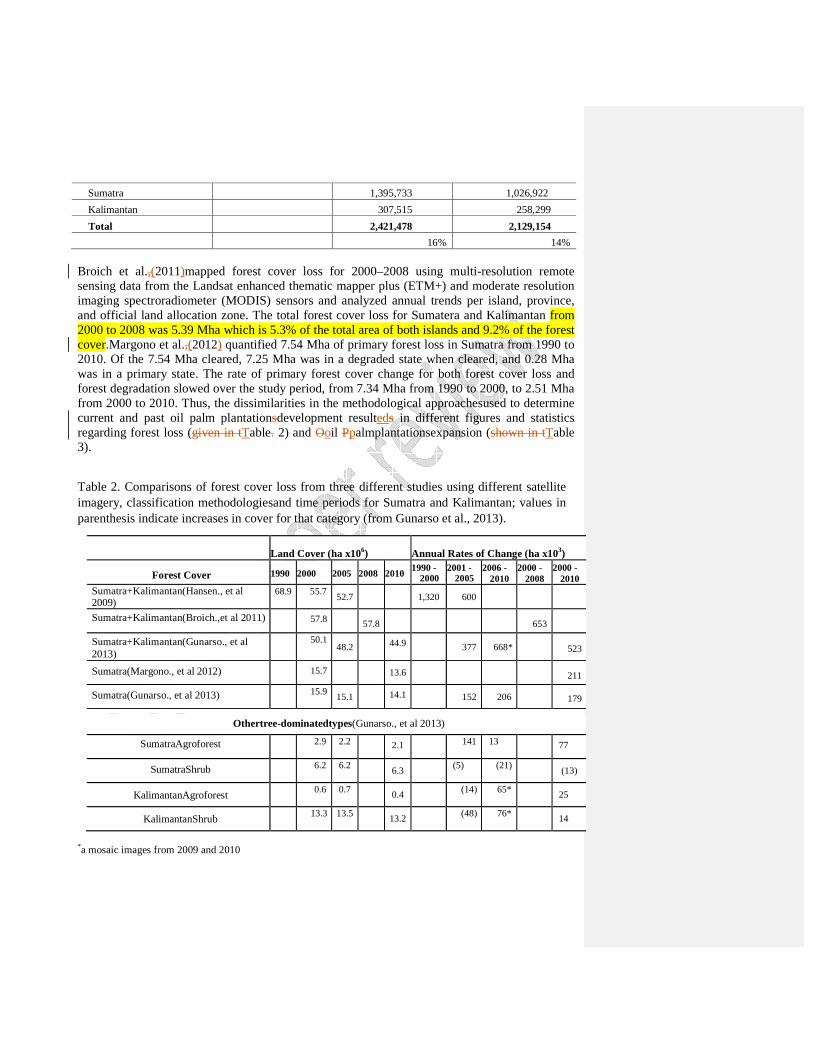
16% 14% Broich et al.,(2011)mapped forest cover loss for 2000–2008 using multi-resolution remote sensing data from the Landsat enhanced thematic mapper plus (ETM+) and moderate resolution imaging spectroradiometer (MODIS) sensors and analyzed annual trends per island, province, and official land allocation zone. The total forest cover loss for Sumatera and Kalimantan from 2000 to 2008 was 5.39 Mha which is 5.3% of the total area of both islands and 9.2% of the forest cover.Margono et al.,(2012) quantified 7.54 Mha of primary forest loss in Sumatra from 1990 to 2010. Of the 7.54 Mha cleared, 7.25 Mha was in a degraded state when cleared, and 0.28 Mha was in a primary state. The rate of primary forest cover change for both forest cover loss and forest degradation slowed over the study period, from 7.34 Mha from 1990 to 2000, to 2.51 Mha from 2000 to 2010. Thus, the dissimilarities in the methodological approachesused to determine current and past oil palm plantationsdevelopment resulteds in different figures and statistics regarding forest loss (given in tTable. 2) and Ooil Ppalmplantationsexpansion (shown in tTable 3).
Table 2. Comparisons of forest cover loss from three different studies using different satellite imagery, classification methodologiesand time periods for Sumatra and Kalimantan; values in parenthesis indicate increases in cover for that category (from Gunarso et al., 2013).
Land Cover (ha x106)
Annual Rates of Change (ha x103)
Forest Cover 1990 2000 2005 2008 2010 1990 -
2000 2001 -
2005 2006 -
2010 2000 -
2008 2000 -
2010 Sumatra+Kalimantan(Hansen., et al 2009)
68.9 55.7 52.7 1,320 600
Sumatra+Kalimantan(Broich.,et al 2011) 57.8 57.8
653
Sumatra+Kalimantan(Gunarso., et al 2013)
50.1 48.2 44.9 377 668*
523
Sumatra(Margono., et al 2012) 15.7 13.6 211
Sumatra(Gunarso., et al 2013) 15.9 15.1 14.1 152 206
179
Othertree-dominatedtypes(Gunarso., et al 2013)
SumatraAgroforest 2.9 2.2 2.1 141 13 77
SumatraShrub 6.2 6.2 6.3 (5) (21) (13)
KalimantanAgroforest 0.6 0.7 0.4 (14) 65* 25
KalimantanShrub 13.3 13.5 13.2 (48) 76* 14
*a mosaic images from 2009 and 2010
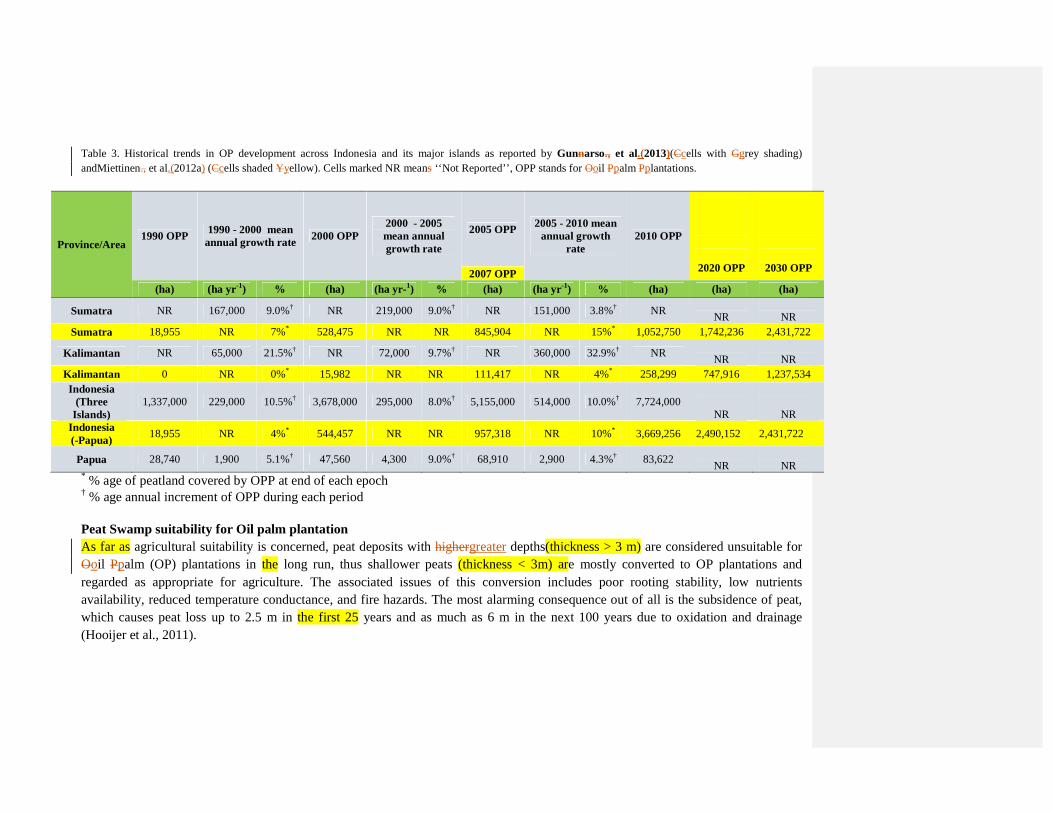
Table 3. Historical trends in OP development across Indonesia and its major islands as reported by Gunnarso., et al.(2013)(Ccells with Ggrey shading) andMiettinen., et al.(2012a) (Ccells shaded Yyellow). Cells marked NR means ‘‘Not Reported’’, OPP stands for Ooil Ppalm Pplantations.
Province/Area 1990 OPP 1990 - 2000 mean
annual growth rate 2000 OPP 2000 - 2005 mean annual growth rate
2005 OPP 2005 - 2010 mean annual growth
rate 2010 OPP
2020 OPP
2030 OPP 2007 OPP (ha) (ha yr-1) % (ha) (ha yr-1) % (ha) (ha yr-1) % (ha) (ha) (ha)
Sumatra NR 167,000 9.0%† NR 219,000 9.0%† NR 151,000 3.8%† NR
NR
NR Sumatra 18,955 NR 7%* 528,475 NR NR 845,904 NR 15%* 1,052,750 1,742,236 2,431,722
Kalimantan NR 65,000 21.5%† NR 72,000 9.7%† NR 360,000 32.9%† NR
NR
NR Kalimantan 0 NR 0%* 15,982 NR NR 111,417 NR 4%* 258,299 747,916 1,237,534 Indonesia
(Three Islands)
1,337,000 229,000 10.5%† 3,678,000 295,000 8.0%† 5,155,000 514,000 10.0%† 7,724,000
NR
NR Indonesia (-Papua)
18,955 NR 4%* 544,457 NR NR 957,318 NR 10%* 3,669,256 2,490,152 2,431,722
Papua 28,740 1,900 5.1%† 47,560 4,300 9.0%† 68,910 2,900 4.3%† 83,622
NR
NR * % age of peatland covered by OPP at end of each epoch † % age annual increment of OPP during each period Peat Swamp suitability for Oil palm plantation As far as agricultural suitability is concerned, peat deposits with highergreater depths(thickness > 3 m) are considered unsuitable for Ooil Ppalm (OP) plantations in the long run, thus shallower peats (thickness < 3m) are mostly converted to OP plantations and regarded as appropriate for agriculture. The associated issues of this conversion includes poor rooting stability, low nutrients availability, reduced temperature conductance, and fire hazards. The most alarming consequence out of all is the subsidence of peat, which causes peat loss up to 2.5 m in the first 25 years and as much as 6 m in the next 100 years due to oxidation and drainage (Hooijer et al., 2011).

Table 4.Shows tThe province-wise distribution of Ppeatlandsinon Kalimantan Islandbased on peat nature and thickness (from Wahyunto et al., 2004)
AreaandcarboncontentineachProvince Total
West Kalimantan Central Kalimantan East Kalimantan South Kalimantan
Depth/ PeatTypes Proportion Area C Content Area C Content Area C Content Area C Content
Area C Content
No. Thickness (%) Ha MilliontonC
Ha MilliontonC
Ha MilliontonC
Ha MilliontonC
Ha MilliontonC
1 VeryShallow/VeryThin
(< 50 cm)
Hemists/mineral 80 / 20 36,673.00 0.98 75,990.00 2.02 -- -- 76,785.00 2.04 189,448 5.04
2
Shallow
/Thin
(50-100cm)
Hemists/Fibrists 60 / 40 125,435.00 77.17 246,316 72.74 49,562 19.20 -- -- 421,313 169.11
3 Hemists/Fibrists/mineral 50 / 30 / 20 225,486.00 111.81 45,610 10.57 4,539 1.40 -- -- 275,635 123.78
4 Hemists/mineral 80 / 20 44,484.00 24.49 79,055 13.12 24,121 6.97 -- -- 147,660 44.58
5 Hemists/Saprists/mineral 40 / 30 / 30 8,793.00 3.82 124,874 43.59 -- -- -- -- 133,667 47.41
6 Hemists/mineral 50 / 50 1,078.00 0.37 106,649 11.07 -- -- 18,100 2.27 125,827 13.71
7 Hemists/mineral 20 / 80 32,896.00 4.53 353,229 14.66 186,337 13.46 32,340 1.62 604,802 34.27
8 Saprists/mineral 20 / 80 -- -- 2,753 0.29 -- -- 28,928 1.22 31,681 1.51
9
Moderate
(100-200cm)
Hemists/Fibrists 60 / 40 737,111.00 1,067.09 459,371 301.41 25,528 18.18 -- -- 1,222,010 1,386.67
10 Hemists/Fibrists/mineral 50 / 30 / 20 -- -- -- -- 86,983 53.71 -- -- 86,983 53.71
11 Hemists/Fibrists/Saprists 40 / 30 / 30 -- -- 3,028 3.00 -- -- -- -- 3,028 3.00
12 Hemists/mineral 10 / 90 -- -- -- -- -- -- 9,976 3.01 9,976 3.01
13 Saprists/Hemists/mineral 25 / 25 / 50 -- -- -- -- -- -- 68,790 15.88 68,790 15.88
14 Deep/Thick
(200-400cm)
Hemists/Fibrists 60 / 40 213,705.00 539.41 574,978 665.98 128,561 32,669 42.15 949,913 1,598.08
15 Hemists/Fibrists/mineral 50 / 30 / 20 -- -- -- -- 91,142 -- -- 91,142 201.90
16 Saprists/Hemists/mineral 30 / 30 / 40 -- -- -- -- -- -- 64,041 17.74 64,041 17.74
17 VeryDeep/VerHemists/Fibrists 60 / 40 304,319.00 1,795.52 661,093 3,066.36 100,224 -- -- 1,065,636 5,408.42
Comment [A2]: This table is not called for in the
manuscript, a call to it needs to be added.

yThick
(400 - 800cm)
18 Extremely Deep/Extrem
ely Thick
(800 - 1200cm)
Hemists/Fibrists 60 / 40 -- -- 277,694 2,146.72 -- -- -- -- 277,694 2,146.72
Total 1,729,980 3,625.19 3,010,640 6,351.52 696,997 1,211 331,629 85.94 5,769,246 11,273.66
% 29.99 32.15 52.18 56.34 12.08 10.75 5.75 0.76 100.00 100.00
The drainage leads to subsidence because the peat surface lies 2 to 10 m above the mean sea level. One of the key changes made to peatlandlandscapes during conversion to agriculture includes semi-permanent flooded conditions which cannot be avoided and has been mostly reported regarding Southeast Asian peatlands (Andriesse, 1988). Therefore it has been concluded that, Southeast Asian peatlands are not suitable for agriculture except where thickness is less than 2 m, and only in those areas selective logging can be allowed. Thus with this standard depth limit in Sarawak Malaysia, the peatland soils with thickness more than 2 m have been declared as organic soils in the land capability classification maps and regarded as soils with severe agriculture limitations. On the other hand peatlands which are shallow (thickness < 2m) hashave been presented as marginally suitable for agriculture. The Department of iIrrigation and dDrainage Sarawak reports these “unsuitable” and “marginally suitable” peatlands converted to OP since 2000 as restorable and they can be “returned to nature” if further drainage is avoided in the future (DID Sarwak, 2001). For the reasons described above, Indonesian Presidential decrees1 stipulates that peat thicker than 3 m should not be drained or clear-felled. However, implementing this law proves outhas proven to be problematic because the Indonesian ban on developing peatlands deeper than 3 m is not strictly enforced, as is clear from the fact that the share of peatland allocated to conversion to OP plantations on peat of 2 to 4 meters deep is as high as 42%, even 19% of the peatland area with thickness more than 4 m has already been given on lease for conversion to OP plantations (Miettinen., et al 2012a).
1Presidential decree no 32, 1990 and Presidential decree no 80, 1999
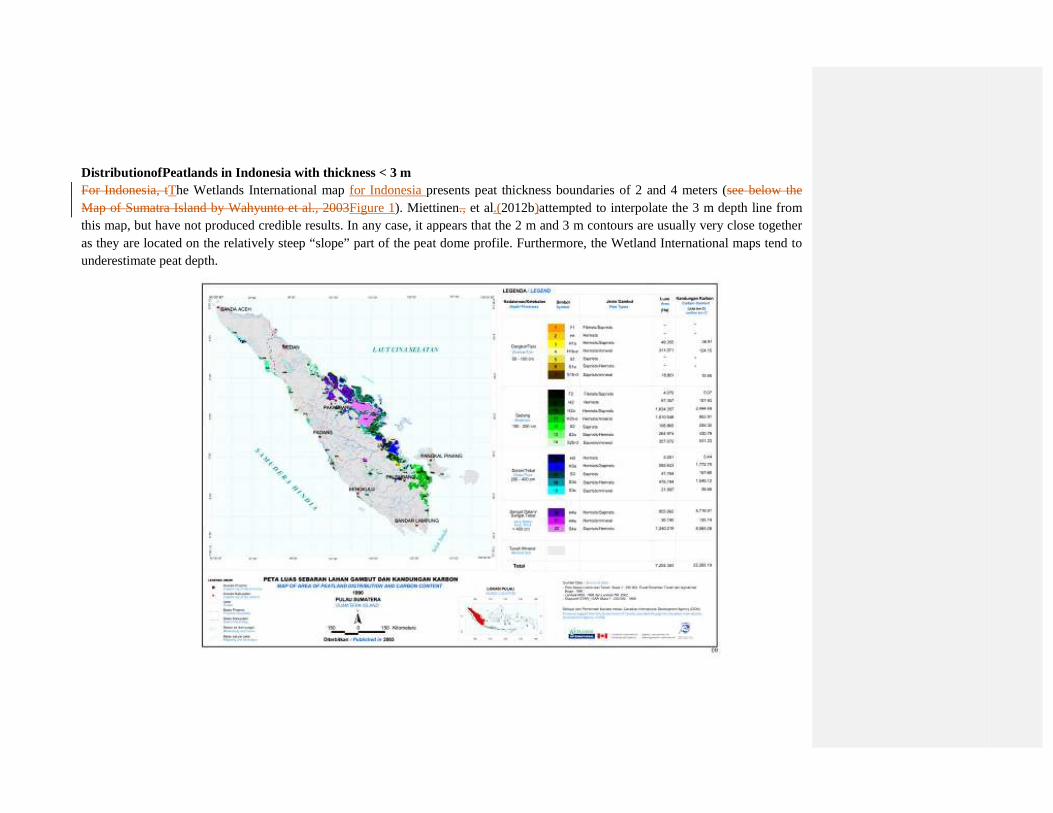
DistributionofPeatlands in Indonesia with thickness < 3 mFor Indonesia, tThe Wetlands International map Map of Sumatra Island by Wahyunto et al., 2003this map, but have not produced credible results. In any case, it appears that the 2 m and 3 m contours are usually very closas they are located on the relatively steep “slope” part of the peat dounderestimate peat depth.
with thickness < 3 m he Wetlands International map for Indonesia presents peat thickness boundaries of 2 and 4 meters
Wahyunto et al., 2003Figure 1). Miettinen., et al.(2012b)attempted to interpolate the 3 m depth line from this map, but have not produced credible results. In any case, it appears that the 2 m and 3 m contours are usually very closas they are located on the relatively steep “slope” part of the peat dome profile. Furthermore, the Wetland International maps tend to
presents peat thickness boundaries of 2 and 4 meters (see below the attempted to interpolate the 3 m depth line from
this map, but have not produced credible results. In any case, it appears that the 2 m and 3 m contours are usually very close together me profile. Furthermore, the Wetland International maps tend to
Figure 1.Peatland distribution Map of Sumatra Island (Wahyunto et al., 2003)

Indonesia can enforce the ban on development of oil palm plantations or other agricultural practices on peat having thickness 3 m or above by encouraging OP expansion on shallow peat or mineral soils. Moreover, ifcontinued to expandexpansion continued only on peat with thickness less than 3 m, merelyapproximately 36% of shallow peats that were not planted with OP in 2010 would be in 2030. If expansion of OP continues with current rates only two provinces will exceed the available area ofshallow peat that have relatively limited peat extant i.e.extent,West Sumatra and North Sumatra.
Peat Swamp Forest conversion to Oil palm plantations
Indonesia is considered to have one of the highest rates of deforestation in the world, ranging
from 0.7 to 1.7 Mhayr-1
from 1995 to 2005 (Hansenetal.,2009). The Lland Uuse Cchange (LUC) can primarily be characterized by forest cover loss on 40 million ha (Mha) of land, a 30% reduction in forest land (Wicke., et al 2011). The largest single cause of historical forest loss can be attributed to unsustainable logging followed by the impact of fire, which in combination led to the progressive transition of large areas of forest land (Gunarso., et al 2013). In the last three decades the oil palm industry showed significant growth in the two countries namely Malaysia and Indonesia, i.e. from 3.5Mhain1990tomorethan 9.5Mhain2005.of which Indonesia shareshas the higher proportion of this growth (Teoh,2009), which is being repeatedly associated with deforestation throughout the scientific and popular media.
Initially the impact of deforestation and oil palm development used to bewas focused on biodiversity losses and its negative impact on indigenous people (Sheiletal.,2009), but the emphasis soon included climate change when interest in oil palm for biofuel production commenced (Gibbsetal.,2008). The greenhousegases(GHGs) emissionsare the result ofdue to oil palm expansion are because of the fact that there occurs decline in the soil organic matter stocks decline when natural forests are replaced by plantations having smaller amounts of residual biomass. Furthermore, the land preparation for oil palm establishment involves drainage and
fires which results into two more sources ofGHGsemissions (Someshwaretal.,2011): one is forest fires which can release GHGs including CO2 and N2O (Andreae et al., 2001) and the second is emissions of GHGs as a results of soil organic matter loss due to drainage (Brevik, 2012). Drainage of the peatlands to prepare them for use as oil palm plantations make the peat soils more vulnerable to catch fire because the upper layer dries out, triggering oxidation and accelerating the decomposition of peat deposits (Aguset al.,2009).
Some studies have covered deforestation in Indonesia but have not covered the issues of the oil palm plantations in particular (Broichetal.,2011)and others have reduced scalesthatwhich make them unsuitable for thorough assessment of the sector (Miettinenetal.,2012b; Carlsonetal.,2012). These studies in particular do not incorporate all the respective land cover categories that are converted to oil palm plantations, neither have they described the economics of the oil palm sector whichthat drives this conversion (Wickeetal.,2011).
Comment [A3]: How can you make this
statement? You just finished talking about the peat
depth maps being inaccurate, then you use them to
make this statement?
Green House Gas (GHG) emissions from Oil Palm plantations By the end of the 1970s Indonesia has beenwas relying on its natural forests to support national economic development, and forest concession rights (HakPengusahaanHutan- HPH) have beenwere the dominant system to utilize natural forests and their resources (Kartodihardjo., et al and Supriono, 2000). Since 1990, industrial plantation development on peatland, especially for oil palm cultivation, has created intense debate due to its potentially adverse social and environmental impacts (Miettinen., et al 2012a). The conversion of one hectare of forest on peat releases over 1,300 Mg CO2 equivalents during the first 25-year cycle of oil palm growth. Depending on the peat depth, continuous decomposition augments the emission with each additional cycle at a magnitude of 800 Mg CO2
equivalents per hectare (Germer&Sauerborn,2008). Various studies has been made thathave reporteds onthe forest loss, Ppeat Sswamp Fforests (PSF) conversion and GHG emission across SEA in general and in Indonesia in particular following a variety of approaches (see tTable. 5).
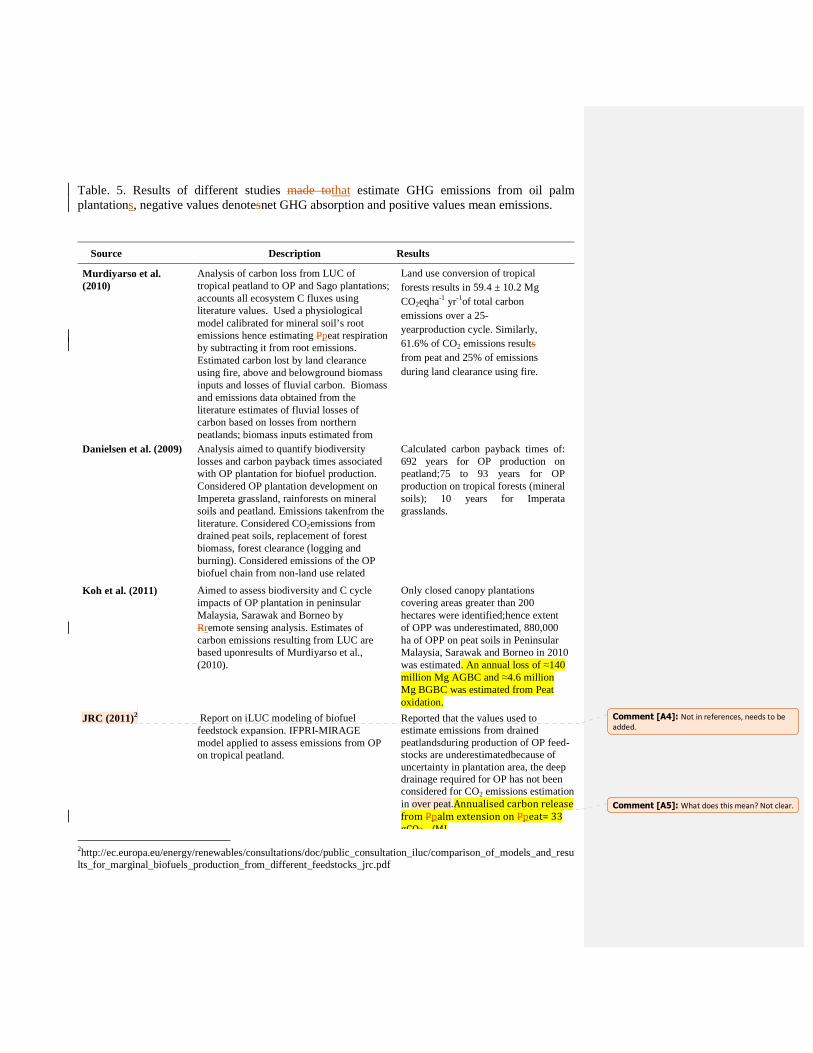
Table. 5. Results of different studies made tothat estimate GHG emissions from oil palm plantations, negative values denotesnet GHG absorption and positive values mean emissions.
2http://ec.europa.eu/energy/renewables/consultations/doc/public_consultation_iluc/comparison_of_models_and_results_for_marginal_biofuels_production_from_different_feedstocks_jrc.pdf
Source Description Results
Murdiyarso et al. (2010)
Analysis of carbon loss from LUC of tropical peatland to OP and Sago plantations; accounts all ecosystem C fluxes using literature values. Used a physiological model calibrated for mineral soil’s root emissions hence estimating Ppeat respiration by subtracting it from root emissions. Estimated carbon lost by land clearance using fire, above and belowground biomass inputs and losses of fluvial carbon. Biomass and emissions data obtained from the literature estimates of fluvial losses of carbon based on losses from northern peatlands; biomass inputs estimated from
Land use conversion of tropical forests results in 59.4 ± 10.2 Mg CO2eqha-1 yr-1of total carbon emissions over a 25-yearproduction cycle. Similarly, 61.6% of CO2 emissions results from peat and 25% of emissions during land clearance using fire.
Danielsen et al. (2009) Analysis aimed to quantify biodiversity losses and carbon payback times associated with OP plantation for biofuel production. Considered OP plantation development on Impereta grassland, rainforests on mineral soils and peatland. Emissions takenfrom the literature. Considered CO2emissions from drained peat soils, replacement of forest biomass, forest clearance (logging and burning). Considered emissions of the OP biofuel chain from non-land use related components also.
Calculated carbon payback times of: 692 years for OP production on peatland;75 to 93 years for OP production on tropical forests (mineral soils); 10 years for Imperata grasslands.
Koh et al. (2011) Aimed to assess biodiversity and C cycle impacts of OP plantation in peninsular Malaysia, Sarawak and Borneo by Rremote sensing analysis. Estimates of carbon emissions resulting from LUC are based uponresults of Murdiyarso et al., (2010).
Only closed canopy plantations covering areas greater than 200 hectares were identified;hence extent of OPP was underestimated, 880,000 ha of OPP on peat soils in Peninsular Malaysia, Sarawak and Borneo in 2010 was estimated. An annual loss of ≈140 million Mg AGBC and ≈4.6 million Mg BGBC was estimated from Peat oxidation.
JRC (2011)2 Report on iLUC modeling of biofuel feedstock expansion. IFPRI-MIRAGE model applied to assess emissions from OP on tropical peatland.
Reported that the values used to estimate emissions from drained peatlandsduring production of OP feed-stocks are underestimatedbecause of uncertainty in plantation area, the deep drainage required for OP has not been considered for CO2 emissions estimation in over peat.Annualised carbon release
from Ppalm extension on Ppeat= 33
gCO2eq/MJ
Comment [A4]: Not in references, needs to be
added.
Comment [A5]: What does this mean? Not clear.

Wicke et al. (2008) GHG emissions from oil palm production in Borneo for electricity generation in the Netherlandshas beenwas estimated by using degraded grasslands, forests on mineral soils and forests on peatlands; based on criteria of Cramer Commission as 50-70% GHG emission reduction compared to fossil energy production systems. IPCC defaults and data from literature reviewhas beenwas used.
Results showedsthat OP plantations on previously rain forestson mineral soils orpeatlandshave results in highGHG emissions and isare not able to meet 50-70% GHG emissions reductions relative to fossil energy systems. However, OP plantations can be a net carbon sink on degraded and well managed lands.
Reijnders&Huijbregts (2008)
The study focused on OP plantations in Southeast Asia and carbon emissions in each cycle replacing tropical forests; reports lack of data regarding peat respiration and fire.
The results shows 27.5 Mg CO2ha-1yr-
1aboveground biomass carbon losses and 36.7 to 55 Mg CO2-eq ha-1yr-1from peat in 25 year plantation life cycle. CO2emissions estimated to be 1.5 to 5.8 Mg CO2-eq from per ton of oil palm produced to be 1.5 to 5.8 Mg CO2-eq during conversion of forests on mineral soils to OP, and 9 to 17 Mg CO2-eq on peatland.
Fargione et al. (2008) Quantified the carbon debt of various biofuel production systems i.e. OP production on lowland tropical rainforests on mineral soils in Southeast Asia. Emission estimates based on literature review.
For lowland forest estimated emissions and carbon biofuel debts over a 50-year period = 610 Mg CO2-eq ha-1,for 86 years = 3000 Mg CO2-eq ha-1and carbon debt of 420 years for peatland; the study also estimated emissions over 120 years for peats deeper than 3 m as 6000 Mg CO2-eq ha-1and 840 years of biofuel carbon Germer&Sauerborn
(2008) Study aimed to quantify GHG emissions from OP plantations on tropical rain forests (on mineral soils), and peatlands. Considered changes soilin biomass carbon storage, emissions from fire during land clearance.
In degraded grasslands (i.e. net sink)net greenhouse gas balance over 25-year production cycle: -134 ± 36 Mg CO2-eq ha-1;for forest conversion on mineral soils 668 ± 372 Mg CO2-eq ha-1for forest conversion on peatland. 1335 ± 690 Mg CO2-eq ha-1.
Agus et al., 2013 The CO2 emissions from LUC, peat fires and
peat oxidation due to OPP were estimated for Indonesia, Malaysia and Papua New Guinea. Emission factors calculated from the differences in the mean value of published reports for Aabove-ground Ccarbon (AGC) in Uundisturbed Fforest (UDF), Ddisturbed Fforest (DF), Sshrub-land (SL), and OP. Emission factor for Ppeat oxidation taken from Lliterature and for fires by assuming fire for land clearing during plantation.
CO2 emission from OP in different time periodshas beenwas estimated i.e. 1900- 2000, 2001-2005 and 2006-2009/10.
Emission factors based AGC for UDF =189 Mg C ha-1 for DF =104 Mg C ha-1 for SL =30 Mg C ha-1 for OP = 36 Mg C ha-1, for peat oxidation for OPP operating on peat soils = 43 Mg CO2 ha-1 yr-1, for fires in swamp forest = 333 Mg CO2 ha-1 and for swamp shrub land = 110 Mg CO2 ha-1. Estimated CO2 emission from OP due to peat oxidation and fire in different time periods reported as: for 1900- 2000 = 92 Tg CO2 yr-1, 2001-2005 = 106Tg CO2 yr-1 and 2006-2009/10 = 184 Tg CO2 yr-1. Similarly due to AGC and LUC the CO2 changed from 55 to 42 to 67 Tg CO2 yr-1 in each period respectively.
Formatted: Font: 10 pt
Formatted: Font: 10 pt
Formatted: Font: 10 pt
Formatted: Font: 10 pt
Formatted: Font: 10 pt
Formatted: Font: 10 pt
Formatted: Font: 10 pt
Formatted: Font: 10 pt
Formatted: Font: 10 pt
Formatted: Font: 10 pt
Formatted: Font: 10 pt
Formatted: Font: 10 pt
Formatted: Font: 10 pt
Formatted: Font: 10 pt
Formatted: Font: 10 pt, Superscript
Formatted: Font: 10 pt
Formatted: Font: 10 pt

Carbon Dioxide (CO2)
Hooijer., et al.(2010) estimated CO2 emission caused by decomposition of drained peatlands,which ranged between 355 Mt y−1 and 855 Mt y−1 in 2006 of which 82% came from Indonesia, largely Sumatra and Kalimantan. The emission factor for peat oxidation for oil palm plantations operating on peat soils iswas 43 Mg CO2 ha-1 yr-1, while the GHG emission factors for peat fires for establishing oil palm plantations in swamp forest based on Aabove Gground Ccarbon (AGC) estimatesiswas 333 Mg CO2 ha-1 and swamp shrub land is 110 Mg CO2 ha-1 (Agus., et al., 2013).The emission factor found for drained OP plantations has been concluded different in various studies as given in tTable 6.
Table. 6. GHG emissions from Ooil Ppalm plantations over peatland estimated in different studies, cells marked as NR means ‘‘not reported’’. Negative values denotes the system being a GHG sink.
Reference Emissions from Drained Peat
CO2 Mg CO2ha-
1yr -1
CH4 Mg CH4ha-1yr -
1
N2O kg N2O-N ha-1yr -1
CO2-eq Mg CO2-eq ha-1yr -1
Koh et al. (2011) 19.2 NR NR 19.2 JRC (2010) 57 NR NR 57
Wicke et al. (2008) 39 NR 8 42.7
Murdiyarso et al. (2010) 19.2 NR NR 19.2 Germer&Sauerborn (2008) 31.4 ± 14.1 -0.2 4.1 ± 5.5 33 ± 16 Fargione et al. (2008) 55 NR NR 55 Reijnders&Huijbregts (2008) 36.7 to 55 NR NR 36.7 to 55 Methane
Comparing overall GHG emissions from peatlands iIt is believed that the CH4 emissions from tropical peat areas only make a minor contribution to the GHG flux compared to the emissions of CO2, and thus play only a minor role in the carbon balance (Watanabe et al., 2009). However, tThe extent of emissions from open water and those promoted by management practices and fires, are likely to contribute considerably, particularly because the warming potential of CH4 is 25 times that of CO2. However, net CH4 fluxes from tropical peats are low compared to fluxes from temperate peat soils and they usually show a clear positive relationship to water level for water levels above 20 cm, as is also the case for temperate wetlands (Schrier-Uijl et al., 2013). An outline of the scientific literature describing methane emissions in tropical peat under different land uses is given in Table 7.
According to Guerin and Abril (2007), the rate of methane emission from a tropical lake in a peat area in French Guiana was 350 ± 412 kg ha-1 yr-1 (8.4 ± Mg CO2-eq ha-1 yr-1), signifying that GHG fluxes from open water bodies in the tropics also have to be considered. On the other hand methane emission fromdrainage canals, ponds or flooded areas in temperate regions may account for 60% of the total annualCH4 flux of a drained peat ecosystem, depending on depth
Comment [A6]: The manuscript is switching
between Mt and Mg, one unit needs to be chosen
and used throughout the manuscript.
Comment [A7]: Not in references, needs to be
added.
Formatted: Font: Font color: Auto, Subscript

and theamount of nutrients in the water (Schrier-Uijlet al., 2011).
Table 7.Methane emissions estimated from different land uses on peatland in tropical Southeast Asia
Source Land use Measurements Frequency
MeanCO2-eq (tCO2/ha/yr)
MinCO2-eq (tCO2/ha/y
MaxCO2-eq (tCO2/ha/y
Mean CH4 emissions (gCH4/m2/yr)
MinCH4 emissions
MaxCH4 emissions
(gCH4/m2/y Furukawa et al, 2005
Drained forest
1-2 years, monthly 0.28
1.17
Cassava 1-2 years, monthly 0.81
3.39
Paddy field upland
1-2 years, monthly 0.87
3.62
Paddy field lowland
1-2 years, monthly 11.89
49.52
3 Swamp forests
2 months 2.02
6.15
Melling et al, 2005
Sec. forest 1 year, monthly 0.006
0.02
Sago 1 year, monthly 0.06 0.24
Oil palm 1 year, monthly -0.006 -0.02
Couwenberg et al, 2010
Swamp forest
1 year, monthly on
-0.9
1.41
-0.37
5.87
Agriculture 1 year, monthly on
0.006
0.816
0.025
3.4
Rice 1 year, monthly on
0.87
11.88
3.26
49.5
Hadi et al, 2005
Rice 1 year, monthly
0.3 1.22
3.5 14.0
Sec. forest 1 year, monthly 1.41
5.87
Paddy field
1 year, monthly 6.28
26.13
Rice-soybean
1 year, monthly 0.83
3.47
Ueda et al, 2000
Fresh water
1.05 26.28
4.38 109.5
The process of methanogenesis is stimulated by increased soiltemperature and development of drainage canals following land use change which raisesCH4 emissions to non-negligible quantities (Jauhiainenet al.,2012). Couwenberget al. (2010) concludedthat at lowwater levels CH4 emissions in tropical peat are negligible and at high water levels amounts to up to 3 Mg
Comment [A8]: Appropriate superscripts and
subscripts need to be used.

CH4 m-2hr-1 (6.3kg CO2-eq ha-1yr-1) may be emitted. In oil palm plantations drainage parameters
such asthe spacing and width of canals show that water surface fromdrainage canals may account for up to 5% of the totalplantation area and hence become a source of CH4 emission. Methane flux from peat soils supporting oil palm, sago and degraded forest was estimated using closed chambers, performing monthly measurements over a year by Mellinget al. (2005).They examined parameters such as depth to groundwater table, precipitation, nutrients, bulk density, and moisture conditions whichthat were likely to control CH4 emissions. The results indicated that the sago plantation and degraded forest were sources for CH4 while the oil palm plantation was a CH4 sink. They attributed the switch from the forest as a source (2.27 ugC m-2hr-1) to the oil palm as a sink (-3.58 ug C m-2hr-1) to a lowering of the water table and soil compaction due to use of machinery and concluded that the conversion of tropical peat primary forest to oil palm promoted CH4 oxidation due to an increased thickness of aerobic soil after drainage. However, it is also evident that increased fire frequency following drainage and management will also increase CH4 emissions and for each ton of CO2 emitted, an additional 1.5 kg of CH4 is produced when vegetation is burned (Scholes et al. 1996).
Nitrous Oxide
A typical oil palm plantation planted on both mineral and peat soils requires around 354 kg N/ha over the first 5 years causing emission of nitrogen oxides and increased eutrophication in neighboring water bodies and wetlands affected by runoff (Sheil., et al., 2009).Nitrous oxide (N2O) is primarily emitted as a by-product of nitrification and denitrification in both agricultural landscapes and natural ecosystems. The usageuse of Nnitrogen fertilizer,witherwhether inorganic or organic, is a major factor in determining the levels of N2O emission, which vary depending on soil moisture conditions and land use (Schrier-Uijl et al., 2013). Nitrous oxide is not necessarily produced by Nnatural boreal wetlands with high water tables (Nykanenet al., 2002), instead they may consume small amounts via denitrification when atmospheric N2O is reduced to N2. On the other hand, tropical peat soils may represent additional GHG emissions because of different biophysical attributes leading to emissions of N2O from fertilizers and manure applications.
It seems likely that, in oil palm plantations the application of nitrogen fertilizers will accelerate release of N2O; however, the extent of those emissions in these types of ecosystems remains poorly documented (Schrier-Uijl et al., 2013). Mellinget al. (2007) made monthlymeasurements of N2O emissions over one year usingclosed chambers on tropical peat soils under oil palm, sago and forest. The N2O sourceemissions in the oil palmplantations were 1.2 kg N2O ha-1yr-1 (0.48 Mg CO2-eq ha-1yr-1). However, there was too much variability for a robust regression analyses, uncertainties were large and data were too limited to distinguish background emissions from event emissions due to fertilizer applications. Hadiet al., (2005) compared the N2O emissions from a paddy field, a field with a rice-soya bean rotation, and a peat forest. They integrated monthly measurements and scaled these up to provide
Comment [A9]: The scientific names of crops
should be given the first time the common name is
used.

annualestimates of N2O emissions. The default value in the IPCC guidelines for synthetic nitrogen fertilizer-induced emissions for Histosols in tropical regions is 10 kg N2O-N ha-1yr-1 (IPCC, 2006), which correspond to a total emission of 4.8 Mg CO2-eq ha-1yr-1. Thus N2O emissions varyies according to land use developed over peatland as mentionedshown inTable8.
Table 8.N2O emissions from various land uses developed over tropical peatlands as reported in the scientific literature
References Land use Measurement frequency Emission (kg CO2-eq /ha/yr)
Mellinget al., 2005 Sago 10 months, monthly 1556
Forest, not primary 10 months, monthly 330
Oil palm 10 months, monthly 566
Hadiet al., 2005 Cultivated upland field 3 measurement days 6608-36754
Rice paddy field 3 measurement days 0-5781
Soya 3 measurement days 4543
Forest, not primary 3 measurement days 6600
Inubushiet al., 2003 Forest, not primary
Abandoned upland field rice 1 year, monthly range -664 - +498
Furukawa et al., 2005 Pineapple 1-2 months 132-1017
Rice paddy field 1 year, monthly 0.016
Upland cassava field 1 year, monthly 0.257
Forest, not primary 1 year, monthly 0.101
Conclusion and Recommendations The oil palm expansion in Indonesia is becoming a great challenge for policy makers locally and for environmental activists worldwide. Almost all studies conducted in the country shows a linear increase in the oil palm development except in cases where further land in not available for plantations such as in few provinces of Sumatra Island. The policy and economical aspects of oil palm establishment on a national scale requires detailed research; however, to make it easy for decision makers comparative cost benefit analysis should be performed by translating the environmental value of conserving peat swamp forests into economic terms andthat can be compared to fiscal returns from the palm oil sector. In spite of that the country requires extensive policy reforms regarding forests concession rights and mechanisms involved in issuing licenses for industrial plantations. In this regard Indonesia’s 2-year moratorium on new concessions in primary natural forest and peatland areas is an important step towards meeting its voluntary commitment to avoid forest conversion and reducing emissions. However, several issues are unresolved concerning the area and status of land covered by the moratorium, and hence the
Formatted: Font: Font color: Auto, Not
Superscript/ Subscript
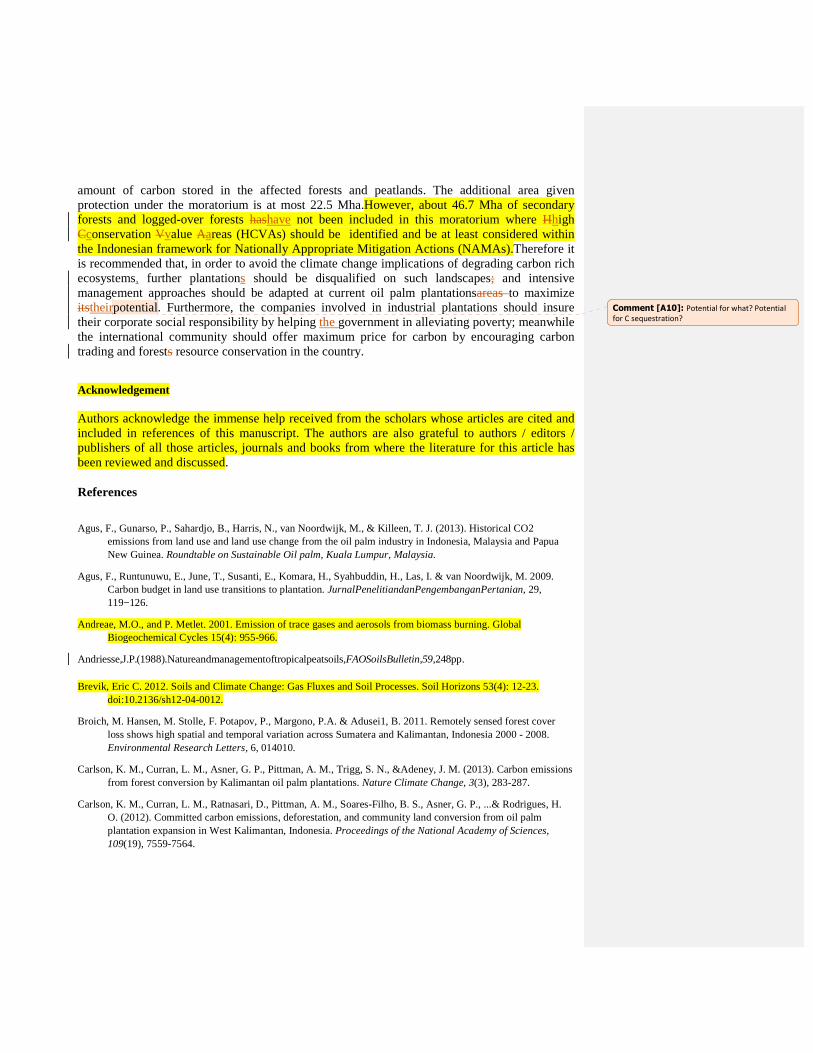
amount of carbon stored in the affected forests and peatlands. The additional area given protection under the moratorium is at most 22.5 Mha.However, about 46.7 Mha of secondary forests and logged-over forests hashave not been included in this moratorium where Hhigh Cconservation Vvalue Aareas (HCVAs) should be identified and be at least considered within the Indonesian framework for Nationally Appropriate Mitigation Actions (NAMAs).Therefore it is recommended that, in order to avoid the climate change implications of degrading carbon rich ecosystems, further plantations should be disqualified on such landscapes; and intensive management approaches should be adapted at current oil palm plantationsareas to maximize itstheirpotential. Furthermore, the companies involved in industrial plantations should insure their corporate social responsibility by helping the government in alleviating poverty; meanwhile the international community should offer maximum price for carbon by encouraging carbon trading and forests resource conservation in the country.
Acknowledgement Authors acknowledge the immense help received from the scholars whose articles are cited and included in references of this manuscript. The authors are also grateful to authors / editors / publishers of all those articles, journals and books from where the literature for this article has been reviewed and discussed.
References
Agus, F., Gunarso, P., Sahardjo, B., Harris, N., van Noordwijk, M., & Killeen, T. J. (2013). Historical CO2
emissions from land use and land use change from the oil palm industry in Indonesia, Malaysia and Papua New Guinea. Roundtable on Sustainable Oil palm, Kuala Lumpur, Malaysia.
Agus, F., Runtunuwu, E., June, T., Susanti, E., Komara, H., Syahbuddin, H., Las, I. & van Noordwijk, M. 2009. Carbon budget in land use transitions to plantation. JurnalPenelitiandanPengembanganPertanian, 29, 119−126.
Andreae, M.O., and P. Metlet. 2001. Emission of trace gases and aerosols from biomass burning. Global Biogeochemical Cycles 15(4): 955-966.
Andriesse,J.P.(1988).Natureandmanagementoftropicalpeatsoils,FAOSoilsBulletin,59,248pp.
Brevik, Eric C. 2012. Soils and Climate Change: Gas Fluxes and Soil Processes. Soil Horizons 53(4): 12-23.
doi:10.2136/sh12-04-0012.
Broich, M. Hansen, M. Stolle, F. Potapov, P., Margono, P.A. & Adusei1, B. 2011. Remotely sensed forest cover loss shows high spatial and temporal variation across Sumatera and Kalimantan, Indonesia 2000 - 2008. Environmental Research Letters, 6, 014010.
Carlson, K. M., Curran, L. M., Asner, G. P., Pittman, A. M., Trigg, S. N., &Adeney, J. M. (2013). Carbon emissions from forest conversion by Kalimantan oil palm plantations. Nature Climate Change, 3(3), 283-287.
Carlson, K. M., Curran, L. M., Ratnasari, D., Pittman, A. M., Soares-Filho, B. S., Asner, G. P., ...& Rodrigues, H. O. (2012). Committed carbon emissions, deforestation, and community land conversion from oil palm plantation expansion in West Kalimantan, Indonesia. Proceedings of the National Academy of Sciences, 109(19), 7559-7564.
Comment [A10]: Potential for what? Potential
for C sequestration?

Couwenberg,J.,Dommain,R.,&Joosten,H.(2010).Greenhousegas fluxesfromtropicalpeatlandsinSouth-EastAsia.GlobalChangeBiology16:1715–1732.
Danielsen, F., Beukema, H., Burgess, N. D., Parish, F., Bruehl, C. A., Donald, P. F., ...&Fitzherbert, E. B. (2009).
Biofuel plantations on forested lands: double jeopardy for biodiversity and climate. Conservation Biology, 23(2), 348-358.
DIDSarawak.(2001).WatermanagementguidelinesforagriculturaldevelopmentinlowlandpeatswampsofSarawak,ReportoftheDrainageandIrrigationDepartment,Sarawak,Malaysia,78pp.
Fargione, J., Hill, J., Tilman, D., Polasky, S., & Hawthorne, P. (2008).Land clearing and the biofuel carbon
debt.Science, 319(5867), 1235-1238.
Furukawa, Y., Inubushi, K.& Ali, M. 2005. Effect of changing groundwater levels caused by land-use changes on greenhouse gas fluxes from tropical peat lands. In: Nutrient Cycling in Agroecosystems, 71, 81-91.
Germer, J. &Sauerborn J. 2008.Estimation of the impact of oil palm plantation establishment on greenhouse gas
balance, Environment, Development and Sustainability, 10, 697-716.
Gibbs H.K., Johnston M., Foley J.A., Holloway T., Monfreda C., Ramankutty N., &Zaks D. 2008. Carbon payback times for crop-based biofuel expansion in the tropics: the effects of changing yield and technology. Environmental Research Letters, 2008, 3, 034001
Guerin, F.& Abril, G. 2007.Significance of pelagic aerobic methane oxidation in the methane and carbon budget of a tropical reservoir. Journal of Geoph Res Vol 112, GO3006, 14 PP., 2007 doi:10.1029/2006JG000393
Gunarso, P., Hartoyo, M. E., Agus, F., & Killeen, T. J. (2013). Oil palm and land use change in Indonesia, Malaysia
and Papua New Guinea. Reports from the Technical Panels of the Second RSPO GHG Working Group, Roundtable for Sustainable Oil palm–RSPO, Kuala Lumpur.
Hadi, A., Inubushi, K., Furukawa, Y., Purnomo, E., Rasmadi, M.&Tsurati, H. 2005. Greenhouse gas emissions from tropical peatlands of Kalimantan, Indonesia, Nutrient Cycling.Agro ecosystems, 71, 73-80.
Hansen, M. C., Stehman, S. V., Potapov, P. V., Arunarwati, B., Stolle, F., & Pittman, K. (2009). Quantifying
changes in the rates of forest clearing in Indonesia from 1990 to 2005 using remotely sensed data sets.Environmental Research Letters, 4(3), 034001.
Heil,A.,Langmann,B.,&Aldrian,E.(2006).Indonesianpeatandvegetationireemissions:studyonfactorsinluencinglarge-scalesmokehazepollutionusinga regional atmospheric chemistrymodel. Mitigation andadaptationstrategiesforglobalchange12,113-133.
Hirano,T.,Segah,H.,Harada,T.,Limin,S.,June,T.,Hirata,R.,&Osaki,M.(2007).CarbondioxidebalanceofatropicalpeatswampforestinKalimantan,Indonesia.GlobalChangeBiology13,412–425.
Hooijer,A.,Page,S., Canadell,J.G.,Silvius, M.,KwadijkJ.,Wösten,
H.,&Jauhiainen,J.(2010).CurrentandfutureCO2emissionsfromdrainedpeatlandsinSoutheast Asia.Biogeosciences,7,1–10.
Hooijer,A.,Silvius,M.,Wösten,H.,&Page,S.(2006).PEAT-
CO2,AssessmentofCO2emissionsfromdrainedpeatlandsinSEAsia.DelftHydraulicsReportQ3943 (http://peat-co2.deltares.nl).
Hooijer, A., Page, S., Jauhiainen, J., Lee, W. A., Lu, X. X., Idris, A., and Anshari, G, 2011: Subsidence and carbon
loss in drained tropical peatlands: reducing uncertainty and implications for CO2 emission reduction options, Biogeosciences Discuss., 8, 9311-9356, doi:10.5194/bgd-8-9311-2011.

Inubushi, K., Furukawa, Y., Hadi, A., Punomo, E.&Tsuruta, H. 2003. Seasonal changes of CO2, CH4 and N2O fluxes in relation to land-use change in tropical peatlands located in coastal area of South Kalimantan. Chemosphere, 52, 603-608.
IPCC(2007).Climatechange2007:TheAR4synthesisreport.Geneva,Switzerland:IntergovernmentalPanelonClimateChange(I
PCC).http://www.ipcc.ch,viewed21April2009. IPCC, 2006.IPCC guidelines for national greenhouse gas inventories. Geneva, Switzerland. Jauhiainen, J &Silvennoinen, S. 2012. Diffusion GHGfluxes at tropical peatland drainage canal watersurfaces,
Finnish Peatland Society, Suo 63(3–4): 93– 105 — Research articles, ISSN 0039-5471 JRC, 2011 here Kartodihardjo, H., &Supriono, A. (2000).The impact of sectoral development on natural forest conversion and
degradation: The case of timber and tree crop plantations in Indonesia (No. 26). Center for International Forestry Research.
Koh, L. P., Miettinen, J., Liew, S. C., &Ghazoul, J. (2011).Remotely sensed evidence of tropical peatland conversion to oil palm.Proceedings of the National Academy of Sciences, 108(12), 5127-5132.
Margono, B. A., Turubanova, S., Zhuravleva, I., Potapov, P., Tyukavina, A., Baccini, A., ...& Hansen, M. C. (2012). Mapping and monitoring deforestation and forest degradation in Sumatra (Indonesia) using Landsat time series data sets from 1990 to 2010. Environmental Research Letters, 7(3), 034010.
Melling, L., Hatano, R.& Goh, K.J. 2007. Nitrous oxide emissions from three ecosystems in tropical peatland of Sarawak, Malaysia. In: Soil Science and Plant Nutrition, 2007, 53, 729-805.
Melling, L., Hatano, R., Goh, K.J. 2005.Methane flux from three ecosystems in tropical peatland of Sarawak,
Malaysia. In: Soil Biology and Chemistry, 37, 2005, 1445-1453. Miettinen, J., Hooijer, A., Shi, C., Tollenaar, D. Vernimmen, R. Liew, S.C., Malins, C. & Page S.E. 2012a.
Historical Analysis and Projection of Oil Palm Plantation Expansion on Peatland in Southeast Asia.International Council on Clean Transportation, Washington, D.C.
Miettinen, J., Hooijer, A., Shi, C., Tollenaar, D., Vernimmen, R., Liew, S. C., ...& Page, S. E. 2012b. Extent of
industrial plantations on Southeast Asian peatlands in 2010 with analysis of historical expansion and future projections.GCB Bioenergy, 4(6), 908-918.
Morrogh-Bernard, H., Husson, S., Page, S. E., &Rieley, J. O. (2003). Population status of the Bornean orang utan (Pongopygmaeus) in the Sebangau peat swamp forest, Central Kalimantan, Indonesia. Biological Conservation 110, 141-152.
Murdiyarso, D., Hergoualc’h, K., &Verchot, L. V. (2010). Opportunities for reducing greenhouse gas emissions in tropical peatlands. Proceedings of the National Academy of Sciences, 107(46), 19655-19660.
Nykanen, H., Vasander, H., Huttunen, J.T.&Martikainen, P.J. 2002 Effect of experimental nitrogen load on methane and nitrous oxide fluxes on ombrotrophic boreal peatland. Plant and Soil, 242, 147-155
Omar at al., 2010 here. Page,
S.E.,Hoscilo,A.,Wösten,H.,Jauhiainen,J.,Silvius,M.,Rieley,J.,Ritzema,H.,Tansey,K.,Graham,L.,Vasander,H.,&Suwido, L. (2009).RestorationecologyoflowlandtropicalpeatlandsinSoutheastAsia:currentknowledgeand
futureresearchdirections.Ecosystems12,888-905. Page,S.E.,Rieley,J.O.,&Banks,C.J.(2011).Globalandregionalimportanceofthetropicalpeatlandcarbonpool.Global
ChangeBiology17,798–818. Page,S.E.,Rieley,J.O.,Shotyk,O.W.,&Weiss,D.(1999).Interdependenceofpeatandvegetationinatropicalpeatswampf
orest.PhilosophicalTransactionsoftheRoyalSocietyB:BiologicalSciences,345,1885–1897. Reijnders, L., &Huijbregts, M. A. J. (2008).Oil palm and the emission of carbon-based greenhouse
gases.Journal of cleaner production, 16(4), 477-482.
Rieley,J.O.,&Page,S.E.(eds).(2005).Wiseuseoftropicalpeatlands:focusofSoutheastAsia.ALTERRA–WageningenUniversityandResearchCentreandtheEUINCO–STRAPEATandRESTORPEATPartnership,Wageningen,TheNetherlands.
Scholes, R.J., Kendall, J.& Justice, C.O., 1996. The quantity of biomass burned in southern Africa. J. of
Geophysical Res. 101 (D19), 23, 667-23 676. Schrier-Uijl, A. P., Silvius, M., Parish, F., Lim, K. H., Rosediana, S., &Anshari, G.2013, Environmental and
Social Impacts of Oil Palm Cultivation on Tropical Peat,Reports from the Technical Panels of the 2nd Greenhouse Gas Working Group of the Roundtable on Sustainable Palm Oil (RSPO), Kuala Lumpur, Malaysia.
Schrier-Uijl, A.P., Veraart, A.J., Leffelaar, P.A., Berendse, F.&Veenendaal, E.M. 2011. Release of CO2 and
CH4 from lakes and drainage ditches in temperate wetlands.Biogeochemistry, doi:10.1007/s10533-010-9440-7.
Sheil, D., Casson, A., Meijaard, E., van Nordwijk, M. Gaskell, J., Sunderland-Groves, J., Wertz, K. and Kanninen, M. 2009. The impacts and opportunities of oil palm in Southeast Asia: What do we know and what do we need to know? Occasional paper no. 51.CIFOR, Bogor, Indonesia.
Siegert,F.,Ruecker,G.,Hinrichs,A.,&Hofmann,A.A.(2001).Increaseddamagefrom firesinloggedforestsduringdroughtscausedbyElNino.Nature414,437-440.
Someshwar, S., Boer, R. & Conrad, E. 2011. World Resources Report Case Study. Managing Peatland Fire
Risk in Central Kalimantan, Indonesia.”World Resources Report, Washington DC.
Teoh, C H. 2009. Key Sustainability Issues in the Oil palm Sector: A Discussion Paper for Multi-Stakeholders Consultations, World Bank and International Finance Corporation, Washington DC.
Ueda, S., Go, C.S., Yoshioka, T. 2000. Dynamics of dissolved O2, CO2, CH4, and N2O in tropical coastal swamp in southern Thailand. Biogeochemistry 49, pp 191-215.
Wahyunto, S. Ritungdan H. Subagjo (2003).Maps of Area of Peatland Distribution and Carbon Content in
Sumatera, 1990 – 2002. Wetlands International - Indonesia Programme& Wildlife Habitat Canada (WHC).
Wahyunto, S. Ritungdan H. Subagjo (2004).Map of Peatland Distribution Area and Carbon Content in Kalimantan, 2000 – 2002. Wetlands International - Indonesia Programme& Wildlife Habitat Canada (WHC).
Watanabe, A., Purwanto, B. H., Ando, H., Kakuda, K.-I., and Jong, F.-S. (2009). “Methane and CO2 fluxes from an Indonesian peatland used for sago palm (Metroxylon sagu Rottb.) cultivation: Effects of fertilizer and groundwater level management.” Agriculture, Ecosystems & Environment, 134, 14–18.

Wicke, B., Dornburg, V., Junginger, M. &Faaij. A. 2008. Different oil palm production systems for energy purposes and their greenhouse gas implications. Biomass and Bioenergy, 32, 1322-1337.
Wicke, B., Sikkema R., Dornburg, V., &Faaij, A. 2011. Exploring land use changes and the role of oil palm production in Indonesia and Malaysia, Land Use Policy, 193-206.