clear-sky shortwave surface radiation intensities over … · clear-sky shortwave surface radiation...
TRANSCRIPT
CLEAR-SKY SHORTWAVE SURFACE RADIATION INTENSITIES OVER THE GLOBE
Charles H. Whitlock Shashi K. Gupta Taiping Zhang
William S. Chandler Science Systems & Applications, Inc.
One Enterprise Parkway, Suite 200 Hampton, VA 23666
e-mail: [email protected]
Laura M. Hinkelman National Institute of Aerospace
100 Exploration Way Hampton, VA 23666
e-mail: [email protected]
Paul W. Stackhouse, Jr.
NASA Langley Research Center Hampton, VA 23681
e-mail: [email protected]
Charles N. Long DOE Pacific Northwest National Laboratory
P.O. 999, MSIN: K9-24 Richland, WA, 99352
e-mail: [email protected]
ABSTRACT Both the buildings and architectural industries desire improved "design-day" knowledge for clear-sky days. The information is useful for preliminary design studies of sustainable buildings with improved energy efficiency. This paper describes a study to obtain an improved knowledge of clear-sky broadband shortwave solar radiation when daily cloud fraction is less than 10 percent. Total, diffuse, and direct-beam radiation for the hottest month in each one-deg cell over the globe are provided. The global information is based on both measurements and validated analytical calculations from a number of national and international organizations. 1. SOURCES OF INFORMATION The NASA Prediction of World Energy Resources (POWER) project first became aware of long-term needs in the buildings industry at a meeting with a group of architects and engineers in 2001. An industry problem is the extended time it takes to obtain a complete set of broadband solar radiation and weather data during the short-time, preliminary-design competition period if the site is in a rural, underdeveloped area. Clear-sky results are based on NASA-developed broadband aerosol properties derived from MODIS 550 nm satellite data input to an assimilation process using 10 species of
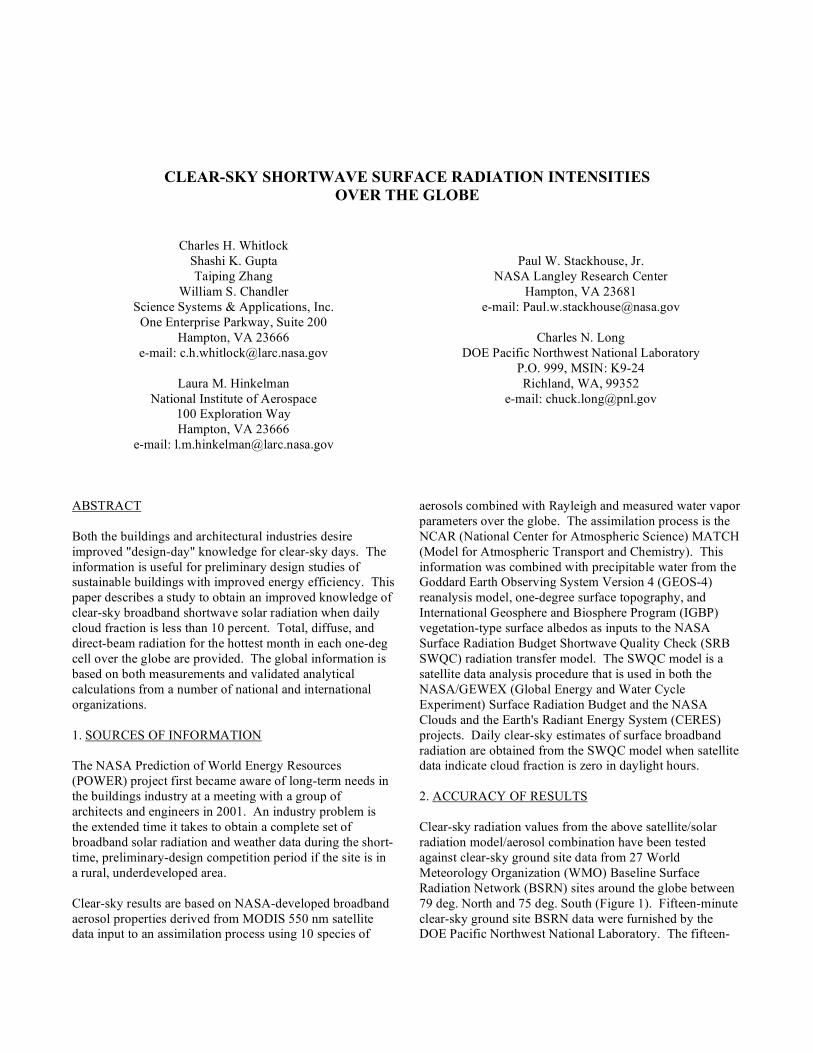
aerosols combined with Rayleigh and measured water vapor parameters over the globe. The assimilation process is the NCAR (National Center for Atmospheric Science) MATCH (Model for Atmospheric Transport and Chemistry). This information was combined with precipitable water from the Goddard Earth Observing System Version 4 (GEOS-4) reanalysis model, one-degree surface topography, and International Geosphere and Biosphere Program (IGBP) vegetation-type surface albedos as inputs to the NASA Surface Radiation Budget Shortwave Quality Check (SRB SWQC) radiation transfer model. The SWQC model is a satellite data analysis procedure that is used in both the NASA/GEWEX (Global Energy and Water Cycle Experiment) Surface Radiation Budget and the NASA Clouds and the Earth's Radiant Energy System (CERES) projects. Daily clear-sky estimates of surface broadband radiation are obtained from the SWQC model when satellite data indicate cloud fraction is zero in daylight hours. 2. ACCURACY OF RESULTS Clear-sky radiation values from the above satellite/solar radiation model/aerosol combination have been tested against clear-sky ground site data from 27 World Meteorology Organization (WMO) Baseline Surface Radiation Network (BSRN) sites around the globe between 79 deg. North and 75 deg. South (Figure 1). Fifteen-minute clear-sky ground site BSRN data were furnished by the DOE Pacific Northwest National Laboratory. The fifteen-
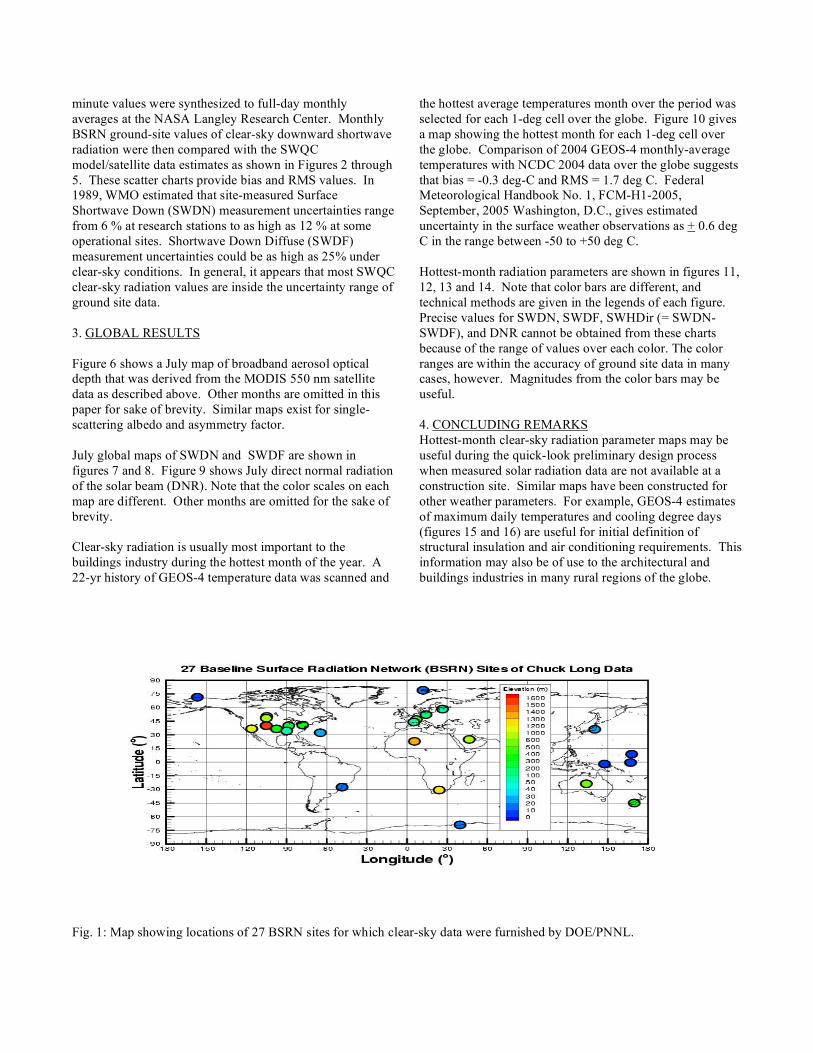
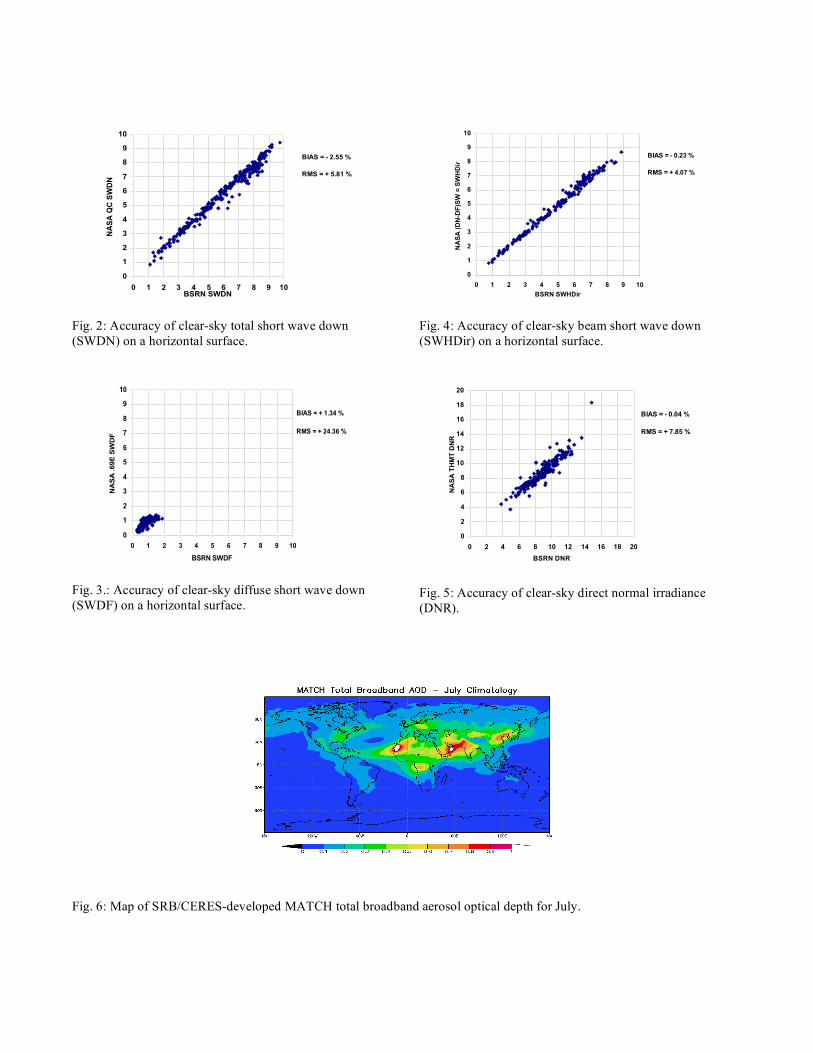
minute values were synthesized to full-day monthly averages at the NASA Langley Research Center. Monthly BSRN ground-site values of clear-sky downward shortwave radiation were then compared with the SWQC model/satellite data estimates as shown in Figures 2 through 5. These scatter charts provide bias and RMS values. In 1989, WMO estimated that site-measured Surface Shortwave Down (SWDN) measurement uncertainties range from 6 % at research stations to as high as 12 % at some operational sites. Shortwave Down Diffuse (SWDF) measurement uncertainties could be as high as 25% under clear-sky conditions. In general, it appears that most SWQC clear-sky radiation values are inside the uncertainty range of ground site data. 3. GLOBAL RESULTS Figure 6 shows a July map of broadband aerosol optical depth that was derived from the MODIS 550 nm satellite data as described above. Other months are omitted in this paper for sake of brevity. Similar maps exist for single-scattering albedo and asymmetry factor. July global maps of SWDN and SWDF are shown in figures 7 and 8. Figure 9 shows July direct normal radiation of the solar beam (DNR). Note that the color scales on each map are different. Other months are omitted for the sake of brevity. Clear-sky radiation is usually most important to the buildings industry during the hottest month of the year. A 22-yr history of GEOS-4 temperature data was scanned and
the hottest average temperatures month over the period was selected for each 1-deg cell over the globe. Figure 10 gives a map showing the hottest month for each 1-deg cell over the globe. Comparison of 2004 GEOS-4 monthly-average temperatures with NCDC 2004 data over the globe suggests that bias = -0.3 deg-C and RMS = 1.7 deg C. Federal Meteorological Handbook No. 1, FCM-H1-2005, September, 2005 Washington, D.C., gives estimated uncertainty in the surface weather observations as + 0.6 deg C in the range between -50 to +50 deg C. Hottest-month radiation parameters are shown in figures 11, 12, 13 and 14. Note that color bars are different, and technical methods are given in the legends of each figure. Precise values for SWDN, SWDF, SWHDir (= SWDN-SWDF), and DNR cannot be obtained from these charts because of the range of values over each color. The color ranges are within the accuracy of ground site data in many cases, however. Magnitudes from the color bars may be useful. 4. CONCLUDING REMARKS Hottest-month clear-sky radiation parameter maps may be useful during the quick-look preliminary design process when measured solar radiation data are not available at a construction site. Similar maps have been constructed for other weather parameters. For example, GEOS-4 estimates of maximum daily temperatures and cooling degree days (figures 15 and 16) are useful for initial definition of structural insulation and air conditioning requirements. This information may also be of use to the architectural and buildings industries in many rural regions of the globe.
Fig. 1: Map showing locations of 27 BSRN sites for which clear-sky data were furnished by DOE/PNNL.
0
1
2
3
4
5
6
7
8
9
10
0 1 2 3 4 5 6 7 8 9 10BSRN SWDN
NA
SA
QC
SW
DN
BIAS = - 2.55 %
RMS = + 5.81 %
Fig. 2: Accuracy of clear-sky total short wave down (SWDN) on a horizontal surface.
0
1
2
3
4
5
6
7
8
9
10
0 1 2 3 4 5 6 7 8 9 10
BSRN SWDF
NA
SA
.69E
SW
DF
BIAS = + 1.34 %
RMS = + 24.36 %
Fig. 3.: Accuracy of clear-sky diffuse short wave down (SWDF) on a horizontal surface.
0
1
2
3
4
5
6
7
8
9
10
0 1 2 3 4 5 6 7 8 9 10
BSRN SWHDir
NA
SA
(D
N-D
F)S
W =
SW
HD
ir
BIAS = - 0.23 %
RMS = + 4.07 %
Fig. 4: Accuracy of clear-sky beam short wave down (SWHDir) on a horizontal surface.
0
2
4
6
8
10
12
14
16
18
20
0 2 4 6 8 10 12 14 16 18 20
BSRN DNR
NA
SA
TH
MT
DN
R
BIAS = - 0.04 %
RMS = + 7.85 %
Fig. 5: Accuracy of clear-sky direct normal irradiance (DNR).
Fig. 6: Map of SRB/CERES-developed MATCH total broadband aerosol optical depth for July.
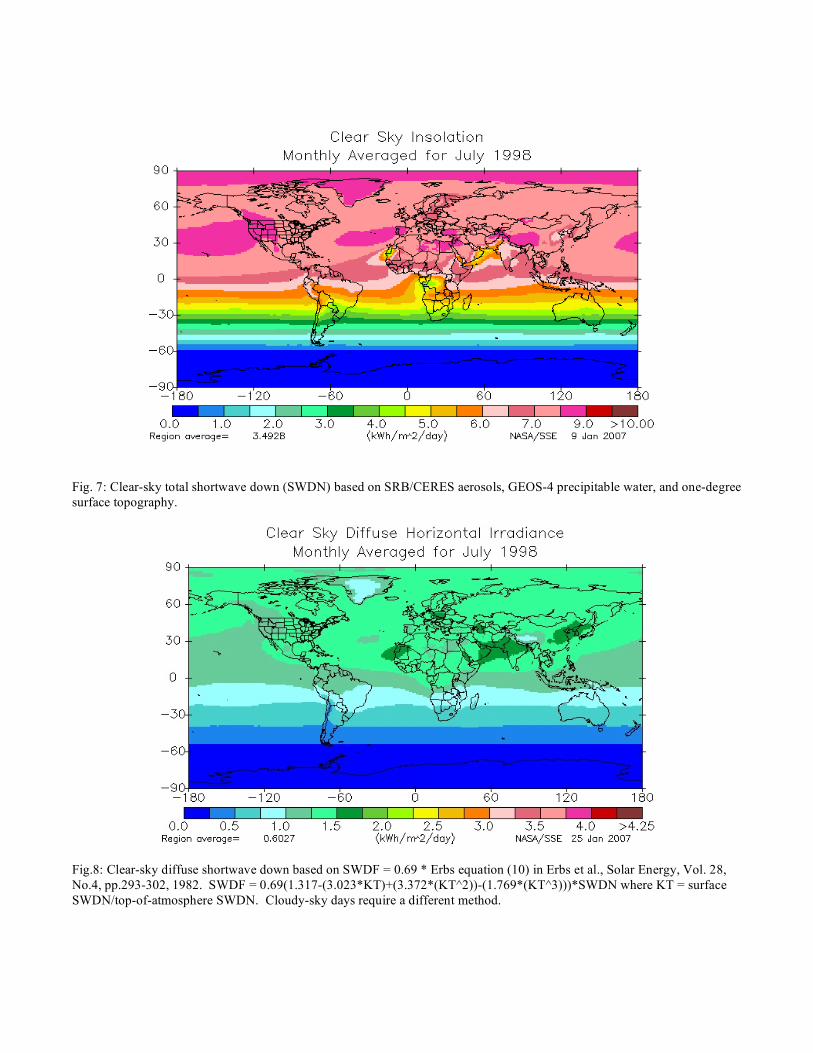
Fig. 7: Clear-sky total shortwave down (SWDN) based on SRB/CERES aerosols, GEOS-4 precipitable water, and one-degree surface topography.
Fig.8: Clear-sky diffuse shortwave down based on SWDF = 0.69 * Erbs equation (10) in Erbs et al., Solar Energy, Vol. 28, No.4, pp.293-302, 1982. SWDF = 0.69(1.317-(3.023*KT)+(3.372*(KT^2))-(1.769*(KT^3)))*SWDN where KT = surface SWDN/top-of-atmosphere SWDN. Cloudy-sky days require a different method.
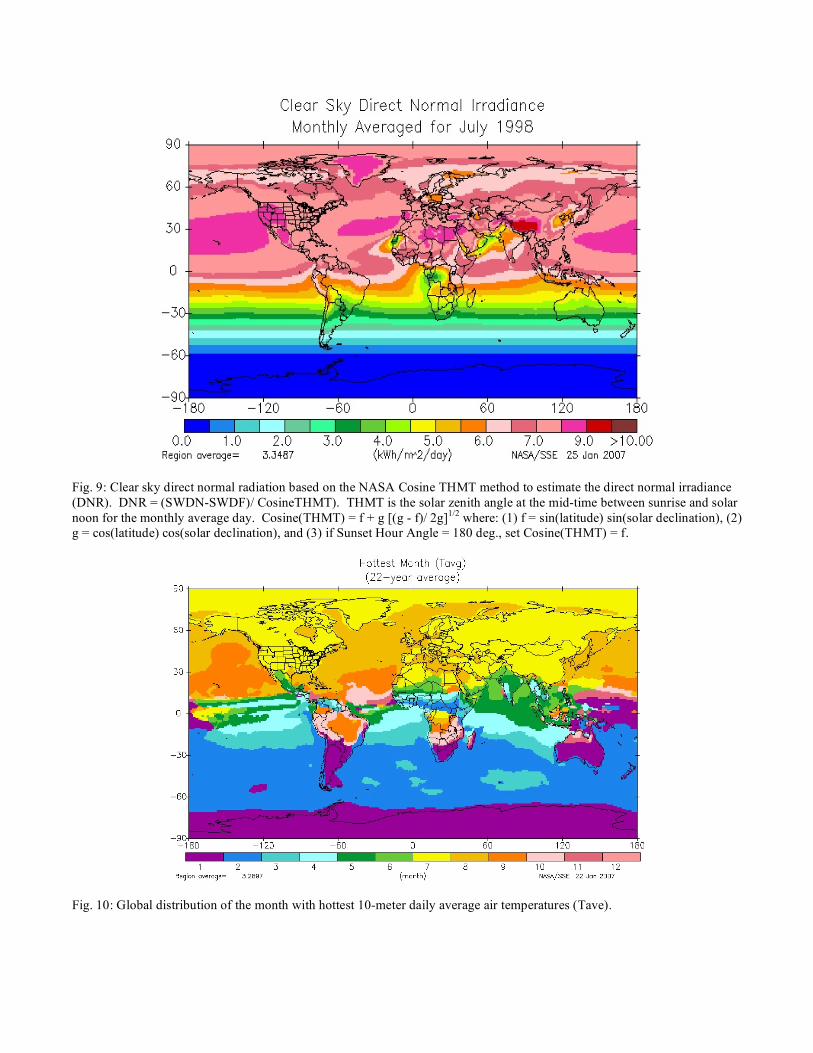
Fig. 9: Clear sky direct normal radiation based on the NASA Cosine THMT method to estimate the direct normal irradiance (DNR). DNR = (SWDN-SWDF)/ CosineTHMT). THMT is the solar zenith angle at the mid-time between sunrise and solar noon for the monthly average day. Cosine(THMT) = f + g [(g - f)/ 2g]1/2 where: (1) f = sin(latitude) sin(solar declination), (2) g = cos(latitude) cos(solar declination), and (3) if Sunset Hour Angle = 180 deg., set Cosine(THMT) = f.
Fig. 10: Global distribution of the month with hottest 10-meter daily average air temperatures (Tave).
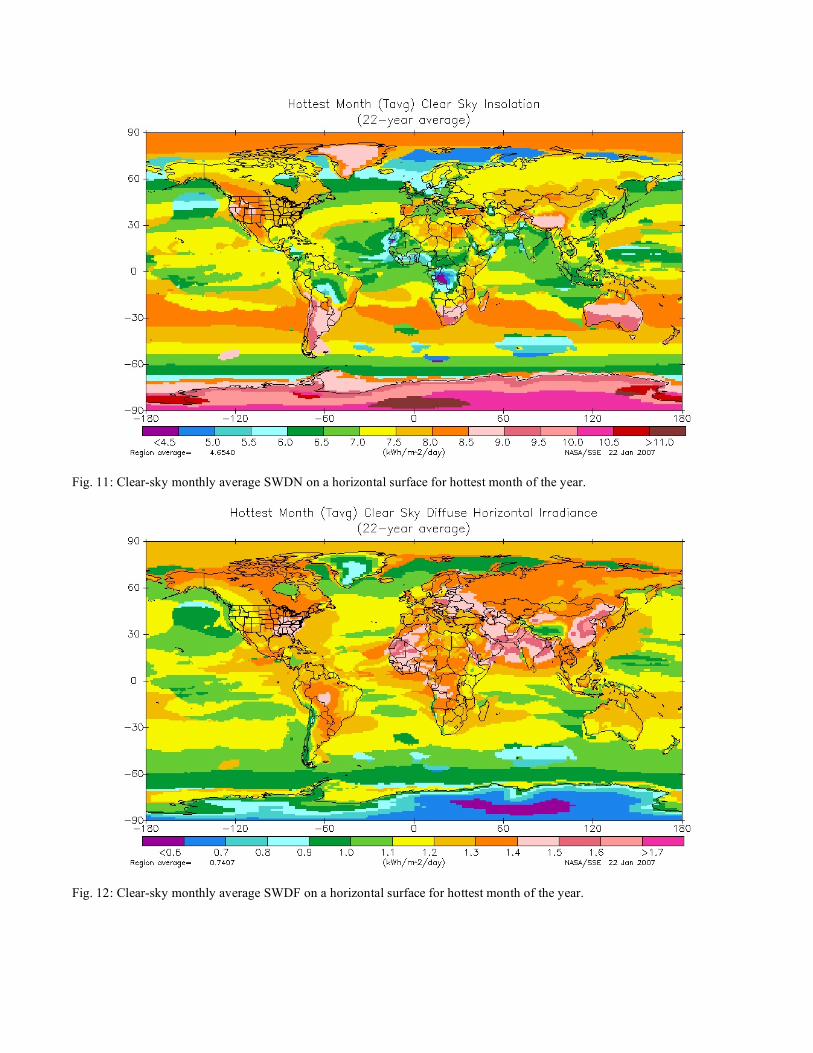
Fig. 11: Clear-sky monthly average SWDN on a horizontal surface for hottest month of the year.
Fig. 12: Clear-sky monthly average SWDF on a horizontal surface for hottest month of the year.
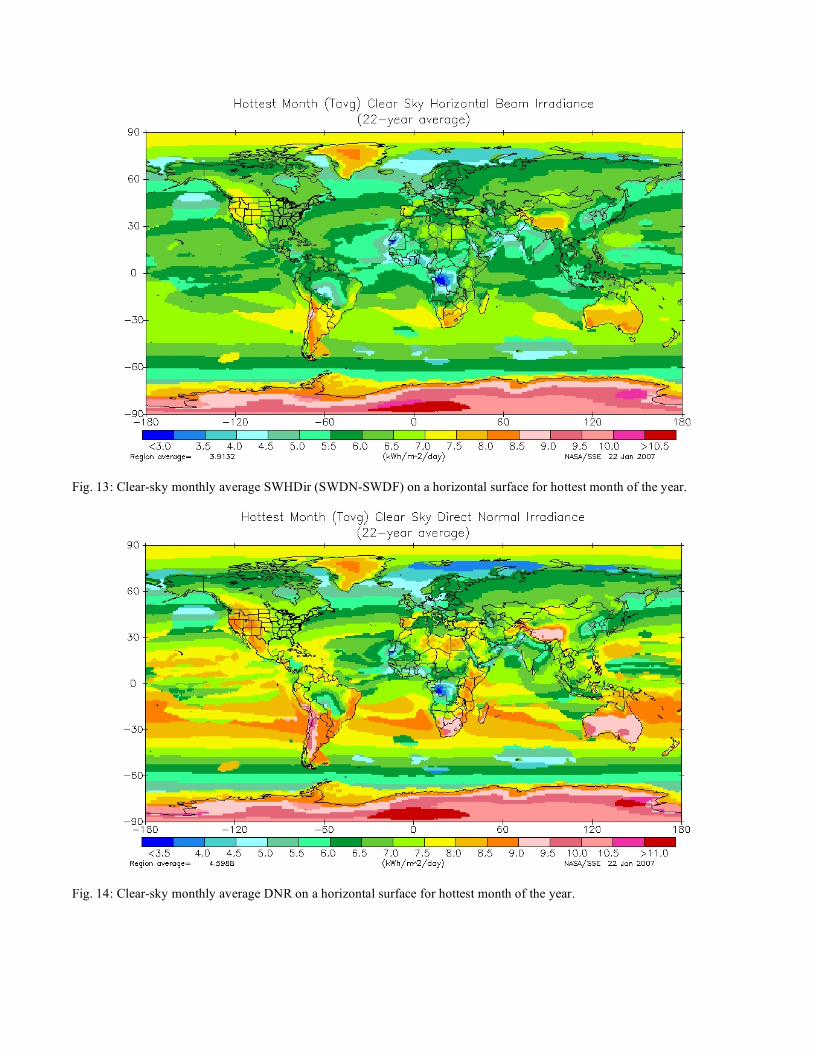
Fig. 13: Clear-sky monthly average SWHDir (SWDN-SWDF) on a horizontal surface for hottest month of the year.
Fig. 14: Clear-sky monthly average DNR on a horizontal surface for hottest month of the year.
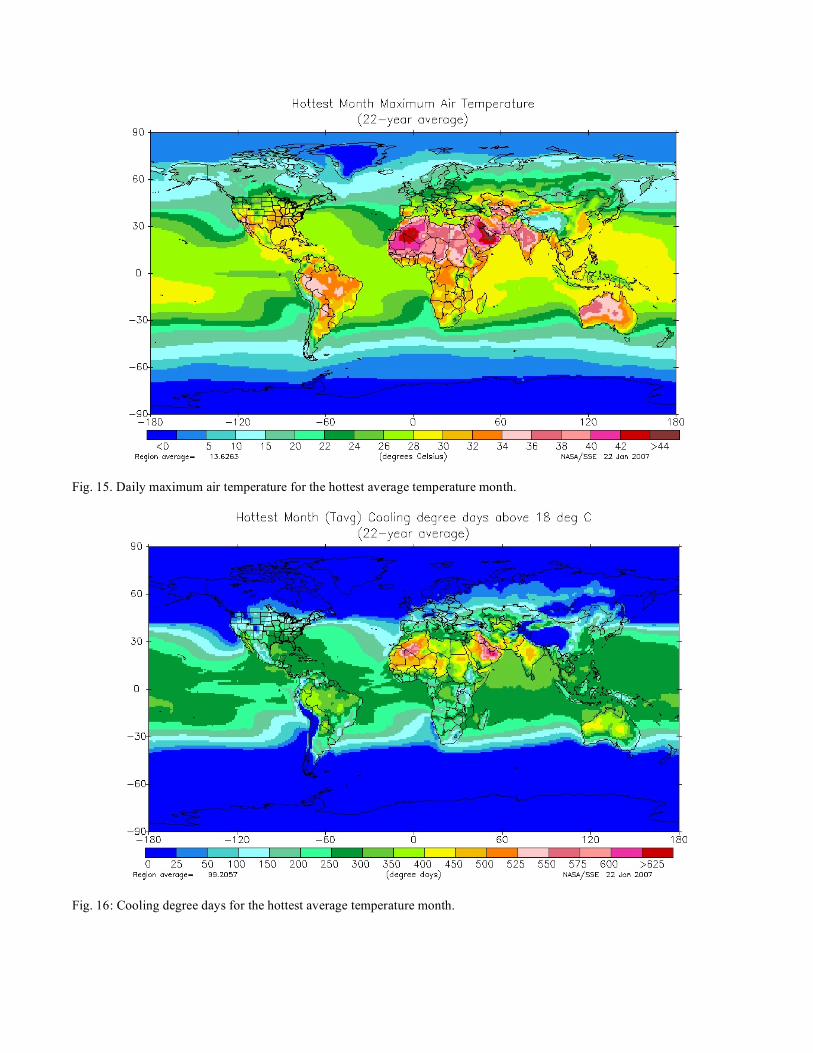
Fig. 15. Daily maximum air temperature for the hottest average temperature month.
Fig. 16: Cooling degree days for the hottest average temperature month.