classification of spanish autochthonous bovine breeds. morphometric study using classical and...
TRANSCRIPT

Livestock Science 143 (2012) 226–232
Contents lists available at SciVerse ScienceDirect
Livestock Science
j ourna l homepage: www.e lsev ie r .com/ locate / l ivsc i
Classification of Spanish autochthonous bovine breeds. Morphometric studyusing classical and heuristic techniques
E. Rodero a, A. González a,⁎, M. Luque b, M. Herrera a, J.C. Gutiérrez-Estrada c
a Departamento de Producción Animal, Campus de Rabanales, Universidad de Córdoba,Campus de Excelencia Internacional Agroalimentario CEIA3, 14071 Córdoba, Spainb Departamento Técnico, Federación Española de Asociaciones de Ganado Selecto (FEAGAS), C/Castelló 45 2° Izda., 28001 Madrid, Spainc Departamento de Ciencias Agroforestales, ETSI, Campus La Rábida, Universidad de Huelva, Campus de Excelencia Internacional Agroalimentario CEIA3, 21819 Palos dela Frontera (Huelva), Spain
a r t i c l e i n f o
⁎ Corresponding author.E-mail address: [email protected] (A. González).
1871-1413/$ – see front matter © 2011 Elsevier B.V. Adoi:10.1016/j.livsci.2011.09.022
a b s t r a c t
Article history:Received 4 April 2011Received in revised form 28 July 2011Accepted 26 September 2011
Six morphometric traits (height at withers, height at rump, chest depth, width at hips, width atpins and rump length) were analysed to characterise from a breed point of view 518 femalesfrom four autochthonous Andalusian cattle breeds (Berrenda en Colorado, Berrenda enNegro, Cárdena Andaluza and Negra Andaluza). Four methods (one classical and three heuris-tic) were used to distinguish between the four breeds by morphometric traits: DiscriminantFunction Analysis (DFA), Multilayer Perceptrons (MLPs) (a type of neural network), Probabi-listic Neural Networks (PNNs) and Support Vector Machines (SVMs). Results indicated notonly that DFA was overall inferior to the other three methods, but also that it could not beused to distinguish one breed from another when they were genetically very close or relatedin terms of breeding. MLP and SVM had similar ability to discriminate, both being betterthan PNN. Sensitivity analysis carried out on the models found to have the best discriminationpower indicated that the most important variables were: depth, height at rump and width atpins.
© 2011 Elsevier B.V. All rights reserved.
Keywords:Phenotypic characterisationMultivariate analysisDiscriminant function analysisArtificial neural networksSupport vector machines
1. Introduction
Although it is difficult to agree on a single widely acceptabledefinition of breed, it seems clear that the various definitions ofthe concept have a feature in common, namely, populationsthat are considered to be of the same breed have similar charac-teristics (in terms of morphology and production, amongothers), defining and setting themapart fromother groupswith-in the same species. Thence, the need to establish a series ofmor-phological characters that is related to and identifies each breedand may have the following functions: i) morphology as a crite-rion for describing a breed; ii) morphology as a criterion for dif-ferentiating between breeds; iii) morphology as a criterion foridentifying breeds and individuals; and iv) morphology as thebasis for distinguishing groups of animals and establishingbreeds (Sierra, 2009).
ll rights reserved.
Despite the fact that, in general, no breed classificationshould rely exclusively on biometric data, it is clear that theseplay a proxy or complementary role in the description of abreed (Parés i Casanova, 2009), in particular with regard tobreeds of farm animals. This is due to the effect of environmen-tal, geographical, physiological, nutritional and even pathologi-cal aspects of the morphological and phenotypic charactersthat identify a breed. In relation to this, analyses of morphomet-ric variables that are easy to measure makes it possible to ex-plore areas such as the structure of breeds, the degree ofvariability between various populations, the harmony of mor-phological models and the definition of morphological modelsfor given breeds (Herrera, 2007). Hence it is important to accu-rately analyse the morphological variables that enable us to dis-tinguish between breeds, as well as explore the use of variousdiscriminationmethods to assess the potential of eachof the var-iables under study.
In the context of farming, the issue of discriminating be-tween the various breeds using morphometric variables has
227E. Rodero et al. / Livestock Science 143 (2012) 226–232
been addressed by various authors in recent years. Herreraet al. (1996) and Luque et al. (2005) used classical discrimi-nant function analysis (DFA) (Lachenbruch, 1975) to differ-entiate between various Andalusian goat breeds. In all thesecases, the method was found to be relatively efficient andallowed differences between breeds and subpopulations tobe detected, as well as the relative distance between themto be assessed. Further, the variables with greatest power todifferentiate were identified enabling them to be weightedaccordingly. However, despite the statistically significant re-sults obtained in these studies, it is necessary to explorenew classification methods that may be more accurate fordistinguishing between breeds and allow a better under-standing of the involvement of each variable in the processof classification.
In recent years, comparisons of classical statistical and heu-ristic methods have generally shown better performance of thelatter type across a rangeof different science and engineering ap-plications. In the context of the differentiation of autochthonousbreeds, the DFA technique has not been comparedwith heuristicmethods like Artificial Neural Networks (ANNs), Fuzzy LogicClassification Functions (FLCFs) or Support Vector Machines(SVMs). In general, artificial neural networks, and particularlyMultilayer Perceptrons (MLPs) and Probabilistic Neural Net-works (PNNs), are well known techniques in some academicfields such as ecology (Goethals et al., 2007; Gutiérrez-Estradaand Bilton, 2010; Gutiérrez-Estrada et al., 2008; Lek and Guegan,1999; Lek et al., 1996), fisheries sciences (Gutiérrez-Estradaet al., 2007, 2009; Haralabous and Georgakarakos, 1996;Robotham et al., 2010), agricultural sciences (Pulido-Calvoand Gutiérrez-Estrada, 2009; Pulido-Calvo et al., 2003, 2007)and hydrology (Adamowski and Karapataki, 2010; Fernandoet al., 2009; Pulido-Calvo and Portela, 2007). On the otherhand, the Support Vector Machine (SVM) method is a relativelynew technique developed as a tool for recognising patterns ordiscriminating between groups (Haralabous andGeorgakarakos,1996; Vapnik, 1995). Therefore the main objective in this studywas the classification of four Andalusian authochthonous bovinebreed for what the performances of a classic DFA and three heu-ristic classification techniques (MLP, PNN and SVM)were evalu-ated. Also, as a second objective, we analysed theweight of eachmorphological variable in the discriminatory ability of themodel. The discrimination study was carried out using morpho-logical descriptors of four autochthonous cattle breeds: Berrendaen Colorado (BC), Berrenda en Negro (BN), Cárdena Andaluza(CA) and Negra Andaluza (NA.
2. Material and methods
2.1. Data collection and morphometric variables
The assessment of the morphological models was carriedout in a population of 518 cows belonging to these fourbreeds autochthonous to Andalusia: Berrenda en Colorado(n=179), Berrenda en Negro (n=214), Cárdena Andaluza(n=48) and Negra Andaluza (n=77). For each individualthe following morphometric variables, considered to bequantitative independent variables, were assessed: i) heightat withers (HW, cm); ii) height at rump (tuber coxae) (HR,cm); iii) chest depth (ChD, cm); iv) width at hips (WH,cm); v) width at pins (WP, cm); and vi) rump length (RL,
cm) (Alderson, 1999; Aparicio et al., 1986; Aparicio-Sánchez,1960; Rodero et al., 1994). Further, the ratios between HWand HR, and between WH and WP were considered as inde-pendent variables.
2.2. Classical discriminant function analysis (DFA)
Discriminant function analysis is a statistical techniquethat allows new individuals to be assigned to previouslyestablished or defined groups. The analysis is based on a setof data from n individuals for which p quantitative variableshave been measured (independent variables) as a profile foreach of them. On the other hand, an additional qualitativevariable (dependent variable), with two or more categoriesand defined by other means, groups each individual in a cat-egory. This produces an n×(p+1) table in which each casehas a profile and is assigned to one group. From this table, adiscriminant model is obtained to compare to the profile ofnew individuals. A complete description of the method canbe found in Dossa et al. (2007), Hair et al. (1999), Herreraet al. (1996), Lanari et al. (2003), Macciotta et al. (2002),Rodero et al. (2003), and Zaitoun et al. (2005) among others.
2.3. Artificial neural network models: MLP and PNN
Artificial neural networks (ANNs) are mathematicalmodels inspired by the neural architecture of the humanbrain. The most widely studied and used type is the multilay-er perceptron (MLP) (Rumelhart et al., 1986). These models‘learn’ in an iterative way, with the data set being presentedto the neural network the necessary number of times toreach a given level of error (each iteration in which all thedata set is presented to the MLP is known as an epoch).These supervised ANNs allow complex data sets to be ana-lysed and their non-linear separation into two or moregroups. A detailed description of MLP performance can befound in Czerwinski et al. (2007), Gutiérrez-Estrada et al.(2000, 2007), Pulido-Calvo and Portela (2007), and Tsoukalasand Uhrig (1997).
A typical three or four layer MLP has one input layer, oneor two hidden layers, and one output layer. The processingelements in each layer are called nodes or neurons. In ourcase, the input data to the MLP are morphological traits andthe output corresponds to the classification results (breed).The neurons are connected through a set of connections re-ferred to as weights, which are analogous to synapse strengthin biological neural nets. There are many MLP calibration orlearning methods. In this work the standard backpropagationalgorithm was applied and solved using STATISTICA®, theNeural Network software package from StatSoft (2005).
Probabilistic neural networks (PNNs) are another type ofANN (Specht, 1990). The neural network architecture forPNNs contains a sequence of layers: input layer (features ofbreeds), pattern layer (cattle breeds for calibration samples),summation layer (density function value by breed) and out-put layer (results of classification). The PNNmethod providesa general solution for classifying cattle breeds based on Bayesclassification technique. The idea is that, given a sample pat-tern, we can make a decision as to the most likely breed thatsample is taken from. PNNs use a probability density functionas the transfer function. The probability density function is
228 E. Rodero et al. / Livestock Science 143 (2012) 226–232
estimated using multi-dimensional kernels in the patternlayer. In our work, as in Rutkowski (2004), a Gaussian kernelwas used as the activation function; this being controlled forthe standard deviation, the width of the activation function.Thus, a PNN essentially constructs an estimate of the proba-bility density function of each breed (class) by adding togeth-er Gaussian curves located at each point in the calibration set.There is no training with PNN, in the sense that there is withMLP, since the set of weights are determined from the cali-bration data.
2.4. Support vector machines: SVM
The support vector machine method is a statistical classi-fication technique proposed by Vapnik (1995); it belongs tothe family of linear classifiers as it seeks to separate thespace of input characteristics by hyperplanes. At an algorith-mic level, the learning of SVM is modelled as a quadratic op-timization problem with linear constraints, the size of whichdepends on the dimension of the characteristic space.
To construct an optimal hyperplane, SVM employees aniterative training algorithm, which is used to minimise anerror function. Typically, when the objective is to classify cat-egorical variables the form of the error function can be classi-fied into two groups: Classification SVM Type 1 (also knownas C-SVM classification) and Classification SVM Type 2 (alsoknown as ρ-SVM classification). In this work, the classifica-tion SVM type used was C-SVM. For this type of SVM, traininginvolves the minimization of the error function:
12wTwþ C∑
N
i¼1δi
subject to the constraints:
yi wTφ xið Þ þ bh i
≥1−δi δi≥0; i ¼ 1;…;N
where C is the capacity constant, w is the vector of coeffi-cients, b is a constant and δi are parameters for handling non-separable data (inputs). The index i labels the N trainingcases. Note that y∈±1 is the class labels and xi is the inde-pendent variables. The kernel φ is used to transform datafrom the input (independent) to the feature space.
In order to find a classifier function using the support vec-tor machine, we must first determine what type of kernelfunction is going to be used, as this should reflect a prioriknowledge of the problem. If it seems that the data mightnot be linearly separable, for example, in our case we havetwo different breeds namely Berrenda en Colorado (BC) andBerrenda en Negro (BN) in which the height at withers ofthe individuals is very similar, kernel functions developedfor non-vectorial structures should be used (e.g., polynomial,Gaussian, sigmoidal, or inverse multiquadratic kernels). Onthe other hand, for classification, Gaussian kernels are widelyrecommended in the literature (e.g., Scholkopf and Smola,2002), since only the γ parameter of the kernel must be esti-mated and also, they tend to be more stable. Another param-eter that needs to estimated, whichever the kernel, is C; thisrepresents a trade-off between the size of the margin andthe training error.
2.5. Data processing: calibration and testing samples
The general procedure employed for the calibration andtesting of DFA, MLP, PNN and SVM is outlined in Fig. 1. Beforethe calibration of any model the data set was randomly divid-ed in two subsets: the first one (calibration subset, CS) wascomposed of 75% of total patterns and the second one (testsubset, TS) was composed of 25% remaining. In the case ofMLP, 25% of calibration subset was selected as control or se-lect subset (also randomly selected) to avoid overtrainingphenomena.
For each model and configuration, the previous procedurewas carried out 30 times (Iyer and Rhinehart, 1999). There-fore, we adopted a K-Fold cross validation method with ran-domly selected subset. Once each model and configurationwere calibrated and tested a model ensemble process wascarried out. Ensemble is the most important means of com-bating the over-calibration and improving the generalisationcapacity of the models (Watts and Worner, 2008). The bestapproach was then selected as the ensemble with the smal-lest error in the validation phase.
Obviously, each technique has different features whichdepend on their mathematical natures. For example, forMLP is necessary know the number of hidden layers andthe number of neurons by layer. Therefore different proce-dures were conducted to reach the optimum configurationof each model. This way, for MLP one and two hidden layerswere tested and the number of neurons in each hiddenlayer oscillated between 5 and 20.
In the case of PNN, as noted above, there is no trainingphase (in the sense of that is required for the MLP method)since all the network parameters (units and weights) are de-termined directly from the calibration data. In our study,smoothing factors (variance) between 0.1 and 0.3 wereused; the value of this variance controlling the width of theactivation function (Gaussian curve).
For the SVM method, two parameters need to be estimat-ed: C representing the trade-off between the size of the mar-gin and the calibration error, and γ representing theparameter of the Gaussian kernel. There is no single acceptedprocedure for estimating these two parameters. In this study,we investigated all the combinations of parameters in therange [1, 500] with step sizes of 50 (in the case of C) and inthe range [0.05, 10] with step sizes of 0.05 (for γ). Each trialconsisted of 100 experiments with the same set of parame-ters (C,γ) and the average classification error for the testingdata was calculated. In each of the iteration, the data setbeing used for calibration and testing changed, i.e., eachtime 75% of the data were chosen at random for calibrationand the remaining 25% were used for testing and calculatingthe classification errors. Once the best values for the parame-ters (C,γ) were found, smaller ranges were explored aroundthese values, with step sizes of 0.01 for γ and 1 for C. Thesame 30 calibration and testing samples used with the restof techniques was then used with the best pair of values forC and γ.
2.6. Data processing: multi-class SVM
Support vector machines (SVM) were originally designedfor binary classification. However, they can also be used for
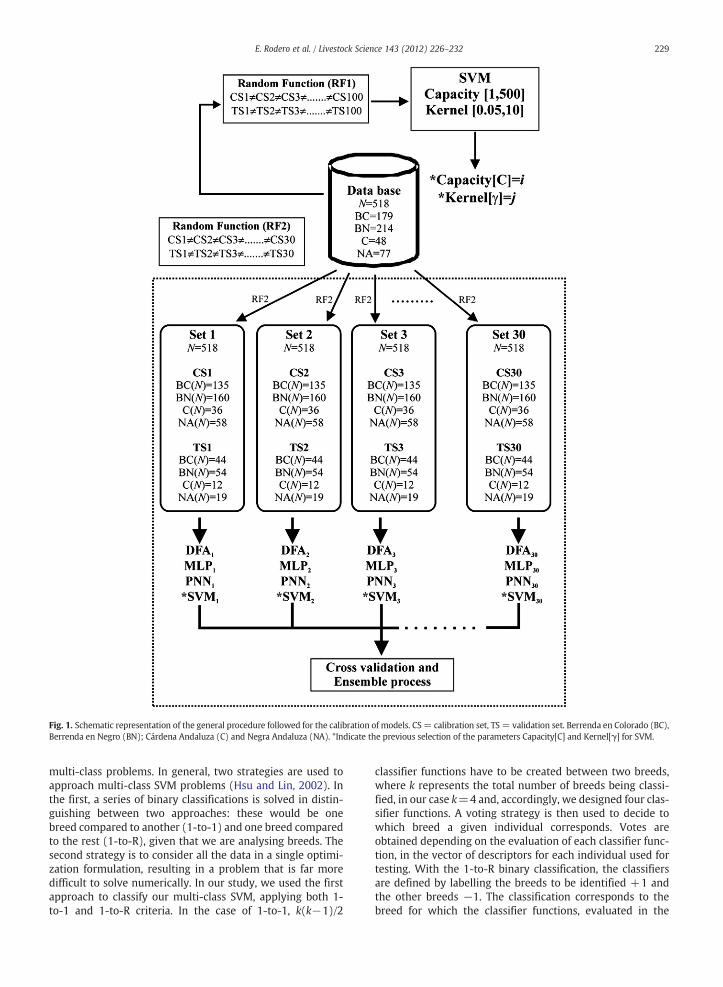
Fig. 1. Schematic representation of the general procedure followed for the calibration of models. CS= calibration set, TS = validation set. Berrenda en Colorado (BC),Berrenda en Negro (BN); Cárdena Andaluza (C) and Negra Andaluza (NA). *Indicate the previous selection of the parameters Capacity[C] and Kernel[γ] for SVM.
229E. Rodero et al. / Livestock Science 143 (2012) 226–232
multi-class problems. In general, two strategies are used toapproach multi-class SVM problems (Hsu and Lin, 2002). Inthe first, a series of binary classifications is solved in distin-guishing between two approaches: these would be onebreed compared to another (1-to-1) and one breed comparedto the rest (1-to-R), given that we are analysing breeds. Thesecond strategy is to consider all the data in a single optimi-zation formulation, resulting in a problem that is far moredifficult to solve numerically. In our study, we used the firstapproach to classify our multi-class SVM, applying both 1-to-1 and 1-to-R criteria. In the case of 1-to-1, k(k−1)/2
classifier functions have to be created between two breeds,where k represents the total number of breeds being classi-fied, in our case k=4 and, accordingly, we designed four clas-sifier functions. A voting strategy is then used to decide towhich breed a given individual corresponds. Votes areobtained depending on the evaluation of each classifier func-tion, in the vector of descriptors for each individual used fortesting. With the 1-to-R binary classification, the classifiersare defined by labelling the breeds to be identified +1 andthe other breeds −1. The classification corresponds to thebreed for which the classifier functions, evaluated in the
230 E. Rodero et al. / Livestock Science 143 (2012) 226–232
vector of descriptors for each individual used for testing, hadthe highest value.
2.7. Sensitivity analysis
The sensitivity analysis was carried out by replacing eachvariable (descriptor) by missing values and assessing the ef-fect of this on the output error. Subsequently, the new errorcalculated was compared with the original error to obtain aratio (error of the model with a variable with missing values/error of themodel with all variables complete). For a given var-iable, a ratio with close or equal to 1 indicates that this variablehas a very low weight in the general structure of the model(Hunter et al., 2000).
3. Results and discussion
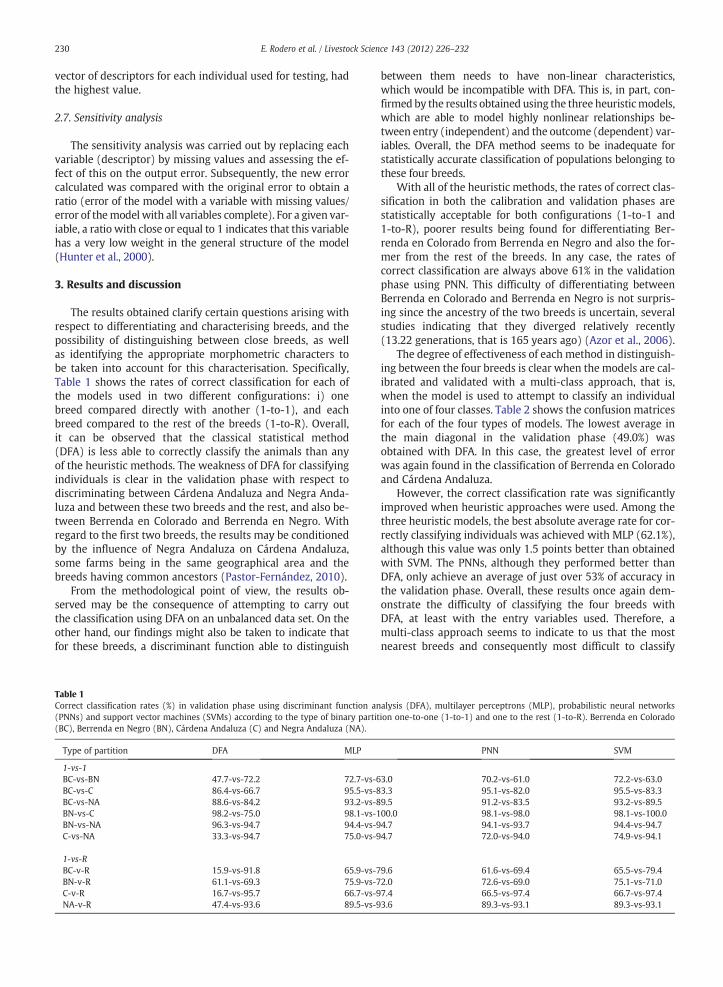
The results obtained clarify certain questions arising withrespect to differentiating and characterising breeds, and thepossibility of distinguishing between close breeds, as wellas identifying the appropriate morphometric characters tobe taken into account for this characterisation. Specifically,Table 1 shows the rates of correct classification for each ofthe models used in two different configurations: i) onebreed compared directly with another (1-to-1), and eachbreed compared to the rest of the breeds (1-to-R). Overall,it can be observed that the classical statistical method(DFA) is less able to correctly classify the animals than anyof the heuristic methods. The weakness of DFA for classifyingindividuals is clear in the validation phase with respect todiscriminating between Cárdena Andaluza and Negra Anda-luza and between these two breeds and the rest, and also be-tween Berrenda en Colorado and Berrenda en Negro. Withregard to the first two breeds, the results may be conditionedby the influence of Negra Andaluza on Cárdena Andaluza,some farms being in the same geographical area and thebreeds having common ancestors (Pastor-Fernández, 2010).
From the methodological point of view, the results ob-served may be the consequence of attempting to carry outthe classification using DFA on an unbalanced data set. On theother hand, our findings might also be taken to indicate thatfor these breeds, a discriminant function able to distinguish
Table 1Correct classification rates (%) in validation phase using discriminant function an(PNNs) and support vector machines (SVMs) according to the type of binary parti(BC), Berrenda en Negro (BN), Cárdena Andaluza (C) and Negra Andaluza (NA).
Type of partition DFA MLP
1-vs-1BC-vs-BN 47.7-vs-72.2 72.7-vs-6BC-vs-C 86.4-vs-66.7 95.5-vs-8BC-vs-NA 88.6-vs-84.2 93.2-vs-8BN-vs-C 98.2-vs-75.0 98.1-vs-1BN-vs-NA 96.3-vs-94.7 94.4-vs-9C-vs-NA 33.3-vs-94.7 75.0-vs-9
1-vs-RBC-v-R 15.9-vs-91.8 65.9-vs-7BN-v-R 61.1-vs-69.3 75.9-vs-7C-v-R 16.7-vs-95.7 66.7-vs-9NA-v-R 47.4-vs-93.6 89.5-vs-9
between them needs to have non-linear characteristics,which would be incompatible with DFA. This is, in part, con-firmed by the results obtained using the three heuristicmodels,which are able to model highly nonlinear relationships be-tween entry (independent) and the outcome (dependent) var-iables. Overall, the DFA method seems to be inadequate forstatistically accurate classification of populations belonging tothese four breeds.
With all of the heuristic methods, the rates of correct clas-sification in both the calibration and validation phases arestatistically acceptable for both configurations (1-to-1 and1-to-R), poorer results being found for differentiating Ber-renda en Colorado from Berrenda en Negro and also the for-mer from the rest of the breeds. In any case, the rates ofcorrect classification are always above 61% in the validationphase using PNN. This difficulty of differentiating betweenBerrenda en Colorado and Berrenda en Negro is not surpris-ing since the ancestry of the two breeds is uncertain, severalstudies indicating that they diverged relatively recently(13.22 generations, that is 165 years ago) (Azor et al., 2006).
The degree of effectiveness of each method in distinguish-ing between the four breeds is clear when the models are cal-ibrated and validated with a multi-class approach, that is,when the model is used to attempt to classify an individualinto one of four classes. Table 2 shows the confusion matricesfor each of the four types of models. The lowest average inthe main diagonal in the validation phase (49.0%) wasobtained with DFA. In this case, the greatest level of errorwas again found in the classification of Berrenda en Coloradoand Cárdena Andaluza.
However, the correct classification rate was significantlyimproved when heuristic approaches were used. Among thethree heuristic models, the best absolute average rate for cor-rectly classifying individuals was achieved with MLP (62.1%),although this value was only 1.5 points better than obtainedwith SVM. The PNNs, although they performed better thanDFA, only achieve an average of just over 53% of accuracy inthe validation phase. Overall, these results once again dem-onstrate the difficulty of classifying the four breeds withDFA, at least with the entry variables used. Therefore, amulti-class approach seems to indicate to us that the mostnearest breeds and consequently most difficult to classify
alysis (DFA), multilayer perceptrons (MLP), probabilistic neural networkstion one-to-one (1-to-1) and one to the rest (1-to-R). Berrenda en Colorado
PNN SVM
3.0 70.2-vs-61.0 72.2-vs-63.03.3 95.1-vs-82.0 95.5-vs-83.39.5 91.2-vs-83.5 93.2-vs-89.500.0 98.1-vs-98.0 98.1-vs-100.04.7 94.1-vs-93.7 94.4-vs-94.74.7 72.0-vs-94.0 74.9-vs-94.1
9.6 61.6-vs-69.4 65.5-vs-79.42.0 72.6-vs-69.0 75.1-vs-71.07.4 66.5-vs-97.4 66.7-vs-97.43.6 89.3-vs-93.1 89.3-vs-93.1

Table 2Confusion matrices for multi-class classifications. Percentages of successfulrecognitions by breed in the validation phase. Berrenda en Colorado (BC),Berrenda en Negro (BN), Cárdena Andaluza (C) and Negra Andaluza (NA).
Breed BC BN C NA
DFA classification (average rate in the validation set=49.0%)BC 34.1 47.7 6.8 11.4BN 29.6 68.5 0.0 1.9C 41.7 0.0 25.0 33.3NA 10.5 5.3 15.8 68.4
Multilayer perceptron (MLP; 8-20-1) classification (average rate in the val-idation set=62.1%)
BC 51.3 38.5 7.7 2.6BN 31.0 65.5 0.0 3.5C 14.3 0.0 71.4 14.3NA 20.0 4.0 16.0 60.0
Probabilistic neural network (PNN; λ=0.3) classification (average rate inthe validation set=53.4%)
BC 43.6 46.2 7.7 2.6BN 34.5 58.6 1.7 5.2C 14.3 0.0 71.4 14.3NA 16.0 1.0 40.0 40.0
Support vector machine (SVM; C=100; γ=0.1) classification (averagerate in the validation set=60.6%)
BC 48.7 41.0 7.7 2.6BN 34.5 62.0 0.0 3.5C 14.3 0.0 71.4 14.3NA 20.0 4.0 16.0 60.0
Table 4Variation coefficients of each morphological trait analysed. Berrenda en Col-orado (BC), Berrenda en Negro (BN), Cárdena Andaluza (C) and Negra Anda-luza (NA).
Descriptor BC BN C NA
Height at withers (HW) 3.78 4.92 2.88 5.57Height at rump (HR) 4.14 4.90 2.64 5.25Chest depth (ChD) 15.31 13.82 7.30 20.57Width at hips (WH) 8.88 11.02 7.37 6.38Width at pins (WP) 24.55 26.89 26.07 14.58Rump length (RL) 8.94 7.89 7.13 6.00
231E. Rodero et al. / Livestock Science 143 (2012) 226–232
are Berrenda en Colorado and Cárdena Andaluza. This effectalso can be observed between Cárdena Andaluza and NegraAndaluza although in a less pronounced form. This seems tocorroborate the preliminary and not yet published resultsobtained with analysis of DNA molecular markers for thesame breeds which show a very close genetic proximity be-tween Berrenda en Colorado y Berrenda en Negro and avery marked genetic distance between Negra Andaluza andthe rest of breeds.
Table 3 shows the result of the sensitivity analysis for eachof the heuristic methods. As can be observed the twomethods with the best average rate of classification (MLPand SVM), weight most variables in similar way. In particular,for both these models, the variable given the greatest weightis ChD, followed byWP and HR with the MLP, and HR andWPwith the SVM method. Moreover, the same trend was ob-served with the PNN method. The effects of the HR–WP andHR–HW ratios are clearly non-significant, probably due tothe fact that the underlying information is already contained
Table 3Values of (1-Ratio) expressed in percentage. Each value indicates the in-creasing of error when the variable is removed. Ranking in brackets.
Descriptor MLP PNN SVM
Height at withers (HW) 6.00 (4) 6.51 (4) 5.98 (4)Height at rump (HR) 7.57 (3) 8.57 (2) 7.60 (2)Chest depth (ChD) 15.58 (1) 11.58 (1) 17.2 (1)Width at hips (WH) 3.31 (6) 3.65 (6) 2.99 (7)Width at pins (WP) 7.70 (2) 6.23 (5) 7.51 (3)Rump length (LG) 3.24 (7) 3.32 (7) 3.01 (6)HR-HW 2.38 (8) 2.00(8) 2.58 (8)WH-WP 5.60 (5) 6.70 (3) 5.70 (5)
in others of the variables used. These variables seems to beassociated with greater variability, at least with respect tothe two most heavily weighted variables, as can be seen inTable 4 (Rodero et al., 2008). On the other hand, HR (rankedthird in MLP; and second in SVM) shows lower variability,which may indicate the need for further analysis of the rela-tionship between co-variables, as well as of the input vari-ables used in the models.
4. Conclusion
There is no universal method for characterising and classify-ing breeds usingmorphological characteristics. In this paper, wepresent the results of a study attempting to classify four cattlebreeds autochthonous to Andalusia using a classical statisticalmethod and three heuristic methods. Our results demonstratethat when analysing data from autochthonous breeds, not sub-ject to generations of selective pressure imposed by humansaiming to improve production, classification using linearmethods is not possible or at least not efficient, probably dueto non-linear relationships between the independent and de-pendent variables. Therefore, in these cases, we have to employmore powerful classification procedures (such as heuristicmodels) that allow for non-linear relationships in the modellingprocess. Among the heuristic models used, we particularly rec-ommend the MLP and SVM methods since they have shown tobe effective during the generalisation of the model.
On the other hand, although sensitivity analysis identifieda similar pattern in the models with greater discriminationability, further research is needed to deepen our understand-ing of the relationships between the co-variables as well asthe causal relationships.
Finally, the results shown in this study indicate that theheuristic models, particularly multilayer perceptron neuralnetworks and support vector machines, could be a promisingtool for phenotypic characterisation, mainly for those coun-tries needing to make comparisons between different breedsand who do not have financing channels and technologiessuch as molecular markers (FAO, 1992, 2010a, 2010b).
Acknowledgements
This project has been possible thanks to the funding for INIAprojects from the SpanishMinistry of Agriculture (RZ00-017 andRZ2004-00013-00-00). We also want to thank the Federation ofAssociations of ‘Raza Berrenda en Negro’ and ‘Raza Berrenda enColorado’ Cattle Breeders (ANABE) and also the Association for‘Raza Cárdena Andaluza’ Cattle Breeders for their support.
232 E. Rodero et al. / Livestock Science 143 (2012) 226–232
References
Adamowski, J., Karapataki, C., 2010. Comparison of multivariate regressionand artificial neural networks for peak urban water-demand forecasting:evaluation of different ANN learning algorithms. J. Hydrol. Eng. 15 (10),729–744.
Alderson, G.L.H., 1999. The development of a system of linear measurementto provide an assessment of type and function of beef cattle. Anim. Res.Inf. 25, 45–56.
Aparicio, M.J.B., Del Castillo, J., Herrera, M., 1986. Características estructur-ales del caballo español tipo Andaluz. Consejo Superior de Investiga-ciones Científicas, Madrid, Spain. (in Spanish).
Aparicio-Sánchez, G., 1960. Zootecnia especial. Etnología Comprendida, 4ª.Ed. Imprenta moderna, Córdoba, Spain. (in Spanish).
Azor, P.J., Rodero, E., Luque, M., González, A., Valera, M., Rodero, A., Molina,A., 2006. Algunas consideraciones sobre el proceso de formación de lasrazas bovinas andaluzas a partir de datos moleculares. V Encuentro deCientíficos y Docentes Zooetnólogos Españoles, Sociedad Española deZooetnología, Córdoba, Spain. (in Spanish).
Czerwinski, I.A., Gutiérrez-Estrada, J.C., Hernando-Casal, J.A., 2007. Short-term forecasting of halibut CPUE: linear and non-linear univariate ap-proaches. Fish. Res. 86, 120–128.
Dossa, L.H., Wollny, C., Gauly, M., 2007. Spatial variation in goat populationsfrom Benin as revealed by multivariate analysis of morphological traits.Small Rum. Res. 73 (1–3), 150–159.
FAO, 1992. The Management of Global Animal Genetic Resources. FAO Ani-mal Production and Health Paper No 104 FAO, Rome.
FAO, 2010a. Draft Guidelines for Molecular Characterization of Animal Ge-netic Resources for Food Agriculture. FAO, Rome.
FAO, 2010b. Draft Guidelines of Phenotypic Characterization. FAO, Rome.Fernando, T.M.K.G., Maier, H.R., Dandy, G.C., 2009. Selection of input vari-
ables for data driven models: an average shifted histogram partial mutu-al information estimator approach. J. Hydrol. 367, 165–176.
Goethals, P.L.M., Dedecker, A.P., Gabriels, W., Lek, S., De Pauw, N., 2007. Ap-plications of artificial neural networks predicting macroinvertebrates infreshwaters. Aquat. Ecol. 41, 491–508.
Gutiérrez-Estrada, J.C., Bilton, D.T., 2010. A heuristic approach to predictingwater beetle diversity in temporary and fluctuating waters. Ecol.Model. 221, 1451–1462.
Gutiérrez-Estrada, J.C., Pulido-Calvo, I., Prenda, J., 2000. Gonadosomaticindex estimates of an introduced pumpkinseed (Lepomis gibbosus) pop-ulation in a Mediterranean stream, using computational neural net-works. Aquat. Sci. 62, 350–363.
Gutiérrez-Estrada, J.C., Silva, C., Yáñez, E., Rodríguez, N., Pulido-Calvo, I., 2007.Monthly catch forecasting of anchovy Engraulis ringens in the north areaof Chile: non-linear univariate approach. Fish. Res. 86, 188–200.
Gutiérrez-Estrada, J.C., Vasconcelos, R., Costa, M.J., 2008. Estimating fishcommunity diversity from environmental features in the Tagus estuary(Portugal): multiple linear regression and artificial neural network ap-proaches. J. Appl. Ichthyol. 24, 150–162.
Gutiérrez-Estrada, J.C., Yáñez, E., Pulido-Calvo, I., Silva, C., Plaza, F., Bórquez,B., 2009. Pacific sardine (Sardinops sagax, Jenyns 1842) landings predic-tion. A neural network ecosystemic approach. Fish. Res. 100, 116–125.
Hair, J.F., Anderson, R.E., Tatham, R.L., Black, W.C., 1999. Multivariate DataAnalysis, 5ª Ed. Prentice Hall International, Inc., Upper Saddle Rives,New Jersey, USA.
Haralabous, J., Georgakarakos, S., 1996. Artificial neural networks as a toolfor species identification of fish schools. ICES J. Mar. Sci. 53, 173–180.
Herrera, M., 2007. Metodología de caracterización zooetnológica. La ganaderíaandaluza en el siglo XXI, patrimonio ganadero andaluz I, pp. 435–448(in Spanish).
Herrera, M., Rodero, E., Gutiérrez, M.J., Peña, F., Rodero, J.M., 1996. Applica-tion of multifactorial discriminant analysis in the morphostructural dif-ferentiation of Andalusian caprine breeds. Small Rum. Res. 22, 39–47.
Hsu, C.W., Lin, C.J., 2002. A comparison of methods for multi-class supportvector machines. IEEE Trans. Neural Netw. 13, 415–425.
Hunter, A., Kennedy, L., Henry, J., Ferguson, I., 2000. Application of neural net-works and sensibility analysis to improved prediction of trauma survival.Comput. Meth. Programs Biomed. 62, 11–19.
Iyer, M., Rhinehart, R., 1999. A method to determine the required number ofneural network training repetitions. IEEE Trans. Neural Netw. 10 (2),427–432.
Lachenbruch, P.A., 1975. Discriminant Analysis. Hafner Press, New York, USA.Lanari, M.R., Taddeo, H., Domingo, E., Pérez-Centeno, M., Gallo, L., 2003. Phe-
notypic differentiation of exterior traits in local Criollo goat populationin Patagonia (Argentina). Arch. Tierzucht 46 (4), 347–356.
Lek, S., Guegan, J.F., 1999. Artificial neural networks as a tool in ecologicalmodeling. An introduction. Ecol. Model. 120, 65–73.
Lek, S., Delacoste, M., Baran, P., Lauga, J., Aulagnier, S., 1996. Application ofneural network for modeling in ecology. Ecol. Model. 90, 39–52.
Luque, M., Rodero, E., Peña, F., García, A., Sierra, I., Herrera, M., 2005. Appli-cation of discriminant analysis to the morphostructural differentiationof 7 extensive goat breeds. Annual Meeting of European Federation ofAnimal Science, Uppsala, Sweden.
Macciotta, N.P.P., Cappio-Borlino, A., Steri, R., Pulina, G., Brandano, P., 2002. So-matic variability of Sarda goat breed analysed by multivariate methods.Livest. Prod. Sci. 75 (1), 51–58.
Parés i Casanova, P.M., 2009. Zoometría. Valoraciónmorfológica de los animalesdomésticos. Minist. Medio Ambiente Medio Rural Mar. 6, 171–196(in Spanish).
Pastor-Fernández, J.M., 2010. Plan de conservación de las razas autóctonasandaluzas en peligro de extinción: análisis poblacional, caracterizacióndemográfica y de sus condicionantes sanitarios. Tesis Doctoral, Universi-dad de Córdoba, Spain (in Spanish).
Pulido-Calvo, I., Gutiérrez-Estrada, J.C., 2009. Improved irrigation water de-mand forecasting using a soft-computing hybrid model. Biosyst. Eng.102, 202–218.
Pulido-Calvo, I., Portela, M.M., 2007. Application of neural approaches toone-step daily flow forecasting in Portuguese watersheds. J. Hydrol.332 (1–2), 1–15.
Pulido-Calvo, I., Roldán, J., López-Luque, R., Gutiérrez-Estrada, J.C., 2003. De-mand forecasting for irrigation water distribution systems. J. Irrig. Drain.Eng. 129 (6), 422–431.
Pulido-Calvo, I., Montesinos, P., Roldán, J., Ruiz-Navarro, F., 2007. Linear re-gressions and neural approaches to water demand forecasting in irriga-tion districts with telemetry systems. Biosyst. Eng. 97, 283–293.
Robotham, H., Bosch, P., Gutiérrez-Estrada, J.C., Castillo, J., Pulido-Calvo, I.,2010. Acoustic identification of small pelagic fish species in Chile usingsupport vector machines and neural networks. Fish. Res. 102, 115–122.
Rodero, E., Delgado-Bermejo, J.V., Rodero, A., Camacho-Vallejo, M.E., 1994.Conservación de razas autóctonas andaluzas en peligro de extinción.Consejería de Agricultura y Pesca, Junta de Andalucía, Sevilla, Spain. (inSpanish).
Rodero, E., Herrera, M., Peña, F., Molina, A., Valera, M., Sepúlveda, N., 2003.Modelo morfoestructural de los caprinos lecheros Españoles Florida yPayoya en sistemas extensivos. Rev. Cient. FCV-LUZ 13 (5), 403–412(in Spanish).
Rodero, E., González, A., Luque, A., 2008. Las razas bovinas andaluzas de protec-ción especial: Berrenda enNegro, Berrenda en Colorado, Cárdena Andaluza,Negra Andaluza de las Campiñas, Pajuna y Marismeña. La ganadería anda-luza en el siglo XXI, patrimonio ganadero andaluz II, pp. 53–120(in Spanish).
Rumelhart, D.E., Hinton, G.E., Williams, R.J., 1986. “Learning” representationsby backpropagation errors. Nature 323 (9), 533–536.
Rutkowski, L., 2004. Adaptive probabilistic neural networks for pattern clas-sification in time-varying environment. IEEE Trans. Neural Netw. 15,811–827.
Scholkopf, B., Smola, A., 2002. Learning with Kernels. The MIT Press, Cam-bridge, MA/London, UK.
Sierra, I., 2009. Importancia de la morfología y su valoración en los animalesdomésticos. Valoración morfológica de los animales domésticos. Minist.Medio Ambiente Medio Rural Mar. 1, 23–46 (in Spanish).
Specht, D.F., 1990. Probabilistic neural networks. Neural Netw. 3, 109–118.Tsoukalas, L.H., Uhrig, R.E., 1997. Fuzzy and Neural Approaches in Engineer-
ing. Wiley Interscience, New York, USA.Vapnik, V.N., 1995. The Nature of Statistical Learning Theory. Springer, New
York, USA.Watts, M.J., Worner, S.P., 2008. Comparing ensemble and cascaded neural
networks that combine biotic and abiotic variables to predict insect spe-cies distribution. Ecol. Model. 3, 354–366.
Zaitoun, I.S., Tabbaa, M.J., Bdour, S., 2005. Differentiation of native goatbreeds of Jordan on the basis of morphostructural characteristics.Small Ruminant Res. 56 (1–3), 173–182.