classical music attendance in canada - hill strategies · 1 | page classical music attendance in...
TRANSCRIPT
1 | P a g e
Classical Music Attendance in Canada By Hill Strategies Research
For Orchestras Canada Conference, May 27, 2009
This report summarizes data on Canadians 15 years of age or older who attended a classical music performance. The data is drawn from Statistics Canada’s General Social Surveys of 1992, 1998 and 2005, in-depth telephone surveys of about 10,000 Canadians 15 years of age or older. Respondents were asked: “During the past 12 months, did you attend a symphonic or classical music performance?” A further description was provided by the interviewer: “Include symphonic music, symphonic ‘pops’ concerts, contemporary classical music (new and experimental music written by 20th century composers and played by soloists, ensembles or full orchestras) and chamber music (played by small ensembles of less than 20 musicians, quartets or soloists)”. Individuals are counted as only one attendee regardless of how many times they attended a performance. It is also important to note that the data includes attendance of Canadians while travelling out of province or out of the country and excludes attendance by residents of other countries while travelling in Canada. This means that the data on classical music attendees represents the number of Canadians who attended at least one performance (anywhere) during the survey year, not the total attendance at Canadian performances. Residents of the three territories were not included in the General Social Survey. All of the statistics in this report have been adjusted for non-response. This means that, in all three survey years, responses of “don’t know” or “not stated” are excluded from the results. The implicit assumption is that those who did not respond or who hung up before completing the survey attended symphonic or classical music performances in the same proportion as those who did respond. Note: A few graphs in this report are reprinted, with permission, from the Hill Strategies report A Profile of the Cultural and Heritage Activities of Canadians in 2005 (March 2007). More detailed sections of the report contain analysis of classical music attendance conducted for Orchestras Canada and drawn from Statistics Canada’s General Social Survey.
2 | P a g e
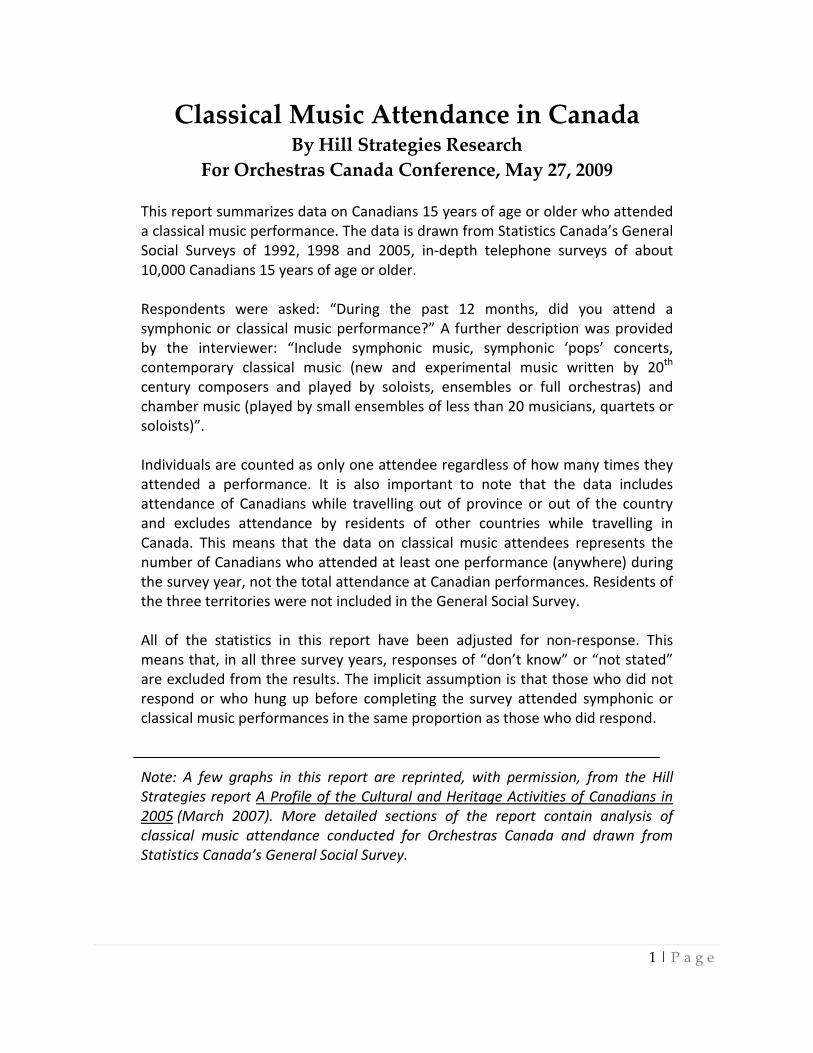
Classical music attendance in 2005 Almost 10% of the Canadian population 15 or older attended a classical music performance in 2005 (2.5 million Canadians). As shown in Figure 1, theatre and popular music performances were attended by a larger percentage of Canadians.
22.6%
23.8%
9.5%
0 % 10 % 20 % 30 %
Theatre
Popular music
Classical music
Percentage of Canadians 15 or older who attended at least one performance during the year
Figure 1: Classical music attendance in 2005
3 | P a g e
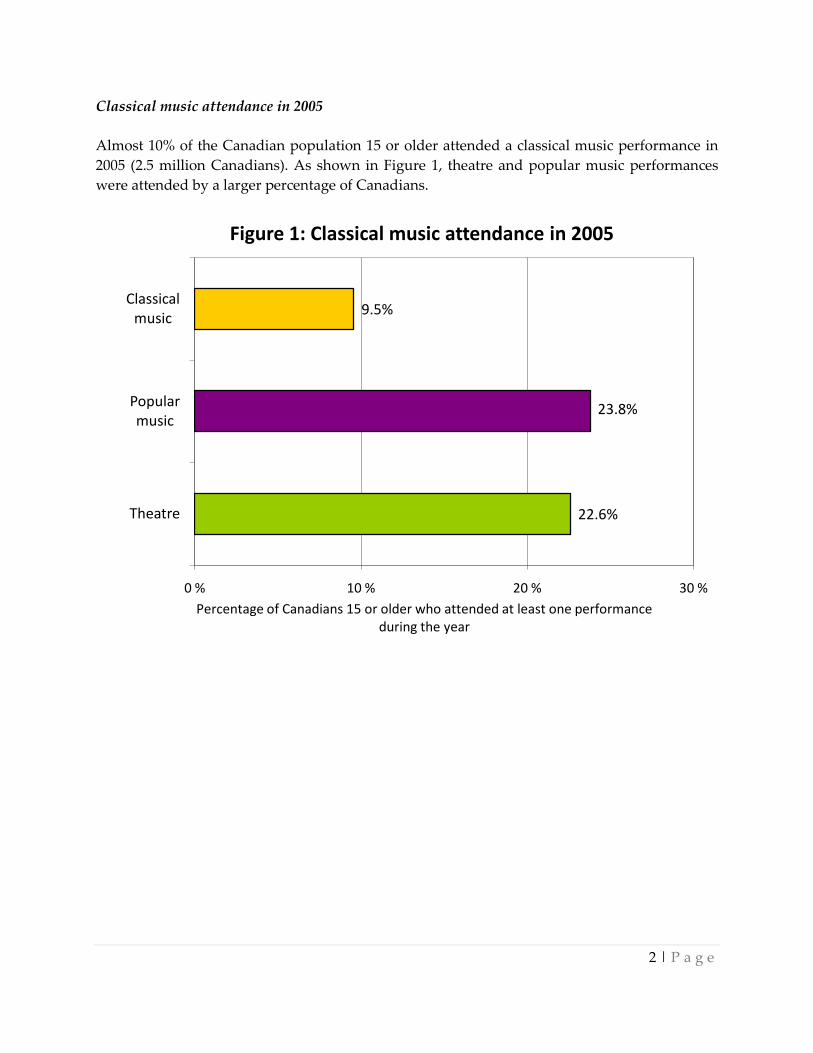
Frequency of classical music attendance Respondents were asked how often they attended classical music performances in 2005. Figure 2 shows that:
• 7.8% of the population 15 or older attended classical music performances between one and four times a year (2.0 million Canadians);
• another 1.1% attended classical music performances five or more times, but not every month (280,000 Canadians); and
• another 0.7% attended classical music performances at least once every month (190,000 Canadians).
1 to 4 times a year, 7.8%
5 or more times, but not
every month, 1.1%
At least once every
month, 0.7%
No symphonic or classical music performances,
90.5%
Figure 2: Frequency of classical music attendance in 2005
4 | P a g e
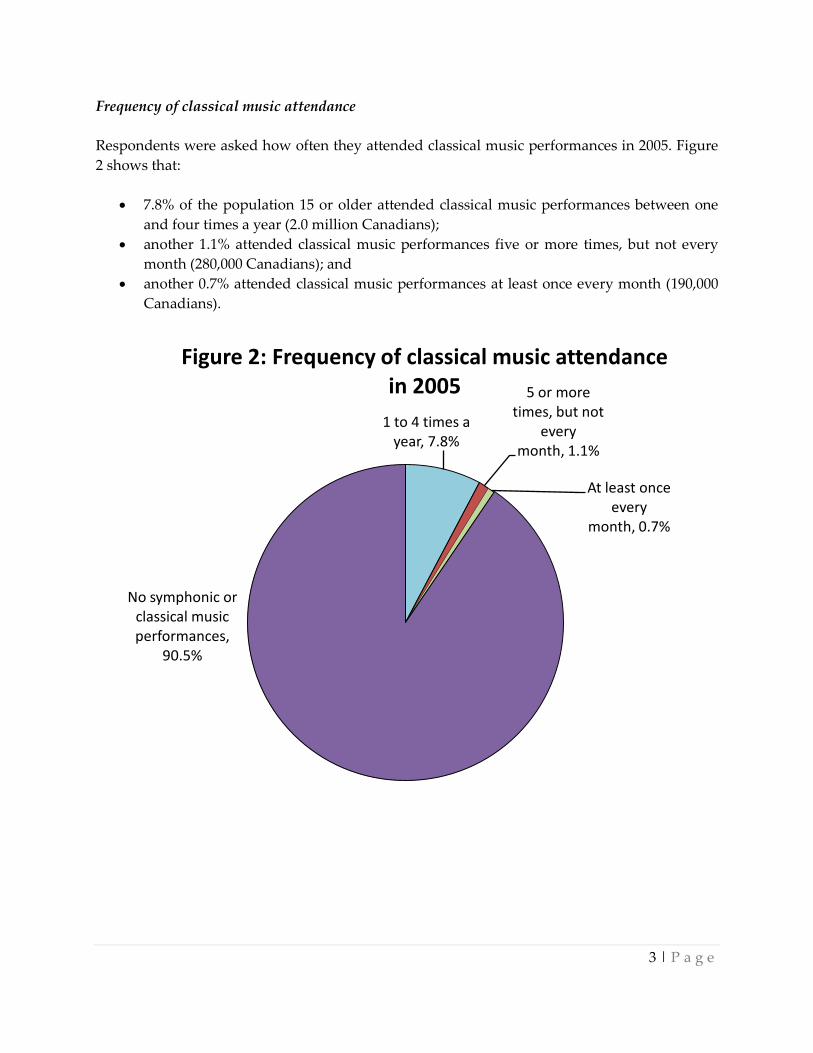
Trends in classical music attendance between 1992 and 2005 There was a small increase in the percentage of Canadians attending a classical music performance between 1992 and 2005. Figure 3 shows that the percentage of Canadians attending a classical music performance increased from 8.4% in 1992 to 9.0% in 1998 and 9.5% in 2005. With 22.6% growth in the population (15 or older) between 1992 and 2005, the number of Canadians attending a classical music performance increased substantially, from 1.8 million in 1992 to 2.5 million in 2005, a 40% increase in the number of Canadians attending a classical performance.
9.5%
9.0%
8.4%
0 % 5 % 10 % 15 % 20 % 25 %
2005
1998
1992
Percentage of Canadians 15 or older who attended at least one symphonic or classical music performance during the year
Figure 3: Trends in classical music attendance1992 to 2005
5 | P a g e
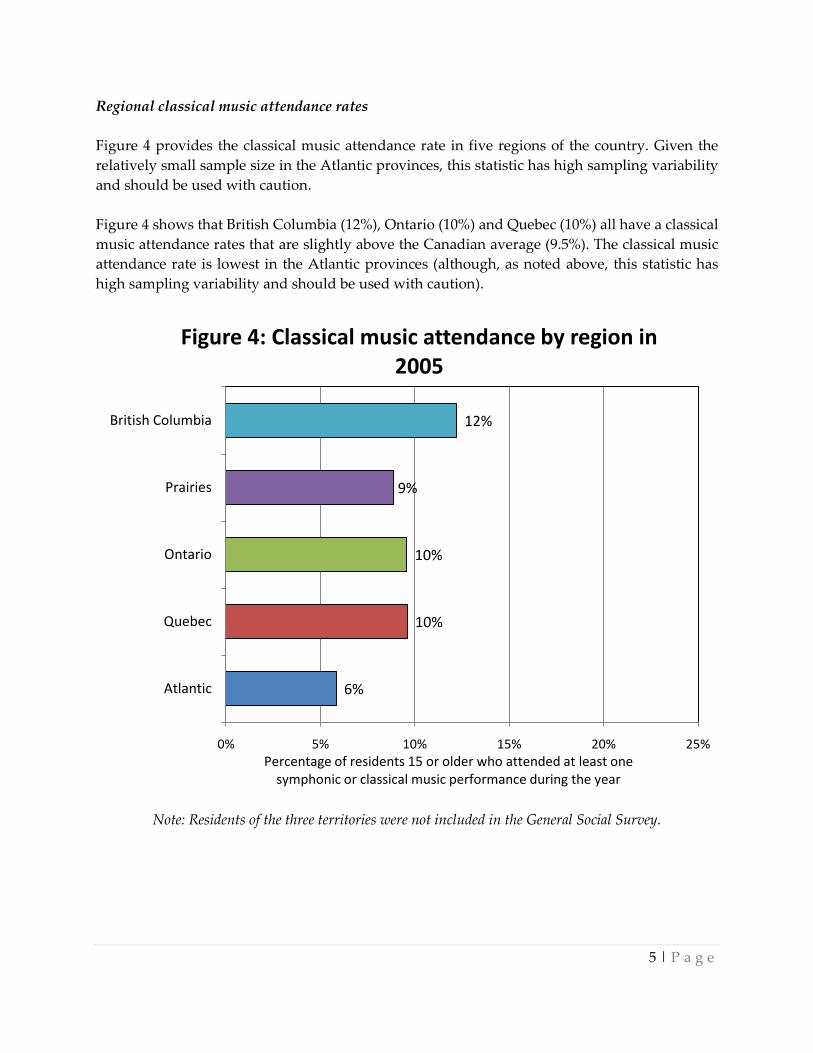
Regional classical music attendance rates Figure 4 provides the classical music attendance rate in five regions of the country. Given the relatively small sample size in the Atlantic provinces, this statistic has high sampling variability and should be used with caution. Figure 4 shows that British Columbia (12%), Ontario (10%) and Quebec (10%) all have a classical music attendance rates that are slightly above the Canadian average (9.5%). The classical music attendance rate is lowest in the Atlantic provinces (although, as noted above, this statistic has high sampling variability and should be used with caution).
Note: Residents of the three territories were not included in the General Social Survey.
6%
10%
10%
9%
12%
0% 5% 10% 15% 20% 25%
Atlantic
Quebec
Ontario
Prairies
British Columbia
Figure 4: Classical music attendance by region in 2005
Percentage of residents 15 or older who attended at least one symphonic or classical music performance during the year
6 | P a g e
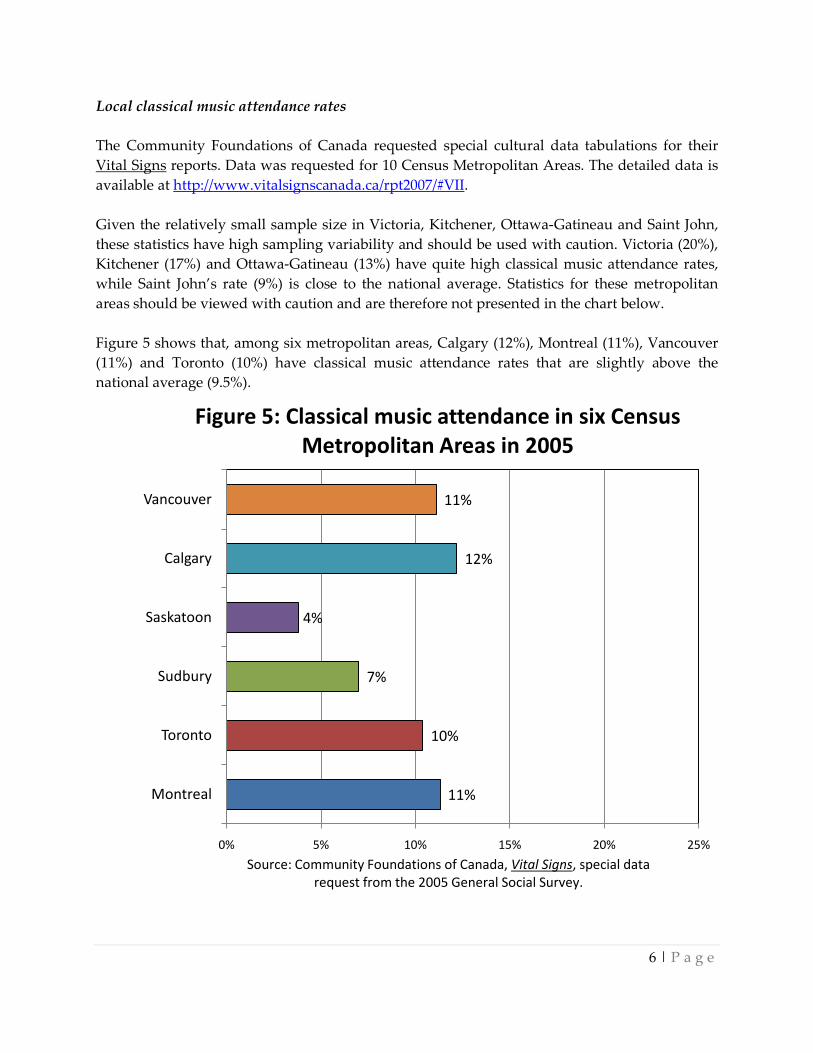
Local classical music attendance rates The Community Foundations of Canada requested special cultural data tabulations for their Vital Signs reports. Data was requested for 10 Census Metropolitan Areas. The detailed data is available at http://www.vitalsignscanada.ca/rpt2007/#VII. Given the relatively small sample size in Victoria, Kitchener, Ottawa-Gatineau and Saint John, these statistics have high sampling variability and should be used with caution. Victoria (20%), Kitchener (17%) and Ottawa-Gatineau (13%) have quite high classical music attendance rates, while Saint John’s rate (9%) is close to the national average. Statistics for these metropolitan areas should be viewed with caution and are therefore not presented in the chart below. Figure 5 shows that, among six metropolitan areas, Calgary (12%), Montreal (11%), Vancouver (11%) and Toronto (10%) have classical music attendance rates that are slightly above the national average (9.5%).
11%
10%
7%
4%
12%
11%
0% 5% 10% 15% 20% 25%
Montreal
Toronto
Sudbury
Saskatoon
Calgary
Vancouver
Figure 5: Classical music attendance in six Census Metropolitan Areas in 2005
Source: Community Foundations of Canada, Vital Signs, special data request from the 2005 General Social Survey.
7 | P a g e
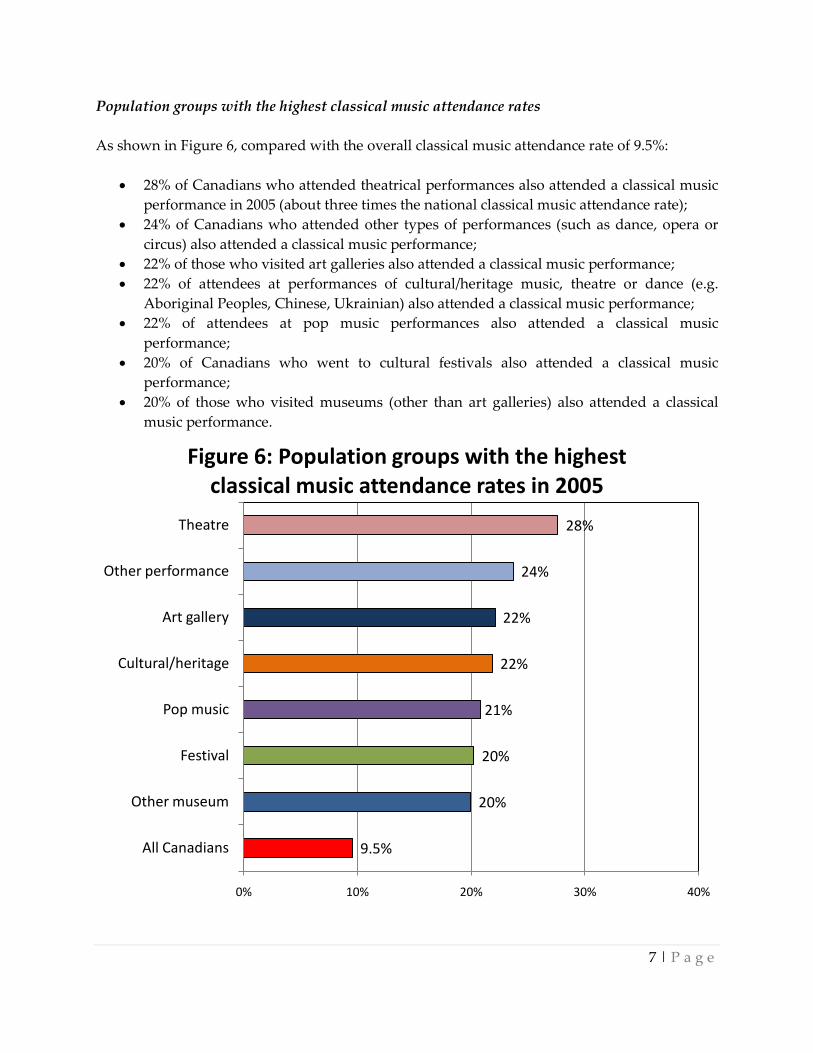
Population groups with the highest classical music attendance rates As shown in Figure 6, compared with the overall classical music attendance rate of 9.5%:
• 28% of Canadians who attended theatrical performances also attended a classical music performance in 2005 (about three times the national classical music attendance rate);
• 24% of Canadians who attended other types of performances (such as dance, opera or circus) also attended a classical music performance;
• 22% of those who visited art galleries also attended a classical music performance; • 22% of attendees at performances of cultural/heritage music, theatre or dance (e.g.
Aboriginal Peoples, Chinese, Ukrainian) also attended a classical music performance; • 22% of attendees at pop music performances also attended a classical music
performance; • 20% of Canadians who went to cultural festivals also attended a classical music
performance; • 20% of those who visited museums (other than art galleries) also attended a classical
music performance.
9.5%
20%
20%
21%
22%
22%
24%
28%
0% 10% 20% 30% 40%
All Canadians
Other museum
Festival
Pop music
Cultural/heritage
Art gallery
Other performance
Theatre
Figure 6: Population groups with the highest classical music attendance rates in 2005
8 | P a g e
These seven cultural activities rank more highly than the best demographic factors in classical music attendance: 20% of Canadians with at least a bachelor’s degree attended a classical music performance, while 15% of those with a household income of $100,000 or more attended a classical music performance in 2005. Attendees at three other types of cultural activities have a classical music attendance rate of 15% or more:
• 17% of Canadians who visited an historic site in 2005 also attended a classical music performance in 2005.
• 16% of Canadians who visited a library in 2005 also attended a classical music performance in 2005.
• 15% of Canadians who visited a zoo, aquarium, botanical garden or other heritage site also attended a classical music performance in 2005.
These statistics clearly show that arts awareness is a much more important factor than education or income in predicting classical music attendance. Demographic factors Although demographic factors are not, on the whole, as important as cultural factors in predicting classical music attendance, some demographic factors do have an impact on attendance. Education is one such factor. The classical music attendance rate is:
• 3% for those with less than a high school diploma; • 5% for Canadians with a high school diploma (but no further education); • 9% for those who are currently in university or college (including CEGEPs in Quebec) or
who quit a university or college program before completion; • 9% for Canadians with a diploma or certificate from a college or trade/technical school
(including CEGEPs in Quebec); and • 20% for those with at least a bachelor’s degree.
The classical music attendance rate also increases with household income. The rate is:
• 7% for Canadians with a household income of less than $20,000 (this statistic has high sampling variability and should be used with caution);
• 7% for those with a household income between $20,000 and $39,999; • 8% for Canadians with a household income between $40,000 and $59,999; • 9% for Canadians with a household income between $60,000 and $79,999; • 13% for those with a household income between $80,000 and $99,999; and • 15% for Canadians with a household income of $100,000 or more.
9 | P a g e
Similarly, the classical music attendance rate increases somewhat with the age of the respondent. The attendance rate is:
• 7% for Canadians between 15 and 24; • 6% for those between 25 and 34; • 8% for those between 35 and 44 years of age; • 10% for Canadians between 45 and 54; • 14% for those between 55 and 64 and those between 65 and 74 years of age; and • 13% for Canadian 75 or older.
Women attend classical music performances in higher numbers than men (11% attendance rate for women and 8% for men). The classical music attendance rate is higher for residents of larger urban centres (10% for those residing in a community with a population of 10,000 or more) than residents of rural areas or small towns (6%). There is almost no difference in the classical music attendance rates for different linguistic groups:
• Canadians who speak English most often at home have a classical music attendance rate of 10%.
• Those who speak French most often at home have a classical music attendance rate of 9%.
• Canadians who speak other languages most often at home have a classical music attendance rate of 9%.
An arts bug? The analysis above shows that the top seven predictors of classical music attendance are other cultural activities, not demographic factors. This indicates that cultural experiences and cultural exposure are more important factors in classical music attendance than most demographic factors. The statistics also imply that there is an arts-interested public that transcends demographic analysis. Those who get the arts go to a range of things. Those who don’t “get it” don’t go. This arts interest could be considered an “arts bug”. For the cultural community, the presence of an arts bug can be seen as both bad news and good news. The rising levels of education in society and the aging of the public will likely have less of a (positive) impact on cultural participation than one might think. More important factors might be the quality and quantity of an individual’s cultural exposure and arts education experiences.
10 | P a g e
On the positive side, the statistics imply that the arts can attract people from various demographic groups. In other words, the arts are not elitist in the conventional sense of the term. A key question for the cultural community is how to spread this beneficial bug to more people. Past studies have shown that a person’s childhood arts education is an important factor in adult arts participation. The statistics have obvious marketing implications for cultural organizations. Specifically, classical music marketing should be directed at other cultural attendees. Performance information should be made available at art galleries, festivals, museums and other types of performances. The statistics also imply that efforts to draw new attendees to cultural activities could be rewarded through higher participation in a range of cultural activities. If organizations help “enlarge the pie” of the arts -interested public, many organizations can reap the rewards.
11 | P a g e
Two recent reports from Hill Strategies Research examined the social effects of cultural attendance. Social Effects of Culture: Exploratory Statistical Evidence, the 22nd report in the Statistical Insights on the Arts series, examines the relationship between four cultural activities (reading books, attending live performances, visiting art galleries and attending movie theatres) and specific social phenomena:
• Volunteering and Donating • Neighbourhood Connections • Sense of Belonging • Social Activities • Labour Force Participation • Quality of Life
Because there are many other factors that could play a significant role in the social indicators examined in the report, the report does not claim to be definitive. However, some statistics do show a relationship between some cultural activities and positive social engagement. Social Effects of Culture: Detailed Statistical Models, the 23rd report in the Statistical Insights on the Arts series, provides strong evidence of the social effects of culture through detailed statistical models of six social indicators:
• Feeling trapped in a daily routine; • Volunteering; • Donating; • Doing a favour for a neighbour; • Sense of belonging to one’s province; and • Sense of belonging to Canada.
This report builds on the previous report in the Statistical Insights on the Arts series, which provided some exploratory findings regarding the social effects of culture. Taking the previous report as a starting point, the statistical models in this report examine whether cultural activities have an impact on social indicators above and beyond demographic information. Unlike the previous report, the current report does not limit the analysis to four cultural activities. Rather, 11 cultural activities from the survey dataset were entered into the statistical models, including attendance at various types of performances (theatre, pop music, classical music, cultural/heritage performances), festivals, movies, public art galleries, historic sites, conservation areas or nature parks as well as reading newspapers or books.
12 | P a g e
The current report shows that, in many cases, even adjusting for the effects of key demographic variables, Canadians who participate in cultural activities are more likely to be socially active than Canadians who do not take part in cultural activities. Methodological notes The data is drawn from Statistics Canada’s General Social Survey of 2005, an in-depth telephone survey of about 20,000 Canadians 15 years of age or older. Because of a split in the survey design, only half of the respondents were asked questions about their cultural activities in 2005. A total of 9,851 respondents answered the cultural questions. The other half of the respondents were asked questions about social networking and trust, including some questions that, in theory, would be helpful in examining the social effects of culture. However, because of the survey split, these questions could not be cross-tabulated with the questions about cultural activities. The report defines a cultural participant as anyone who participated at least once in the relevant cultural activity in 2005. This is a low threshold of cultural participation. In particular, many cultural activities do not have explicit social goals. As such, their social impacts may be less than for those artistic activities that have an explicit social goal. For each of the six social indicators, a preliminary exploration was done to examine the percentage of respondents in each category based on their demographic characteristics and cultural activities. Both positive and negative effects were examined. The variables that the preliminary research indicated may be of primary importance were included in the initial drafts of the models, while the remaining variables were added and removed in order to improve the accuracy of the model. This was done without preference for any of the variables. For example, if adding a variable did not cause the measures of statistical significance of the model (in particular, the -2 log likelihood) to change significantly, then the variable in question would not have much importance in predicting the dependent variable and was left out of the model. These steps of adding and removing different combinations of variables was done until the -2 log likelihood was as small as possible, while other statistical tests showed that the data fit the model well and that the predictor variables did not exhibit multicollinearity. In the statistical models, the typical margin of error of the estimates of the likelihood of participating in one of the six social indicators is 9 percent, 19 times out of 20. For the standard error associated with each variable as well as more information about the construction of the logistic regression model, please consult the Technical Supplement to the report at www.hillstrategies.com. The following slides from Kelly Hill’s presentation at the Orchestras Canada conference in May 2009 summarize the main findings regarding the social effects of classical music attendance.
13
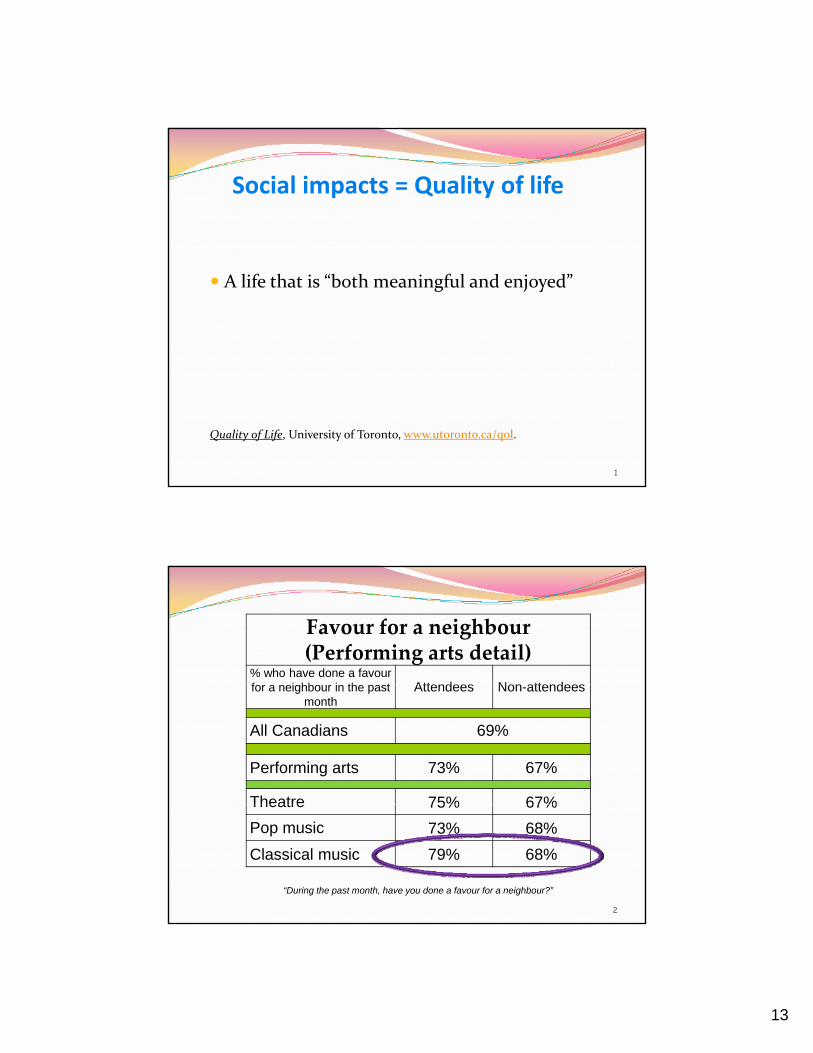
Social impacts = Quality of life
A life that is “both meaningful and enjoyed”
Quality of Life, University of Toronto, www.utoronto.ca/qol.
1
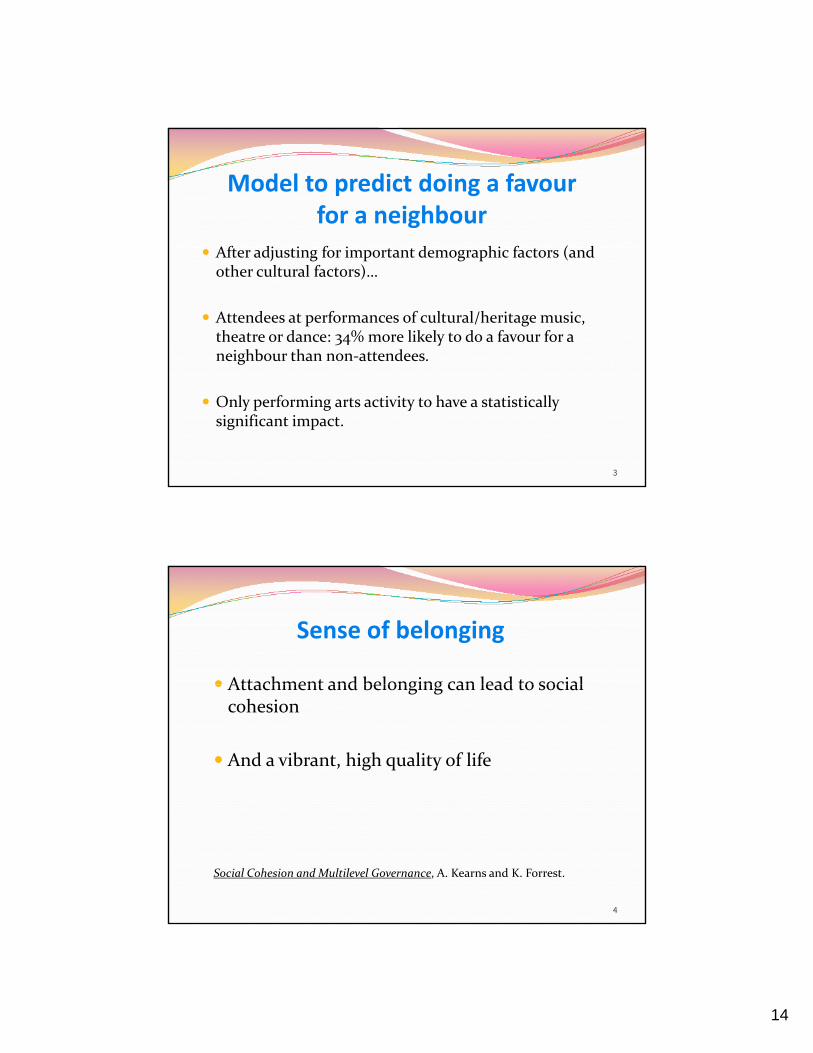
Favour for a neighbour(Performing arts detail)
% who have done a favour for a neighbo r in the past Attendees Non attendeesfor a neighbour in the past
monthAttendees Non-attendees
All Canadians 69%
Performing arts 73% 67%
Theatre 75% 67%Theatre 75% 67%
Pop music 73% 68%
Classical music 79% 68%
2
“During the past month, have you done a favour for a neighbour?”
14
Af dj i f i d hi f ( d
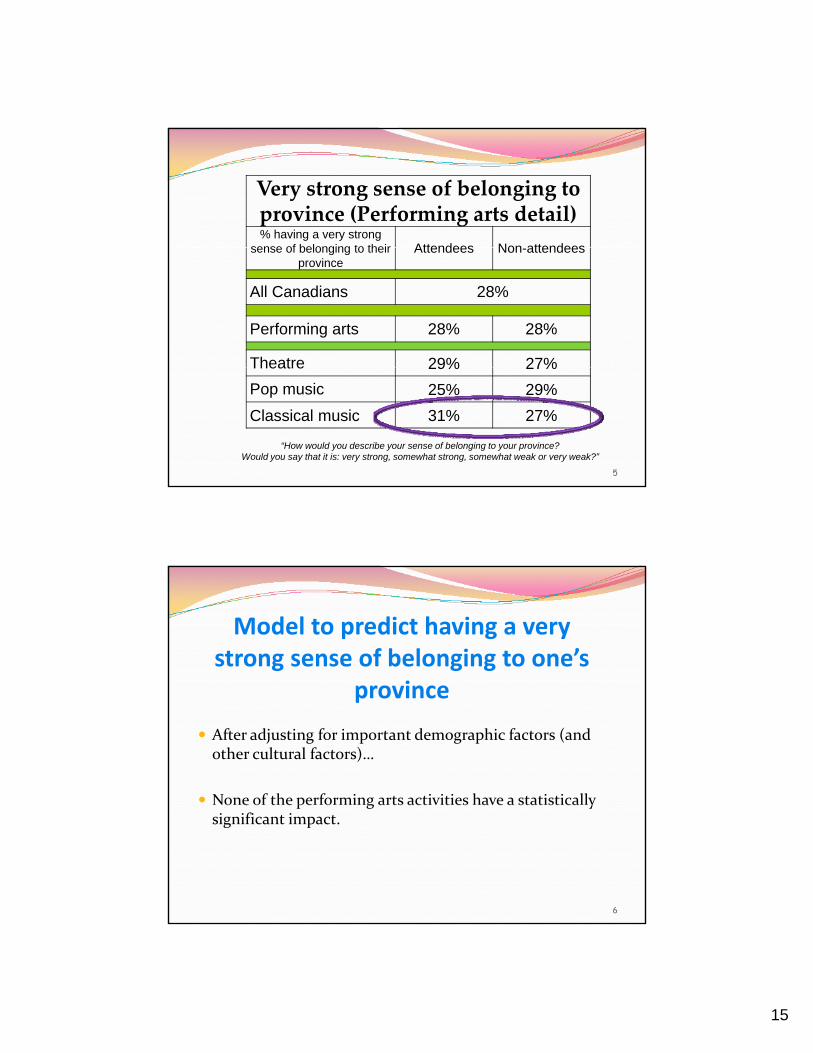
Model to predict doing a favour for a neighbour
After adjusting for important demographic factors (and other cultural factors)…
Attendees at performances of cultural/heritage music, theatre or dance: 34% more likely to do a favour for a neighbour than non‐attendees.
Only performing arts activity to have a statistically significant impact.
3
Sense of belonging
Attachment and belonging can lead to social Attachment and belonging can lead to social cohesion
And a vibrant, high quality of life
Social Cohesion and Multilevel Governance, A. Kearns and K. Forrest.
4
15
Very strong sense of belonging to province (Performing arts detail)% having a very strong
sense of belonging to their Attendees Non attendeessense of belonging to their province
Attendees Non-attendees
All Canadians 28%
Performing arts 28% 28%
Theatre 29% 27%Theatre 29% 27%
Pop music 25% 29%
Classical music 31% 27%
5
“How would you describe your sense of belonging to your province?Would you say that it is: very strong, somewhat strong, somewhat weak or very weak?”
Model to predict having a very strong sense of belonging to one’s
i
After adjusting for important demographic factors (and other cultural factors)…
None of the performing arts activities have a statistically
province
None of the performing arts activities have a statistically significant impact.
6
16
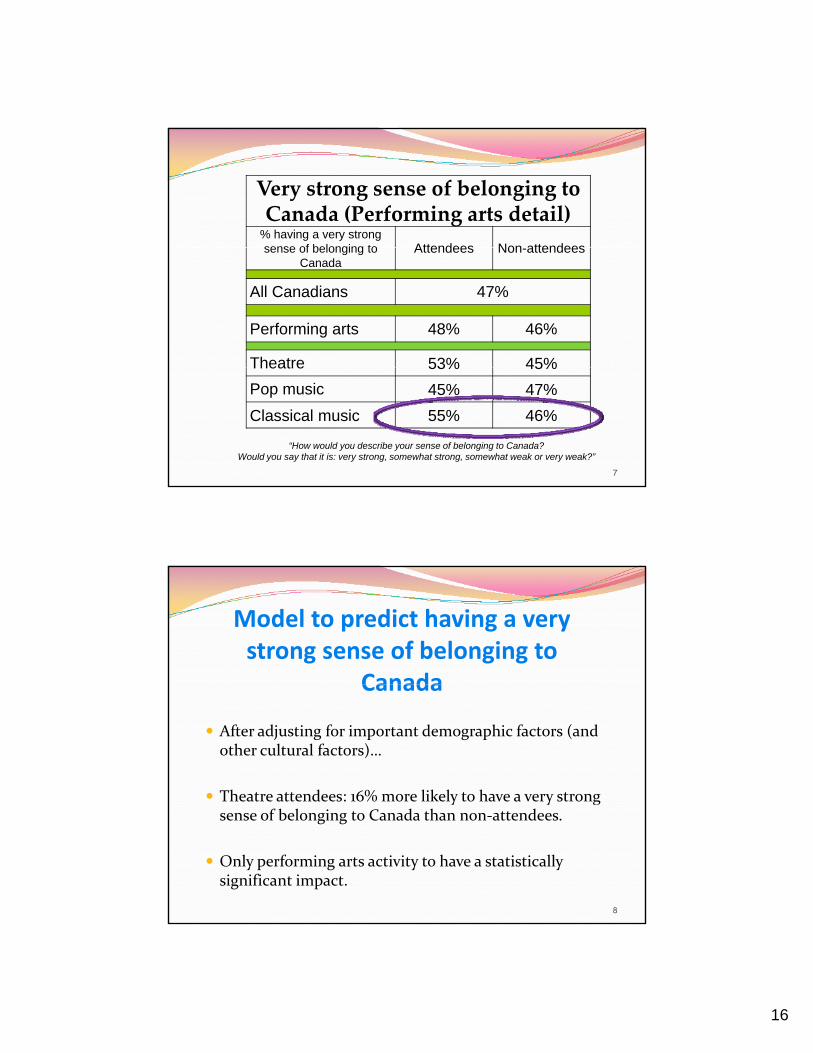
Very strong sense of belonging to Canada (Performing arts detail)
% having a very strong sense of belonging to Attendees Non attendeessense of belonging to
CanadaAttendees Non-attendees
All Canadians 47%
Performing arts 48% 46%
Theatre 53% 45%Theatre 53% 45%
Pop music 45% 47%
Classical music 55% 46%
7
“How would you describe your sense of belonging to Canada?Would you say that it is: very strong, somewhat strong, somewhat weak or very weak?”
Model to predict having a very strong sense of belonging to
Canada
After adjusting for important demographic factors (and other cultural factors)…
Theatre attendees: 16% more likely to have a very strong
Canada
y y gsense of belonging to Canada than non‐attendees.
Only performing arts activity to have a statistically significant impact.
8
17
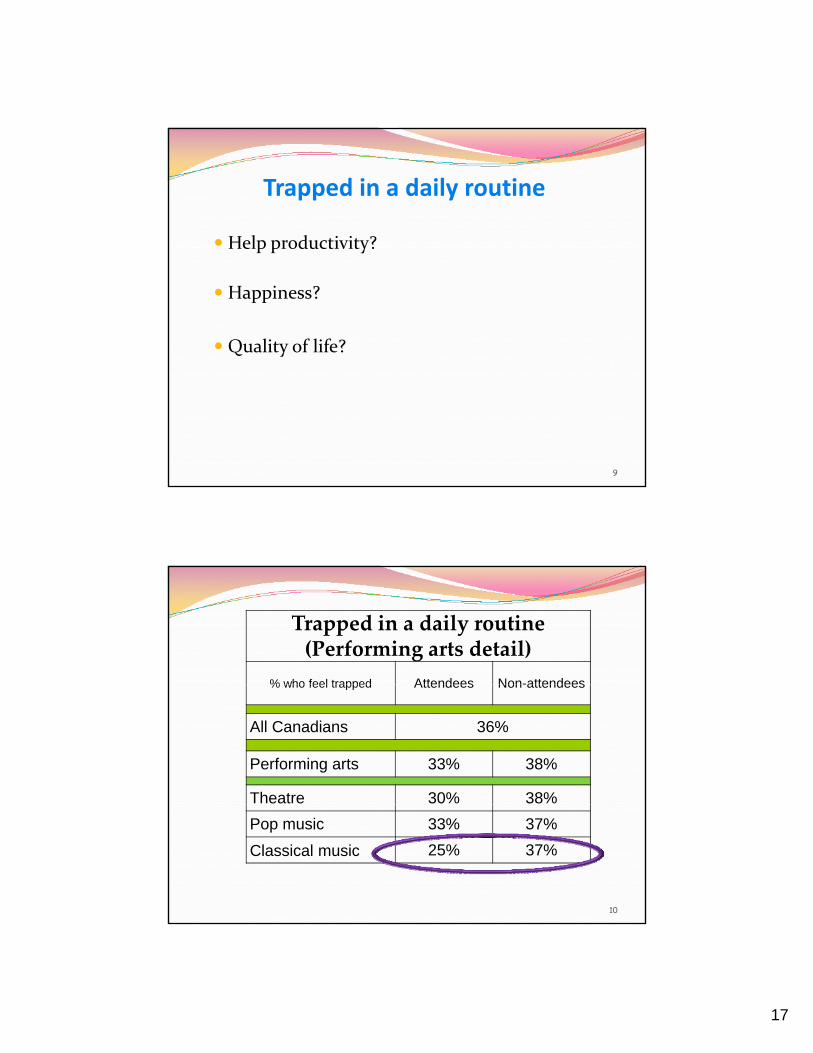
Trapped in a daily routine
Help productivity?Help productivity?
Happiness?
Quality of life?
9
Trapped in a daily routine(Performing arts detail)
% who feel trapped Attendees Non-attendees% who feel trapped Attendees Non attendees
All Canadians 36%
Performing arts 33% 38%
Theatre 30% 38%
Pop music 33% 37%
Classical music 25% 37%
10

18
Model to predict being trappedin a daily routine
After adjusting for important demographic factors (and other cultural factors)…
Classical music attendees: 26% less likely to feel trapped in a daily routine than non‐attendees.
Theatre attendees: 13% less likely to feel trapped in a daily routine than non‐attendees.
11
Donation rates(Performing arts detail)
% who donate Attendees Non-attendees% who donate Attendees Non attendees
All Canadians 77%
Performing arts 85% 71%
Theatre 89% 73%
Pop music 83% 75%
Classical music 90% 75%
12
“During the past 12 months, did you donate money or goods to any organization or charity?Do not include membership fees or dues.”
19
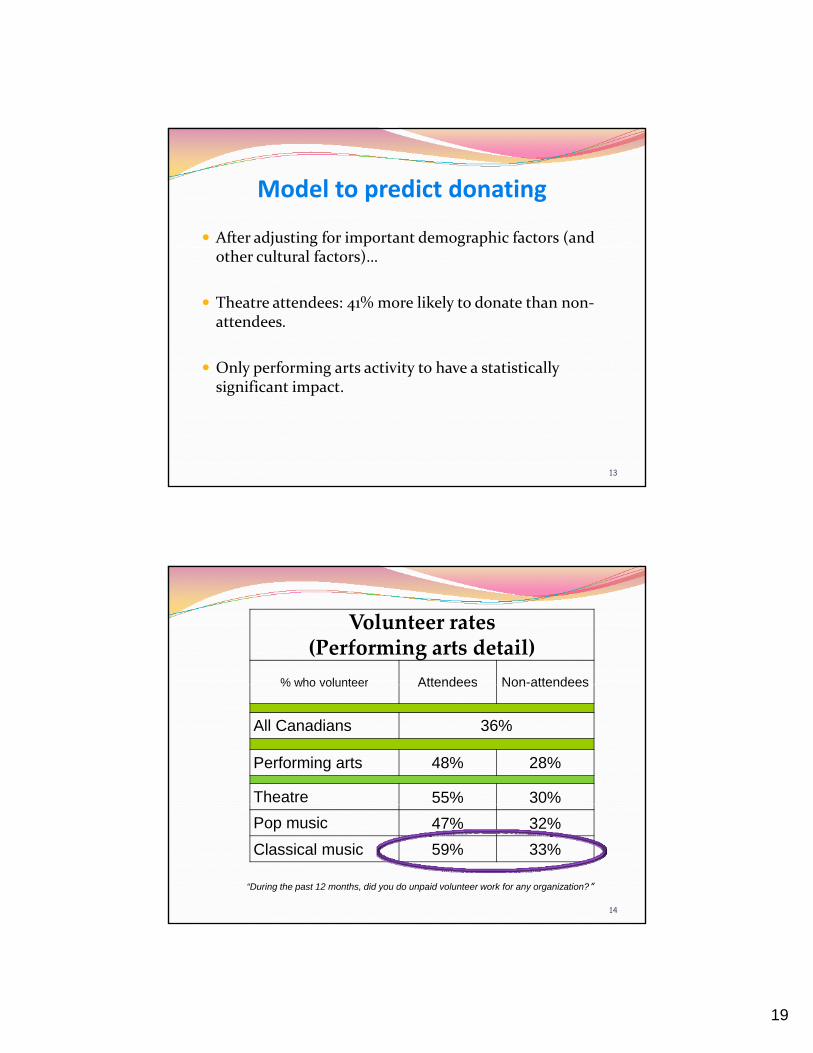
After adjusting for important demographic factors (and
Model to predict donating
other cultural factors)…
Theatre attendees: 41% more likely to donate than non‐attendees.
Only performing arts activity to have a statistically Only performing arts activity to have a statistically significant impact.
13
Volunteer rates(Performing arts detail)
% who volunteer Attendees Non-attendees% who volunteer Attendees Non attendees
All Canadians 36%
Performing arts 48% 28%
Theatre 55% 30%
Pop music 47% 32%
Classical music 59% 33%
14
“During the past 12 months, did you do unpaid volunteer work for any organization?”
20
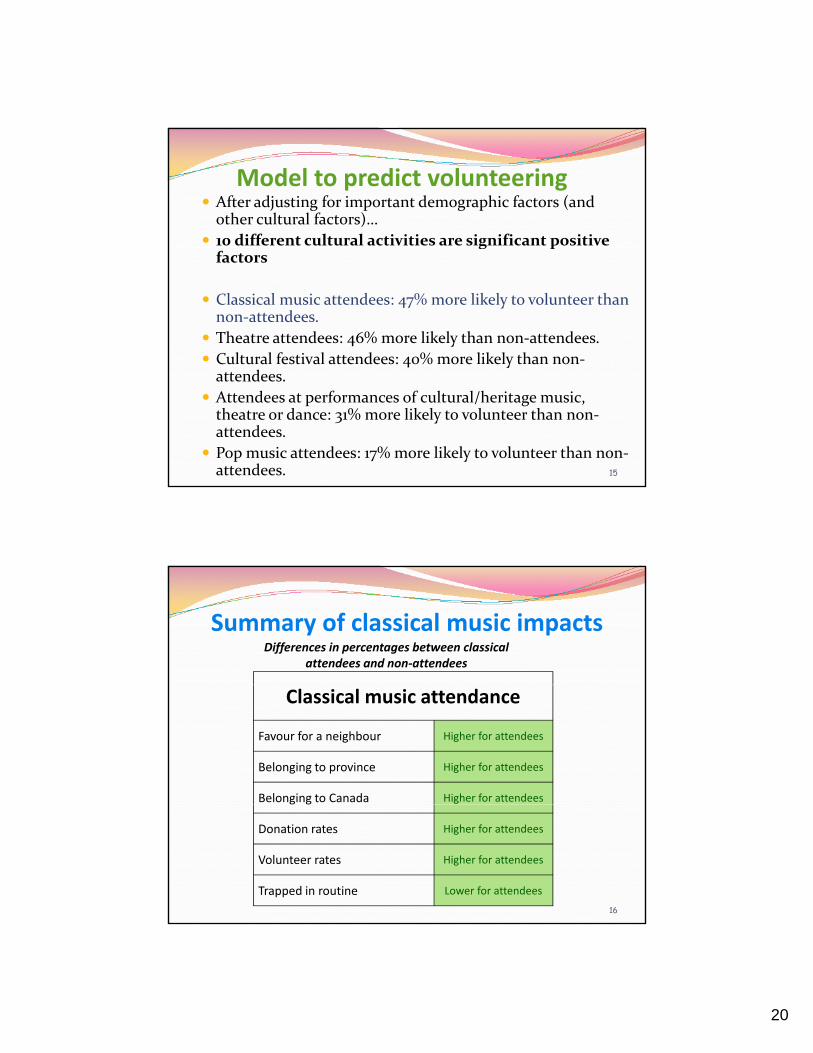
After adjusting for important demographic factors (and other cultural factors)…
10 different cultural activities are significant positive
Model to predict volunteering
g pfactors
Classical music attendees: 47% more likely to volunteer than non‐attendees.
Theatre attendees: 46% more likely than non‐attendees.
Cultural festival attendees: 40% more likely than non‐4 yattendees.
Attendees at performances of cultural/heritage music, theatre or dance: 31% more likely to volunteer than non‐attendees.
Pop music attendees: 17% more likely to volunteer than non‐attendees. 15
Summary of classical music impactsDifferences in percentages between classical
attendees and non‐attendees
Classical music attendance
Favour for a neighbour Higher for attendees
Belonging to province Higher for attendees
Belonging to Canada Higher for attendees
16
Donation rates Higher for attendees
Volunteer rates Higher for attendees
Trapped in routine Lower for attendees
21
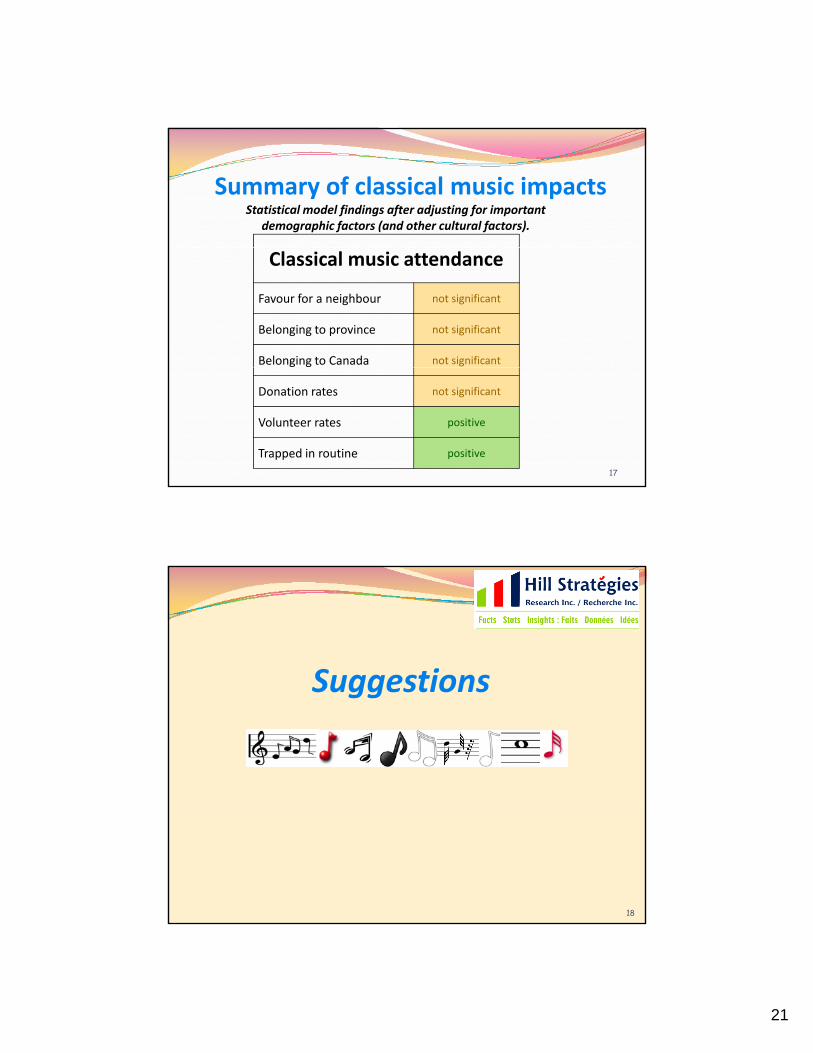
Summary of classical music impactsStatistical model findings after adjusting for important
demographic factors (and other cultural factors).
Classical music attendance
Favour for a neighbour not significant
Belonging to province not significant
Belonging to Canada not significant
17
Donation rates not significant
Volunteer rates positive
Trapped in routine positive
SuggestionsSuggestions
18
22
Social impacts: A slogan?
Break out of your daily routine!
Take in a concert!
19
Suggestions
Pay attention to arts education.
Pay attention to motivations and benefits for donors and attendees.
20
23
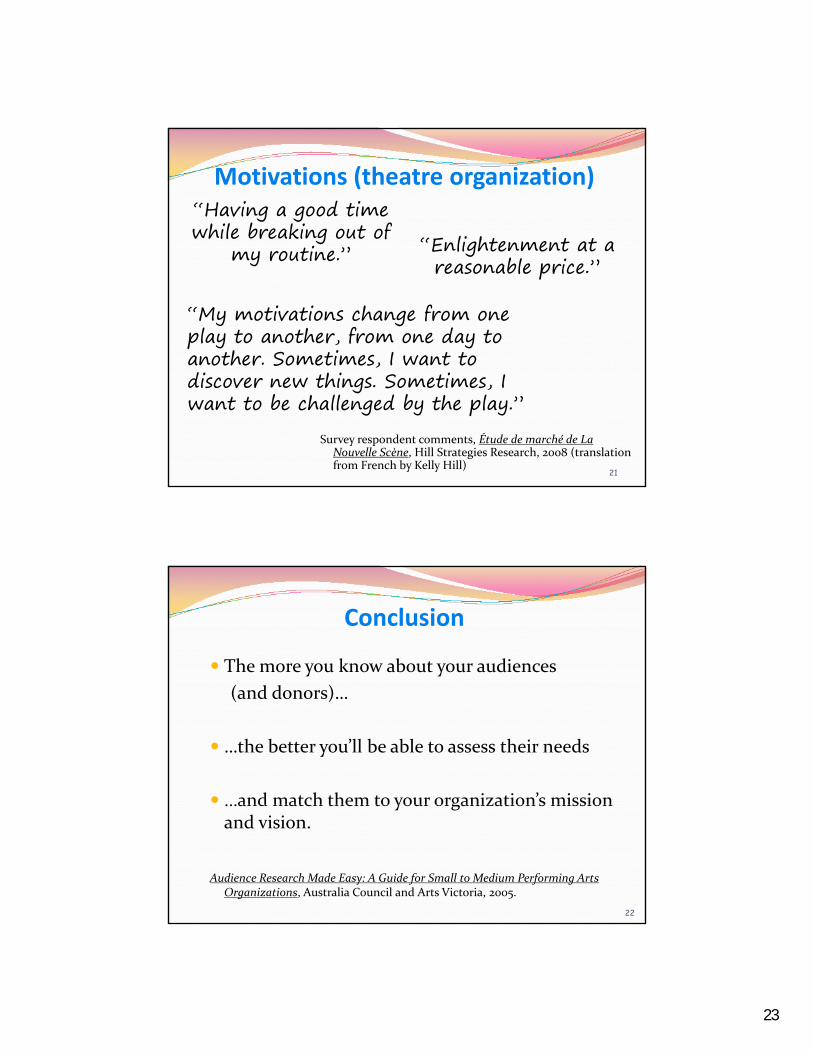
Motivations (theatre organization)
“Enlightenment at a “Having a good time while breaking out of
ti ” Enlightenment at a reasonable price.”my routine.”
“My motivations change from one play to another, from one day to another. Sometimes, I want to
Survey respondent comments, Étude de marché de La Nouvelle Scène, Hill Strategies Research, 2008 (translation from French by Kelly Hill)
21
,discover new things. Sometimes, I want to be challenged by the play.”
Conclusion
The more you know about your audiences
( d d )(and donors)…
…the better you’ll be able to assess their needs
…and match them to your organization’s mission …and match them to your organizations mission and vision.
Audience Research Made Easy: A Guide for Small to Medium Performing Arts Organizations, Australia Council and Arts Victoria, 2005.
22

24
Merci !
Thanks for your time!
i f hill i
Thanks for your time!
23
1‐877‐445‐5494Hamilton, Ontario