clarion university’s workforce characteristics … gap analysis/clarion wcr.pdfclarion...
TRANSCRIPT
Clarion University’s
WORKFORCE CHARACTERISTICS TECHNICAL REPORTA report for Pennsylvania’s State System of Higher Education
2016
2DRAFT
CONTENTS
5 1. Introduction
6 1.1 Pennsylvania’s State System of Higher Education Gap Analysis Project
7 1.2 Goal of the Workforce Characteristics Report
9 2. Pennsylvania’s State System Learner Origin
10 2.1 Clarion University’s Learner Origin
12 3. Summary of Clarion University Workforce Region
13 3.1 DefiningClarionUniversity’sWorkforceRegion
15 4. Labor Market of Clarion University’s Workforce Region
16 4.1 Employment Projections
18 5. Industries in Clarion University’s Workforce Region
19 5.1 Top Employers in Clarion University’s Workforce Region
21 6. Occupations in Clarion University’s Workforce Region
21 6.1 Skilled Occupations22 6.2 Top Skilled Occupations in Clarion University’s Workforce
Region25 6.3 Key Skilled High Demand Occupations Aligning to
University-level Education29 6.4 IndustryStaffingPatternsforKeySkilledHighDemand
Occupations in Clarion University’s Workforce Region31 6.5 KeySkilledHighDemandOccupationalProfiles
3DRAFT
38 7. Demographic and Socio-economic Indicators of Clarion University’s Workforce Region
38 7.1 Demographics of Clarion University’s Workforce Region 40 7.2 Socio-economic Indicators of Clarion University’s
Workforce Region
44 8. Next Steps
45 Data Sources
46 Appendix A: Methodology for Identifying State System University Workforce Regions
52 Appendix B: Pennsylvania State and County Enrollment and Employment
54 Appendix C: Industry Projections 2014-2024 for Clarion University’s Workforce Region
64 Appendix D: Occupation Projections 2014-2024 for Clarion University’s Workforce Region
91 About The State System’s Gap Analysis Project
4DRAFT
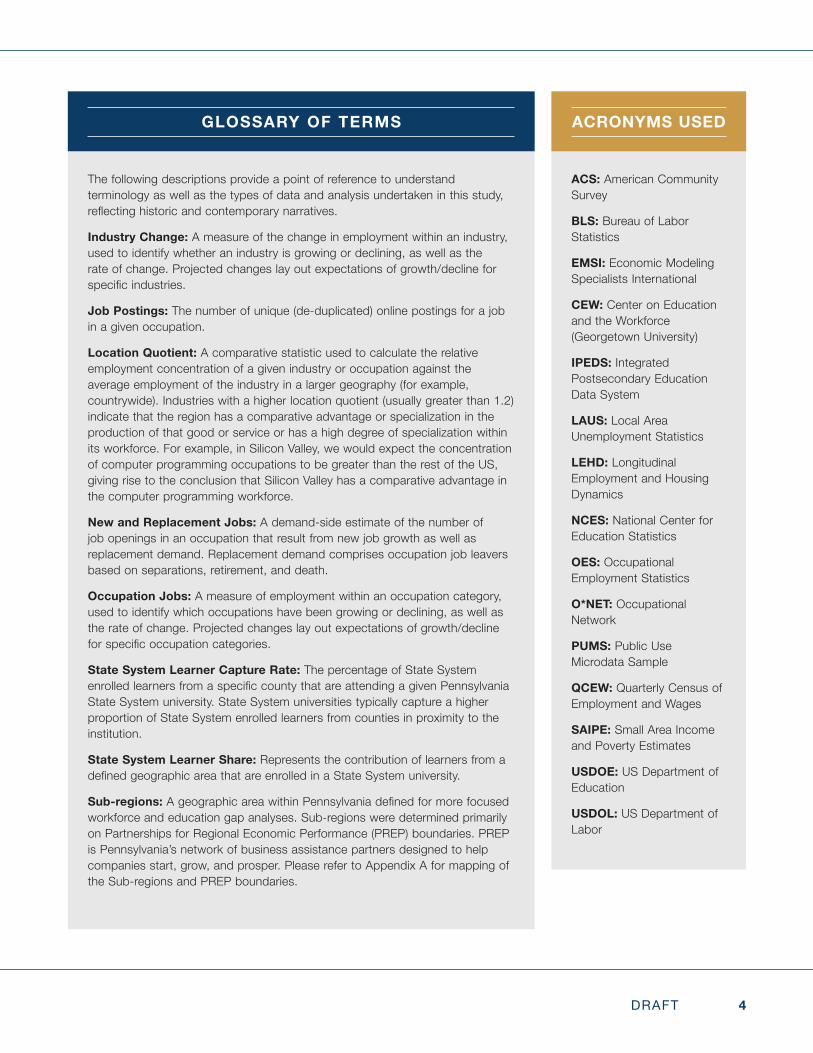
GLOSSARY OF TERMS
The following descriptions provide a point of reference to understand terminology as well as the types of data and analysis undertaken in this study, reflectinghistoricandcontemporarynarratives.
Industry Change: A measure of the change in employment within an industry, used to identify whether an industry is growing or declining, as well as the rate of change. Projected changes lay out expectations of growth/decline for specificindustries.
Job Postings: The number of unique (de-duplicated) online postings for a job in a given occupation.
Location Quotient: A comparative statistic used to calculate the relative employment concentration of a given industry or occupation against the average employment of the industry in a larger geography (for example, countrywide). Industries with a higher location quotient (usually greater than 1.2) indicate that the region has a comparative advantage or specialization in the production of that good or service or has a high degree of specialization within its workforce. For example, in Silicon Valley, we would expect the concentration of computer programming occupations to be greater than the rest of the US, giving rise to the conclusion that Silicon Valley has a comparative advantage in the computer programming workforce.
New and Replacement Jobs: A demand-side estimate of the number of job openings in an occupation that result from new job growth as well as replacement demand. Replacement demand comprises occupation job leavers based on separations, retirement, and death.
Occupation Jobs: A measure of employment within an occupation category, used to identify which occupations have been growing or declining, as well as the rate of change. Projected changes lay out expectations of growth/decline forspecificoccupationcategories.
State System Learner Capture Rate: The percentage of State System enrolledlearnersfromaspecificcountythatareattendingagivenPennsylvaniaState System university. State System universities typically capture a higher proportion of State System enrolled learners from counties in proximity to the institution.
State System Learner Share: Represents the contribution of learners from a definedgeographicareathatareenrolledinaStateSystemuniversity.
Sub-regions: AgeographicareawithinPennsylvaniadefinedformorefocusedworkforce and education gap analyses. Sub-regions were determined primarily on Partnerships for Regional Economic Performance (PREP) boundaries. PREP is Pennsylvania’s network of business assistance partners designed to help companies start, grow, and prosper. Please refer to Appendix A for mapping of the Sub-regions and PREP boundaries.
ACRONYMS USED
ACS: American Community Survey
BLS: Bureau of Labor Statistics
EMSI: Economic Modeling Specialists International
CEW: Center on Education and the Workforce (Georgetown University)
IPEDS: Integrated Postsecondary Education Data System
LAUS: Local Area Unemployment Statistics
LEHD: Longitudinal Employment and Housing Dynamics
NCES: National Center for Education Statistics
OES: Occupational Employment Statistics
O*NET: Occupational Network
PUMS: Public Use Microdata Sample
QCEW: Quarterly Census of Employment and Wages
SAIPE: Small Area Income and Poverty Estimates
USDOE: US Department of Education
USDOL: US Department of Labor
5DRAFT
1. INTRODUCTION
Pennsylvania’s State System of Higher Education (State System) comprises 14 universities, four branch campuses, multiple regional centers and the McKeever Environmental Learning Center.1 The universities are located in rural, suburban, and small-town settings around Pennsylvania. The State System’s two educational hubs (with locations in Harrisburg, the Dixon University Center, and Philadelphia,StateSystem@CenterCity)offeracademicprogramsthroughaconsortium of public and private colleges and universities. Per Act 188 of 1982, the State System’s mission “is the provision of instruction for undergraduate and graduate students to and beyond the master’s degree in the liberal arts and sciences,andintheappliedfields,includingtheteachingprofession.”Indoingso, the State System’s purpose is “to provide high quality education at the lowestpossiblecosttostudents.”2 Analysis and understanding of the economy and workforce the State System supports, as well as future demands for talent advances the State System’s mission and philosophy—a key component of this report.Further,itenableseffectiveandtargetedstrategiesanddecision-making,grounded in data-driven evidence.
Like all institutions of higher education, the State System’s universities face challengesintheirefforttoidentifyandquantifyprogramneedsforPennsylvaniaresidents and businesses that demand talent. They must account for the changing economic and workforce dynamics within the region they support, such as industry and occupation growth/decline, as well as the changing quality of the area’s workforce. Furthermore, as technology progresses, a growing need to address increasingly complex and specialized occupational tasks requires additional customization to education. As a result, education institutions are increasingly called upon to incorporate relevant courses that meet the needs of students and businesses in their service area—a departure from traditional supply-based education towards a more employer demand-driven model.
Afundamentalchallengeforanyhighereducationsystemistofirstunderstandthe characteristics of the economy and workforce it supports. This study and
1 One of the State System’s entities, System-wide Functions and Services, is primarily located at the Dixon University Center in Harrisburg and includes: System-wide shared administrative services; System leadership functions of the Chancellor and Board of Governors; some System-wide initiatives and grants managed on behalf of the universities; and the academic, student, and facilities support for the multi-university sites in Harrisburg and Philadelphia.
2 Source: The State System’s Economic and Employment Impact on the Commonwealth of Pennsylvania – released April 15, 2015.
6DRAFT
the broader set of deliverables under the State System’s Supply/Demand Gap Analysis Project—hereinafter, Gap Analysis Project—will assist universities and education planners by providing an infrastructure of resources for internal planning, as well as external engagement. Understanding key economic aspects of the geography helps to better align policy and strategic direction in order to continue supporting the talent needs of Pennsylvania.
1.1 Pennsylvania’s State System of Higher Education Gap Analysis Project
In a fast-changing economic and social environment that is also experiencing rising costs for higher education, institutions are increasingly called upon to align their programs to the changing needs of the economy.
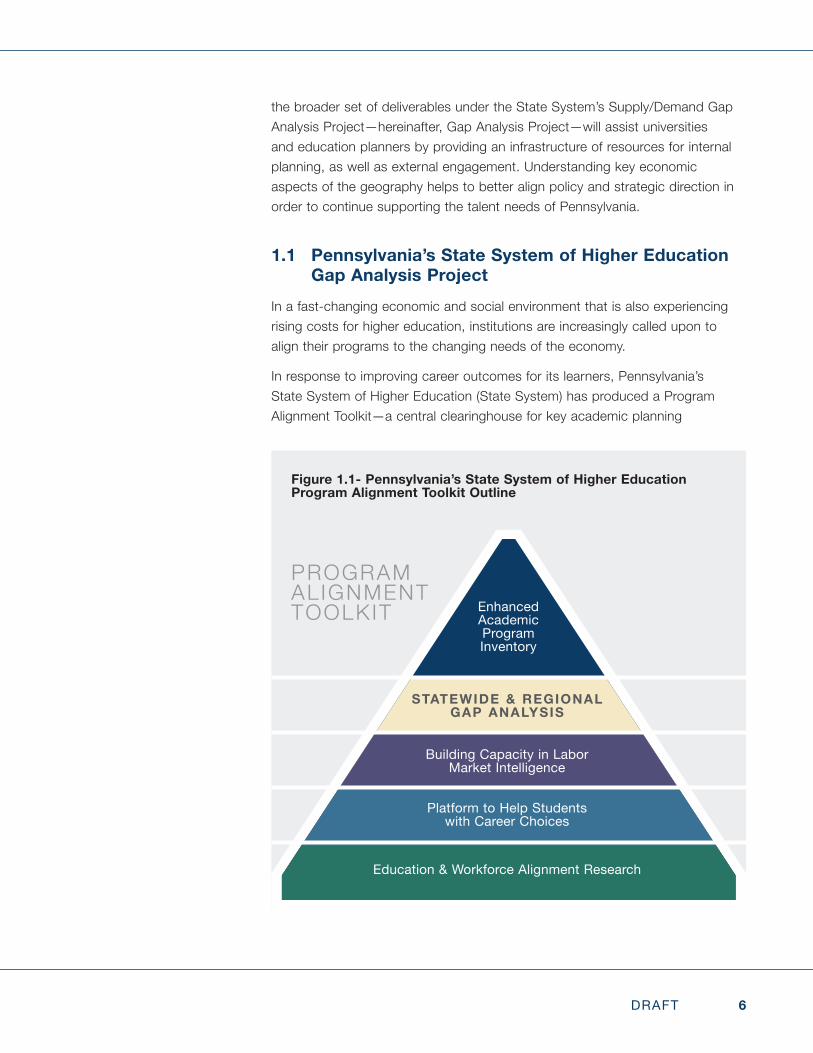
In response to improving career outcomes for its learners, Pennsylvania’s State System of Higher Education (State System) has produced a Program Alignment Toolkit—a central clearinghouse for key academic planning
Figure 1.1- Pennsylvania’s State System of Higher Education Program Alignment Toolkit Outline
Education & Workforce Alignment Research
Platform to Help Students with Career Choices
Building Capacity in Labor Market Intelligence
STATEWIDE & REGIONAL GAP ANALYSIS
Enhanced Academic Program Inventory
PROGRAM ALIGNMENT TOOLKIT
7DRAFT
information, developed in response to the State System’s Strategic Plan “Rising totheChallenge2020.”TheProgramAlignmentToolkithelpsprovidemultipleperspectives of how higher education can connect to the state’s economy and lead to career success for students. A key component of this toolkit is the development of a statewide and regional gap analysis. Other high impact strategies that are a part of the State System’s Program Alignment Toolkit are presented in Figure 1.1. The ultimate goal of this plan is to assist the State System’s fourteen universities to increase their individual and collective impact on Pennsylvania’s economy.
1.2 Goal of the Workforce Characteristics ReportThe State System’s Gap Analysis Project produced both a Workforce Characteristics Report and a Supply/Demand Gap Analysis Report for both thestateandfivesub-regions.TheWorkforceCharacteristicsReportcontainsa set of economic, workforce, demographic, and socio-economic information to contextualize the supply/demand gap analysis. The Supply/Demand Gap Analysis Report for Pennsylvania and its sub-regions provides a data-driven perspective of employer demand (new and replacement jobs by occupation in the state) and higher education supply (degree production by major program). The data sources utilized for the State System’s Gap Analysis Project are diverse including Bureau of Labor Statistics (BLS), U.S. Census Bureau, AmericanCommunitySurvey(ACS),SystemResearchOffice,NationalCenterfor Education Statistics (NCES, Integrated Postsecondary Education Data System), IMPLAN (Input/Output Model), and Economic Modeling Specialists International (EMSI). Ultimately, the reports generated from this project will assist the State System universities with strategic engagement, program development and evaluation, student engagement, and marketing.
The intentions of this Workforce Characteristics Report are fourfold.
• First, it provides a baseline reporting structure to evaluate workforce characteristics at the state level and sub-region level within Pennsylvania, which can be repeated in the future.
• Second,itidentifiessub-regionswithinPennsylvaniathatwillbeusedtoconductregionallyspecificanalysisinsubsequentreports.
• Third, it builds on CEW’s State System degree production report. The Workforce Characteristics Report is a data-driven analysis and discussion of trends in Pennsylvania’s economy, including projections of industry and occupational employment, key skilled high demand occupations, and changes in socio-economic characteristics.
8DRAFT
• Finally, this report creates the foundation to construct the State System’s Gap Analysis reports for the state and its regions and complements the content of the supply/demand gap analysis reports.
While the main body of this report provides a high level summary, the Appendices provide an abundance of information for those seeking additional detail. Appendix A provides a map of the state sub-region boundaries along with PREP and WIA boundaries. Appendix B provides detail on the employment and enrollment by each county in Pennsylvania. Appendix C provides nearly 300 detailed industry employment projections for the region along with a measure of competitiveness for each industry. Lastly, Appendix D provides a description of occupation levels and employment projections for over 400 detailed occupations.
9DRAFT
2. PENNSYLVANIA’S STATE SYSTEM LEARNER ORIGIN
This section provides an overview of where State System learners come from within Pennsylvania. It is then compared to where Pennsylvania’s workforce is employed. This information is combined with other relevant economic data to definesub-regionsaswellasuniversityworkforceregions—addingvaluablegeographic granularity to the State System’s program alignment toolkit.
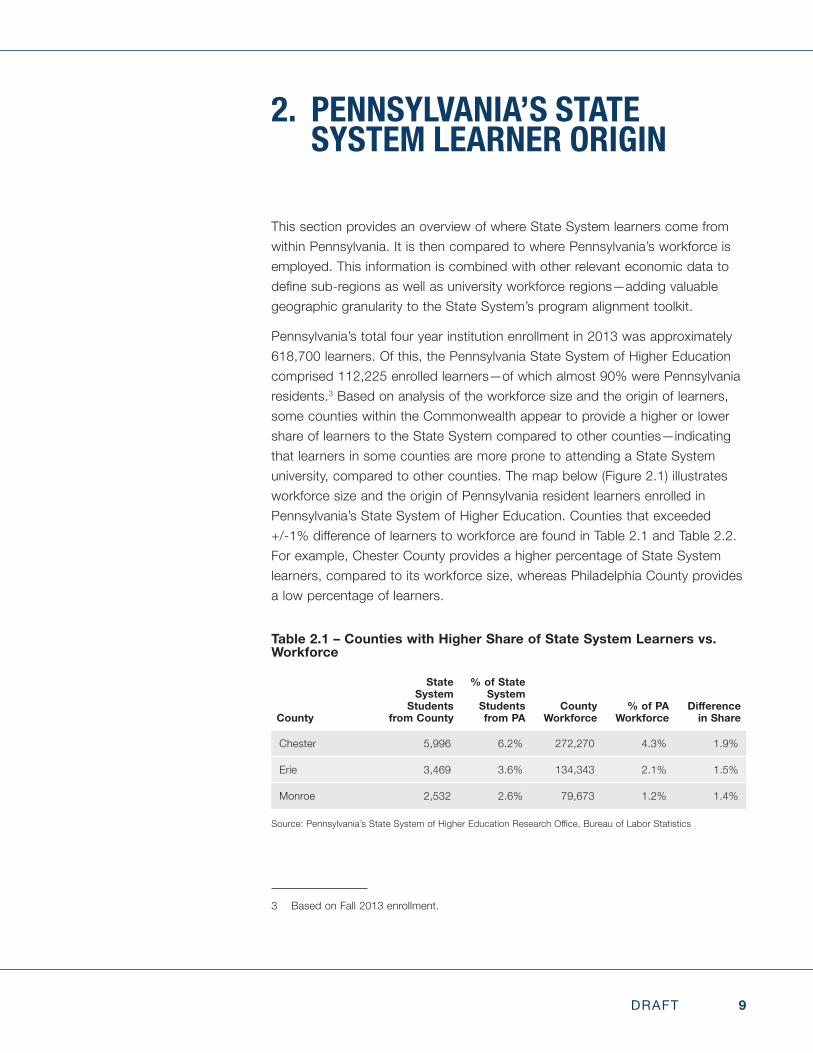
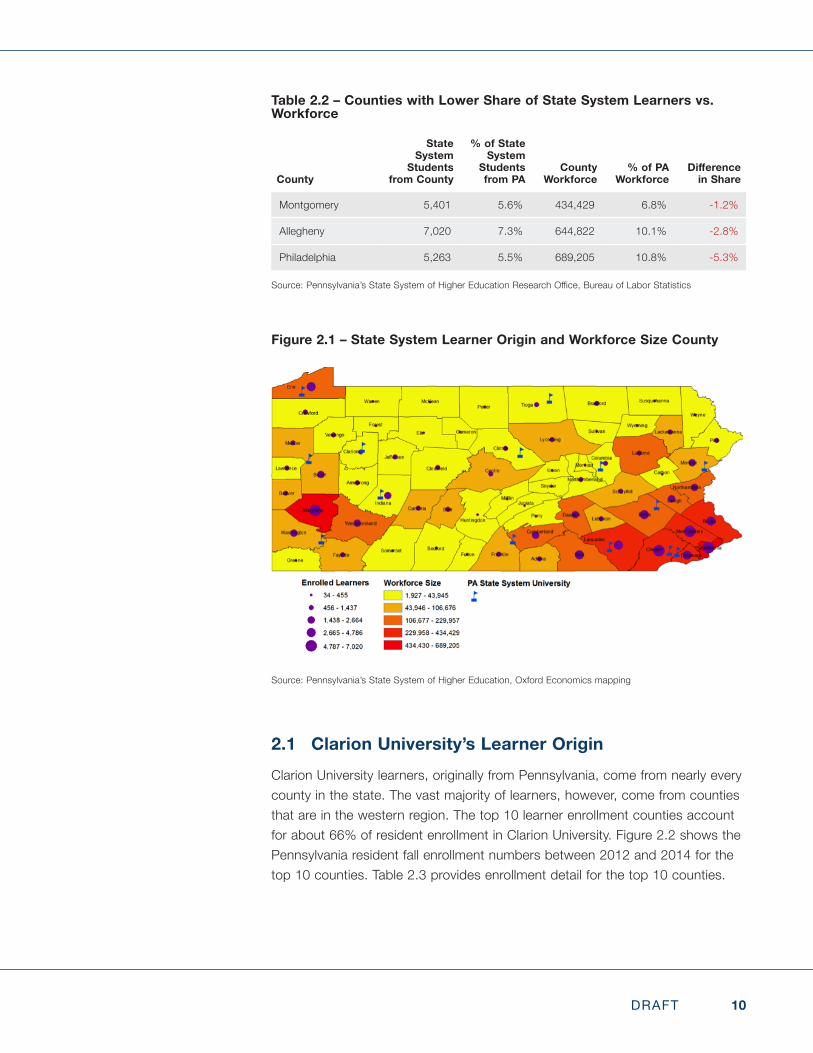
Pennsylvania’s total four year institution enrollment in 2013 was approximately 618,700 learners. Of this, the Pennsylvania State System of Higher Education comprised 112,225 enrolled learners—of which almost 90% were Pennsylvania residents.3 Based on analysis of the workforce size and the origin of learners, some counties within the Commonwealth appear to provide a higher or lower share of learners to the State System compared to other counties—indicating that learners in some counties are more prone to attending a State System university, compared to other counties. The map below (Figure 2.1) illustrates workforce size and the origin of Pennsylvania resident learners enrolled in Pennsylvania’s State System of Higher Education. Counties that exceeded +/-1%differenceoflearnerstoworkforcearefoundinTable2.1andTable2.2.For example, Chester County provides a higher percentage of State System learners, compared to its workforce size, whereas Philadelphia County provides a low percentage of learners.
3 Based on Fall 2013 enrollment.
Table 2.1 – Counties with Higher Share of State System Learners vs. Workforce
County
State System
Students from County
% of State System
Students from PA
County Workforce
% of PA Workforce
Difference in Share
Chester 5,996 6.2% 272,270 4.3% 1.9%
Erie 3,469 3.6% 134,343 2.1% 1.5%
Monroe 2,532 2.6% 79,673 1.2% 1.4%
Source:Pennsylvania’sStateSystemofHigherEducationResearchOffice,BureauofLaborStatistics
10DRAFT
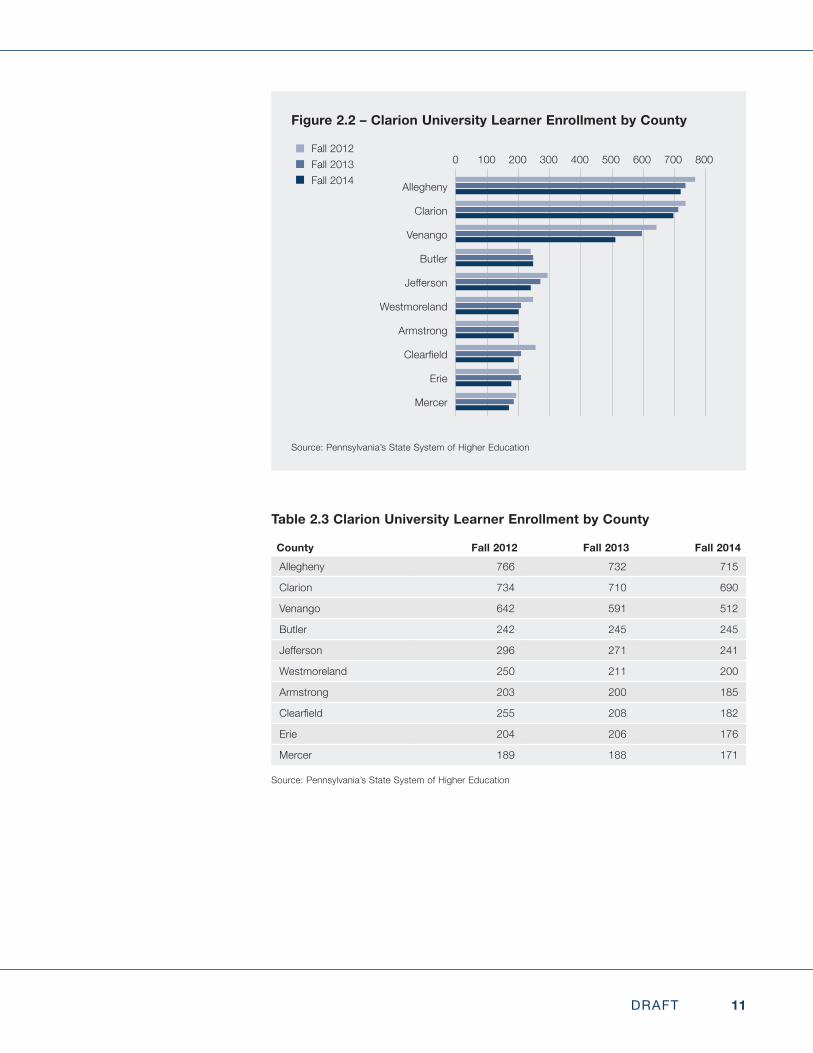
2.1 Clarion University’s Learner OriginClarion University learners, originally from Pennsylvania, come from nearly every county in the state. The vast majority of learners, however, come from counties that are in the western region. The top 10 learner enrollment counties account for about 66% of resident enrollment in Clarion University. Figure 2.2 shows the Pennsylvania resident fall enrollment numbers between 2012 and 2014 for the top 10 counties. Table 2.3 provides enrollment detail for the top 10 counties.
Table 2.2 – Counties with Lower Share of State System Learners vs. Workforce
County
State System
Students from County
% of State System
Students from PA
County Workforce
% of PA Workforce
Difference in Share
Montgomery 5,401 5.6% 434,429 6.8% -1.2%
Allegheny 7,020 7.3% 644,822 10.1% -2.8%
Philadelphia 5,263 5.5% 689,205 10.8% -5.3%
Source:Pennsylvania’sStateSystemofHigherEducationResearchOffice,BureauofLaborStatistics
Figure 2.1 – State System Learner Origin and Workforce Size County
Source: Pennsylvania’s State System of Higher Education, Oxford Economics mapping
11DRAFT
Figure 2.2 – Clarion University Learner Enrollment by County
Source: Pennsylvania’s State System of Higher Education
Allegheny
Clarion
Venango
Butler
Jefferson
Westmoreland
Armstrong
Clearfield
Erie
Mercer
Fall 2012Fall 2013Fall 2014
Table 2.3 Clarion University Learner Enrollment by County
County Fall 2012 Fall 2013 Fall 2014Allegheny 766 732 715
Clarion 734 710 690
Venango 642 591 512
Butler 242 245 245
Jefferson 296 271 241
Westmoreland 250 211 200
Armstrong 203 200 185
Clearfield 255 208 182
Erie 204 206 176
Mercer 189 188 171
Source: Pennsylvania’s State System of Higher Education
8005004002000 600300100 70099+95+83+31+38+32+26+33+26+2595+92+77+32+35+27+26+27+27+2493+90+66+32+31+26+24+24+23+22
12DRAFT
3. SUMMARY OF CLARION UNIVERSITY WORKFORCE REGION
Located in Clarion County, Pennsylvania, Clarion University (Clarion) supports the northwestern region of Pennsylvania’s State System of Higher Education. It provides a breadth of degree programs and serves a student population of about 6,100 learners, of which about 82% are Pennsylvania residents.4
The following sections outline the supporting data used to select Clarion’s workforceregion—definedasClarion,Armstrong,Butler,Venango,Jefferson,Elk, Forest, and Allegheny counties. Subsequent sections provide a brief analysis of economic, workforce, demographic and socio-economic information. The purpose of providing this analysis is to gain better insight into how the workforce region has changed over the past several years, as well as projections of how the area will continue to change over the next several years.
4 Based on Average Fall Enrollment 2012-2014.
A BRIEF NOTE ON DEVELOPING THE WORKFORCE REGION
Part of the geographic research and analysis involves central place theory— a geographical theory that seeks to explain the location and connectedness ofeconomicactivity.Morespecifically,thisresearchseekstoquantifytheinterconnectedness of local economies surrounding the State System universities. This is measured by workforce commuting and economic activity (i.e. industry production, supply chains, sales, etc.). An additional aspect involves the geographic connection between the university’s learners. The university’s ability to draw learners from the surrounding region helps contextualize the geographic footprint of the institution.
The full details of this process are described in Appendix A.
13DRAFT
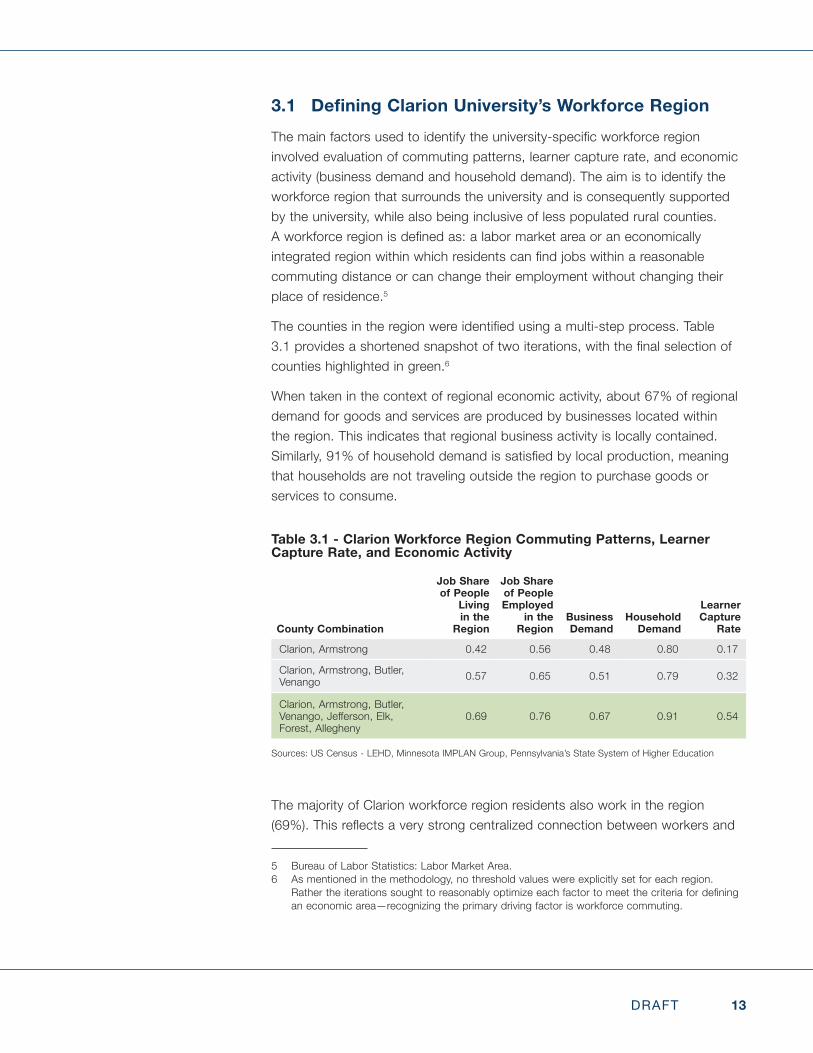
3.1 Defining Clarion University’s Workforce RegionThemainfactorsusedtoidentifytheuniversity-specificworkforceregioninvolved evaluation of commuting patterns, learner capture rate, and economic activity (business demand and household demand). The aim is to identify the workforce region that surrounds the university and is consequently supported by the university, while also being inclusive of less populated rural counties. Aworkforceregionisdefinedas:alabormarketareaoraneconomicallyintegratedregionwithinwhichresidentscanfindjobswithinareasonablecommuting distance or can change their employment without changing their place of residence.5
Thecountiesintheregionwereidentifiedusingamulti-stepprocess.Table3.1providesashortenedsnapshotoftwoiterations,withthefinalselectionofcounties highlighted in green.6
When taken in the context of regional economic activity, about 67% of regional demand for goods and services are produced by businesses located within the region. This indicates that regional business activity is locally contained. Similarly,91%ofhouseholddemandissatisfiedbylocalproduction,meaningthat households are not traveling outside the region to purchase goods or services to consume.
The majority of Clarion workforce region residents also work in the region (69%).Thisreflectsaverystrongcentralizedconnectionbetweenworkersand
5 Bureau of Labor Statistics: Labor Market Area.6 As mentioned in the methodology, no threshold values were explicitly set for each region.
Rathertheiterationssoughttoreasonablyoptimizeeachfactortomeetthecriteriafordefiningan economic area—recognizing the primary driving factor is workforce commuting.
Table 3.1 - Clarion Workforce Region Commuting Patterns, Learner Capture Rate, and Economic Activity
County Combination
Job Share of People
Living in the
Region
Job Share of People Employed
in the Region
Business Demand
Household Demand
Learner Capture
Rate
Clarion, Armstrong 0.42 0.56 0.48 0.80 0.17
Clarion, Armstrong, Butler, Venango 0.57 0.65 0.51 0.79 0.32
Clarion, Armstrong, Butler, Venango,Jefferson,Elk,Forest, Allegheny
0.69 0.76 0.67 0.91 0.54
Sources: US Census - LEHD, Minnesota IMPLAN Group, Pennsylvania’s State System of Higher Education
14DRAFT
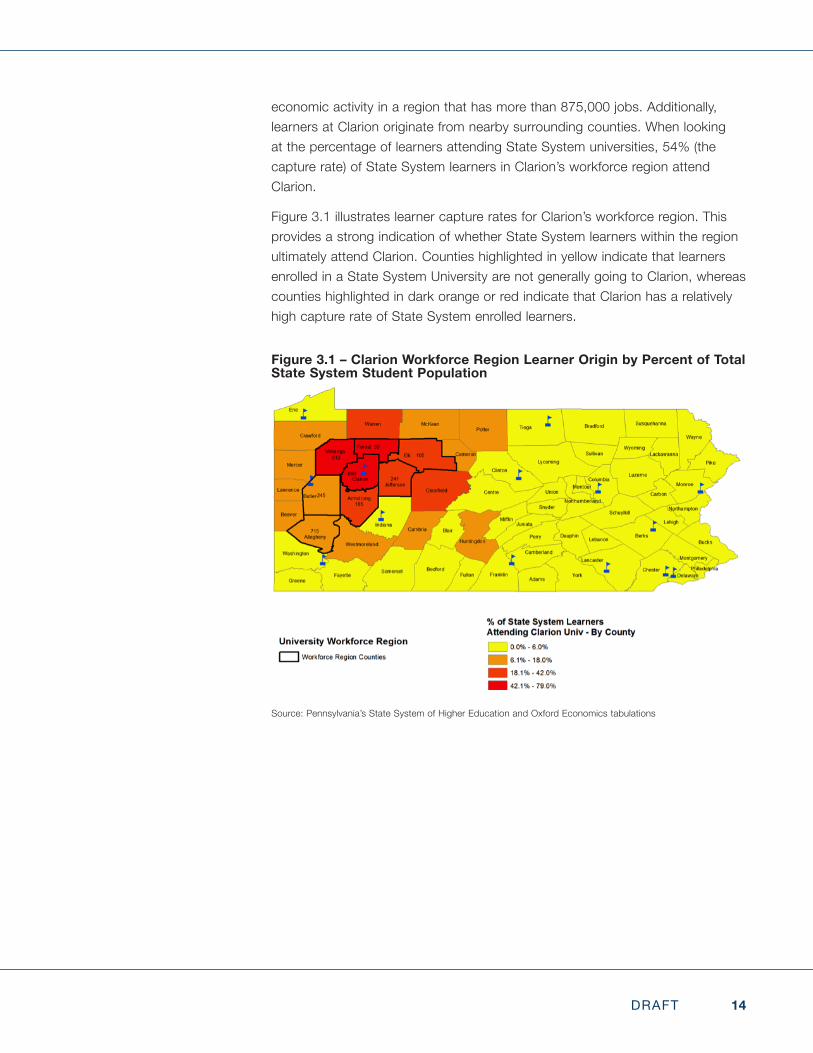
economic activity in a region that has more than 875,000 jobs. Additionally, learners at Clarion originate from nearby surrounding counties. When looking at the percentage of learners attending State System universities, 54% (the capture rate) of State System learners in Clarion’s workforce region attend Clarion.
Figure 3.1 illustrates learner capture rates for Clarion’s workforce region. This provides a strong indication of whether State System learners within the region ultimately attend Clarion. Counties highlighted in yellow indicate that learners enrolled in a State System University are not generally going to Clarion, whereas counties highlighted in dark orange or red indicate that Clarion has a relatively high capture rate of State System enrolled learners.
Figure 3.1 – Clarion Workforce Region Learner Origin by Percent of Total State System Student Population
Source: Pennsylvania’s State System of Higher Education and Oxford Economics tabulations
15DRAFT
4. LABOR MARKET OF CLARION UNIVERSITY’S WORKFORCE REGION
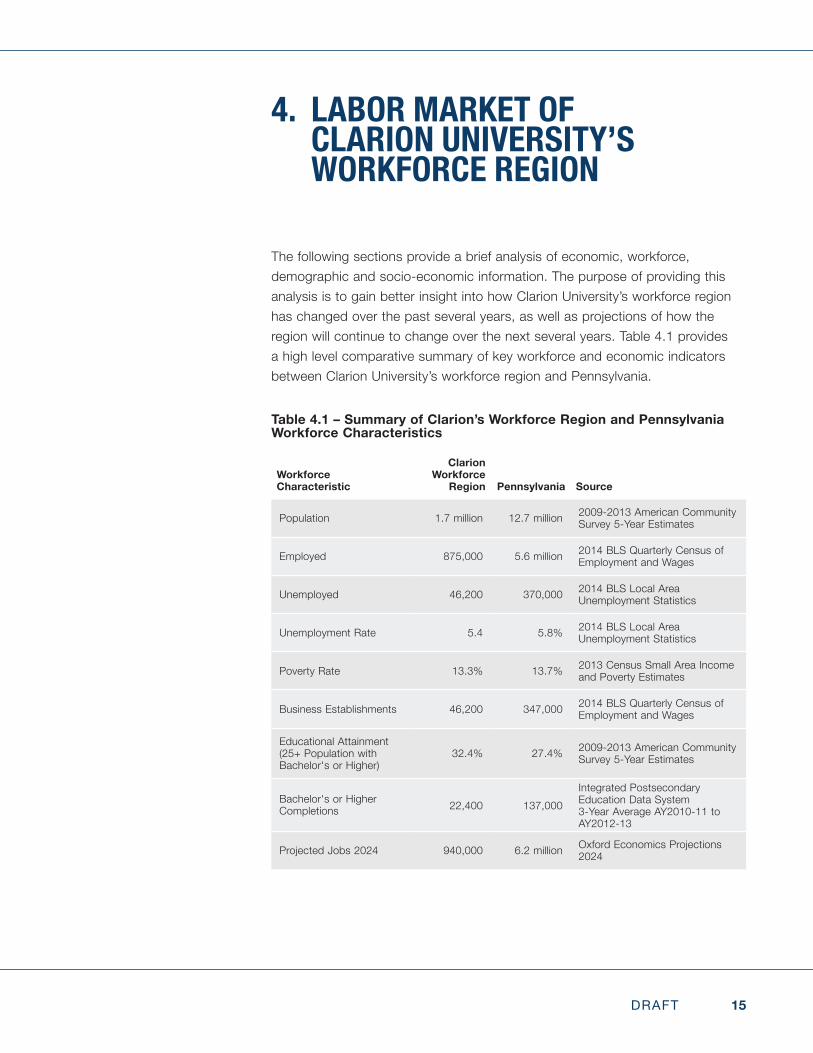
The following sections provide a brief analysis of economic, workforce, demographic and socio-economic information. The purpose of providing this analysis is to gain better insight into how Clarion University’s workforce region has changed over the past several years, as well as projections of how the region will continue to change over the next several years. Table 4.1 provides a high level comparative summary of key workforce and economic indicators between Clarion University’s workforce region and Pennsylvania.
Table 4.1 – Summary of Clarion’s Workforce Region and Pennsylvania Workforce Characteristics
Workforce Characteristic
Clarion Workforce
Region Pennsylvania Source
Population 1.7 million 12.7 million 2009-2013 American Community Survey 5-Year Estimates
Employed 875,000 5.6 million 2014 BLS Quarterly Census of Employment and Wages
Unemployed 46,200 370,000 2014 BLS Local Area Unemployment Statistics
Unemployment Rate 5.4 5.8% 2014 BLS Local Area Unemployment Statistics
Poverty Rate 13.3% 13.7% 2013 Census Small Area Income and Poverty Estimates
Business Establishments 46,200 347,000 2014 BLS Quarterly Census of Employment and Wages
Educational Attainment (25+ Population with Bachelor's or Higher)
32.4% 27.4% 2009-2013 American Community Survey 5-Year Estimates
Bachelor's or Higher Completions 22,400 137,000
Integrated Postsecondary Education Data System 3-Year Average AY2010-11 to AY2012-13
Projected Jobs 2024 940,000 6.2 million Oxford Economics Projections 2024
16DRAFT
The analysis in the following sections is broken into three key sections, namely:
1. Industries – an evaluation of historic and current changes in sector employment, as well as top employers in the state.
2. Occupations – an evaluation of historic and projected changes in occupations, as well as more detailed analysis of key skilled occupations that align to university education.
‧ Top Skilled Occupations: largest skilled employed occupations and new & replacement job demand.
‧ KeySkilledHighDemandOccupations:fivekeyskilledoccupationsand new & replacement job demand.
‧ JobPostingAnalytics:analysisofjobpostingsvs.hiresforfivekeyskilled high demand occupations.
‧ IndustryStaffingPatterns:industryemploymentbreakdownforfivekey skilled high demand occupations.
‧ KeyOccupationalProfiles:regionaldemographicprofileforfivekeyskilled high demand occupations.
3. Demographics and Socio-economic Indicators – an evaluation of the demographicprofileofthepopulationofClarionUniversity’sworkforceregion. Also, a brief analysis of three key socio-economic indicators—educational attainment, unemployment, and poverty.
Each section is designed to provide additional context to the economic environment for the universities to consider broader aspects of strategic vision and program planning. Each section also provides the data-driven preparation for the next phase of research—namely the Supply/Demand Gap Analysis Report.
4.1 Employment ProjectionsCurrently, the industry and occupation employment projections available from Pennsylvania’sDepartmentofLaborandIndustryreflectthetimeperiodfrom2012–2022 and therefore do not incorporate much of the post-recession recovery that has taken place between 2012 and 2014. In order to capture recoveryandreflectcurrentemploymentdata,theStateSystemused4-digitNAICS (industry) and 5-digit SOC (occupation) projections to 2024 at the county level for Pennsylvania. The projections incorporate Quarterly Census of Employment and Wages (QCEW) data through 2014, and therefore contain themostrecentemploymentdatathatfurtherreflectstheeconomicrecovery.

17DRAFT
See Appendix C for 4-digit industry projections and Appendix D for 5-digit occupation projections.
OxfordEconomics,apremiereconomicmodelingandconsultingfirm,producedthe projections. By updating projections, Oxford Economics provided insight into new job growth which better measures occupational demand over the next 10 years.
The next section provides an analysis of industries in Clarion University’s workforce region with a focus on the post-recession recovery period 2009 to 2014, as well as top employers in the region.
18DRAFT
5. INDUSTRIES IN CLARION UNIVERSITY’S WORKFORCE REGION
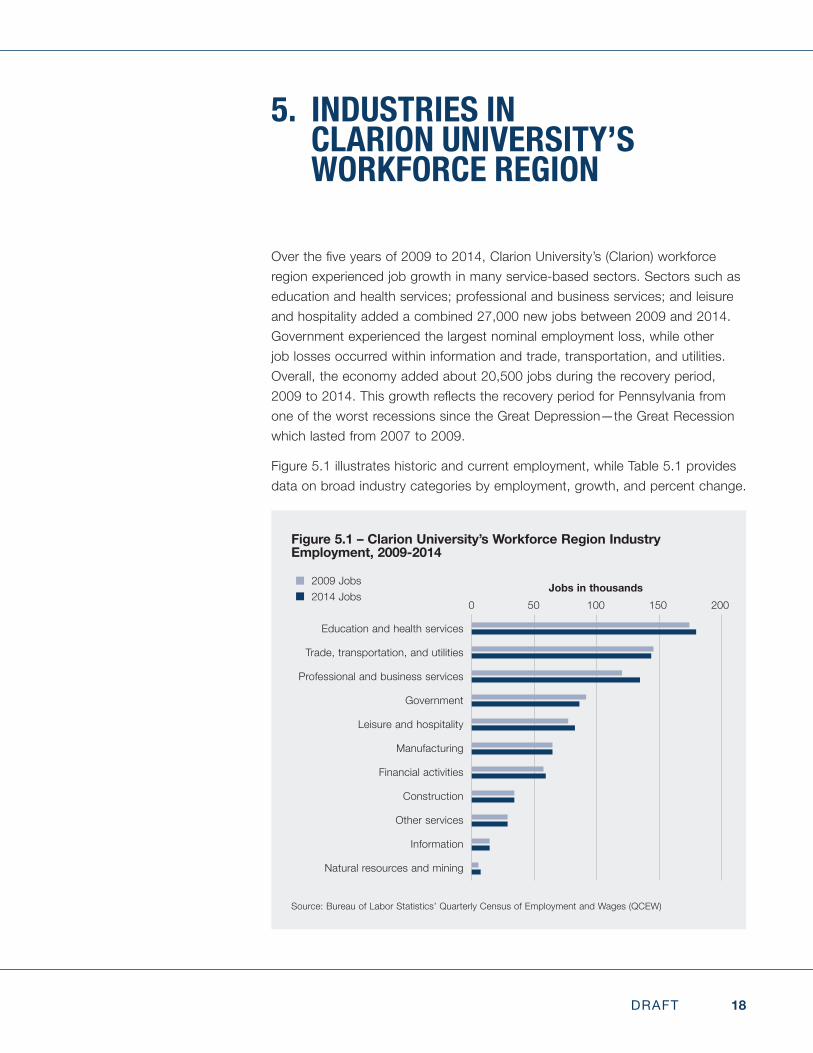
Overthefiveyearsof2009to2014,ClarionUniversity’s(Clarion)workforceregion experienced job growth in many service-based sectors. Sectors such as education and health services; professional and business services; and leisure and hospitality added a combined 27,000 new jobs between 2009 and 2014. Government experienced the largest nominal employment loss, while other job losses occurred within information and trade, transportation, and utilities. Overall, the economy added about 20,500 jobs during the recovery period, 2009to2014.ThisgrowthreflectstherecoveryperiodforPennsylvaniafromone of the worst recessions since the Great Depression—the Great Recession which lasted from 2007 to 2009.
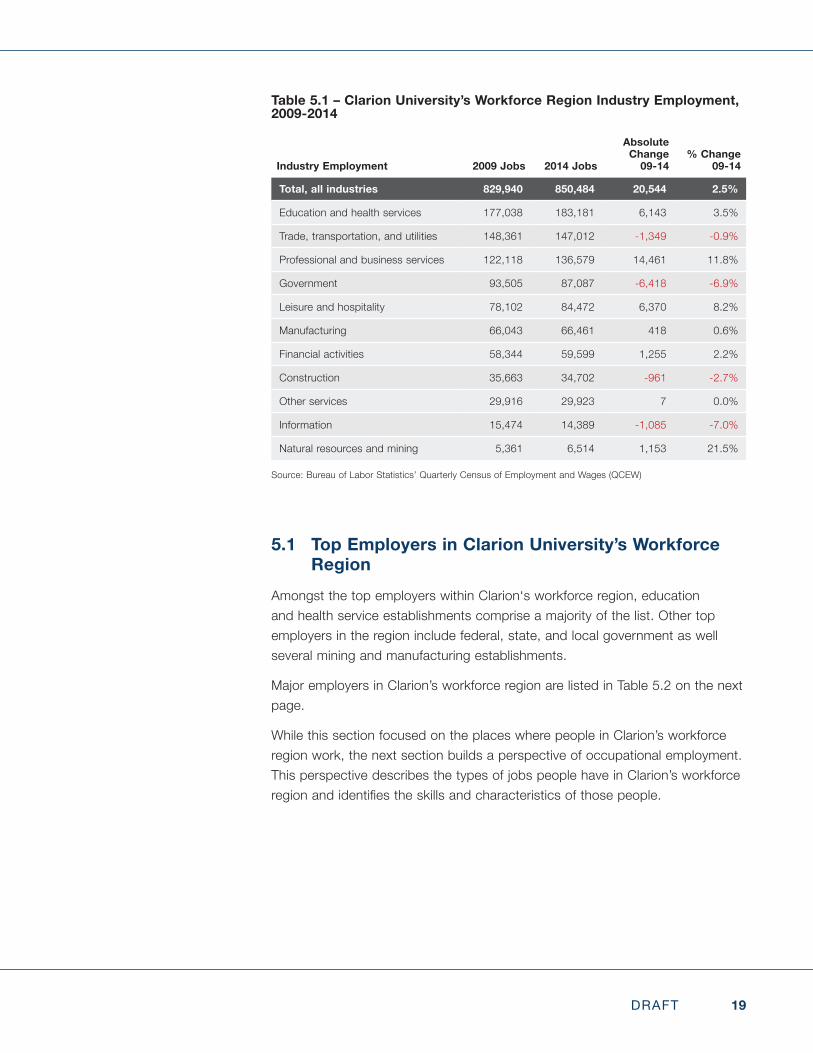
Figure 5.1 illustrates historic and current employment, while Table 5.1 provides data on broad industry categories by employment, growth, and percent change.
Figure 5.1 – Clarion University’s Workforce Region Industry Employment, 2009-2014
Source: Bureau of Labor Statistics’ Quarterly Census of Employment and Wages (QCEW)
Education and health services
Trade, transportation, and utilities
Professional and business services
Government
Leisure and hospitality
Manufacturing
Financial activities
Construction
Other services
Information
Natural resources and mining
2009 Jobs Jobs in thousands2014 Jobs 97+81+67+51+43+36+32+19+16+8+3
100+80+75+48+46+36+33+19+16+8+4200500 150100
19DRAFT
5.1 Top Employers in Clarion University’s Workforce Region
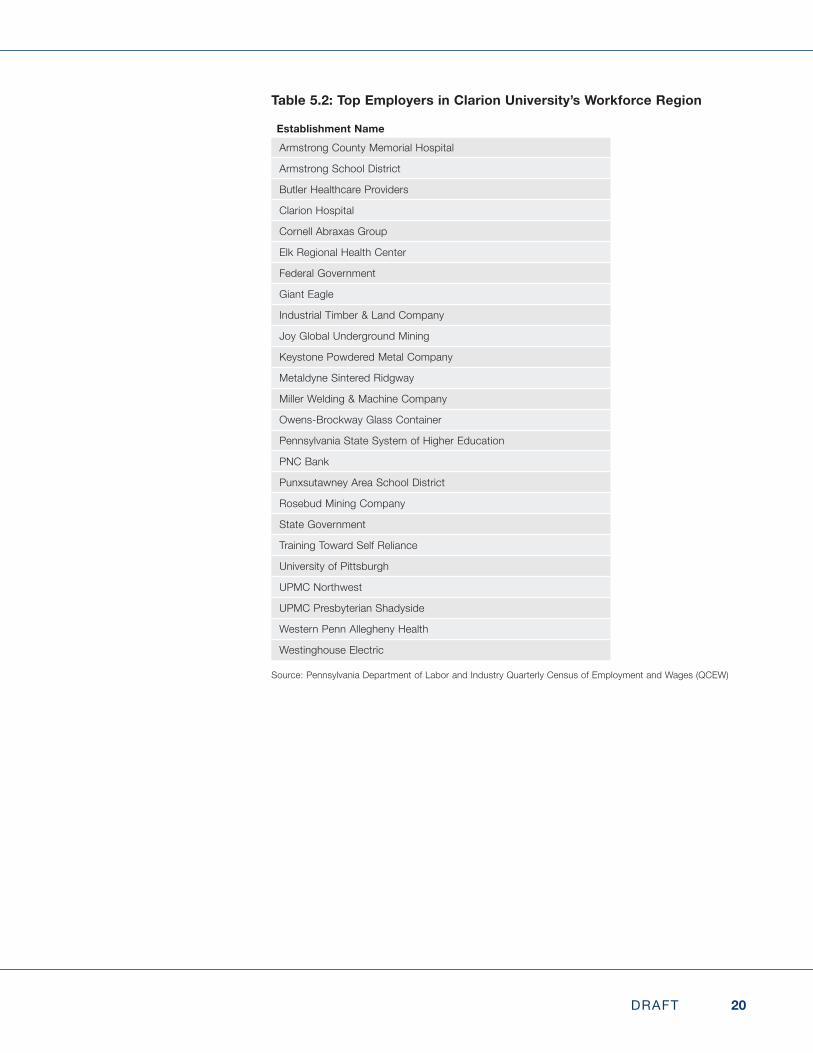
Amongst the top employers within Clarion‘s workforce region, education and health service establishments comprise a majority of the list. Other top employers in the region include federal, state, and local government as well several mining and manufacturing establishments.
Major employers in Clarion’s workforce region are listed in Table 5.2 on the next page.
While this section focused on the places where people in Clarion’s workforce region work, the next section builds a perspective of occupational employment. This perspective describes the types of jobs people have in Clarion’s workforce regionandidentifiestheskillsandcharacteristicsofthosepeople.
Table 5.1 – Clarion University’s Workforce Region Industry Employment, 2009-2014
Industry Employment 2009 Jobs 2014 Jobs
Absolute Change
09-14% Change
09-14
Total, all industries 829,940 850,484 20,544 2.5%
Education and health services 177,038 183,181 6,143 3.5%
Trade, transportation, and utilities 148,361 147,012 -1,349 -0.9%
Professional and business services 122,118 136,579 14,461 11.8%
Government 93,505 87,087 -6,418 -6.9%
Leisure and hospitality 78,102 84,472 6,370 8.2%
Manufacturing 66,043 66,461 418 0.6%
Financial activities 58,344 59,599 1,255 2.2%
Construction 35,663 34,702 -961 -2.7%
Other services 29,916 29,923 7 0.0%
Information 15,474 14,389 -1,085 -7.0%
Natural resources and mining 5,361 6,514 1,153 21.5%
Source: Bureau of Labor Statistics’ Quarterly Census of Employment and Wages (QCEW)
20DRAFT
Table 5.2: Top Employers in Clarion University’s Workforce Region
Establishment NameArmstrong County Memorial Hospital
Armstrong School District
Butler Healthcare Providers
Clarion Hospital
Cornell Abraxas Group
Elk Regional Health Center
Federal Government
Giant Eagle
Industrial Timber & Land Company
Joy Global Underground Mining
Keystone Powdered Metal Company
Metaldyne Sintered Ridgway
Miller Welding & Machine Company
Owens-Brockway Glass Container
Pennsylvania State System of Higher Education
PNC Bank
Punxsutawney Area School District
Rosebud Mining Company
State Government
Training Toward Self Reliance
University of Pittsburgh
UPMC Northwest
UPMC Presbyterian Shadyside
Western Penn Allegheny Health
Westinghouse Electric
Source: Pennsylvania Department of Labor and Industry Quarterly Census of Employment and Wages (QCEW)
21DRAFT
6. OCCUPATIONS IN CLARION UNIVERSITY’S WORKFORCE REGION
Theworkforcewithintheregioncanbeevaluatedfrommanydifferentanglesinordertobuildadeeperprofileofthequalitiesandattributesofworkers.Thenextfivesub-sectionsprovideinsightintothequalitiesofClarion’sworkforceregion, answering questions such as:
• What are the largest skilled occupations employed within the region?
• What are the key skilled high demand occupations that typically align to university-level education?
• Within the key skilled high demand occupations what is the current market demand in terms of jobs postings and hires?
• What sectors typically employ the key skilled high demand occupations?
• What type of demographic is typically found in key skilled high demand occupations?
Each perspective provides data-driven content for the universities to consider when engaging businesses, learners and program planners.
6.1 Skilled OccupationsThe O*NET program is the nation’s primary source of occupational information. Essential to the project is the O*NET database, containing information on hundredsofstandardizedandoccupation-specificdescriptors.7
Forthisanalysisa“skilled”occupationisdefinedasanoccupationinO*NETJob Zones Three, Four, or Five. A Job Zone is a group of occupations that are similar in how much education people need to do the work, how much related experience people need to do the work, and how much on-the-job training people need to do the work.8
Most occupations in Job Zone Three require training in vocational schools, related on-the-job experience, or an associate’s degree. Most occupations in
7 http://www.onetcenter.org/overview.html8 https://www.onetonline.org/help/online/zones
22DRAFT
Job Zone Four require a four-year bachelor’s degree, but some do not. Most occupations in Job Zone Five require graduate school. For example, they may require a master’s degree, and some require a Ph.D., M.D., or J.D. (law degree). For a more detailed description of O*NET Job Zones and training requirements see Appendix D.
Forthefivekeyskilledhighdemandoccupations,over50%ofthoseemployedhave attained an associate’s degree or higher and are generally associated with university-level education.
6.2 Top Skilled Occupations in Clarion University’s Workforce Region
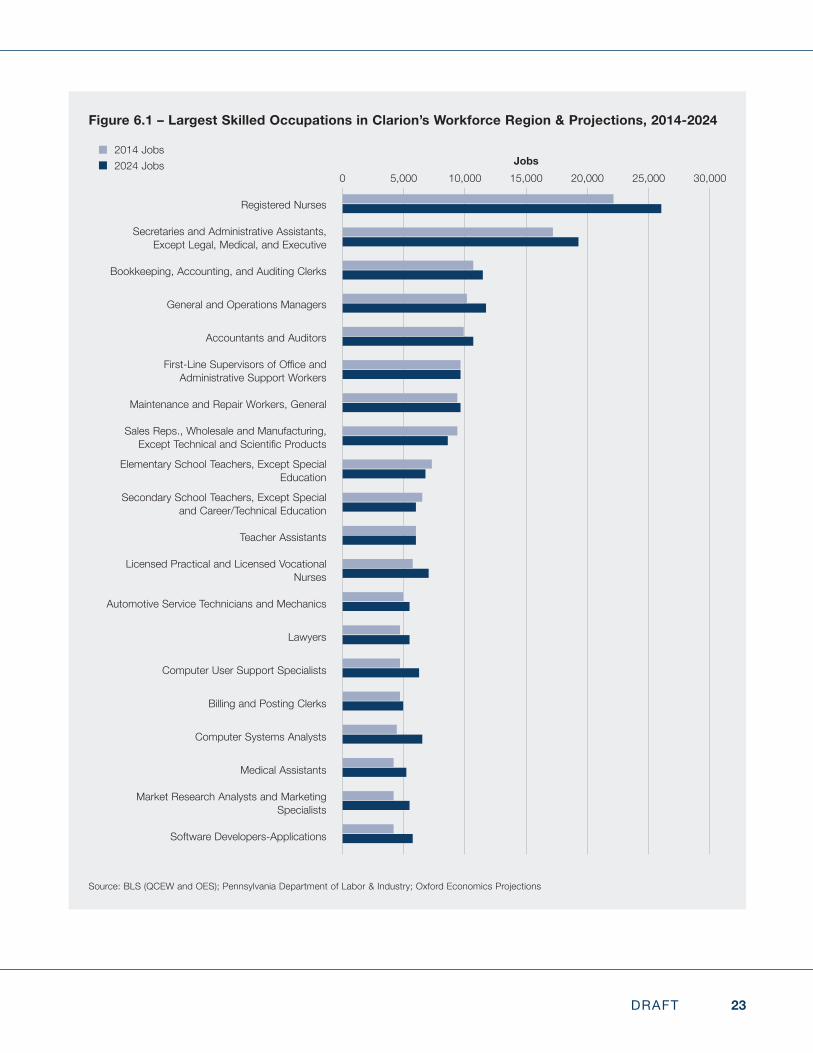
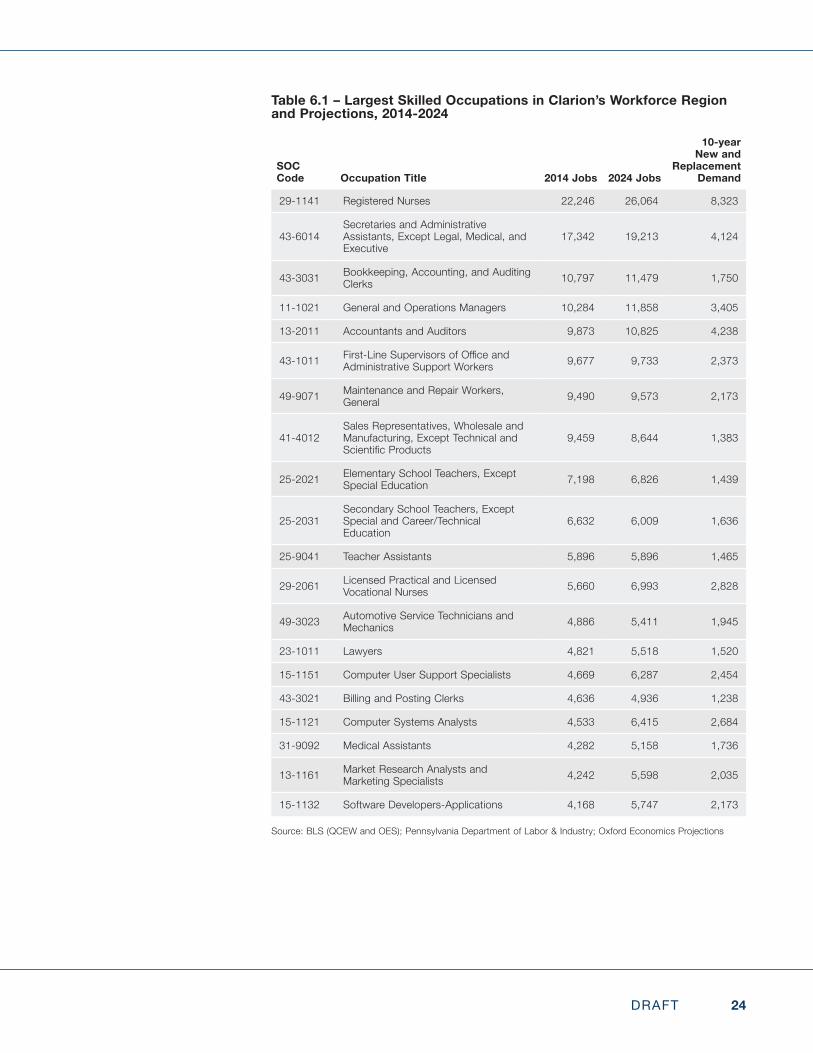
Top skilled occupations in the region are driven by industry composition. Medical centers employ a cadre of health professionals, while enterprise management companies employ a range of business professionals. Given the dominating presence of trade, transportation and utilities; education and health services; and manufacturing establishments in Clarion’s workforce region, top skilled occupations include: teachers, nurses, sales representatives, managers, and assistants. Figure 6.1 and Table 6.1 highlight the top 20 skilled occupations in the region, 10-year job growth projections, and new and replacement jobs.9
An important aspect to distinguish skilled occupations, in this sub-section, is that post-secondary education is not necessarily a pre-requisite for employment. However, a high percentage of those employed in the skilled occupation have a post-secondary education.
The next section provides a more narrow view of skilled occupations, focusing specificallyonoccupationsthataligntouniversity-leveleducationandhavehighdemand for new and replacement jobs.
9 New and replacement job change takes into account demand for occupations based on: industry growth (new jobs), occupation productivity, workforce ageing, migration and other factors that would contribute to new and replacement job openings.
23DRAFT
Figure 6.1 – Largest Skilled Occupations in Clarion’s Workforce Region & Projections, 2014-2024
Source: BLS (QCEW and OES); Pennsylvania Department of Labor & Industry; Oxford Economics Projections
Registered Nurses
Secretaries and Administrative Assistants, Except Legal, Medical, and Executive
Bookkeeping, Accounting, and Auditing Clerks
General and Operations Managers
Accountants and Auditors
First-LineSupervisorsofOfficeandAdministrative Support Workers
Maintenance and Repair Workers, General
Sales Reps., Wholesale and Manufacturing, ExceptTechnicalandScientificProducts
Elementary School Teachers, Except Special Education
Secondary School Teachers, Except Special and Career/Technical Education
Teacher Assistants
Licensed Practical and Licensed Vocational Nurses
Automotive Service Technicians and Mechanics
Lawyers
Computer User Support Specialists
Billing and Posting Clerks
Computer Systems Analysts
Medical Assistants
Market Research Analysts and Marketing Specialists
Software Developers-Applications
2014 JobsJobs2024 Jobs
5,0000 30,00010,000 20,000 25,00015,00085+66+41+39+38+37+36+36+28+25+23+22+19+18+18+18+17+16+16+16100+74+44+45+41+37+37+33+26+23+23+27+21+21+24+19+25+20+21+22
24DRAFT
Table 6.1 – Largest Skilled Occupations in Clarion’s Workforce Region and Projections, 2014-2024
SOC Code Occupation Title 2014 Jobs 2024 Jobs
10-year New and
Replacement Demand
29-1141 Registered Nurses 22,246 26,064 8,323
43-6014Secretaries and Administrative Assistants, Except Legal, Medical, and Executive
17,342 19,213 4,124
43-3031 Bookkeeping, Accounting, and Auditing Clerks 10,797 11,479 1,750
11-1021 General and Operations Managers 10,284 11,858 3,405
13-2011 Accountants and Auditors 9,873 10,825 4,238
43-1011 First-LineSupervisorsofOfficeandAdministrative Support Workers 9,677 9,733 2,373
49-9071 Maintenance and Repair Workers, General 9,490 9,573 2,173
41-4012Sales Representatives, Wholesale and Manufacturing, Except Technical and ScientificProducts
9,459 8,644 1,383
25-2021 Elementary School Teachers, Except Special Education 7,198 6,826 1,439
25-2031Secondary School Teachers, Except Special and Career/Technical Education
6,632 6,009 1,636
25-9041 Teacher Assistants 5,896 5,896 1,465
29-2061 Licensed Practical and Licensed Vocational Nurses 5,660 6,993 2,828
49-3023 Automotive Service Technicians and Mechanics 4,886 5,411 1,945
23-1011 Lawyers 4,821 5,518 1,520
15-1151 Computer User Support Specialists 4,669 6,287 2,454
43-3021 Billing and Posting Clerks 4,636 4,936 1,238
15-1121 Computer Systems Analysts 4,533 6,415 2,684
31-9092 Medical Assistants 4,282 5,158 1,736
13-1161 Market Research Analysts and Marketing Specialists 4,242 5,598 2,035
15-1132 Software Developers-Applications 4,168 5,747 2,173
Source: BLS (QCEW and OES); Pennsylvania Department of Labor & Industry; Oxford Economics Projections
25DRAFT
6.3 Key Skilled High Demand Occupations Aligning to University-level Education
Occupationdemandcanrepresentdifferentperspectivesofemploymentneed. One perspective evaluates demand due to growth of new jobs. It also represents the need for replacement jobs. When combined, new and replacement job projections provide a more realistic perspective of labor demand.
To support the occupational demand for new and replacement jobs, this analysis also evaluates real-time job posting data. By measuring the number ofuniquejobpostingsforaspecificjobtitle,whichisthentranslatedintoanoccupationclassification,itispossibletogaugereal-timedemand—anotherperspective of employment need. The number of unique postings provides guidance on real-time changes in occupations that companies may be seeking to hire. As with all datasets, job posting data have caveats. Discrepancies between postings and actual hires can be challenging to measure—wherein a job posting may not result in a hire for one occupation, but another job posting foradifferentoccupationmayresultinmultiplehires.10
This section looks at both perspectives—occupation demand using projections of new and replacement jobs as well as real-time job postings—in order to draw specificinsightintooccupationdemandwithinClarion’sworkforceregion.
6.3.1 New and Replacement Demand for Key Skilled High Demand Occupations
Many skilled occupations exist in Pennsylvania. Demand for new and replacement jobs for key skilled high demand occupations that tie more closely to university-level programs are typically determined by the sheer size of the employment within the occupation and the demographic characteristics of thosewhoarecurrentlyemployed—specificallyage.Forexample,Pennsylvaniabusinesses employ approximately 54,400 accountants and auditors. Projections indicate that new employment for accountants and auditors will increase to about 60,000 by 2024—5,600 new jobs in 10 years. However, 47% of the employed accountants and auditors are over the age of 45, meaning that many of the currently employed accountants and auditors will likely retire over the next 10 years. This retirement will drive up the need to replace outgoing
10 Whenevaluatingjobspostings,aspecificcaveatfocusesonnetopeningsandjobsfilled(i.e.openings that result in an opportunity for a new entrant, rather than normal job turn wherein a workermovestoadifferentcompanyintheregionandtheirvacantjobisfilledbyyetanotherincumbent worker at another company).
26DRAFT
accountants and auditors with new workers—hence the reason we see nearly 23,700 new and replacement jobs (5,600 new and 18,100 replacement) for the occupation over the next 10 years.11
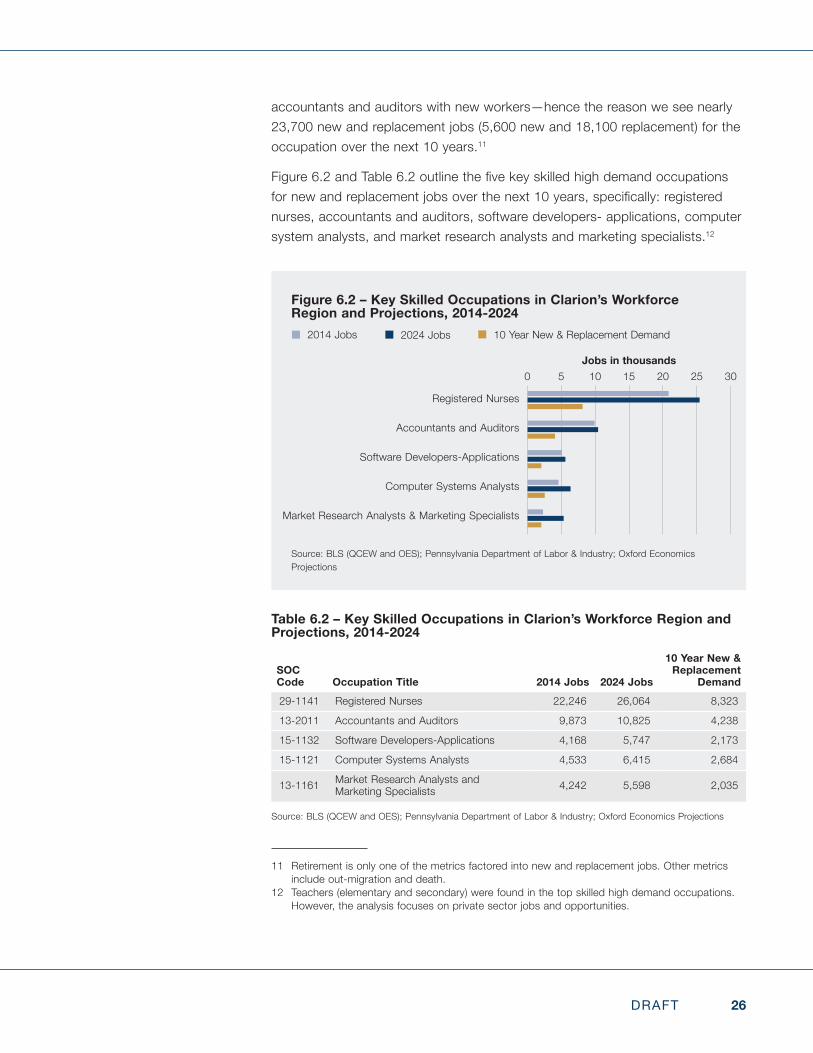
Figure6.2andTable6.2outlinethefivekeyskilledhighdemandoccupationsfornewandreplacementjobsoverthenext10years,specifically:registerednurses, accountants and auditors, software developers- applications, computer system analysts, and market research analysts and marketing specialists.12
11 Retirement is only one of the metrics factored into new and replacement jobs. Other metrics include out-migration and death.
12 Teachers (elementary and secondary) were found in the top skilled high demand occupations. However, the analysis focuses on private sector jobs and opportunities.
Table 6.2 – Key Skilled Occupations in Clarion’s Workforce Region and Projections, 2014-2024
SOC Code Occupation Title 2014 Jobs 2024 Jobs
10 Year New & Replacement
Demand29-1141 Registered Nurses 22,246 26,064 8,323
13-2011 Accountants and Auditors 9,873 10,825 4,238
15-1132 Software Developers-Applications 4,168 5,747 2,173
15-1121 Computer Systems Analysts 4,533 6,415 2,684
13-1161 Market Research Analysts and Marketing Specialists 4,242 5,598 2,035
Source: BLS (QCEW and OES); Pennsylvania Department of Labor & Industry; Oxford Economics Projections
Figure 6.2 – Key Skilled Occupations in Clarion’s Workforce Region and Projections, 2014-2024
Source: BLS (QCEW and OES); Pennsylvania Department of Labor & Industry; Oxford Economics Projections
Registered Nurses
Accountants and Auditors
Software Developers-Applications
Computer Systems Analysts
Market Research Analysts & Marketing Specialists
2014 Jobs
Jobs in thousands
2024 Jobs 10 Year New & Replacement Demand
3020150 2510582+39+20+18+9100+41+22+25+2132+16+8+10+8
27DRAFT
While this section focused on 10-year new and replacement demand, the next section highlights the importance of current demand using real-time job posting analytics.
6.3.2 Real-Time Job Postings for Key Skilled High Demand Occupations
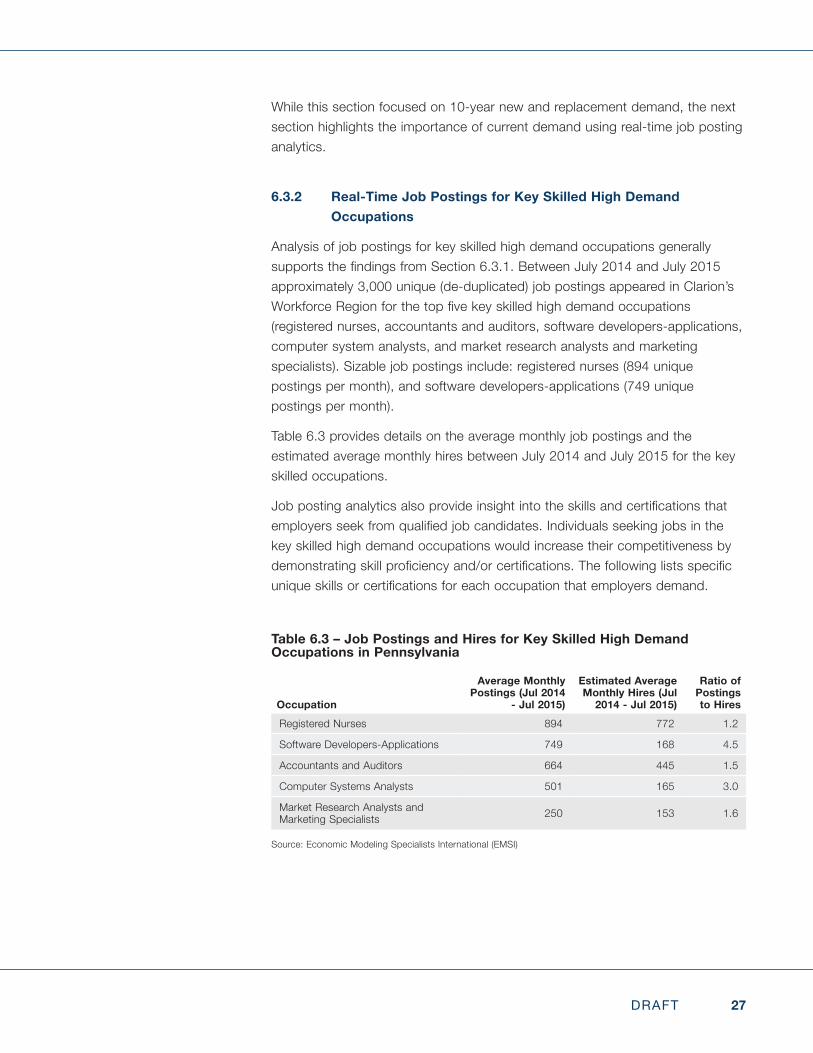
Analysis of job postings for key skilled high demand occupations generally supportsthefindingsfromSection6.3.1.BetweenJuly2014andJuly2015approximately 3,000 unique (de-duplicated) job postings appeared in Clarion’s WorkforceRegionforthetopfivekeyskilledhighdemandoccupations(registered nurses, accountants and auditors, software developers-applications, computer system analysts, and market research analysts and marketing specialists). Sizable job postings include: registered nurses (894 unique postings per month), and software developers-applications (749 unique postings per month).
Table 6.3 provides details on the average monthly job postings and the estimated average monthly hires between July 2014 and July 2015 for the key skilled occupations.
Jobpostinganalyticsalsoprovideinsightintotheskillsandcertificationsthatemployersseekfromqualifiedjobcandidates.Individualsseekingjobsinthekey skilled high demand occupations would increase their competitiveness by demonstratingskillproficiencyand/orcertifications.Thefollowinglistsspecificuniqueskillsorcertificationsforeachoccupationthatemployersdemand.
Table 6.3 – Job Postings and Hires for Key Skilled High Demand Occupations in Pennsylvania
Occupation
Average Monthly Postings (Jul 2014
- Jul 2015)
Estimated Average Monthly Hires (Jul
2014 - Jul 2015)
Ratio of Postings to Hires
Registered Nurses 894 772 1.2
Software Developers-Applications 749 168 4.5
Accountants and Auditors 664 445 1.5
Computer Systems Analysts 501 165 3.0
Market Research Analysts and Marketing Specialists 250 153 1.6
Source: Economic Modeling Specialists International (EMSI)
28DRAFT
Registered Nurses
Unique skills: acute care, surgery, schedule/record keeping
Certifications: Cardiopulmonary Resuscitation (CPR), Basic Life Support (BLS), Advanced Life Support (ALS), Registered Nurse (RN) license
Accountants and Auditors
Unique skills: audits,finance,GenerallyAcceptedAccountingPrinciples(GAAP)
Certifications: CertifiedPublicAccountant(CPA)
Computer Systems Analysts
Unique skills: information systems, SAP software, SQL programming, Oracle databases
Certifications: securityclearance,CertifiedInformationSystemsSecurityProfessional(CISSP),Microsoftcertifiedprofessional,CertifiedInformation Systems Auditor (CISA)
Market Research Analysts and Marketing Specialists
Unique skills: product marketing, product management, marketing concepts, market analysis, social media, product development, presentations
Certifications: Six Sigma, Project Management Professional (PMP)
Software Developers-Applications
Unique skills: software engineering, C++ programming language, API’s, Java programming language
Certifications: securityclearance,Microsoftcertifiedprofessional,CertifiedInformation Systems Security Professional (CISSP)
Thislistofskillsandcertificationsdonotencompasstheentiretyofskillsandcertificationsthatmayberequiredfordifferentindustrysectorsandjobfunctions.However,theseskillsreflectthegeneralonlinejobpostingminimumqualificationsforthoseseekingtoapplytooneoftheoccupations.
The next section builds a broader sense of which industry sectors typically employeachofthetopfiveskilledhighdemandoccupations.
29DRAFT
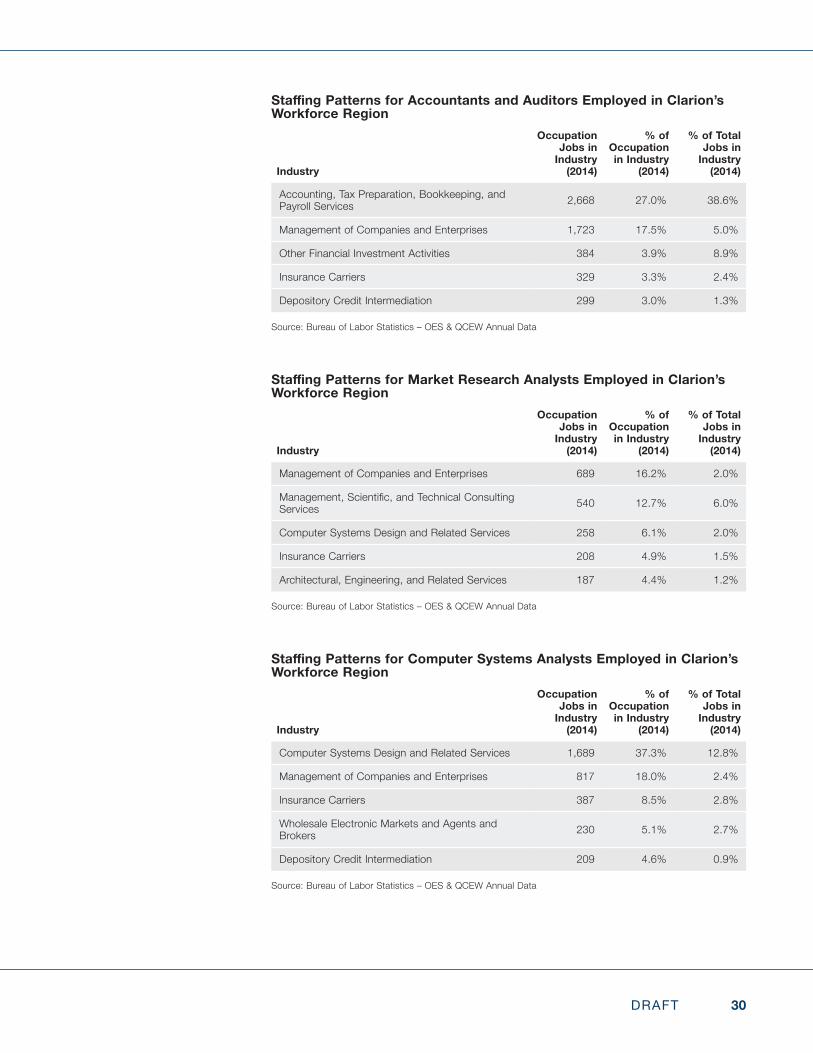
6.4 Industry Staffing Patterns for Key Skilled High Demand Occupations in Clarion University’s Workforce Region
Understanding which industries employ key skilled occupations is helpful when engaging businesses as well as communicating programs and potential career opportunities to learners. Also knowing the industries that predominately employ certain occupations can help align program planning.
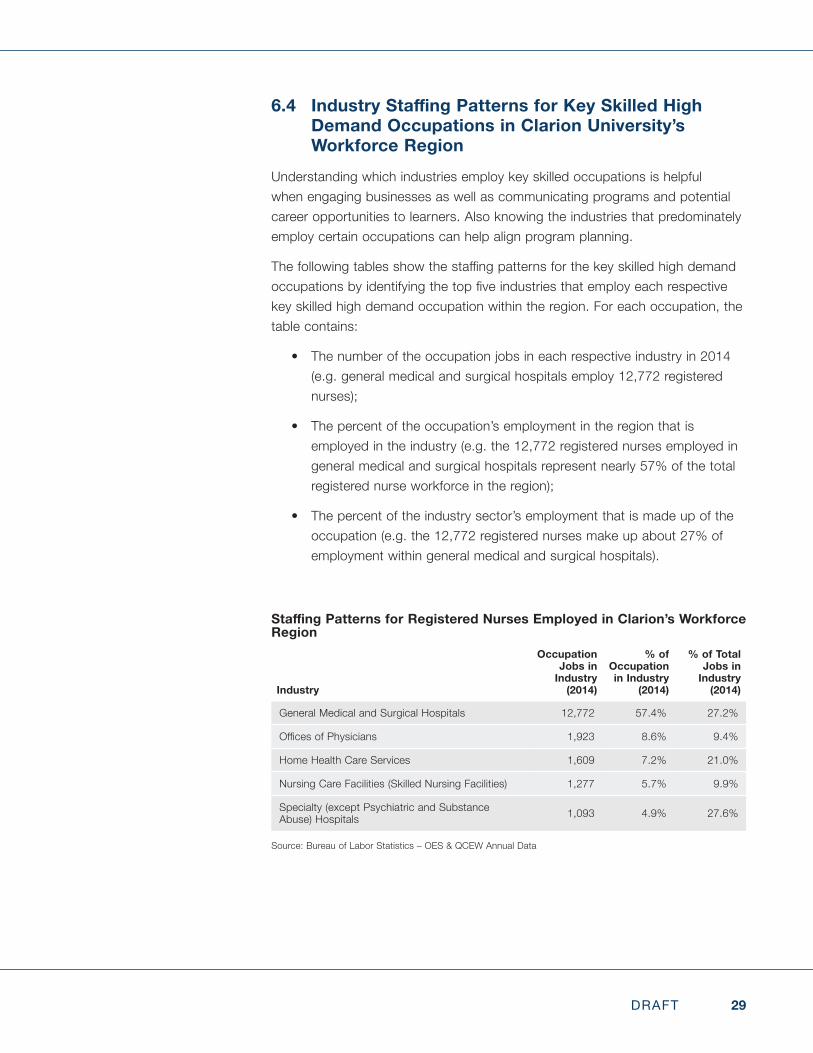
Thefollowingtablesshowthestaffingpatternsforthekeyskilledhighdemandoccupationsbyidentifyingthetopfiveindustriesthatemployeachrespectivekey skilled high demand occupation within the region. For each occupation, the table contains:
• The number of the occupation jobs in each respective industry in 2014 (e.g. general medical and surgical hospitals employ 12,772 registered nurses);
• The percent of the occupation’s employment in the region that is employed in the industry (e.g. the 12,772 registered nurses employed in general medical and surgical hospitals represent nearly 57% of the total registered nurse workforce in the region);
• The percent of the industry sector’s employment that is made up of the occupation (e.g. the 12,772 registered nurses make up about 27% of employment within general medical and surgical hospitals).
Staffing Patterns for Registered Nurses Employed in Clarion’s Workforce Region
Industry
Occupation Jobs in
Industry (2014)
% of Occupation in Industry
(2014)
% of Total Jobs in
Industry (2014)
General Medical and Surgical Hospitals 12,772 57.4% 27.2%
OfficesofPhysicians 1,923 8.6% 9.4%
Home Health Care Services 1,609 7.2% 21.0%
Nursing Care Facilities (Skilled Nursing Facilities) 1,277 5.7% 9.9%
Specialty (except Psychiatric and Substance Abuse) Hospitals 1,093 4.9% 27.6%
Source: Bureau of Labor Statistics – OES & QCEW Annual Data
30DRAFT
Staffing Patterns for Accountants and Auditors Employed in Clarion’s Workforce Region
Industry
Occupation Jobs in
Industry (2014)
% of Occupation in Industry
(2014)
% of Total Jobs in
Industry (2014)
Accounting, Tax Preparation, Bookkeeping, and Payroll Services 2,668 27.0% 38.6%
Management of Companies and Enterprises 1,723 17.5% 5.0%
Other Financial Investment Activities 384 3.9% 8.9%
Insurance Carriers 329 3.3% 2.4%
Depository Credit Intermediation 299 3.0% 1.3%
Source: Bureau of Labor Statistics – OES & QCEW Annual Data
Staffing Patterns for Market Research Analysts Employed in Clarion’s Workforce Region
Industry
Occupation Jobs in
Industry (2014)
% of Occupation in Industry
(2014)
% of Total Jobs in
Industry (2014)
Management of Companies and Enterprises 689 16.2% 2.0%
Management,Scientific,andTechnicalConsultingServices 540 12.7% 6.0%
Computer Systems Design and Related Services 258 6.1% 2.0%
Insurance Carriers 208 4.9% 1.5%
Architectural, Engineering, and Related Services 187 4.4% 1.2%
Source: Bureau of Labor Statistics – OES & QCEW Annual Data
Staffing Patterns for Computer Systems Analysts Employed in Clarion’s Workforce Region
Industry
Occupation Jobs in
Industry (2014)
% of Occupation in Industry
(2014)
% of Total Jobs in
Industry (2014)
Computer Systems Design and Related Services 1,689 37.3% 12.8%
Management of Companies and Enterprises 817 18.0% 2.4%
Insurance Carriers 387 8.5% 2.8%
Wholesale Electronic Markets and Agents and Brokers 230 5.1% 2.7%
Depository Credit Intermediation 209 4.6% 0.9%
Source: Bureau of Labor Statistics – OES & QCEW Annual Data
31DRAFT
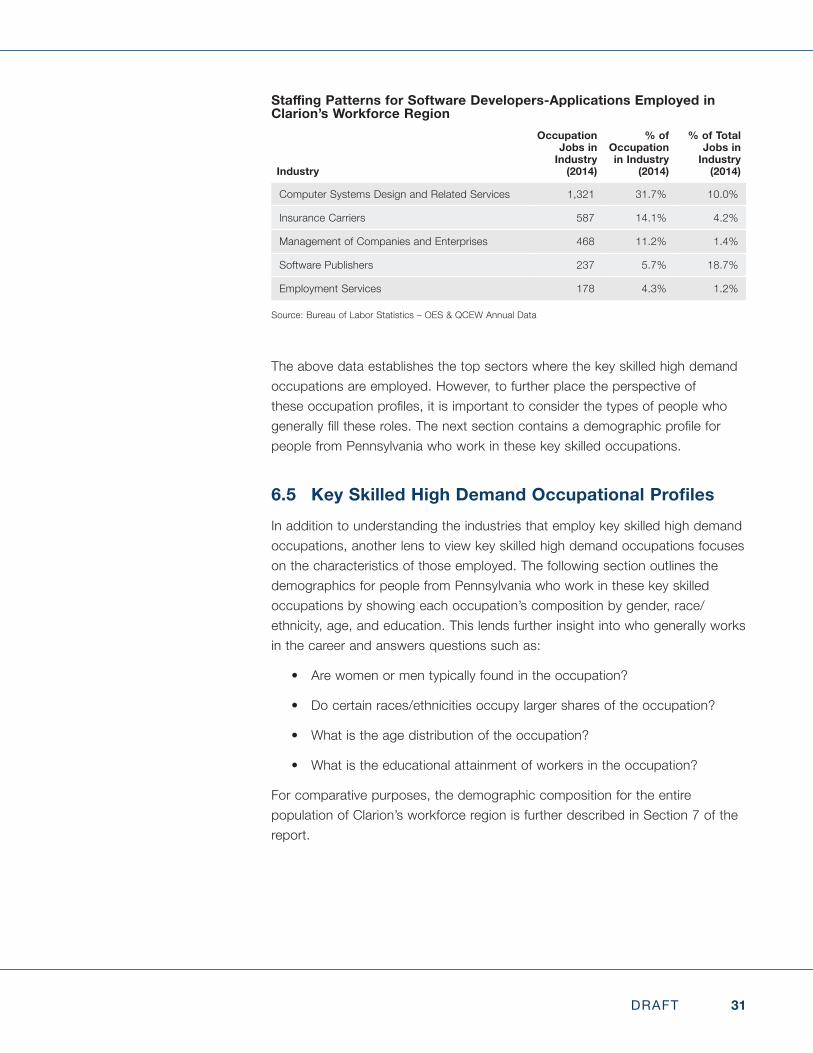
The above data establishes the top sectors where the key skilled high demand occupations are employed. However, to further place the perspective of theseoccupationprofiles,itisimportanttoconsiderthetypesofpeoplewhogenerallyfilltheseroles.Thenextsectioncontainsademographicprofileforpeople from Pennsylvania who work in these key skilled occupations.
6.5 Key Skilled High Demand Occupational ProfilesIn addition to understanding the industries that employ key skilled high demand occupations, another lens to view key skilled high demand occupations focuses on the characteristics of those employed. The following section outlines the demographics for people from Pennsylvania who work in these key skilled occupations by showing each occupation’s composition by gender, race/ethnicity, age, and education. This lends further insight into who generally works in the career and answers questions such as:
• Are women or men typically found in the occupation?
• Do certain races/ethnicities occupy larger shares of the occupation?
• What is the age distribution of the occupation?
• What is the educational attainment of workers in the occupation?
For comparative purposes, the demographic composition for the entire population of Clarion’s workforce region is further described in Section 7 of the report.
Staffing Patterns for Software Developers-Applications Employed in Clarion’s Workforce Region
Industry
Occupation Jobs in
Industry (2014)
% of Occupation in Industry
(2014)
% of Total Jobs in
Industry (2014)
Computer Systems Design and Related Services 1,321 31.7% 10.0%
Insurance Carriers 587 14.1% 4.2%
Management of Companies and Enterprises 468 11.2% 1.4%
Software Publishers 237 5.7% 18.7%
Employment Services 178 4.3% 1.2%
Source: Bureau of Labor Statistics – OES & QCEW Annual Data
32DRAFT
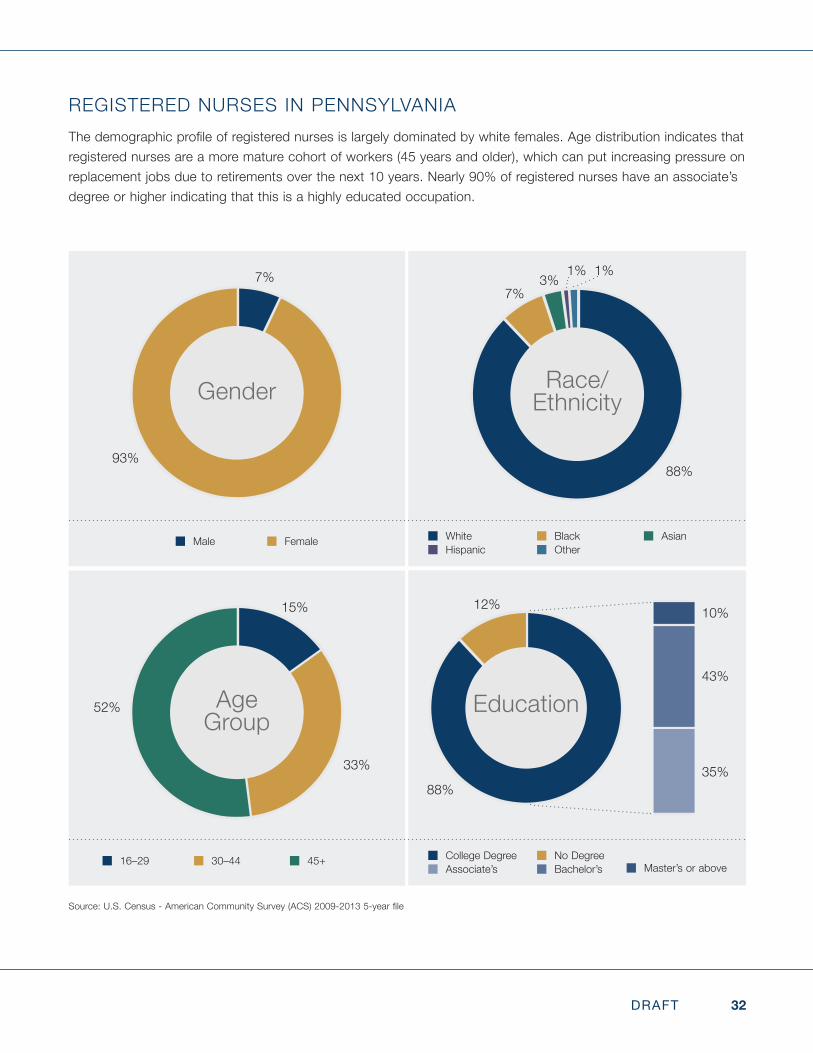
REGISTERED NURSES IN PENNSYLVANIAThedemographicprofileofregisterednursesislargelydominatedbywhitefemales.Agedistributionindicatesthatregistered nurses are a more mature cohort of workers (45 years and older), which can put increasing pressure on replacement jobs due to retirements over the next 10 years. Nearly 90% of registered nurses have an associate’s degree or higher indicating that this is a highly educated occupation.
Source:U.S.Census-AmericanCommunitySurvey(ACS)2009-20135-yearfile
7+93+G15+33+52+G 88+12+G
88+7+3+1+1+G88+78+35
Gender
Age Group
Race/ Ethnicity
7%
15%
33%
88%
7%3%
12%
88%
1% 1%
93%
52%
Male
16–29
White
College Degree
Hispanic
Associate’s
Female
30–44 45+
Black
No Degree
Other
Bachelor’s
Asian
Master’s or above
Education
10%
43%
35%
33DRAFT
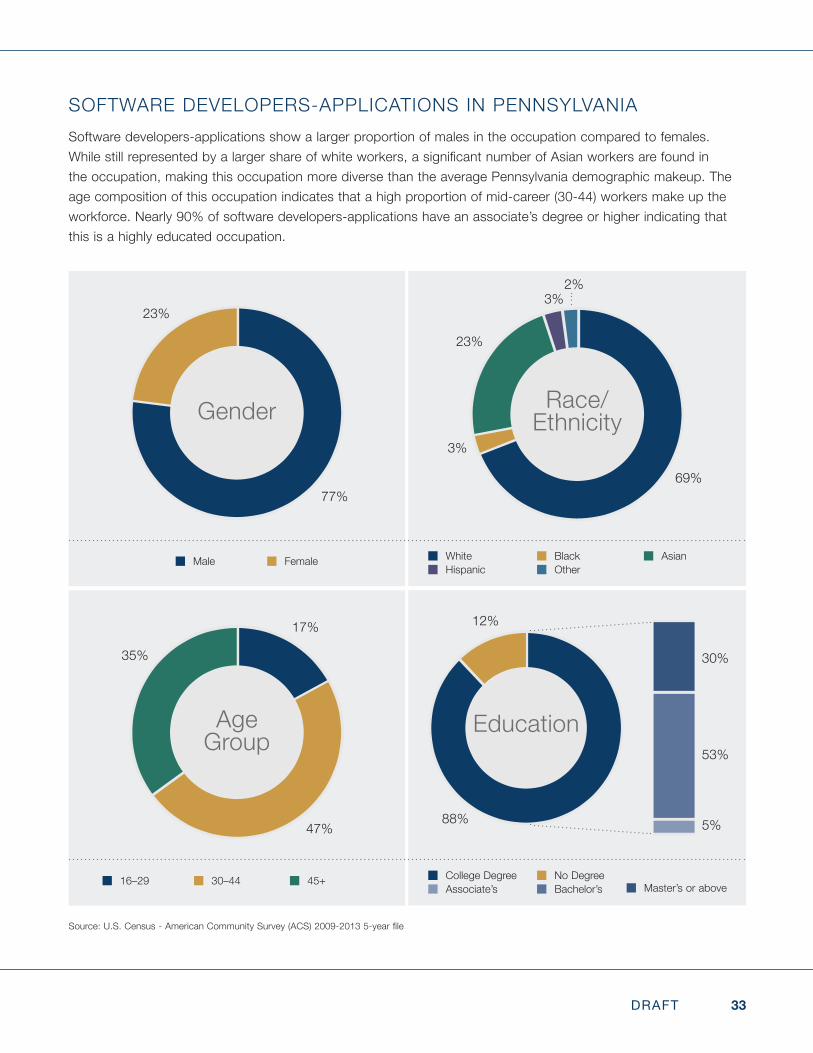
SOFTWARE DEVELOPERS-APPLICATIONS IN PENNSYLVANIASoftware developers-applications show a larger proportion of males in the occupation compared to females. Whilestillrepresentedbyalargershareofwhiteworkers,asignificantnumberofAsianworkersarefoundinthe occupation, making this occupation more diverse than the average Pennsylvania demographic makeup. The age composition of this occupation indicates that a high proportion of mid-career (30-44) workers make up the workforce. Nearly 90% of software developers-applications have an associate’s degree or higher indicating that this is a highly educated occupation.
Source:U.S.Census-AmericanCommunitySurvey(ACS)2009-20135-yearfile
77+23+G17+48+35+G 88+12+G
69+3+23+3+2+G88+58+5
Gender
Age Group
Race/ Ethnicity
77%
17%
47%
69%
3%
23%
12%
88%
3%2%
23%
35%
Male
16–29
White
College Degree
Hispanic
Associate’s
Female
30–44 45+
Black
No Degree
Other
Bachelor’s
Asian
Master’s or above
Education
30%
53%
5%
34DRAFT
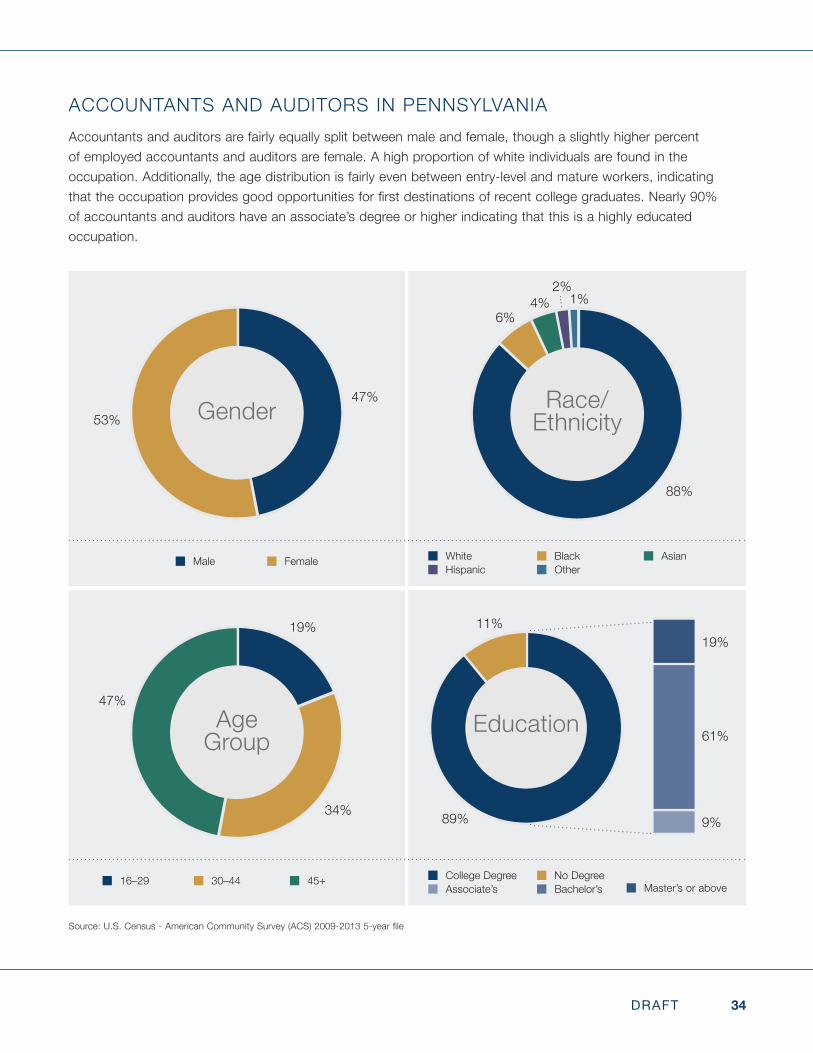
ACCOUNTANTS AND AUDITORS IN PENNSYLVANIAAccountants and auditors are fairly equally split between male and female, though a slightly higher percent of employed accountants and auditors are female. A high proportion of white individuals are found in the occupation. Additionally, the age distribution is fairly even between entry-level and mature workers, indicating thattheoccupationprovidesgoodopportunitiesforfirstdestinationsofrecentcollegegraduates.Nearly90%of accountants and auditors have an associate’s degree or higher indicating that this is a highly educated occupation.
Source:U.S.Census-AmericanCommunitySurvey(ACS)2009-20135-yearfile
47+53+G19+34+47+G 89+11+G
87+6+4+2+1+G89+70+9
Gender
Age Group
Race/ Ethnicity
47%
19%
34%
88%
6%4%
11%
89%
2%1%
53%
47%
Male
16–29
White
College Degree
Hispanic
Associate’s
Female
30–44 45+
Black
No Degree
Other
Bachelor’s
Asian
Master’s or above
Education
19%
61%
9%
35DRAFT
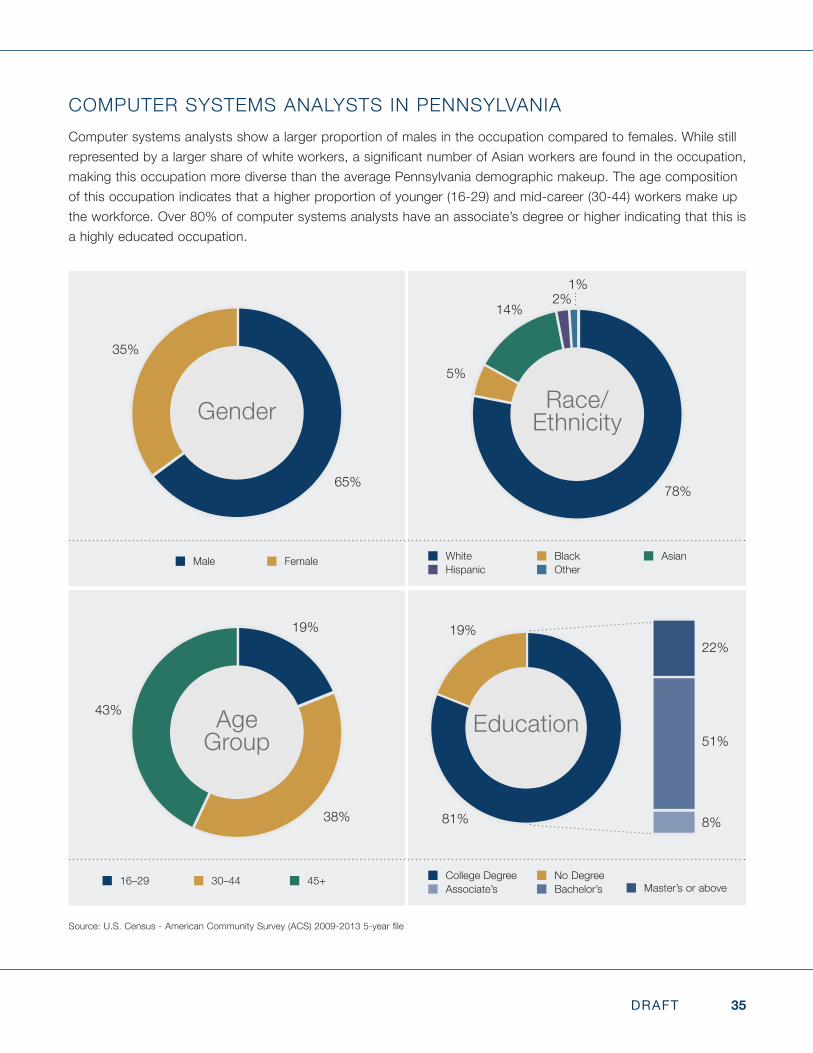
COMPUTER SYSTEMS ANALYSTS IN PENNSYLVANIAComputer systems analysts show a larger proportion of males in the occupation compared to females. While still representedbyalargershareofwhiteworkers,asignificantnumberofAsianworkersarefoundintheoccupation,making this occupation more diverse than the average Pennsylvania demographic makeup. The age composition of this occupation indicates that a higher proportion of younger (16-29) and mid-career (30-44) workers make up the workforce. Over 80% of computer systems analysts have an associate’s degree or higher indicating that this is a highly educated occupation.
Source:U.S.Census-AmericanCommunitySurvey(ACS)2009-20135-yearfile
65+35+G19+38+43+G 81+19+G
78+5+14+2+1+G81+59+8
Gender
Age Group
Race/ Ethnicity
65%
19%
38%
78%
5%
14%
19%
81%
2%1%
35%
43%
Male
16–29
White
College Degree
Hispanic
Associate’s
Female
30–44 45+
Black
No Degree
Other
Bachelor’s
Asian
Master’s or above
Education
22%
51%
8%
36DRAFT
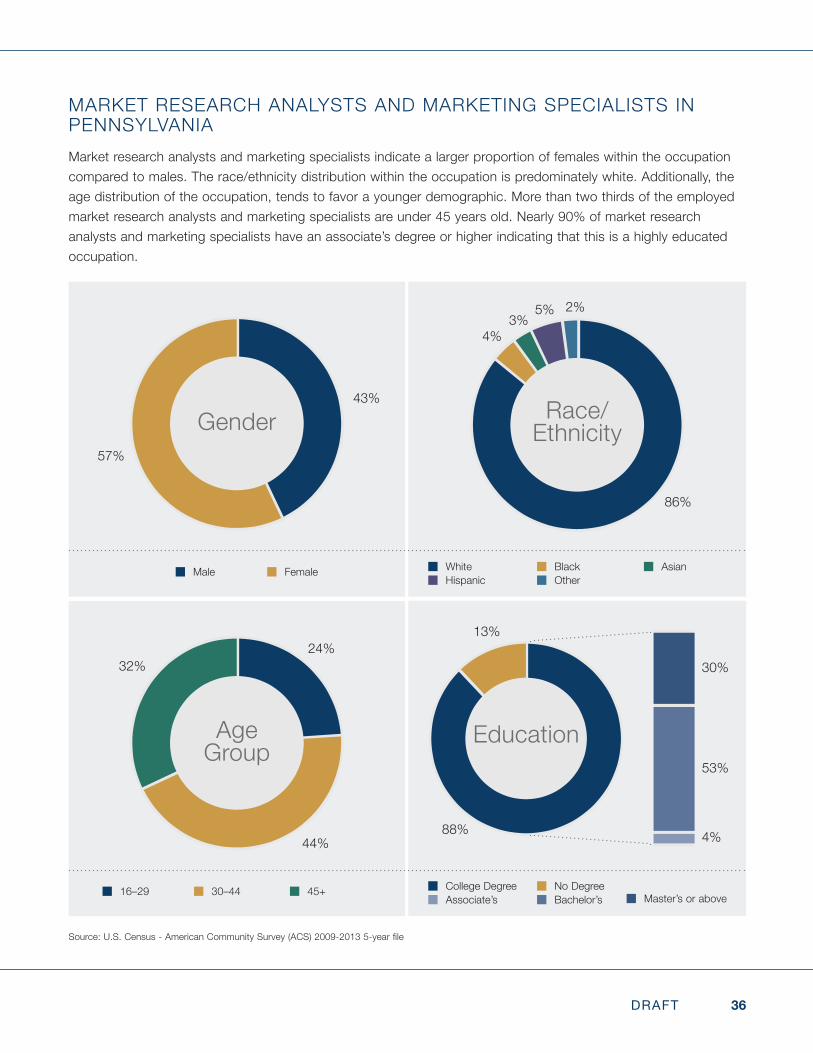
MARKET RESEARCH ANALYSTS AND MARKETING SPECIALISTS IN PENNSYLVANIAMarket research analysts and marketing specialists indicate a larger proportion of females within the occupation compared to males. The race/ethnicity distribution within the occupation is predominately white. Additionally, the age distribution of the occupation, tends to favor a younger demographic. More than two thirds of the employed market research analysts and marketing specialists are under 45 years old. Nearly 90% of market research analysts and marketing specialists have an associate’s degree or higher indicating that this is a highly educated occupation.
Source:U.S.Census-AmericanCommunitySurvey(ACS)2009-20135-yearfile
43+57+G24+44+32+G 88+12+G
86+4+3+5+2+G88+57+4
Gender
Age Group
Race/ Ethnicity
43%
24%
44%
86%
4%3%
13%
88%
5% 2%
57%
32%
Male
16–29
White
College Degree
Hispanic
Associate’s
Female
30–44 45+
Black
No Degree
Other
Bachelor’s
Asian
Master’s or above
Education
30%
53%
4%

37DRAFT
ThefinalsectionofthisreportexploresClarion’sworkforceregiondemographicandsocio-economiccharacteristics.Whilenottiedtoaspecificoccupation,theanalysis further contextualizes the region’s population and workforce.
38DRAFT
7. DEMOGRAPHIC AND SOCIO-ECONOMIC INDICATORS OF CLARION UNIVERSITY’S WORKFORCE REGION
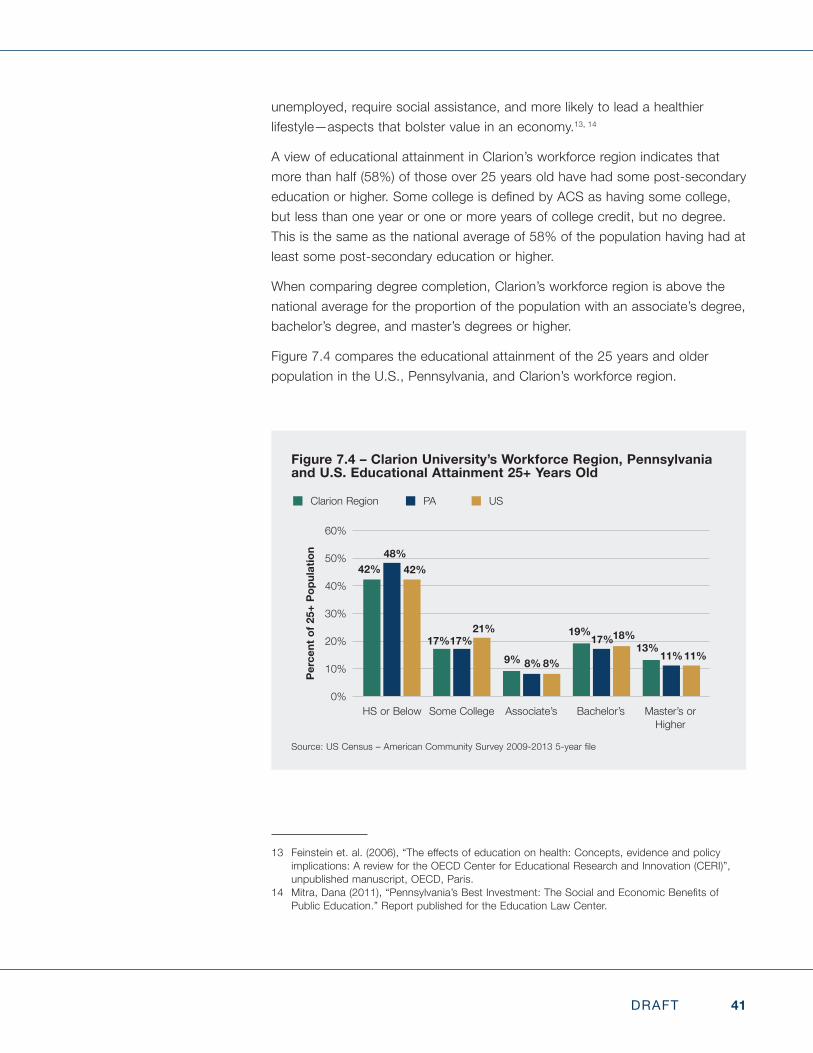
This section provides further information about the demographic and socio-economic composition of Clarion’s Workforce Region in order to better understand the characteristics of the population. An additional focus evaluates changes in age cohorts for university-age residents.
Analysis of three socio-economic indicators—education, unemployment, and poverty—also provides insight into the segment of the population that may be considered economically disadvantaged. Areas with high proportions of economically disadvantaged learners may require additional considerations in educationandfinancialsupport.
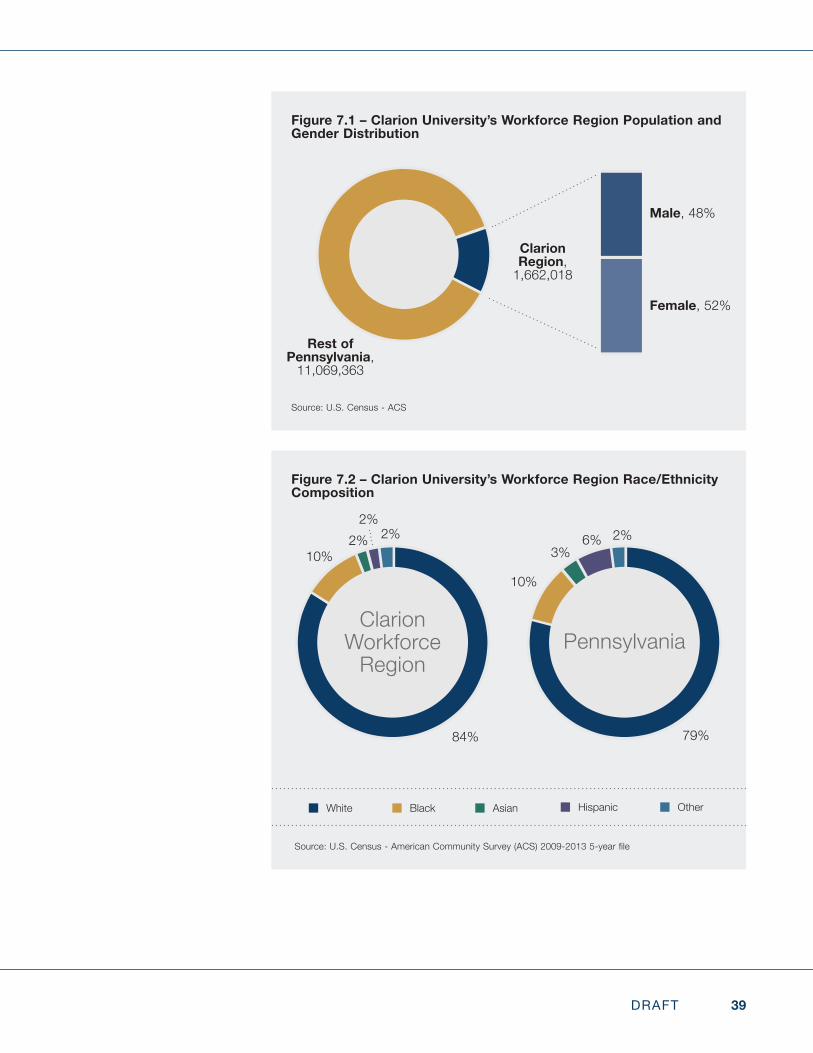
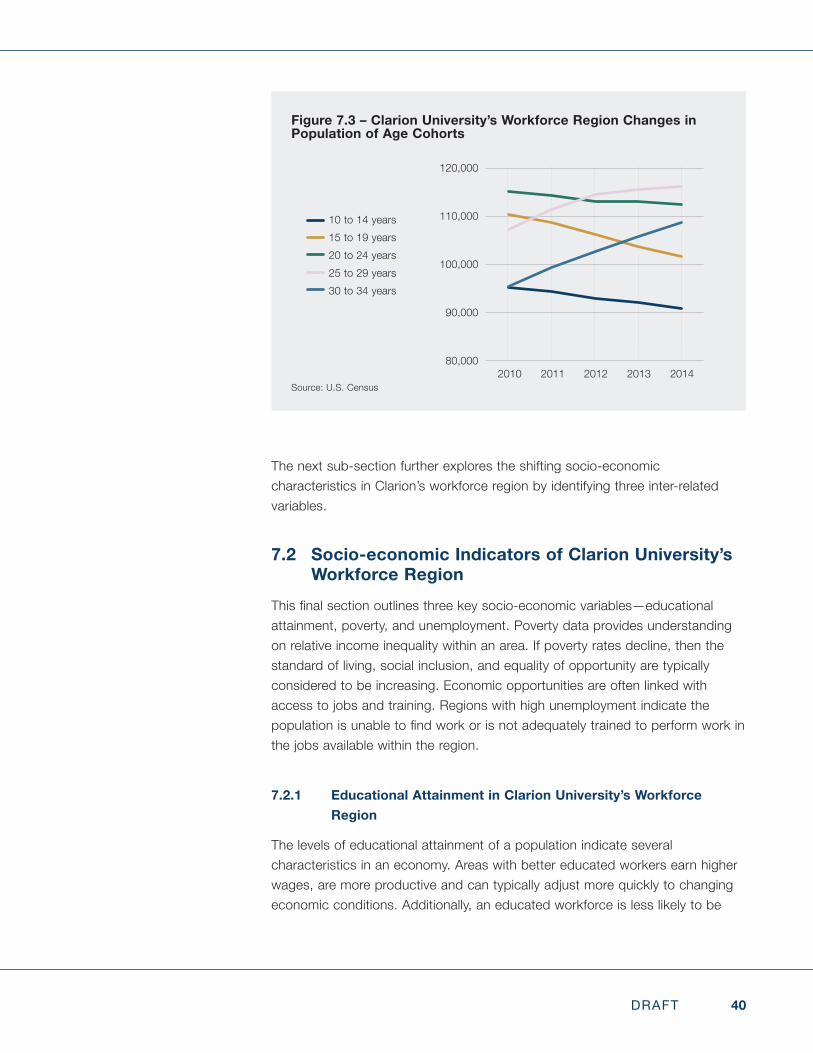
7.1 Demographics of Clarion University’s Workforce Region
The Clarion workforce region has a population of about 1.7 million people. As shown in Figure 7.1, females make up a slightly larger share of the population compared to males. Figure 7.2 illustrates that the majority of the region is represented by a White demographic, with Blacks representing the next largest group, followed by Asians.
Fall2014datafromtheStateSystemResearchOfficeindicatesthatapproximately 83% (90,966) of learners within the State System are traditional students—ages 18- to 22-year-old high school graduates—and 17% (18,640) are adult learners. A view of the change in population by age demographic indicates a diminishing number in the traditional age cohort and a growing rate ofadultsaged25to34yearsold.Asillustratedinfigure7.3,the10to19yearold cohort population declined by nearly 13,000 people between 2010 and 2014—a 6% decline. Conversely, the 25-34 year old cohort increased nearly 11%, or 22,000 people, over the same time period. This demographic shift presents an opportunity to incorporate a broader university recruitment strategy.
39DRAFT
Figure 7.2 – Clarion University’s Workforce Region Race/Ethnicity Composition
Source:U.S.Census-AmericanCommunitySurvey(ACS)2009-20135-yearfile
84+10+2+2+2+J79+10+3+6+2+JClarion Workforce
RegionPennsylvania
84% 79%
10%
10%
2%
3%2% 6%2% 2%
White HispanicBlack OtherAsian
Figure 7.1 – Clarion University’s Workforce Region Population and Gender Distribution
Source: U.S. Census - ACS
13+87+G 100+52Rest of
Pennsylvania, 11,069,363
Male, 48%
Female, 52%
Clarion Region,
1,662,018
40DRAFT
The next sub-section further explores the shifting socio-economic characteristics in Clarion’s workforce region by identifying three inter-related variables.
7.2 Socio-economic Indicators of Clarion University’s Workforce Region
Thisfinalsectionoutlinesthreekeysocio-economicvariables—educationalattainment, poverty, and unemployment. Poverty data provides understanding on relative income inequality within an area. If poverty rates decline, then the standard of living, social inclusion, and equality of opportunity are typically considered to be increasing. Economic opportunities are often linked with access to jobs and training. Regions with high unemployment indicate the populationisunabletofindworkorisnotadequatelytrainedtoperformworkinthe jobs available within the region.
7.2.1 Educational Attainment in Clarion University’s Workforce Region
The levels of educational attainment of a population indicate several characteristics in an economy. Areas with better educated workers earn higher wages, are more productive and can typically adjust more quickly to changing economic conditions. Additionally, an educated workforce is less likely to be
Figure 7.3 – Clarion University’s Workforce Region Changes in Population of Age Cohorts
Source: U.S. Census2010 2011 2012 2013 2014
10 to 14 years15 to 19 years20 to 24 years25 to 29 years30 to 34 years
120,000
100,000
90,000
80,000
110,000
41DRAFT
unemployed, require social assistance, and more likely to lead a healthier lifestyle—aspects that bolster value in an economy.13, 14
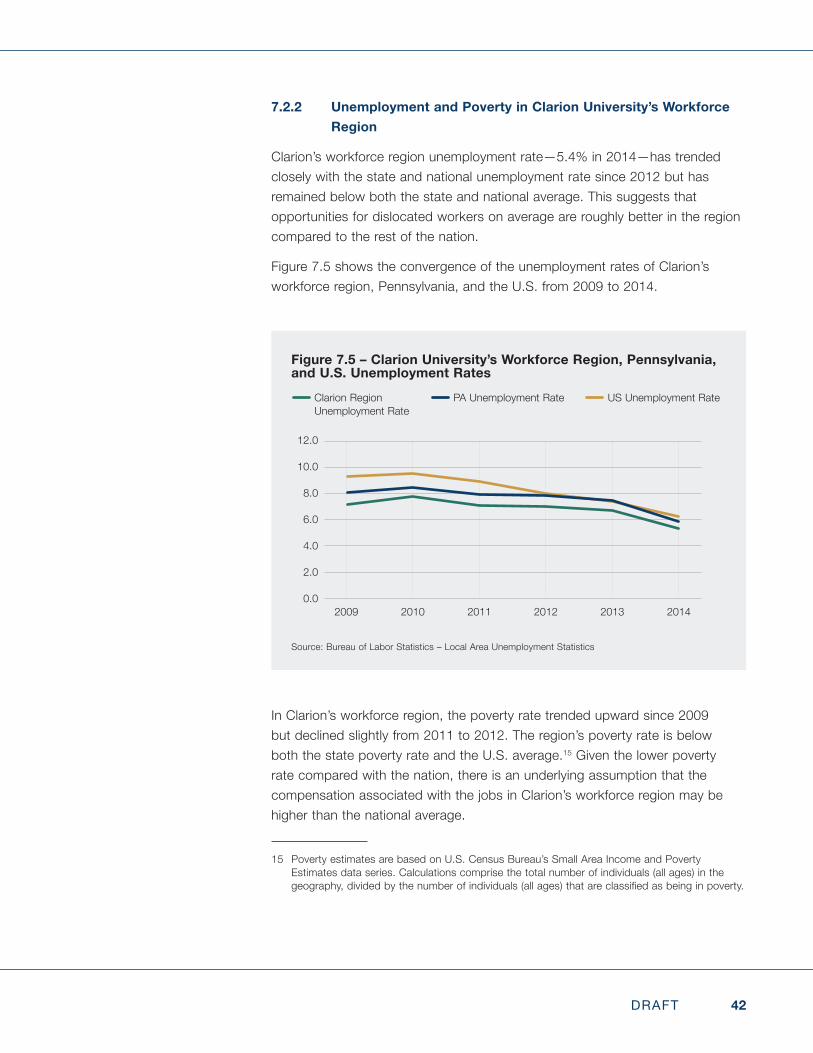
A view of educational attainment in Clarion’s workforce region indicates that more than half (58%) of those over 25 years old have had some post-secondary educationorhigher.SomecollegeisdefinedbyACSashavingsomecollege,but less than one year or one or more years of college credit, but no degree. This is the same as the national average of 58% of the population having had at least some post-secondary education or higher.
When comparing degree completion, Clarion’s workforce region is above the national average for the proportion of the population with an associate’s degree, bachelor’s degree, and master’s degrees or higher.
Figure 7.4 compares the educational attainment of the 25 years and older population in the U.S., Pennsylvania, and Clarion’s workforce region.
13 Feinsteinet.al.(2006),“Theeffectsofeducationonhealth:Concepts,evidenceandpolicyimplications:AreviewfortheOECDCenterforEducationalResearchandInnovation(CERI)”,unpublished manuscript, OECD, Paris.
14 Mitra,Dana(2011),“Pennsylvania’sBestInvestment:TheSocialandEconomicBenefitsofPublicEducation.”ReportpublishedfortheEducationLawCenter.
Figure 7.4 – Clarion University’s Workforce Region, Pennsylvania and U.S. Educational Attainment 25+ Years Old
Source:USCensus–AmericanCommunitySurvey2009-20135-yearfile
42 + 17 + 9 + 19 + 1348 + 17 + 8 + 17 + 1142 + 21 + 8 + 18 + 1160%
40%
30%
20%
10%
0%
50%
Perc
ent o
f 25+
Pop
ulat
ion
HS or Below Some College Associate’s Bachelor’s Master’s or Higher
42%
17%21%
17%9% 8%8%
19%17%18%
13%11%11%
42%48%
Clarion Region USPA
42DRAFT
7.2.2 Unemployment and Poverty in Clarion University’s Workforce Region
Clarion’s workforce region unemployment rate—5.4% in 2014—has trended closely with the state and national unemployment rate since 2012 but has remained below both the state and national average. This suggests that opportunities for dislocated workers on average are roughly better in the region compared to the rest of the nation.
Figure 7.5 shows the convergence of the unemployment rates of Clarion’s workforce region, Pennsylvania, and the U.S. from 2009 to 2014.
In Clarion’s workforce region, the poverty rate trended upward since 2009 but declined slightly from 2011 to 2012. The region’s poverty rate is below both the state poverty rate and the U.S. average.15 Given the lower poverty rate compared with the nation, there is an underlying assumption that the compensation associated with the jobs in Clarion’s workforce region may be higher than the national average.
15 Poverty estimates are based on U.S. Census Bureau’s Small Area Income and Poverty Estimates data series. Calculations comprise the total number of individuals (all ages) in the geography,dividedbythenumberofindividuals(allages)thatareclassifiedasbeinginpoverty.
Figure 7.5 – Clarion University’s Workforce Region, Pennsylvania, and U.S. Unemployment Rates
Source: Bureau of Labor Statistics – Local Area Unemployment Statistics
20102009 2011 2012 2013 2014
PA Unemployment RateClarion Region Unemployment Rate
US Unemployment Rate
12.0
10.0
8.0
6.0
2.0
0.0
4.0
43DRAFT
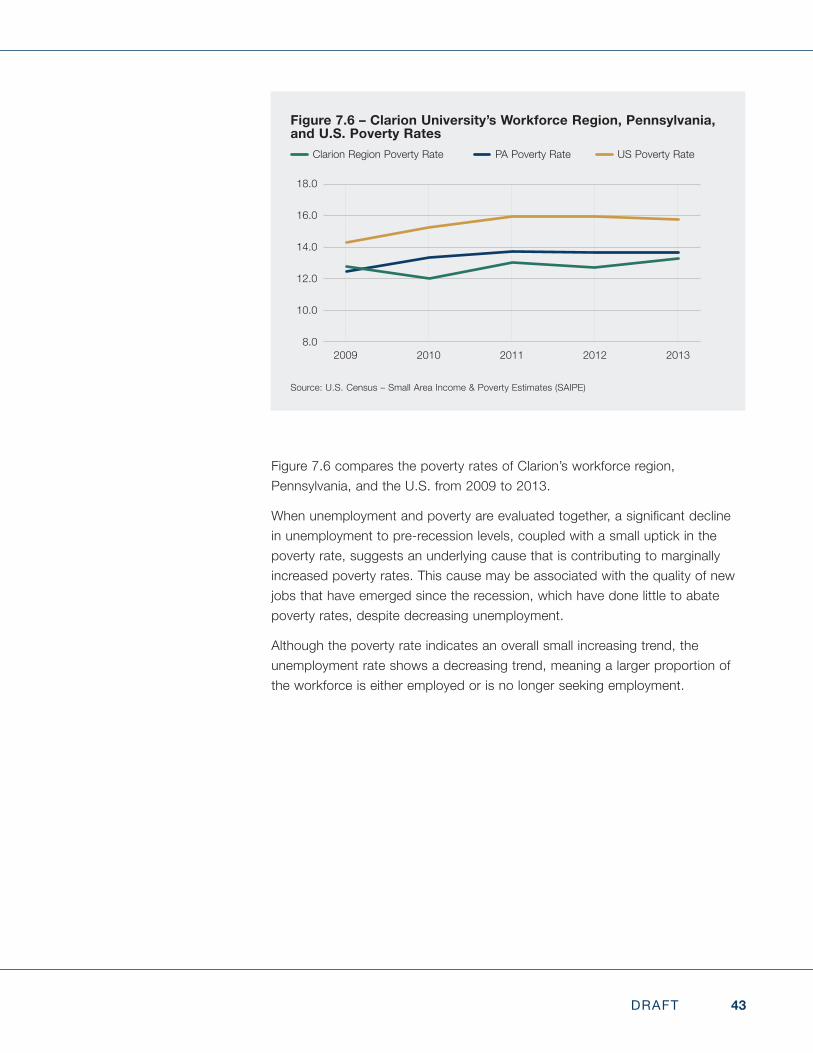
Figure 7.6 compares the poverty rates of Clarion’s workforce region, Pennsylvania, and the U.S. from 2009 to 2013.
Whenunemploymentandpovertyareevaluatedtogether,asignificantdeclinein unemployment to pre-recession levels, coupled with a small uptick in the poverty rate, suggests an underlying cause that is contributing to marginally increased poverty rates. This cause may be associated with the quality of new jobs that have emerged since the recession, which have done little to abate poverty rates, despite decreasing unemployment.
Although the poverty rate indicates an overall small increasing trend, the unemployment rate shows a decreasing trend, meaning a larger proportion of the workforce is either employed or is no longer seeking employment.
Figure 7.6 – Clarion University’s Workforce Region, Pennsylvania, and U.S. Poverty Rates
Source: U.S. Census – Small Area Income & Poverty Estimates (SAIPE)
20102009 2011 2012 2013
PA Poverty RateClarion Region Poverty Rate US Poverty Rate
18.0
16.0
14.0
10.0
8.0
12.0
44DRAFT
8. NEXT STEPS
This report sets the foundation for program planning by accomplishing three key tasks:
• Definingtheuniversity’sworkforceregion.
• Describing key economic, workforce, and demographic attributes in the regional economy.
• Forecasting the demand for skilled occupations.
The next steps for research to support Pennsylvania’s State System of Higher Education Program Alignment Toolkit are the development of an education supply and workforce demand gap analysis. Key data-driven aspects in the gap analysis research include:
• Development of an education program to occupation crosswalk.
• Analysis of completion data from the State System institutions as well as other institutions in the university’s workforce region.
• Comparison of the occupation forecasts against the recent completions of education programs.
• Identificationofprogramsthatmayrequireexpansionordevelopment,as well as programs that indicate a potential surplus of talent within the region.
45DRAFT
DATA SOURCES
Bureau of Labor Statistics (BLS):
• QCEW - Quarterly Census of Employment & Wages (Bureau of Labor Statistics) - http://www.bls.gov/cew/
• OES – Occupational Employment Statistics (Bureau of Labor Statistics) - http://www.bls.gov/oes/
• LAUS – Local Area Unemployment Statistics (Bureau of Labor Statistics) - http://www.bls.gov/lau/
U.S. Census Bureau (Census):
• LEHD – Longitudinal Employer-Household Dynamics - http://lehd.ces.census.gov/
• ACS – American Community Survey - http://www.census.gov/acs/www/
• SAIPE – Small Area Income and Poverty Estimates - http://www.census.gov/did/www/saipe/
National Center for Education Statistics (NCES):
• IPEDS – Integrated Postsecondary Education Data System (National Center for Education Statistics) - https://nces.ed.gov/ipeds/
Pennsylvania Department of Labor and Industry (PADLI):
• CWIA – Center for Workforce Information & Analysis (PA Department of Labor & Industry) – www.paworkstats.pa.gov
O*NET Resource Center (O*NET)
• Job Zones www.onetonline.org/help/online/zones
Economic Modeling Specialists International (EMSI)
46DRAFT
APPENDIX A: METHODOLOGY FOR IDENTIFYING STATE SYSTEM UNIVERSITY WORKFORCE REGIONS
IntroductionEconomic and workforce analysis is best undertaken at a geographic level that reflectshowtheeconomicmarketoperates.Inordertoeffectivelyanalyzearelevantmarketarea,asystematicapproachtodefinethegeographyshouldbecompleted.Thisreportprovidesauniversity-specificworkforcecharacteristicsanalysisbasedonadefinedworkforceregion.Thefollowingoutlinesthemethodology for identifying university workforce regions.
Aworkforceregionisdefinedas:alabormarketareaoraneconomicallyintegratedregionwithinwhichresidentscanfindjobswithinareasonablecommuting distance or can change their employment without changing their place of residence.16 When determining a workforce region, there is no universal approach.17 Given the target audience for the workforce region—State System universities—thecontextusedtodefinetheregionshouldreflectmultipleregional characteristics that the universities are tasked to support, while stillconformingtothebroaderdefinitionofwhatisoftencalledafunctionaleconomic market area (FEMA). A FEMA is best described as an area that containskeyeconomicmarkets.Theseeconomicmarketsbestreflectdriversof the local economy such as the workforce and inter-industry business activity. For the purposes of this analysis, three drivers are measured in order to best defineworkforceregions,specifically:
1. Workforce flows (primary input) - measured through commuting patterns.
2. Learner origin (secondary input) - measured by the proportion of state system learners from a given county who are attending the university.
3. Economic activity (secondary input) - measured through inter-industry
16 Bureau of Labor Statistics: Labor Market Area.17 Functional Economic Market Areas: An economic note. Communities and Local Government.
February 2010. http://webarchive.nationalarchives.gov.uk/20120919132719/http:/www.communities.gov.uk/documents/localgovernment/pdf/1469713.pdf
47DRAFT
exchange within the region and consumer purchasing activity within the region using an input-output model.
Further information on each of the measurements is detailed later.
Geographic ConsiderationInordertodefineregionsforStateSystemuniversities,county-leveldataprovide the best units of economic and workforce information. As such, county groupings serve as the best structure for describing the regions.
However,noonecountyisidentical.Eachcountyhasdifferentindustryandworkforcestructures,aswellasdifferentlearnerpopulations.Additionally,someuniversities are located in areas that are near large metropolitan areas, while other universities are not. Therefore, a blanket approach of setting threshold primarydrivervalueswhendefiningaworkforceregionforeachuniversitywouldultimately favor universities located near large metropolitan areas. In order to allowforbroadergeographiccoverage,threespecificconsiderationsweretakeninto account:
1. Percent of commuters working and/or living in the workforce region. Specifically,smallpopulationcountiesthatcontainaStateSystemuniversitydonotcontainalargeworkforce.Furthermore,thecommutingflowsoftheworkforce may seemingly favor the county containing the State System University. However, if a reasonable proportion of in commuters and out commuters (generally 10% or more) are traveling to work in contiguous counties, then these counties were included in the workforce region of the university.18
2. Inclusiveness of counties in Pennsylvania. The State System seeks to include all counties as part of the Rising to the Challenge Strategy. However, given the small population and workforce counties that exist across Pennsylvania, combined with many State System universities located within geographic proximity of these small counties, a second criterion of learner“capturerate”isused.ThecapturerateissimplytheproportionofState System enrolled learners within a county that are attending a given
18 The contiguous region approach employs the U.S. Department of Labor, Bureau of Labor Statistics’ (BLS) Small Labor Market Areas’ criteria to designating a labor market area. However, the 25% threshold set by the BLS was relaxed in order to adhere to an additional criterion of inclusiveness, wherein every county in Pennsylvania is assigned to at least one university. To meet this criteria, the proportion of county-level State System learner enrollment within PA attending the university was also included to identify a contiguous geographic area that captures both labor shed and county-level learner enrollment density (i.e. a percentage of State System learners from within the county and nearby counties that are attending the university—a “capturerate”).
48DRAFT
State System university. For example, about 75% of State System enrolled learners from Erie County attend Edinboro University. Therefore Edinboro’s capture rate for Erie County is 75%.
3. Level of inter-industry exchange and ability to satisfy household demand for goods and services. To provide additional context to regionaleconomicactivityandensurethatafinalregionaldescriptioncanbe considered a functional economic market area (FEMA), input-output modeling is used. In short, an input-output model is an inter-industry accounting framework, wherein a proportion of demand for inputs by oneindustryissatisfiedthroughtheproductionofanoutputbyanotherindustry within a supply chain. Regions with well-developed supply chains and integrated markets typically retain a higher proportion inter-industry trade, thus reducing the level of economic leakage. Similarly, the ability for a region’s businesses to satisfy the demand for household consumption reduces economic leakage. This analysis considers both inter-industry exchange(called“outputsupply/demand”)andhouseholdconsumption(called “household supply/demand).
ProcessGiven the workforce/commute, learner and economic variances that exist withinthedifferentgeographiesacrossPennsylvania,aniterativeprocessisusedtodefinetheworkforceregion.Thismultiplestep,iterativeprocessseekstomaximizetheprimarydrivervalue(workforceflows),whileadheringtotheguiding principles of a functional economic area. It also ensures that each county in Pennsylvania is assigned to at least one university workforce region—from which the secondary driver values (learner capture rate and economic activity) were used. The process can be broken into the following steps for each driver:
Workforce Flows:
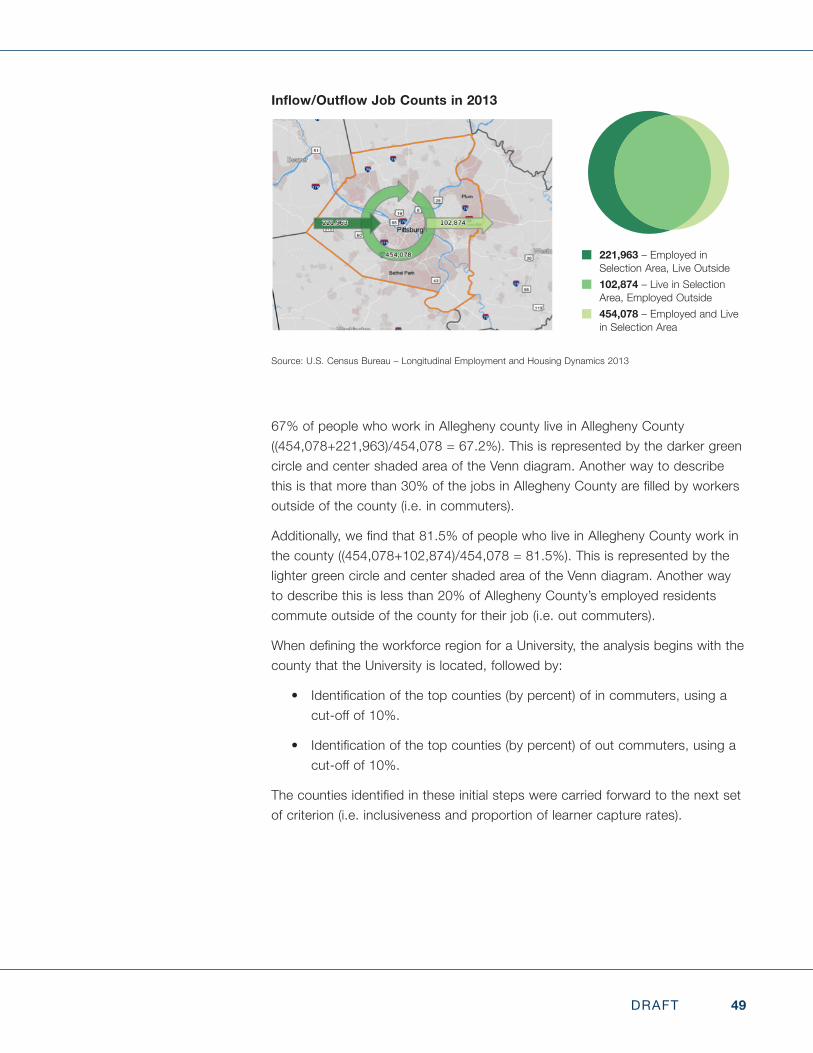
Definedbycommutingpatterns,workforceflowsrepresenttheflowofworkersinto and out of the region. The following two illustrations for Allegheny County providebetterunderstandingofcommutingflows.Themapindicatesthecommutingflowofworkers.Inshort,454,000peoplewholiveinthecountyalso work in the county. Additionally, almost 222,000 workers commute into Allegheny County for work, while nearly 103,000 county residents commute outside of Allegheny for their jobs.
Whenthesenumbersareconvertedintopercentages,wefindthat
49DRAFT
67% of people who work in Allegheny county live in Allegheny County ((454,078+221,963)/454,078 = 67.2%). This is represented by the darker green circle and center shaded area of the Venn diagram. Another way to describe thisisthatmorethan30%ofthejobsinAlleghenyCountyarefilledbyworkersoutside of the county (i.e. in commuters).
Additionally,wefindthat81.5%ofpeoplewholiveinAlleghenyCountyworkinthe county ((454,078+102,874)/454,078 = 81.5%). This is represented by the lighter green circle and center shaded area of the Venn diagram. Another way to describe this is less than 20% of Allegheny County’s employed residents commute outside of the county for their job (i.e. out commuters).
WhendefiningtheworkforceregionforaUniversity,theanalysisbeginswiththecounty that the University is located, followed by:
• Identificationofthetopcounties(bypercent)ofincommuters,usingacut-offof10%.
• Identificationofthetopcounties(bypercent)ofoutcommuters,usingacut-offof10%.
Thecountiesidentifiedintheseinitialstepswerecarriedforwardtothenextsetof criterion (i.e. inclusiveness and proportion of learner capture rates).
Inflow/Outflow Job Counts in 2013
Source: U.S. Census Bureau – Longitudinal Employment and Housing Dynamics 2013
221,963 – Employed in Selection Area, Live Outside102,874 – Live in Selection Area, Employed Outside454,078 – Employed and Live in Selection Area
50DRAFT
Learner Capture Rates and Inclusiveness:
Characterized by the proportion of State System enrolled learners from a given Pennsylvania county who are attending a given State System university, the learner capture rate indicates how well the university is providing education to learners within a geographic proximity. This second set of criteria helps to shape the regional backdrop of learners supported within a contiguous area around the university. Not to be confused with the headcount of where a University’slearnersarecomingfrom,thisanalysisisspecificallydesignedtobroaden the contiguous region to help ensure inclusiveness of other counties (many of which are often low population areas).
Counties were selected based on two criteria for learner origin. First, to evaluate each county, we consider the total number of State System learners who come from each respective county. We sum all students enrolled in the State System for each county and then calculate the share of students going to each State System university. Although a particular county may not contribute a large proportion of total State System students, this method ensured inclusiveness based upon each respective county’s relative contribution. Second, to consider the university perspective, we calculate where the majority of learners come from within Pennsylvania for each respective university. This ensured that Chester County, for example, was included as part of Millersville’s workforce region even though a majority of learners in Chester County do not attend MillersvilleUniversity.Greaterweightwasgiventothefirstcriteriatoensureinclusiveness of all counties. Note that counties must be contiguous in order to conformtothedefinitionofaworkforceregion.
Economic Activity and Concentration:
Concurrently, we measured the economic activity of the region using supply/demand ratios for businesses and households. After each workforce region wasdefinedusingthecriteriaforcommutingandlearnerorigin,thegrosscommodity demand was calculated for that region using IMPLAN. Gross commodity demand is the total demand for supply chain products and services by businesses in the region. The Output Supply/Demand ratio represents the percent of industry demand for supply chain products and services that are satisfiedbybusinessesintheregion.TheHouseholdSupply/Demandratiorepresents the percent of household demand for goods and services that are satisfiedbybusinessesintheregion.Forexample,whendefiningBloomsburgUniversity’s workforce region several county combinations were evaluated. The fourth iteration included Columbia, Montour, Luzerne, and Northumberland. The supply/demand ratios for businesses and households were 54% and
51DRAFT
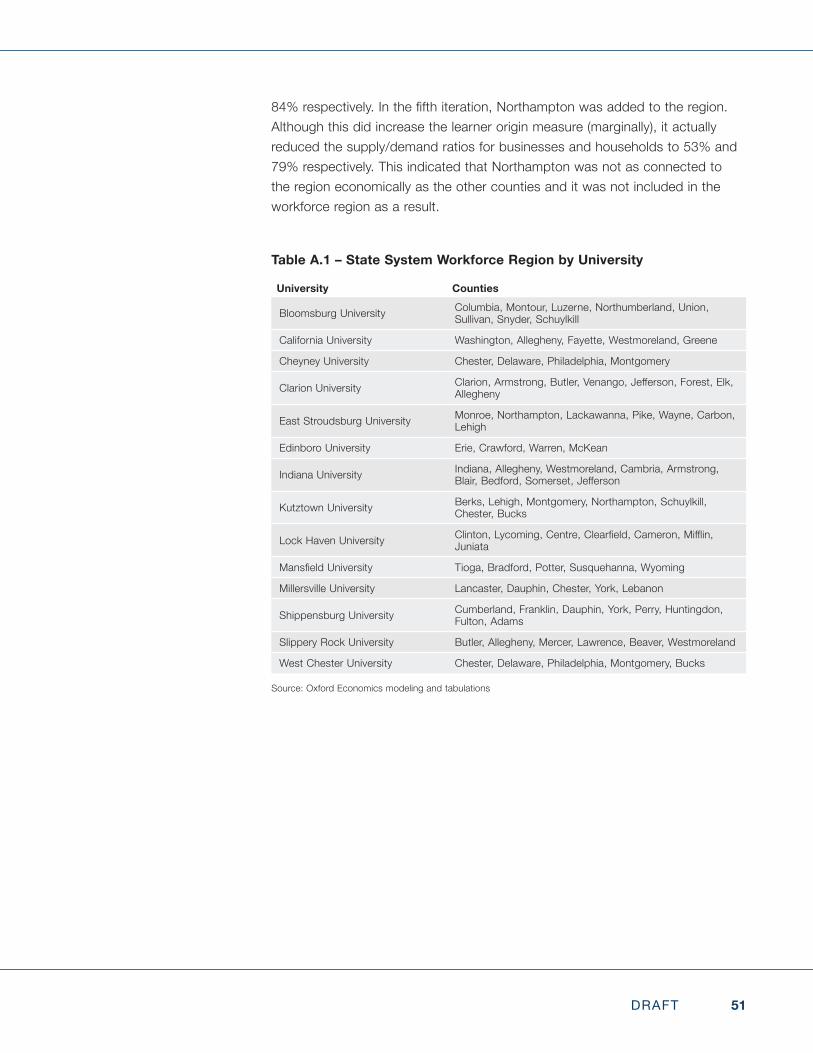
84%respectively.Inthefifthiteration,Northamptonwasaddedtotheregion.Although this did increase the learner origin measure (marginally), it actually reduced the supply/demand ratios for businesses and households to 53% and 79% respectively. This indicated that Northampton was not as connected to the region economically as the other counties and it was not included in the workforce region as a result.
Table A.1 – State System Workforce Region by University
University Counties
Bloomsburg University Columbia, Montour, Luzerne, Northumberland, Union, Sullivan, Snyder, Schuylkill
California University Washington, Allegheny, Fayette, Westmoreland, Greene
Cheyney University Chester, Delaware, Philadelphia, Montgomery
Clarion University Clarion,Armstrong,Butler,Venango,Jefferson,Forest,Elk,Allegheny
East Stroudsburg University Monroe, Northampton, Lackawanna, Pike, Wayne, Carbon, Lehigh
Edinboro University Erie, Crawford, Warren, McKean
Indiana University Indiana, Allegheny, Westmoreland, Cambria, Armstrong, Blair,Bedford,Somerset,Jefferson
Kutztown University Berks, Lehigh, Montgomery, Northampton, Schuylkill, Chester, Bucks
Lock Haven University Clinton,Lycoming,Centre,Clearfield,Cameron,Mifflin,Juniata
MansfieldUniversity Tioga, Bradford, Potter, Susquehanna, Wyoming
Millersville University Lancaster, Dauphin, Chester, York, Lebanon
Shippensburg University Cumberland, Franklin, Dauphin, York, Perry, Huntingdon, Fulton, Adams
Slippery Rock University Butler, Allegheny, Mercer, Lawrence, Beaver, Westmoreland
West Chester University Chester, Delaware, Philadelphia, Montgomery, Bucks
Source: Oxford Economics modeling and tabulations
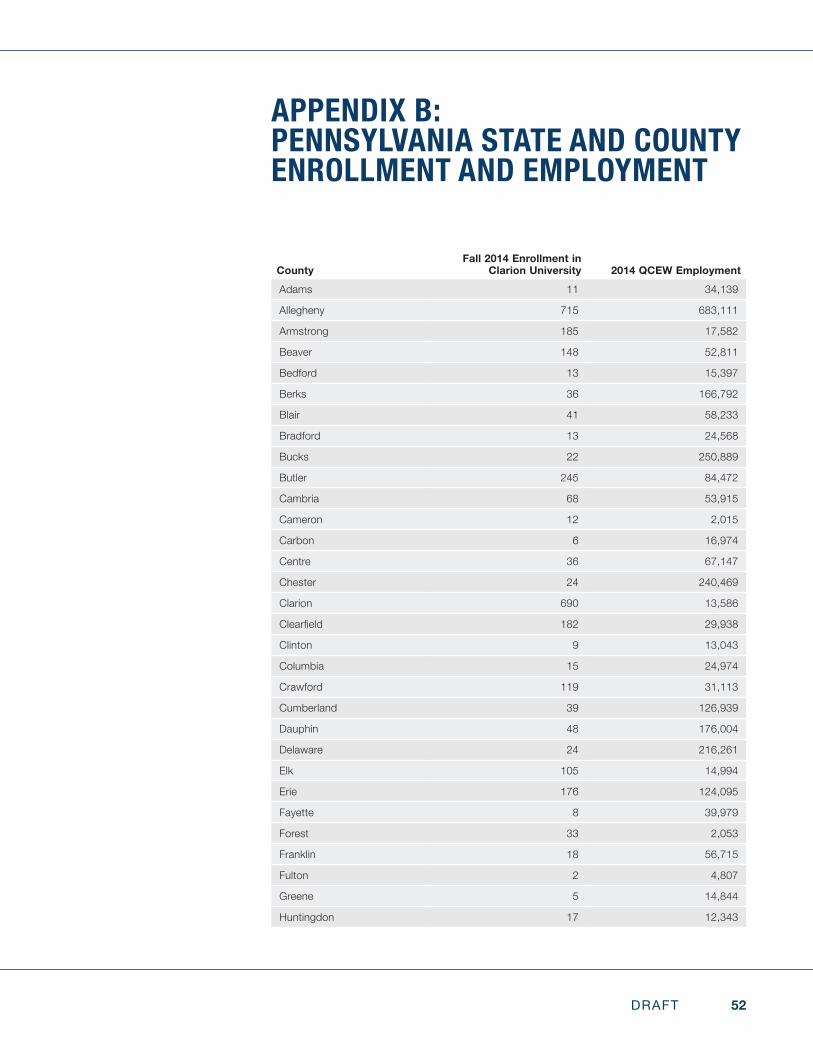
52DRAFT
APPENDIX B: PENNSYLVANIA STATE AND COUNTY ENROLLMENT AND EMPLOYMENT
County Fall 2014 Enrollment in
Clarion University 2014 QCEW EmploymentAdams 11 34,139
Allegheny 715 683,111
Armstrong 185 17,582
Beaver 148 52,811
Bedford 13 15,397
Berks 36 166,792
Blair 41 58,233
Bradford 13 24,568
Bucks 22 250,889
Butler 245 84,472
Cambria 68 53,915
Cameron 12 2,015
Carbon 6 16,974
Centre 36 67,147
Chester 24 240,469
Clarion 690 13,586
Clearfield 182 29,938
Clinton 9 13,043
Columbia 15 24,974
Crawford 119 31,113
Cumberland 39 126,939
Dauphin 48 176,004
Delaware 24 216,261
Elk 105 14,994
Erie 176 124,095
Fayette 8 39,979
Forest 33 2,053
Franklin 18 56,715
Fulton 2 4,807
Greene 5 14,844
Huntingdon 17 12,343
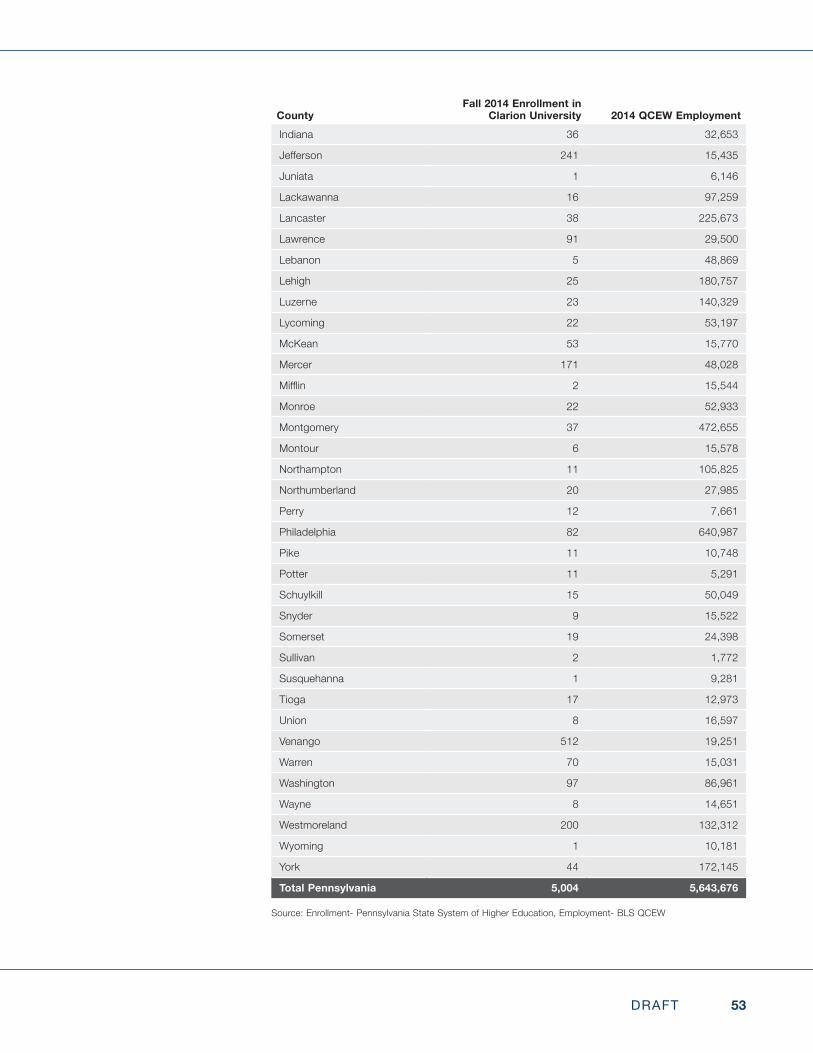
53DRAFT
County Fall 2014 Enrollment in
Clarion University 2014 QCEW EmploymentIndiana 36 32,653
Jefferson 241 15,435
Juniata 1 6,146
Lackawanna 16 97,259
Lancaster 38 225,673
Lawrence 91 29,500
Lebanon 5 48,869
Lehigh 25 180,757
Luzerne 23 140,329
Lycoming 22 53,197
McKean 53 15,770
Mercer 171 48,028
Mifflin 2 15,544
Monroe 22 52,933
Montgomery 37 472,655
Montour 6 15,578
Northampton 11 105,825
Northumberland 20 27,985
Perry 12 7,661
Philadelphia 82 640,987
Pike 11 10,748
Potter 11 5,291
Schuylkill 15 50,049
Snyder 9 15,522
Somerset 19 24,398
Sullivan 2 1,772
Susquehanna 1 9,281
Tioga 17 12,973
Union 8 16,597
Venango 512 19,251
Warren 70 15,031
Washington 97 86,961
Wayne 8 14,651
Westmoreland 200 132,312
Wyoming 1 10,181
York 44 172,145
Total Pennsylvania 5,004 5,643,676
Source: Enrollment- Pennsylvania State System of Higher Education, Employment- BLS QCEW
54DRAFT
APPENDIX C: INDUSTRY PROJECTIONS 2014-2024 FOR CLARION UNIVERSITY’S WORKFORCE REGION
A common measure of industry competitiveness is through the use of a location quotient statistic. Location quotients (LQ) provide a relative perspective on localcomparativeadvantagesinspecificindustryclassificationsbycomparingemployment within a local or state economy to a larger geographic area (e.g. nation). On its own, the analysis achieves little. However, when evaluated jointly with the employment data and growth, one gains a sense of the industry sectorsthatmightbenefitfromeffortstoaligneducationalopportunitieswith economic development (i.e. industries that State System universities may consider engaging in larger conversations about aligning employer and educational needs).
To interpret results, LQs equal to 1 indicate that the area’s industry concentration is equal the national concentration of the same industry. Industries with a higher location quotient (usually greater than 1.2) indicate that an area has a relatively higher concentration of jobs in the sector and therefore concludes that the area has a comparative advantage or specialization in the production of that good or service, compared to the national average. Note: High employment industries do not necessarily result in large location quotients, as this is a comparative statistic. The following table provides the industry LQs at the 4-digit NAICS level in Clarion’s workforce region. Included in the table are the number of jobs in 2014 and the projected job growth/decline in 2024.
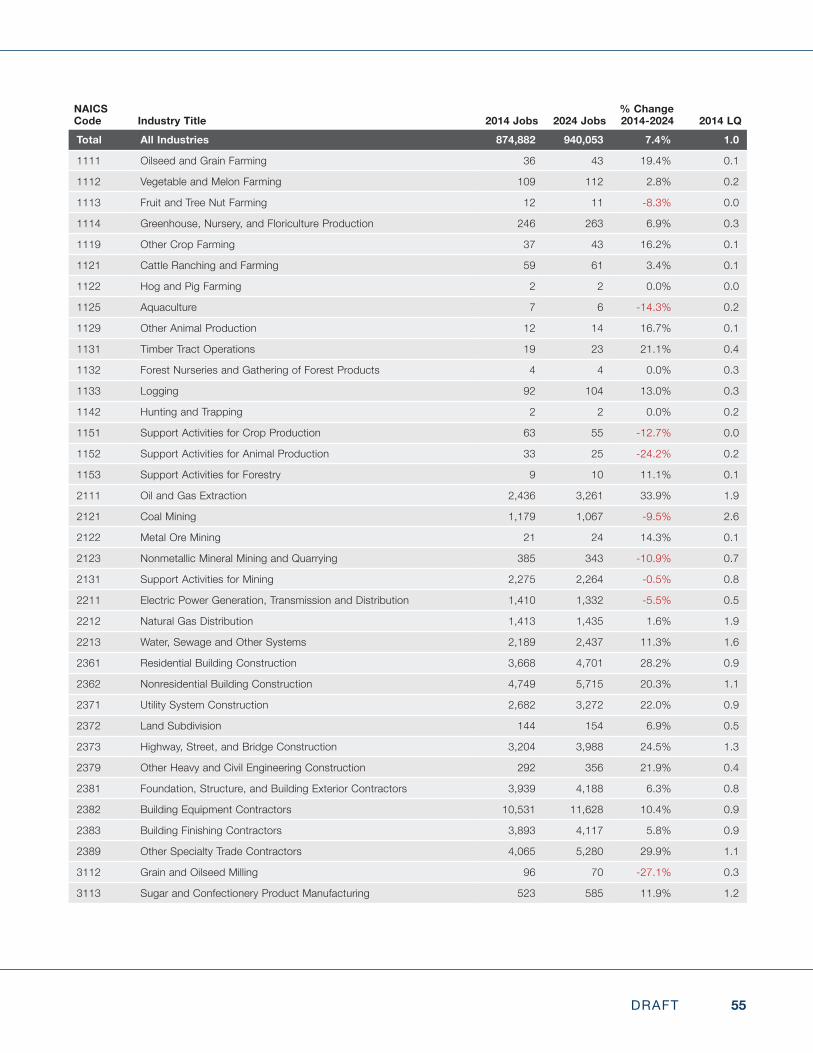
55DRAFT
NAICS Code Industry Title 2014 Jobs 2024 Jobs
% Change 2014-2024 2014 LQ
Total All Industries 874,882 940,053 7.4% 1.0
1111 Oilseed and Grain Farming 36 43 19.4% 0.1
1112 Vegetable and Melon Farming 109 112 2.8% 0.2
1113 Fruit and Tree Nut Farming 12 11 -8.3% 0.0
1114 Greenhouse, Nursery, and Floriculture Production 246 263 6.9% 0.3
1119 Other Crop Farming 37 43 16.2% 0.1
1121 Cattle Ranching and Farming 59 61 3.4% 0.1
1122 Hog and Pig Farming 2 2 0.0% 0.0
1125 Aquaculture 7 6 -14.3% 0.2
1129 Other Animal Production 12 14 16.7% 0.1
1131 Timber Tract Operations 19 23 21.1% 0.4
1132 Forest Nurseries and Gathering of Forest Products 4 4 0.0% 0.3
1133 Logging 92 104 13.0% 0.3
1142 Hunting and Trapping 2 2 0.0% 0.2
1151 Support Activities for Crop Production 63 55 -12.7% 0.0
1152 Support Activities for Animal Production 33 25 -24.2% 0.2
1153 Support Activities for Forestry 9 10 11.1% 0.1
2111 Oil and Gas Extraction 2,436 3,261 33.9% 1.9
2121 Coal Mining 1,179 1,067 -9.5% 2.6
2122 Metal Ore Mining 21 24 14.3% 0.1
2123 Nonmetallic Mineral Mining and Quarrying 385 343 -10.9% 0.7
2131 Support Activities for Mining 2,275 2,264 -0.5% 0.8
2211 Electric Power Generation, Transmission and Distribution 1,410 1,332 -5.5% 0.5
2212 Natural Gas Distribution 1,413 1,435 1.6% 1.9
2213 Water, Sewage and Other Systems 2,189 2,437 11.3% 1.6
2361 Residential Building Construction 3,668 4,701 28.2% 0.9
2362 Nonresidential Building Construction 4,749 5,715 20.3% 1.1
2371 Utility System Construction 2,682 3,272 22.0% 0.9
2372 Land Subdivision 144 154 6.9% 0.5
2373 Highway, Street, and Bridge Construction 3,204 3,988 24.5% 1.3
2379 Other Heavy and Civil Engineering Construction 292 356 21.9% 0.4
2381 Foundation, Structure, and Building Exterior Contractors 3,939 4,188 6.3% 0.8
2382 Building Equipment Contractors 10,531 11,628 10.4% 0.9
2383 Building Finishing Contractors 3,893 4,117 5.8% 0.9
2389 Other Specialty Trade Contractors 4,065 5,280 29.9% 1.1
3112 Grain and Oilseed Milling 96 70 -27.1% 0.3
3113 Sugar and Confectionery Product Manufacturing 523 585 11.9% 1.2
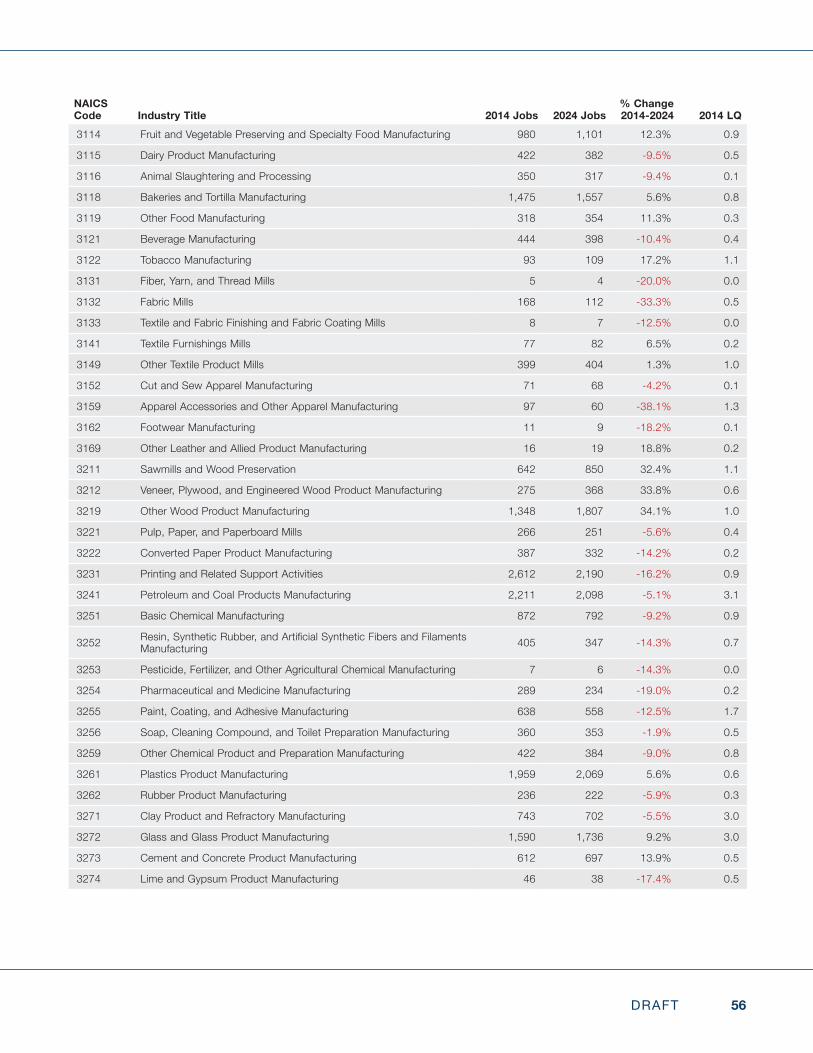
56DRAFT
NAICS Code Industry Title 2014 Jobs 2024 Jobs
% Change 2014-2024 2014 LQ
3114 Fruit and Vegetable Preserving and Specialty Food Manufacturing 980 1,101 12.3% 0.9
3115 Dairy Product Manufacturing 422 382 -9.5% 0.5
3116 Animal Slaughtering and Processing 350 317 -9.4% 0.1
3118 Bakeries and Tortilla Manufacturing 1,475 1,557 5.6% 0.8
3119 Other Food Manufacturing 318 354 11.3% 0.3
3121 Beverage Manufacturing 444 398 -10.4% 0.4
3122 Tobacco Manufacturing 93 109 17.2% 1.1
3131 Fiber, Yarn, and Thread Mills 5 4 -20.0% 0.0
3132 Fabric Mills 168 112 -33.3% 0.5
3133 Textile and Fabric Finishing and Fabric Coating Mills 8 7 -12.5% 0.0
3141 Textile Furnishings Mills 77 82 6.5% 0.2
3149 Other Textile Product Mills 399 404 1.3% 1.0
3152 Cut and Sew Apparel Manufacturing 71 68 -4.2% 0.1
3159 Apparel Accessories and Other Apparel Manufacturing 97 60 -38.1% 1.3
3162 Footwear Manufacturing 11 9 -18.2% 0.1
3169 Other Leather and Allied Product Manufacturing 16 19 18.8% 0.2
3211 Sawmills and Wood Preservation 642 850 32.4% 1.1
3212 Veneer, Plywood, and Engineered Wood Product Manufacturing 275 368 33.8% 0.6
3219 Other Wood Product Manufacturing 1,348 1,807 34.1% 1.0
3221 Pulp, Paper, and Paperboard Mills 266 251 -5.6% 0.4
3222 Converted Paper Product Manufacturing 387 332 -14.2% 0.2
3231 Printing and Related Support Activities 2,612 2,190 -16.2% 0.9
3241 Petroleum and Coal Products Manufacturing 2,211 2,098 -5.1% 3.1
3251 Basic Chemical Manufacturing 872 792 -9.2% 0.9
3252 Resin,SyntheticRubber,andArtificialSyntheticFibersandFilamentsManufacturing 405 347 -14.3% 0.7
3253 Pesticide, Fertilizer, and Other Agricultural Chemical Manufacturing 7 6 -14.3% 0.0
3254 Pharmaceutical and Medicine Manufacturing 289 234 -19.0% 0.2
3255 Paint, Coating, and Adhesive Manufacturing 638 558 -12.5% 1.7
3256 Soap, Cleaning Compound, and Toilet Preparation Manufacturing 360 353 -1.9% 0.5
3259 Other Chemical Product and Preparation Manufacturing 422 384 -9.0% 0.8
3261 Plastics Product Manufacturing 1,959 2,069 5.6% 0.6
3262 Rubber Product Manufacturing 236 222 -5.9% 0.3
3271 Clay Product and Refractory Manufacturing 743 702 -5.5% 3.0
3272 Glass and Glass Product Manufacturing 1,590 1,736 9.2% 3.0
3273 Cement and Concrete Product Manufacturing 612 697 13.9% 0.5
3274 Lime and Gypsum Product Manufacturing 46 38 -17.4% 0.5
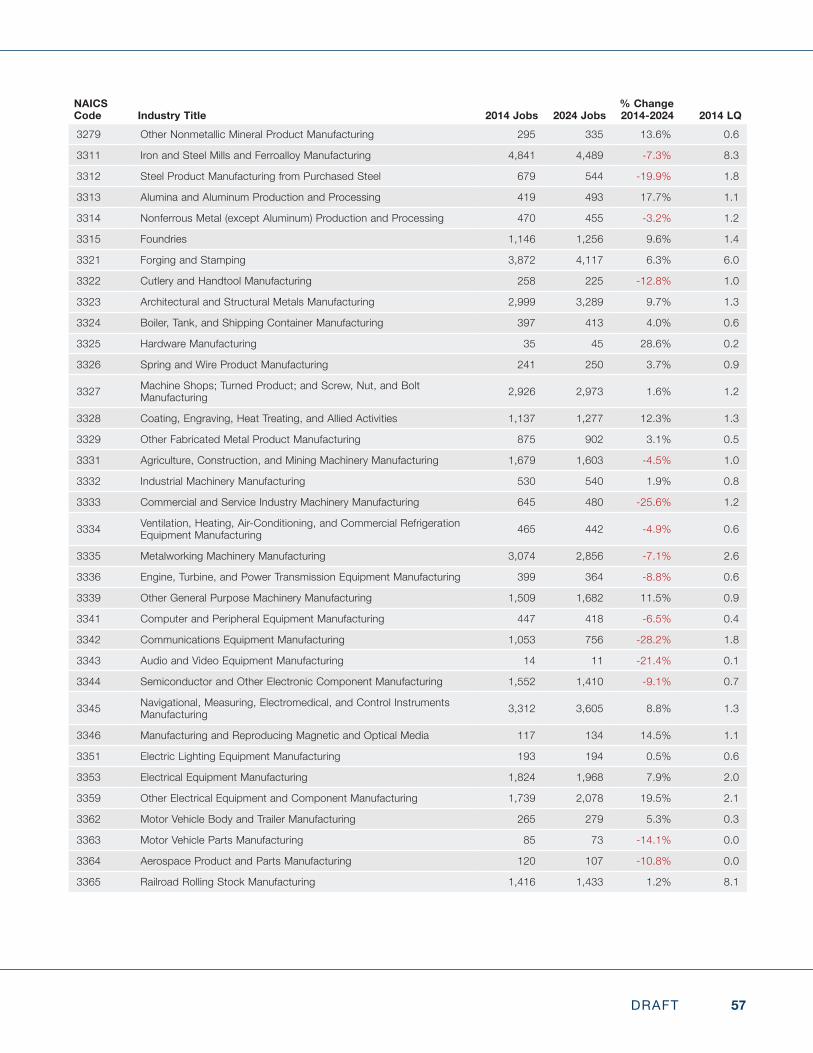
57DRAFT
NAICS Code Industry Title 2014 Jobs 2024 Jobs
% Change 2014-2024 2014 LQ
3279 Other Nonmetallic Mineral Product Manufacturing 295 335 13.6% 0.6
3311 Iron and Steel Mills and Ferroalloy Manufacturing 4,841 4,489 -7.3% 8.3
3312 Steel Product Manufacturing from Purchased Steel 679 544 -19.9% 1.8
3313 Alumina and Aluminum Production and Processing 419 493 17.7% 1.1
3314 Nonferrous Metal (except Aluminum) Production and Processing 470 455 -3.2% 1.2
3315 Foundries 1,146 1,256 9.6% 1.4
3321 Forging and Stamping 3,872 4,117 6.3% 6.0
3322 Cutlery and Handtool Manufacturing 258 225 -12.8% 1.0
3323 Architectural and Structural Metals Manufacturing 2,999 3,289 9.7% 1.3
3324 Boiler, Tank, and Shipping Container Manufacturing 397 413 4.0% 0.6
3325 Hardware Manufacturing 35 45 28.6% 0.2
3326 Spring and Wire Product Manufacturing 241 250 3.7% 0.9
3327 Machine Shops; Turned Product; and Screw, Nut, and Bolt Manufacturing 2,926 2,973 1.6% 1.2
3328 Coating, Engraving, Heat Treating, and Allied Activities 1,137 1,277 12.3% 1.3
3329 Other Fabricated Metal Product Manufacturing 875 902 3.1% 0.5
3331 Agriculture, Construction, and Mining Machinery Manufacturing 1,679 1,603 -4.5% 1.0
3332 Industrial Machinery Manufacturing 530 540 1.9% 0.8
3333 Commercial and Service Industry Machinery Manufacturing 645 480 -25.6% 1.2
3334 Ventilation, Heating, Air-Conditioning, and Commercial Refrigeration Equipment Manufacturing 465 442 -4.9% 0.6
3335 Metalworking Machinery Manufacturing 3,074 2,856 -7.1% 2.6
3336 Engine, Turbine, and Power Transmission Equipment Manufacturing 399 364 -8.8% 0.6
3339 Other General Purpose Machinery Manufacturing 1,509 1,682 11.5% 0.9
3341 Computer and Peripheral Equipment Manufacturing 447 418 -6.5% 0.4
3342 Communications Equipment Manufacturing 1,053 756 -28.2% 1.8
3343 Audio and Video Equipment Manufacturing 14 11 -21.4% 0.1
3344 Semiconductor and Other Electronic Component Manufacturing 1,552 1,410 -9.1% 0.7
3345 Navigational, Measuring, Electromedical, and Control Instruments Manufacturing 3,312 3,605 8.8% 1.3
3346 Manufacturing and Reproducing Magnetic and Optical Media 117 134 14.5% 1.1
3351 Electric Lighting Equipment Manufacturing 193 194 0.5% 0.6
3353 Electrical Equipment Manufacturing 1,824 1,968 7.9% 2.0
3359 Other Electrical Equipment and Component Manufacturing 1,739 2,078 19.5% 2.1
3362 Motor Vehicle Body and Trailer Manufacturing 265 279 5.3% 0.3
3363 Motor Vehicle Parts Manufacturing 85 73 -14.1% 0.0
3364 Aerospace Product and Parts Manufacturing 120 107 -10.8% 0.0
3365 Railroad Rolling Stock Manufacturing 1,416 1,433 1.2% 8.1
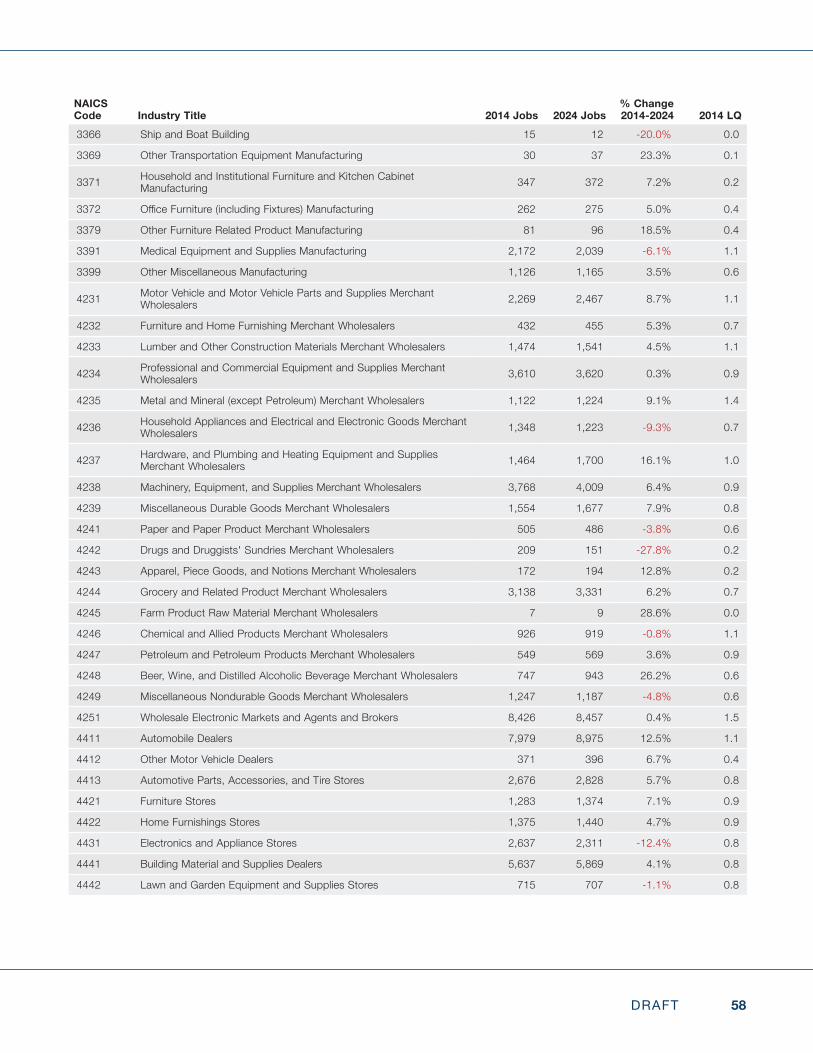
58DRAFT
NAICS Code Industry Title 2014 Jobs 2024 Jobs
% Change 2014-2024 2014 LQ
3366 Ship and Boat Building 15 12 -20.0% 0.0
3369 Other Transportation Equipment Manufacturing 30 37 23.3% 0.1
3371 Household and Institutional Furniture and Kitchen Cabinet Manufacturing 347 372 7.2% 0.2
3372 OfficeFurniture(includingFixtures)Manufacturing 262 275 5.0% 0.4
3379 Other Furniture Related Product Manufacturing 81 96 18.5% 0.4
3391 Medical Equipment and Supplies Manufacturing 2,172 2,039 -6.1% 1.1
3399 Other Miscellaneous Manufacturing 1,126 1,165 3.5% 0.6
4231 Motor Vehicle and Motor Vehicle Parts and Supplies Merchant Wholesalers 2,269 2,467 8.7% 1.1
4232 Furniture and Home Furnishing Merchant Wholesalers 432 455 5.3% 0.7
4233 Lumber and Other Construction Materials Merchant Wholesalers 1,474 1,541 4.5% 1.1
4234 Professional and Commercial Equipment and Supplies Merchant Wholesalers 3,610 3,620 0.3% 0.9
4235 Metal and Mineral (except Petroleum) Merchant Wholesalers 1,122 1,224 9.1% 1.4
4236 Household Appliances and Electrical and Electronic Goods Merchant Wholesalers 1,348 1,223 -9.3% 0.7
4237 Hardware, and Plumbing and Heating Equipment and Supplies Merchant Wholesalers 1,464 1,700 16.1% 1.0
4238 Machinery, Equipment, and Supplies Merchant Wholesalers 3,768 4,009 6.4% 0.9
4239 Miscellaneous Durable Goods Merchant Wholesalers 1,554 1,677 7.9% 0.8
4241 Paper and Paper Product Merchant Wholesalers 505 486 -3.8% 0.6
4242 Drugs and Druggists' Sundries Merchant Wholesalers 209 151 -27.8% 0.2
4243 Apparel, Piece Goods, and Notions Merchant Wholesalers 172 194 12.8% 0.2
4244 Grocery and Related Product Merchant Wholesalers 3,138 3,331 6.2% 0.7
4245 Farm Product Raw Material Merchant Wholesalers 7 9 28.6% 0.0
4246 Chemical and Allied Products Merchant Wholesalers 926 919 -0.8% 1.1
4247 Petroleum and Petroleum Products Merchant Wholesalers 549 569 3.6% 0.9
4248 Beer, Wine, and Distilled Alcoholic Beverage Merchant Wholesalers 747 943 26.2% 0.6
4249 Miscellaneous Nondurable Goods Merchant Wholesalers 1,247 1,187 -4.8% 0.6
4251 Wholesale Electronic Markets and Agents and Brokers 8,426 8,457 0.4% 1.5
4411 Automobile Dealers 7,979 8,975 12.5% 1.1
4412 Other Motor Vehicle Dealers 371 396 6.7% 0.4
4413 Automotive Parts, Accessories, and Tire Stores 2,676 2,828 5.7% 0.8
4421 Furniture Stores 1,283 1,374 7.1% 0.9
4422 Home Furnishings Stores 1,375 1,440 4.7% 0.9
4431 Electronics and Appliance Stores 2,637 2,311 -12.4% 0.8
4441 Building Material and Supplies Dealers 5,637 5,869 4.1% 0.8
4442 Lawn and Garden Equipment and Supplies Stores 715 707 -1.1% 0.8
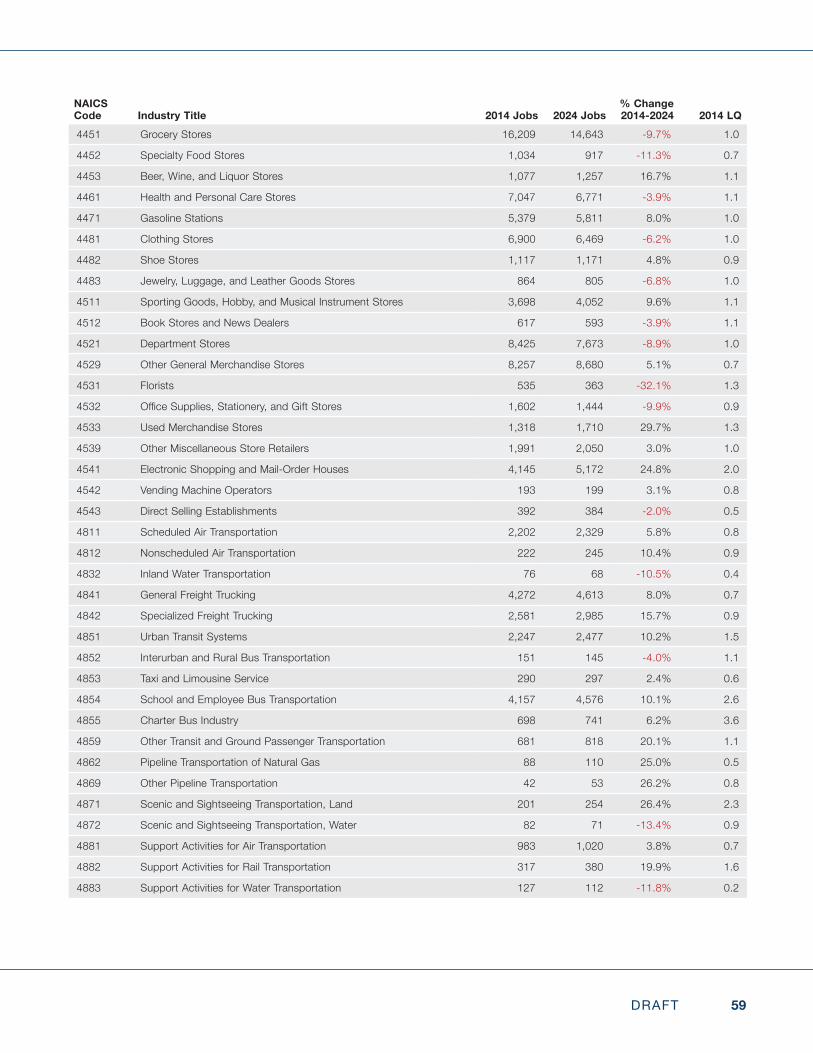
59DRAFT
NAICS Code Industry Title 2014 Jobs 2024 Jobs
% Change 2014-2024 2014 LQ
4451 Grocery Stores 16,209 14,643 -9.7% 1.0
4452 Specialty Food Stores 1,034 917 -11.3% 0.7
4453 Beer, Wine, and Liquor Stores 1,077 1,257 16.7% 1.1
4461 Health and Personal Care Stores 7,047 6,771 -3.9% 1.1
4471 Gasoline Stations 5,379 5,811 8.0% 1.0
4481 Clothing Stores 6,900 6,469 -6.2% 1.0
4482 Shoe Stores 1,117 1,171 4.8% 0.9
4483 Jewelry, Luggage, and Leather Goods Stores 864 805 -6.8% 1.0
4511 Sporting Goods, Hobby, and Musical Instrument Stores 3,698 4,052 9.6% 1.1
4512 Book Stores and News Dealers 617 593 -3.9% 1.1
4521 Department Stores 8,425 7,673 -8.9% 1.0
4529 Other General Merchandise Stores 8,257 8,680 5.1% 0.7
4531 Florists 535 363 -32.1% 1.3
4532 OfficeSupplies,Stationery,andGiftStores 1,602 1,444 -9.9% 0.9
4533 Used Merchandise Stores 1,318 1,710 29.7% 1.3
4539 Other Miscellaneous Store Retailers 1,991 2,050 3.0% 1.0
4541 Electronic Shopping and Mail-Order Houses 4,145 5,172 24.8% 2.0
4542 Vending Machine Operators 193 199 3.1% 0.8
4543 Direct Selling Establishments 392 384 -2.0% 0.5
4811 Scheduled Air Transportation 2,202 2,329 5.8% 0.8
4812 Nonscheduled Air Transportation 222 245 10.4% 0.9
4832 Inland Water Transportation 76 68 -10.5% 0.4
4841 General Freight Trucking 4,272 4,613 8.0% 0.7
4842 Specialized Freight Trucking 2,581 2,985 15.7% 0.9
4851 Urban Transit Systems 2,247 2,477 10.2% 1.5
4852 Interurban and Rural Bus Transportation 151 145 -4.0% 1.1
4853 Taxi and Limousine Service 290 297 2.4% 0.6
4854 School and Employee Bus Transportation 4,157 4,576 10.1% 2.6
4855 Charter Bus Industry 698 741 6.2% 3.6
4859 Other Transit and Ground Passenger Transportation 681 818 20.1% 1.1
4862 Pipeline Transportation of Natural Gas 88 110 25.0% 0.5
4869 Other Pipeline Transportation 42 53 26.2% 0.8
4871 Scenic and Sightseeing Transportation, Land 201 254 26.4% 2.3
4872 Scenic and Sightseeing Transportation, Water 82 71 -13.4% 0.9
4881 Support Activities for Air Transportation 983 1,020 3.8% 0.7
4882 Support Activities for Rail Transportation 317 380 19.9% 1.6
4883 Support Activities for Water Transportation 127 112 -11.8% 0.2
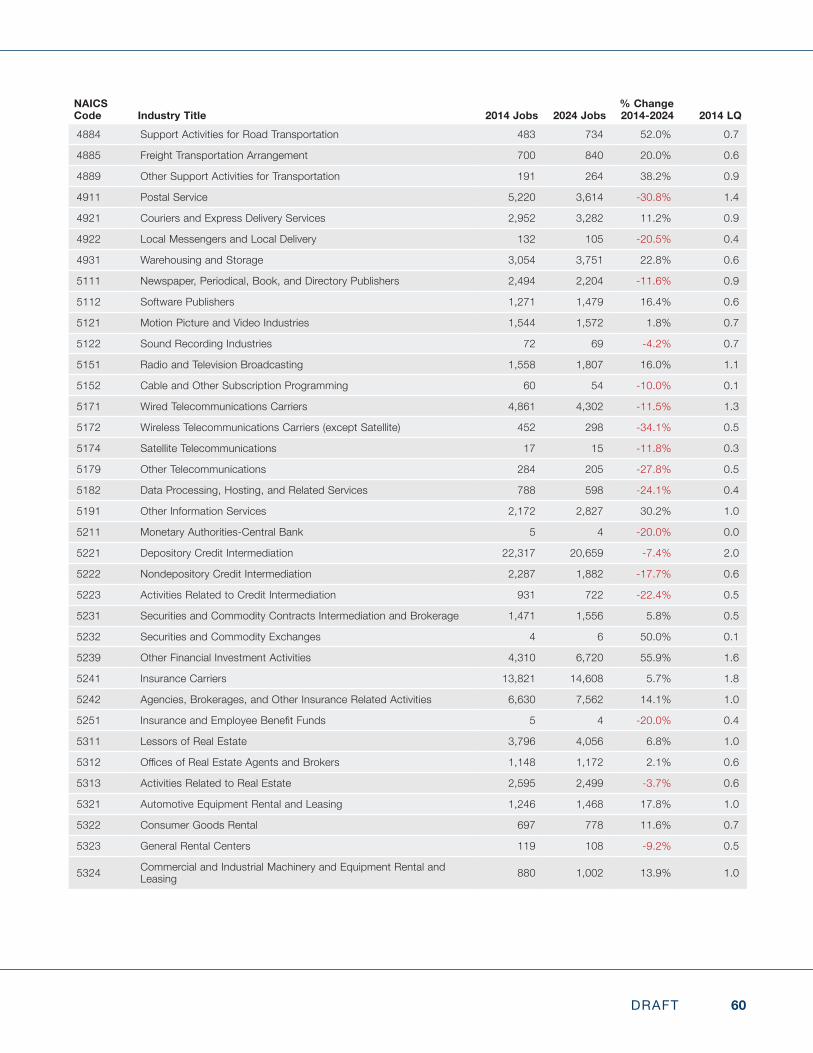
60DRAFT
NAICS Code Industry Title 2014 Jobs 2024 Jobs
% Change 2014-2024 2014 LQ
4884 Support Activities for Road Transportation 483 734 52.0% 0.7
4885 Freight Transportation Arrangement 700 840 20.0% 0.6
4889 Other Support Activities for Transportation 191 264 38.2% 0.9
4911 Postal Service 5,220 3,614 -30.8% 1.4
4921 Couriers and Express Delivery Services 2,952 3,282 11.2% 0.9
4922 Local Messengers and Local Delivery 132 105 -20.5% 0.4
4931 Warehousing and Storage 3,054 3,751 22.8% 0.6
5111 Newspaper, Periodical, Book, and Directory Publishers 2,494 2,204 -11.6% 0.9
5112 Software Publishers 1,271 1,479 16.4% 0.6
5121 Motion Picture and Video Industries 1,544 1,572 1.8% 0.7
5122 Sound Recording Industries 72 69 -4.2% 0.7
5151 Radio and Television Broadcasting 1,558 1,807 16.0% 1.1
5152 Cable and Other Subscription Programming 60 54 -10.0% 0.1
5171 Wired Telecommunications Carriers 4,861 4,302 -11.5% 1.3
5172 Wireless Telecommunications Carriers (except Satellite) 452 298 -34.1% 0.5
5174 Satellite Telecommunications 17 15 -11.8% 0.3
5179 Other Telecommunications 284 205 -27.8% 0.5
5182 Data Processing, Hosting, and Related Services 788 598 -24.1% 0.4
5191 Other Information Services 2,172 2,827 30.2% 1.0
5211 Monetary Authorities-Central Bank 5 4 -20.0% 0.0
5221 Depository Credit Intermediation 22,317 20,659 -7.4% 2.0
5222 Nondepository Credit Intermediation 2,287 1,882 -17.7% 0.6
5223 Activities Related to Credit Intermediation 931 722 -22.4% 0.5
5231 Securities and Commodity Contracts Intermediation and Brokerage 1,471 1,556 5.8% 0.5
5232 Securities and Commodity Exchanges 4 6 50.0% 0.1
5239 Other Financial Investment Activities 4,310 6,720 55.9% 1.6
5241 Insurance Carriers 13,821 14,608 5.7% 1.8
5242 Agencies, Brokerages, and Other Insurance Related Activities 6,630 7,562 14.1% 1.0
5251 InsuranceandEmployeeBenefitFunds 5 4 -20.0% 0.4
5311 Lessors of Real Estate 3,796 4,056 6.8% 1.0
5312 OfficesofRealEstateAgentsandBrokers 1,148 1,172 2.1% 0.6
5313 Activities Related to Real Estate 2,595 2,499 -3.7% 0.6
5321 Automotive Equipment Rental and Leasing 1,246 1,468 17.8% 1.0
5322 Consumer Goods Rental 697 778 11.6% 0.7
5323 General Rental Centers 119 108 -9.2% 0.5
5324 Commercial and Industrial Machinery and Equipment Rental and Leasing 880 1,002 13.9% 1.0
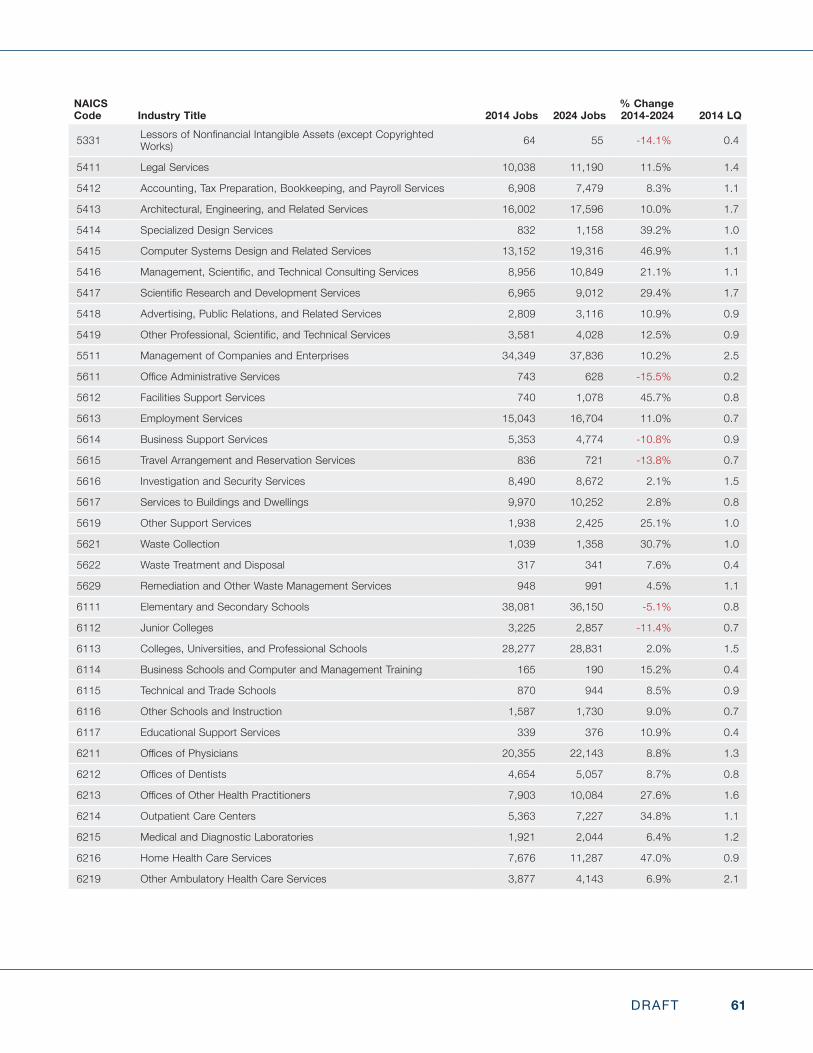
61DRAFT
NAICS Code Industry Title 2014 Jobs 2024 Jobs
% Change 2014-2024 2014 LQ
5331 LessorsofNonfinancialIntangibleAssets(exceptCopyrightedWorks) 64 55 -14.1% 0.4
5411 Legal Services 10,038 11,190 11.5% 1.4
5412 Accounting, Tax Preparation, Bookkeeping, and Payroll Services 6,908 7,479 8.3% 1.1
5413 Architectural, Engineering, and Related Services 16,002 17,596 10.0% 1.7
5414 Specialized Design Services 832 1,158 39.2% 1.0
5415 Computer Systems Design and Related Services 13,152 19,316 46.9% 1.1
5416 Management,Scientific,andTechnicalConsultingServices 8,956 10,849 21.1% 1.1
5417 ScientificResearchandDevelopmentServices 6,965 9,012 29.4% 1.7
5418 Advertising, Public Relations, and Related Services 2,809 3,116 10.9% 0.9
5419 OtherProfessional,Scientific,andTechnicalServices 3,581 4,028 12.5% 0.9
5511 Management of Companies and Enterprises 34,349 37,836 10.2% 2.5
5611 OfficeAdministrativeServices 743 628 -15.5% 0.2
5612 Facilities Support Services 740 1,078 45.7% 0.8
5613 Employment Services 15,043 16,704 11.0% 0.7
5614 Business Support Services 5,353 4,774 -10.8% 0.9
5615 Travel Arrangement and Reservation Services 836 721 -13.8% 0.7
5616 Investigation and Security Services 8,490 8,672 2.1% 1.5
5617 Services to Buildings and Dwellings 9,970 10,252 2.8% 0.8
5619 Other Support Services 1,938 2,425 25.1% 1.0
5621 Waste Collection 1,039 1,358 30.7% 1.0
5622 Waste Treatment and Disposal 317 341 7.6% 0.4
5629 Remediation and Other Waste Management Services 948 991 4.5% 1.1
6111 Elementary and Secondary Schools 38,081 36,150 -5.1% 0.8
6112 Junior Colleges 3,225 2,857 -11.4% 0.7
6113 Colleges, Universities, and Professional Schools 28,277 28,831 2.0% 1.5
6114 Business Schools and Computer and Management Training 165 190 15.2% 0.4
6115 Technical and Trade Schools 870 944 8.5% 0.9
6116 Other Schools and Instruction 1,587 1,730 9.0% 0.7
6117 Educational Support Services 339 376 10.9% 0.4
6211 OfficesofPhysicians 20,355 22,143 8.8% 1.3
6212 OfficesofDentists 4,654 5,057 8.7% 0.8
6213 OfficesofOtherHealthPractitioners 7,903 10,084 27.6% 1.6
6214 Outpatient Care Centers 5,363 7,227 34.8% 1.1
6215 Medical and Diagnostic Laboratories 1,921 2,044 6.4% 1.2
6216 Home Health Care Services 7,676 11,287 47.0% 0.9
6219 Other Ambulatory Health Care Services 3,877 4,143 6.9% 2.1
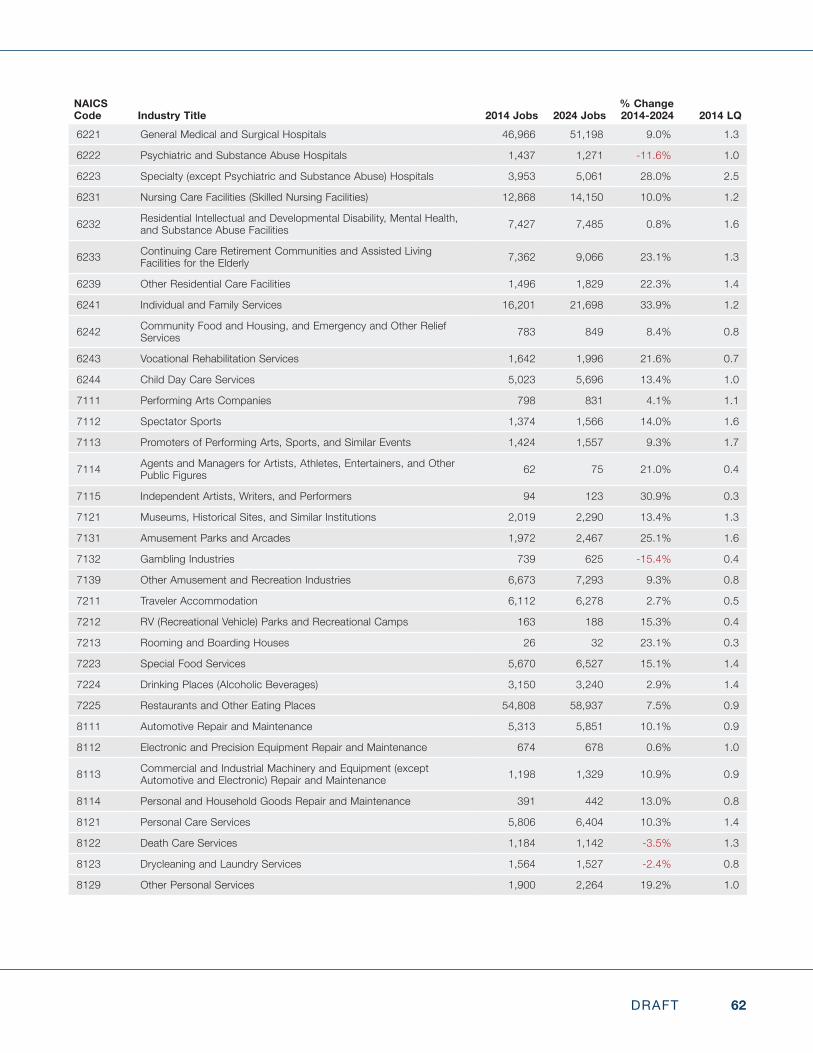
62DRAFT
NAICS Code Industry Title 2014 Jobs 2024 Jobs
% Change 2014-2024 2014 LQ
6221 General Medical and Surgical Hospitals 46,966 51,198 9.0% 1.3
6222 Psychiatric and Substance Abuse Hospitals 1,437 1,271 -11.6% 1.0
6223 Specialty (except Psychiatric and Substance Abuse) Hospitals 3,953 5,061 28.0% 2.5
6231 Nursing Care Facilities (Skilled Nursing Facilities) 12,868 14,150 10.0% 1.2
6232 Residential Intellectual and Developmental Disability, Mental Health, and Substance Abuse Facilities 7,427 7,485 0.8% 1.6
6233 Continuing Care Retirement Communities and Assisted Living Facilities for the Elderly 7,362 9,066 23.1% 1.3
6239 Other Residential Care Facilities 1,496 1,829 22.3% 1.4
6241 Individual and Family Services 16,201 21,698 33.9% 1.2
6242 Community Food and Housing, and Emergency and Other Relief Services 783 849 8.4% 0.8
6243 Vocational Rehabilitation Services 1,642 1,996 21.6% 0.7
6244 Child Day Care Services 5,023 5,696 13.4% 1.0
7111 Performing Arts Companies 798 831 4.1% 1.1
7112 Spectator Sports 1,374 1,566 14.0% 1.6
7113 Promoters of Performing Arts, Sports, and Similar Events 1,424 1,557 9.3% 1.7
7114 Agents and Managers for Artists, Athletes, Entertainers, and Other Public Figures 62 75 21.0% 0.4
7115 Independent Artists, Writers, and Performers 94 123 30.9% 0.3
7121 Museums, Historical Sites, and Similar Institutions 2,019 2,290 13.4% 1.3
7131 Amusement Parks and Arcades 1,972 2,467 25.1% 1.6
7132 Gambling Industries 739 625 -15.4% 0.4
7139 Other Amusement and Recreation Industries 6,673 7,293 9.3% 0.8
7211 Traveler Accommodation 6,112 6,278 2.7% 0.5
7212 RV (Recreational Vehicle) Parks and Recreational Camps 163 188 15.3% 0.4
7213 Rooming and Boarding Houses 26 32 23.1% 0.3
7223 Special Food Services 5,670 6,527 15.1% 1.4
7224 Drinking Places (Alcoholic Beverages) 3,150 3,240 2.9% 1.4
7225 Restaurants and Other Eating Places 54,808 58,937 7.5% 0.9
8111 Automotive Repair and Maintenance 5,313 5,851 10.1% 0.9
8112 Electronic and Precision Equipment Repair and Maintenance 674 678 0.6% 1.0
8113 Commercial and Industrial Machinery and Equipment (except Automotive and Electronic) Repair and Maintenance 1,198 1,329 10.9% 0.9
8114 Personal and Household Goods Repair and Maintenance 391 442 13.0% 0.8
8121 Personal Care Services 5,806 6,404 10.3% 1.4
8122 Death Care Services 1,184 1,142 -3.5% 1.3
8123 Drycleaning and Laundry Services 1,564 1,527 -2.4% 0.8
8129 Other Personal Services 1,900 2,264 19.2% 1.0
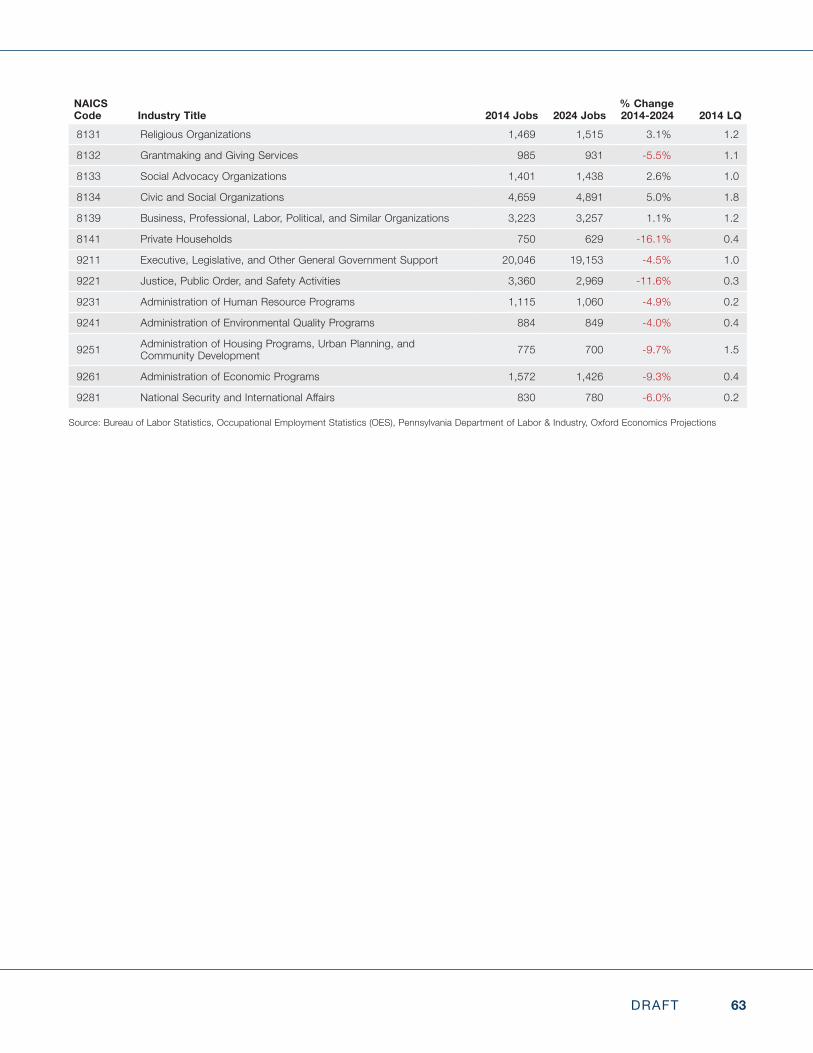
63DRAFT
NAICS Code Industry Title 2014 Jobs 2024 Jobs
% Change 2014-2024 2014 LQ
8131 Religious Organizations 1,469 1,515 3.1% 1.2
8132 Grantmaking and Giving Services 985 931 -5.5% 1.1
8133 Social Advocacy Organizations 1,401 1,438 2.6% 1.0
8134 Civic and Social Organizations 4,659 4,891 5.0% 1.8
8139 Business, Professional, Labor, Political, and Similar Organizations 3,223 3,257 1.1% 1.2
8141 Private Households 750 629 -16.1% 0.4
9211 Executive, Legislative, and Other General Government Support 20,046 19,153 -4.5% 1.0
9221 Justice, Public Order, and Safety Activities 3,360 2,969 -11.6% 0.3
9231 Administration of Human Resource Programs 1,115 1,060 -4.9% 0.2
9241 Administration of Environmental Quality Programs 884 849 -4.0% 0.4
9251 Administration of Housing Programs, Urban Planning, and Community Development 775 700 -9.7% 1.5
9261 Administration of Economic Programs 1,572 1,426 -9.3% 0.4
9281 NationalSecurityandInternationalAffairs 830 780 -6.0% 0.2
Source: Bureau of Labor Statistics, Occupational Employment Statistics (OES), Pennsylvania Department of Labor & Industry, Oxford Economics Projections
64DRAFT
APPENDIX D: OCCUPATION PROJECTIONS 2014-2024 FOR CLARION UNIVERSITY’S WORKFORCE REGION
Forthisanalysisa“skilled”occupationisdefinedasanoccupationinO*NETJob Zones19 Three, Four or Five. Most occupations in Job Zone Three require training in vocational schools, related on-the-job experience, or an associate’s degree.
The O*NET program is the nation’s primary source of occupational information. Central to the project is the O*NET database, containing information on hundredsofstandardizedandoccupation-specificdescriptors.Thedatabase,which is available to the public at no cost, is continually updated by surveying a broad range of workers from each occupation.20
JOB ZONE ONE: Little or No Preparation Needed
• Education – Some of these occupations may require a high school diplomaorGEDcertificate.
• Related Experience – Little or no previous work-related skill, knowledge, or experience is needed for these occupations. For example, a person can become a waiter or waitress even if he/she has never worked before.
• Job Training – Employees in these occupations need anywhere from a few days to a few months of training. Usually, an experienced worker could show you how to do the job.
• Job Zone Examples – These occupations involve following instructions and helping others. Examples include taxi drivers, amusement and recreation attendants, counter and rental clerks, nonfarm animal caretakers, continuous mining machine operators, and waiters/waitresses.
JOB ZONE TWO: Some Preparation Needed
• Education – These occupations usually require a high school diploma.
19 https://www.onetonline.org/help/online/zones20 http://www.onetcenter.org/overview.html
65DRAFT
• Related Experience – Some previous work-related skill, knowledge, or experienceisusuallyneeded.Forexample,atellerwouldbenefitfromexperience working directly with the public.
• Job Training – Employees in these occupations need anywhere from a few months to one year of working with experienced employees. A recognized apprenticeship program may be associated with these occupations.
• Job Zone Examples – These occupations often involve using your knowledge and skills to help others. Examples include sheet metal workers,forestfirefighters,customerservicerepresentatives,physicaltherapist aides, salespersons (retail), and tellers.
JOB ZONE THREE: Medium Preparation Needed
• Education – Most occupations in this zone require training in vocational schools, related on-the-job experience, or an associate’s degree.
• Related Experience – Previous work-related skill, knowledge, or experience is required for these occupations. For example, an electrician must have completed three or four years of apprenticeship or several years of vocational training, and often must have passed a licensing exam, in order to perform the job.
• Job Training – Employees in these occupations usually need one or two years of training involving both on-the-job experience and informal training with experienced workers. A recognized apprenticeship program may be associated with these occupations.
• Job Zone Examples – These occupations usually involve using communication and organizational skills to coordinate, supervise, manage, or train others to accomplish goals. Examples include food service managers, electricians, agricultural technicians, legal secretaries, occupational therapy assistants, and medical assistants.
JOB ZONE FOUR: Considerable Preparation Needed
• Education – Most of these occupations require a four-year bachelor’s degree, but some do not.
• Related Experience – A considerable amount of work-related skill, knowledge, or experience is needed for these occupations. For example, an accountant must complete four years of college and work for several yearsinaccountingtobeconsideredqualified.
66DRAFT
• Job Training – Employees in these occupations usually need several years of work-related experience, on-the-job training, and/or vocational training.
• Job Zone Examples – Many of these occupations involve coordinating, supervising, managing, or training others. Examples include accountants, sales managers, database administrators, teachers, chemists, art directors, and cost estimators.
JOB ZONE FIVE: Extensive Preparation Needed
• Education – Most of these occupations require graduate school. For example, they may require a master’s degree, and some require a Ph.D., M.D., or J.D. (law degree).
• Related Experience – Extensive skill, knowledge, and experience are neededfortheseoccupations.Manyrequiremorethanfiveyearsofexperience. For example, surgeons must complete four years of college andanadditionalfivetosevenyearsofspecializedmedicaltrainingtobeable to do their job.
• Job Training – Employees may need some on-the-job training, but most of these occupations assume that the person will already have the required skills, knowledge, work-related experience, and/or training.
• Job Zone Examples – These occupations often involve coordinating, training, supervising, or managing the activities of others to accomplish goals. Very advanced communication and organizational skills are required. Examples include librarians, lawyers, sports medicine physicians, wildlife biologists, school psychologists, surgeons, treasurers, and controllers.
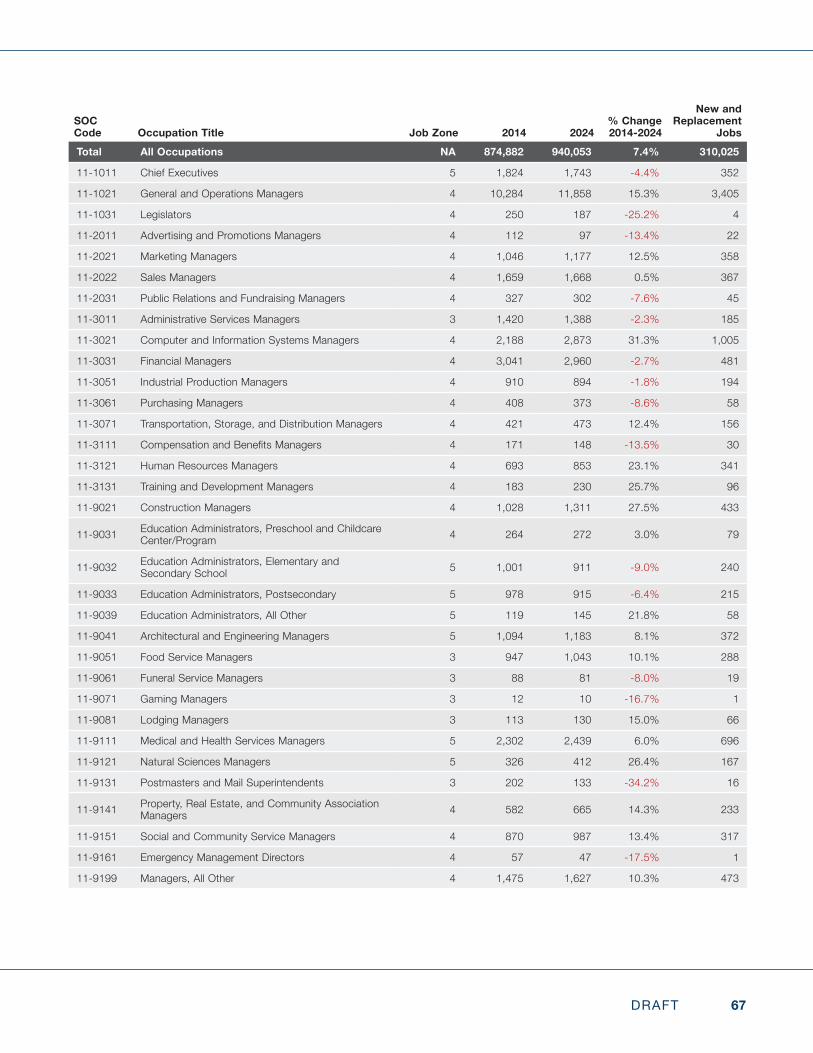
67DRAFT
SOC Code Occupation Title Job Zone 2014 2024
% Change 2014-2024
New and Replacement
Jobs
Total All Occupations NA 874,882 940,053 7.4% 310,025
11-1011 Chief Executives 5 1,824 1,743 -4.4% 352
11-1021 General and Operations Managers 4 10,284 11,858 15.3% 3,405
11-1031 Legislators 4 250 187 -25.2% 4
11-2011 Advertising and Promotions Managers 4 112 97 -13.4% 22
11-2021 Marketing Managers 4 1,046 1,177 12.5% 358
11-2022 Sales Managers 4 1,659 1,668 0.5% 367
11-2031 Public Relations and Fundraising Managers 4 327 302 -7.6% 45
11-3011 Administrative Services Managers 3 1,420 1,388 -2.3% 185
11-3021 Computer and Information Systems Managers 4 2,188 2,873 31.3% 1,005
11-3031 Financial Managers 4 3,041 2,960 -2.7% 481
11-3051 Industrial Production Managers 4 910 894 -1.8% 194
11-3061 Purchasing Managers 4 408 373 -8.6% 58
11-3071 Transportation, Storage, and Distribution Managers 4 421 473 12.4% 156
11-3111 CompensationandBenefitsManagers 4 171 148 -13.5% 30
11-3121 Human Resources Managers 4 693 853 23.1% 341
11-3131 Training and Development Managers 4 183 230 25.7% 96
11-9021 Construction Managers 4 1,028 1,311 27.5% 433
11-9031 Education Administrators, Preschool and Childcare Center/Program 4 264 272 3.0% 79
11-9032 Education Administrators, Elementary and Secondary School 5 1,001 911 -9.0% 240
11-9033 Education Administrators, Postsecondary 5 978 915 -6.4% 215
11-9039 Education Administrators, All Other 5 119 145 21.8% 58
11-9041 Architectural and Engineering Managers 5 1,094 1,183 8.1% 372
11-9051 Food Service Managers 3 947 1,043 10.1% 288
11-9061 Funeral Service Managers 3 88 81 -8.0% 19
11-9071 Gaming Managers 3 12 10 -16.7% 1
11-9081 Lodging Managers 3 113 130 15.0% 66
11-9111 Medical and Health Services Managers 5 2,302 2,439 6.0% 696
11-9121 Natural Sciences Managers 5 326 412 26.4% 167
11-9131 Postmasters and Mail Superintendents 3 202 133 -34.2% 16
11-9141 Property, Real Estate, and Community Association Managers 4 582 665 14.3% 233
11-9151 Social and Community Service Managers 4 870 987 13.4% 317
11-9161 Emergency Management Directors 4 57 47 -17.5% 1
11-9199 Managers, All Other 4 1,475 1,627 10.3% 473
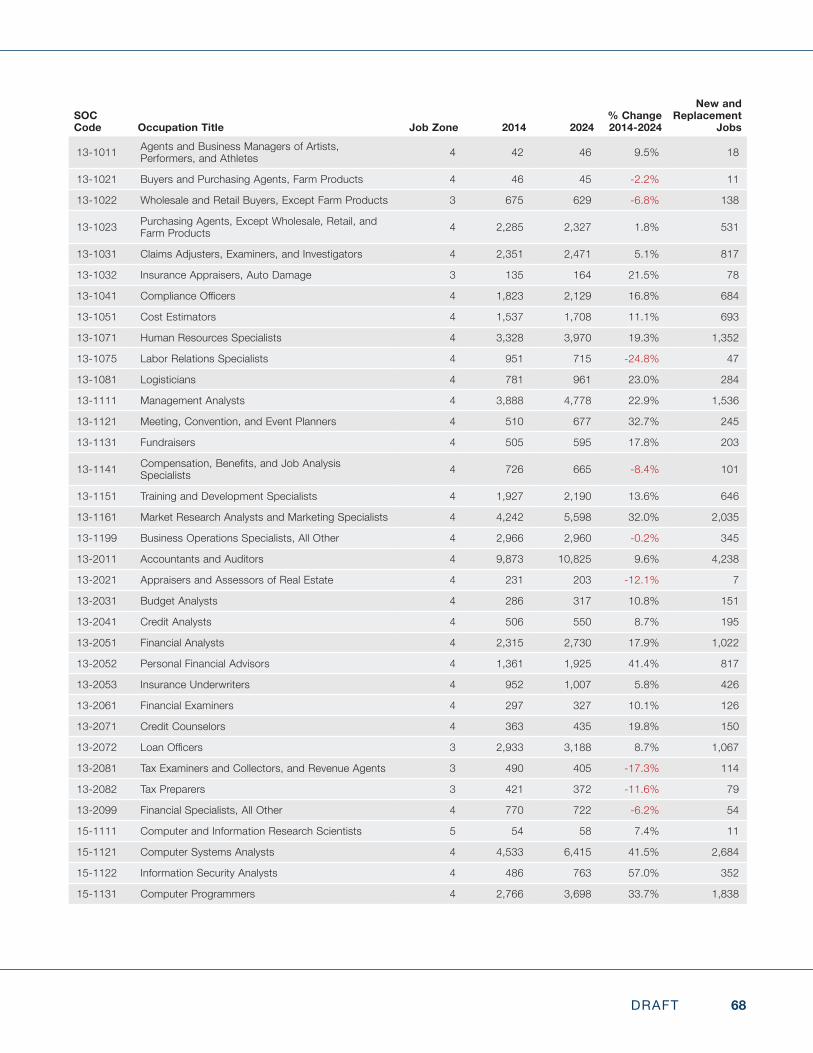
68DRAFT
SOC Code Occupation Title Job Zone 2014 2024
% Change 2014-2024
New and Replacement
Jobs
13-1011 Agents and Business Managers of Artists, Performers, and Athletes 4 42 46 9.5% 18
13-1021 Buyers and Purchasing Agents, Farm Products 4 46 45 -2.2% 11
13-1022 Wholesale and Retail Buyers, Except Farm Products 3 675 629 -6.8% 138
13-1023 Purchasing Agents, Except Wholesale, Retail, and Farm Products 4 2,285 2,327 1.8% 531
13-1031 Claims Adjusters, Examiners, and Investigators 4 2,351 2,471 5.1% 817
13-1032 Insurance Appraisers, Auto Damage 3 135 164 21.5% 78
13-1041 ComplianceOfficers 4 1,823 2,129 16.8% 684
13-1051 Cost Estimators 4 1,537 1,708 11.1% 693
13-1071 Human Resources Specialists 4 3,328 3,970 19.3% 1,352
13-1075 Labor Relations Specialists 4 951 715 -24.8% 47
13-1081 Logisticians 4 781 961 23.0% 284
13-1111 Management Analysts 4 3,888 4,778 22.9% 1,536
13-1121 Meeting, Convention, and Event Planners 4 510 677 32.7% 245
13-1131 Fundraisers 4 505 595 17.8% 203
13-1141 Compensation,Benefits,andJobAnalysisSpecialists 4 726 665 -8.4% 101
13-1151 Training and Development Specialists 4 1,927 2,190 13.6% 646
13-1161 Market Research Analysts and Marketing Specialists 4 4,242 5,598 32.0% 2,035
13-1199 Business Operations Specialists, All Other 4 2,966 2,960 -0.2% 345
13-2011 Accountants and Auditors 4 9,873 10,825 9.6% 4,238
13-2021 Appraisers and Assessors of Real Estate 4 231 203 -12.1% 7
13-2031 Budget Analysts 4 286 317 10.8% 151
13-2041 Credit Analysts 4 506 550 8.7% 195
13-2051 Financial Analysts 4 2,315 2,730 17.9% 1,022
13-2052 Personal Financial Advisors 4 1,361 1,925 41.4% 817
13-2053 Insurance Underwriters 4 952 1,007 5.8% 426
13-2061 Financial Examiners 4 297 327 10.1% 126
13-2071 Credit Counselors 4 363 435 19.8% 150
13-2072 LoanOfficers 3 2,933 3,188 8.7% 1,067
13-2081 Tax Examiners and Collectors, and Revenue Agents 3 490 405 -17.3% 114
13-2082 Tax Preparers 3 421 372 -11.6% 79
13-2099 Financial Specialists, All Other 4 770 722 -6.2% 54
15-1111 Computer and Information Research Scientists 5 54 58 7.4% 11
15-1121 Computer Systems Analysts 4 4,533 6,415 41.5% 2,684
15-1122 Information Security Analysts 4 486 763 57.0% 352
15-1131 Computer Programmers 4 2,766 3,698 33.7% 1,838
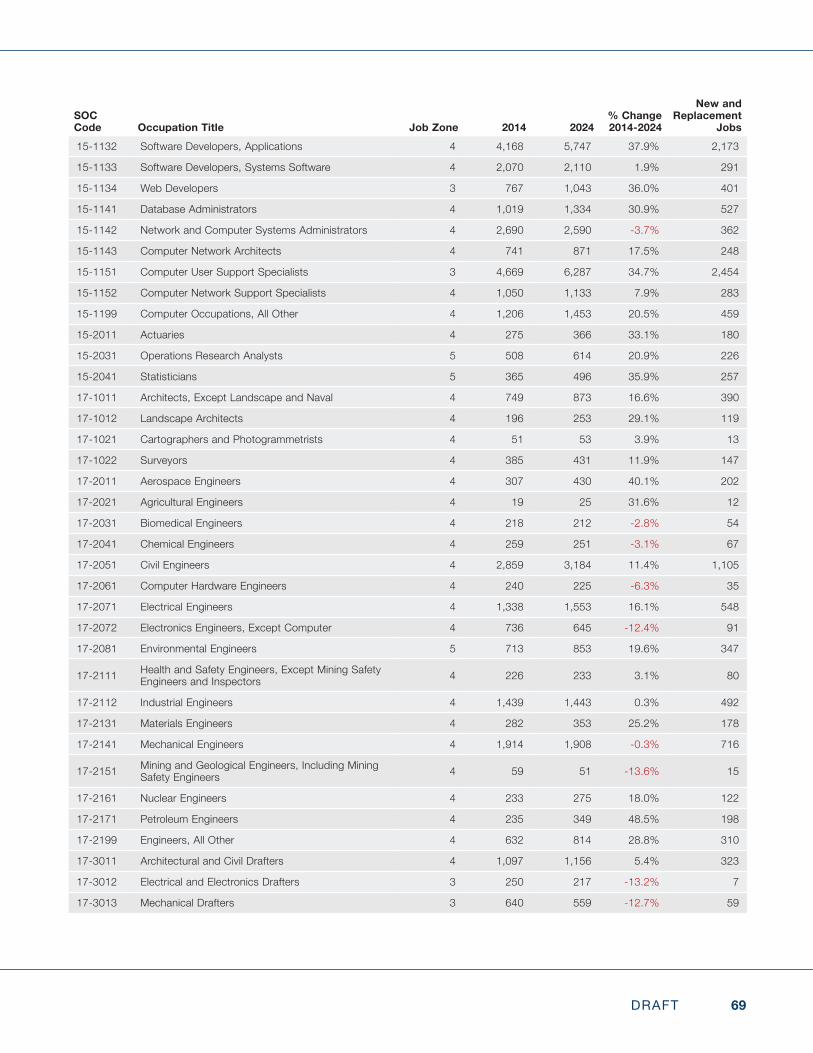
69DRAFT
SOC Code Occupation Title Job Zone 2014 2024
% Change 2014-2024
New and Replacement
Jobs15-1132 Software Developers, Applications 4 4,168 5,747 37.9% 2,173
15-1133 Software Developers, Systems Software 4 2,070 2,110 1.9% 291
15-1134 Web Developers 3 767 1,043 36.0% 401
15-1141 Database Administrators 4 1,019 1,334 30.9% 527
15-1142 Network and Computer Systems Administrators 4 2,690 2,590 -3.7% 362
15-1143 Computer Network Architects 4 741 871 17.5% 248
15-1151 Computer User Support Specialists 3 4,669 6,287 34.7% 2,454
15-1152 Computer Network Support Specialists 4 1,050 1,133 7.9% 283
15-1199 Computer Occupations, All Other 4 1,206 1,453 20.5% 459
15-2011 Actuaries 4 275 366 33.1% 180
15-2031 Operations Research Analysts 5 508 614 20.9% 226
15-2041 Statisticians 5 365 496 35.9% 257
17-1011 Architects, Except Landscape and Naval 4 749 873 16.6% 390
17-1012 Landscape Architects 4 196 253 29.1% 119
17-1021 Cartographers and Photogrammetrists 4 51 53 3.9% 13
17-1022 Surveyors 4 385 431 11.9% 147
17-2011 Aerospace Engineers 4 307 430 40.1% 202
17-2021 Agricultural Engineers 4 19 25 31.6% 12
17-2031 Biomedical Engineers 4 218 212 -2.8% 54
17-2041 Chemical Engineers 4 259 251 -3.1% 67
17-2051 Civil Engineers 4 2,859 3,184 11.4% 1,105
17-2061 Computer Hardware Engineers 4 240 225 -6.3% 35
17-2071 Electrical Engineers 4 1,338 1,553 16.1% 548
17-2072 Electronics Engineers, Except Computer 4 736 645 -12.4% 91
17-2081 Environmental Engineers 5 713 853 19.6% 347
17-2111 Health and Safety Engineers, Except Mining Safety Engineers and Inspectors 4 226 233 3.1% 80
17-2112 Industrial Engineers 4 1,439 1,443 0.3% 492
17-2131 Materials Engineers 4 282 353 25.2% 178
17-2141 Mechanical Engineers 4 1,914 1,908 -0.3% 716
17-2151 Mining and Geological Engineers, Including Mining Safety Engineers 4 59 51 -13.6% 15
17-2161 Nuclear Engineers 4 233 275 18.0% 122
17-2171 Petroleum Engineers 4 235 349 48.5% 198
17-2199 Engineers, All Other 4 632 814 28.8% 310
17-3011 Architectural and Civil Drafters 4 1,097 1,156 5.4% 323
17-3012 Electrical and Electronics Drafters 3 250 217 -13.2% 7
17-3013 Mechanical Drafters 3 640 559 -12.7% 59
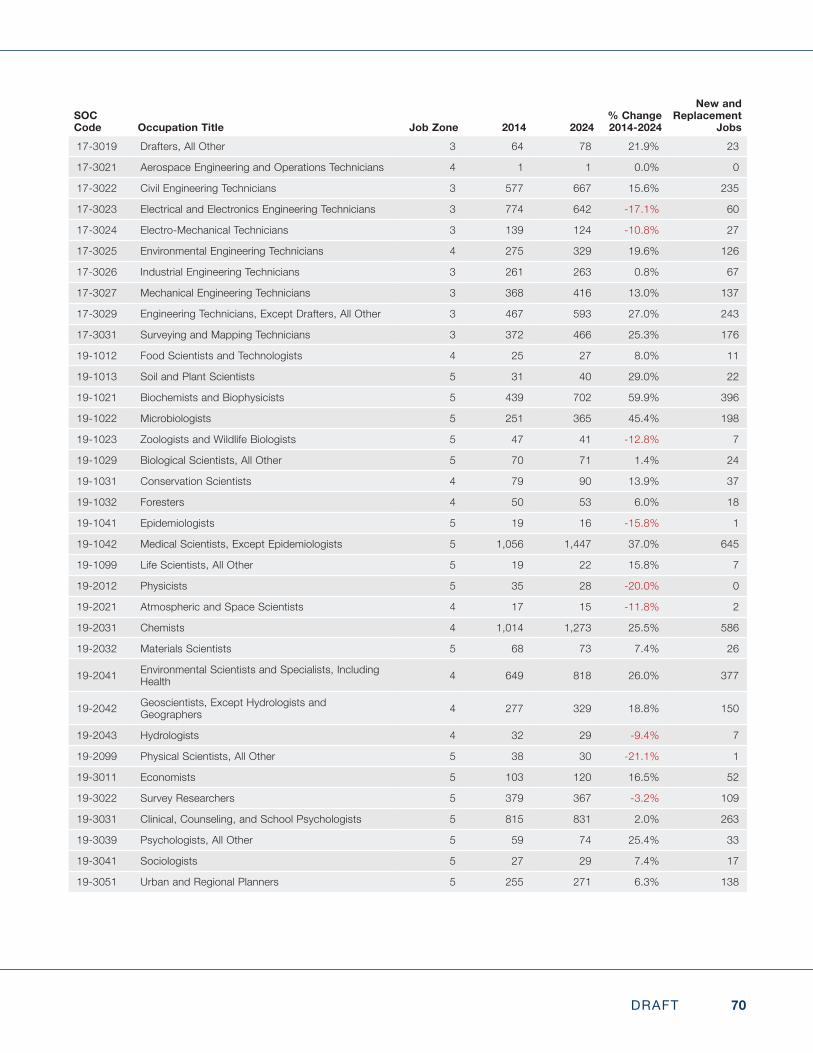
70DRAFT
SOC Code Occupation Title Job Zone 2014 2024
% Change 2014-2024
New and Replacement
Jobs17-3019 Drafters, All Other 3 64 78 21.9% 23
17-3021 Aerospace Engineering and Operations Technicians 4 1 1 0.0% 0
17-3022 Civil Engineering Technicians 3 577 667 15.6% 235
17-3023 Electrical and Electronics Engineering Technicians 3 774 642 -17.1% 60
17-3024 Electro-Mechanical Technicians 3 139 124 -10.8% 27
17-3025 Environmental Engineering Technicians 4 275 329 19.6% 126
17-3026 Industrial Engineering Technicians 3 261 263 0.8% 67
17-3027 Mechanical Engineering Technicians 3 368 416 13.0% 137
17-3029 Engineering Technicians, Except Drafters, All Other 3 467 593 27.0% 243
17-3031 Surveying and Mapping Technicians 3 372 466 25.3% 176
19-1012 Food Scientists and Technologists 4 25 27 8.0% 11
19-1013 Soil and Plant Scientists 5 31 40 29.0% 22
19-1021 Biochemists and Biophysicists 5 439 702 59.9% 396
19-1022 Microbiologists 5 251 365 45.4% 198
19-1023 Zoologists and Wildlife Biologists 5 47 41 -12.8% 7
19-1029 Biological Scientists, All Other 5 70 71 1.4% 24
19-1031 Conservation Scientists 4 79 90 13.9% 37
19-1032 Foresters 4 50 53 6.0% 18
19-1041 Epidemiologists 5 19 16 -15.8% 1
19-1042 Medical Scientists, Except Epidemiologists 5 1,056 1,447 37.0% 645
19-1099 Life Scientists, All Other 5 19 22 15.8% 7
19-2012 Physicists 5 35 28 -20.0% 0
19-2021 Atmospheric and Space Scientists 4 17 15 -11.8% 2
19-2031 Chemists 4 1,014 1,273 25.5% 586
19-2032 Materials Scientists 5 68 73 7.4% 26
19-2041 Environmental Scientists and Specialists, Including Health 4 649 818 26.0% 377
19-2042 Geoscientists, Except Hydrologists and Geographers 4 277 329 18.8% 150
19-2043 Hydrologists 4 32 29 -9.4% 7
19-2099 Physical Scientists, All Other 5 38 30 -21.1% 1
19-3011 Economists 5 103 120 16.5% 52
19-3022 Survey Researchers 5 379 367 -3.2% 109
19-3031 Clinical, Counseling, and School Psychologists 5 815 831 2.0% 263
19-3039 Psychologists, All Other 5 59 74 25.4% 33
19-3041 Sociologists 5 27 29 7.4% 17
19-3051 Urban and Regional Planners 5 255 271 6.3% 138
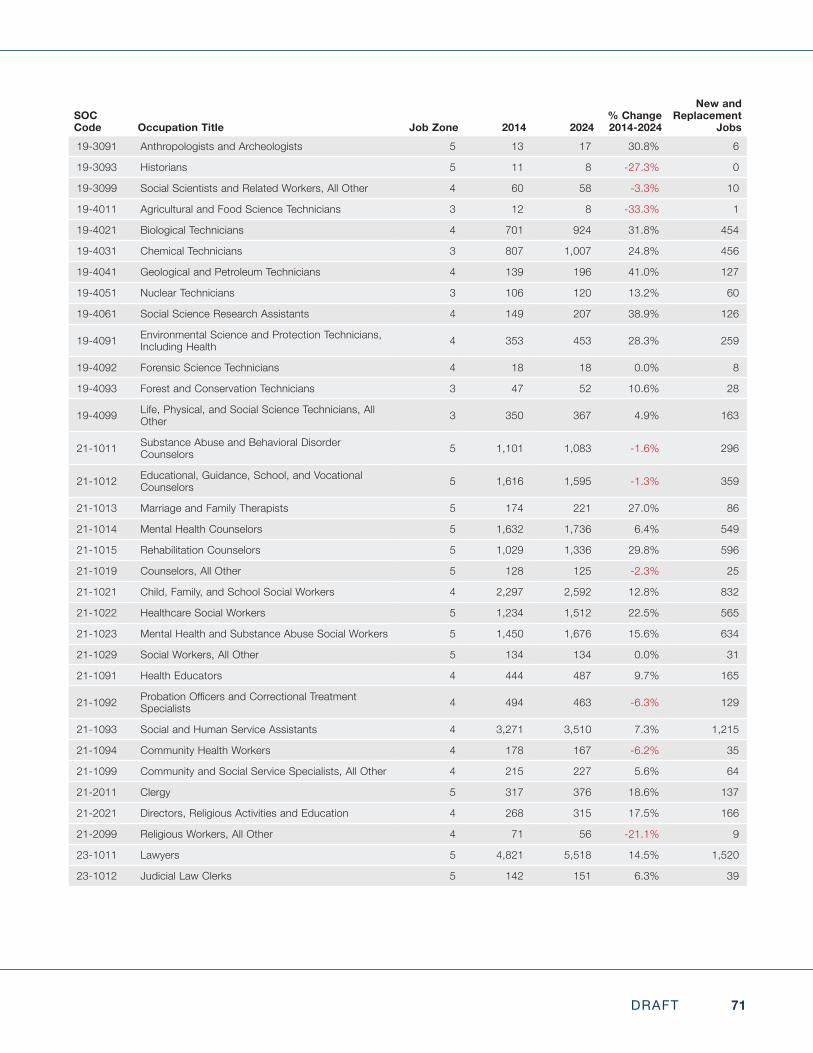
71DRAFT
SOC Code Occupation Title Job Zone 2014 2024
% Change 2014-2024
New and Replacement
Jobs19-3091 Anthropologists and Archeologists 5 13 17 30.8% 6
19-3093 Historians 5 11 8 -27.3% 0
19-3099 Social Scientists and Related Workers, All Other 4 60 58 -3.3% 10
19-4011 Agricultural and Food Science Technicians 3 12 8 -33.3% 1
19-4021 Biological Technicians 4 701 924 31.8% 454
19-4031 Chemical Technicians 3 807 1,007 24.8% 456
19-4041 Geological and Petroleum Technicians 4 139 196 41.0% 127
19-4051 Nuclear Technicians 3 106 120 13.2% 60
19-4061 Social Science Research Assistants 4 149 207 38.9% 126
19-4091 Environmental Science and Protection Technicians, Including Health 4 353 453 28.3% 259
19-4092 Forensic Science Technicians 4 18 18 0.0% 8
19-4093 Forest and Conservation Technicians 3 47 52 10.6% 28
19-4099 Life, Physical, and Social Science Technicians, All Other 3 350 367 4.9% 163
21-1011 Substance Abuse and Behavioral Disorder Counselors 5 1,101 1,083 -1.6% 296
21-1012 Educational, Guidance, School, and Vocational Counselors 5 1,616 1,595 -1.3% 359
21-1013 Marriage and Family Therapists 5 174 221 27.0% 86
21-1014 Mental Health Counselors 5 1,632 1,736 6.4% 549
21-1015 Rehabilitation Counselors 5 1,029 1,336 29.8% 596
21-1019 Counselors, All Other 5 128 125 -2.3% 25
21-1021 Child, Family, and School Social Workers 4 2,297 2,592 12.8% 832
21-1022 Healthcare Social Workers 5 1,234 1,512 22.5% 565
21-1023 Mental Health and Substance Abuse Social Workers 5 1,450 1,676 15.6% 634
21-1029 Social Workers, All Other 5 134 134 0.0% 31
21-1091 Health Educators 4 444 487 9.7% 165
21-1092 ProbationOfficersandCorrectionalTreatmentSpecialists 4 494 463 -6.3% 129
21-1093 Social and Human Service Assistants 4 3,271 3,510 7.3% 1,215
21-1094 Community Health Workers 4 178 167 -6.2% 35
21-1099 Community and Social Service Specialists, All Other 4 215 227 5.6% 64
21-2011 Clergy 5 317 376 18.6% 137
21-2021 Directors, Religious Activities and Education 4 268 315 17.5% 166
21-2099 Religious Workers, All Other 4 71 56 -21.1% 9
23-1011 Lawyers 5 4,821 5,518 14.5% 1,520
23-1012 Judicial Law Clerks 5 142 151 6.3% 39
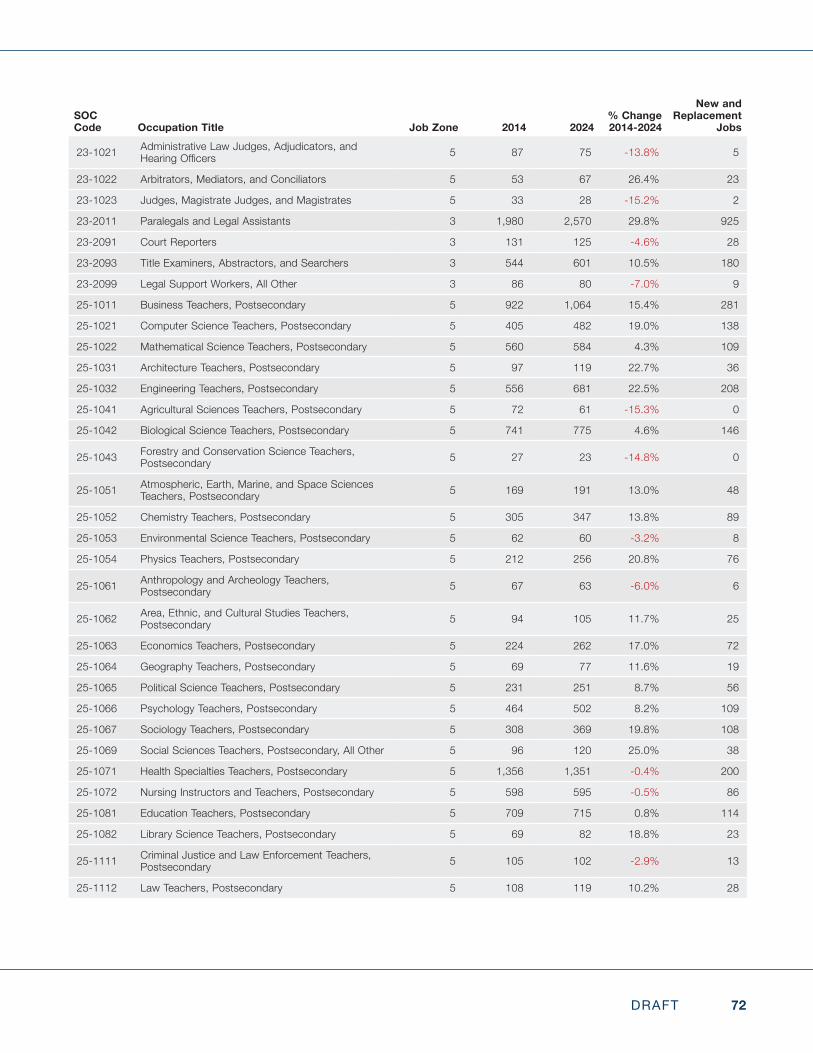
72DRAFT
SOC Code Occupation Title Job Zone 2014 2024
% Change 2014-2024
New and Replacement
Jobs
23-1021 Administrative Law Judges, Adjudicators, and HearingOfficers 5 87 75 -13.8% 5
23-1022 Arbitrators, Mediators, and Conciliators 5 53 67 26.4% 23
23-1023 Judges, Magistrate Judges, and Magistrates 5 33 28 -15.2% 2
23-2011 Paralegals and Legal Assistants 3 1,980 2,570 29.8% 925
23-2091 Court Reporters 3 131 125 -4.6% 28
23-2093 Title Examiners, Abstractors, and Searchers 3 544 601 10.5% 180
23-2099 Legal Support Workers, All Other 3 86 80 -7.0% 9
25-1011 Business Teachers, Postsecondary 5 922 1,064 15.4% 281
25-1021 Computer Science Teachers, Postsecondary 5 405 482 19.0% 138
25-1022 Mathematical Science Teachers, Postsecondary 5 560 584 4.3% 109
25-1031 Architecture Teachers, Postsecondary 5 97 119 22.7% 36
25-1032 Engineering Teachers, Postsecondary 5 556 681 22.5% 208
25-1041 Agricultural Sciences Teachers, Postsecondary 5 72 61 -15.3% 0
25-1042 Biological Science Teachers, Postsecondary 5 741 775 4.6% 146
25-1043 Forestry and Conservation Science Teachers, Postsecondary 5 27 23 -14.8% 0
25-1051 Atmospheric, Earth, Marine, and Space Sciences Teachers, Postsecondary 5 169 191 13.0% 48
25-1052 Chemistry Teachers, Postsecondary 5 305 347 13.8% 89
25-1053 Environmental Science Teachers, Postsecondary 5 62 60 -3.2% 8
25-1054 Physics Teachers, Postsecondary 5 212 256 20.8% 76
25-1061 Anthropology and Archeology Teachers, Postsecondary 5 67 63 -6.0% 6
25-1062 Area, Ethnic, and Cultural Studies Teachers, Postsecondary 5 94 105 11.7% 25
25-1063 Economics Teachers, Postsecondary 5 224 262 17.0% 72
25-1064 Geography Teachers, Postsecondary 5 69 77 11.6% 19
25-1065 Political Science Teachers, Postsecondary 5 231 251 8.7% 56
25-1066 Psychology Teachers, Postsecondary 5 464 502 8.2% 109
25-1067 Sociology Teachers, Postsecondary 5 308 369 19.8% 108
25-1069 Social Sciences Teachers, Postsecondary, All Other 5 96 120 25.0% 38
25-1071 Health Specialties Teachers, Postsecondary 5 1,356 1,351 -0.4% 200
25-1072 Nursing Instructors and Teachers, Postsecondary 5 598 595 -0.5% 86
25-1081 Education Teachers, Postsecondary 5 709 715 0.8% 114
25-1082 Library Science Teachers, Postsecondary 5 69 82 18.8% 23
25-1111 Criminal Justice and Law Enforcement Teachers, Postsecondary 5 105 102 -2.9% 13
25-1112 Law Teachers, Postsecondary 5 108 119 10.2% 28
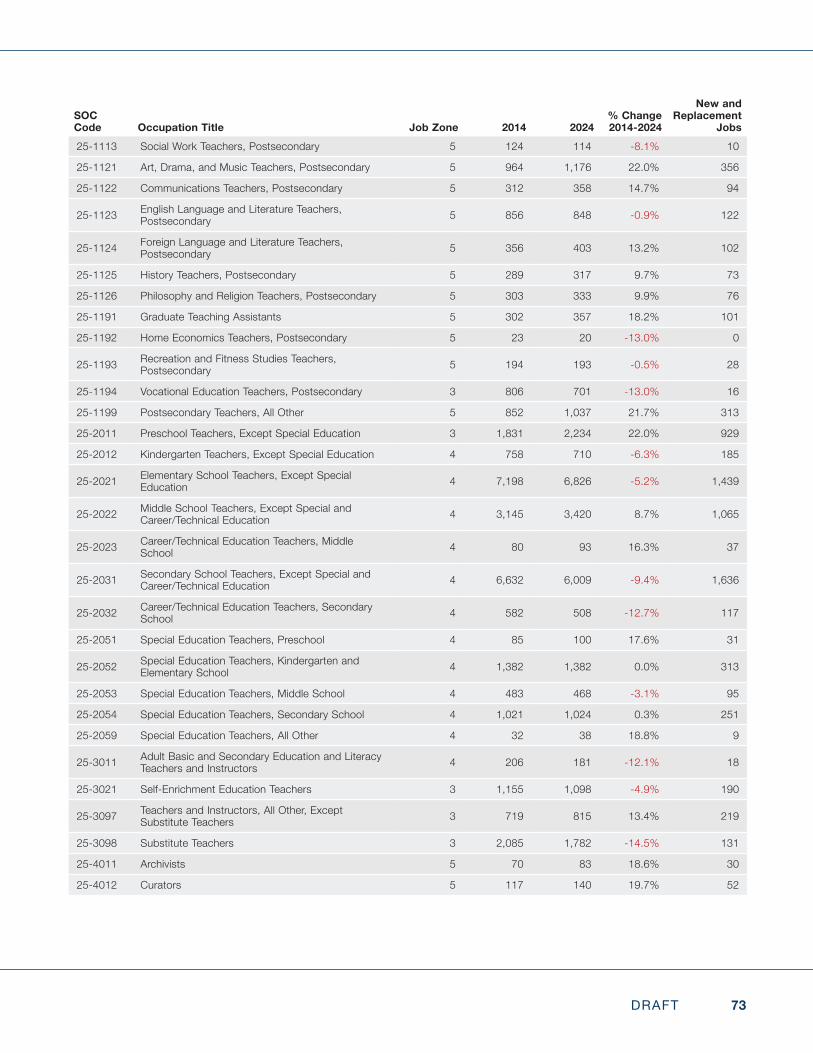
73DRAFT
SOC Code Occupation Title Job Zone 2014 2024
% Change 2014-2024
New and Replacement
Jobs25-1113 Social Work Teachers, Postsecondary 5 124 114 -8.1% 10
25-1121 Art, Drama, and Music Teachers, Postsecondary 5 964 1,176 22.0% 356
25-1122 Communications Teachers, Postsecondary 5 312 358 14.7% 94
25-1123 English Language and Literature Teachers, Postsecondary 5 856 848 -0.9% 122
25-1124 Foreign Language and Literature Teachers, Postsecondary 5 356 403 13.2% 102
25-1125 History Teachers, Postsecondary 5 289 317 9.7% 73
25-1126 Philosophy and Religion Teachers, Postsecondary 5 303 333 9.9% 76
25-1191 Graduate Teaching Assistants 5 302 357 18.2% 101
25-1192 Home Economics Teachers, Postsecondary 5 23 20 -13.0% 0
25-1193 Recreation and Fitness Studies Teachers, Postsecondary 5 194 193 -0.5% 28
25-1194 Vocational Education Teachers, Postsecondary 3 806 701 -13.0% 16
25-1199 Postsecondary Teachers, All Other 5 852 1,037 21.7% 313
25-2011 Preschool Teachers, Except Special Education 3 1,831 2,234 22.0% 929
25-2012 Kindergarten Teachers, Except Special Education 4 758 710 -6.3% 185
25-2021 Elementary School Teachers, Except Special Education 4 7,198 6,826 -5.2% 1,439
25-2022 Middle School Teachers, Except Special and Career/Technical Education 4 3,145 3,420 8.7% 1,065
25-2023 Career/Technical Education Teachers, Middle School 4 80 93 16.3% 37
25-2031 Secondary School Teachers, Except Special and Career/Technical Education 4 6,632 6,009 -9.4% 1,636
25-2032 Career/Technical Education Teachers, Secondary School 4 582 508 -12.7% 117
25-2051 Special Education Teachers, Preschool 4 85 100 17.6% 31
25-2052 Special Education Teachers, Kindergarten and Elementary School 4 1,382 1,382 0.0% 313
25-2053 Special Education Teachers, Middle School 4 483 468 -3.1% 95
25-2054 Special Education Teachers, Secondary School 4 1,021 1,024 0.3% 251
25-2059 Special Education Teachers, All Other 4 32 38 18.8% 9
25-3011 Adult Basic and Secondary Education and Literacy Teachers and Instructors 4 206 181 -12.1% 18
25-3021 Self-Enrichment Education Teachers 3 1,155 1,098 -4.9% 190
25-3097 Teachers and Instructors, All Other, Except Substitute Teachers 3 719 815 13.4% 219
25-3098 Substitute Teachers 3 2,085 1,782 -14.5% 131
25-4011 Archivists 5 70 83 18.6% 30
25-4012 Curators 5 117 140 19.7% 52
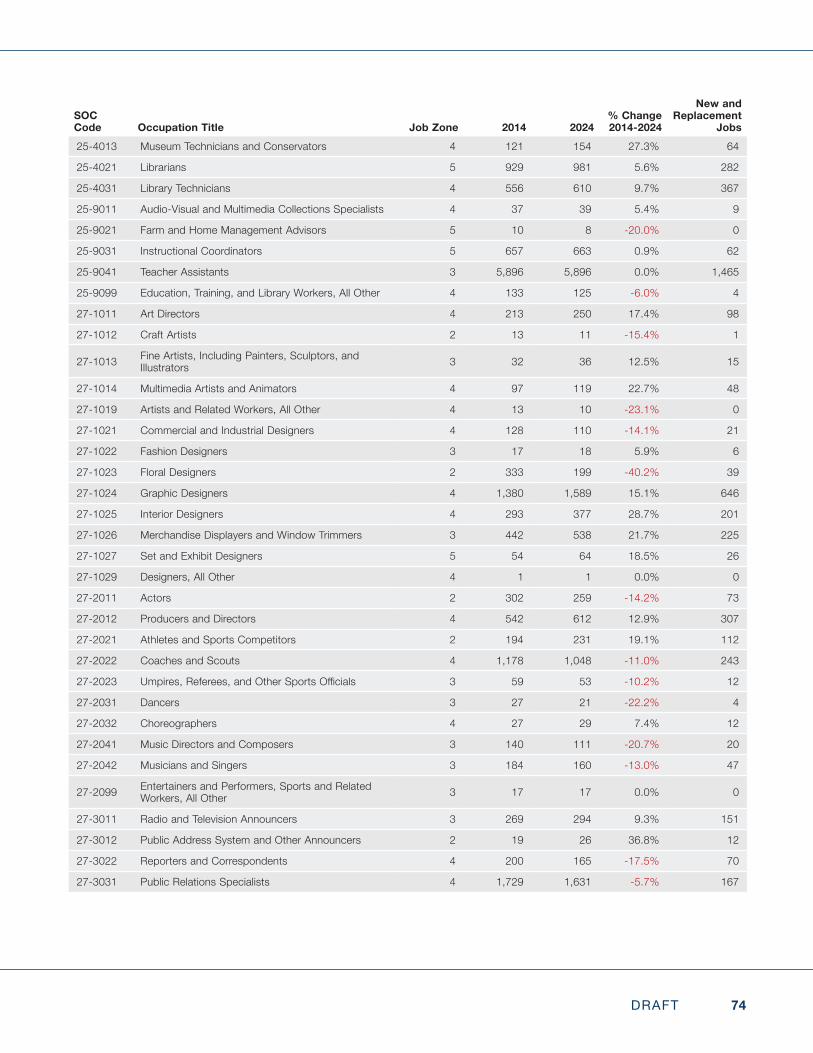
74DRAFT
SOC Code Occupation Title Job Zone 2014 2024
% Change 2014-2024
New and Replacement
Jobs25-4013 Museum Technicians and Conservators 4 121 154 27.3% 64
25-4021 Librarians 5 929 981 5.6% 282
25-4031 Library Technicians 4 556 610 9.7% 367
25-9011 Audio-Visual and Multimedia Collections Specialists 4 37 39 5.4% 9
25-9021 Farm and Home Management Advisors 5 10 8 -20.0% 0
25-9031 Instructional Coordinators 5 657 663 0.9% 62
25-9041 Teacher Assistants 3 5,896 5,896 0.0% 1,465
25-9099 Education, Training, and Library Workers, All Other 4 133 125 -6.0% 4
27-1011 Art Directors 4 213 250 17.4% 98
27-1012 Craft Artists 2 13 11 -15.4% 1
27-1013 Fine Artists, Including Painters, Sculptors, and Illustrators 3 32 36 12.5% 15
27-1014 Multimedia Artists and Animators 4 97 119 22.7% 48
27-1019 Artists and Related Workers, All Other 4 13 10 -23.1% 0
27-1021 Commercial and Industrial Designers 4 128 110 -14.1% 21
27-1022 Fashion Designers 3 17 18 5.9% 6
27-1023 Floral Designers 2 333 199 -40.2% 39
27-1024 Graphic Designers 4 1,380 1,589 15.1% 646
27-1025 Interior Designers 4 293 377 28.7% 201
27-1026 Merchandise Displayers and Window Trimmers 3 442 538 21.7% 225
27-1027 Set and Exhibit Designers 5 54 64 18.5% 26
27-1029 Designers, All Other 4 1 1 0.0% 0
27-2011 Actors 2 302 259 -14.2% 73
27-2012 Producers and Directors 4 542 612 12.9% 307
27-2021 Athletes and Sports Competitors 2 194 231 19.1% 112
27-2022 Coaches and Scouts 4 1,178 1,048 -11.0% 243
27-2023 Umpires,Referees,andOtherSportsOfficials 3 59 53 -10.2% 12
27-2031 Dancers 3 27 21 -22.2% 4
27-2032 Choreographers 4 27 29 7.4% 12
27-2041 Music Directors and Composers 3 140 111 -20.7% 20
27-2042 Musicians and Singers 3 184 160 -13.0% 47
27-2099 Entertainers and Performers, Sports and Related Workers, All Other 3 17 17 0.0% 0
27-3011 Radio and Television Announcers 3 269 294 9.3% 151
27-3012 Public Address System and Other Announcers 2 19 26 36.8% 12
27-3022 Reporters and Correspondents 4 200 165 -17.5% 70
27-3031 Public Relations Specialists 4 1,729 1,631 -5.7% 167
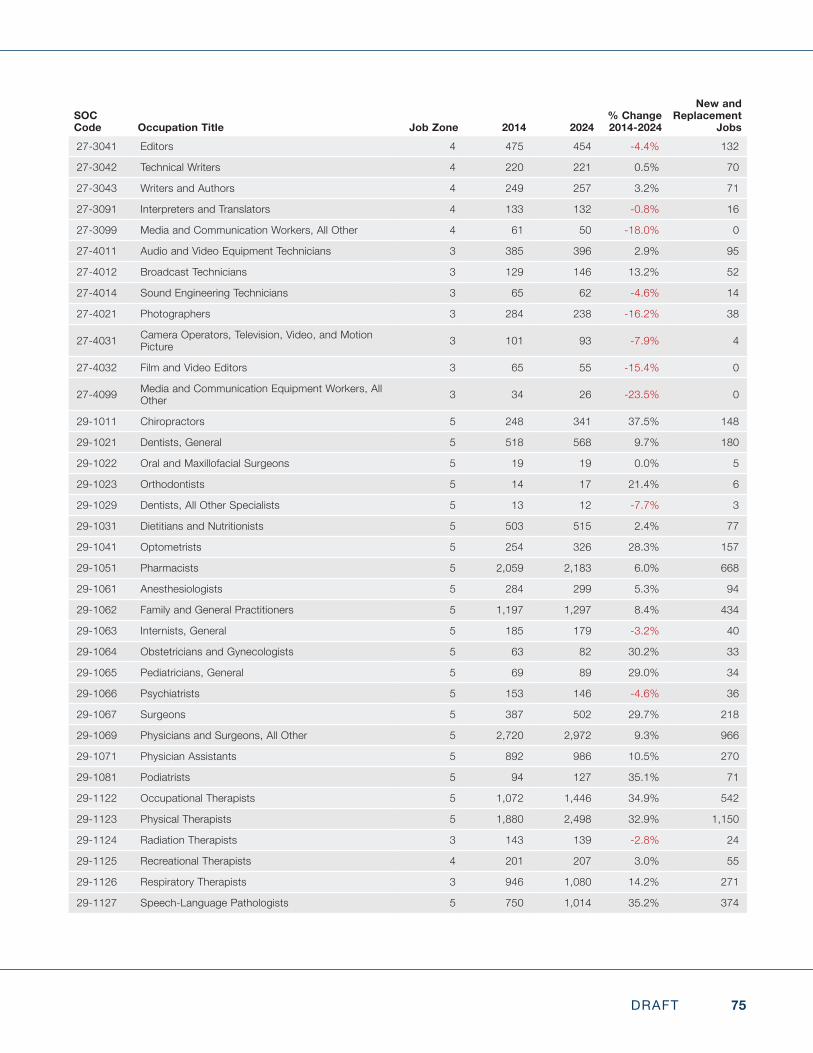
75DRAFT
SOC Code Occupation Title Job Zone 2014 2024
% Change 2014-2024
New and Replacement
Jobs27-3041 Editors 4 475 454 -4.4% 132
27-3042 Technical Writers 4 220 221 0.5% 70
27-3043 Writers and Authors 4 249 257 3.2% 71
27-3091 Interpreters and Translators 4 133 132 -0.8% 16
27-3099 Media and Communication Workers, All Other 4 61 50 -18.0% 0
27-4011 Audio and Video Equipment Technicians 3 385 396 2.9% 95
27-4012 Broadcast Technicians 3 129 146 13.2% 52
27-4014 Sound Engineering Technicians 3 65 62 -4.6% 14
27-4021 Photographers 3 284 238 -16.2% 38
27-4031 Camera Operators, Television, Video, and Motion Picture 3 101 93 -7.9% 4
27-4032 Film and Video Editors 3 65 55 -15.4% 0
27-4099 Media and Communication Equipment Workers, All Other 3 34 26 -23.5% 0
29-1011 Chiropractors 5 248 341 37.5% 148
29-1021 Dentists, General 5 518 568 9.7% 180
29-1022 Oral and Maxillofacial Surgeons 5 19 19 0.0% 5
29-1023 Orthodontists 5 14 17 21.4% 6
29-1029 Dentists, All Other Specialists 5 13 12 -7.7% 3
29-1031 Dietitians and Nutritionists 5 503 515 2.4% 77
29-1041 Optometrists 5 254 326 28.3% 157
29-1051 Pharmacists 5 2,059 2,183 6.0% 668
29-1061 Anesthesiologists 5 284 299 5.3% 94
29-1062 Family and General Practitioners 5 1,197 1,297 8.4% 434
29-1063 Internists, General 5 185 179 -3.2% 40
29-1064 Obstetricians and Gynecologists 5 63 82 30.2% 33
29-1065 Pediatricians, General 5 69 89 29.0% 34
29-1066 Psychiatrists 5 153 146 -4.6% 36
29-1067 Surgeons 5 387 502 29.7% 218
29-1069 Physicians and Surgeons, All Other 5 2,720 2,972 9.3% 966
29-1071 Physician Assistants 5 892 986 10.5% 270
29-1081 Podiatrists 5 94 127 35.1% 71
29-1122 Occupational Therapists 5 1,072 1,446 34.9% 542
29-1123 Physical Therapists 5 1,880 2,498 32.9% 1,150
29-1124 Radiation Therapists 3 143 139 -2.8% 24
29-1125 Recreational Therapists 4 201 207 3.0% 55
29-1126 Respiratory Therapists 3 946 1,080 14.2% 271
29-1127 Speech-Language Pathologists 5 750 1,014 35.2% 374
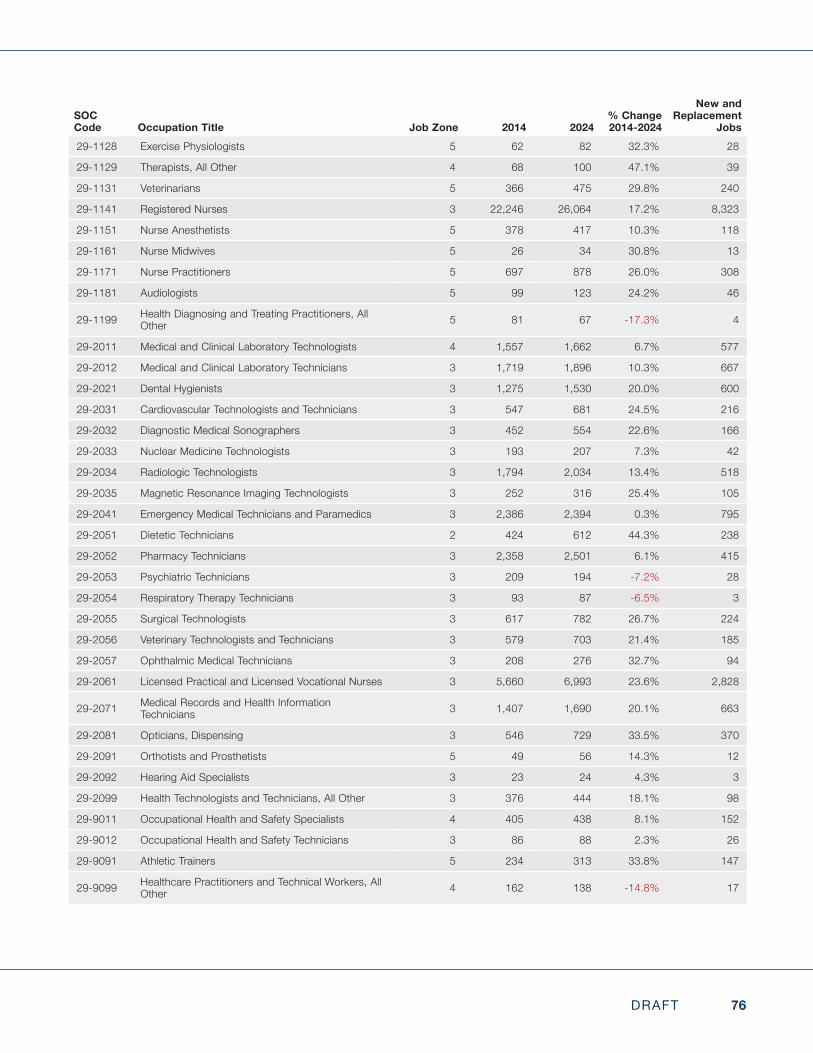
76DRAFT
SOC Code Occupation Title Job Zone 2014 2024
% Change 2014-2024
New and Replacement
Jobs29-1128 Exercise Physiologists 5 62 82 32.3% 28
29-1129 Therapists, All Other 4 68 100 47.1% 39
29-1131 Veterinarians 5 366 475 29.8% 240
29-1141 Registered Nurses 3 22,246 26,064 17.2% 8,323
29-1151 Nurse Anesthetists 5 378 417 10.3% 118
29-1161 Nurse Midwives 5 26 34 30.8% 13
29-1171 Nurse Practitioners 5 697 878 26.0% 308
29-1181 Audiologists 5 99 123 24.2% 46
29-1199 Health Diagnosing and Treating Practitioners, All Other 5 81 67 -17.3% 4
29-2011 Medical and Clinical Laboratory Technologists 4 1,557 1,662 6.7% 577
29-2012 Medical and Clinical Laboratory Technicians 3 1,719 1,896 10.3% 667
29-2021 Dental Hygienists 3 1,275 1,530 20.0% 600
29-2031 Cardiovascular Technologists and Technicians 3 547 681 24.5% 216
29-2032 Diagnostic Medical Sonographers 3 452 554 22.6% 166
29-2033 Nuclear Medicine Technologists 3 193 207 7.3% 42
29-2034 Radiologic Technologists 3 1,794 2,034 13.4% 518
29-2035 Magnetic Resonance Imaging Technologists 3 252 316 25.4% 105
29-2041 Emergency Medical Technicians and Paramedics 3 2,386 2,394 0.3% 795
29-2051 Dietetic Technicians 2 424 612 44.3% 238
29-2052 Pharmacy Technicians 3 2,358 2,501 6.1% 415
29-2053 Psychiatric Technicians 3 209 194 -7.2% 28
29-2054 Respiratory Therapy Technicians 3 93 87 -6.5% 3
29-2055 Surgical Technologists 3 617 782 26.7% 224
29-2056 Veterinary Technologists and Technicians 3 579 703 21.4% 185
29-2057 Ophthalmic Medical Technicians 3 208 276 32.7% 94
29-2061 Licensed Practical and Licensed Vocational Nurses 3 5,660 6,993 23.6% 2,828
29-2071 Medical Records and Health Information Technicians 3 1,407 1,690 20.1% 663
29-2081 Opticians, Dispensing 3 546 729 33.5% 370
29-2091 Orthotists and Prosthetists 5 49 56 14.3% 12
29-2092 Hearing Aid Specialists 3 23 24 4.3% 3
29-2099 Health Technologists and Technicians, All Other 3 376 444 18.1% 98
29-9011 Occupational Health and Safety Specialists 4 405 438 8.1% 152
29-9012 Occupational Health and Safety Technicians 3 86 88 2.3% 26
29-9091 Athletic Trainers 5 234 313 33.8% 147
29-9099 Healthcare Practitioners and Technical Workers, All Other 4 162 138 -14.8% 17
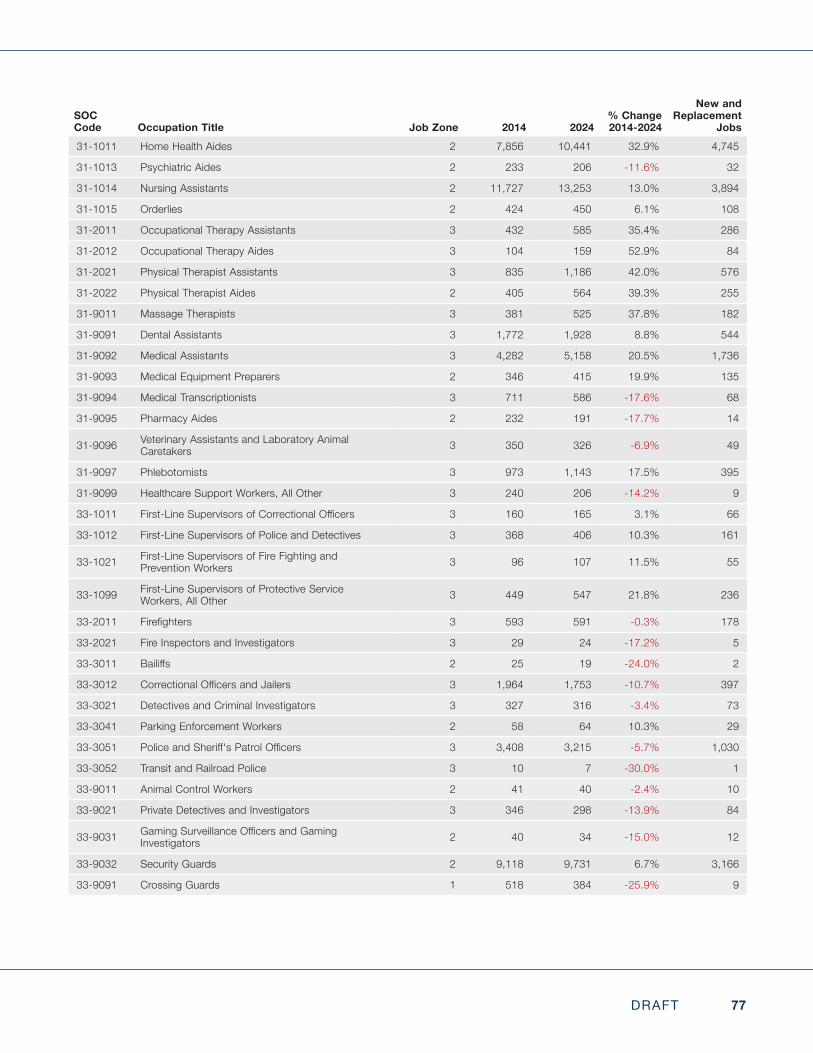
77DRAFT
SOC Code Occupation Title Job Zone 2014 2024
% Change 2014-2024
New and Replacement
Jobs31-1011 Home Health Aides 2 7,856 10,441 32.9% 4,745
31-1013 Psychiatric Aides 2 233 206 -11.6% 32
31-1014 Nursing Assistants 2 11,727 13,253 13.0% 3,894
31-1015 Orderlies 2 424 450 6.1% 108
31-2011 Occupational Therapy Assistants 3 432 585 35.4% 286
31-2012 Occupational Therapy Aides 3 104 159 52.9% 84
31-2021 Physical Therapist Assistants 3 835 1,186 42.0% 576
31-2022 Physical Therapist Aides 2 405 564 39.3% 255
31-9011 Massage Therapists 3 381 525 37.8% 182
31-9091 Dental Assistants 3 1,772 1,928 8.8% 544
31-9092 Medical Assistants 3 4,282 5,158 20.5% 1,736
31-9093 Medical Equipment Preparers 2 346 415 19.9% 135
31-9094 Medical Transcriptionists 3 711 586 -17.6% 68
31-9095 Pharmacy Aides 2 232 191 -17.7% 14
31-9096 Veterinary Assistants and Laboratory Animal Caretakers 3 350 326 -6.9% 49
31-9097 Phlebotomists 3 973 1,143 17.5% 395
31-9099 Healthcare Support Workers, All Other 3 240 206 -14.2% 9
33-1011 First-LineSupervisorsofCorrectionalOfficers 3 160 165 3.1% 66
33-1012 First-Line Supervisors of Police and Detectives 3 368 406 10.3% 161
33-1021 First-Line Supervisors of Fire Fighting and Prevention Workers 3 96 107 11.5% 55
33-1099 First-Line Supervisors of Protective Service Workers, All Other 3 449 547 21.8% 236
33-2011 Firefighters 3 593 591 -0.3% 178
33-2021 Fire Inspectors and Investigators 3 29 24 -17.2% 5
33-3011 Bailiffs 2 25 19 -24.0% 2
33-3012 CorrectionalOfficersandJailers 3 1,964 1,753 -10.7% 397
33-3021 Detectives and Criminal Investigators 3 327 316 -3.4% 73
33-3041 Parking Enforcement Workers 2 58 64 10.3% 29
33-3051 PoliceandSheriff'sPatrolOfficers 3 3,408 3,215 -5.7% 1,030
33-3052 Transit and Railroad Police 3 10 7 -30.0% 1
33-9011 Animal Control Workers 2 41 40 -2.4% 10
33-9021 Private Detectives and Investigators 3 346 298 -13.9% 84
33-9031 GamingSurveillanceOfficersandGamingInvestigators 2 40 34 -15.0% 12
33-9032 Security Guards 2 9,118 9,731 6.7% 3,166
33-9091 Crossing Guards 1 518 384 -25.9% 9
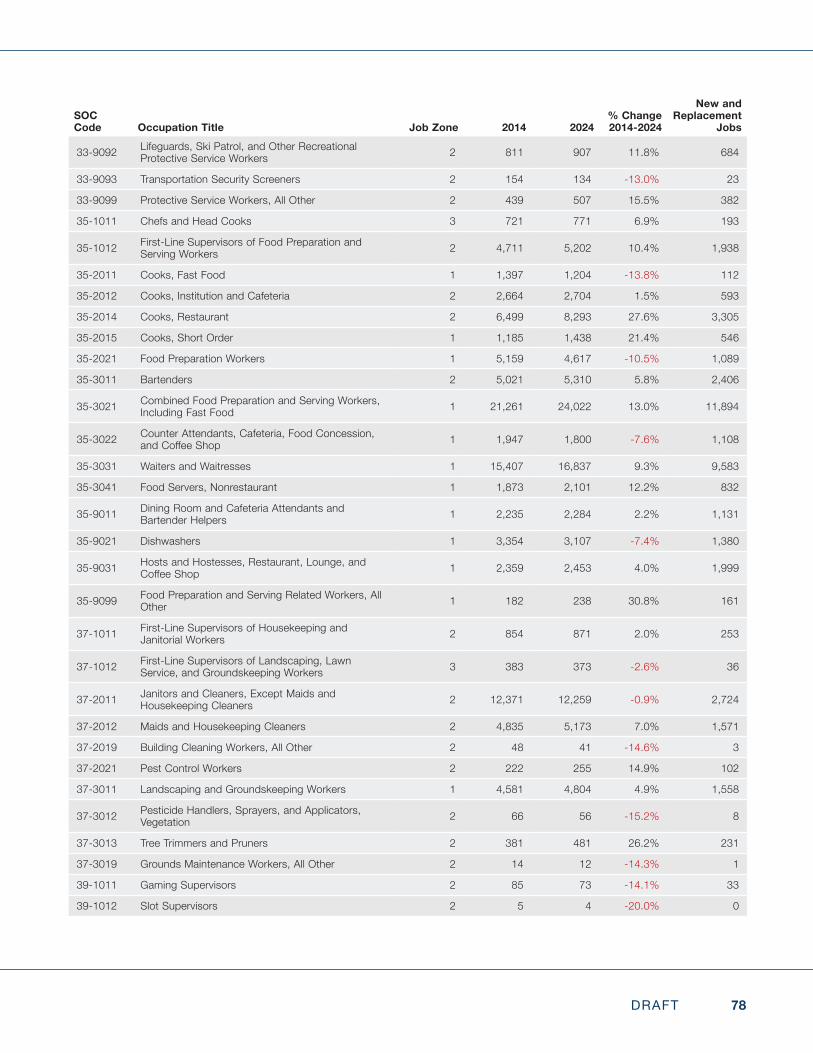
78DRAFT
SOC Code Occupation Title Job Zone 2014 2024
% Change 2014-2024
New and Replacement
Jobs
33-9092 Lifeguards, Ski Patrol, and Other Recreational Protective Service Workers 2 811 907 11.8% 684
33-9093 Transportation Security Screeners 2 154 134 -13.0% 23
33-9099 Protective Service Workers, All Other 2 439 507 15.5% 382
35-1011 Chefs and Head Cooks 3 721 771 6.9% 193
35-1012 First-Line Supervisors of Food Preparation and Serving Workers 2 4,711 5,202 10.4% 1,938
35-2011 Cooks, Fast Food 1 1,397 1,204 -13.8% 112
35-2012 Cooks, Institution and Cafeteria 2 2,664 2,704 1.5% 593
35-2014 Cooks, Restaurant 2 6,499 8,293 27.6% 3,305
35-2015 Cooks, Short Order 1 1,185 1,438 21.4% 546
35-2021 Food Preparation Workers 1 5,159 4,617 -10.5% 1,089
35-3011 Bartenders 2 5,021 5,310 5.8% 2,406
35-3021 Combined Food Preparation and Serving Workers, Including Fast Food 1 21,261 24,022 13.0% 11,894
35-3022 Counter Attendants, Cafeteria, Food Concession, andCoffeeShop 1 1,947 1,800 -7.6% 1,108
35-3031 Waiters and Waitresses 1 15,407 16,837 9.3% 9,583
35-3041 Food Servers, Nonrestaurant 1 1,873 2,101 12.2% 832
35-9011 Dining Room and Cafeteria Attendants and Bartender Helpers 1 2,235 2,284 2.2% 1,131
35-9021 Dishwashers 1 3,354 3,107 -7.4% 1,380
35-9031 Hosts and Hostesses, Restaurant, Lounge, and CoffeeShop 1 2,359 2,453 4.0% 1,999
35-9099 Food Preparation and Serving Related Workers, All Other 1 182 238 30.8% 161
37-1011 First-Line Supervisors of Housekeeping and Janitorial Workers 2 854 871 2.0% 253
37-1012 First-Line Supervisors of Landscaping, Lawn Service, and Groundskeeping Workers 3 383 373 -2.6% 36
37-2011 Janitors and Cleaners, Except Maids and Housekeeping Cleaners 2 12,371 12,259 -0.9% 2,724
37-2012 Maids and Housekeeping Cleaners 2 4,835 5,173 7.0% 1,571
37-2019 Building Cleaning Workers, All Other 2 48 41 -14.6% 3
37-2021 Pest Control Workers 2 222 255 14.9% 102
37-3011 Landscaping and Groundskeeping Workers 1 4,581 4,804 4.9% 1,558
37-3012 Pesticide Handlers, Sprayers, and Applicators, Vegetation 2 66 56 -15.2% 8
37-3013 Tree Trimmers and Pruners 2 381 481 26.2% 231
37-3019 Grounds Maintenance Workers, All Other 2 14 12 -14.3% 1
39-1011 Gaming Supervisors 2 85 73 -14.1% 33
39-1012 Slot Supervisors 2 5 4 -20.0% 0
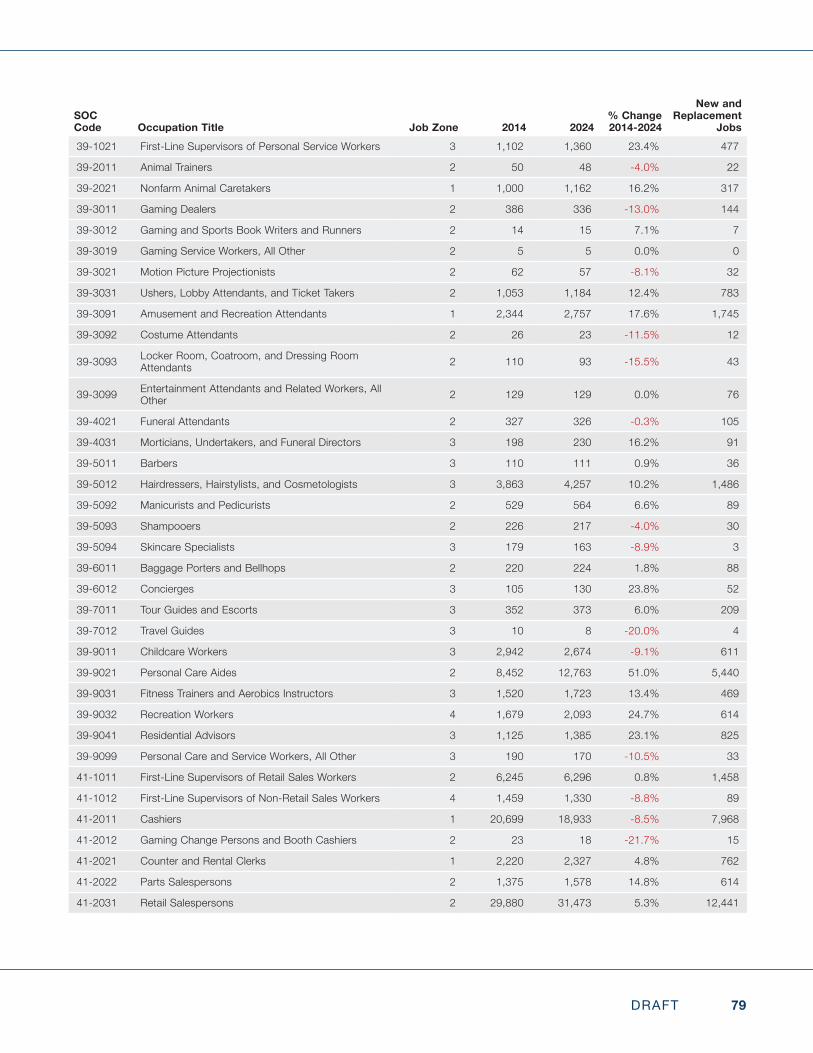
79DRAFT
SOC Code Occupation Title Job Zone 2014 2024
% Change 2014-2024
New and Replacement
Jobs39-1021 First-Line Supervisors of Personal Service Workers 3 1,102 1,360 23.4% 477
39-2011 Animal Trainers 2 50 48 -4.0% 22
39-2021 Nonfarm Animal Caretakers 1 1,000 1,162 16.2% 317
39-3011 Gaming Dealers 2 386 336 -13.0% 144
39-3012 Gaming and Sports Book Writers and Runners 2 14 15 7.1% 7
39-3019 Gaming Service Workers, All Other 2 5 5 0.0% 0
39-3021 Motion Picture Projectionists 2 62 57 -8.1% 32
39-3031 Ushers, Lobby Attendants, and Ticket Takers 2 1,053 1,184 12.4% 783
39-3091 Amusement and Recreation Attendants 1 2,344 2,757 17.6% 1,745
39-3092 Costume Attendants 2 26 23 -11.5% 12
39-3093 Locker Room, Coatroom, and Dressing Room Attendants 2 110 93 -15.5% 43
39-3099 Entertainment Attendants and Related Workers, All Other 2 129 129 0.0% 76
39-4021 Funeral Attendants 2 327 326 -0.3% 105
39-4031 Morticians, Undertakers, and Funeral Directors 3 198 230 16.2% 91
39-5011 Barbers 3 110 111 0.9% 36
39-5012 Hairdressers, Hairstylists, and Cosmetologists 3 3,863 4,257 10.2% 1,486
39-5092 Manicurists and Pedicurists 2 529 564 6.6% 89
39-5093 Shampooers 2 226 217 -4.0% 30
39-5094 Skincare Specialists 3 179 163 -8.9% 3
39-6011 Baggage Porters and Bellhops 2 220 224 1.8% 88
39-6012 Concierges 3 105 130 23.8% 52
39-7011 Tour Guides and Escorts 3 352 373 6.0% 209
39-7012 Travel Guides 3 10 8 -20.0% 4
39-9011 Childcare Workers 3 2,942 2,674 -9.1% 611
39-9021 Personal Care Aides 2 8,452 12,763 51.0% 5,440
39-9031 Fitness Trainers and Aerobics Instructors 3 1,520 1,723 13.4% 469
39-9032 Recreation Workers 4 1,679 2,093 24.7% 614
39-9041 Residential Advisors 3 1,125 1,385 23.1% 825
39-9099 Personal Care and Service Workers, All Other 3 190 170 -10.5% 33
41-1011 First-Line Supervisors of Retail Sales Workers 2 6,245 6,296 0.8% 1,458
41-1012 First-Line Supervisors of Non-Retail Sales Workers 4 1,459 1,330 -8.8% 89
41-2011 Cashiers 1 20,699 18,933 -8.5% 7,968
41-2012 Gaming Change Persons and Booth Cashiers 2 23 18 -21.7% 15
41-2021 Counter and Rental Clerks 1 2,220 2,327 4.8% 762
41-2022 Parts Salespersons 2 1,375 1,578 14.8% 614
41-2031 Retail Salespersons 2 29,880 31,473 5.3% 12,441
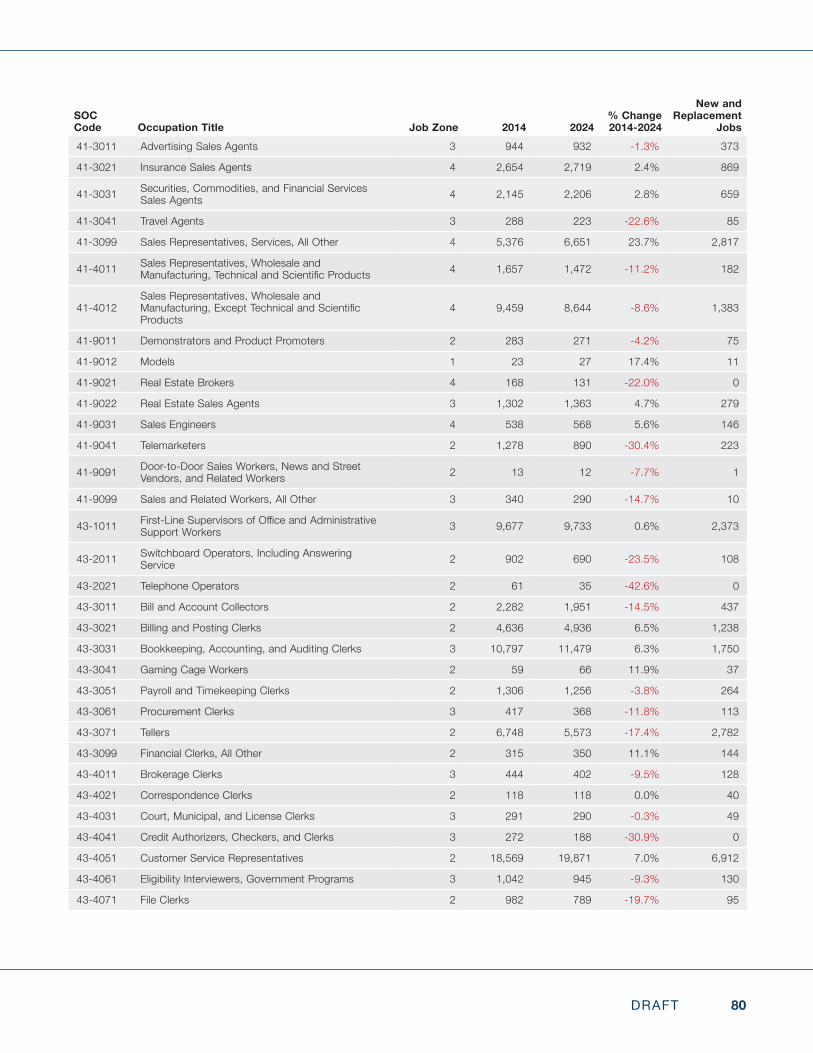
80DRAFT
SOC Code Occupation Title Job Zone 2014 2024
% Change 2014-2024
New and Replacement
Jobs41-3011 Advertising Sales Agents 3 944 932 -1.3% 373
41-3021 Insurance Sales Agents 4 2,654 2,719 2.4% 869
41-3031 Securities, Commodities, and Financial Services Sales Agents 4 2,145 2,206 2.8% 659
41-3041 Travel Agents 3 288 223 -22.6% 85
41-3099 Sales Representatives, Services, All Other 4 5,376 6,651 23.7% 2,817
41-4011 Sales Representatives, Wholesale and Manufacturing,TechnicalandScientificProducts 4 1,657 1,472 -11.2% 182
41-4012Sales Representatives, Wholesale and Manufacturing,ExceptTechnicalandScientificProducts
4 9,459 8,644 -8.6% 1,383
41-9011 Demonstrators and Product Promoters 2 283 271 -4.2% 75
41-9012 Models 1 23 27 17.4% 11
41-9021 Real Estate Brokers 4 168 131 -22.0% 0
41-9022 Real Estate Sales Agents 3 1,302 1,363 4.7% 279
41-9031 Sales Engineers 4 538 568 5.6% 146
41-9041 Telemarketers 2 1,278 890 -30.4% 223
41-9091 Door-to-Door Sales Workers, News and Street Vendors, and Related Workers 2 13 12 -7.7% 1
41-9099 Sales and Related Workers, All Other 3 340 290 -14.7% 10
43-1011 First-LineSupervisorsofOfficeandAdministrativeSupport Workers 3 9,677 9,733 0.6% 2,373
43-2011 Switchboard Operators, Including Answering Service 2 902 690 -23.5% 108
43-2021 Telephone Operators 2 61 35 -42.6% 0
43-3011 Bill and Account Collectors 2 2,282 1,951 -14.5% 437
43-3021 Billing and Posting Clerks 2 4,636 4,936 6.5% 1,238
43-3031 Bookkeeping, Accounting, and Auditing Clerks 3 10,797 11,479 6.3% 1,750
43-3041 Gaming Cage Workers 2 59 66 11.9% 37
43-3051 Payroll and Timekeeping Clerks 2 1,306 1,256 -3.8% 264
43-3061 Procurement Clerks 3 417 368 -11.8% 113
43-3071 Tellers 2 6,748 5,573 -17.4% 2,782
43-3099 Financial Clerks, All Other 2 315 350 11.1% 144
43-4011 Brokerage Clerks 3 444 402 -9.5% 128
43-4021 Correspondence Clerks 2 118 118 0.0% 40
43-4031 Court, Municipal, and License Clerks 3 291 290 -0.3% 49
43-4041 Credit Authorizers, Checkers, and Clerks 3 272 188 -30.9% 0
43-4051 Customer Service Representatives 2 18,569 19,871 7.0% 6,912
43-4061 Eligibility Interviewers, Government Programs 3 1,042 945 -9.3% 130
43-4071 File Clerks 2 982 789 -19.7% 95
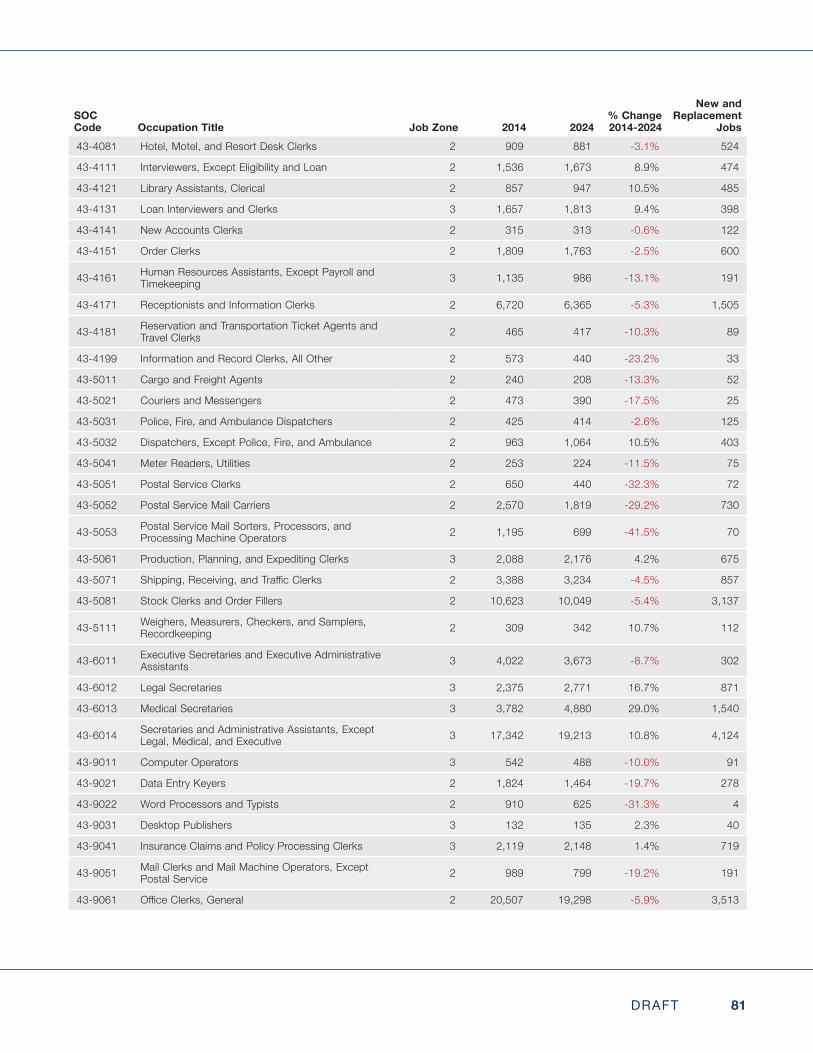
81DRAFT
SOC Code Occupation Title Job Zone 2014 2024
% Change 2014-2024
New and Replacement
Jobs43-4081 Hotel, Motel, and Resort Desk Clerks 2 909 881 -3.1% 524
43-4111 Interviewers, Except Eligibility and Loan 2 1,536 1,673 8.9% 474
43-4121 Library Assistants, Clerical 2 857 947 10.5% 485
43-4131 Loan Interviewers and Clerks 3 1,657 1,813 9.4% 398
43-4141 New Accounts Clerks 2 315 313 -0.6% 122
43-4151 Order Clerks 2 1,809 1,763 -2.5% 600
43-4161 Human Resources Assistants, Except Payroll and Timekeeping 3 1,135 986 -13.1% 191
43-4171 Receptionists and Information Clerks 2 6,720 6,365 -5.3% 1,505
43-4181 Reservation and Transportation Ticket Agents and Travel Clerks 2 465 417 -10.3% 89
43-4199 Information and Record Clerks, All Other 2 573 440 -23.2% 33
43-5011 Cargo and Freight Agents 2 240 208 -13.3% 52
43-5021 Couriers and Messengers 2 473 390 -17.5% 25
43-5031 Police, Fire, and Ambulance Dispatchers 2 425 414 -2.6% 125
43-5032 Dispatchers, Except Police, Fire, and Ambulance 2 963 1,064 10.5% 403
43-5041 Meter Readers, Utilities 2 253 224 -11.5% 75
43-5051 Postal Service Clerks 2 650 440 -32.3% 72
43-5052 Postal Service Mail Carriers 2 2,570 1,819 -29.2% 730
43-5053 Postal Service Mail Sorters, Processors, and Processing Machine Operators 2 1,195 699 -41.5% 70
43-5061 Production, Planning, and Expediting Clerks 3 2,088 2,176 4.2% 675
43-5071 Shipping,Receiving,andTrafficClerks 2 3,388 3,234 -4.5% 857
43-5081 Stock Clerks and Order Fillers 2 10,623 10,049 -5.4% 3,137
43-5111 Weighers, Measurers, Checkers, and Samplers, Recordkeeping 2 309 342 10.7% 112
43-6011 Executive Secretaries and Executive Administrative Assistants 3 4,022 3,673 -8.7% 302
43-6012 Legal Secretaries 3 2,375 2,771 16.7% 871
43-6013 Medical Secretaries 3 3,782 4,880 29.0% 1,540
43-6014 Secretaries and Administrative Assistants, Except Legal, Medical, and Executive 3 17,342 19,213 10.8% 4,124
43-9011 Computer Operators 3 542 488 -10.0% 91
43-9021 Data Entry Keyers 2 1,824 1,464 -19.7% 278
43-9022 Word Processors and Typists 2 910 625 -31.3% 4
43-9031 Desktop Publishers 3 132 135 2.3% 40
43-9041 Insurance Claims and Policy Processing Clerks 3 2,119 2,148 1.4% 719
43-9051 Mail Clerks and Mail Machine Operators, Except Postal Service 2 989 799 -19.2% 191
43-9061 OfficeClerks,General 2 20,507 19,298 -5.9% 3,513
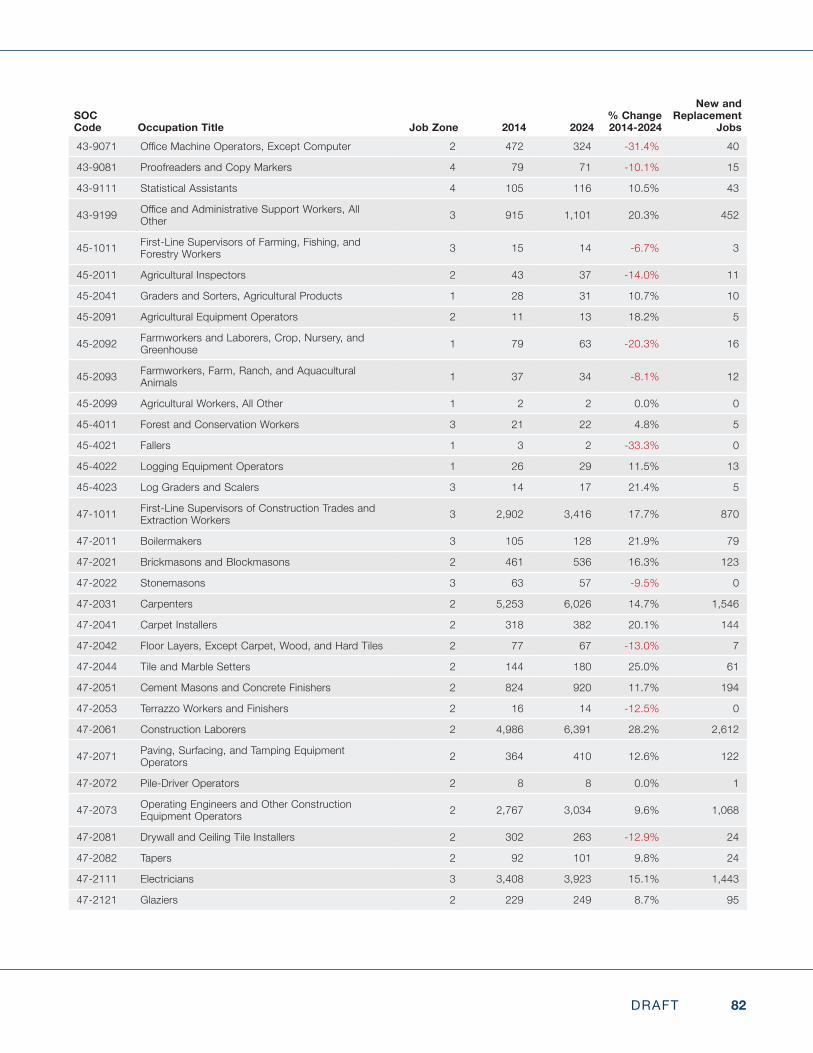
82DRAFT
SOC Code Occupation Title Job Zone 2014 2024
% Change 2014-2024
New and Replacement
Jobs43-9071 OfficeMachineOperators,ExceptComputer 2 472 324 -31.4% 40
43-9081 Proofreaders and Copy Markers 4 79 71 -10.1% 15
43-9111 Statistical Assistants 4 105 116 10.5% 43
43-9199 OfficeandAdministrativeSupportWorkers,AllOther 3 915 1,101 20.3% 452
45-1011 First-Line Supervisors of Farming, Fishing, and Forestry Workers 3 15 14 -6.7% 3
45-2011 Agricultural Inspectors 2 43 37 -14.0% 11
45-2041 Graders and Sorters, Agricultural Products 1 28 31 10.7% 10
45-2091 Agricultural Equipment Operators 2 11 13 18.2% 5
45-2092 Farmworkers and Laborers, Crop, Nursery, and Greenhouse 1 79 63 -20.3% 16
45-2093 Farmworkers, Farm, Ranch, and Aquacultural Animals 1 37 34 -8.1% 12
45-2099 Agricultural Workers, All Other 1 2 2 0.0% 0
45-4011 Forest and Conservation Workers 3 21 22 4.8% 5
45-4021 Fallers 1 3 2 -33.3% 0
45-4022 Logging Equipment Operators 1 26 29 11.5% 13
45-4023 Log Graders and Scalers 3 14 17 21.4% 5
47-1011 First-Line Supervisors of Construction Trades and Extraction Workers 3 2,902 3,416 17.7% 870
47-2011 Boilermakers 3 105 128 21.9% 79
47-2021 Brickmasons and Blockmasons 2 461 536 16.3% 123
47-2022 Stonemasons 3 63 57 -9.5% 0
47-2031 Carpenters 2 5,253 6,026 14.7% 1,546
47-2041 Carpet Installers 2 318 382 20.1% 144
47-2042 Floor Layers, Except Carpet, Wood, and Hard Tiles 2 77 67 -13.0% 7
47-2044 Tile and Marble Setters 2 144 180 25.0% 61
47-2051 Cement Masons and Concrete Finishers 2 824 920 11.7% 194
47-2053 Terrazzo Workers and Finishers 2 16 14 -12.5% 0
47-2061 Construction Laborers 2 4,986 6,391 28.2% 2,612
47-2071 Paving, Surfacing, and Tamping Equipment Operators 2 364 410 12.6% 122
47-2072 Pile-Driver Operators 2 8 8 0.0% 1
47-2073 Operating Engineers and Other Construction Equipment Operators 2 2,767 3,034 9.6% 1,068
47-2081 Drywall and Ceiling Tile Installers 2 302 263 -12.9% 24
47-2082 Tapers 2 92 101 9.8% 24
47-2111 Electricians 3 3,408 3,923 15.1% 1,443
47-2121 Glaziers 2 229 249 8.7% 95
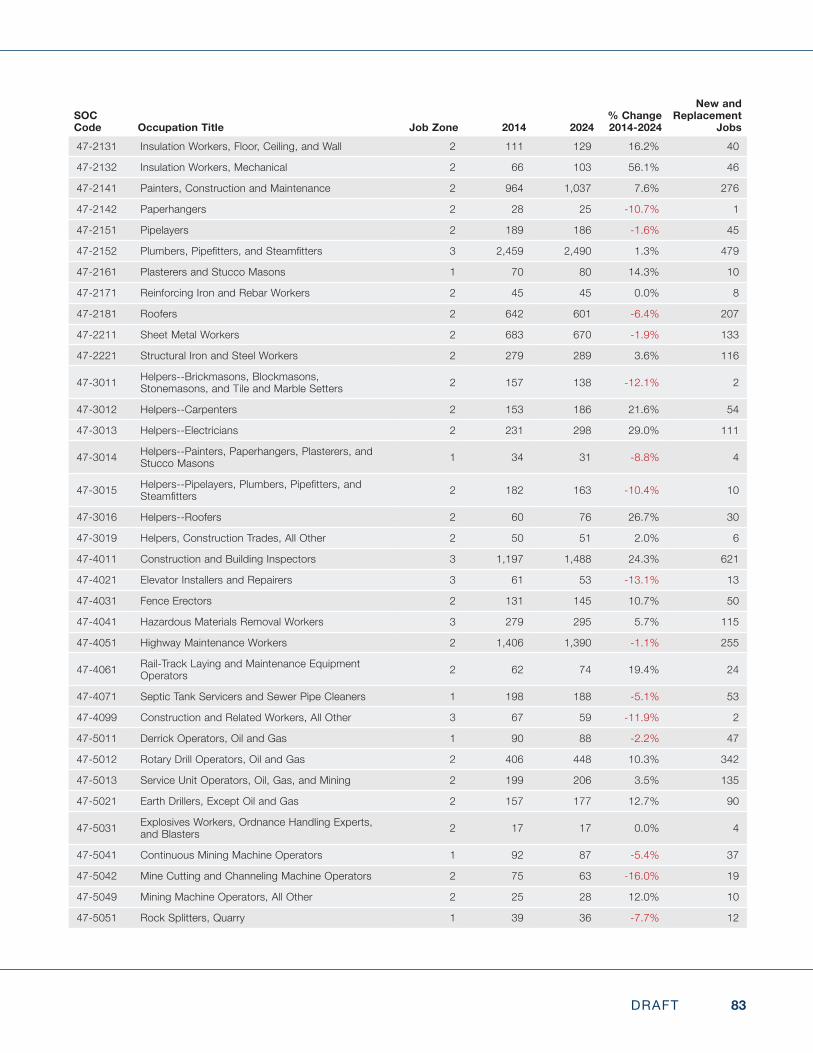
83DRAFT
SOC Code Occupation Title Job Zone 2014 2024
% Change 2014-2024
New and Replacement
Jobs47-2131 Insulation Workers, Floor, Ceiling, and Wall 2 111 129 16.2% 40
47-2132 Insulation Workers, Mechanical 2 66 103 56.1% 46
47-2141 Painters, Construction and Maintenance 2 964 1,037 7.6% 276
47-2142 Paperhangers 2 28 25 -10.7% 1
47-2151 Pipelayers 2 189 186 -1.6% 45
47-2152 Plumbers,Pipefitters,andSteamfitters 3 2,459 2,490 1.3% 479
47-2161 Plasterers and Stucco Masons 1 70 80 14.3% 10
47-2171 Reinforcing Iron and Rebar Workers 2 45 45 0.0% 8
47-2181 Roofers 2 642 601 -6.4% 207
47-2211 Sheet Metal Workers 2 683 670 -1.9% 133
47-2221 Structural Iron and Steel Workers 2 279 289 3.6% 116
47-3011 Helpers--Brickmasons, Blockmasons, Stonemasons, and Tile and Marble Setters 2 157 138 -12.1% 2
47-3012 Helpers--Carpenters 2 153 186 21.6% 54
47-3013 Helpers--Electricians 2 231 298 29.0% 111
47-3014 Helpers--Painters, Paperhangers, Plasterers, and Stucco Masons 1 34 31 -8.8% 4
47-3015 Helpers--Pipelayers,Plumbers,Pipefitters,andSteamfitters 2 182 163 -10.4% 10
47-3016 Helpers--Roofers 2 60 76 26.7% 30
47-3019 Helpers, Construction Trades, All Other 2 50 51 2.0% 6
47-4011 Construction and Building Inspectors 3 1,197 1,488 24.3% 621
47-4021 Elevator Installers and Repairers 3 61 53 -13.1% 13
47-4031 Fence Erectors 2 131 145 10.7% 50
47-4041 Hazardous Materials Removal Workers 3 279 295 5.7% 115
47-4051 Highway Maintenance Workers 2 1,406 1,390 -1.1% 255
47-4061 Rail-Track Laying and Maintenance Equipment Operators 2 62 74 19.4% 24
47-4071 Septic Tank Servicers and Sewer Pipe Cleaners 1 198 188 -5.1% 53
47-4099 Construction and Related Workers, All Other 3 67 59 -11.9% 2
47-5011 Derrick Operators, Oil and Gas 1 90 88 -2.2% 47
47-5012 Rotary Drill Operators, Oil and Gas 2 406 448 10.3% 342
47-5013 Service Unit Operators, Oil, Gas, and Mining 2 199 206 3.5% 135
47-5021 Earth Drillers, Except Oil and Gas 2 157 177 12.7% 90
47-5031 Explosives Workers, Ordnance Handling Experts, and Blasters 2 17 17 0.0% 4
47-5041 Continuous Mining Machine Operators 1 92 87 -5.4% 37
47-5042 Mine Cutting and Channeling Machine Operators 2 75 63 -16.0% 19
47-5049 Mining Machine Operators, All Other 2 25 28 12.0% 10
47-5051 Rock Splitters, Quarry 1 39 36 -7.7% 12
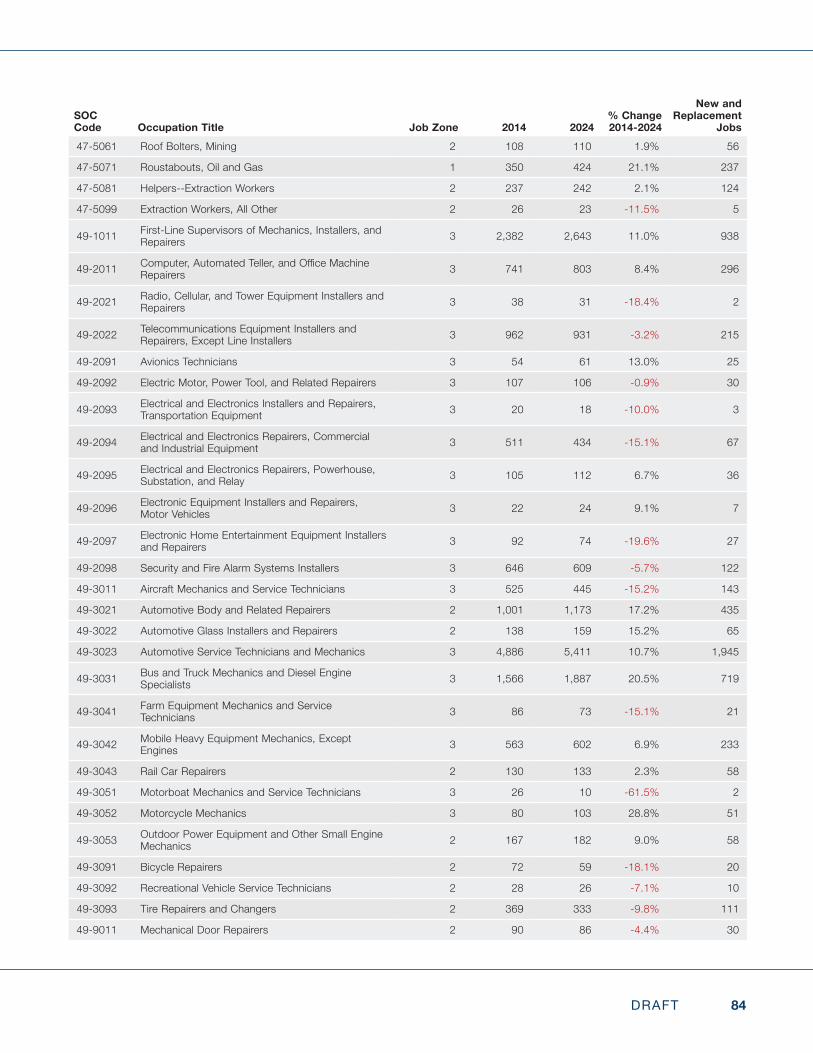
84DRAFT
SOC Code Occupation Title Job Zone 2014 2024
% Change 2014-2024
New and Replacement
Jobs47-5061 Roof Bolters, Mining 2 108 110 1.9% 56
47-5071 Roustabouts, Oil and Gas 1 350 424 21.1% 237
47-5081 Helpers--Extraction Workers 2 237 242 2.1% 124
47-5099 Extraction Workers, All Other 2 26 23 -11.5% 5
49-1011 First-Line Supervisors of Mechanics, Installers, and Repairers 3 2,382 2,643 11.0% 938
49-2011 Computer,AutomatedTeller,andOfficeMachineRepairers 3 741 803 8.4% 296
49-2021 Radio, Cellular, and Tower Equipment Installers and Repairers 3 38 31 -18.4% 2
49-2022 Telecommunications Equipment Installers and Repairers, Except Line Installers 3 962 931 -3.2% 215
49-2091 Avionics Technicians 3 54 61 13.0% 25
49-2092 Electric Motor, Power Tool, and Related Repairers 3 107 106 -0.9% 30
49-2093 Electrical and Electronics Installers and Repairers, Transportation Equipment 3 20 18 -10.0% 3
49-2094 Electrical and Electronics Repairers, Commercial and Industrial Equipment 3 511 434 -15.1% 67
49-2095 Electrical and Electronics Repairers, Powerhouse, Substation, and Relay 3 105 112 6.7% 36
49-2096 Electronic Equipment Installers and Repairers, Motor Vehicles 3 22 24 9.1% 7
49-2097 Electronic Home Entertainment Equipment Installers and Repairers 3 92 74 -19.6% 27
49-2098 Security and Fire Alarm Systems Installers 3 646 609 -5.7% 122
49-3011 Aircraft Mechanics and Service Technicians 3 525 445 -15.2% 143
49-3021 Automotive Body and Related Repairers 2 1,001 1,173 17.2% 435
49-3022 Automotive Glass Installers and Repairers 2 138 159 15.2% 65
49-3023 Automotive Service Technicians and Mechanics 3 4,886 5,411 10.7% 1,945
49-3031 Bus and Truck Mechanics and Diesel Engine Specialists 3 1,566 1,887 20.5% 719
49-3041 Farm Equipment Mechanics and Service Technicians 3 86 73 -15.1% 21
49-3042 Mobile Heavy Equipment Mechanics, Except Engines 3 563 602 6.9% 233
49-3043 Rail Car Repairers 2 130 133 2.3% 58
49-3051 Motorboat Mechanics and Service Technicians 3 26 10 -61.5% 2
49-3052 Motorcycle Mechanics 3 80 103 28.8% 51
49-3053 Outdoor Power Equipment and Other Small Engine Mechanics 2 167 182 9.0% 58
49-3091 Bicycle Repairers 2 72 59 -18.1% 20
49-3092 Recreational Vehicle Service Technicians 2 28 26 -7.1% 10
49-3093 Tire Repairers and Changers 2 369 333 -9.8% 111
49-9011 Mechanical Door Repairers 2 90 86 -4.4% 30
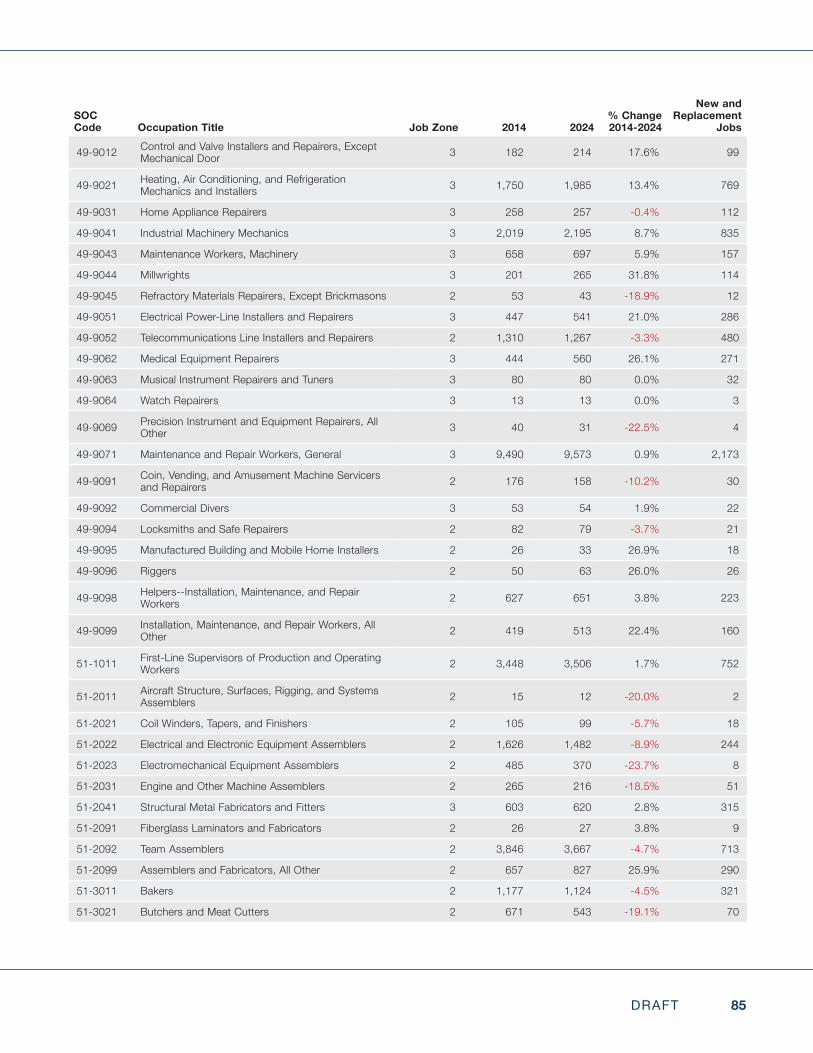
85DRAFT
SOC Code Occupation Title Job Zone 2014 2024
% Change 2014-2024
New and Replacement
Jobs
49-9012 Control and Valve Installers and Repairers, Except Mechanical Door 3 182 214 17.6% 99
49-9021 Heating, Air Conditioning, and Refrigeration Mechanics and Installers 3 1,750 1,985 13.4% 769
49-9031 Home Appliance Repairers 3 258 257 -0.4% 112
49-9041 Industrial Machinery Mechanics 3 2,019 2,195 8.7% 835
49-9043 Maintenance Workers, Machinery 3 658 697 5.9% 157
49-9044 Millwrights 3 201 265 31.8% 114
49-9045 Refractory Materials Repairers, Except Brickmasons 2 53 43 -18.9% 12
49-9051 Electrical Power-Line Installers and Repairers 3 447 541 21.0% 286
49-9052 Telecommunications Line Installers and Repairers 2 1,310 1,267 -3.3% 480
49-9062 Medical Equipment Repairers 3 444 560 26.1% 271
49-9063 Musical Instrument Repairers and Tuners 3 80 80 0.0% 32
49-9064 Watch Repairers 3 13 13 0.0% 3
49-9069 Precision Instrument and Equipment Repairers, All Other 3 40 31 -22.5% 4
49-9071 Maintenance and Repair Workers, General 3 9,490 9,573 0.9% 2,173
49-9091 Coin, Vending, and Amusement Machine Servicers and Repairers 2 176 158 -10.2% 30
49-9092 Commercial Divers 3 53 54 1.9% 22
49-9094 Locksmiths and Safe Repairers 2 82 79 -3.7% 21
49-9095 Manufactured Building and Mobile Home Installers 2 26 33 26.9% 18
49-9096 Riggers 2 50 63 26.0% 26
49-9098 Helpers--Installation, Maintenance, and Repair Workers 2 627 651 3.8% 223
49-9099 Installation, Maintenance, and Repair Workers, All Other 2 419 513 22.4% 160
51-1011 First-Line Supervisors of Production and Operating Workers 2 3,448 3,506 1.7% 752
51-2011 Aircraft Structure, Surfaces, Rigging, and Systems Assemblers 2 15 12 -20.0% 2
51-2021 Coil Winders, Tapers, and Finishers 2 105 99 -5.7% 18
51-2022 Electrical and Electronic Equipment Assemblers 2 1,626 1,482 -8.9% 244
51-2023 Electromechanical Equipment Assemblers 2 485 370 -23.7% 8
51-2031 Engine and Other Machine Assemblers 2 265 216 -18.5% 51
51-2041 Structural Metal Fabricators and Fitters 3 603 620 2.8% 315
51-2091 Fiberglass Laminators and Fabricators 2 26 27 3.8% 9
51-2092 Team Assemblers 2 3,846 3,667 -4.7% 713
51-2099 Assemblers and Fabricators, All Other 2 657 827 25.9% 290
51-3011 Bakers 2 1,177 1,124 -4.5% 321
51-3021 Butchers and Meat Cutters 2 671 543 -19.1% 70
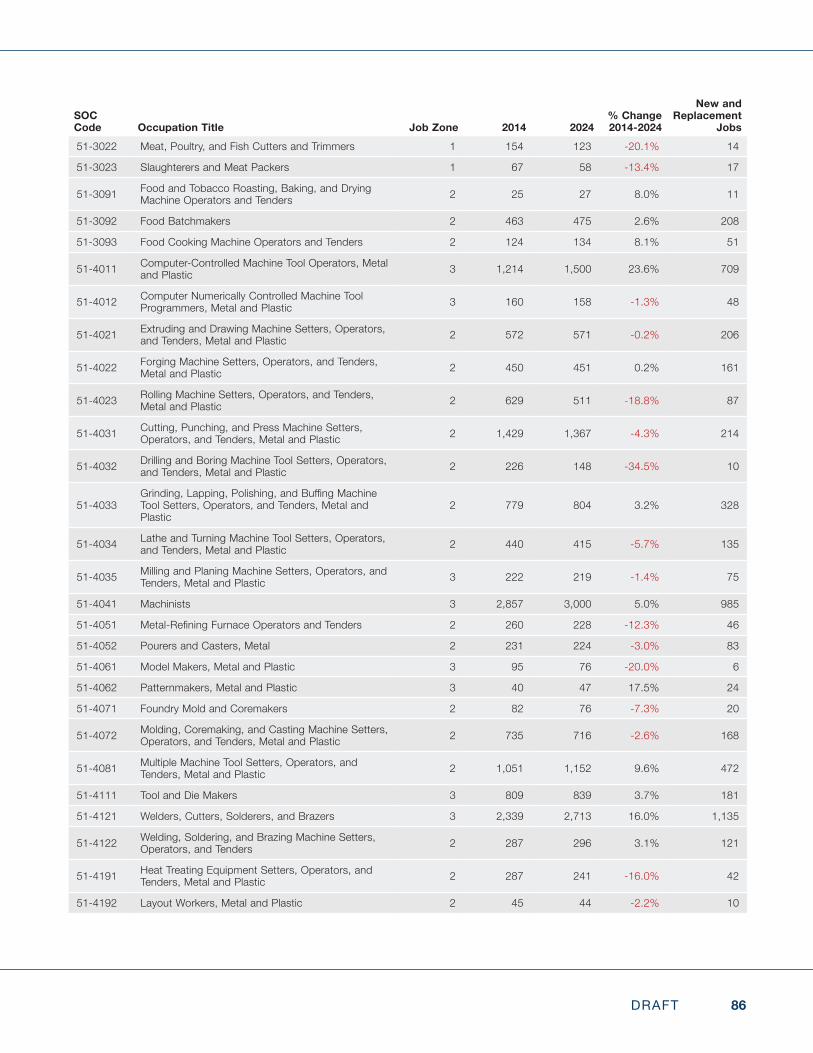
86DRAFT
SOC Code Occupation Title Job Zone 2014 2024
% Change 2014-2024
New and Replacement
Jobs51-3022 Meat, Poultry, and Fish Cutters and Trimmers 1 154 123 -20.1% 14
51-3023 Slaughterers and Meat Packers 1 67 58 -13.4% 17
51-3091 Food and Tobacco Roasting, Baking, and Drying Machine Operators and Tenders 2 25 27 8.0% 11
51-3092 Food Batchmakers 2 463 475 2.6% 208
51-3093 Food Cooking Machine Operators and Tenders 2 124 134 8.1% 51
51-4011 Computer-Controlled Machine Tool Operators, Metal and Plastic 3 1,214 1,500 23.6% 709
51-4012 Computer Numerically Controlled Machine Tool Programmers, Metal and Plastic 3 160 158 -1.3% 48
51-4021 Extruding and Drawing Machine Setters, Operators, and Tenders, Metal and Plastic 2 572 571 -0.2% 206
51-4022 Forging Machine Setters, Operators, and Tenders, Metal and Plastic 2 450 451 0.2% 161
51-4023 Rolling Machine Setters, Operators, and Tenders, Metal and Plastic 2 629 511 -18.8% 87
51-4031 Cutting, Punching, and Press Machine Setters, Operators, and Tenders, Metal and Plastic 2 1,429 1,367 -4.3% 214
51-4032 Drilling and Boring Machine Tool Setters, Operators, and Tenders, Metal and Plastic 2 226 148 -34.5% 10
51-4033Grinding,Lapping,Polishing,andBuffingMachineTool Setters, Operators, and Tenders, Metal and Plastic
2 779 804 3.2% 328
51-4034 Lathe and Turning Machine Tool Setters, Operators, and Tenders, Metal and Plastic 2 440 415 -5.7% 135
51-4035 Milling and Planing Machine Setters, Operators, and Tenders, Metal and Plastic 3 222 219 -1.4% 75
51-4041 Machinists 3 2,857 3,000 5.0% 985
51-4051 Metal-RefiningFurnaceOperatorsandTenders 2 260 228 -12.3% 46
51-4052 Pourers and Casters, Metal 2 231 224 -3.0% 83
51-4061 Model Makers, Metal and Plastic 3 95 76 -20.0% 6
51-4062 Patternmakers, Metal and Plastic 3 40 47 17.5% 24
51-4071 Foundry Mold and Coremakers 2 82 76 -7.3% 20
51-4072 Molding, Coremaking, and Casting Machine Setters, Operators, and Tenders, Metal and Plastic 2 735 716 -2.6% 168
51-4081 Multiple Machine Tool Setters, Operators, and Tenders, Metal and Plastic 2 1,051 1,152 9.6% 472
51-4111 Tool and Die Makers 3 809 839 3.7% 181
51-4121 Welders, Cutters, Solderers, and Brazers 3 2,339 2,713 16.0% 1,135
51-4122 Welding, Soldering, and Brazing Machine Setters, Operators, and Tenders 2 287 296 3.1% 121
51-4191 Heat Treating Equipment Setters, Operators, and Tenders, Metal and Plastic 2 287 241 -16.0% 42
51-4192 Layout Workers, Metal and Plastic 2 45 44 -2.2% 10
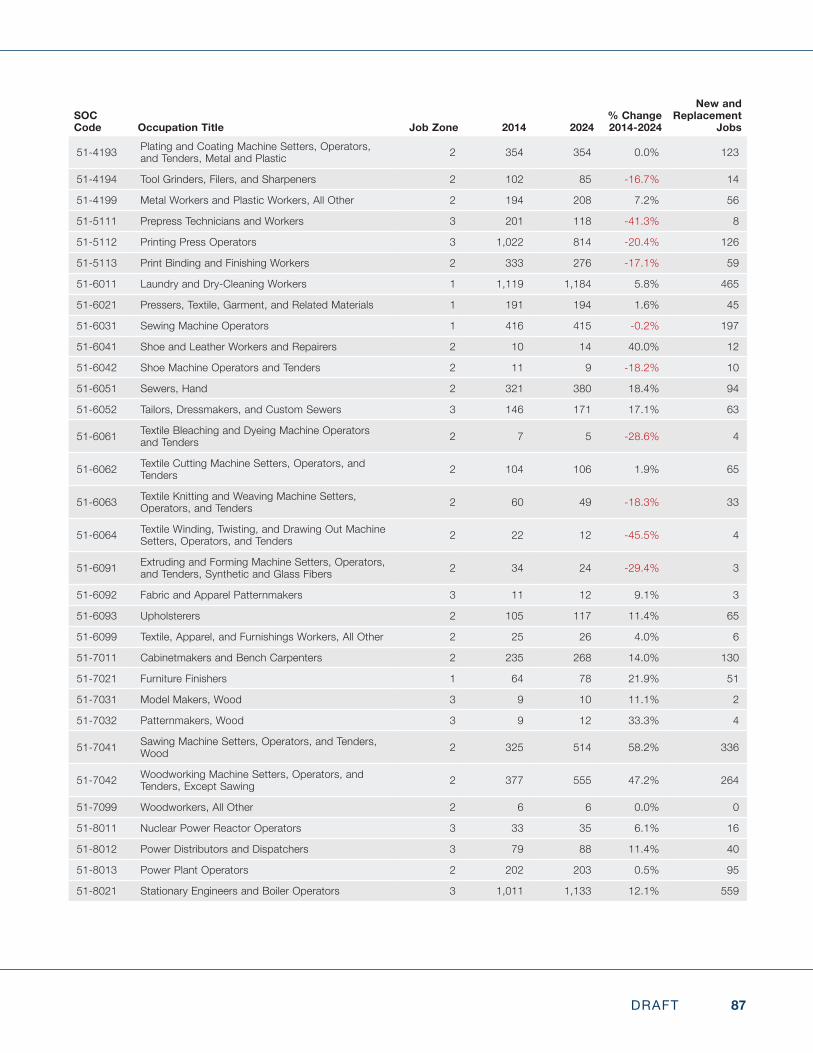
87DRAFT
SOC Code Occupation Title Job Zone 2014 2024
% Change 2014-2024
New and Replacement
Jobs
51-4193 Plating and Coating Machine Setters, Operators, and Tenders, Metal and Plastic 2 354 354 0.0% 123
51-4194 Tool Grinders, Filers, and Sharpeners 2 102 85 -16.7% 14
51-4199 Metal Workers and Plastic Workers, All Other 2 194 208 7.2% 56
51-5111 Prepress Technicians and Workers 3 201 118 -41.3% 8
51-5112 Printing Press Operators 3 1,022 814 -20.4% 126
51-5113 Print Binding and Finishing Workers 2 333 276 -17.1% 59
51-6011 Laundry and Dry-Cleaning Workers 1 1,119 1,184 5.8% 465
51-6021 Pressers, Textile, Garment, and Related Materials 1 191 194 1.6% 45
51-6031 Sewing Machine Operators 1 416 415 -0.2% 197
51-6041 Shoe and Leather Workers and Repairers 2 10 14 40.0% 12
51-6042 Shoe Machine Operators and Tenders 2 11 9 -18.2% 10
51-6051 Sewers, Hand 2 321 380 18.4% 94
51-6052 Tailors, Dressmakers, and Custom Sewers 3 146 171 17.1% 63
51-6061 Textile Bleaching and Dyeing Machine Operators and Tenders 2 7 5 -28.6% 4
51-6062 Textile Cutting Machine Setters, Operators, and Tenders 2 104 106 1.9% 65
51-6063 Textile Knitting and Weaving Machine Setters, Operators, and Tenders 2 60 49 -18.3% 33
51-6064 Textile Winding, Twisting, and Drawing Out Machine Setters, Operators, and Tenders 2 22 12 -45.5% 4
51-6091 Extruding and Forming Machine Setters, Operators, and Tenders, Synthetic and Glass Fibers 2 34 24 -29.4% 3
51-6092 Fabric and Apparel Patternmakers 3 11 12 9.1% 3
51-6093 Upholsterers 2 105 117 11.4% 65
51-6099 Textile, Apparel, and Furnishings Workers, All Other 2 25 26 4.0% 6
51-7011 Cabinetmakers and Bench Carpenters 2 235 268 14.0% 130
51-7021 Furniture Finishers 1 64 78 21.9% 51
51-7031 Model Makers, Wood 3 9 10 11.1% 2
51-7032 Patternmakers, Wood 3 9 12 33.3% 4
51-7041 Sawing Machine Setters, Operators, and Tenders, Wood 2 325 514 58.2% 336
51-7042 Woodworking Machine Setters, Operators, and Tenders, Except Sawing 2 377 555 47.2% 264
51-7099 Woodworkers, All Other 2 6 6 0.0% 0
51-8011 Nuclear Power Reactor Operators 3 33 35 6.1% 16
51-8012 Power Distributors and Dispatchers 3 79 88 11.4% 40
51-8013 Power Plant Operators 2 202 203 0.5% 95
51-8021 Stationary Engineers and Boiler Operators 3 1,011 1,133 12.1% 559
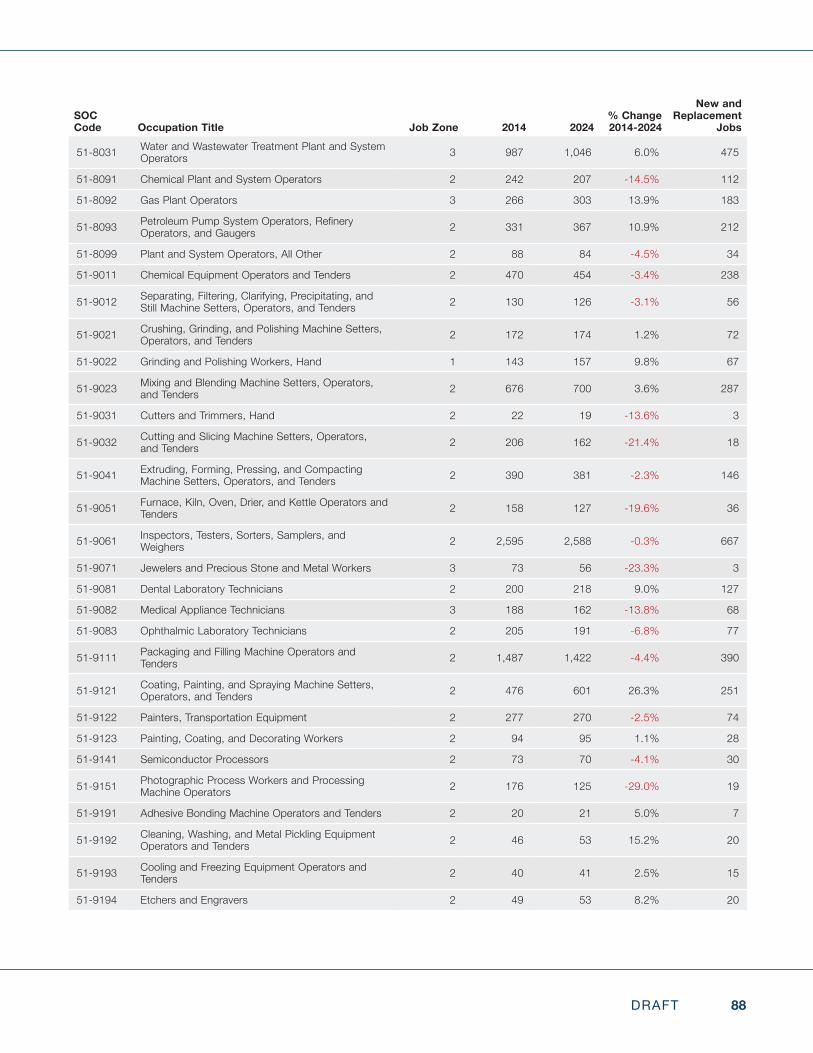
88DRAFT
SOC Code Occupation Title Job Zone 2014 2024
% Change 2014-2024
New and Replacement
Jobs
51-8031 Water and Wastewater Treatment Plant and System Operators 3 987 1,046 6.0% 475
51-8091 Chemical Plant and System Operators 2 242 207 -14.5% 112
51-8092 Gas Plant Operators 3 266 303 13.9% 183
51-8093 PetroleumPumpSystemOperators,RefineryOperators, and Gaugers 2 331 367 10.9% 212
51-8099 Plant and System Operators, All Other 2 88 84 -4.5% 34
51-9011 Chemical Equipment Operators and Tenders 2 470 454 -3.4% 238
51-9012 Separating, Filtering, Clarifying, Precipitating, and Still Machine Setters, Operators, and Tenders 2 130 126 -3.1% 56
51-9021 Crushing, Grinding, and Polishing Machine Setters, Operators, and Tenders 2 172 174 1.2% 72
51-9022 Grinding and Polishing Workers, Hand 1 143 157 9.8% 67
51-9023 Mixing and Blending Machine Setters, Operators, and Tenders 2 676 700 3.6% 287
51-9031 Cutters and Trimmers, Hand 2 22 19 -13.6% 3
51-9032 Cutting and Slicing Machine Setters, Operators, and Tenders 2 206 162 -21.4% 18
51-9041 Extruding, Forming, Pressing, and Compacting Machine Setters, Operators, and Tenders 2 390 381 -2.3% 146
51-9051 Furnace, Kiln, Oven, Drier, and Kettle Operators and Tenders 2 158 127 -19.6% 36
51-9061 Inspectors, Testers, Sorters, Samplers, and Weighers 2 2,595 2,588 -0.3% 667
51-9071 Jewelers and Precious Stone and Metal Workers 3 73 56 -23.3% 3
51-9081 Dental Laboratory Technicians 2 200 218 9.0% 127
51-9082 Medical Appliance Technicians 3 188 162 -13.8% 68
51-9083 Ophthalmic Laboratory Technicians 2 205 191 -6.8% 77
51-9111 Packaging and Filling Machine Operators and Tenders 2 1,487 1,422 -4.4% 390
51-9121 Coating, Painting, and Spraying Machine Setters, Operators, and Tenders 2 476 601 26.3% 251
51-9122 Painters, Transportation Equipment 2 277 270 -2.5% 74
51-9123 Painting, Coating, and Decorating Workers 2 94 95 1.1% 28
51-9141 Semiconductor Processors 2 73 70 -4.1% 30
51-9151 Photographic Process Workers and Processing Machine Operators 2 176 125 -29.0% 19
51-9191 Adhesive Bonding Machine Operators and Tenders 2 20 21 5.0% 7
51-9192 Cleaning, Washing, and Metal Pickling Equipment Operators and Tenders 2 46 53 15.2% 20
51-9193 Cooling and Freezing Equipment Operators and Tenders 2 40 41 2.5% 15
51-9194 Etchers and Engravers 2 49 53 8.2% 20
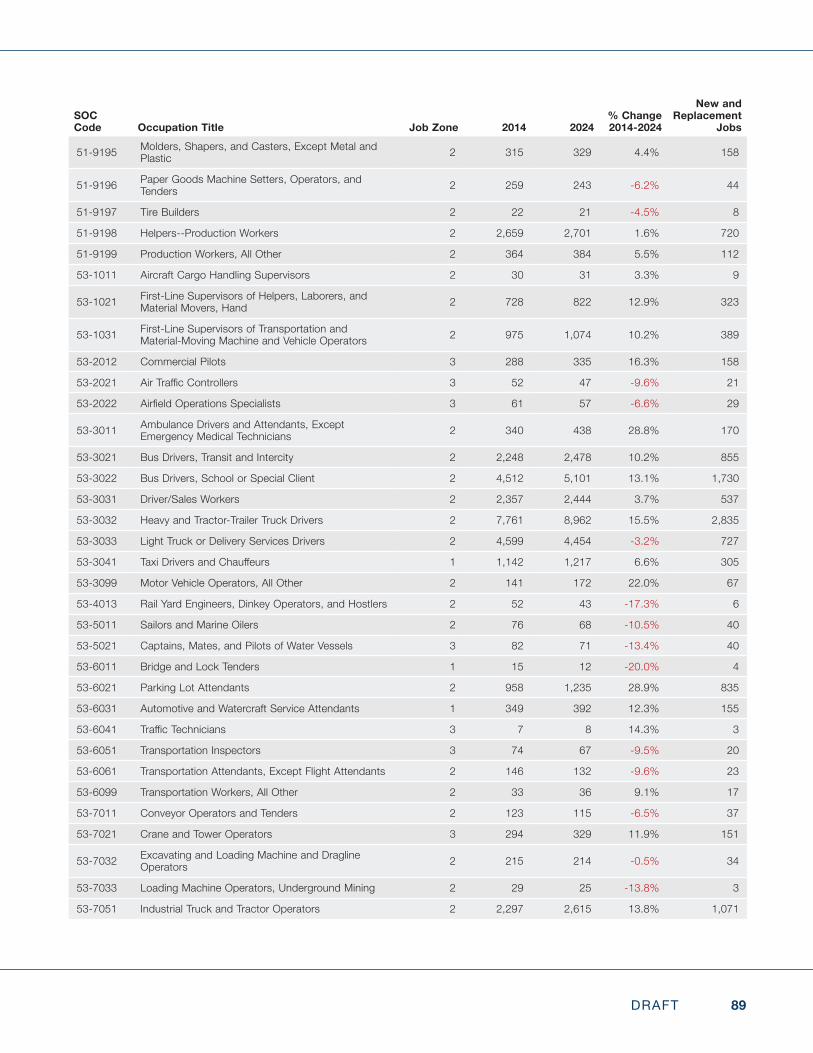
89DRAFT
SOC Code Occupation Title Job Zone 2014 2024
% Change 2014-2024
New and Replacement
Jobs
51-9195 Molders, Shapers, and Casters, Except Metal and Plastic 2 315 329 4.4% 158
51-9196 Paper Goods Machine Setters, Operators, and Tenders 2 259 243 -6.2% 44
51-9197 Tire Builders 2 22 21 -4.5% 8
51-9198 Helpers--Production Workers 2 2,659 2,701 1.6% 720
51-9199 Production Workers, All Other 2 364 384 5.5% 112
53-1011 Aircraft Cargo Handling Supervisors 2 30 31 3.3% 9
53-1021 First-Line Supervisors of Helpers, Laborers, and Material Movers, Hand 2 728 822 12.9% 323
53-1031 First-Line Supervisors of Transportation and Material-Moving Machine and Vehicle Operators 2 975 1,074 10.2% 389
53-2012 Commercial Pilots 3 288 335 16.3% 158
53-2021 AirTrafficControllers 3 52 47 -9.6% 21
53-2022 AirfieldOperationsSpecialists 3 61 57 -6.6% 29
53-3011 Ambulance Drivers and Attendants, Except Emergency Medical Technicians 2 340 438 28.8% 170
53-3021 Bus Drivers, Transit and Intercity 2 2,248 2,478 10.2% 855
53-3022 Bus Drivers, School or Special Client 2 4,512 5,101 13.1% 1,730
53-3031 Driver/Sales Workers 2 2,357 2,444 3.7% 537
53-3032 Heavy and Tractor-Trailer Truck Drivers 2 7,761 8,962 15.5% 2,835
53-3033 Light Truck or Delivery Services Drivers 2 4,599 4,454 -3.2% 727
53-3041 TaxiDriversandChauffeurs 1 1,142 1,217 6.6% 305
53-3099 Motor Vehicle Operators, All Other 2 141 172 22.0% 67
53-4013 Rail Yard Engineers, Dinkey Operators, and Hostlers 2 52 43 -17.3% 6
53-5011 Sailors and Marine Oilers 2 76 68 -10.5% 40
53-5021 Captains, Mates, and Pilots of Water Vessels 3 82 71 -13.4% 40
53-6011 Bridge and Lock Tenders 1 15 12 -20.0% 4
53-6021 Parking Lot Attendants 2 958 1,235 28.9% 835
53-6031 Automotive and Watercraft Service Attendants 1 349 392 12.3% 155
53-6041 TrafficTechnicians 3 7 8 14.3% 3
53-6051 Transportation Inspectors 3 74 67 -9.5% 20
53-6061 Transportation Attendants, Except Flight Attendants 2 146 132 -9.6% 23
53-6099 Transportation Workers, All Other 2 33 36 9.1% 17
53-7011 Conveyor Operators and Tenders 2 123 115 -6.5% 37
53-7021 Crane and Tower Operators 3 294 329 11.9% 151
53-7032 Excavating and Loading Machine and Dragline Operators 2 215 214 -0.5% 34
53-7033 Loading Machine Operators, Underground Mining 2 29 25 -13.8% 3
53-7051 Industrial Truck and Tractor Operators 2 2,297 2,615 13.8% 1,071
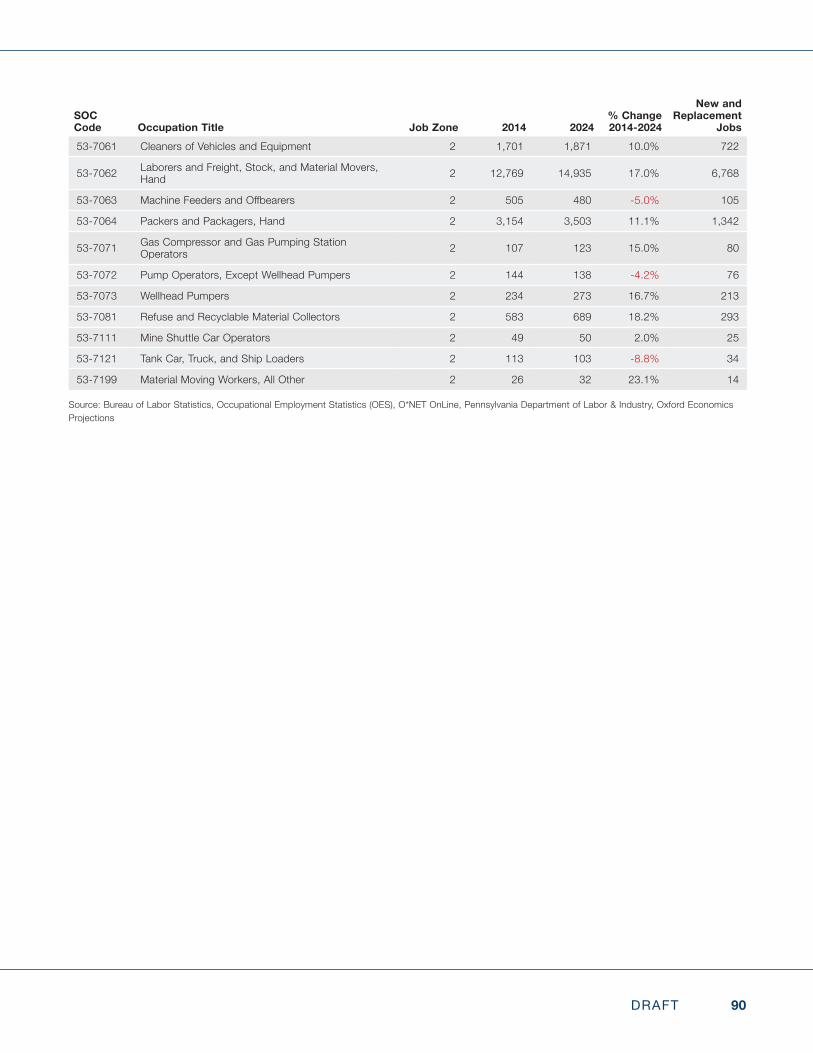
90DRAFT
SOC Code Occupation Title Job Zone 2014 2024
% Change 2014-2024
New and Replacement
Jobs53-7061 Cleaners of Vehicles and Equipment 2 1,701 1,871 10.0% 722
53-7062 Laborers and Freight, Stock, and Material Movers, Hand 2 12,769 14,935 17.0% 6,768
53-7063 MachineFeedersandOffbearers 2 505 480 -5.0% 105
53-7064 Packers and Packagers, Hand 2 3,154 3,503 11.1% 1,342
53-7071 Gas Compressor and Gas Pumping Station Operators 2 107 123 15.0% 80
53-7072 Pump Operators, Except Wellhead Pumpers 2 144 138 -4.2% 76
53-7073 Wellhead Pumpers 2 234 273 16.7% 213
53-7081 Refuse and Recyclable Material Collectors 2 583 689 18.2% 293
53-7111 Mine Shuttle Car Operators 2 49 50 2.0% 25
53-7121 Tank Car, Truck, and Ship Loaders 2 113 103 -8.8% 34
53-7199 Material Moving Workers, All Other 2 26 32 23.1% 14
Source: Bureau of Labor Statistics, Occupational Employment Statistics (OES), O*NET OnLine, Pennsylvania Department of Labor & Industry, Oxford Economics Projections
91DRAFT
ABOUT THE STATE SYSTEM’S GAP ANALYSIS PROJECT
The Workforce Characteristics Report was produced through a multi-organization collaboration that consisted of Pennsylvania’s State System of HigherEducationOfficeoftheChancellor,OxfordEconomicsUSAInc.,andGeorgetown University’s Center on Education and the Workforce. Oxford Economics completed the analysis and research work for this report, under theguidanceofTheStateSystem’sOfficeoftheChancellor,theteamsoughtfeedback and insight from senior administration and representatives from each of the 14 State System Universities. The team also drew on insight and feedback from subject matter experts involved in labor market intelligence and education program alignment.
The modeling and results presented here are based on information provided by third parties, upon which Oxford Economics has relied in producing its report and forecasts in good faith. Any subsequent revision or update of those data willaffecttheassessmentsandprojectionsshown.
OxfordEconomicsisakeyadvisertocorporate,financial,governmentandeducation decision-makers and thought leaders. Oxford Economics’ worldwide client base now comprises over 1000 international organizations, including leadingmultinationalcompaniesandfinancialinstitutions;keygovernmentbodies and trade associations; and top universities, consultancies, and think tanks.
ThisreportisconfidentialtoclientsofPennsylvania’sStateSystemofHigherEducation and may not be published or distributed without their prior written permission. Contact information for such request is provided below:
Dr. Sue Mukherjee Executive Director for Program Alignment and Policy Development Phone: (717) 720-4201 Email: [email protected]