cityzen - meteorologisk institutt · cityzen has thus performed two sensitivity studies...
TRANSCRIPT

CityZen megaCITY - Zoom for the Environment
Collaborative Project
7th Framework Programme for Research and Technological Development Cooperation, Theme 6:
Environment (including Climate Change)
Grant Agreement No.: 212095
Deliverable D2.5.1, type R Report on megacity impact on the distribution of climate parameters
and weather elements, regionally and globally
Due date of deliverable: project month 30
Actual submission date: project month 37
Start date of project: 1 September 2008 Duration: 36 months
Name of lead beneficiary for this deliverable: met.no
Scientist(s) responsible for this deliverable: Michael Gauss
Contribution authors: Øyvind Seland (met.no), Michael Gauss (met.no)
Project co-funded by the European Commission within the Seventh Framework Programme (2007-2013) Dissemination Level
PU Public X PP Restricted to other programme participants (including the Commission Services) RE Restricted to a group specified by the consortium (including the Commission Services) CO Confidential, only for members of the consortium (including the Commission Services)
D2.5.1 FP7 – CityZen Deliverable
Report on megacity impact on the distribution of climate parameters and weather elements, regionally and globally
Interactions between air quality and climate change have been one of the main issues in CityZen, e.g. how will air quality respond to a changing climate and, vice versa, how do megacities and large emission hot spots affect climate? Global climate models have, in general, too coarse a resolution to resolve megacity emissions, which makes it difficult to define megacity areas in these models. CityZen has thus performed two sensitivity studies investigating the couplings involved.
In CityZen there are two models that couple aerosols and climate, the Norwegian Earth System Model (NorESM) and the ECHAM5-HAM model. Both models were asked to assess the effect of aerosol and aerosol-precursor emissions on climate. The first calculation redistributed megacity emissions (‘even distribution’ approach) while the other study removed them completely (‘annihila-tion’ approach). Both approaches are valid to answer the question about megacity impact, but they reflect two different story lines. The first one represents a structural change (e.g. moving popula-tion, industry, etc. out of megacities into less populated areas), and the second one mimics emission reduction measures (in this case realized as a ‘zero emission’ sensitivity study). The ‘even distribu-tion’ approach tends to place emissions in more arid areas where aerosols have a longer lifetime. The change in aerosol optical depth and the resulting temperature change are rather complex, and mostly within natural variability, although the change in the emission pattern is relatively large. The global net effect of the evenly distributed emission in that simulation is a warming, albeit very small. In other words, megacities are cooling. The other study, i.e. the ‘annihilation approach’, ef-fectively removes emissions, implying less aerosols, i.e. a net warming. In other words, megacities would be cooling also according to that experiment. The effect of the annihilation is larger than that of the re-distribution.
The following sections describe the first experiment only, where the NorESM model was applied. The other experiment has been described in detail in Section 3.1 of Deliverable report D2.4.1b.
Deliverable CityZen D2.5.1
3 of 7
1) The Norwegian Earth System Model
NorESM is initially based on CCSM4 from NCAR, including the coupler CPL7 which is the core of the model (J. Hurrel et al., pers. comm., see http://www.ccsm.ucar.edu/models/ccsm4.0/cam/). The ocean component POP2 has been replaced by a MICOM version based on the ocean model in the Bergen Climate Model (Furevik et al., 2003), and includes an interactive module for carbon (HAMOCC_v5; The Hamburg Ocean Carbon Cycle Model, developed by Ernst Maier-Reimer and Christoph Heinze at the Max-Planck-Institut für Meteorologie in Germany).
The land model in NorESM is the original CLM4 of CCSM4, including its own carbon cycle model as well as the SNow, ICe, and Aerosol Radiative (SNICAR) model (Flanner et al, 2007; 2009) which enable calculations of effects on radiation from snow darkening caused by deposited absorb-ing aerosols. Also, effects of deposition of light-absorbing aerosols on the albedo of snow-covered and bare sea-ice are taken into account in the sea-ice model CICE4 (Holland et al., 2011, manu-script in preparation).
Finally, the atmosphere component of CCSM4, CAM4, has been modified and extended to include updated versions of the aerosol and aerosol-cloud interaction schemes which were originally devel-oped for use in the global atmospheric model CAM-Oslo. The most recent published versions of CAM-Oslo so far are based on CAM3, and are described in detail in Seland et al. (2008), Kirkevåg et al. (2008), Storelvmo et al. (2008), Hoose et al. (2009), and Struthers et al. (2011). The extended CAM4 version used in NorESM, CAM4-Oslo, includes a number of updates relative to CAM-Oslo. Papers on the current state of CAM4-Oslo (Kirkevåg et al., 2011) and NorESM are presently in preparation. A short description follows.
CAM-Oslo performs prognostic calculations of the natural primary aerosols sea-salt (SS) and mineral dust (DU), includes a sulphur cycle with gaseous precursors (DMS and SO2) yielding sulphate (SO4), and emissions of black carbon (BC) and particulate organic matter (OM). Although the principles have been developed independently, the aerosol module has many similarities with that of Stier et al., (2005). Beside the direct emissions and sulphur chemistry, particles are affected by sedimentation, wet and dry deposition. A number of the modes in the model are calculated on a process level, without any explicit size assumptions, e.g. in the case of sulphate condensate and coagulated particles. The chemical components and the size modes are the same in the two models, but CAM-Oslo does not solve equations for number concentrations. A 44-bin sectional model is used to construct look-up tables for aerosol optical properties. The bin sectional model is also used for calculating cloud droplet number concentrations (CDNC) although for calculating prognostic CDNC a log normal approximation is used for the CDNC production term. Hence, both the direct climate effects as well as the first and second indirect effects are included.
2) Experimental setup and results.
A sensitivity experiment was performed with the global Norwegian Earth System Model (NorESM) to study the effects of an even distribution of fossil fuel emissions, as opposed to an un-even distribution with heavily urbanized emission hot spots.
The model was run on 1.9x2.5 degrees horizontal resolution and 26 vertical layers. The model was initialized from the end of the model year 1988 in a 20th century simulation and was run until 2049 using a combination of historic data and the RCP8.5 scenario for greenhouse gas concen-trations and aerosol emissions from fossil fuel and biomass burning provided by CMIP5. In addi-
D2.5.1 FP7 – CityZen Deliverable
tion, as described in section 1 there are emissions of sea-salt, mineral dust, DMS, SO2 from contin-uous volcanic eruptions and organic aerosols from biota.
All land-based fossil fuel emissions of OM, BC and SO2 between the equator and 60°N ex-cept North Africa and the Arabian Peninsula south of 30°N were distributed equally over all land-areas within the defined region.
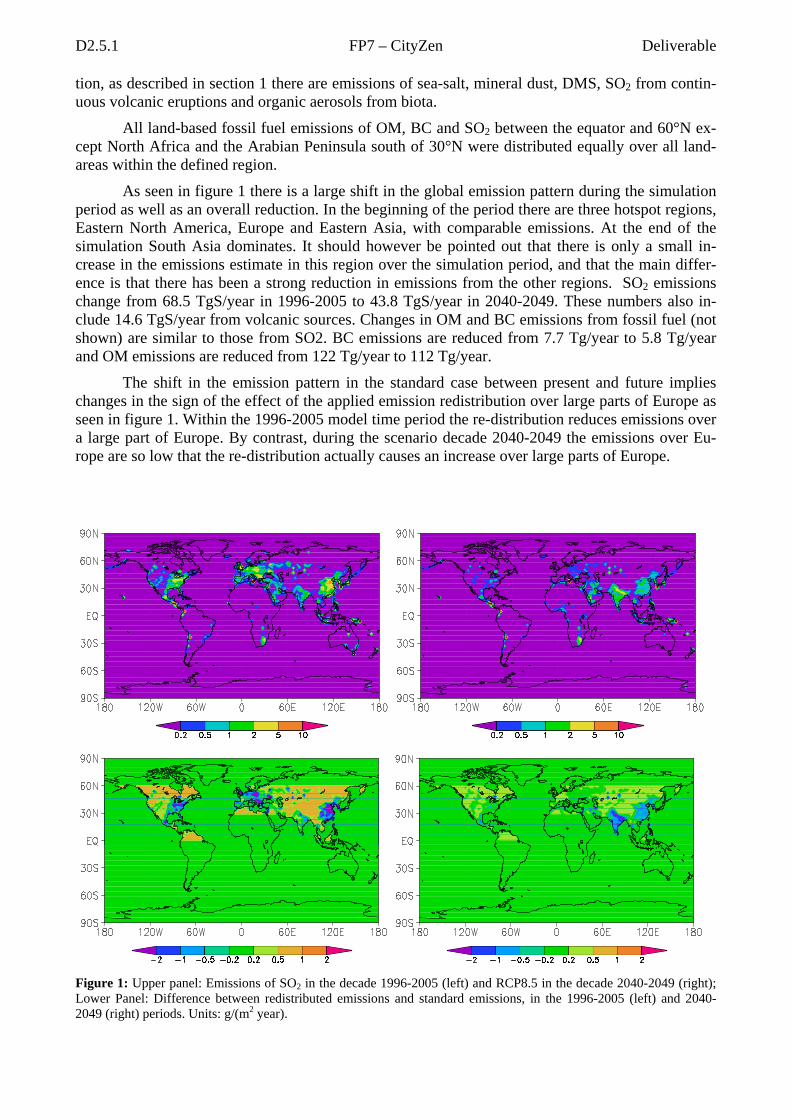
As seen in figure 1 there is a large shift in the global emission pattern during the simulation period as well as an overall reduction. In the beginning of the period there are three hotspot regions, Eastern North America, Europe and Eastern Asia, with comparable emissions. At the end of the simulation South Asia dominates. It should however be pointed out that there is only a small in-crease in the emissions estimate in this region over the simulation period, and that the main differ-ence is that there has been a strong reduction in emissions from the other regions. SO2 emissions change from 68.5 TgS/year in 1996-2005 to 43.8 TgS/year in 2040-2049. These numbers also in-clude 14.6 TgS/year from volcanic sources. Changes in OM and BC emissions from fossil fuel (not shown) are similar to those from SO2. BC emissions are reduced from 7.7 Tg/year to 5.8 Tg/year and OM emissions are reduced from 122 Tg/year to 112 Tg/year.
The shift in the emission pattern in the standard case between present and future implies changes in the sign of the effect of the applied emission redistribution over large parts of Europe as seen in figure 1. Within the 1996-2005 model time period the re-distribution reduces emissions over a large part of Europe. By contrast, during the scenario decade 2040-2049 the emissions over Eu-rope are so low that the re-distribution actually causes an increase over large parts of Europe.
Figure 1: Upper panel: Emissions of SO2 in the decade 1996-2005 (left) and RCP8.5 in the decade 2040-2049 (right); Lower Panel: Difference between redistributed emissions and standard emissions, in the 1996-2005 (left) and 2040-2049 (right) periods. Units: g/(m2 year).
Deliverable CityZen D2.5.1
5 of 7
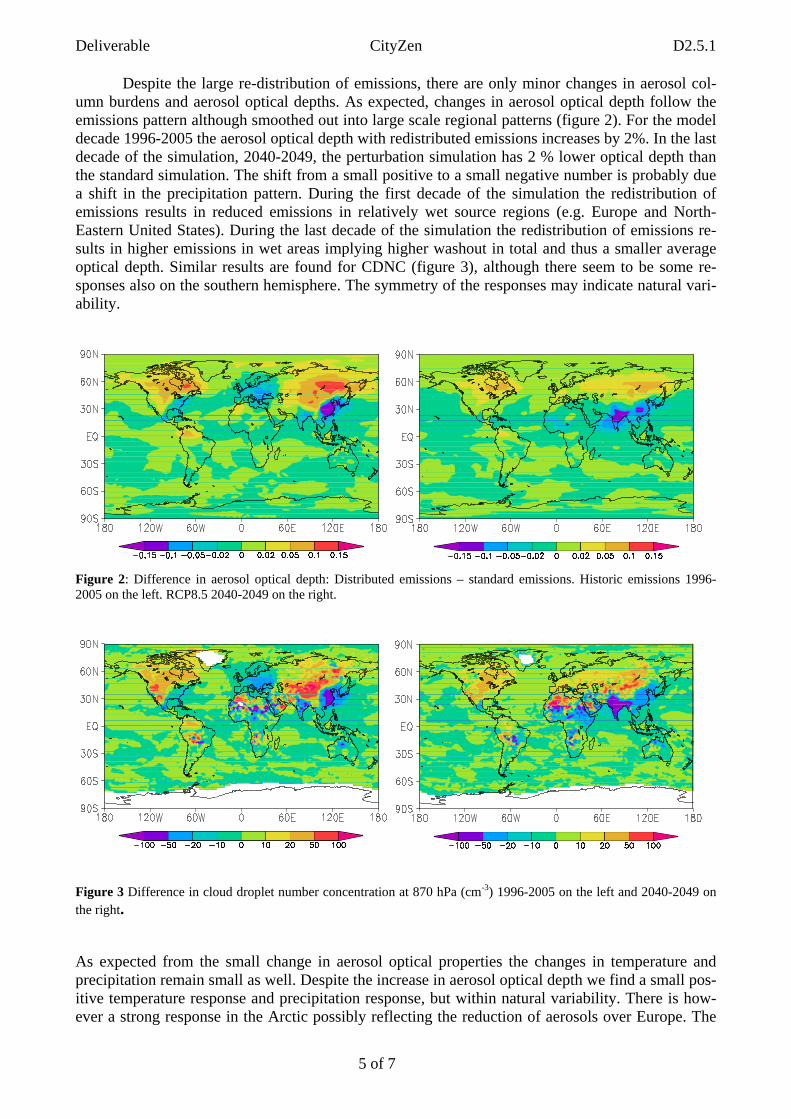
Despite the large re-distribution of emissions, there are only minor changes in aerosol col-umn burdens and aerosol optical depths. As expected, changes in aerosol optical depth follow the emissions pattern although smoothed out into large scale regional patterns (figure 2). For the model decade 1996-2005 the aerosol optical depth with redistributed emissions increases by 2%. In the last decade of the simulation, 2040-2049, the perturbation simulation has 2 % lower optical depth than the standard simulation. The shift from a small positive to a small negative number is probably due a shift in the precipitation pattern. During the first decade of the simulation the redistribution of emissions results in reduced emissions in relatively wet source regions (e.g. Europe and North-Eastern United States). During the last decade of the simulation the redistribution of emissions re-sults in higher emissions in wet areas implying higher washout in total and thus a smaller average optical depth. Similar results are found for CDNC (figure 3), although there seem to be some re-sponses also on the southern hemisphere. The symmetry of the responses may indicate natural vari-ability.
Figure 2: Difference in aerosol optical depth: Distributed emissions – standard emissions. Historic emissions 1996-2005 on the left. RCP8.5 2040-2049 on the right.
Figure 3 Difference in cloud droplet number concentration at 870 hPa (cm-3) 1996-2005 on the left and 2040-2049 on the right. As expected from the small change in aerosol optical properties the changes in temperature and precipitation remain small as well. Despite the increase in aerosol optical depth we find a small pos-itive temperature response and precipitation response, but within natural variability. There is how-ever a strong response in the Arctic possibly reflecting the reduction of aerosols over Europe. The
D2.5.1 FP7 – CityZen Deliverable
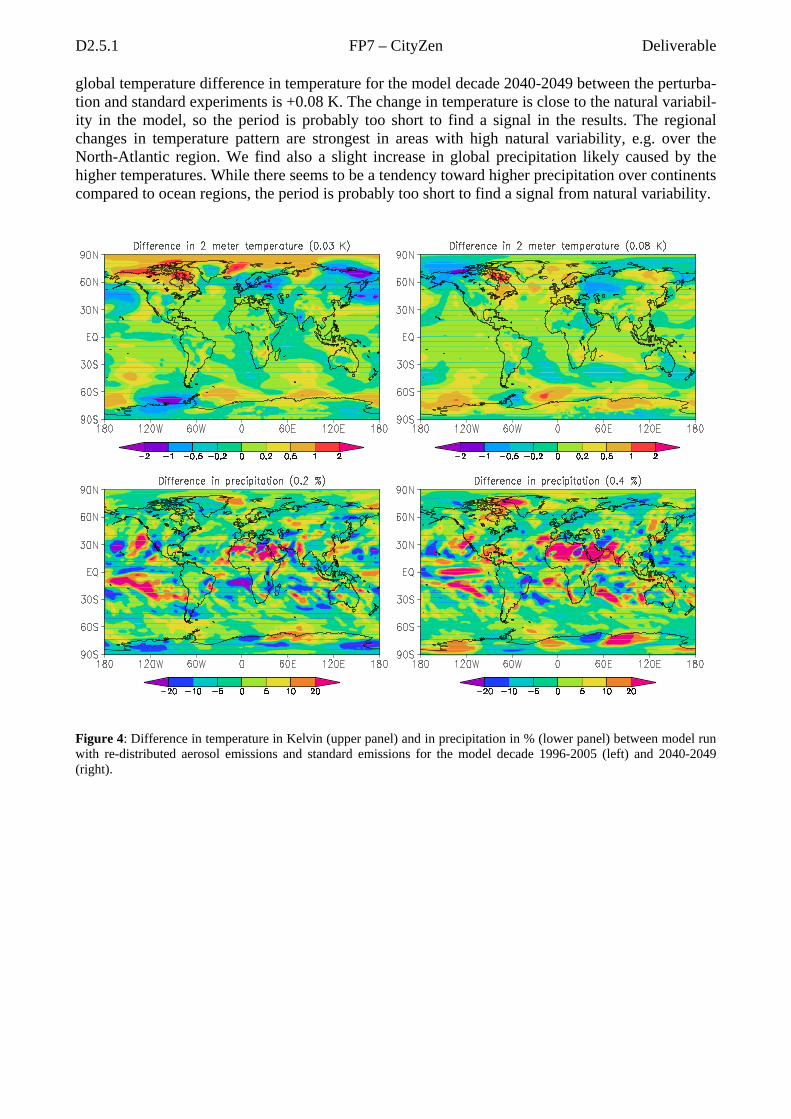
global temperature difference in temperature for the model decade 2040-2049 between the perturba-tion and standard experiments is +0.08 K. The change in temperature is close to the natural variabil-ity in the model, so the period is probably too short to find a signal in the results. The regional changes in temperature pattern are strongest in areas with high natural variability, e.g. over the North-Atlantic region. We find also a slight increase in global precipitation likely caused by the higher temperatures. While there seems to be a tendency toward higher precipitation over continents compared to ocean regions, the period is probably too short to find a signal from natural variability.
Figure 4: Difference in temperature in Kelvin (upper panel) and in precipitation in % (lower panel) between model run with re-distributed aerosol emissions and standard emissions for the model decade 1996-2005 (left) and 2040-2049 (right).
Deliverable CityZen D2.5.1
7 of 7
3) References
Berntsen, T., and I. S. A. Isaksen, 1997: A global 3-D chemical transport model for the troposphere, 1, Model description and CO and Ozone results, J. Geophys. Res., 102(D17), 21239-21280, doi:10.1029/97JD01140.
Flanner, M. G., C. S. Zender, J. T. Randerson, and P. J. Rasch (2007), Present day climate forcing and response from black carbon in snow, J. Geophys. Res., 112, D11202, doi:10.1029/2006JD008003.
Flanner, M. G., C. S. Zender, P. G. Hess, N. M. Mahowald, T. H. Painter, V. Ramanathan, and P. J. Rasch (2009), Springtime warming and reduced snow cover from carbonaceous particles, Atmos. Chem. Phys., 9, 2481-2497.
Furevik, T, Bentsen, M., Drange, H., Kindem, I.K.T., Kvamstø, N.G., and Sorteberg, A., 2003: De-scription and evaluation of the bergen climate model: ARPEGE coupled with MICOM. Climate Dynamics, 21, 27–51. DOI 10.1007/s00382-003-0317-5.
Holland, M. M., D. A. Bailey, B. P. Briegleb, B. Light, and E. Hunke, 2011, Improved Sea Ice Shortwave Radiation Physics in CCSM4: The Impact of Melt Ponds and Black Carbon. J. of Cli-mate (submitted).
Hoose, C., J. E. Kristjansson, T. Iversen, A. Kirkevåg, Ø. Seland, and A. Gettelman, 2009: Con-straining cloud droplet number concentration in GCMs suppresses the aerosol indirect ef-fect.Geophys. Res. Lett., 36, L12807, doi:10.1029/2009GL038568.
Kirkevåg, A., T. Iversen, Ø. Seland, J.B Debernard,, T. Storelvmo, and J.E. Kristjánsson, 2008: Aerosol-cloud-climate interactions in the climate model CAM-Oslo. Tellus, 60A, 492-512.
Kirkevåg A , Iversen T. , Seland Ø., Struthers H. , Hoose C. and Nilsson D., Aerosols and their ra-diative effects on climate in CAM4-Oslo/NorESM. The importance of natural aerosols for esti-mates of anthropogenic impacts, manuscript in preparation. Seland, Ø., T. Iversen, A. Kirkevåg, and T. Storelvmo, 2008: Aerosol-climate interactions in the CAM-Oslo atmospheroc GCM and investigations of associated shortcomings. Tellus, 60A, 459-491.
Storelvmo, T., J. E. Kristjansson, U. Lohmann, T. Iversen, A. Kirkevåg, Ø.Seland, 2008: Modeling the Wegener-Bergeron-Findeisen process – implications for aerosol indirect effects. Environ. Res. Lett. 3. 045001. DOI:10.1088/1748-9326/3/4/045001.
Struthers, H., A. M. L. Ekman, P. Glantz, T. Iversen, A. Kirkevåg, E. M. Mårtensson, Ø. Seland, and E. D. Nilsson, 2011: The effect of sea ice loss on sea salt aerosol concentrations and the radia-tive balance of the Arctic. Atmos. Chem. Phys., 11, 3459-3477.