city report toronto final 2014
TRANSCRIPT
T O R O N T O
2014City Report:
© Decode Inc. 2014 www.youthfulcities.com [email protected] Facebook: Youthful Cities @youthfulcities

02
Youth (15-29 yrs.) are at the centre of urbanization. They add energy, vibrancy, creativity
and digital age talent to cities. Youth build a city’s competitive edge, stimulate development
and find new solutions. They are the future of cities... now. But which cities are taking
advantage of this positive economic, social and political potential? Which cities will get
ahead?
YouthfulCities has worked with thousands of youth in 25 mega cities across the five
major global regions to build a way to measure and map cities from a youth perspective.
With more than 100 different indicators and 2500 points of data we are building an
unparalleled base of knowledge about cities and youth. This ranking sets up a unique urban
competition between the world’s great cities. YouthfulCities also amplifies the voice and
creativity of youth to build better, smarter, greener, more prosperous, ingenious, respectful,
playful, more dynamic cities.
Experience behind YouthfulCities - Decode founding partner www.decode.net
Since 1994, Decode has worked with global corporations and NGOs to create ideas and initiatives built by youth that
truly engage youth. Now with the founding of YouthfulCities, Decode, its global partners and a network of dedicated young
social entrepreneurs in the biggest cities in the world are creating better cities with youth in the drivers seat.
And that’s just the start. Next year we will rank 100 cities
More than 50% of the world’s population is under 30
More than 50% of the world’s
population lives in cities.
ShATOk
JbG
kiN
CA
iS T
LAG
LONPA R
bRL
ROM
MuM MNA
LA
TORNYCChi
DAL
NAi
SeO
MXC
bOG
LiM SP
bA
03
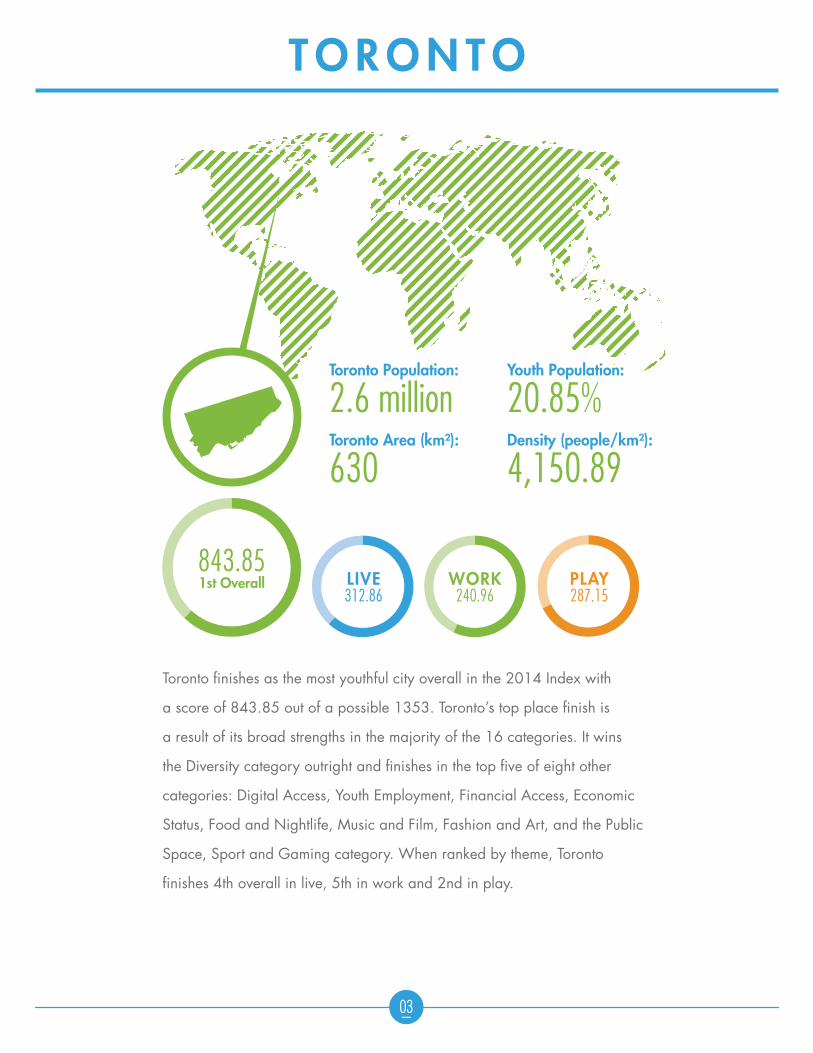
Toronto finishes as the most youthful city overall in the 2014 Index with
a score of 843.85 out of a possible 1353. Toronto’s top place finish is
a result of its broad strengths in the majority of the 16 categories. It wins
the Diversity category outright and finishes in the top five of eight other
categories: Digital Access, Youth Employment, Financial Access, Economic
Status, Food and Nightlife, Music and Film, Fashion and Art, and the Public
Space, Sport and Gaming category. When ranked by theme, Toronto
finishes 4th overall in live, 5th in work and 2nd in play.
Toronto Population:
2.6 millionToronto Area (km²):
630
Youth Population:
20.85%Density (people/km²):
4,150.89
T O R O N T O
Live312.86
wORk240.96
PLAY287.15
843.851st Overall
04
Overview
Toronto has a reputation for being one of the world’s most multicultural cities,
a reality that is confirmed as it tops the diversity category. Here it wins the
Number of Voting Languages indicator outright, with 26 languages to vote in,
scoring 40% higher than Chicago, the 2nd place city. Another strength exists
in Toronto’s 3rd overall finish in the economic status category. Torontonians
find themselves among the highest minimum wage earners, earning an
average $10.20 per hour and finishing in 4th place. Elsewhere, Toronto’s
strong performance in the public space, sport and gaming category comes
as a result of its 4th place finish in per capita number of public libraries, with
98, and its 5th place finish in per capita number of municipally maintained
recreation facilities, with 596. According to Bruce Wayne Yip, Toronto
entrepreneur and sport and gaming enthusiast, “Toronto boasts hundreds
of sports clubs for youth outside of school and work. With Toronto’s ever-
changing weather, new amateur sports leagues/clubs begin each quarter,
and for top-tier athletes, Toronto has some of the most renowned coaches in
the world for track and field, swimming, martial arts and hockey.” Toronto has
over 60 sports leagues and clubs, which include some very unique sports such
as dodgeball, hang gliding, and underwater hockey.
Despite its wealth of assets, the Index also reveals that Toronto’s challenges
lie largely in the areas of civic participation, where it finishes with a relatively
low number of youth engaged formally with city council (36), and safety and
mental health, where it finishes 18th overall and has the 3rd highest number
of suicides per capita, at 598. This last liability brings to light a serious issue
faced by youth in Toronto, and reflects the possibility that young people in
the city find themselves without the necessary supports when working through
mental health distress.
Despite these liabilities, Toronto’s broad strengths in the majority of areas
researched indicates that it is a city that benefits immensely from its diversity
and remains a place that can both actively attract mobile youth as well as
secure its current youth population.
T O R O N T O
Recommendations
As mentioned, Toronto shows weakness in both the safety and mental health as
well as the civic participation categories. Each of these exist as opportunities
for relationships between government and society to be better fostered, in order
to initiate and/or maximize the potential for projects serving these important
public interests.
The high number of suicides in the city reflects a need for crisis intervention
measures and processes that ensure individuals can access support when it
is needed. While Toronto boasts Canada’s largest mental health facility - the
Centre for Addiction and Mental Health - it houses a modest 12 beds for youth
in crisis, which could bear an increase. Crisis intervention also comes from
organizations like Distress Centre, which handled over 133,000 calls in 2012.
While encouraging, the statistics show that the city nonetheless has the 3rd
highest suicide rate per capita. This suggests that more programs like Distress
Centre are needed, and overall that a more coordinated service delivery model
for youth in mental health crisis might be necessary.
Regarding Toronto’s weakness in the civic participation category, as mentioned,
one key reason for this is the relatively small number of youth engaged formally
with city council. There are at present a maximum of 36 youth involved at
any given time. At certain times this is lower. One recommendation would be
to increase this to a full-time 44 youth at minimum, which would line up with
the number of wards in the city. Having one youth per ward would be key to
enabling the system to more promptly assess and provide for the varied needs
of youth in the city. This would in turn nurture a larger youth population that will
emerge from youth council better suited to flourish in civic and political life.
05
T O R O N T O
Toronto finishes 1st in Diversity
“It’s exciting to find out that Toronto is not only a multicultural city, but one that
values the voice and political participation of its hugely varied ethno-lingual
groups. Toronto is a city that makes space for any individual regardless of
age, gender, sexual orientation, or language, which is in part reflected by
the fact that the city has the highest number of languages to vote in, when
measured against the remaining 24 cities on the YouthfulCities Global Index.”
- Gabriella Penev
key Comments
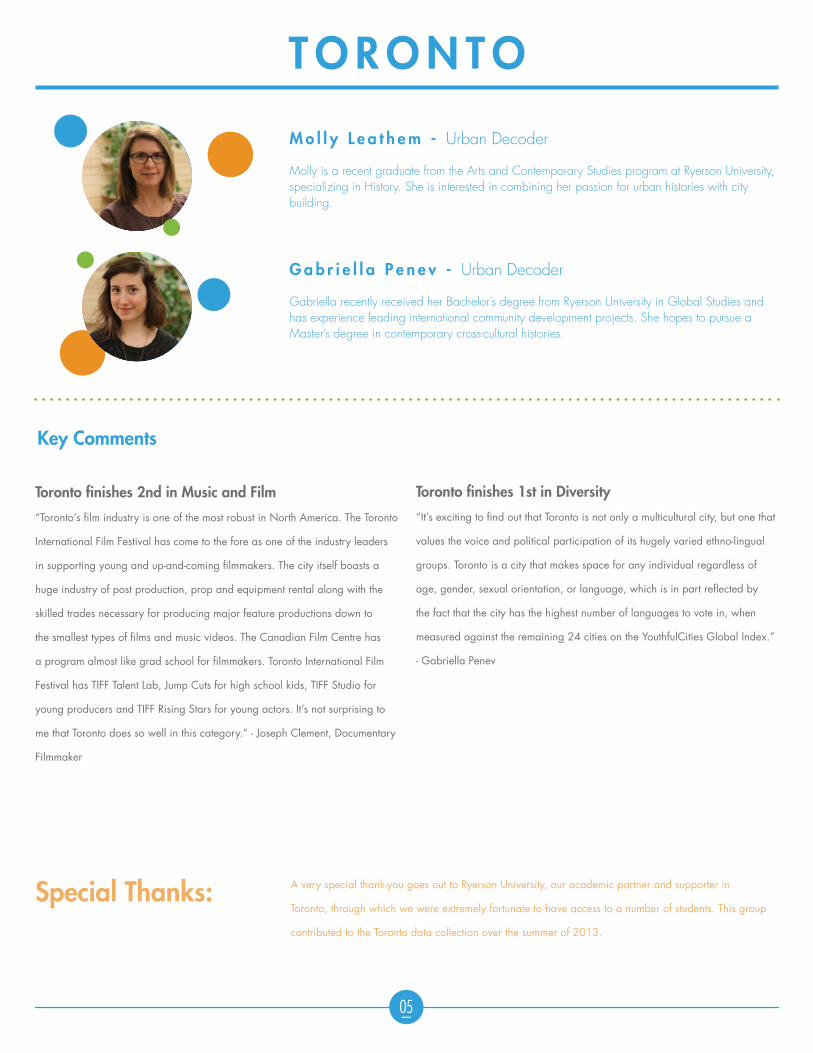
M o l l y L e a t h e m - Urban Decoder Molly is a recent graduate from the Arts and Contemporary Studies program at Ryerson University, specializing in History. She is interested in combining her passion for urban histories with city building.
G a b r i e l l a P e n e v - Urban Decoder Gabriella recently received her Bachelor’s degree from Ryerson University in Global Studies and has experience leading international community development projects. She hopes to pursue a Master’s degree in contemporary cross-cultural histories.
Toronto finishes 2nd in Music and Film
“Toronto’s film industry is one of the most robust in North America. The Toronto
International Film Festival has come to the fore as one of the industry leaders
in supporting young and up-and-coming filmmakers. The city itself boasts a
huge industry of post production, prop and equipment rental along with the
skilled trades necessary for producing major feature productions down to
the smallest types of films and music videos. The Canadian Film Centre has
a program almost like grad school for filmmakers. Toronto International Film
Festival has TIFF Talent Lab, Jump Cuts for high school kids, TIFF Studio for
young producers and TIFF Rising Stars for young actors. It’s not surprising to
me that Toronto does so well in this category.” - Joseph Clement, Documentary
Filmmaker
A very special thank-you goes out to Ryerson University, our academic partner and supporter in
Toronto, through which we were extremely fortunate to have access to a number of students. This group
contributed to the Toronto data collection over the summer of 2013.
Special Thanks:
06
The 2014 YouthfulCities Index ranks the performance of 25 of the world’s most
populous cities from a youth perspective. It evaluates how youth LIVE, WORK
and PLAY in their urban settings, in order to determine how cities are serving
their youth, and discover how youth can be better integrated and engaged in
their cities. YouthfulCities provides municipalities, businesses and individuals
the chance to asses how they can better support young people in their cities
and engages youth to take initiative in joining with these partners to create
exceptional urban communities.
Between January and November 2013, youth analysts collected and evaluated
data on 80 indicators across 16 categories and 3 themes. There are two types
of indicators that were “normalized” across the cities: those that measure the
cost of an item and those that measure the per capita number of an item.
M e T h O D O L O G Y
Thirteen indicators reflect the cost of a given item. The data for these
indicators was normalized and compared by expressing it relative to one hour
of minimum wage labour in the given city. For example, if a movie ticket cost
$15 and minimum wage was $10, then 1.5 would be the city’s score in this
indicator. All local currencies were normalized to US dollars. Where cost data
is referred to below, the costs expressed are the amount of a given item in US
dollars, before being expressed as a unit of minimum wage.
Fourteen of the indicators are evaluated per capita. Where per capita data is
referred to below, the numbers are expressed as absolutes, taken before per
capita calculations. Expressing the results of these insights, this year’s Index
largely reflects information current for 2012.

07
L iveCiviC PARTiCiPATiONPercentage of population 15-29 years oldVoting ageVolunteer opportunitiesPolitical influence
DiveRSiTYLanguages to vote inDiversity of foodOpenness to LGBTOpenness to immigrantsOpenness to religion
iNTeRNAL TRANSPORTKilometers of public transportationHours per week dedicated transit operatesBike rentalsKilometers of bike paths, per capitaDriving ageCommuter time by carCommuter time by transitCommuter time by footWalkabilityTransit cost monthly
DiGiTAL ACCeSSExtent of WIFI free at universitiesExtent of WIFI free in public transitExtent of WIFI free in librariesExtent of WIFI free in public squaresExtent of WIFI free in cafesCost per minute prepaid cell service, no planMobile phone infrastructureCost per hour of internet access in web cafe
eNviRONMeNTAL SuSTAiNAbiLiTYWater scaleQuantity of recycled waste, per capitaCarbon emissions, per capitaNumber of types of recycled materialsTotal cars, per capita
SAFeTY & MeNTAL heALThHomicides, per capitaSuicides, per capita
WoRkeDuCATiON ACCeSSPost-secondary institutions, per capitaTuition fees
YOuTh eMPLOYMeNTYouth unemployment rateYouth employment centersStudent debt
eNTRePReNeuRShiPAge to register a businessEarly stage entrepreneurial activityEntrepreneurship incubators
FiNANCiAL ACCeSSAge to open a business bank accountNumber of chartered banksAge for personal banking availabilityFinancial literacy
eCONOMiC STATuSMinimum wageAnnual incomeHousingStudent housingGINI coefficientConsumption tax
PLAyFOOD & NiGhTLiFeNumber of nightclubs, per capitaNumber of restaurants, per capitaCost of fast food mealCost of 12 large eggs
MuSiC & FiLMFilm festivals, per capitaNumber of cinema seats per capitaCost of movie ticketMusic festivalsCost of music concert
FAShiON & ARTGraffiti and street artIs there a youth fashion showcaseIs there a fashion incubatorNumber of design schools, per capita
ReGiONAL & GLObAL CONNeCTiviTYNumber of cities connected by direct flightsGetaway city train costGetaway city train distanceGetaway city train frequencyGetaway city bus costGetaway city bus distanceGetaway city bus frequencyGetaway city plane costGetaway city plane distanceGetaway city plane frequencyCost of hostel stay
PubLiC SPACe, SPORT AND GAMiNGMunicipally operated green space, per capitaNumber public libraries, per capitaMunicipally maintained recreation facilities, per capitaGatherings of gamers
C AT e G O R Y i N D i C AT O R S
TOR
NYC
Chi
DAL
LA
MXC
LiM
bOG
SP
bA
TOk
SeO
MNA
MuM
ShA
LON
bRL
ROM
PAR
iST
CAi
NAi
JbG
kiN
LAG
NORTh AMeRiCA
Toronto, Canada
New York City, USA
Chicago, USA
Dallas, USA
Los Angeles, USA
LATiN AMeRiCA
Mexico City, Mexico
Lima, Peru
bogota, Colombia
Sao Paulo, Brazil
buenos Aires, Argentina
ASiA
Tokyo, Japan
Seoul, korea
Manila, Philippines
Mumbai, india
Shanghai, China
euROPe
London, Uk
berlin, Germany
Rome, italy
Paris, France
istanbul, Turkey
AFRiCA
Cairo, egypt
Nairobi, kenya
Johannesburg, South Africa
kinshasa, DRC
Lagos, Nigeria
Geographic Regions
08
0 5 10 15 20 25 30 35 40 45 50 55 60 65 70 75 80 85 90 95 100
TOR27.11
LA30.81
DAL31.46
Chi33.57
NYC40.80
SP45.32
LiM46.06
MXC62.23
0 5 10 15 20 25 30 35 40 45 50 55 60 65 70 75 80 85 90 95 100
DA L51.46
LA51.86
NY C54.48
Ch i66.00 LO N
77.25
TO R78.32
0 5 10 15 20 25 30 35 40 45 50 55 60 65 70 75 80 85 90 95 100
bRL73.46
PAR72.39
bA62.77
NYC60.71
Chi59.98TOR
53.06
DAL52.96LA
48.63
0 5 10 15 20 25 30 35 40 45 50 55 60 65 70 75 80 85 90 95 100
PAR93.57
LON85.79
TOk74.32
TOR71.88
LA68.61
Chi67.39
DAL65.86
NYC65.57
0 5 10 15 20 25 30 35 40 45 50 55 60 65 70 75 80 85 90 95 100
Se O71.86MN A
67.30
bA65.66
NY C61.21
TO R53.79
LA42.30
Ch i36.77
DA L32.04
0 5 10 15 20 25 30 35 40 45 50 55 60 65 70 75 80 85 90 95 100
LiM94.58
kiN94.57
LAG94.36
NYC85.16
TOR73.54
DAL64.78Chi
60.32
LA59.69
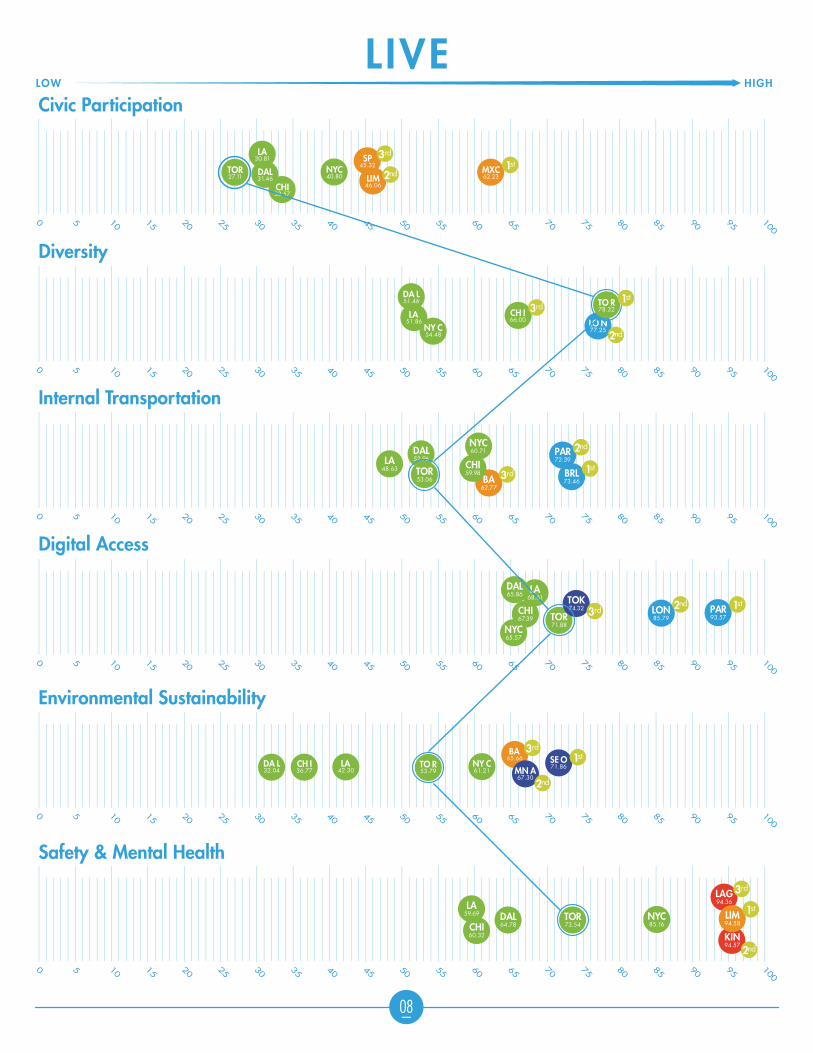
L ive hiGhLOw
Civic Participation
Diversity
internal Transportation
Digital Access
environmental Sustainability
Safety & Mental health
3rd
1st2nd
3rd1st
2nd
3rd 1st
2nd
3rd 1st2nd
3rd1st
2nd
3rd
1st
2nd
09
0 5 10 15 20 25 30 35 40 45 50 55 60 65 70 75 80 85 90 95 100
MXC93.93
MuM82.26
bRL76.89
DAL71.22
TOR59.95
Chi51.96
LA51.42
NYC50.13
0 5 10 15 20 25 30 35 40 45 50 55 60 65 70 75 80 85 90 95 100
bR L73.80
NY C73.16
CA i72.02
TO R64.35
LA58.42
Ch i56.52
DA L50.61
0 5 10 15 20 25 30 35 40 45 50 55 60 65 70 75 80 85 90 95 100
LA54.33
DA L47.56
NY C39.32Ch i
32.33
TO R30.39
0 5 10 15 20 25 30 35 40 45 50 55 60 65 70 75 80 85 90 95 100
MuM58.78
NYC53.57
LON40.45
TOR36.95
Chi36.15
LA22.83
DAL22.71
0 5 10 15 20 25 30 35 40 45 50 55 60 65 70 75 80 85 90 95 100
NYC74.98 LA
79.06
Chi79.37
DAL80.10
TOR81.03
bRL82.28
TOk92.30
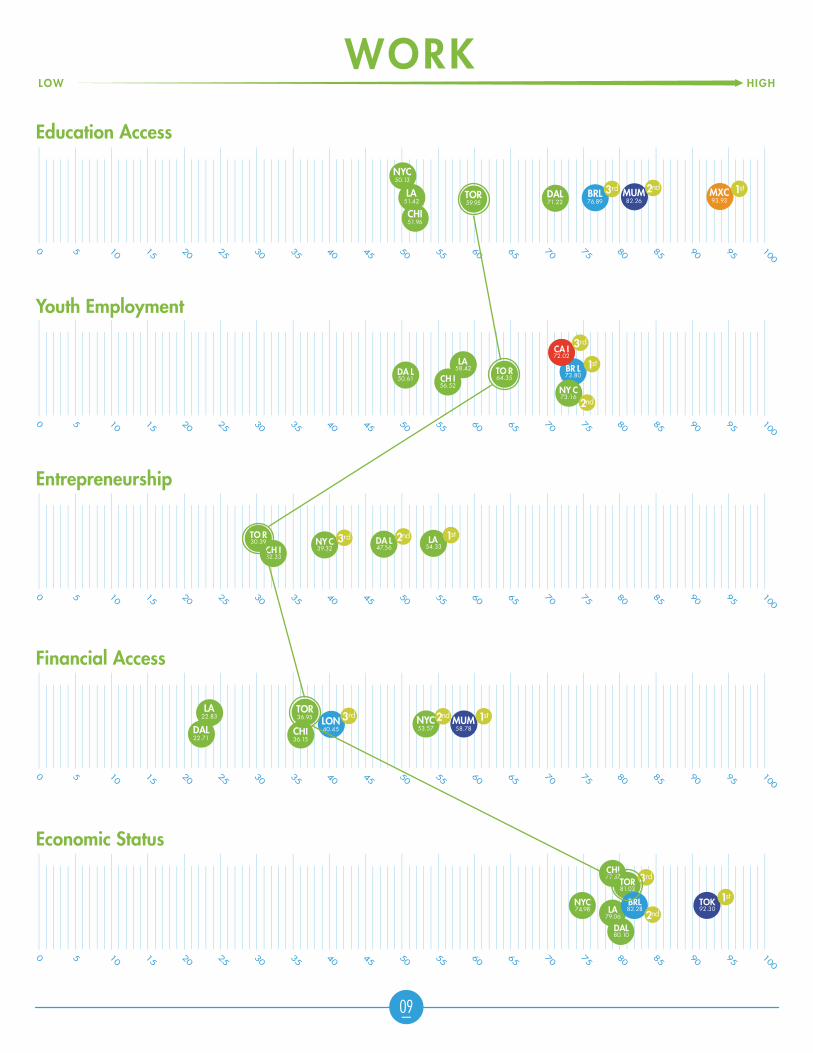
wORk hiGhLOw
Youth employment
education Access
entrepreneurship
Financial Access
economic Status
3rd 1st2nd
3rd
1st
2nd
3rd 1st2nd
3rd
1st
2nd
3rd 1st2nd
10
0 5 10 15 20 25 30 35 40 45 50 55 60 65 70 75 80 85 90 95 100
NYC56.26
TOR61.01 LA
65.54
DAL65.79
Chi67.02
SeO69.92
0 5 10 15 20 25 30 35 40 45 50 55 60 65 70 75 80 85 90 95 100
bRL80.34
TOR67.68
Chi66.20
LA65.32
DAL63.96NYC
57.14
0 5 10 15 20 25 30 35 40 45 50 55 60 65 70 75 80 85 90 95 100
Chi59.85
LA66.85
DAL68.97
NYC82.07 TOR
96.89
JbG98.56
PAR100.00
0 5 10 15 20 25 30 35 40 45 50 55 60 65 70 75 80 85 90 95 100
DAL76.31
NYC74.90
SeO70.68
TOR64.17
LA63.96
Chi62.15
0 5 10 15 20 25 30 35 40 45 50 55 60 65 70 75 80 85 90 95 100
DAL56.93
Chi55.44
TOR54.29
LA39.49
NYC35.58
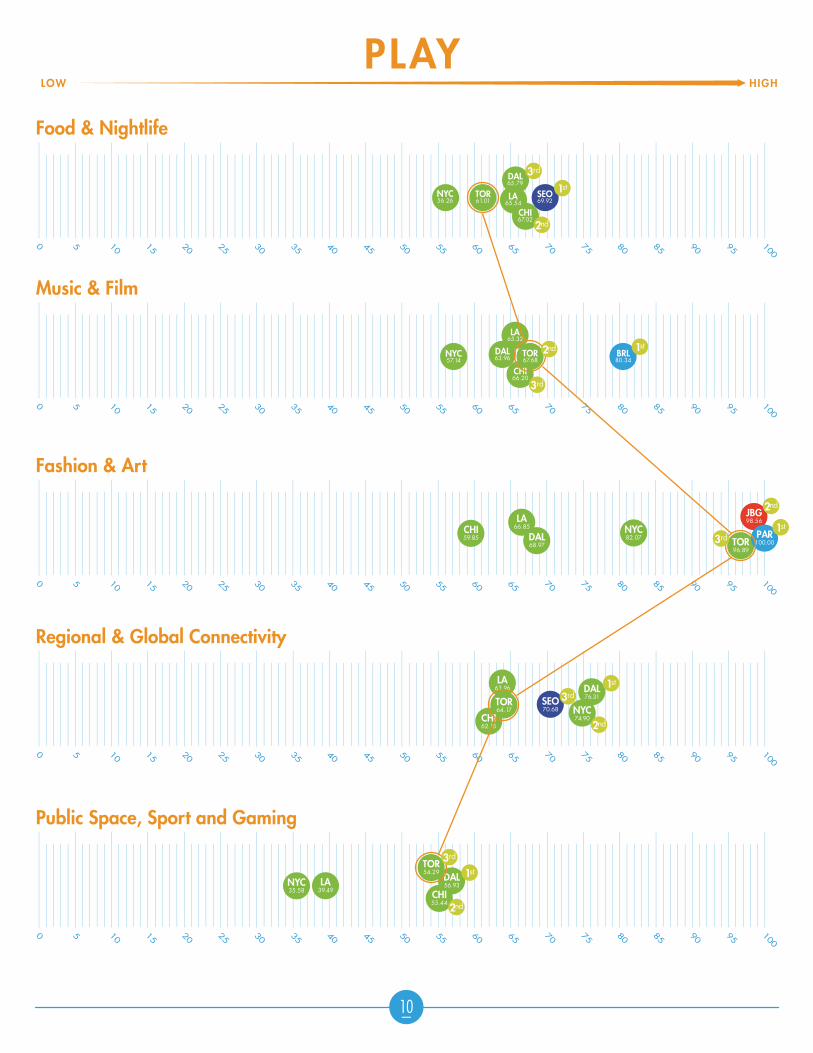
PLAY hiGhLOw
Food & Nightlife
Music & Film
Fashion & Art
Regional & Global Connectivity
Public Space, Sport and Gaming
1st
3rd
1st
2nd
3rd
1st2nd
3rd
2nd
3rd
1st
2nd
3rd1st
2nd
11
The 2014 YouthfulCities Index is an ambitious collaborative effort to analyze 25 cities around the world from a unique youth perspective. Our venture aims to add another 75 cities over the next year, in order to bring the total number of cities ranked to 100 for the second iteration of our Index.
Want to join the global effort to create better cities built by youth?Add Your City to the global initiative to rank the world’s top cities from a youth
perspective.
here’s how it works:
Our innovative City Package will build unprecedented knowledge about
Your City, helping to move local urban development in a groundbreaking
new direction. We employ unique and innovative measures to calculate and
harness the real potential of today’s youth. By combining our passion for
seeking out ever-changing urban youth perspectives with a hybrid approach
to gathering information, creating insights and fueling youth-oriented local
ventures, the YouthfulCities City Package will transform Your City into a
dynamic and engaging hub for youth to live, work, and play.
Our strategy involves four interconnected steps to bridge the gap between
youth and Your City. We initiate the process by:
• Sourcing and developing a local candidate to act as Your City’s Urban Decoder
• Launching a locally customized Urban Youth Survey
• Developing a city specific YouthfulCities INDEX
• Establishing the 30Network to harness the creativity and expertise of leading young professionals in Your City.
From building a diverse network of young leaders, to creating a comparable
city database, the City Package will connect you to the global network of
youthful cities and give you the edge to attract and retain youth to make Your
City better.
Click here for more details about how to get your city involved.
Get your city involved in the next Youthfulcities index