city of clinton, mississippi comprehensive … of clinton, mississippi comprehensive annual...
TRANSCRIPT
CITY OF CLINTON, MISSISSIPPI
COMPREHENSIVE ANNUAL FINANCIAL REPORT
YEAR ENDED SEPTEMBER 30, 2014
ANNUAL YEAR ENDED SEPTEMBER 30, 2014
INTRODUCTORY SECTION Letter of Transmittal List of Principal Officials Organizational Chart
TABLE
Certificate of Achievement for Excellence in Financial Reporting
FINANCIAL SECTION INDEPENDENT AUDITORS' REPORT
CONTENTS
REQUIRED SUPPLEMENTARY INFORMATION Management's Discussion and Analysis
BASIC FINANCIAL STATEMENTS
Government-Wide Financial Statements: Statement of Net Position Statement of Activities
Fund Financial Statements: Balance Sheet - Governmental Funds Statement of Revenues, Expenditures and Changes
in Fund Balance - Governmental Funds Statement of Net Position - Proprietary Funds Statement of Revenues, Expenses and Changes
in Net Position - Proprietary Funds Statement of Cash Flows - Proprietary Funds Statement Fiduciary Net Position Statement of Changes in Fiduciary
i-iv v vi
vii
1-3
4-12
13-14 15-16
17-18
19-20 21-"24
25-27 28-30
31
COMPREHENSIVE ANNUAL FINANCIAL YEAR ENDED SEPTEMBER 30, 2014
TABLE OF CONTENTS - CONTINUED
OTHER SUPPLEMENTARY INFORMATION
Combining Statements: Combining Balance Sheet - Nonmajor Governmental Funds Combining Statement of Revenues, Expenditures and
Changes in Fund Balance - Nonmajor Governmental Funds Combining Balance Sheet - Nonmajor Special Revenue Funds Combining Statement of Revenues, Expenditures and
Changes in Fund Balance - Nonmajor Special Revenue Funds Combining Balance Sheet - Nonmajor Debt Service Funds Combining Statement of Revenues, Expenditures and
Changes in Fund Balance - Nonmajor Debt Service Funds Combining Balance Sheet - Nonmajor Capital Projects Funds Combining Statement of Revenues, Expenditures and
Changes in Fund Balance - Nonmajor Capital Projects Funds
Budgetary Comparison Schedules: Tourism Tax Fund Special Law Enforcement Fund G.O. Series 2013 Bond and Interest Fund Infrastructure Bond and Interest Fund G.O. Refunding Bonds 2013 Bond and Interest Fund Quisenberry Library Bond and Interest Fund Tax Increment Financing Bond and Interest Fund - United Artists Tax Increment Financing Bond and Interest Fund - Walmart Tax Increment Financing Bond and Interest Fund - Parkway Center Tax Increment Financing Bond and Interest Fund - Prugon Hampstead Boulevard Construction Project Fund
Drive Construction Project Fund Construction 1.Jrrr.• 0 ""'1'
PAGE
78
79-80 81
82-83 84
85-86 87
88
89 90 91 92 93 94 95 96 97 98 99
100 1 1
COMPREHENSIVE ANNUAL FINANCIAL YEAR ENDED SEPTEMBER 30, 2014
TABLE CONTENTS - CONTINUED
OTHER SUPPLEMENTARY INFORMATION - Continued
Other Schedules: Schedule of Surety Bonds for Municipal Officials and Other Employees
Schedule of Expenditures of Federal Awards
STATISTICAL SECTION
Introduction Net Position by Component Changes in Net Position Fund Balances, Governmental Funds Changes in Fund Balances, Governmental Funds Assessed Value and Estimated Actual Value of
Taxable Property Direct and Overlapping Property Tax Rates Principal Property Tax Payers Property Tax Levies and Collections Ratios of Outstanding Debt by Type Ratio of General Bonded Debt Outstanding Direct and Overlapping Governmental Activities Debt
Legal Debt Margin Information Pledged-Revenue Coverage Demographic and Economic Statistics Principal Employers Full-Time Equivalent City Government
Employees by Function/Program Operating Indicators by
Statistics
PAGE
103 104-105
106 107
108-109 110 111
112 113 114 115 116 117
118 119 120 121 122
123 124 1
COMPREHENSIVE ANNUAL NANCIAL YEAR ENDED SEPTEMBER 30, 2014
OF CONTENTS - CONTINUED
INDEPENDENT AUDITORS' REPORTS ON INTERNAL CONTROL AND COMPLIANCE
Independent Auditors' Report on Internal Control over Financial Reporting and on Compliance and Other Matters Based on an Audit of Financial Statements Performed in Accordance with Government Auditing Standards
Independent Auditors' Report on Compliance for Each Major Program and on Internal Control over Compliance Required by OMB Circular A-133
Independent Auditors' Report on Compliance with State Laws and Regulations
Schedule of Findings and Questioned Costs Summary Schedule of Prior Audit Findings
126-127
128-129
130 131 132
INTRODUCTORY SECTION
Phil Fisher, Mayor
ALDERMEN David Ellis Ward One
Jim Martin Ward Two
William O. Barnett Ward Three
Greg IC Cronin Ward Four
Jan Cossitt Ward Five
Mike Cashkm Ward Six
Jehu Brabham Alderman-At-Large
Russell L, Wall City Clerk
March 18, 2015
The Honorable Mayor, Honorable Members of the Board of Aldermen, and Citizens of the City of Clinton
We are pleased to submit the Comprehensive Annual Financial Report (CAFR) of the City of Clinton for the fiscal year ended September 30, 2014. State law requires that all governments publish within thirty days of completion of an audit each fiscal year a complete set of financial statements presented in conformity with generally accepted accounting principles (GAAP) and audited in accordance with generally accepted auditing standards by a firm of licensed certified public accountants.
We maintain that this financial report to the best of our knowledge and belief is complete and reliable in all material respects. This report consists of management's representations concerning the finances of the City of Clinton. Consequently, management assumes full responsibility for the completeness and reliability of all of the information presented in this report. To provide a reasonable basis for making these representations, management of the City of Clinton has established a comprehensive internal control framework that is designed both to protect the government's assets from loss, theft, or misuse and to compile sufficient reliable information for the preparation of the City of Clinton's financial statements in conformity with GAAP. Because the cost of internal controls should not outweigh their benefits, the City of Clinton's comprehensive framework of internal controls has been designed to provide reasonable rather than absolute assurance that the financial statements will be free from material misstatement.
Tann, Brown & Russ Co., PLLC, a firm of licensed certified public accountants, has audited the City of Clinton's financial statements. The goal of the independent audit was to provide reasonable assurance that the financial statements of the City for the fiscal year ended September 30, 2014 are free of material misstatement. The independent auditor concluded based upon the audit, that there was a reasonable basis for rendering an unqualified opinion that the City's financial statements for the fiscal year ended September 30, 2014 are fairly presented in conformity with GAAP. The auditor's report is presented as the first item of the Financial Section of this report.
In addition to the independent audit of the financial statements, a federally mandated 11Single Audit" designed to meet the special needs of federal granter agencies is required. The standards governing Single Audit engagements require the independent auditor to report not only on the fair presentation statements, but on the audited government's internal controls and rru'Y'lnll'!'.J!r'lf"O
,.,..,,,.""'°'.-.'!re- with on controls ~H~:'lll~V'\IO Jn
City of Clinton, incorporated in 1830, is located in east-central section of Hinds The City is located 8 miles west of Jackson, the capitol city of the state. The City currently occupies 40 square miles and serves a population of approximately 25,305.
The City operates as a code charter municipality. Policy-making and legislature authority are vested in the governing body consisting of the mayor and seven aldermen. The governing body is responsible for, among other things, passing ordinances, adopting the budget, appointing committees, and appointing and hiring the government's officers and attorney. Municipal government is comprised of the mayor, who is elected at large, and a board of seven aldermen, six of whom are elected by ward and one of whom is elected at large. The mayor and aldermen serve four-year terms.
The City of Clinton provides a comprehensive range of municipal services to its citizens including public safety, street maintenance, water, sewer, and sanitation services, recreational activities, cultural events and general administration. These services are provided in the context of the broad policy initiatives as determined by the elected officials of the City.
The annual budget serves as the foundation for the city1s financial planning and control. All funds of the City are required to submit requests for appropriation to the City1s Chief Financial Officer (CFO) on or before August 1 each year. These requests are used by the CFO as the beginning point for the development of a preliminary budget. The CFO then presents the preliminary budget to the Mayor for further review and the preparation of a proposed budget for review by the Board of Aldermen prior to September 1. The Board is required to hold a public hearing on the proposed budget and to adopt a final budget on or before September 15. Budget-to-actual comparisons are provided in this report for each individual governmental fund for which an appropriated annual budget has been adopted. For the General Fund, this comparison is presented on pages 74 through 76. For all other governmental funds 1 this comparison is presented on pages 89 through 102.
The City has a tradition of providing quality education to children of its citizens and others seeking quality education. Mississippi College, a private college established in 1826, is the oldest college in Mississippi and the second oldest Baptist College in the United States. Mississippi College offers its 4,921 students' with more than 80 areas of study. 16 graduate degree programs, a doctor of jurisprudence degree1 a doctor of education leadership degree, and a doctor of professional counseling degree. Clinton's children are educated by the Clinton Public School District (CPSD), which educates approximately 4,860 students with 320 licensed teachers through its seven public schools (four elementary schools, two middle schools and one high school). CPSD had an annual budget of $43.2 million for 2015. Additional quality education is provided by Mt. Salus Christian School and Clinton Christian Academy, both private schools, which offer grades K-12.
Condition
ii
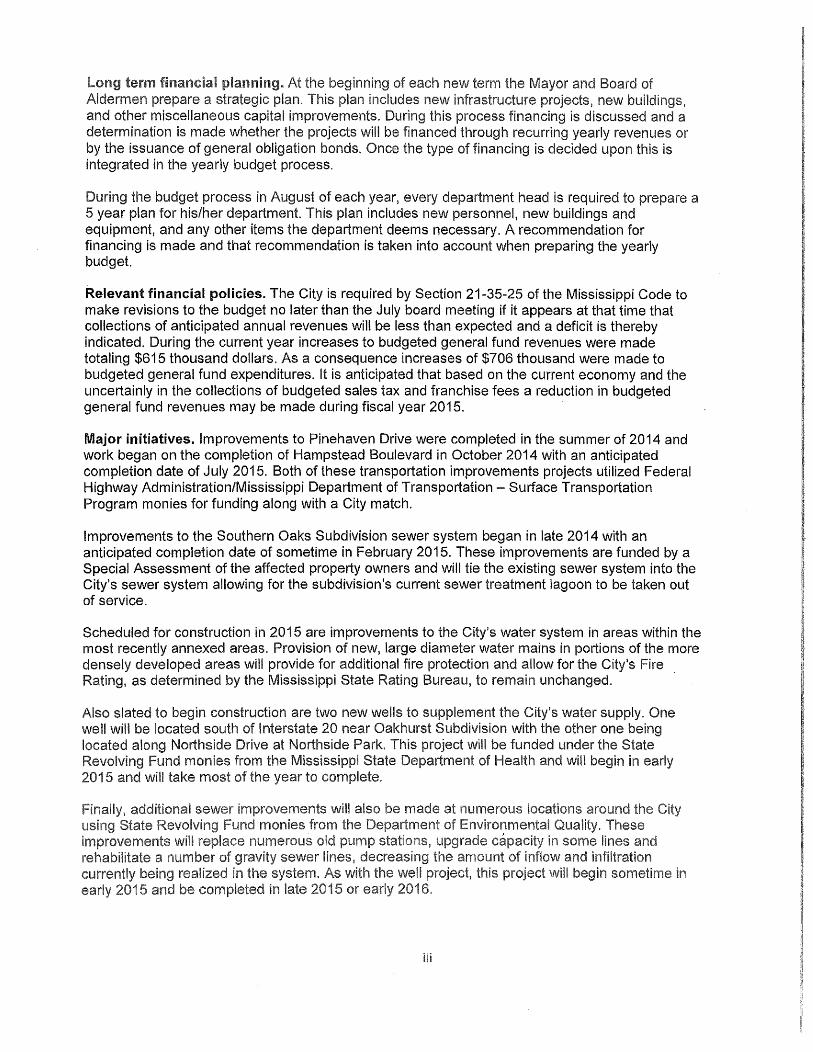
tan·!3 1t1u·"•~1 planning. the beginning of of Aldermen prepare a strategic plan. plan includes new projects, new buildings, and other miscellaneous capital improvements. During this process financing is discussed and a determination is made whether the projects will be financed through recurring yearly revenues or by the issuance of general obligation bonds. Once the type of financing is decided upon this is integrated in the yearly budget process.
During the budget process in August of each year, every department head is required to prepare a 5 year plan for his/her department. This plan includes new personnel, new buildings and equipment, and any other items the department deems necessary. A recommendation for financing is made and that recommendation is taken into account when preparing the yearly budget.
Relevant financial policies. The City is required by Section 21-35-25 of the Mississippi Code to make revisions to the budget no later than the July board meeting if it appears at that time that collections of anticipated annual revenues will be less than expected and a deficit is thereby indicated. During the current year increases to budgeted general fund revenues were made totaling $615 thousand dollars. As a consequence increases of $706 thousand were made to budgeted general fund expenditures. It is anticipated that based on the current economy and the uncertainly in the collections of budgeted sales tax and franchise fees a reduction in budgeted general fund revenues may be made during fiscal year 2015.
Major initiatives. Improvements to Pinehaven Drive were completed in the summer of 2014 and work began on the completion of Hampstead Boulevard in October 2014 with an anticipated completion date of July 2015. Both of these transportation improvements projects utilized Federal Highway Administration/Mississippi Department of Transportation - Surface Transportation Program monies for funding along with a City match.
Improvements to the Southern Oaks Subdivision sewer system began in late 2014 with an anticipated completion date of sometime in February 2015. These improvements are funded by a Special Assessment of the affected property owners and will tie the existing sewer system into the City's sewer system allowing for the subdivision's current sewer treatment lagoon to be taken out of service.
Scheduled for construction in 2015 are improvements to the City's water system in areas within the most recently annexed areas. Provision of new, large diameter water mains in portions of the more densely developed areas will provide for additional fire protection and allow for the City's Fire Rating, as determined by the Mississippi State Rating Bureau, to remain unchanged.
Also slated to begin construction are two new wells to supplement the City's water supply. One well will be located south of Interstate 20 near Oakhurst Subdivision with the other one being located along Northside Drive at Northside Park. This project will be funded under the State Revolving Fund monies from the Mississippi State Department of Health and will begin in
5 will most the to ,... ..... lf' ...... ""10.,.0
States and Canada awarded a Excellence in Reporting to the City of Clinton for its comprehensive annual financial report for the fiscal year ended September 30, 2013. This was the tenth consecutive year that the government has achieved this prestigious award. In order to be awarded a Certificate of Achievement, a government must publish an easily readable and efficiently organized comprehensive annual financial report. This report must satisfy both generally accepted accounting principles and applicable legal requirements.
A Certificate of Achievement is valid for a period of one year only. We believe that our current comprehensive annual financial report continues to meet the Certificate of Achievement Program's requirements and we are submitting it to the GFOA to determine its eligibility for another certificate.
The preparation of this report would not have been possible without the efficient and dedicated services of the staff of the finance and administrative departments. We would like to express our appreciation of these departments, as well as other departmental personnel who participated in the development of information contained herein. In addition, credit must be given to the Mayor and Board of Aldermen for their unfailing support for maintaining the highest standards of professionalism in the management of the city's financial resources.
Respectfully submitted,
Russell L. Wall, CMCC, CPA City Clerk and Chief Financial Officer
iv
I !
II ~
I I &
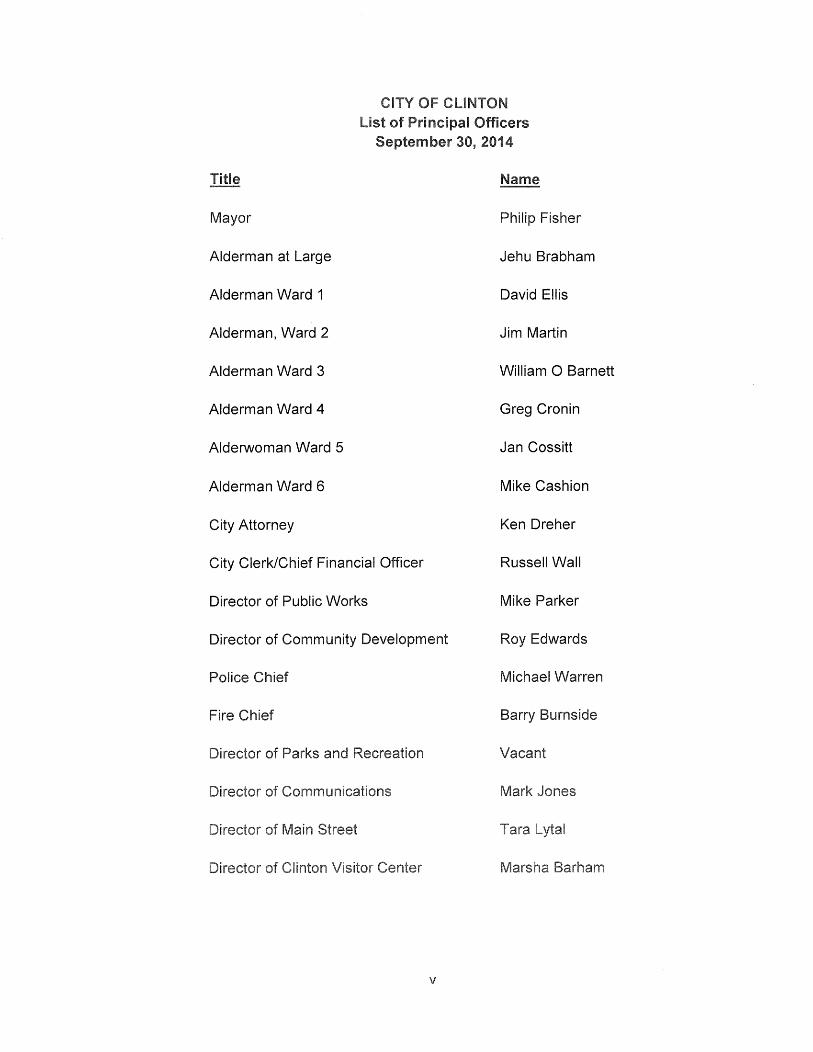
list of Principal Officers September 30, 2014
Mayor Philip Fisher
Alderman at Large Jehu Brabham
Alderman Ward 1 David Ellis
Alderman, Ward 2 Jim Martin
Alderman Ward 3 William 0 Barnett
Alderman Ward 4 Greg Cronin
Alderwoman Ward 5 Jan Cossitt
Alderman Ward 6 Mike Cashion
City Attorney Ken Dreher
City Clerk/Chief Financial Officer Russell Wall
Director of Public Works Mike Parker
Director of Community Development Roy Edwards
Police Chief Michael Warren
Fire Chief Barry Burnside
Recreation
v
Department of Public Works
Police Department
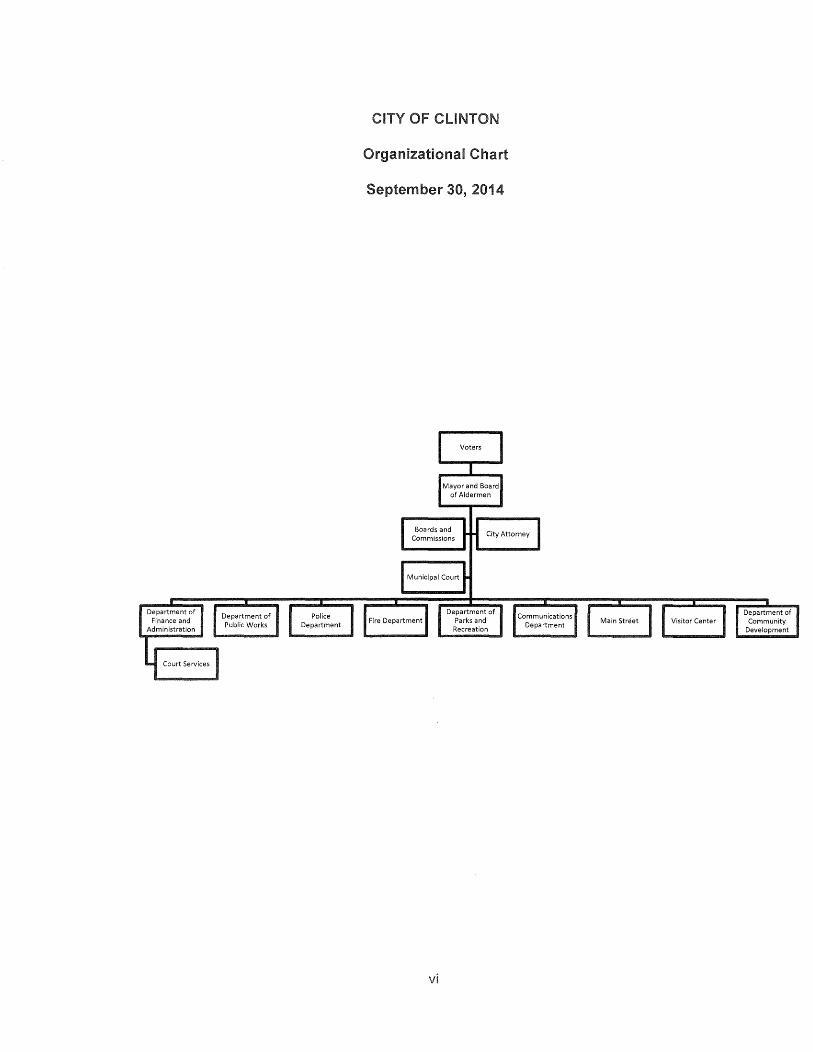
Orga.niza.tiona.I Cha.rt
September 30, 2014
Voters
Mayor and Board of Aldermen
Boards and Commissions
Fire Department
vi
Department of Parks and Recreation
Communications Department
Main Street Visitor Center Department of
Community Development
Government Finance Officers Association
Certificate of Achievement for Excellence
in Financial Reporting
Presented to
City of Clinton
Mississippi
For its Comprehensive Annual Financial Report
the Fiscal Year Ended

FINANCIAL SECTION
MEMBERS
AMERICAN INSTITUTE
CERTIFIED i"UIBl..!C ACCOUNTANTS
TELEPHONE (SCH 354=4926
FA.CSnMH .. E (601 354=494"1
INDEPENDENT AUDITORS' REPORT
The Honorable Mayor and Board of Aldermen City of Clinton Clinton, Mississippi
Report on the Financial Statements
MEMBERS
MISlf31SSilPPI SOCIETY 011"' CERTil"'iEO
PiJBL.IC: ACCOUNTANTS
We have audited the accompanying financial statements of the governmental activities, the business-type activities, each major fund, and the aggregate remaining fund information of the City of Clinton, Mississippi, as of and for the year ended September 30, 2014, and the related notes to the financial statements, which collectively comprise the City of Clinton's basic financial statements as listed in the table of contents.
Management's Responsibility for the Financial Statements
Management is responsible for the preparation and fair presentation of these financial statements in accordance with accounting principles generally accepted in the United States of America; this includes the design, implementation, and maintenance of internal control relevant to the preparation and fair presentation of financial statements that are free from material misstatement, whether due to fraud or error.
Auditors' Responsibility
Our responsibility is to express opinions on these financial statements based on our audit. We conducted our audit in accordance with auditing standards generally accepted in the United States America standards applicable to financial audits contained in Government Auditing Standards, issued Comptroller States. standards
to
-1
audit obtain about disclosures in the financial statements. The procedures selected depend on the auditors' judgment, including the assessment of the risks of material misstatement of the financial statements, whether due to fraud or error. In making those risk assessments, the auditor considers internal control relevant to the entity's preparation and fair presentation of the financial statements in order to design audit procedures that are appropriate in the circumstances, but not for the purpose of expressing an opinion on the effectiveness of the entity's internal control. Accordingly, we express no such opinion. An audit also includes evaluating the appropriateness of accounting policies used and the reasonableness of significant accounting estimates made by management, as well as evaluating the overall presentation of the financial statements.
We believe that the audit evidence we have obtained is sufficient and appropriate to provide a basis for our audit opinions.
Opinions
In our opinion, the financial statements referred to above present fairly, in all material respects, the respective financial position of the governmental activities, the business-type activities, each major fund, and the aggregate remaining fund information of the City of Clinton, Mississippi, as of September 30, 2014, and the respective changes in financial position, and, where applicable, cash flows thereof for the year then ended in accordance with accounting principles generally accepted in the United States of America.
Other Matters
Required Supplementary Information
Accounting principles generally accepted in the United States of America require that the Management's Discussion and Analysis and Budgetary Comparison Schedule - General Fund on pages 4 through 12 and 74 through 77 be presented to supplement the basic financial statements. Such information, although not a part of the basic financial statements, is required by the Governmental Accounting Standards Board, who considers it to be an essential part of financial reporting for placing the basic financial statements in an appropriate operational, economic, or historical context. We have applied certain limited procedures to the required supplementary information in accordance with auditing standards generally accepted in the United States of America, which consisted of inquiries of management about the methods of preparing the information and comparing the information for consistency with management's responses to our inquiries, the basic financial statements, and other knowledge we obtained during our audit of the basic financial statements. We do not express an opinion or provide any
...... +."''"""'"' ...... +.,.... .... because the limited not us or assurance.
Our audit was conducted for the purpose of forming opinions on the financial statements that collectively comprise the City of Clinton's basic financial statements. The introductory section, combining statements, budgetary comparison schedules, other schedules, and statistical section are presented for purposes of additional analysis and are not a required part of the basic financial statements. The schedule of expenditures of federal awards is presented for purposes of additional analysis as required by U.S. Office of Management and Budget Circular A-133, Audits of States, Local Governments, and Non-Profit Organizations, and is also not a required part of the basic financial statements.
The combining statements, budgetary comparison schedules, other schedules, and the schedule of expenditures of federal awards are the responsibility of management and were derived from and relate directly to the underlying accounting and other records used to prepare the basic financial statements. Such information has been subjected to the auditing procedures applied in the audit of the basic financial statements and certain additional procedures, including comparing and reconciling such information directly to the underlying accounting and other records used to prepare the basic financial statements or to the basic financial statements themselves, and other additional procedures in accordance with auditing standards generally accepted in the United States of America. In our opinion, the combining statements, budgetary comparison schedules, other schedules, and the schedule of expenditures of federal awards are fairly stated in all material respects in relation to the basic financial statements as a whole.
The introductory and statistical sections have not been subjected to the auditing procedures applied in the audit of the basic financial statements and, accordingly, we do not express an opinion or provide any assurance on them.
Other Reporting Required by Government Auditing Standards
In accordance with Government Auditing Standards, we have also issued our report dated March 18, 2015 on our consideration of City of Clinton's internal control over financial reporting and on our tests of its compliance with certain provisions of laws, regulations, contracts, and grant agreements and other matters. The purpose of that report is to describe the scope of our testing of internal control over financial reporting and compliance and the results of that testing, and not to provide an opinion on internal control over financial reporting or on compliance. That report is an integral part of an audit performed in accordance with Government Auditing Standards in considering the City of Clinton's internal control over financial reporting and compliance.
18, 5
MANAGEMENT'S DISCUSSION AND ANALYSIS
Our discussion and analysis of The City of Clinton's (the City) financial performance provides an overview of the City's financial activities for the fiscal year ended September 30, 2014. Please read it in conjunction with the City's financial statements that begin on page 13.
USING THIS ANNUAL REPORT
This annual report consists of a series of financial statements. The Statement of Net Position and the Statement of Activities (on pages 13 through 16) provide information about the activities of the City as a whole and present a longer-term view of the City's finances. Fund financial statements start on page 17 and tell how these services were financed in the short term as well as what remains for future spending. Fund financial statements also report the City's operations in more detail than the government-wide statement by providing information about the City's most significant funds. Fiduciary fund statements provide financial information about activities for which the City acts solely as a trustee or agent for the benefit of those outside the government.
Reporting the City as a Whole The Statement of Net Position and the Statement of Activities
Our analysis of the total City begins on page 6. One of the most important questions asked about the City's finances is "Is the City, as a whole, in better or worse condition as a result of this year's activities?" The Statement of Net Position and the Statement of Activities report information about the City as a whole and about its activities to assist in answering this question. These statements include all assets, liabilities, and deferred inflows and outflows of resources using the accrual basis of accounting, which is similar to the accounting used by most private-sector companies. All current year's revenues and expenses are taken into account, regardless of when cash is received or spent.
These two statements report the City's net position and, in addition, the changes which have occurred in it. Think of the City's net position as the difference between assets and deferred outflows of resources (what citizens own) and liabilities and deferred inflows of resources (what citizens owe), as one way of measuring the City's financial health, or financial position. Over time, increases and decreases in the City's net position is an indicator of whether its financial health is improving or worsening. You will need to consider other non-financial factors, however, such as changes in the City's property tax base, sales tax base, and the condition of the City's capital assets (roads, buildings, water and sewer lines, etc.) to determine the overall health the City.
we two
Reporting the City's Funds Fund Financial Statements
Our analysis of the City's funds begins on page 8. The fund financial statements begin on page 17 and provide detailed information about the most significant funds - not the City as a whole. Some funds are required to be established by State law. However, the City established many other funds to help it control and manage money for particular purposes or to show that it is meeting legal responsibilities for using certain taxes, grants, and other money. The City's three kinds of funds, governmental, proprietary and fiduciary, use different accounting approaches.
Governmental funds: Most of the City's basic services are reported in governmental funds, which focus on how money flows into and out of those funds and the balances left at the end of the year that are available for spending. These funds are reported using the modified accrual basis of accounting, which measures cash and all other financial assets that can be readily converted to cash. The governmental fund statements provide a detailed short-term view of the City's general government operations and the basic services it provides. Governmental fund information helps one determine whether there are more or fewer financial resources that can be spent in the near future to finance the City's programs. We describe the relationship (or differences) between governmental activities (reported in the Statement of Net Position and the Statement of Activities) and the governmental funds in the reconciliations at the bottom of the fund financial statements.
The City maintains two major governmental funds (the General Fund and the Pinehaven Drive Construction Project Fund) and thirteen (13) non-major governmental funds. A combination of all governmental funds is presented in the governmental fund balance sheet and in the governmental fund statement of revenues, expenditures and changes in fund balances. Individual fund data on all governmental funds is provided elsewhere in this report.
The City adopts an annual budget for all of its funds. A budgetary comparison statement has been provided for the General Fund to demonstrate compliance with this budget.
Basic governmental fund financial statements can be found on pages 17 through 20 of this report.
Proprietary funds: City maintains two different types of proprietary funds. Enterprise funds, a component of proprietary funds, are used to report the same functions presented as "business-type" activities in the government-wide financial statements. The City uses enterprise funds to account for its Water and Sewer Operations and Garbage Collections Funds. Internal
used to and allocate costs u· ... t.:::i.rn•':l>llH
uses
The basic proprietary fund financial statements can be found on pages 21 through 30 of this report.
Fiduciary fund: A fiduciary fund is used to account for resources held for the benefit of parties outside the government. The fiduciary fund is not reflected in the government-wide financial statements because the resources are not available to support the City's own programs. The City's only fiduciary fund is the Unemployment Compensation Benefit Fund, which is reported on a full accrual basis. Financial statements can be found on pages 31 and 32 of this report.
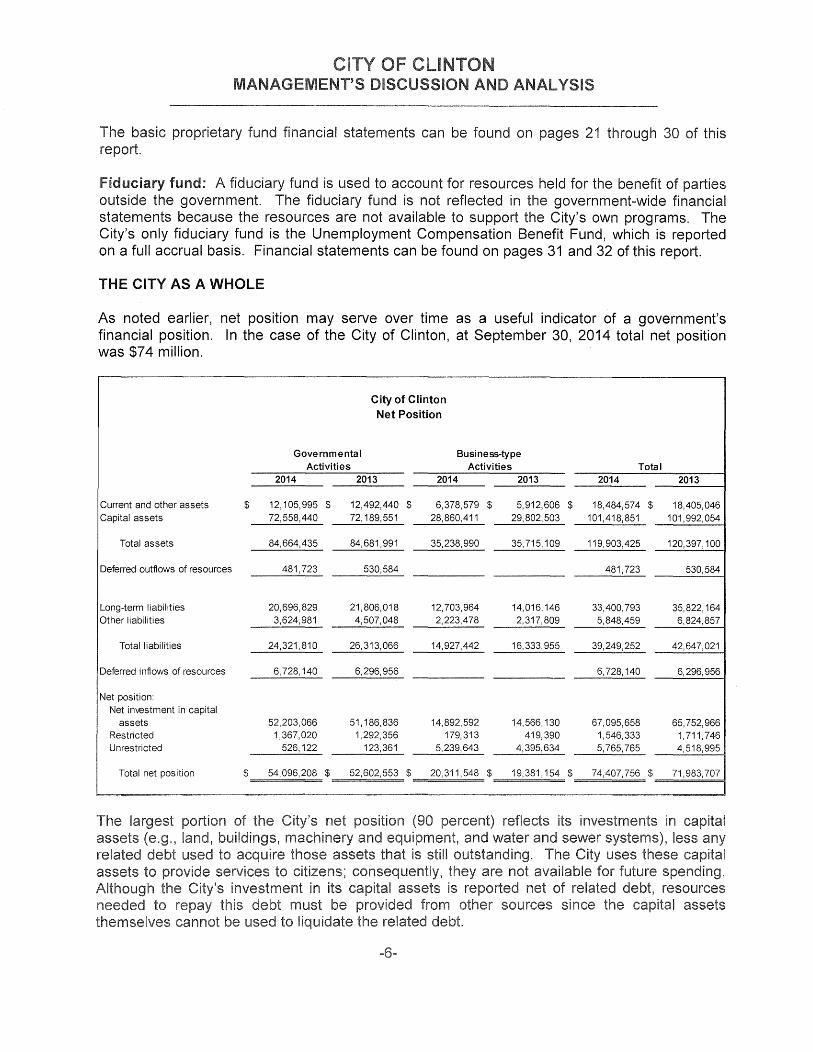
THE CITY AS A WHOLE
As noted earlier, net position may serve over time as a useful indicator of a government's financial position. In the case of the City of Clinton, at September 30, 2014 total net position was $7 4 million.
City of Clinton Net Position
Governmental Business-type Activities Activities Total
2014 2013 2014 2013 2014 2013
Current and other assets $ 12, 105,995 $ 12,492,440 $ 6,378,579 $ 5,912,606 $ 18,484,574 $ 18,405,046 Capital assets 72,558,440 72, 189,551 28,860,411 29,802,503 101,418,851 101,992,054
Total assets 84,664,435 84,681,991 35,238,990 35,715,109 119,903,425 120,397, 100
Deferred outflows of resources 481, 723 530,584 481, 723 530,584
Long-term liabilities 20,696,829 21,806,018 12,703,964 14,016, 146 33,400, 793 35,822, 164 Other liabilities 3,624,981 4,507,048 2,223,478 2,317,809 5,848,459 6,824,857
Total liabilities 24,321,810 26,313,066 14,927,442 16,333,955 39,249,252 42,647,021
Deferred inflows of resources 6,728, 140 6,296,956 6, 728, 140 6,296,956
Net position: Net investment in capital
assets 52,203,066 51,186,836 14,892,592 14,566, 130 67,095,658 65,752,966 Restricted 1,367,020 1,292,356 179,313 419,390 1,546,333 1, 711, 746 Unrestricted 526, 122 123,361 5,239,643 4,395,634 5,765,765 4,518,995
Total net position $ 54,096,208 $ 52,602,553 $ 20,311,548 $ 19,381, 154 $ 74,407,756 $ 71,983,707
Revenues: Program revenues:
Charges for services Operating grants and
contributions Capital grants and
contributions General revenues:
Property taxes Sales taxes Franchise charges Shared grants and
revenues Other
Total re\€nues
Expenses: General go\€rnment Public safety Public works Culture and recreation Economic development Interest on long-term
debt Water and sewer Garbage
Total expenses
Change in net position before transfers Transfers
Change in net position Net position - beginning
Net position - ending
September 30, business-type
$
$
net .._,U'•..J>ILl'UI
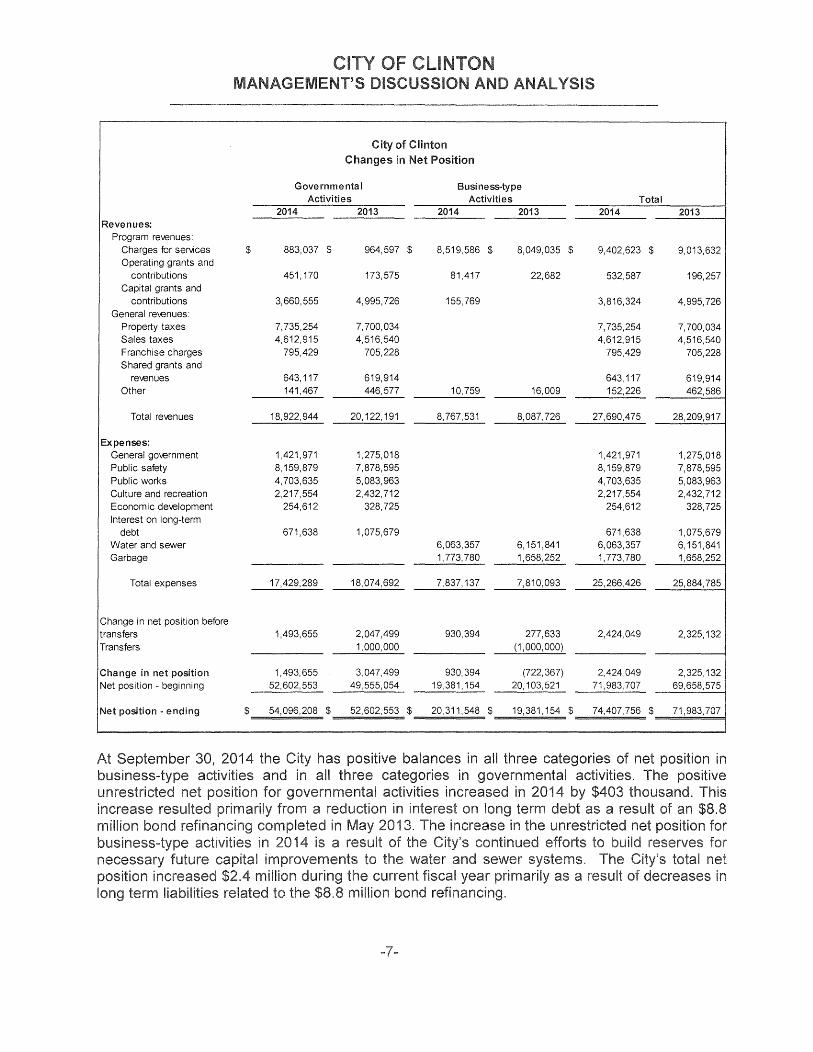
City of Clinton Changes in Net Position
Governmental Business-type Activities Activities Total
2014 2013 2014 2013 2014 2013
883,037 $ 964,597 $ 8,519,586 $ 8,049,035 $ 9,402,623 $ 9,013,632
451,170 173,575 81,417 22,682 532,587 196,257
3,660,555 4,995,726 155,769 3,816,324 4,995,726
7, 735,254 7,700,034 7,735,254 7,700,034 4,612,915 4,516,540 4,612,915 4,516,540
795,429 705,228 795,429 705,228
643, 117 619,914 643, 117 619,914 141,467 446,577 10,759 16,009 152,226 462,586
18,922,944 20, 122, 191 8,767,531 8,087,726 27,690,475 28,209,917
1,421,971 1,275,018 1,421,971 1,275,018 8, 159,879 7,878,595 8, 159,879 7,878,595 4,703,635 5,083,963 4,703,635 5,083,963 2,217,554 2,432,712 2,217,554 2,432,712
254,612 328,725 254,612 328,725
671,638 1,075,679 671,638 1,075,679 6,063,357 6,151,841 6,063,357 6, 151,841 1,773,780 1,658,252 1,773,780 1,658,252
17,429,289 18,074,692 7,837, 137 7,810,093 25,266,426 25,884,785
1,493,655 2,047,499 930,394 277,633 2,424,049 2,325, 132 1,000,000 (1,000,000)
1,493,655 3,047,499 930,394 (722,367) 2,424,049 2,325, 132 52,602,553 49,555,054 19,381,154 20, 103,521 71,983,707 69,658,575
54,096,208 $ 52,602,553 $ 20,311,548 $ 19,381,154 $ 74,407,756 $ 71,983,707
has positive balances in all three categories of net position in categories in governmental activities. positive
increased in 4 $403 term
Governmental activities. Governmental activities increased the City's net position by $1.5 million during the year. The increase in operating grants and contributions was primarily due to grant revenues received by the police department for the bomb squad and the enforcement of DUI laws. The increase in franchise charges was due to increases in collections. The increase in public safety expenditures was primarily due to the salary costs for the hiring of new police officers. The decrease in public works expenditures was due to lower than expected salary costs in the street department. The decrease in culture and recreation expenditures was due to a complete review of the department's programs and activities that resulted in lower costs for salaries, supplies, other services and charges, and capital outlay.
Business-type activities. Business-type activities increased the City's net position by $930 thousand during the year. Total assets decreased in 2014 primarily due to the depreciation expense that is recorded over the estimated useful lives of the capital assets. Total liabilities decreased due to scheduled debt payments made during the year. Water and Sewer expenditures decreased in 2014 primarily due to lower than expected costs for salaries in the water department and reductions in principal and interest on debt service as a result of an $8.8 million refinancing completed in May 2013. Garbage expenditures increased in 2014 as a result of increases in the collection of residential and commercial garbage.
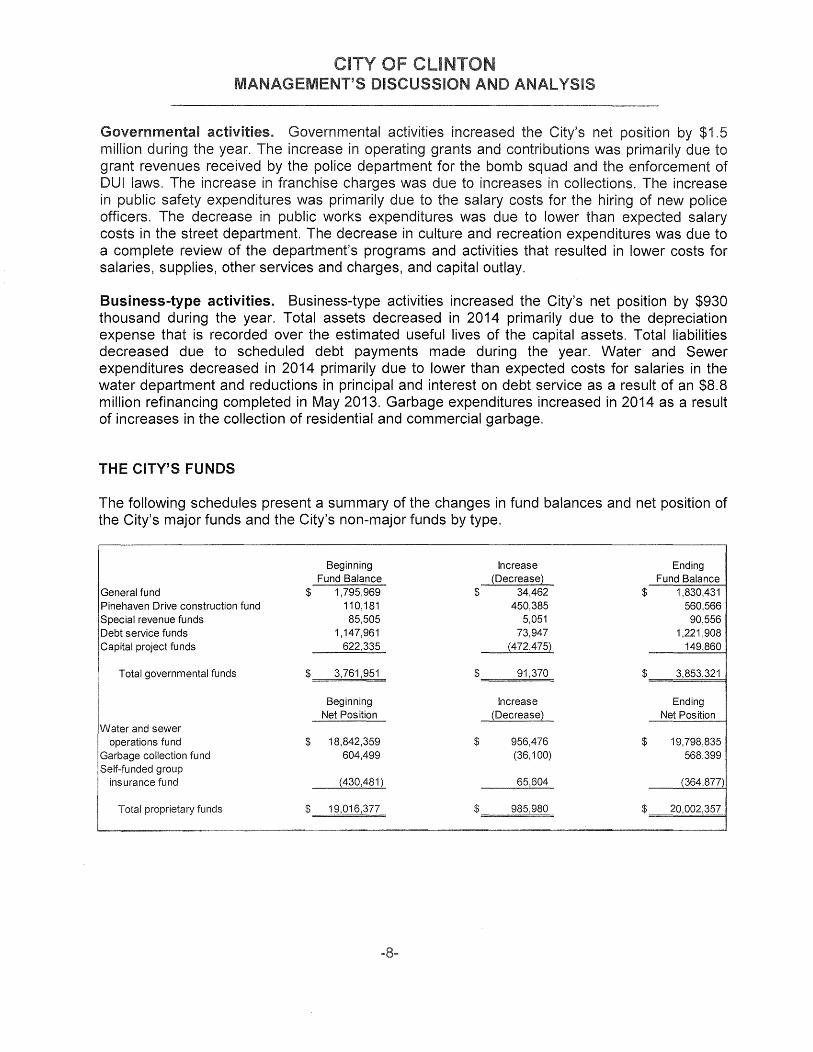
THE CITY'S FUNDS
The following schedules present a summary of the changes in fund balances and net position of the City's major funds and the City's non-major funds by type.
General fund Pinehaven Drive construction fund Special revenue funds Debt service funds Capital project funds
Total governmental funds
Water and sewer operations fund
Garbage collection fund Self-funded group
insurance fund
Total proprietary funds
The increase in the Pinehaven Drive Construction Fund is primarily due to borrowing $350 thousand on a general obligation note and a transfer of $338 thousand from the general fund in order to provide the funding necessary to complete the project.
The increase in the debt service funds is primarily due to ad valorem taxes collected in excess of those needed for repayment of debt.
The decrease in the capital projects funds resulted from bond proceeds for the police department expansion project and the fire station construction project received in a prior year and spent in the current year.
The increase in the water and sewer operations fund is primarily due to continued efforts to build reserves for necessary future capital improvements to the water and sewer systems.
The decrease in the garbage collection fund balance is primarily due to operating costs increasing more rapidly than the fees charged to residents. The garbage collection rates are adjusted as considered necessary in order to maintain an adequate fund balance.
The Self-Funded Group Insurance Fund is an internal service fund that charges the City's employees and other City funds for the cost of providing health and dental insurance coverage to employees. This fund started the year with a negative net position because the cost of claims in prior years was higher than expected, however claims in 2014 were less than expected. The premium rates charged to employees and other City funds are adjusted annually in order to maintain adequate funds for paying claims.
GENERAL FUND BUDGETARY HIGHLIGHTS
Final budgeted funds available were greater than original budgeted funds available by $764 thousand. This increase resulted primarily from a $149 thousand increase to the beginning fund balance, a $125 thousand increase for FEMA grants received, a $118 thousand increase to general sales tax received, a $99 thousand increase in insurance proceeds for hail damage to City buildings, a $72 thousand increase for Homeland Security grants received, a $47 thousand increase for the reimbursement of property cleaning costs, a $34 thousand increase for court fines collected, and $27 thousand for reimbursement of training costs of new police officers. Final budgeted expenditures were $706 thousand greater than those originally budgeted. Key elements of this increase were as follows:
1!11 $203,000 decrease in personal services as a result savings from vacant positions e increase in operating supplies as result of increases in miscellaneous
the Police costs the
a note not
Actual funds available were $89 thousand less than final budgeted. The majority of this difference consisted of a $406 thousand decrease in federal grants received offset by a $75 thousand increase in state grants received, a $122 thousand increase in sales tax collected, $70 thousand increase in local grants received, a $91 thousand increase in charges for services, and a $67 thousand increase in fines and forfeitures collected.
Actual expenditures were $491 thousand less than those finally budgeted. The majority of this decrease consisted of $284 thousand in police, fire and parks and recreation salaries and a $78 thousand decrease in police and fire supplies, other services and charges and debt service.
For additional information, see Required Supplementary Information beginning on page 74.
CAPITAL ASSETS
Governmental activities. The City's investment in net capital assets for its governmental activities amounted to $72.5 million at September 30, 2014. This investment includes land, buildings, other improvements, equipment and vehicles, infrastructure and construction in progress. Additions during the current year totaled $4.6 million. Significant increases were:
• $ 3.6 million - for work on the Pinehaven Drive widening project • $346 thousand - for renovation of the police station • $ 60 thousand - for work on the 2013 NRCS drainage project • $138 thousand - for purchase of rescue breathing cylinders • $119 thousand - for purchase of police vehicles • $109 thousand - for streets and drainage improvements in Oak Meadow Subdivision • $ 82 thousand - for completion of the new fire station • $ 66 thousand - for preliminary work on the Hampstead Boulevard extension project • $ 80 thousand - for various other capital assets
Depreciation expense amounted to $4.3 million for 2014 and $4.3 million for 2013. Accumulated depreciation at September 30, 2014 and 2013 was$ 52.9 million and $48.7 million, respectively.
Business-type activities. At September 30, 2014, the City's business-type net capital assets amounted to $28.8 million. This asset grouping includes land, buildings, water and sewer systems, equipment and vehicles and construction in progress. Additions of $510 thousand were made during 2014 mainly for water and sewer improvements and the purchase of new vehicles. Depreciation expense amounted to $1.5 million for 2014 and $1 million for 2013. Accumulated depreciation at September 30, 4 and 3 was $25.4 and $23.9 million,
-1
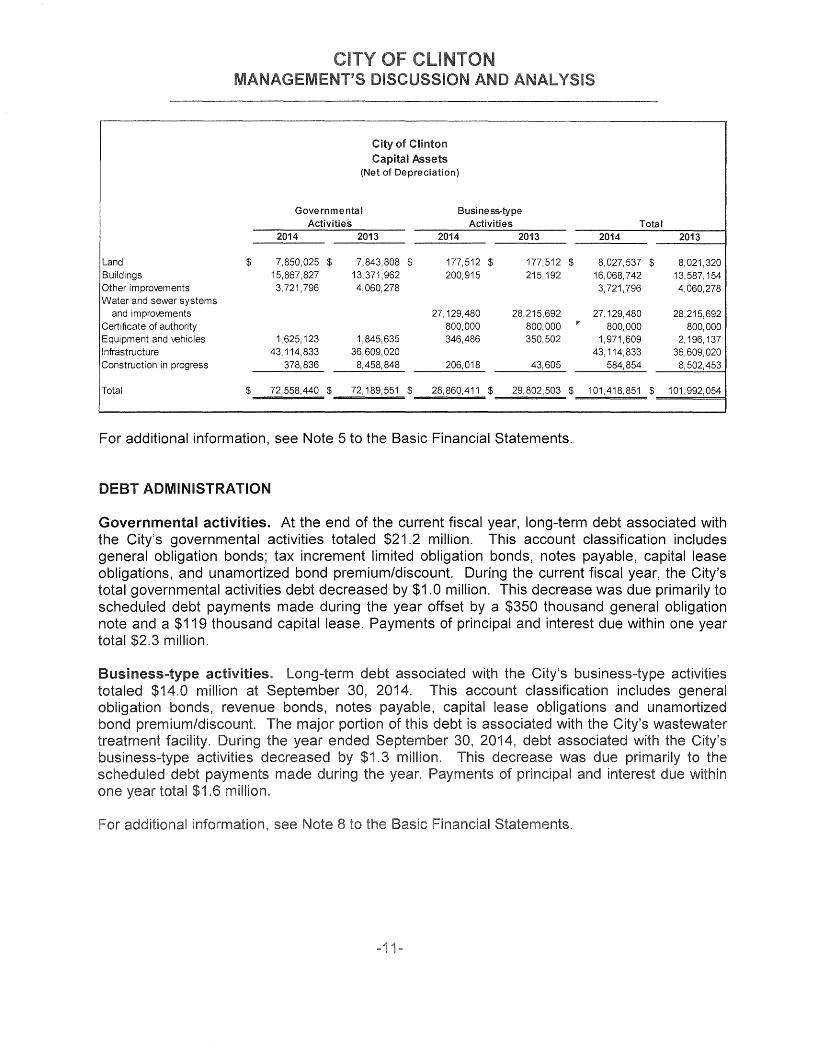
City of Clinton Capital Assets
(Net of Depreciation)
Governmental Business-type Activities Activities Total
2014 2013 2014 2013 2014 2013
Land $ 7,850,025 $ 7,843,808 $ 177,512 $ 177,512 $ 8,027,537 $ 8,021,320 Buildings 15,867,827 13,371,962 200,915 215, 192 16,068,742 13,587, 154 Other improvements 3,721,796 4,060,278 3, 721, 796 4,060,278 Water and sewer systems
and improvements 27, 129,480 28,215,692 27, 129,480 28,215,692 Certificate of authority 800,000 800,000 II' 800,000 800,000 Equipment and vehicles 1,625, 123 1,845,635 346,486 350,502 1,971,609 2, 196, 137 Infrastructure 43, 114,833 36,609,020 43, 114,833 36,609,020 Construction in progress 378,836 8,458,848 206,018 43,605 584,854 8,502,453
Total $ 72,558,440 $ 72, 189,551 $ 28,860,411 $ 29,802,503 $ 101,418,851 $ 101,992,054
For additional information, see Note 5 to the Basic Financial Statements.
DEBT ADMINISTRATION
Governmental activities. At the end of the current fiscal year, long-term debt associated with the City's governmental activities totaled $21.2 million. This account classification includes general obligation bonds; tax increment limited obligation bonds, notes payable, capital lease obligations, and unamortized bond premium/discount. During the current fiscal year, the City's total governmental activities debt decreased by $1.0 million. This decrease was due primarily to scheduled debt payments made during the year offset by a $350 thousand general obligation note and a $119 thousand capital lease. Payments of principal and interest due within one year total $2.3 million.
Business-type activities. Long-term debt associated with the City's business-type activities totaled $14.0 million at September 30, 2014. This account classification includes general obligation bonds, revenue bonds, notes payable, capital lease obligations and unamortized bond premium/discount. The major portion of this debt is associated with the City's wastewater treatment facility. During the year ended September 30, 4, debt associated with the City's business-type activities decreased million. decrease was due primarily
l""l".ll'llli"Y'IOl"'l'tC made
see 8to
1-
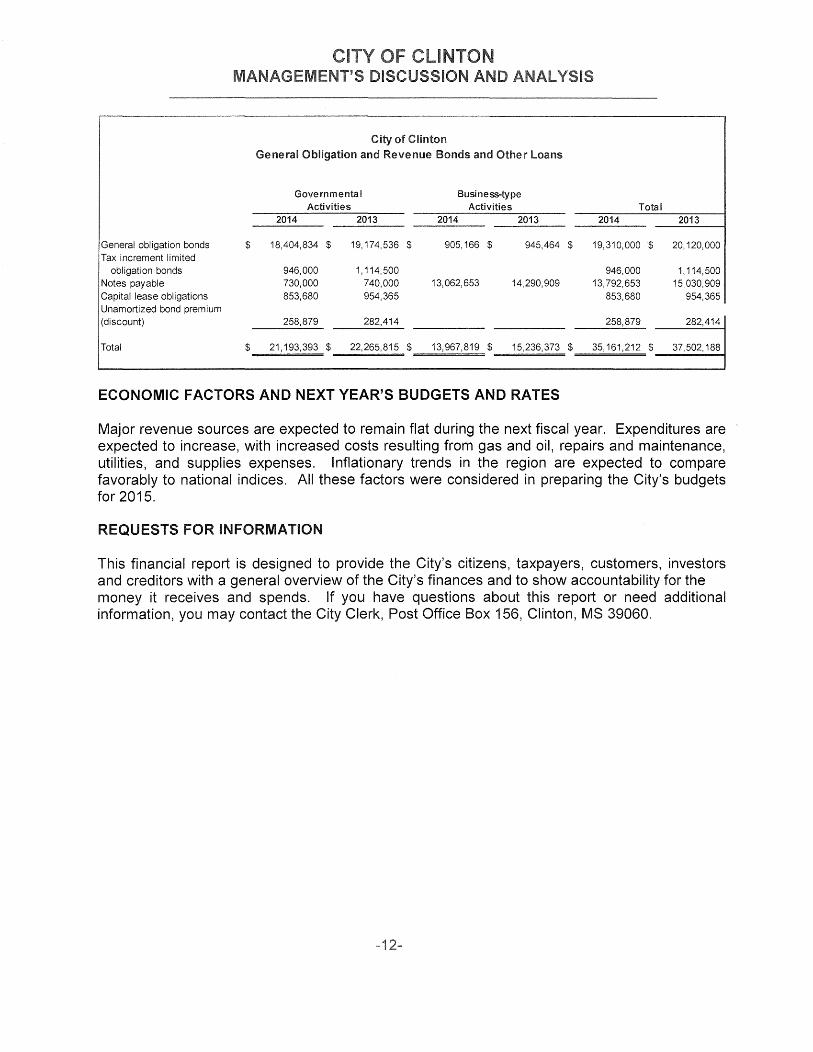
City of Clinton General Obligation and Revenue Bonds and Other Loans
Governmental Business-type Activities Activities Total
2014 2013 2014 2013 2014 2013
General obligation bonds $ 18,404,834 $ 19, 174,536 $ 905, 166 $ 945,464 $ 19,310,000 $ 20, 120,000 Tax increment limited
obligation bonds 946,000 1,114,500 946,000 1,114,500 Notes payable 730,000 740,000 13,062,653 14,290,909 13,792,653 15,030,909 Capital lease obligations 853,680 954,365 853,680 954,365 Unamortized bond premium (discount) 258,879 282,414 258,879 282,414
Total $ 21, 193,393 $ 22,265,815 $ 13,967,819 $ 15,236,373 $ 35, 161,212 $ 37,502, 188
ECONOMIC FACTORS AND NEXT YEAR'S BUDGETS AND RATES
Major revenue sources are expected to remain flat during the next fiscal year. Expenditures are expected to increase, with increased costs resulting from gas and oil, repairs and maintenance, utilities, and supplies expenses. Inflationary trends in the region are expected to compare favorably to national indices. All these factors were considered in preparing the City's budgets for 2015.
REQUESTS FOR INFORMATION
This financial report is designed to provide the City's citizens, taxpayers, customers, investors and creditors with a general overview of the City's finances and to show accountability for the money it receives and spends. If you have questions about this report or need additional information, you may contact the City Clerk, Post Office Box 156, Clinton, MS 39060.
-1
BASIC FINANCIAL STATEMENTS
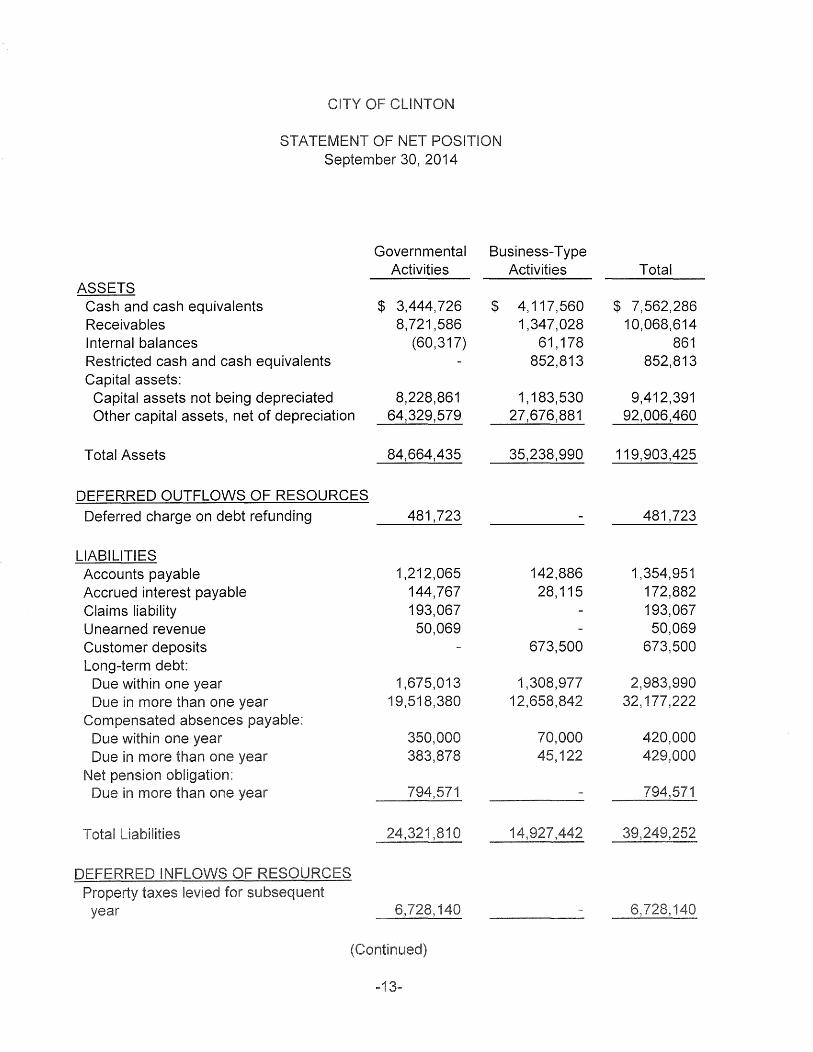
STATEMENT OF NET POSITION September 30, 2014
Governmental Business-Type Activities Activities
ASSETS Cash and cash equivalents $ 3,444,726 $ 4, 117,560 Receivables 8,721,586 1,347,028 Internal balances (60,317) 61, 178 Restricted cash and cash equivalents 852,813 Capital assets:
Capital assets not being depreciated 8,228,861 1, 183,530 Other capital assets, net of depreciation 64,329,579 27,676,881
Total Assets 84,664,435 35,238,990
DEFERRED OUTFLOWS OF RESOURCES
Deferred charge on debt refunding 481,723
LIABILITIES Accounts payable 1,212,065 142,886 Accrued interest payable 144,767 28, 115 Claims liability 193,067 Unearned revenue 50,069 Customer deposits 673,500 Long-term debt:
Due within one year 1,675,013 1,308,977 Due in more than one year 19,518,380 12,658,842
Compensated absences payable: Due within one year 350,000 70,000 Due in more than one 383,878 45, 122
obligation: in more than one
-1
Total
$ 7,562,286 10,068,614
861 852,813
9,412,391 92,006,460
119,903,425
481,723
1,354,951 172,882 193,067 50,069
673,500
2,983,990 32, 177,222
420,000 429,000
September 30, 2014
Governmental Business-Type Activities Activities Total
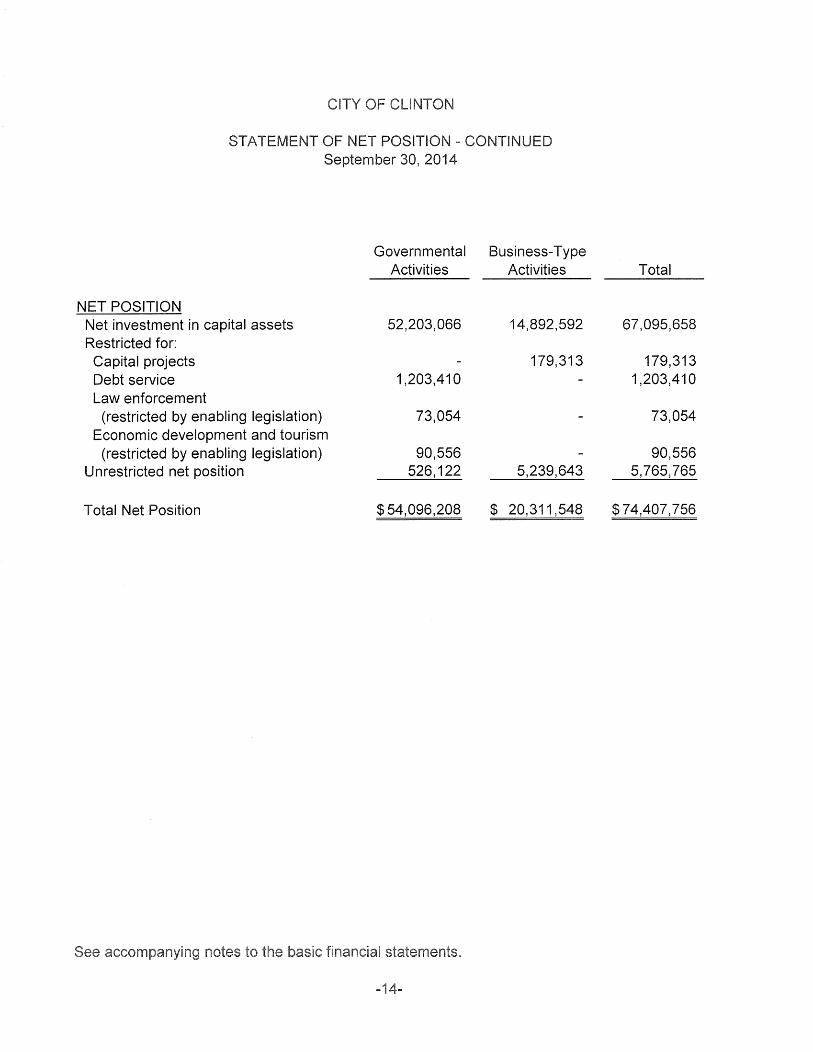
NET POSITION Net investment in capital assets 52,203,066 14,892,592 67,095,658 Restricted for:
Capital projects 179,313 179,313 Debt service 1,203,410 1,203,410 Law enforcement
(restricted by enabling legislation) 73,054 73,054 Economic development and tourism
(restricted by enabling legislation) 90,556 90,556 Unrestricted net position 526, 122 5,239,643 5,765,765
Total Net Position $ 54,096,208 $ 20,311,548 $ 74,407,756
-1
on
$ ,971 8, 159,879 4,703,635
7,554 254,612
671,638
17,429,289
2,429,947 3,633,410 1,773,780
7,837,137
$ 25,266,426
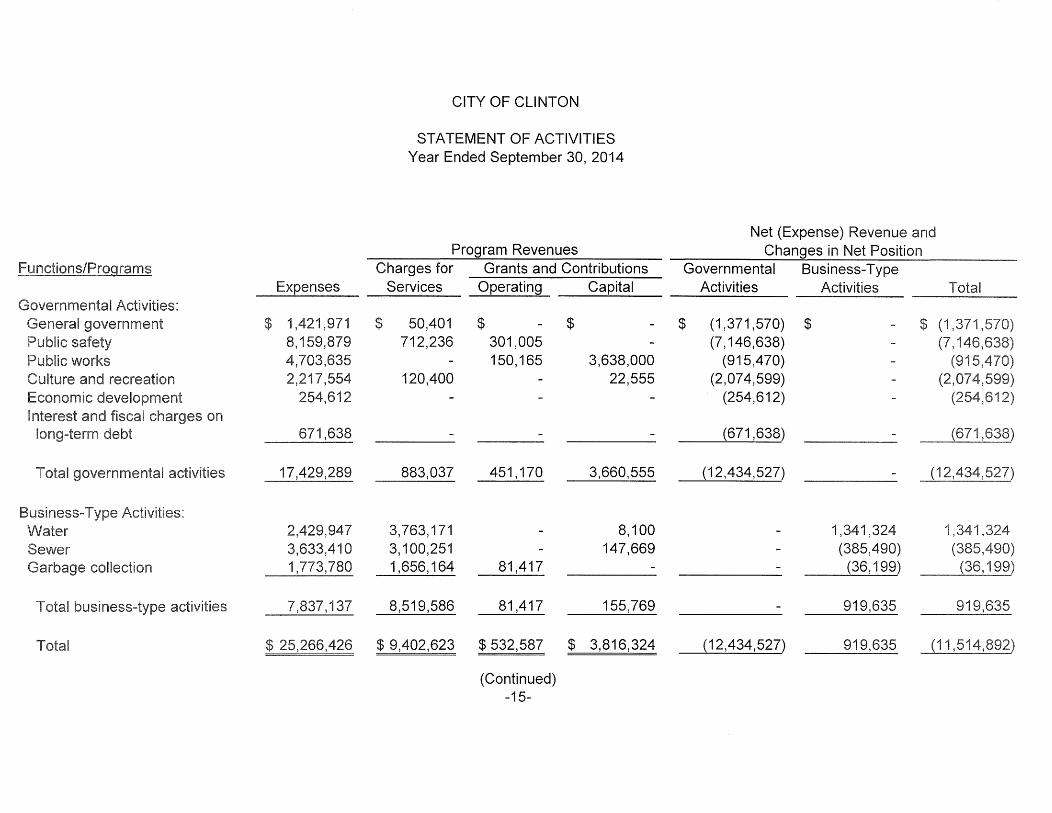
CITY OF CLINTON
STATEMENT OF ACTIVITIES Year Ended September 30, 2014
Program Revenues Charges for Grants and Contributions
Services Operating Capital
$ 50,401 $ - $ -
712,236 301,005 -150, 165 3,638,000
120,400 - 22,555
883,037 451, 170 3,660,555
3,763,171 - 8,100 3, 100,251 - 147,669 1,656, 164 81,417 -
8,519,586 81,417 155,769 -
$ 9,402,623 $ 532,587 $ 3,816,324
(Continued) -15-
Net (Expense) Revenue and Changes in Net Position
Governmental Business-Type Activities Activities
$ (1,371,570) $ (7, 146,638)
(915,470) (2,074,599)
(254,612)
(671,638) -
(12,434,527) - (1
- 1,341,324 - (385,490) - (36, 199)
- 919,635
(12,434,527) 919,635
1
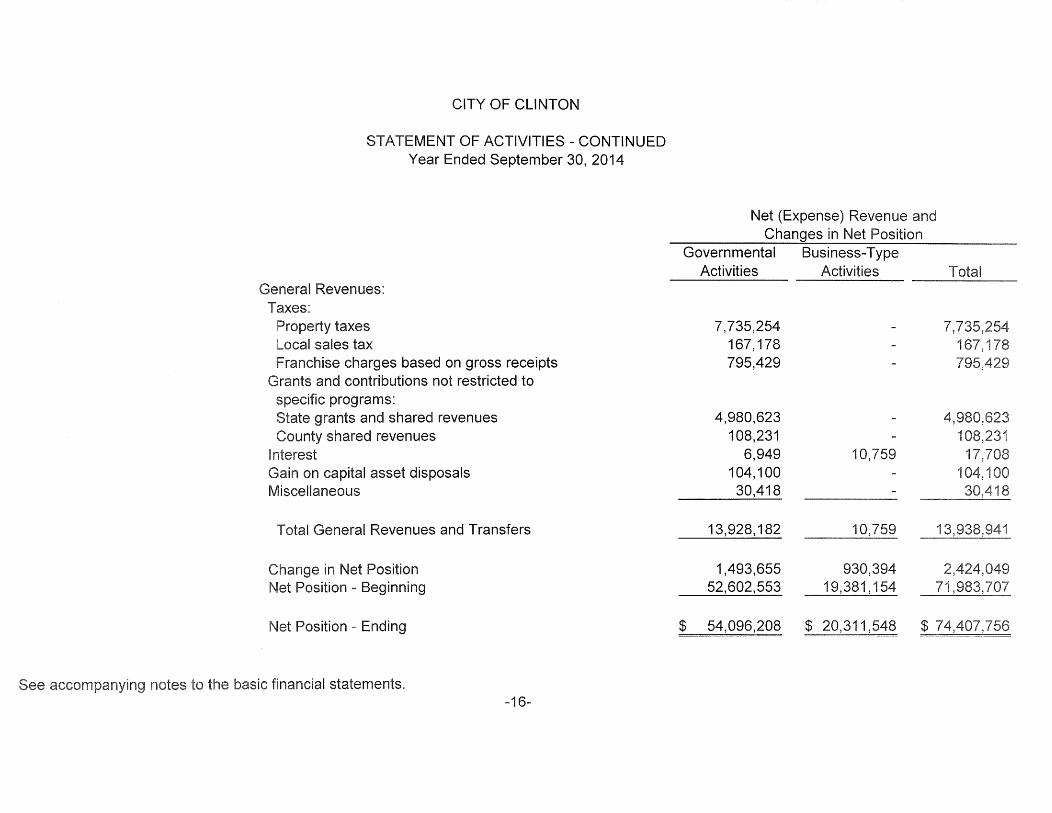
CITY OF CLINTON
STATEMENT OF ACTIVITIES - CONTINUED Year Ended September 30, 2014
.::onor'"lll Revenues:
Property taxes Local sales tax
charges based on gross receipts and contributions not restricted to
programs: grants and shared revenues
County shared revenues
on capital asset disposals Miscellaneous
General Revenues and Transfers
Change in Net Position Position - Beginning
Position - Ending
+an ......... ,..,...,, statements. -16-
Net (Expense) Revenue Changes in Net Position
Governmental Business-Type
$
Activities Activities
7,735,254 167,178 795,429
4,980,623 108,231
6,949 104,100 30,418
13,928, 182
1,493,655 52,602,553
54,096,208
10,759
10,759
930,394 19,381, 154
$ 20,311,548
-
$
1
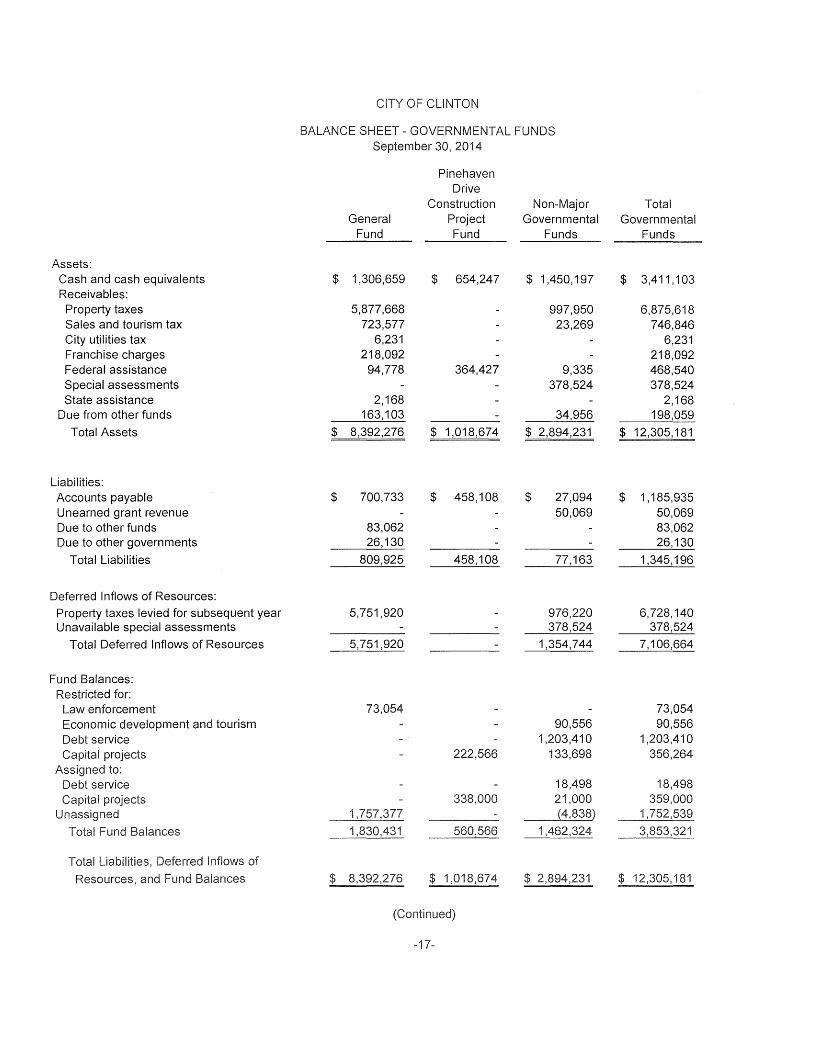
Assets: Cash and cash equivalents Receivables:
Property taxes Sales and tourism tax City utilities tax Franchise charges Federal assistance Special assessments State assistance
Due from other funds
Total Assets
Liabilities: Accounts payable Unearned grant revenue Due to other funds Due to other governments
Total Liabilities
Deferred Inflows of Resources:
Property taxes levied for subsequent year Unavailable special assessments
Total Deferred Inflows of Resources
Fund Balances: Restricted for:
Law enforcement Economic development and tourism Debt service Capital projects
Assigned to: Debt service Capital projects
Unassigned
Total Fund Balances
Resources, and Fund Balances
CITY OF CLINTON
BALANCE SHEET- GOVERNMENTAL FUNDS September 30, 2014
Pinehaven Drive
Construction General Project
Fund Fund
$ 1,306,659 $ 654,247
5,877,668 723,577
6,231 218,092
94,778 364,427
2,168 163, 103
$ 8,392,276 $ 1,018,674
$ 700,733 $ 458,108
83,062 26, 130
809,925 458,108
5,751,920
5,751,920
73,054
222,566
338,000
-17-
Non-Major Governmental
Funds
$ 1,450, 197
997,950 23,269
9,335 378,524
34,956
$ 2,894,231
$ 27,094 50,069
77,163
976,220 378,524
1,354,744
90,556 1,203,410
133,698
18,498 21,000 (4,838)
1,462,324
Total Governmental
$
$
$
Funds
3,411, 103
6,875,618 746,846
6,231 218,092 468,540 378,524
2,168 198,059
12,305,181
1, 185,935 50,069 83,062 26,130
1,345, 196
6,728, 140 378,524
7, 106,664
73,054 90,556
1,203,410 356,264
18,498 359,000
1,752,539
3,853,321
$ 12,305, 181
- GOVERNMENTAL September 30, 2014
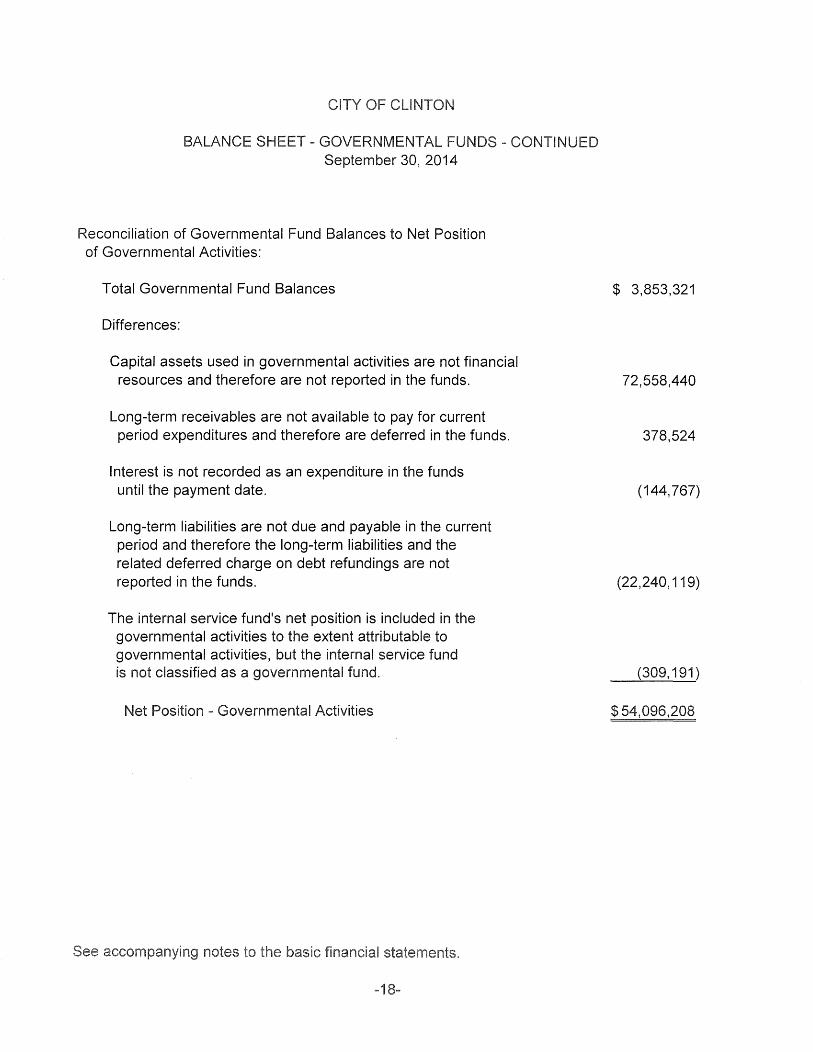
Reconciliation of Governmental Fund Balances to Net Position of Governmental Activities:
Total Governmental Fund Balances
Differences:
Capital assets used in governmental activities are not financial resources and therefore are not reported in the funds.
Long-term receivables are not available to pay for current period expenditures and therefore are deferred in the funds.
Interest is not recorded as an expenditure in the funds until the payment date.
Long-term liabilities are not due and payable in the current period and therefore the long-term liabilities and the related deferred charge on debt refundings are not reported in the funds.
The internal service fund's net position is included in the governmental activities to the extent attributable to governmental activities, but the internal service fund is not classified as a governmental fund.
Net Position - Governmental Activities
-1
$ 3,853,321
72,558,440
378,524
(144, 767)
(22,240, 119)
(309, 191)
$ 54, 096,208
CITY OF CLINTON
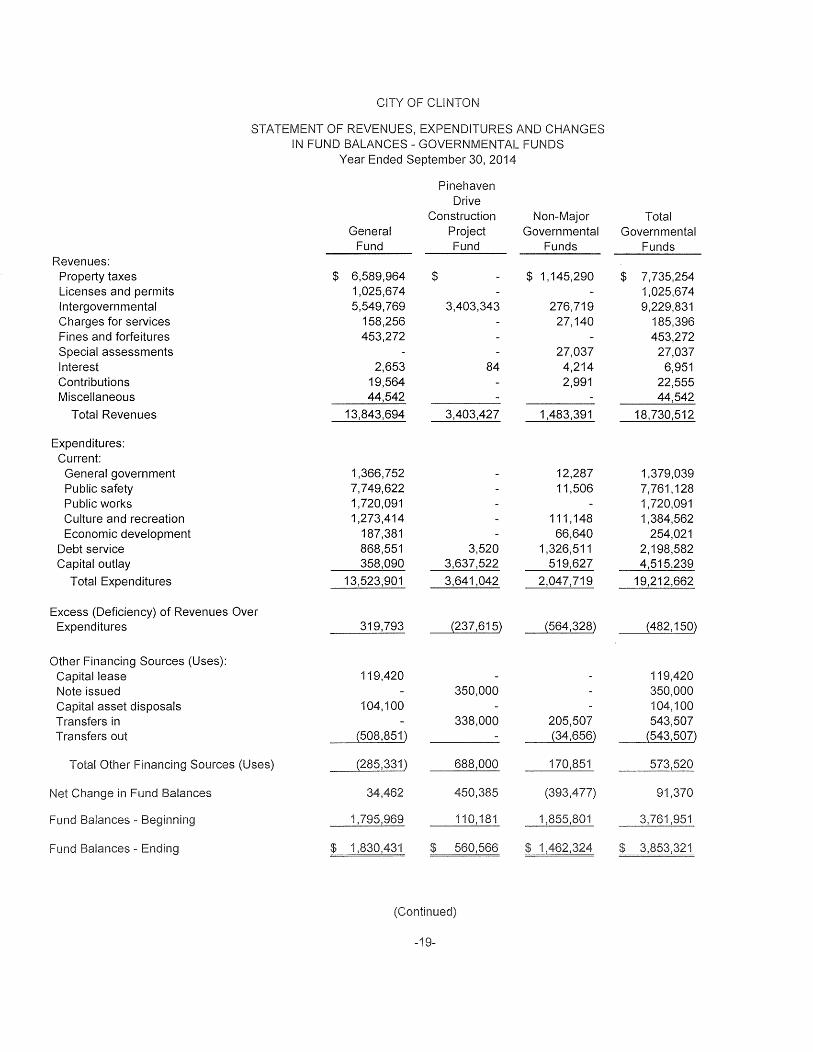
STATEMENT OF REVENUES, EXPENDITURES AND CHANGES IN FUND BALANCES - GOVERNMENTAL FUNDS
Revenues: Property taxes Licenses and permits Intergovernmental Charges for services Fines and forfeitures Special assessments Interest Contributions Miscellaneous
Total Revenues
Expenditures: Current:
General government Public safety Public works Culture and recreation Economic development
Debt service Capital outlay
Total Expenditures
Excess (Deficiency) of Revenues Over Expenditures
Other Financing Sources (Uses): Capital lease Note issued Capital asset disposals Transfers in Transfers out
Total Other Financing Sources (Uses)
Net Change in Fund Balances
Fund Balances -
Year Ended September 30, 2014
General Fund
$ 6,589,964 1,025,674 5,549,769
158,256 453,272
2,653 19,564 44,542
13,843,694
1,366,752 7,749,622 1,720,091 1,273,414
187,381 868,551 358,090
13,523,901
319,793
119,420
104,100
(508,851)
(285,331)
34,462
Pinehaven Drive
Construction Project Fund
$
-19-
3,403,343
84
3,403,427
3,520 3,637,522
3,641,042
(237,615)
350,000
338,000
688,000
450,385
110, 181
Non-Major Governmental
$
Funds
1, 145,290
276,719 27,140
27,037 4,214 2,991
1,483,391
12,287 11,506
111, 148 66,640
1,326,511 519,627
2,047,719
(564,328)
205,507 {34,656)
170,851
(393,477)
1,855,801
Total Governmental
$
Funds
7,735,254 1,025,674 9,229,831
185,396 453,272
27,037 6,951
22,555 44,542
18,730,512
1,379,039 7,761, 128 1,720,091 1,384,562
254,021 2, 198,582 4,515,239
19,212,662
(482, 150)
119,420 350,000 104,100 543,507
(543,507)
573,520
91,370
$ 3,853,321
CITY OF CLINTON
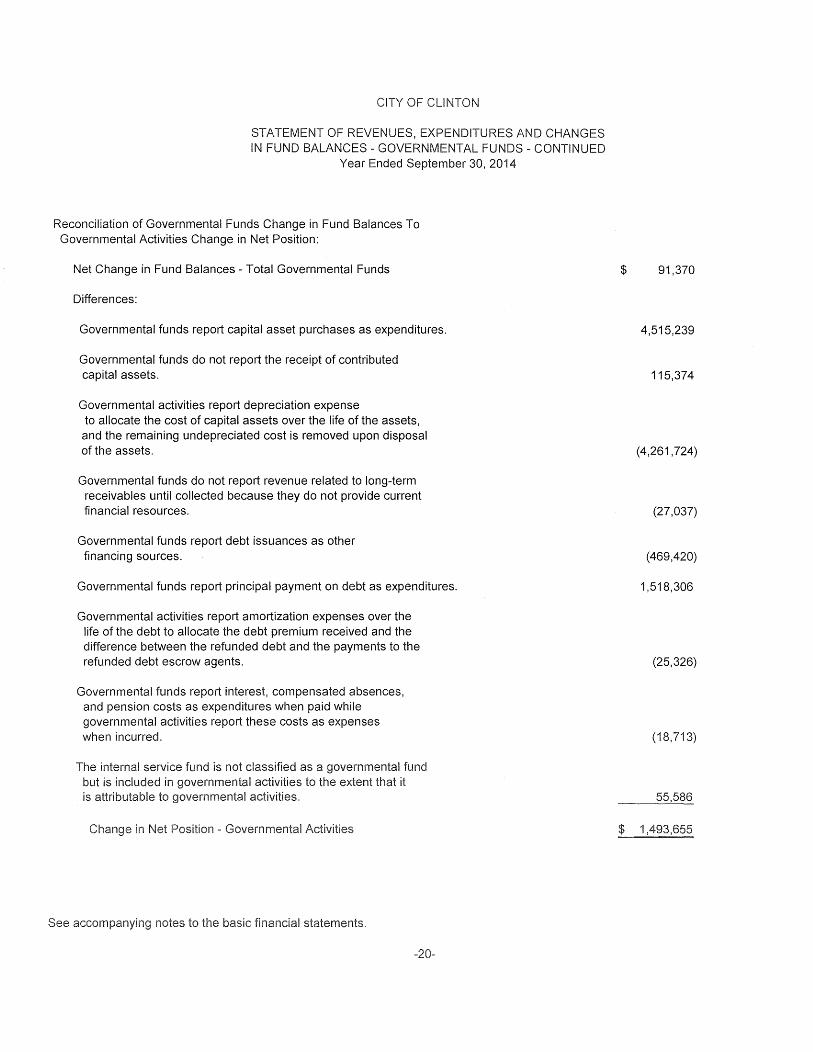
STATEMENT OF REVENUES, EXPENDITURES AND CHANGES IN FUND BALANCES - GOVERNMENTAL FUNDS - CONTINUED
Year Ended September 30, 2014
Reconciliation of Governmental Funds Change in Fund Balances To Governmental Activities Change in Net Position:
Net Change in Fund Balances - Total Governmental Funds
Differences:
Governmental funds report capital asset purchases as expenditures.
Governmental funds do not report the receipt of contributed capital assets.
Governmental activities report depreciation expense to allocate the cost of capital assets over the life of the assets, and the remaining undepreciated cost is removed upon disposal of the assets.
Governmental funds do not report revenue related to long-term receivables until collected because they do not provide current financial resources.
Governmental funds report debt issuances as other financing sources.
Governmental funds report principal payment on debt as expenditures.
Governmental activities report amortization expenses over the life of the debt to allocate the debt premium received and the difference between the refunded debt and the payments to the refunded debt escrow agents.
Governmental funds report interest, compensated absences, and pension costs as expenditures when paid while governmental activities report these costs as expenses when incurred.
The internal service fund is not classified as a governmental fund but is included in governmental activities to the extent that it is attributable to governmental activities.
in Net Position - Governmental Activities
-20-
$ 91,370
4,515,239
115,374
(4,261,724)
(27,037)
(469,420)
1,518,306
(25,326)
(18,713)
55,586
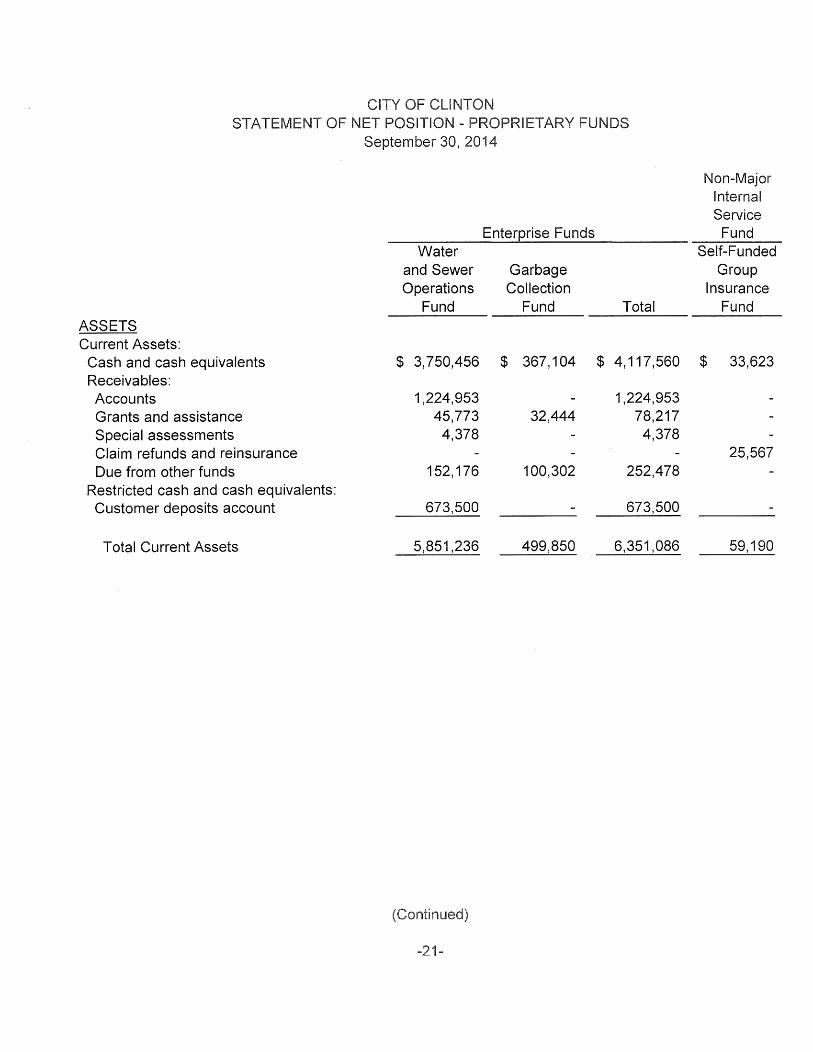
ASSETS Current Assets:
STATEMENT
Cash and cash equivalents Receivables: Accounts Grants and assistance Special assessments Claim refunds and reinsurance Due from other funds
Restricted cash and cash equivalents: Customer deposits account
Total Current Assets
FUNDS September 30, 2014
Water and Sewer Operations
Fund
Enterprise Funds
Garbage Collection
Fund
$ 3, 750,456 $ 367' 104
1,224,953 45, 773 32,444
4,378
152, 176 100,302
673,500
5,851,236 499,850
Total
Non-Major Internal Service
Fund Self-Funded
Group Insurance
Fund
$ 4, 117,560 $ 33,623
1,224,953 78,217 4,378
252,478
673,500
6,351,086
25,567
59, 190
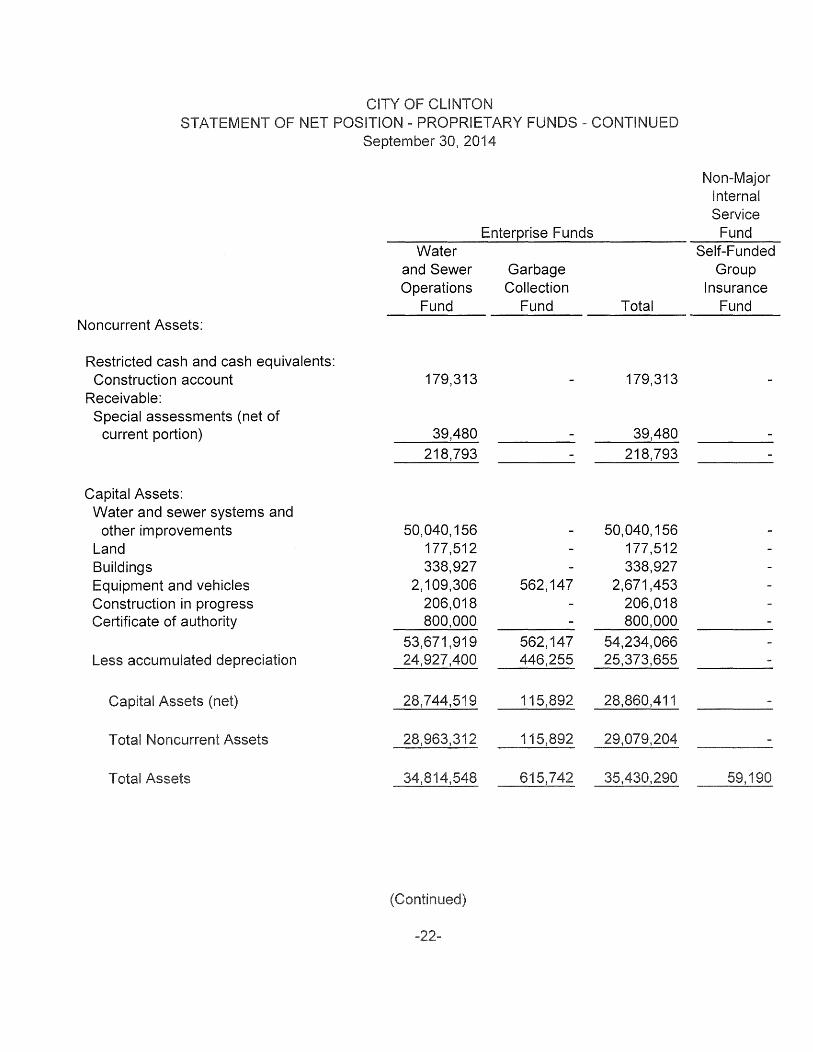
- CONTI September 30, 2014
Non-Major Internal Service
Enterprise Funds Fund Water Self-Funded
and Sewer Garbage Group Operations Collection Insurance
Fund Fund Total Fund Noncurrent Assets:
Restricted cash and cash equivalents: Construction account 179,313 179,313
Receivable: Special assessments (net of
current portion) 39,480 39,480 218,793 218,793
Capital Assets: Water and sewer systems and
other improvements 50,040, 156 50,040, 156 Land 177,512 177,512 Buildings 338,927 338,927 Equipment and vehicles 2, 109,306 562, 147 2,671,453 Construction in progress 206,018 206,018 Certificate of authority 800,000 800,000
53,671,919 562, 147 54,234,066 Less accumulated depreciation 24,927,400 446,255 25,373,655
Capital Assets (net) 28,744,519 115,892 28,860,411
Total Noncurrent Assets 28,963,312 11
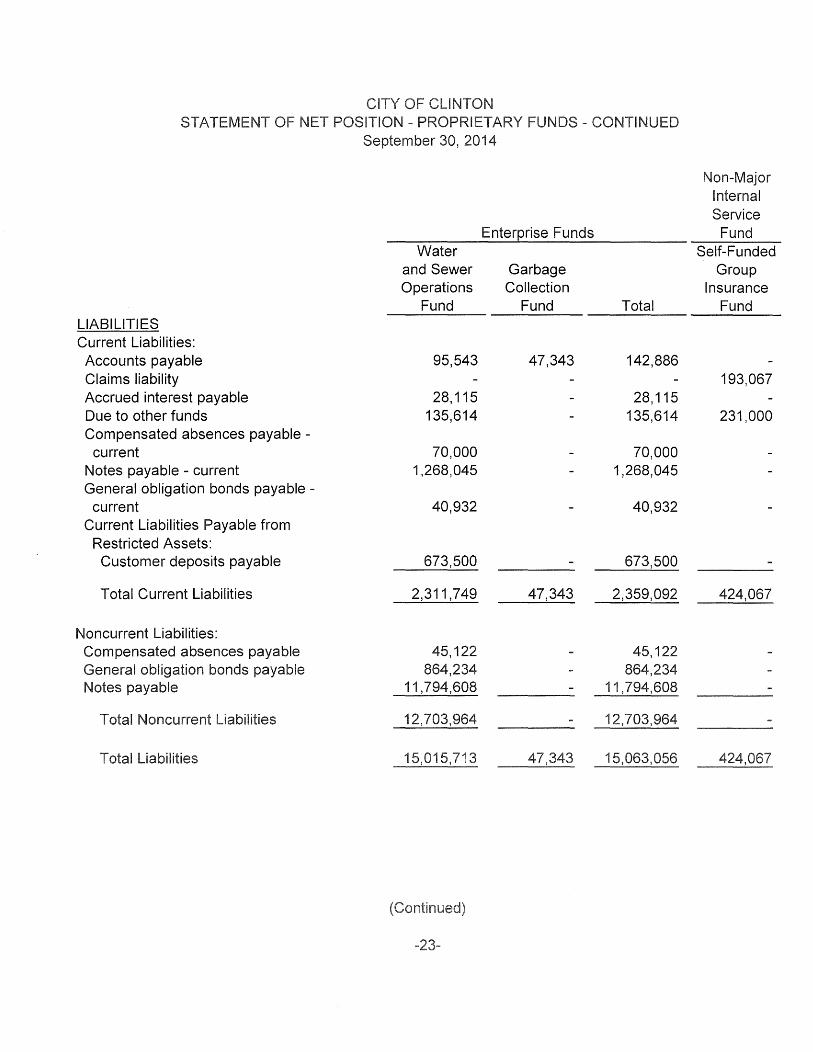
September 30, 2014
Non-Major Internal Service
Enterprise Funds Fund Water Self-Funded
and Sewer Garbage Group Operations Collection Insurance
Fund Fund Total Fund LIABILITIES Current Liabilities:
Accounts payable 95,543 47,343 142,886 Claims liability 193,067 Accrued interest payable 28, 115 28, 115 Due to other funds 135,614 135,614 231,000 Compensated absences payable -
current 70,000 70,000 Notes payable - current 1,268,045 1,268,045 General obligation bonds payable -
current 40,932 40,932 Current Liabilities Payable from
Restricted Assets: Customer deposits payable 673,500 673,500
Total Current Liabilities 2,311,749 47,343 2,359,092 424,067
Noncurrent Liabilities: Compensated absences payable 45,122 45, 122 General obligation bonds payable 864,234 864,234 Notes payable 11,794,608 11,794,608
Total Noncurrent Liabilities 12,703,964 12,703,964
Liabilities 1
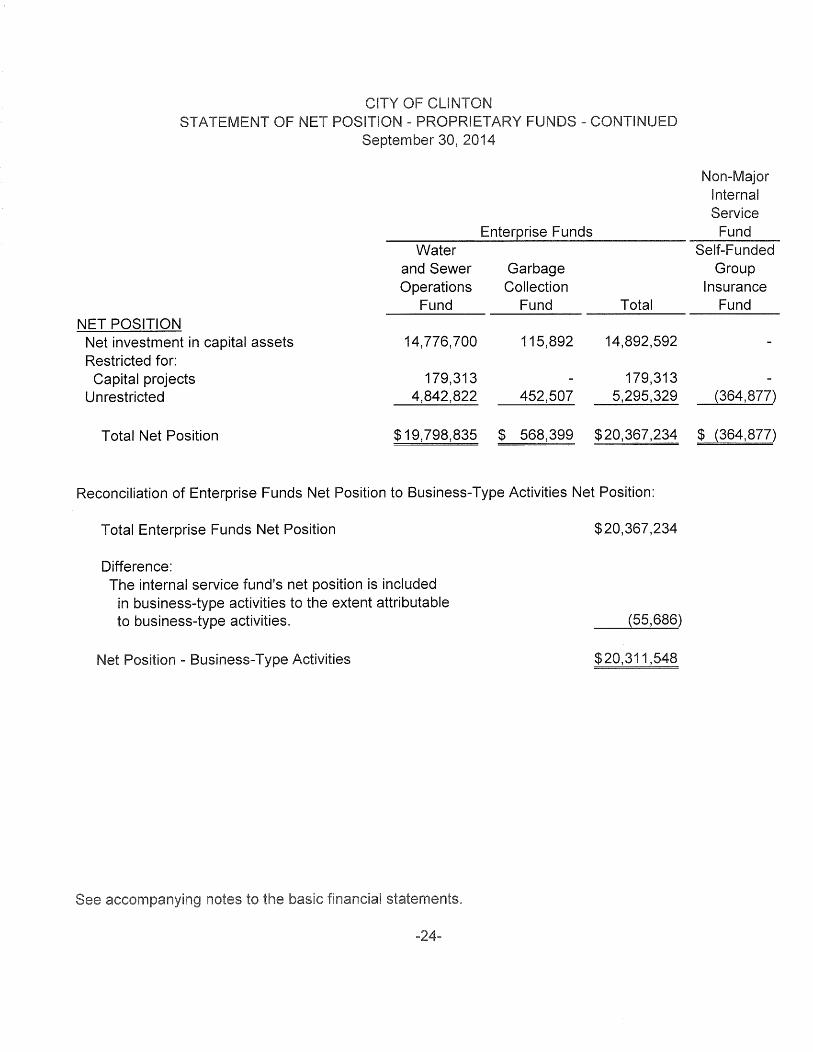
NET POSITION Net investment in capital assets Restricted for:
Capital projects Unrestricted
Total Net Position
September 30, 2014
Enterprise Funds Water
and Sewer Garbage Operations Collection
Fund Fund
14,776,700 115,892
179,313 4,842,822 452,507
$19,798,835 $ 568,399
Total
14,892,592
179,313 5,295,329
$20,367,234
Reconciliation of Enterprise Funds Net Position to Business-Type Activities Net Position:
Total Enterprise Funds Net Position
Difference: The internal service fund's net position is included
in business-type activities to the extent attributable to business-type activities.
Net Position - Business-Type Activities
$20,367,234
(55,686)
$20,311,548
Non-Major Internal Service Fund
Self-Funded Group
Insurance Fund
(364,877)
$ (364,877)
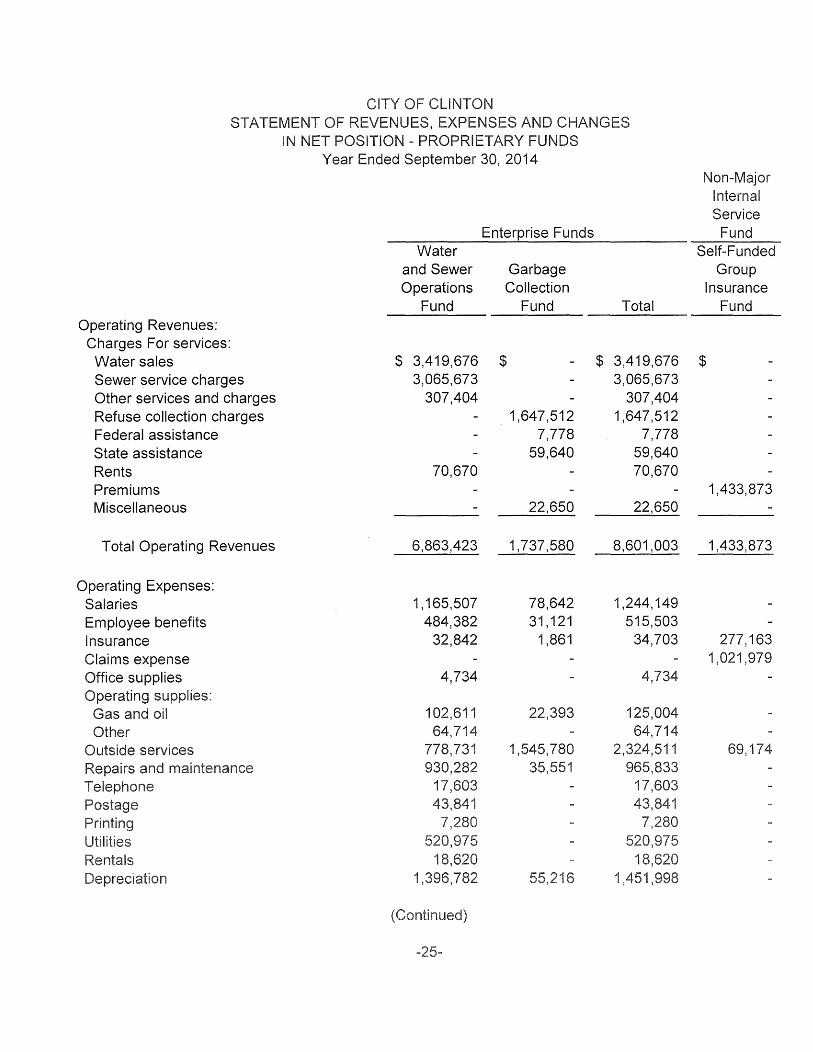
Operating Revenues: Charges For services: Water sales Sewer service charges Other services and charges Refuse collection charges Federal assistance State assistance Rents Premiums Miscellaneous
Total Operating Revenues
Operating Expenses: Salaries Employee benefits Insurance Claims expense Office supplies Operating supplies:
Gas and oil Other
Outside services Repairs
REVENUES, EXPENSES AND CHANGES POSITION - PROPRIETARY FUNDS
Year Ended September 30, 2014
Water and Sewer Operations
Fund
$ 3,419,676 3,065,673
307,404
70,670
6,863,423
1, 165,507 484,382
32,842
4,734
102,611 64,714
778,731 930,282
17,603
1
Enterprise Funds
Garbage Collection
Fund
$
1,647,512 7,778
59,640
22,650
1,737,580
78,642 31, 121
1,861
22,393
1,545,780
6
Total
$ 3,419,676 3,065,673
307,404 1,647,512
7,778 59,640 70,670
22,650
8,601,003
1,244, 149 515,503
34,703
4,734
125,004 64,714
2,324,511 965,833
1
1
Non-Major Internal Service
Fund Self-Funded
Group Insurance
Fund
$
1,433,873
1,433,873
277, 163 1,021,979
69,174
STATEMENT REVENUES,EXPENSES CHANGES IN POSITION - PROPRIETARY FUNDS - CONTINUED
Year Ended September 30, 2014
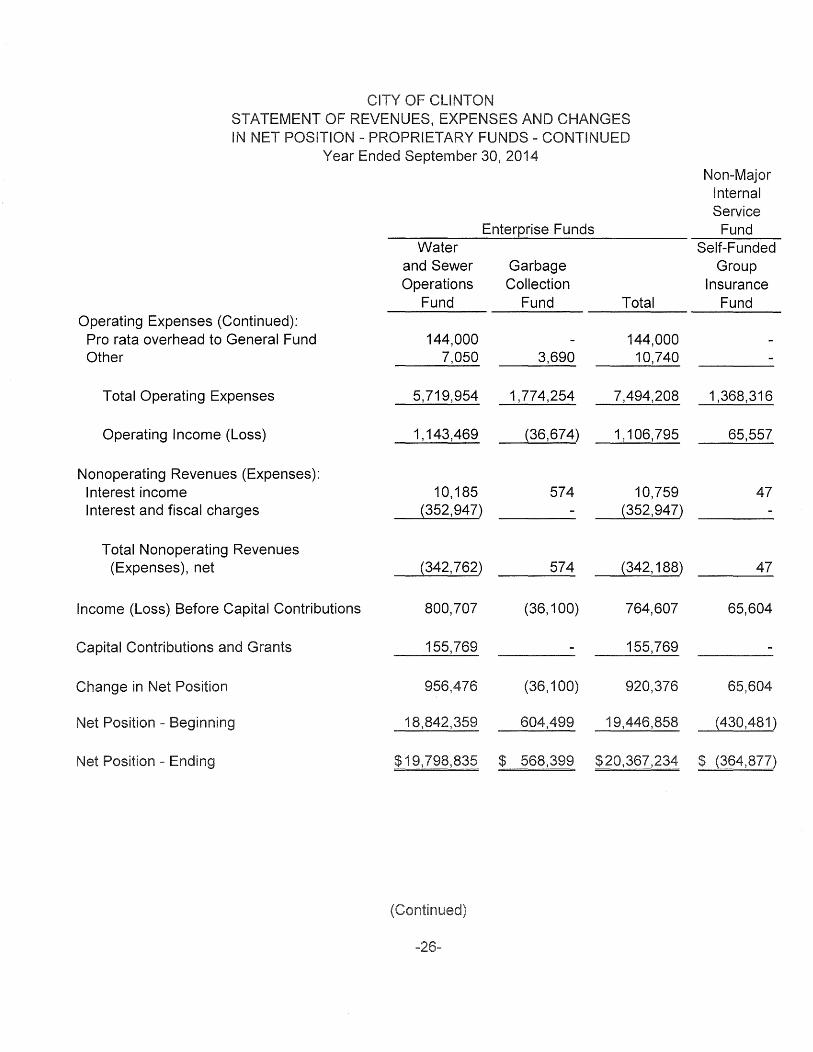
Operating Expenses (Continued): Pro rata overhead to General Fund Other
Total Operating Expenses
Operating Income (Loss)
Nonoperating Revenues (Expenses): Interest income Interest and fiscal charges
Total Nonoperating Revenues (Expenses), net
Income (Loss) Before Capital Contributions
Capital Contributions and Grants
Change in Net Position
Net Position - Beginning
Position -
Water and Sewer Operations
Fund
144,000 7,050
Enterprise Funds
Garbage Collection
Fund
3,690
5,719,954 1,774,254
1, 143,469 (36,674)
10,185 574 (352,947)
(342, 762) 57 4
800, 707 (36, 100)
155,769
Total
144,000 10,740
Non-Major Internal Service Fund
Self-Funded Group
Insurance Fund
7,494,208 1,368,316
1, 106, 795 65,557
10,759 47 (352,947)
(342, 188) 4 7
764,607 65,604
155,769
956,476 (36, 100) 920,376 65,604
18,842,359 604,499 19,446,858 (430,481)
$19,798,835 $ 568,399 $20,367,234 $ (364,877)
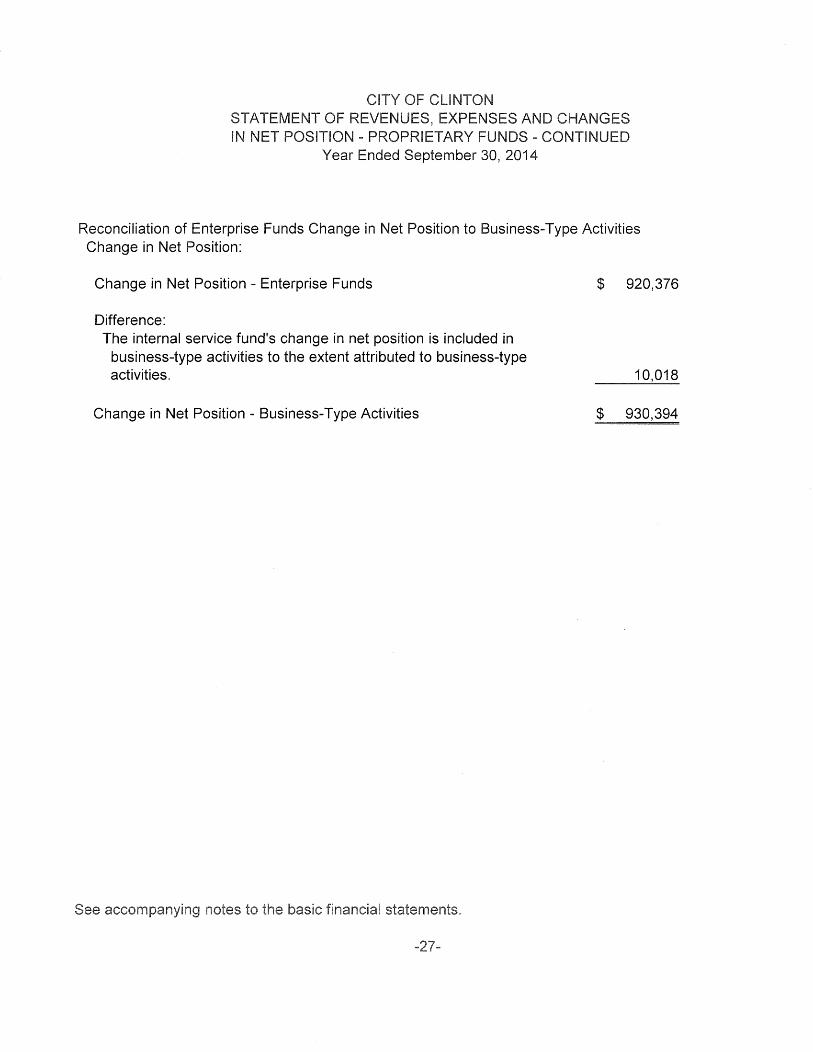
STATEMENT EXPENSES AND NET POSITION - PROPRIETARY FUNDS - CONTINUED
Year Ended September 30, 2014
Reconciliation of Enterprise Funds Change in Net Position to Business-Type Activities Change in Net Position:
Change in Net Position - Enterprise Funds
Difference: The internal service fund's change in net position is included in
business-type activities to the extent attributed to business-type activities.
Change in Net Position - Business-Type Activities
notes to statements.
$ 920,376
10,018
$ 930,394
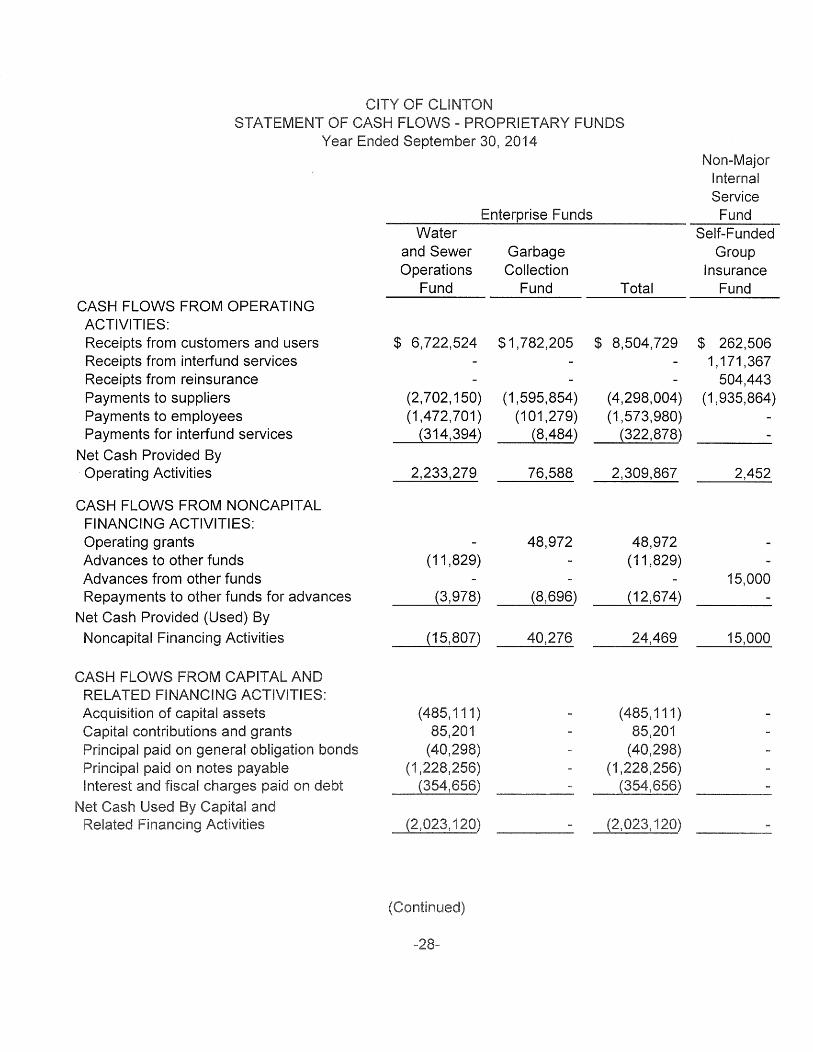
STATEMENT CASH FLOWS - PROPRIETARY FUNDS Year Ended September 30, 2014
CASH FLOWS FROM OPERATING ACTIVITIES: Receipts from customers and users Receipts from interfund services Receipts from reinsurance Payments to suppliers Payments to employees Payments for interfund services
Net Cash Provided By Operating Activities
CASH FLOWS FROM NONCAPITAL FINANCING ACTIVITIES: Operating grants Advances to other funds Advances from other funds Repayments to other funds for advances
Net Cash Provided (Used) By
Noncapital Financing Activities
CASH FLOWS FROM CAPITAL AND RELATED FINANCING ACTIVITIES: Acquisition of capital assets Capital contributions and grants Principal paid on general obligation bonds Principal paid on notes payable
fiscal charges on
Water and Sewer Operations
Fund
$ 6,722,524
(2, 702, 150) (1,472,701)
(314,394)
2,233,279
(11,829)
(3,978)
(15,807)
(485,111) 85,201
(40,298) (1,228,256)
Enterprise Funds
Garbage Collection
Fund
$1,782,205
(1,595,854) (101,279)
(8,484)
76,588
48,972
(8,696)
40,276
Total
$ 8,504,729
(4,298,004) (1,573,980)
(322,878)
2,309,867
(1
48,972 (11,829)
(12,674)
24,469
(485, 111) 85,201
(40,298)
Non-Major Internal Service Fund
Self-Funded Group
Insurance Fund
$ 262,506 1,171,367
504,443 (1,935,864)
2,452
15,000
15,000
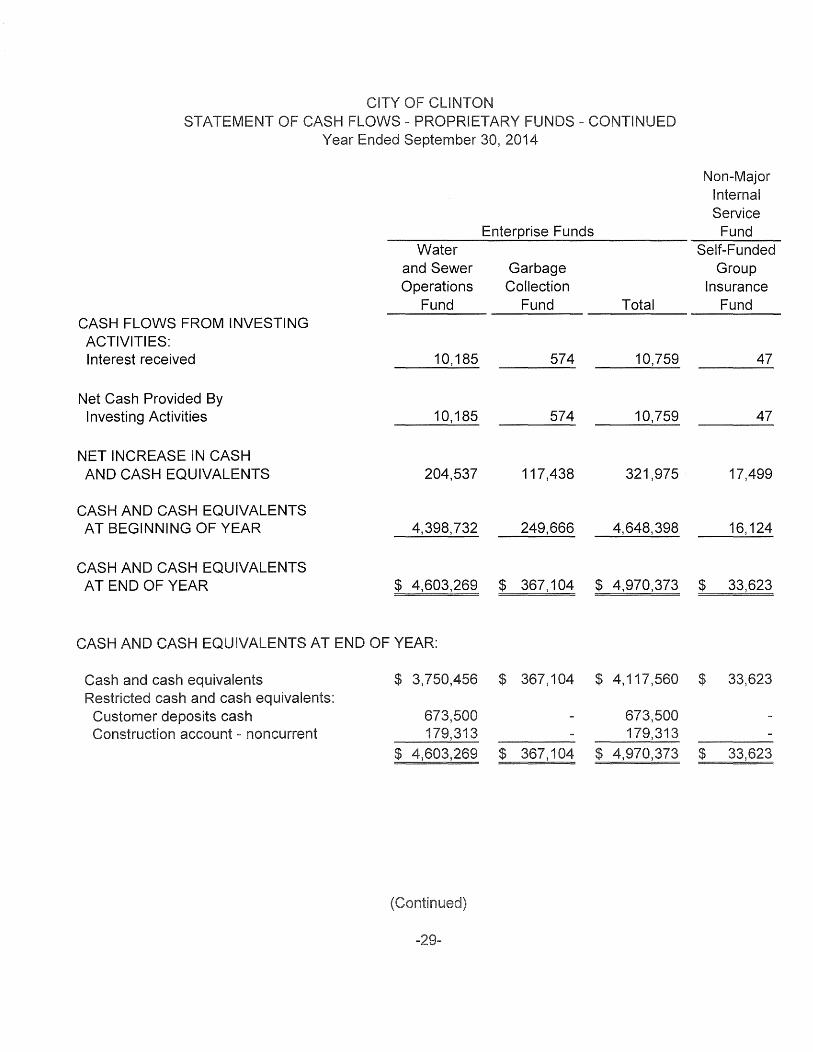
FUNDS -Year Ended September 30, 2014
Non-Major Internal Service
Enterprise Funds Fund Water Self-Funded
and Sewer Garbage Group Operations Collection Insurance
Fund Fund Total Fund CASH FLOWS FROM INVESTING ACTIVITIES: Interest received 10, 185 574 10,759 47
Net Cash Provided By Investing Activities 10, 185 574 10,759 47
NET INCREASE IN CASH AND CASH EQUIVALENTS 204,537 117,438 321,975 17,499
CASH AND CASH EQUIVALENTS AT BEGINNING OF YEAR 4,398,732 249,666 4,648,398 16, 124
CASH AND CASH EQUIVALENTS AT END OF YEAR $ 4,603,269 $ 367,104 $ 4,970,373 $ 33,623
CASH AND CASH EQUIVALENTS AT END OF YEAR:
Cash and cash equivalents $ 3,750,456 $ 367,104 $ 4, 117,560 $ 33,623 Restricted cash and cash equivalents:
Customer deposits cash 673,500 673,500 Construction account - noncurrent 179,313 179,313
$ 4,603,269 $ 367,1 $ 4,970,373 $ 33,623
CASH FLOWS - PROPRIETARY Year Ended September 30, 2014
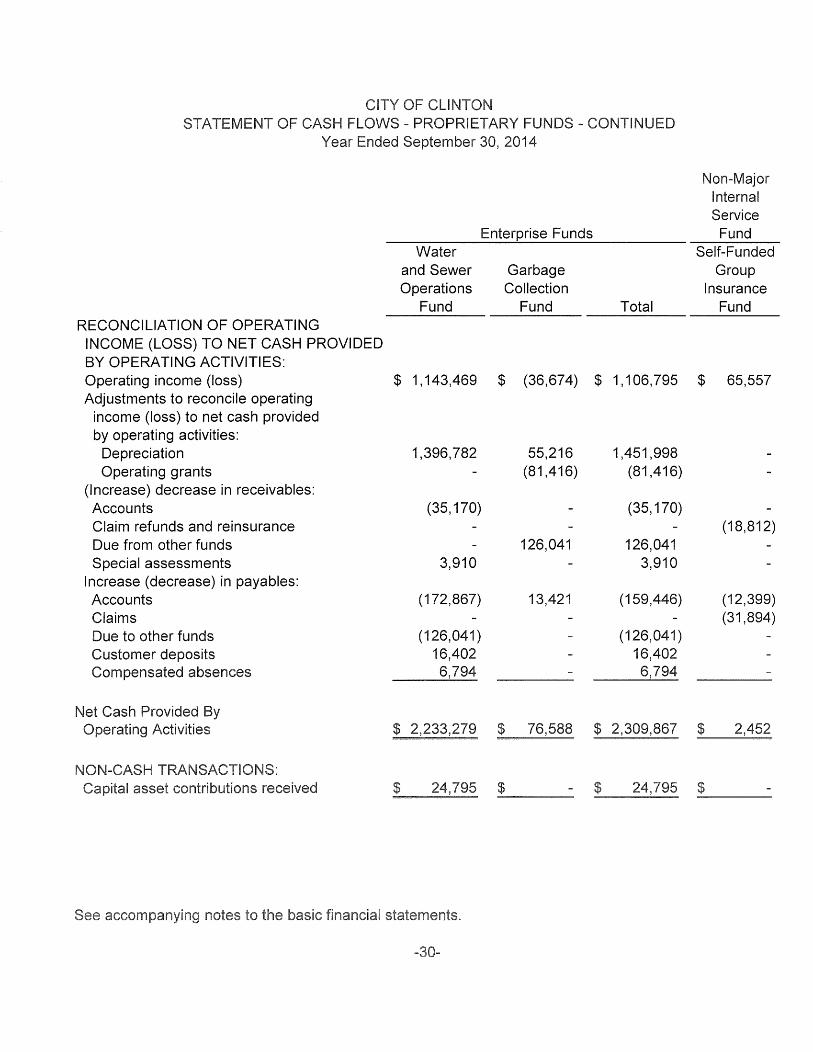
RECONCILIATION OF OPERATING INCOME (LOSS) TO NET CASH PROVIDED BY OPERATING ACTIVITIES:
Water and Sewer Operations
Fund
Enterprise Funds
Garbage Collection
Fund Total
Non-Major Internal Service Fund
Self-Funded Group
Insurance Fund
Operating income (loss) Adjustments to reconcile operating
$ 1, 143,469 $ (36,674) $ 1, 106,795 $ 65,557
income (loss) to net cash provided by operating activities:
Depreciation Operating grants
(Increase) decrease in receivables: Accounts Claim refunds and reinsurance Due from other funds Special assessments
Increase (decrease) in payables: Accounts Claims Due to other funds Customer deposits Compensated absences
Net Cash Provided By Operating Activities
1,396,782
(35, 170)
3,910
(172,867)
(126,041) 16,402 6,794
55,216 (81,416)
126,041
13,421
1,451,998 (81,416)
(35, 170)
126,041 3,910
(159,446)
(126,041) 16,402 6,794
(18,812)
(12,399) (31,894)
$ 76,588 $ 2,309,867 $ 2,452 =======
$ $
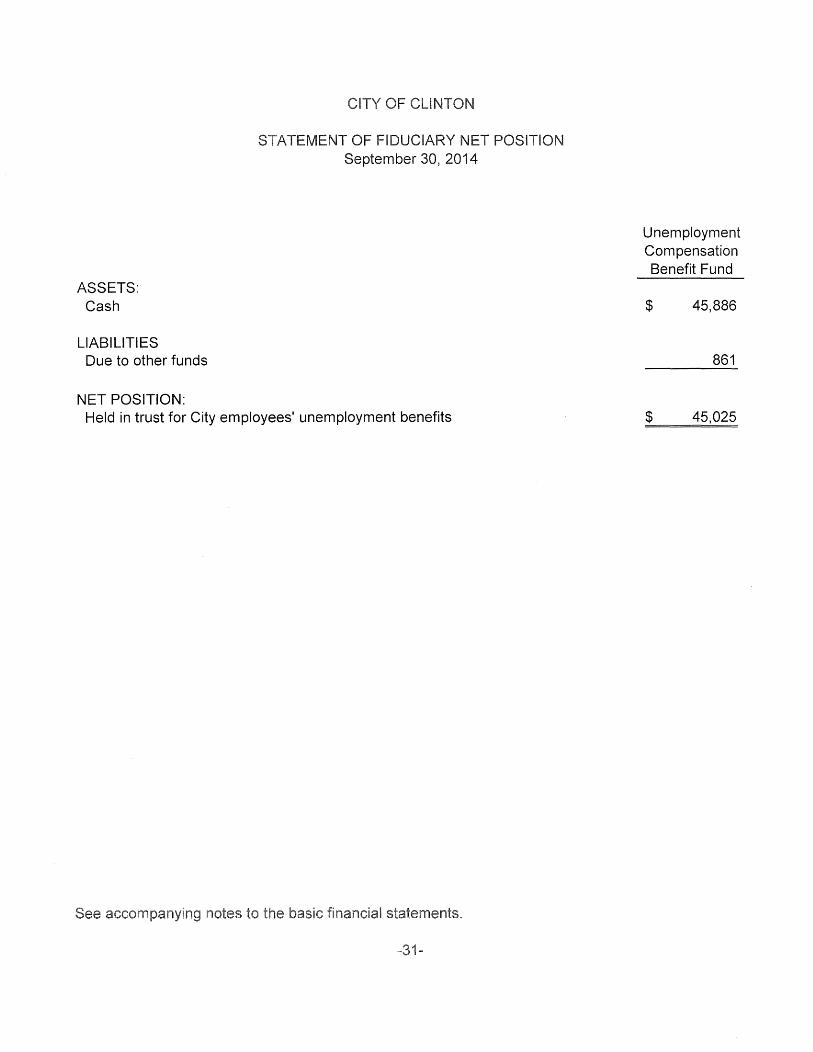
STATEMENT OF September 30, 2014
ASSETS: Cash
LIABILITIES Due to other funds
NET POSITION: Held in trust for City employees' unemployment benefits
POSITION
Unemployment Compensation Benefit Fund
$ 45,886
861
$ 45,025
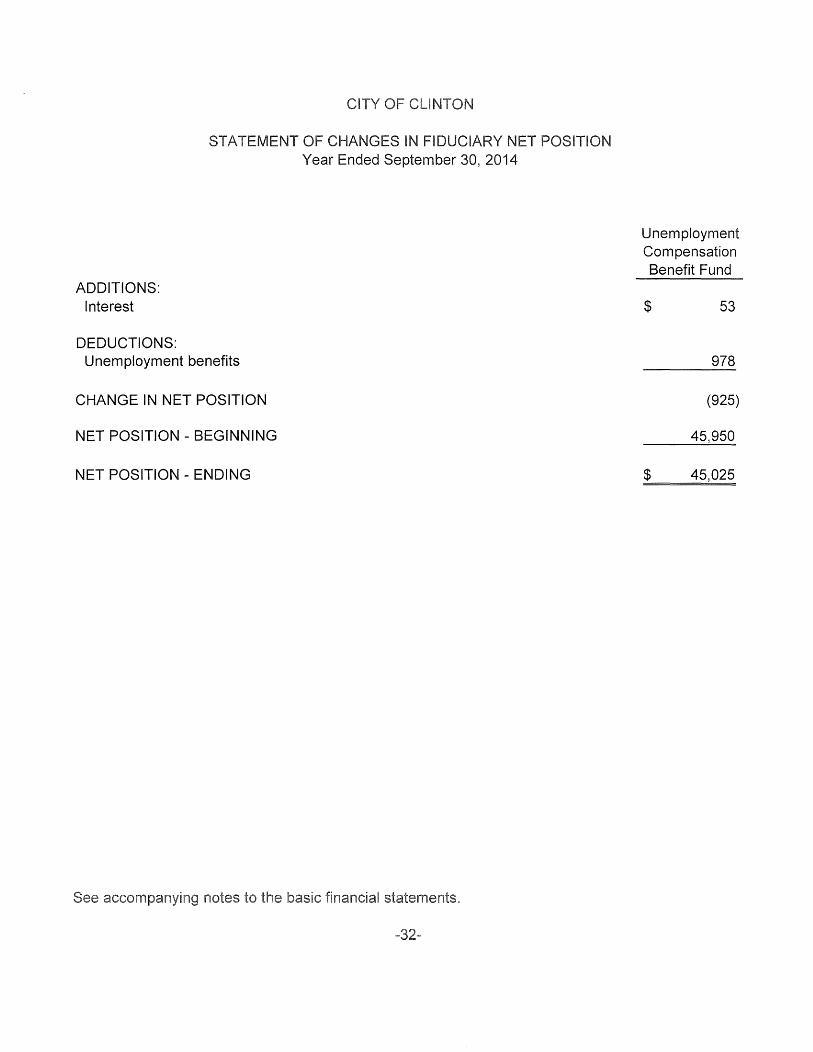
ADDITIONS: Interest
DEDUCTIONS: Unemployment benefits
CHANGE IN NET POSITION
NET POSITION - BEGINNING
NET POSITION - ENDING
OF CHANGES IN FIDUCIARY NET Year Ended September 30, 2014
Unemployment Compensation Benefit Fund
$ 53
978
(925)
45,950
$ 45,025
NOTE 1.
BASIC NANCIAL STATEMENTS September 30, 2014
SUMMARY OF SIGNIFICANT ACCOUNTING POLICIES
The City of Clinton, Mississippi (the City) is incorporated under the laws of the State of Mississippi and operates as a code charter municipality. The City is governed by a mayor and a board of seven aldermen, all of whom are elected to four-year terms by the City's registered voters.
The City complies with accounting principles generally accepted in the United States of America (GAAP), which includes all relevant Governmental Accounting Standards Board (GASB) pronouncements. The accounting and reporting framework and the more significant accounting policies are discussed in subsequent subsections of this note.
A. REPORTING ENTITY
In evaluating how to define the City, for financial reporting purposes, management has considered all potential component units. The decision to include or exclude a potential component unit in the reporting entity was made by applying the criteria set forth in GAAP. The criteria includes how the budget is adopted, whether debt is secured by general obligations of the City, the City's duty to cover any deficits that may occur, and supervision over the accounting functions. Based upon the application of these criteria, the Clinton Public School District is excluded from the City's reporting entity.
1. SUMMARY SIGNIFICANT ACCOUNTING - Continued
B. BASIS OF PRESENTATION
Government-wide Financial Statements:
The Statement of Net Position and the Statement of Activities display information about the reporting government as a whole. They include all funds of the reporting entity except for fiduciary funds. The statements distinguish between governmental and business-type activities. Governmental activities generally are financed through taxes, intergovernmental revenues, and other nonexchange revenues. Business-type activities are financed in whole or in part by fees charged to external parties for goods or services. Internal services fund activity is eliminated to avoid reporting the revenues and expenses twice, and other internal activity between funds has also been eliminated.
Program revenues include charges for goods and services provided by a given function and grants and contributions restricted to meeting the operational or capital requirements of a particular function. General revenues include taxes and any sources of revenue that are not reported as program revenues.
Fund Financial Statements:
Fund financial statements of the reporting entity are organized into funds, each of which is considered to be a separate accounting entity. Each fund is accounted for by providing a separate set of self-balancing accounts. Funds are organized into three major categories: governmental, proprietary, and fiduciary. An emphasis is placed on major funds within the governmental and proprietary categories. A fund is considered major if it is the primary operating fund of the City, is considered particularly important to users, or meets the following criteria:
a. Total assets plus deferred outflows of resources, liabilities plus deferred inflows of resources, revenues, or expenditures/expenses of that individual governmental or enterprise fund are at least 10 percent the corresponding for funds that category or
and
b. resources, revenues or
1. SUMMARY SIGNIFICA~T ACCOUNTING - Continued
B. BASIS OF PRESENTATION - Continued
The funds of the financial reporting entity are described below:
Governmental Funds
General Fund
The General Fund is the primary operating fund of the City and is used to account for all activities except those which are legally or administratively required to be accounted for in other funds.
Special Revenue Funds
Special revenue funds are used to account for the proceeds of specific revenue sources that are legally restricted or committed to expenditures for certain purposes.
Debt Service Funds
Debt service funds account for the accumulation of financial resources for the payment of interest and principal on the general long-term debt of the city other than debt service payments made by enterprise funds.
Capital Project Funds
Capital project funds are used to account for resources restricted for the acquisition of specific capital projects other than those financed by enterprise funds.
Proprietary Funds
Enterprise Funds
funds are used to account for business-like activities provided general public. activities are Tin•:lnl"'C>f'I
to
1. SUMMARY OF SIGNIFICANT ACCOUNTING - Continued
B. BASIS OF PRESENTATION - Continued
Internal Service Fund
The internal service fund is used to account for services provided to other funds of the City on a cost reimbursement basis.
Fiduciary Fund (Not included in government-wide statements)
Trust Fund
The trust fund accounts for assets held by the City in a trustee capacity.
Major and Nonmajor Funds
The funds are further classified as major or nonmajor as follows:
Major Funds:
GENERAL FUND
CAPITAL PROJECT FUND:
Pinehaven Drive Construction Project Fund
Brief Description
Accounts for resources traditionally associated with government which are not required legally or by sound financial management to be accounted for in another fund.
Accounts for the proceeds of a Federal grant being used for the construction of street improvements. This fund was previously called North side
1. SUMMARY SIGNIFICANT ACCOUNTING - Continued
B. BASIS OF PRESENTATION - Continued
Brief Description
PROPRIETARY FUNDS:
Water and Sewer Operations Accounts for the provision of water and Fund sewer services.
Garbage Collection Fund Accounts for the provision of refuse collection services.
Nonmajor Funds:
SPECIAL REVENUE FUNDS:
Tourism Tax Fund
Special Law Enforcement Fund
DEBT SERVICE FUNDS:
G.O. Series 2013 Bond and Interest Fund
Infrastructure Bond
Accounts for revenues from a 2% tax imposed on hotel and motel room rentals within the city limits. These funds must be used to promote tourism and economic development.
Accounts for law enforcement grants and drug seizure property. The city receives a share of property seized when its policemen participate in a drug seizure. These funds must be used to augment existing law enforcement budgets. ,
Temporarily used to hold funds related to a 2013 general obligation refunding bond issue.
Accumulates funds payment of a general obligation issue - Series
2
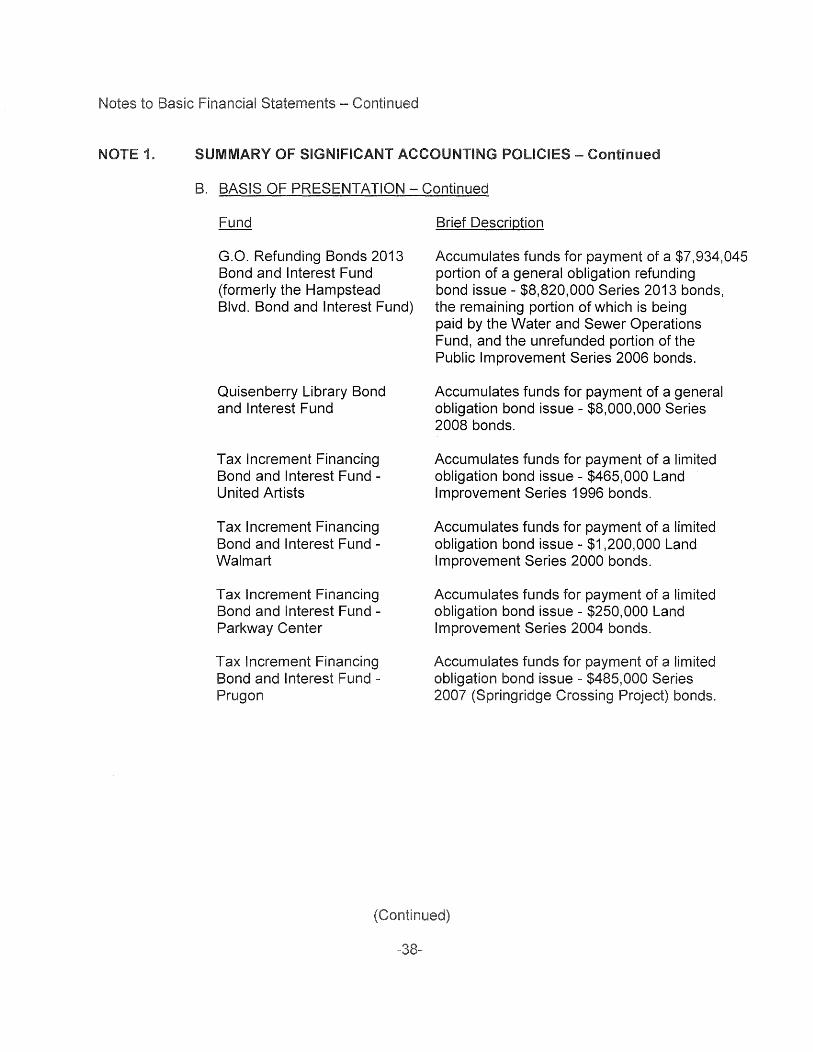
NOTE 1. SUMMARY OF SIGNIFICANT ACCOUNTING POLICIES - Continued
B. BASIS OF PRESENTATION - Continued
G.O. Refunding Bonds 2013 Bond and Interest Fund (formerly the Hampstead Blvd. Bond and Interest Fund)
Quisenberry Library Bond and Interest Fund
Tax Increment Financing Bond and Interest Fund -United Artists
Tax Increment Financing Bond and Interest Fund -Wal mart
Tax Increment Financing Bond and Interest Fund -Parkway Center
Tax Increment Financing Bond and Interest Fund -Prugon
Brief Description
Accumulates funds for payment of a $7,934,045 portion of a general obligation refunding bond issue - $8,820,000 Series 2013 bonds, the remaining portion of which is being paid by the Water and Sewer Operations Fund, and the unrefunded portion of the Public Improvement Series 2006 bonds.
Accumulates funds for payment of a general obligation bond issue - $8,000,000 Series 2008 bonds.
Accumulates funds for payment of a limited obligation bond issue - $465,000 Land Improvement Series 1996 bonds.
Accumulates funds for payment of a limited obligation bond issue - $1,200,000 Land Improvement Series 2000 bonds.
Accumulates funds for payment of a limited obligation bond issue - $250,000 Land Improvement Series 2004 bonds.
Accumulates funds for payment of a limited obligation bond issue - $485,000 Series 2007 (Springridge Crossing Project) bonds.
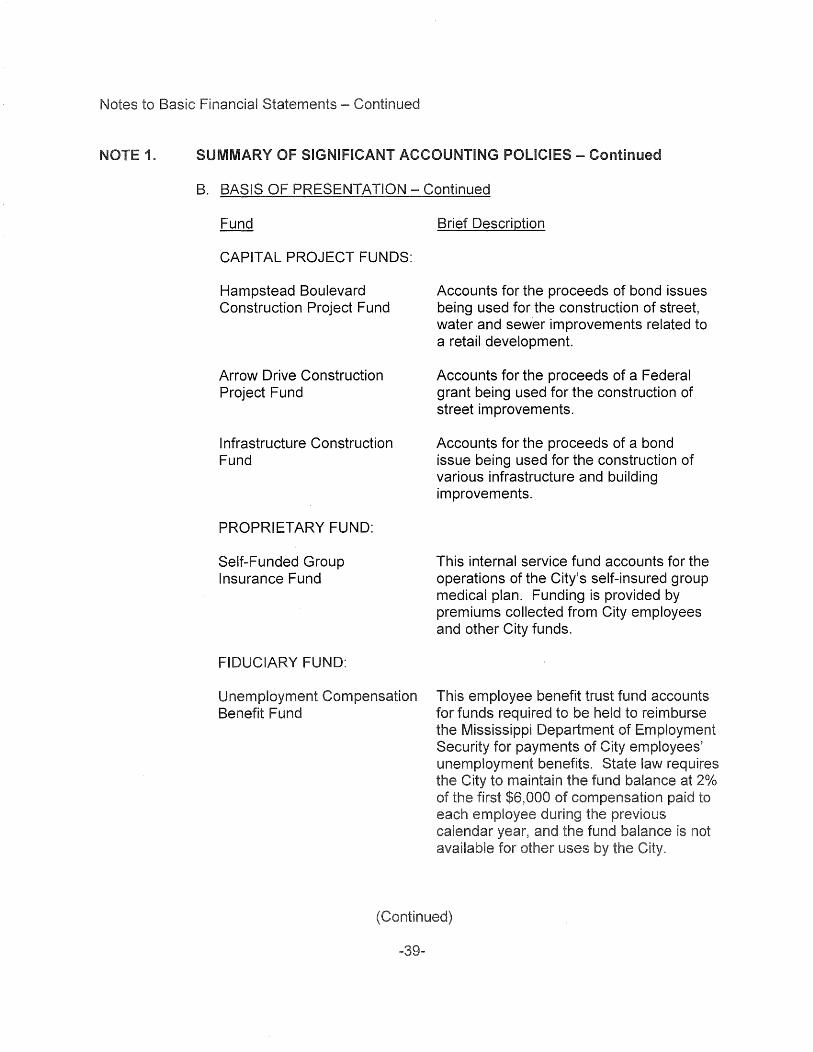
NOTE 1. SUMMARY OF SIGNIFICANT ACCOUNTING POLICIES - Continued
B. BASIS OF PRESENTATION - Continued
CAPITAL PROJECT FUNDS:
Hampstead Boulevard Construction Project Fund
Arrow Drive Construction Project Fund
Infrastructure Construction Fund
PROPRIETARY FUND:
Self-Funded Group Insurance Fund
FIDUCIARY FUND:
Unemployment Compensation Benefit Fund
Brief Description
Accounts for the proceeds of bond issues being used for the construction of street, water and sewer improvements related to a retail development.
Accounts for the proceeds of a Federal grant being used for the construction of street improvements.
Accounts for the proceeds of a bond issue being used for the construction of various infrastructure and building improvements.
This internal service fund accounts for the operations of the City's self-insured group medical plan. Funding is provided by premiums collected from City employees and other City funds.
This employee benefit trust fund accounts for funds required to be held to reimburse the Mississippi Department of Employment Security for payments City employees' unemployment benefits. State law requires the maintain fund balance at 2%
$6,000
to
NOTE 1. SUMMARY OF SIGNIFICANT ACCOUNTING POLICIES - Continued
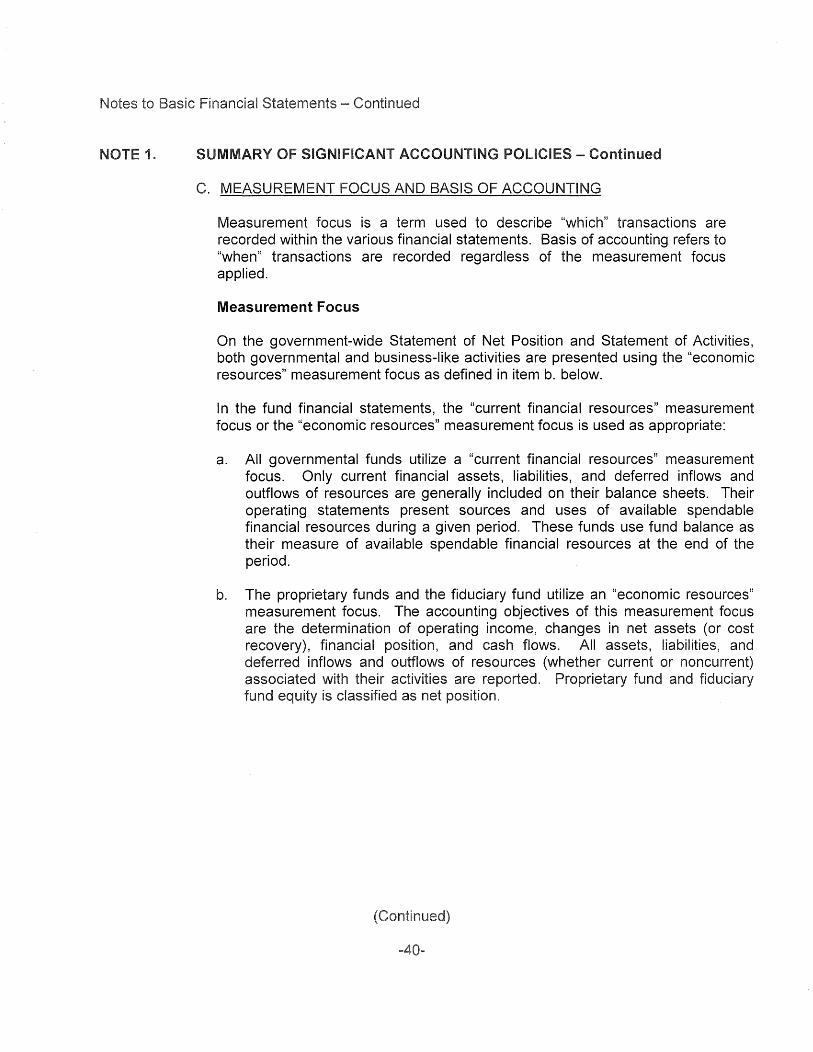
C. MEASUREMENT FOCUS AND BASIS OF ACCOUNTING
Measurement focus is a term used to describe "which" transactions are recorded within the various financial statements. Basis of accounting refers to "when" transactions are recorded regardless of the measurement focus applied.
Measurement Focus
On the government-wide Statement of Net Position and Statement of Activities, both governmental and business-like activities are presented using the "economic resources" measurement focus as defined in item b. below.
In the fund financial statements, the "current financial resources" measurement focus or the "economic resources" measurement focus is used as appropriate:
a. All governmental funds utilize a "current financial resources" measurement focus. Only current financial assets, liabilities, and deferred inflows and outflows of resources are generally included on their balance sheets. Their operating statements present sources and uses of available spendable financial resources during a given period. These funds use fund balance as their measure of available spendable financial resources at the end of the period.
b. The proprietary funds and the fiduciary fund utilize an "economic resources" measurement focus. The accounting objectives of this measurement focus are the determination of operating income, changes in net assets (or cost recovery), financial position, and cash flows. All assets, liabilities, and deferred inflows and outflows of resources (whether current or noncurrent) associated with their activities are reported. Proprietary fund and fiduciary fund equity is classified as net position.
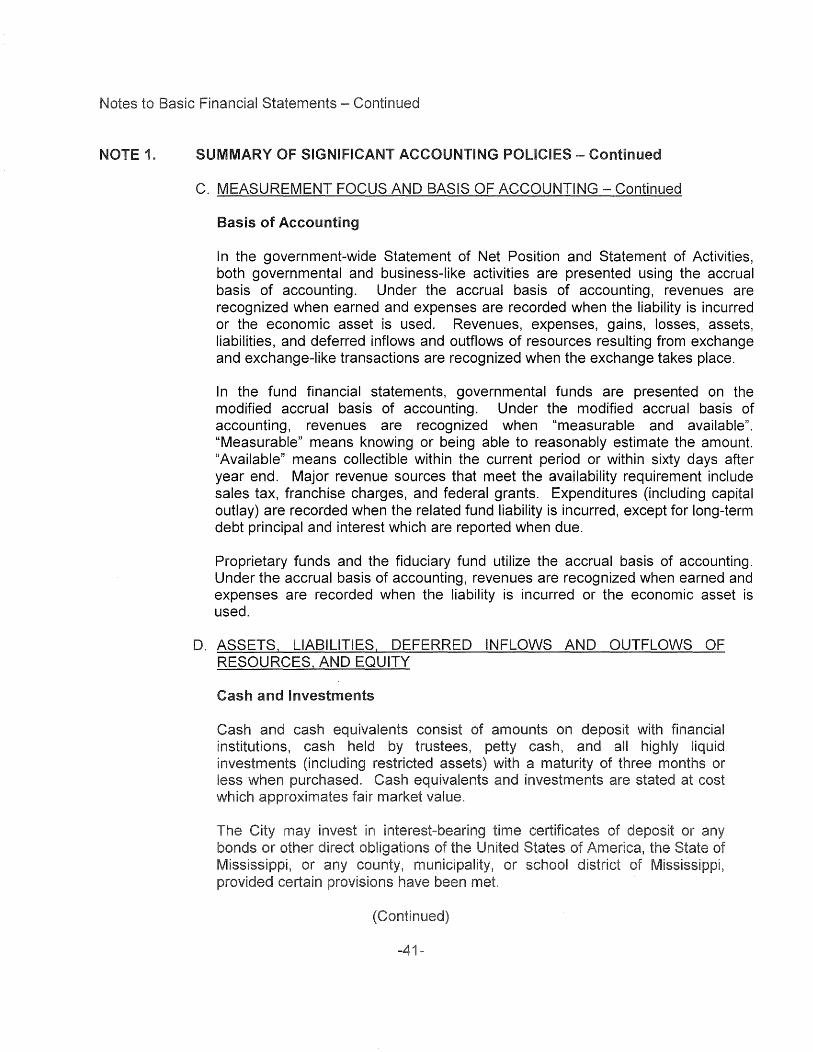
NOTE 1. SUMMARY OF SIGNIFICANT ACCOUNTING POLICIES - Continued
C. MEASUREMENT FOCUS AND BASIS OF ACCOUNTING - Continued
Basis of Accounting
In the government-wide Statement of Net Position and Statement of Activities, both governmental and business-like activities are presented using the accrual basis of accounting. Under the accrual basis of accounting, revenues are recognized when earned and expenses are recorded when the liability is incurred or the economic asset is used. Revenues, expenses, gains, losses, assets, liabilities, and deferred inflows and outflows of resources resulting from exchange and exchange-like transactions are recognized when the exchange takes place.
In the fund financial statements, governmental funds are presented on the modified accrual basis of accounting. Under the modified accrual basis of accounting, revenues are recognized when "measurable and available". "Measurable" means knowing or being able to reasonably estimate the amount. "Available" means collectible within the current period or within sixty days after year end. Major revenue sources that meet the availability requirement include sales tax, franchise charges, and federal grants. Expenditures (including capital outlay) are recorded when the related fund liability is incurred, except for long-term debt principal and interest which are reported when due.
Proprietary funds and the fiduciary fund utilize the accrual basis of accounting. Under the accrual basis of accounting, revenues are recognized when earned and expenses are recorded when the liability is incurred or the economic asset is used.
D. ASSETS, LIABILITIES, DEFERRED INFLOWS AND OUTFLOWS OF RESOURCES, AND EQUITY
Cash and Investments
Cash and cash equivalents consist of amounts on deposit with financial institutions, cash held by trustees, petty cash, and all highly liquid investments (including restricted assets) a maturity three months or less when purchased. Cash equivalents and investments are stated at cost
to
NOTE 1. SUMMARY OF SIGNIFICANT ACCOUNTING POLICIES - Continued
D. ASSETS, LIABILITIES, DEFERRED tNFLOWS AND OUTFLOWS OF RESOURCES, AND EQUITY - Continued
lnterfund Receivables and Payables
During the course of operations, numerous transactions occur between individual funds that may result in amounts owed between funds. Long-term interfund loans (noncurrent portion) are reported as "advances from/to other funds." All other outstanding balances between funds are reported as "due to/from other funds". lnterfund receivables and payables between funds within governmental activities are eliminated in the Statement of Net Position. Any balances outstanding between the governmental activities and businesstype activities are reported in the government-wide financial statements as "internal balances".
Receivables
In the government-wide statements, receivables consist of all revenues earned at year-end and not yet received. Allowances for uncollectible accounts receivable are based upon historical trends and the periodic aging of accounts receivable. Major receivable balances for the governmental activities include property taxes, sales taxes, franchise taxes, and grants. Business-type activities report utility and garbage collection earnings as their major receivables.
In the fund financial statements, material receivables in governmental funds include revenue accruals such as sales tax, franchise tax, and grants and other similar intergovernmental revenues since they are usually both measurable and available. Proprietary fund material receivables consist of all revenues earned at year-end and not yet received. Utility and garbage collection accounts receivable compose the majority of proprietary fund receivables. Allowances for uncollectible accounts receivable are based upon historical trends and the periodic aging of accounts receivable.
Statements -
1. SUMMARY OF SIGNIFICANT ACCOUNTING POLICIES - Continued
ASSETS, LIABILITIES, DEFERRED INFLOWS AND OUTFLOWS OF RESOURCES, AND EQUITY - Continued
Capital Assets
The accounting treatment of property, plant, equipment, and intangible assets (capital assets) depends on whether the assets are used in governmental fund operations or proprietary fund operations and whether they are reported in the government-wide or fund financial statements.
Government-wide Statements
In the government-wide financial statements, all capital assets are valued at historical cost, or estimated historical cost if actual cost is unavailable, except for donated capital assets which are recorded at their estimated fair value at the date of donation. The City began using a capitalization threshold of $5,000 for the year ended September 30, 2006, and used a capitalization threshold of $500 for previous years.
Prior to October 1, 2002, governmental funds' infrastructure assets were not capitalized. These assets have been valued at estimated historical cost.
Depreciation of all exhaustible capital assets is recorded as an expense in the Statement of Activities, with accumulated depreciation reflected in the Statement of Net Position. Depreciation is provided over the assets' estimated useful lives using the straight-line method of depreciation. The range of estimated useful lives by type of asset is as follows:
Buildings Improvements Machinery and Equipment Utility System Infrastructure
20-50 years 5-50 years 3-15 years
10-50 years 10-40 years
1. SUMMARY OF SIGNIFICANT ACCOUNTING POLICIES - Continued
D. ASSETS, LIABILITIES, DEFERRED INFLOWS AND OUTFLOWS OF RESOURCES, AND EQUITY - Continued
Fund Financial Statements
In the fund financial statements, capital assets used in governmental fund operations are accounted for as capital outlay expenditures of the governmental fund upon acquisition. Capital assets used in proprietary fund operations are accounted for the same as in the government-wide statements.
Restricted Assets
Certain customer utility deposits and fees charged for replacement of capital assets are classified as restricted assets on the balance sheet because their use is limited. When both restricted and unrestricted resources are available for use, it is the City's policy to use restricted resources first, and then unrestricted resources as they are needed.
Bond Discounts and Premiums
In the government-wide and proprietary fund financial statements, bond discounts and premiums are deferred and amortized as interest over the terms of the bonds. Unamortized discounts and premiums are combined with bonds payable in the financial statements.
long-Term Debt
The accounting treatment of long-term debt depends on whether the assets are used in governmental fund operations or proprietary fund operations and whether they are reported in the government-wide or fund financial statements.
All long-term debt to be repaid from governmental and business-type resources is reported as liabilities in the government-wide statements. The long-term debt consists primarily bonds and notes payable, capital
obligations, absences, net
1. SUMMARY OF SIGNIFICANT ACCOUNTING POLICIES - Continued
ASSETS, LIABILITIES, DEFERRED INFLOWS AND OUTFLOWS OF RESOURCES, AND EQUITY - Continued
Long-term debt for governmental funds is not reported as liabilities in the fund financial statements. The debt proceeds are reported as other financing sources and payments of principal and interest are reported as expenditures. The accounting for proprietary funds is the same in the fund statements as it is in the government-wide statements.
Compensated Absences
The City's policies regarding vacation time permit employees to accumulate earned but unused vacation leave, subject to certain limitations. The liability for these compensated absences is recorded as long-term debt in the government-wide statements. The current portion of this debt is estimated based on historical trends. In the fund financial statements, governmental funds report only the compensated absence liability that has matured, for example, as a result of employee resignations and retirements, while the proprietary funds report the liability as it is incurred.
Deferred Inflows and Outflows of Resources
In addition to assets, the statement of net position will sometimes report a separate section for deferred outflows of resources. This separate financial statement element, deferred outflows of resources, represents a consumption of net position that applies to a future period and so will not be recognized as an outflow of resources (expense/expenditure) until then. The government-wide statements report a deferred refunding charge for the difference between the balance of the refunded debt and the amount paid to the refunded debt escrow agents, and the deferred charge is amortized over the life of the debt.
In addition to liabilities, the statement of net position will sometimes report a separate section for deferred inflows of resources. This separate financial statement element, deferred inflows resources, represents an acquisition of net position that applies to a period and so will not
as an inflow
1. SUMMARY SIGNIFICANT ACCOUNTING POLICIES - Continued
D. ASSETS, LIABILITIES, DEFERRED INFLOWS AND OUTFLOWS OF RESOURCES, AND EQUITY - Continued
Equity Classifications
Government-wide Statements
Equity is classified as net position and displayed in three components:
a. Net investment in capital assets - Consists of capital assets net of accumulated depreciation and reduced by the outstanding balances of any bonds, mortgages, notes, other borrowings, and related deferred outflows of resources that are attributable to the acquisition, construction, or improvement of those assets.
b. Restricted net position - Consists of net position amounts with constraints placed on their use either by (1) external groups such as creditors, grantors, contributors, or laws or regulations of other governments; or (2) law through constitutional provisions or enabling legislation.
c. Unrestricted net position - All other net position amounts that do not meet the definition of "restricted" or "net investment in capital assets."
Fund Statements
Governmental fund equity is classified as fund balance. Proprietary fund and fiduciary fund equity is classified the same as in the government-wide statements.
The governmental fund financial statements present fund balances based on the extent of the constraints on their use as follows:
a) Nonspendable fund balance - Consists of amounts that cannot be spent because they are either (1) in spendable form or (2) are legally or contractually required to be maintained
1. SUMMARY OF SIGNIFICANT ACCOUNTING POLICIES - Continued
D. ASSETS, LIABILITIES, DEFERRED INFLOWS AND OUTFLOWS OF RESOURCES, AND EQUITY - Continued
c) Committed fund balance - Consists of amounts that can be used only for specific purposes pursuant to constraints imposed by the adoption of an ordinance by the City's Mayor and Board of Aldermen. Once adopted, the limitation imposed by the ordinance remains in place until a similar action is taken to remove or revise the limitation.
d) Assigned fund balance - Consists of amounts that are constrained by the City's intent to use them for a specific purpose but that are neither restricted nor committed. Intent can be expressed by the City Clerk, to whom the Mayor and Board of Aldermen have delegated the authority. The Mayor and Board of Aldermen may also assign fund balance as it does when appropriating fund balance to cover a gap between estimated revenue and appropriations in the subsequent year's appropriated budget. Unlike commitments, assignments generally only exist temporarily. In other words, an additional action does not normally have to be taken for the removal of an assignment. Conversely, as discussed above, an additional action is essential to either remove or revise a commitment.
e) Unassigned fund balance - Consists of the residual fund balance for the General Fund, which is the only fund that can have a positive unassigned fund balance. However, other governmental funds may have a negative unassigned fund balance if restricted and committed amounts exceed the total fund balance.
The City utilizes restricted fund balances first, followed by committed fund balances and then assigned fund balances when they are available to use for the same purpose.
NOTE 1. SUMMARY OF SIGNIFICANT ACCOUNTING POLICIES - Continued
REVENUES, EXPENDITURES AND EXPENSES - Continued
Grant Revenues
Revenues from federal, state, and other grants, the purpose of which is to fund specific City expenditures, are recognized at the time of the specific expenditure.
Operating Revenues and Expenses
Operating revenues and expenses for proprietary funds are those that result from providing services and producing and delivering goods and/or services. It also includes all revenue and expenses not related to capital and related financing, noncapital financing, or investing activities.
Expenditures/Expenses
In the government-wide financial statements, expenses are classified by function for both governmental and business-type activities.
In the fund financial statements, expenditures are classified as follows:
Governmental Funds - By Character: Current (further classified by function) Debt Service Capital Outlay
Proprietary Fund - By Operating and Nonoperating
In the fund financial statements, governmental funds report expenditures of financial resources. Proprietary funds report expenses relating to the use of economic resources.
lnterfund Transfers
1.
NOTE 2.
Statements -
SUMMARY SIGNIFICANT ACCOUNTING POLICIES - Continued
F. ESTIMATES
The preparation of financial statements in conformity with accounting principles generally accepted in the United States of America requires management to make estimates and assumptions that affect the reported amounts of assets, liabilities and deferred inflows and outflows of resources and disclosure of contingent assets and liabilities at the date of the financial statements and the reported amounts of revenues and expenses during the reporting period. Actual results could differ from those estimates.
STEWARDSHIP, COMPLIANCE, AND ACCOUNTABILITY
A. BUDGETS
The City prepares a budget for each of its funds, and the budgets provide details by department and purpose. In September, the proposed budgets are presented to the Mayor and Board of Aldermen for review. The Board of Aldermen hold public hearings and may add to, subtract from, or change appropriations, but may not change the form of the budgets. Any changes in the budgets must be within the revenues and reserves estimated as available by the accounting department. The budgets must be adopted on or before September 15th.
Mississippi law requires that municipalities budget on a modified-cash basis. Claims that have been incurred prior to the end of the year and are paid within 30 days after the end of the year are recorded in the year for which they were budgeted. Prior year claims that are paid more than 30 days after the end of the year are reflected as expenditures of the year in which they were paid. All revenue is accounted for under the cash basis. The required budgetary basis is therefore not considered to be in accordance with U.S. generally accepted accounting principles.
Expenditures other than capital outlay, election, and emergency expenditures may not legally exceed budgeted appropriations at the purpose level (e.g., personal services, supplies, other services and charges, and
to
- Continued
B. TAX LEVIES
The City levies taxes based on 15% of fair value for real and personal property except for single-family owner-occupied dwellings which are taxed based on 10% of fair value and motor vehicles and public utilities which are taxed based on 30% of fair value.
Annual tax increases for all purposes except payment of general obligation bonds and interest and funding of the Disability and Relief Fund are limited by state law to 10% of certain preceding years' receipts plus taxes on newly constructed and other properties added to the tax rolls.
Limitations are imposed on the amount of bonded and floating debt that may be issued based upon assessed valuation of properties.
Real property, personal property (excluding vehicle taxes, which have tax due dates based on the original date of vehicle registration), and public utility taxes are due on or before February 1. The City has an agreement with Hinds County whereby the County collects these ad valorem taxes for both the City and the Clinton Public School District. The agreement allows the County to retain 3% of the gross collections as a commission up to a maximum of $25,000 annually. The agreement is renewed automatically on an annual basis, unless terminated by either party. The County continues to collect motor vehicle ad valorem taxes for the City and School District, retaining 5% of the gross collections as a commission. Taxes collected by the County for the School District are distributed by the County directly to the School District.
C. DEFICIT FUND EQUITY
The Self-Funded Group Insurance Fund had a deficit fund equity of $364,877 as of September 30, 2014. The City intends to adjust the future premium rates charged to City employees and other City funds in order to alleviate the deficit fund equity.
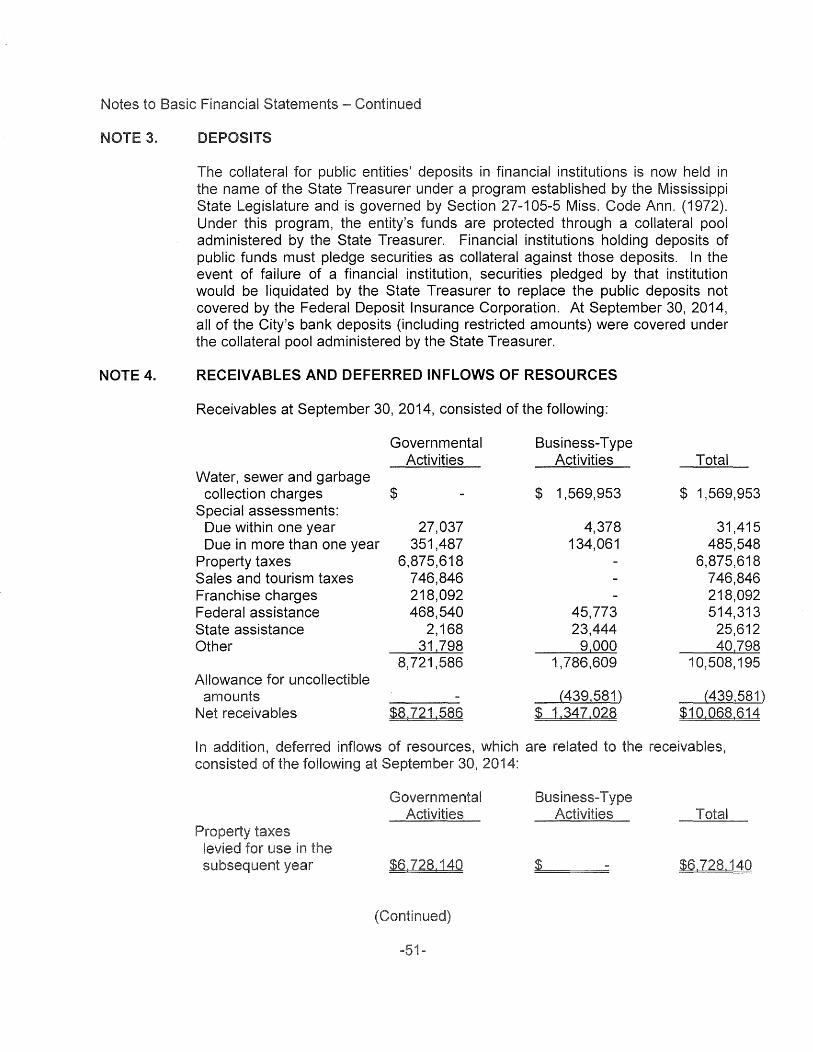
NOTE 4.
DEPOSITS
The collateral for public entities' deposits in financial institutions is now held in the name of the State Treasurer under a program established by the Mississippi State Legislature and is governed by Section 27-105-5 Miss. Code Ann. (1972). Under this program, the entity's funds are protected through a collateral pool administered by the State Treasurer. Financial institutions holding deposits of public funds must pledge securities as collateral against those deposits. In the event of failure of a financial institution, securities pledged by that institution would be liquidated by the State Treasurer to replace the public deposits not covered by the Federal Deposit Insurance Corporation. At September 30, 2014, all of the City's bank deposits (including restricted amounts) were covered under the collateral pool administered by the State Treasurer.
RECEIVABLES AND DEFERRED INFLOWS OF RESOURCES
Receivables at September 30, 2014, consisted of the following:
Governmental Business-Type Activities Activities Total
Water, sewer and garbage collection charges $ $ 1,569,953 $ 1,569,953
Special assessments: Due within one year 27,037 4,378 31,415 Due in more than one year 351,487 134,061 485,548
Property taxes 6,875,618 6,875,618 Sales and tourism taxes 746,846 746,846 Franchise charges 218,092 218,092 Federal assistance 468,540 45,773 514,313 State assistance 2,168 23,444 25,612 Other 312798 92000 40 798
8,721,586 1,786,609 10,508, 195 Allowance for uncollectible
amounts (4391581) (4392581) Net receivables $8,721,586 $ 1,347,028 $10,068,614
In addition, deferred inflows resources, which are related receivables, consisted of the following September
$
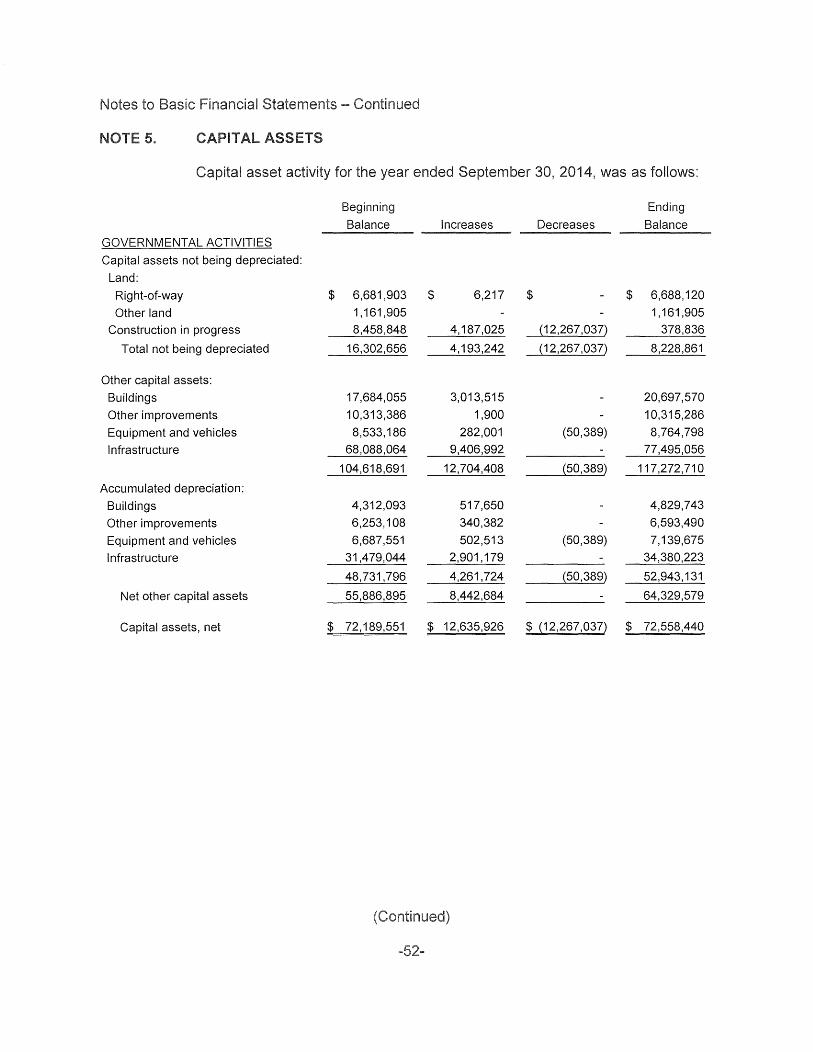
Capital asset activity for the year ended September 30, 2014, was as follows:
Beginning Ending
Balance Increases Decreases Balance
GOVERNMENTAL ACTIVITIES
Capital assets not being depreciated:
Land:
Right-of-way $ 6,681,903 $ 6,217 $ $ 6,688,120
Other land 1,161,905 1,161,905
Construction in progress 8,458,848 4, 187,025 {12,267,037) 378,836
Total not being depreciated 16,302,656 4,193,242 {12,267,037) 8,228,861
Other capital assets:
Buildings 17,684,055 3,013,515 20,697,570
Other improvements 10,313,386 1,900 10,315,286
Equipment and vehicles 8,533, 186 282,001 (50,389) 8,764,798
Infrastructure 68,088,064 9,406,992 77,495,056
104,618,691 12,704,408 {50,389) 117,272,710
Accumulated depreciation:
Buildings 4,312,093 517,650 4,829,743
Other improvements 6,253,108 340,382 6,593,490
Equipment and vehicles 6,687,551 502,513 (50,389) 7,139,675
Infrastructure 31,479,044 2,901, 179 34,380,223
48,731,796 4,261,724 {50,389) 52,943,131
Net other capital assets 55,886,895 8,442,684 64,329,579
Capital assets, net $ 72, 189,551 $ 12,635,926 $ {12,267,037) $ 72,558,440
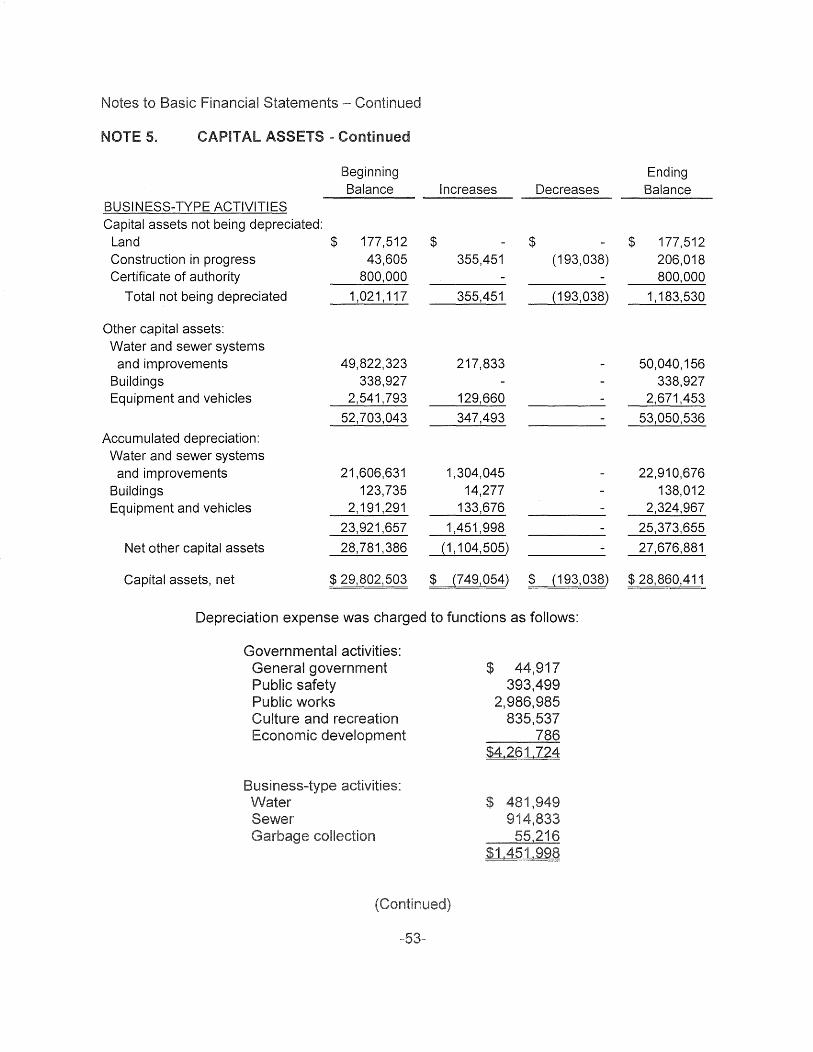
ASSETS = Continued
Beginning Balance Increases Decreases
BUSINESS-TYPE ACTIVITIES Capital assets not being depreciated:
Land $ 177,512 $ $ Construction in progress 43,605 355,451 (193,038) Certificate of authority 800,000
Total not being depreciated 1,021, 117 355,451 (193,038)
Other capital assets: Water and sewer systems
and improvements 49,822,323 217,833 Buildings 338,927 Equipment and vehicles 2,541,793 129,660
52,703,043 347,493
Accumulated depreciation: Water and sewer systems
and improvements 21,606,631 1,304,045 Buildings 123,735 14,277 Equipment and vehicles 2, 191,291 133,676
23,921,657 1,451,998
Net other capital assets 28,781,386 (1, 104,505)
Capital assets, net $ 29, 802, 503 $ (749,054) $ (193,038)
Depreciation expense was charged to functions as follows:
Governmental activities: General government Public safety Public works Culture and recreation Economic development
$ 44,917 393,499
2,986,985 835,537
786 $4,261,724
Ending Balance
$ 177,512 206,018 800,000
1, 183,530
50,040, 156 338,927
2,671,453
53,050,536
22,910,676 138,012
2,324,967
25,373,655
27,676,881
$ 28,860,411
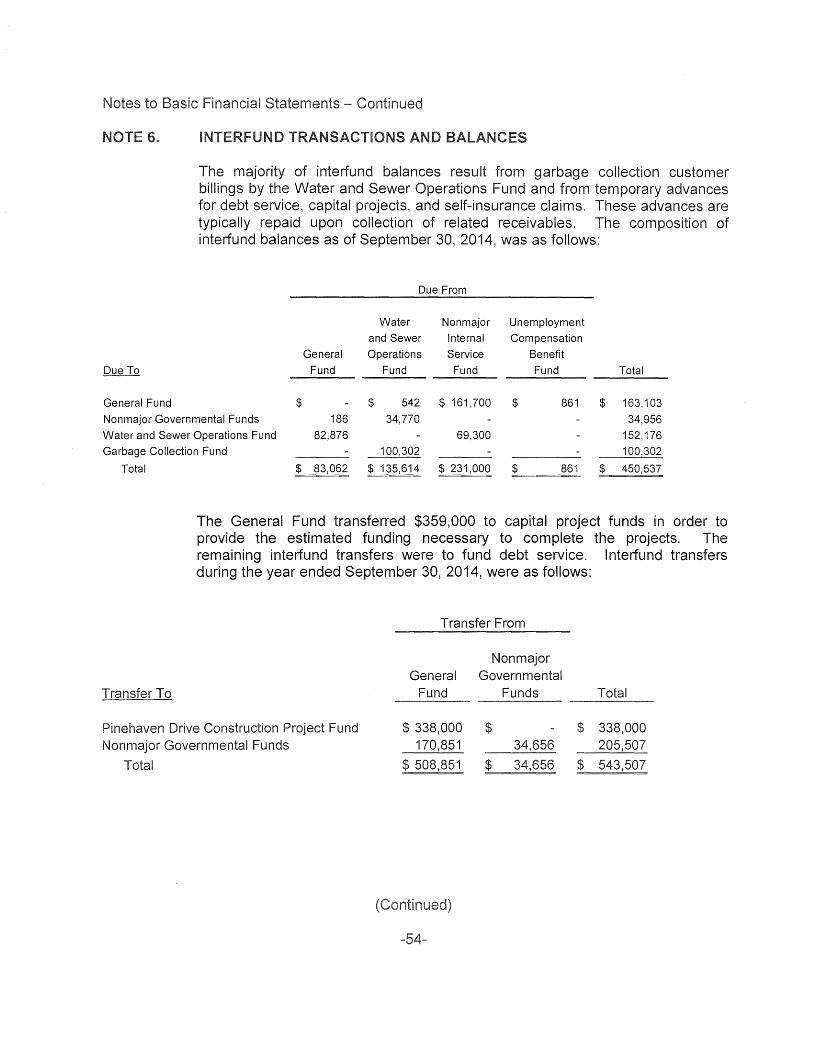
Due To
General Fund
The majority of interfund balances result from garbage collection customer billings by the Water and Sewer Operations Fund and from temporary advances for debt service, capital projects, and self-insurance claims. These advances are typically repaid upon collection of related receivables. The composition of interfund balances as of September 30, 2014, was as follows:
Due From
Water Nonmajor Unemployment
and Sewer Internal Compensation
General Operations Service Benefit
Fund Fund Fund Fund Total
$ $ 542 $ 161,700 $ 861 $ 163,103
Nonmajor Governmental Funds 186 34,770 34,956
Water and Sewer Operations Fund 82,876 69,300 152,176
Garbage Collection Fund 100,302 100,302
Total $ 83,062 $ 135,614 $ 231,000 $ 861 $ 450,537
The General Fund transferred $359,000 to capital project funds in order to provide the estimated funding necessary to complete the projects. The remaining interfund transfers were to fund debt service. lnterfund transfers during the year ended September 30, 2014, were as follows:
Transfer To
Pinehaven Drive Construction Project Fund Nonmajor Governmental Funds
Total
Transfer From
Non major General Governmental
Fund Funds
$ 338,000 $ 170,851 34,656
$ 508,851 $ 34,656
Total
$ 338,000 205,507
$ 543,507
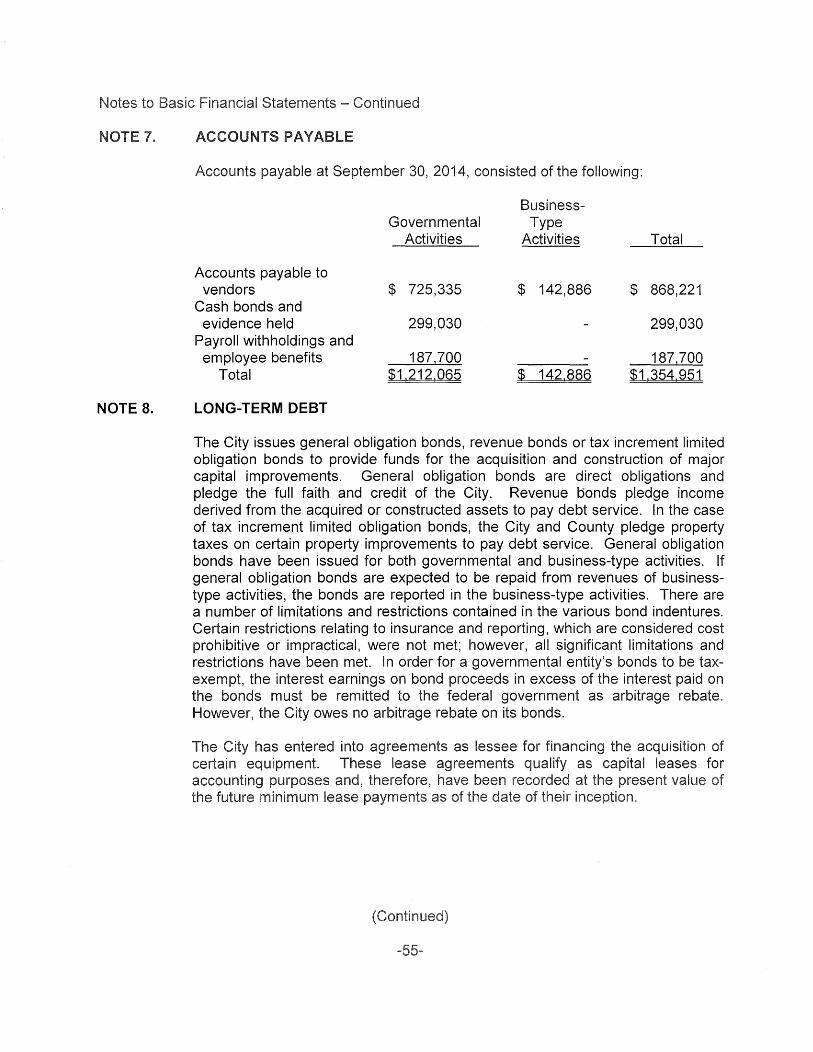
NOTE 8.
Statements -
ACCOUNTS
Accounts payable at September 30, 2014, consisted of the following:
Accounts payable to vendors
Cash bonds and evidence held
Payroll withholdings and employee benefits
Total
LONG-TERM DEBT
Governmental Activities
$ 725,335
299,030
187,700 $1,212,065
BusinessType
Activities
$ 142,886
$ 142,886
Total
$ 868,221
299,030
187,700 $1,354,951
The City issues general obligation bonds, revenue bonds or tax increment limited obligation bonds to provide funds for the acquisition and construction of major capital improvements. General obligation bonds are direct obligations and pledge the full faith and credit of the City. Revenue oonds pledge income derived from the acquired or constructed assets to pay debt service. In the case of tax increment limited obligation bonds, the City and County pledge property taxes on certain property improvements to pay debt service. General obligation bonds have been issued for both governmental and business-type activities. If general obligation bonds are expected to be repaid from revenues of businesstype activities, the bonds are reported in the business-type activities. There are a number of limitations and restrictions contained in the various bond indentures. Certain restrictions relating to insurance and reporting, which are considered cost prohibitive or impractical, were not met; however, all significant limitations and restrictions have been met. In order for a governmental entity's bonds to be taxexempt, the interest earnings on bond proceeds in excess of the interest paid on the bonds must be remitted to the federal government as arbitrage rebate. However, the City owes no arbitrage rebate on its bonds.
The has entered into agreements as lessee for financing the acquisition certain equipment. These lease agreements qualify as capital leases accounting purposes and, therefore, have been recorded the value
as
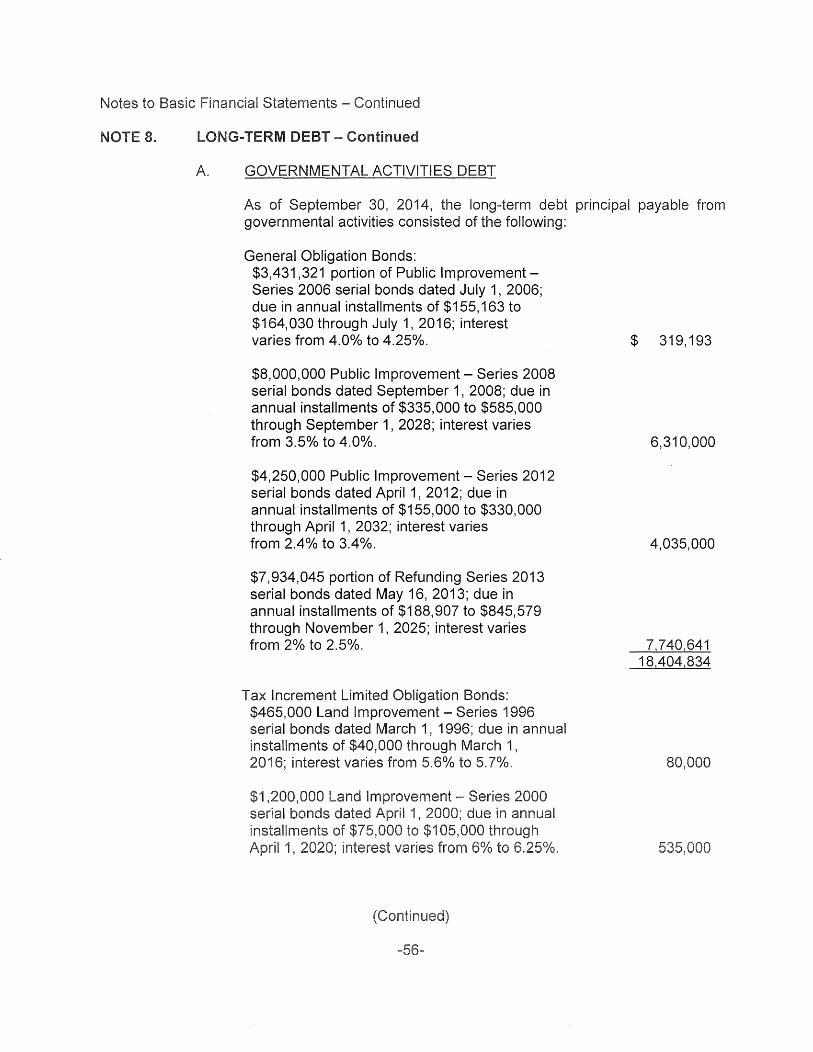
- Continued
A. GOVERNMENTAL ACTIVITIES DEBT
As of September 30, 2014, the long-term debt principal payable from governmental activities consisted of the following:
General Obligation Bonds: $3,431,321 portion of Public Improvement -Series 2006 serial bonds dated July 1, 2006; due in annual installments of $155, 163 to $164,030 through July 1, 2016; interest varies from 4.0% to 4.25%.
$8,000,000 Public Improvement - Series 2008 serial bonds dated September 1, 2008; due in annual installments of $335, 000 to $585, 000 through September 1, 2028; interest varies from 3.5% to 4.0%.
$4,250,000 Public Improvement - Series 2012 serial bonds dated April 1, 2012; due in annual installments of $155,000 to $330,000 through April 1, 2032; interest varies from 2.4% to 3.4%.
$7,934,045 portion of Refunding Series 2013 serial bonds dated May 16, 2013; due in annual installments of $188,907 to $845,579 through November 1, 2025; interest varies from 2% to 2.5%.
Tax Increment Limited Obligation Bonds: $465,000 Land Improvement - Series 1996 serial bonds dated March 1, 1996; due in annual installments of $40,000 through March 1,
6; interest varies from 5.6% to 5.7%.
$ 319,193
6,310,000
4,035,000
7,740,641 18,404,834
80,000
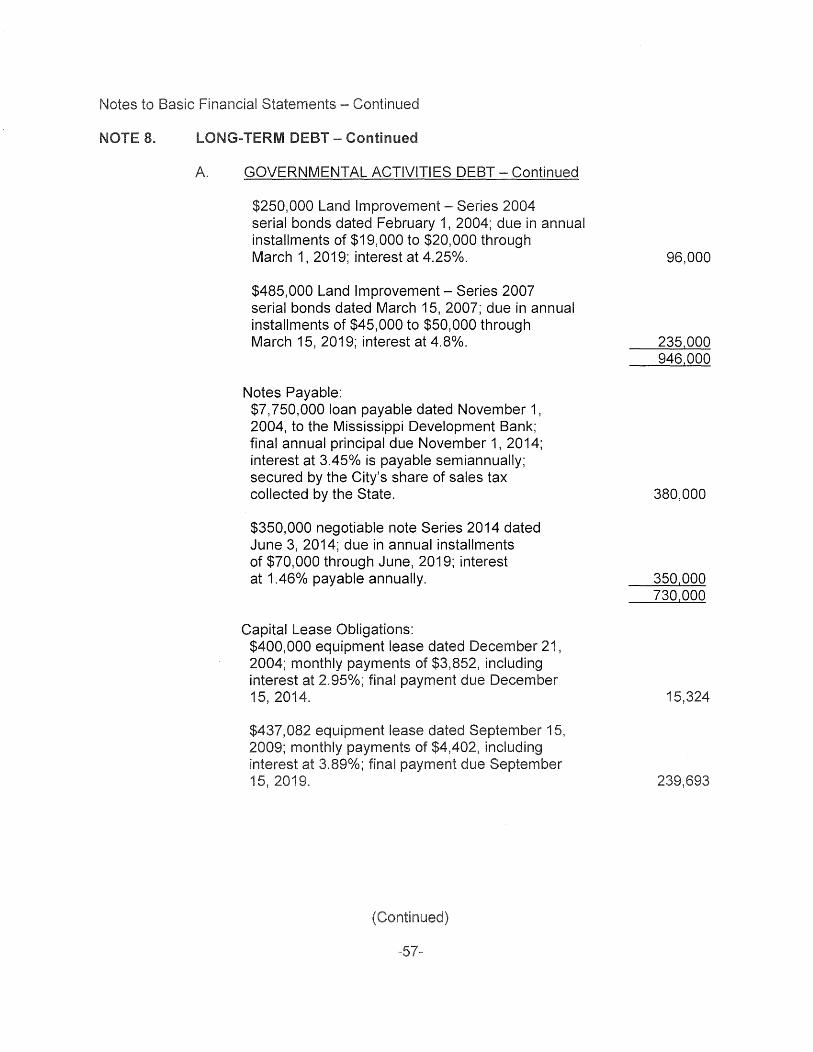
- Continued
A. GOVERNMENTAL ACTIVITIES DEBT - Continued
$250,000 Land Improvement- Series 2004 serial bonds dated February 1, 2004; due in annual installments of $19,000 to $20,000 through March 1, 2019; interest at 4.25%.
$485,000 Land Improvement- Series 2007 serial bonds dated March 15, 2007; due in annual installments of $45,000 to $50,000 through March 15, 2019; interest at 4.8%.
Notes Payable: $7, 750,000 loan payable dated November 1, 2004, to the Mississippi Development Bank; final annual principal due November 1, 2014; interest at 3.45% is payable semiannually; secured by the City's share of sales tax collected by the State.
$350,000 negotiable note Series 2014 dated June 3, 2014; due in annual installments of $70,000 through June, 2019; interest at 1.46% payable annually.
Capital Lease Obligations: $400,000 equipment lease dated December 21, 2004; monthly payments of $3,852, including interest at 2.95%; final payment due December 15, 2014.
$437,082 equipment lease dated September 15, 2009; monthly payments $4,402, including interest at 3.89%; payment due September 15, 9.
96,000
235,000 946,000
380,000
350,000 730,000
15,324
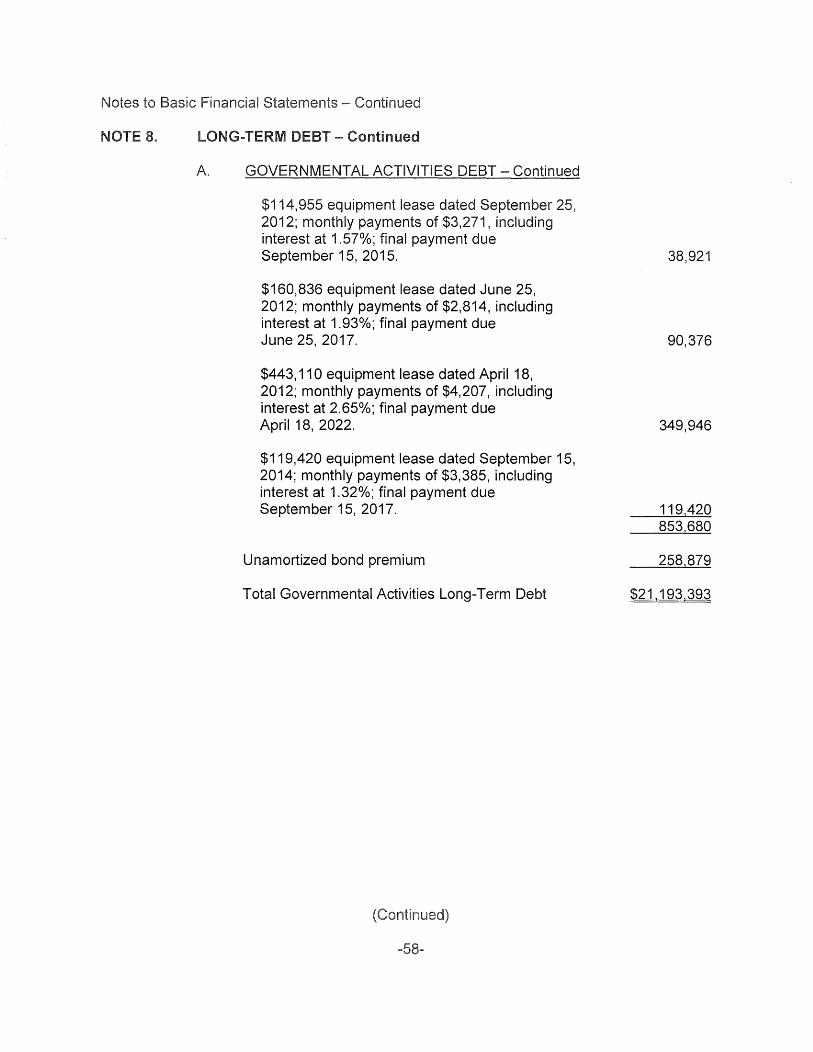
NOTE LONG-TERM DEBT - Continued
A. GOVERNMENTAL ACTIVITIES DEBT - Continued
$114,955 equipment lease dated September 25, 2012; monthly payments of $3,271, including interest at 1.57%; final payment due September 15, 2015.
$160,836 equipment lease dated June 25, 2012; monthly payments of $2,814, including interest at 1.93%; final payment due June 25, 2017.
$443, 110 equipment lease dated April 18, 2012; monthly payments of $4,207, including interest at 2.65%; final payment due April 18, 2022.
$119,420 equipment lease dated September 15, 2014; monthly payments of $3,385, including interest at 1.32%; final payment due September 15, 2017.
Unamortized bond premium
Total Governmental Activities Long-Term Debt
38,921
90,376
349,946
119,420 853,680
258,879
$21, 193,393
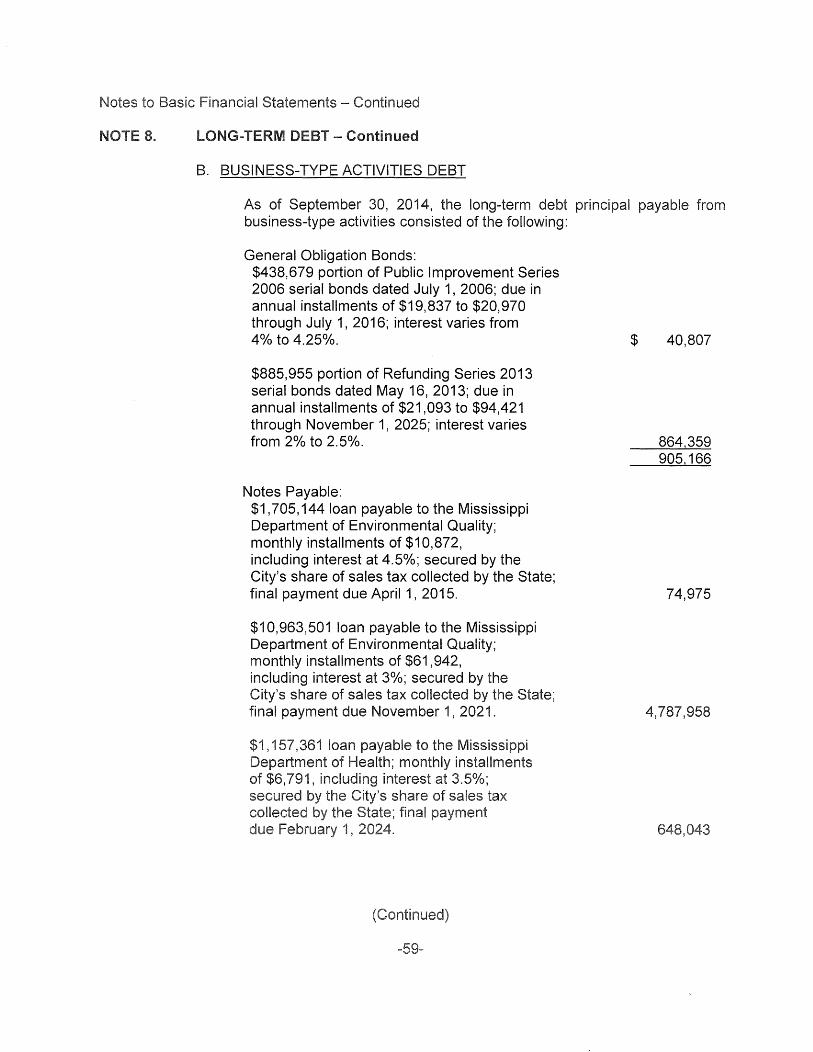
LONG-TERM - Continued
B. BUSINESS-TYPE ACTIVITIES DEBT
As of September 30, 2014, the long-term debt principal payable from business-type activities consisted of the following:
General Obligation Bonds: $438,679 portion of Public Improvement Series 2006 serial bonds dated July 1, 2006; due in annual installments of $19,837 to $20,970 through July 1, 2016; interest varies from 4% to 4.25%.
$885,955 portion of Refunding Series 2013 serial bonds dated May 16, 2013; due in annual installments of $21,093 to $94,421 through November 1, 2025; interest varies from 2% to 2.5%.
Notes Payable: $1,705, 144 loan payable to the Mississippi Department of Environmental Quality; monthly installments of $10,872, including interest at 4.5%; secured by the City's share of sales tax collected by the State; final payment due April 1, 2015.
$10,963,501 loan payable to the Mississippi Department of Environmental Quality; monthly installments of $61,942, including interest at 3%; secured by the City's share of sales tax collected by the State; final payment due November 1, 2021.
$1, 157,361 loan payable to the Mississippi Department of Health; monthly installments
$6,791, including interest at 3.5%; City's sales tax
$ 40,807
864,359 905, 166
74,975
4,787,958
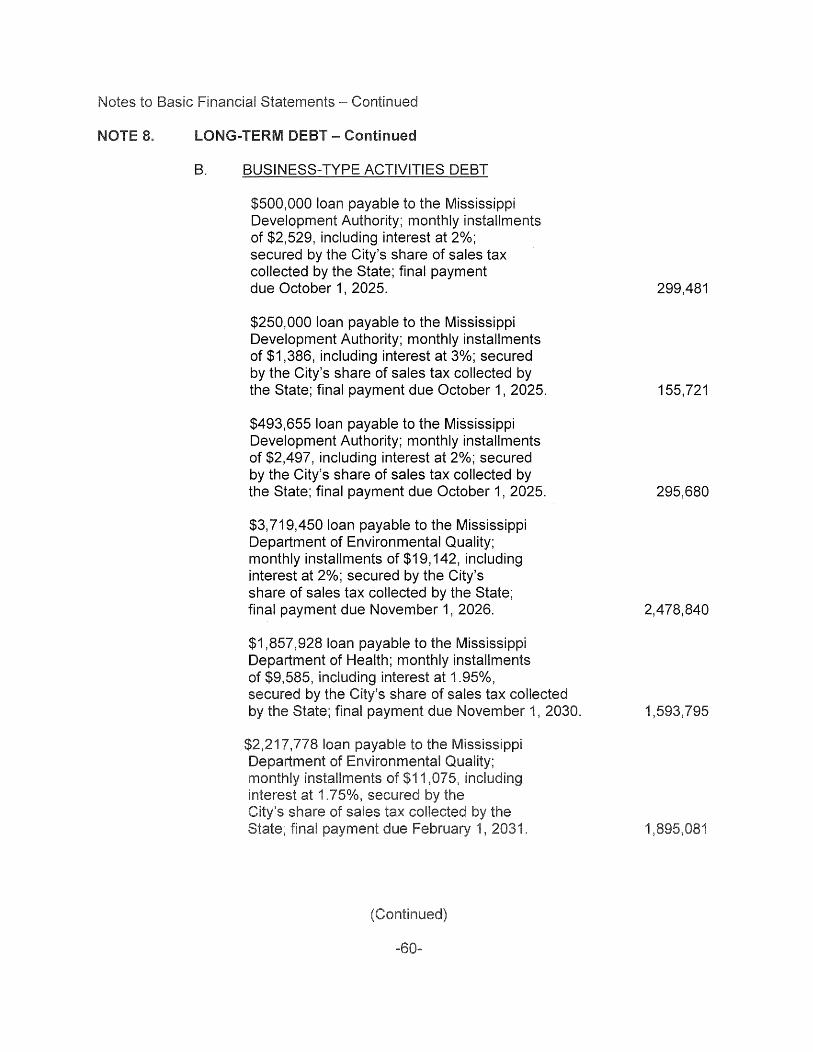
to
NOTE 8.
Statements -
LONG-TERM - Continued
B. BUSINESS-TYPE ACTIVITIES DEBT
$500,000 loan payable to the Mississippi Development Authority; monthly installments of $2,529, including interest at 2%; secured by the City's share of sales tax collected by the State; final payment due October 1, 2025.
$250, 000 loan payable to the Mississippi Development Authority; monthly installments of $1,386, including interest at 3%; secured by the City's share of sales tax collected by the State; final payment due October 1, 2025.
$493,655 loan payable to the Mississippi Development Authority; monthly installments of $2,497, including interest at 2%; secured by the City's share of sales tax collected by the State; final payment due October 1, 2025.
$3, 719,450 loan payable to the Mississippi Department of Environmental Quality; monthly installments of $19, 142, including interest at 2%; secured by the City's share of sales tax collected by the State; final payment due November 1, 2026.
$1 , 857, 928 loan payable to the Mississippi Department of Health; monthly installments of $9,585, including interest at 1.95%, secured by the City's share of sales tax collected by the State; final payment due November 1, 2030.
299,481
155,721
295,680
2,478,840
1,593,795
1
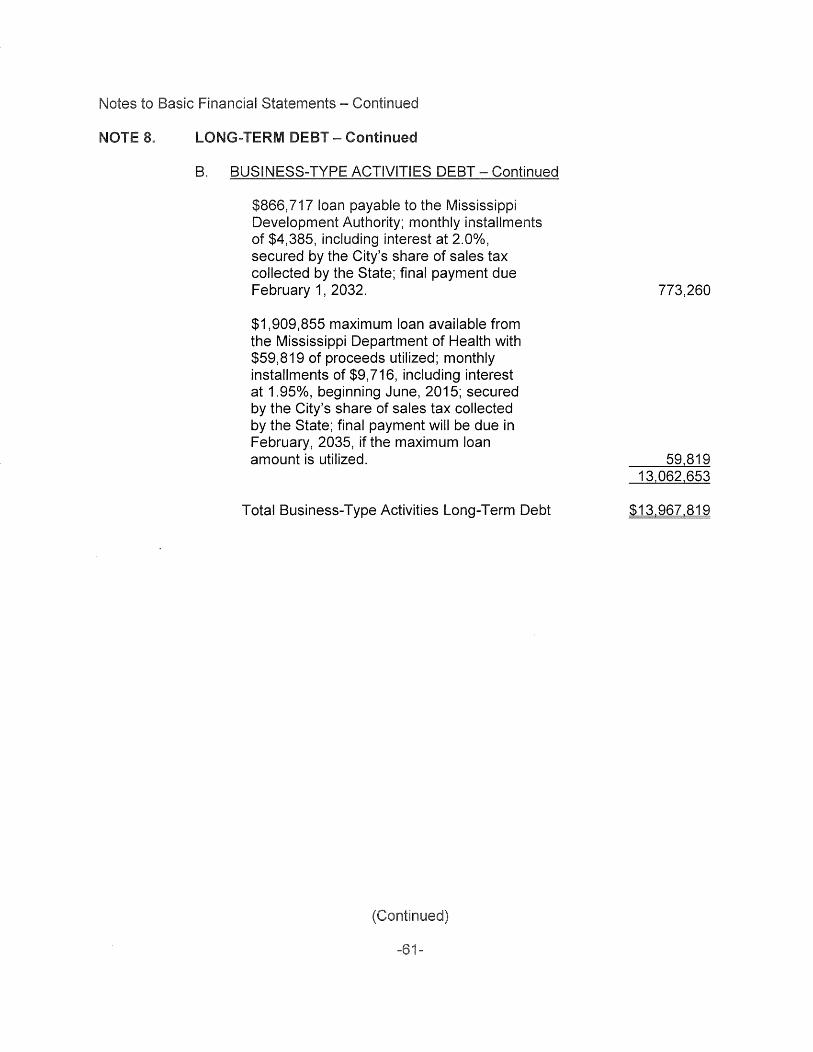
8. LONG-TERM DEBT- Continued
B. BUSINESS-TYPE ACTIVITIES DEBT- Continued
$866, 717 loan payable to the Mississippi Development Authority; monthly installments of $4,385, including interest at 2.0%, secured by the City's share of sales tax collected by the State; final payment due February 1, 2032.
$1,909,855 maximum loan available from the Mississippi Department of Health with $59,819 of proceeds utilized; monthly installments of $9, 716, including interest at 1.95%, beginning June, 2015; secured by the City's share of sales tax collected by the State; final payment will be due in February, 2035, if the maximum loan amount is utilized.
Total Business-Type Activities Long-Term Debt
773,260
59,819 13,062,653
$13,967,819
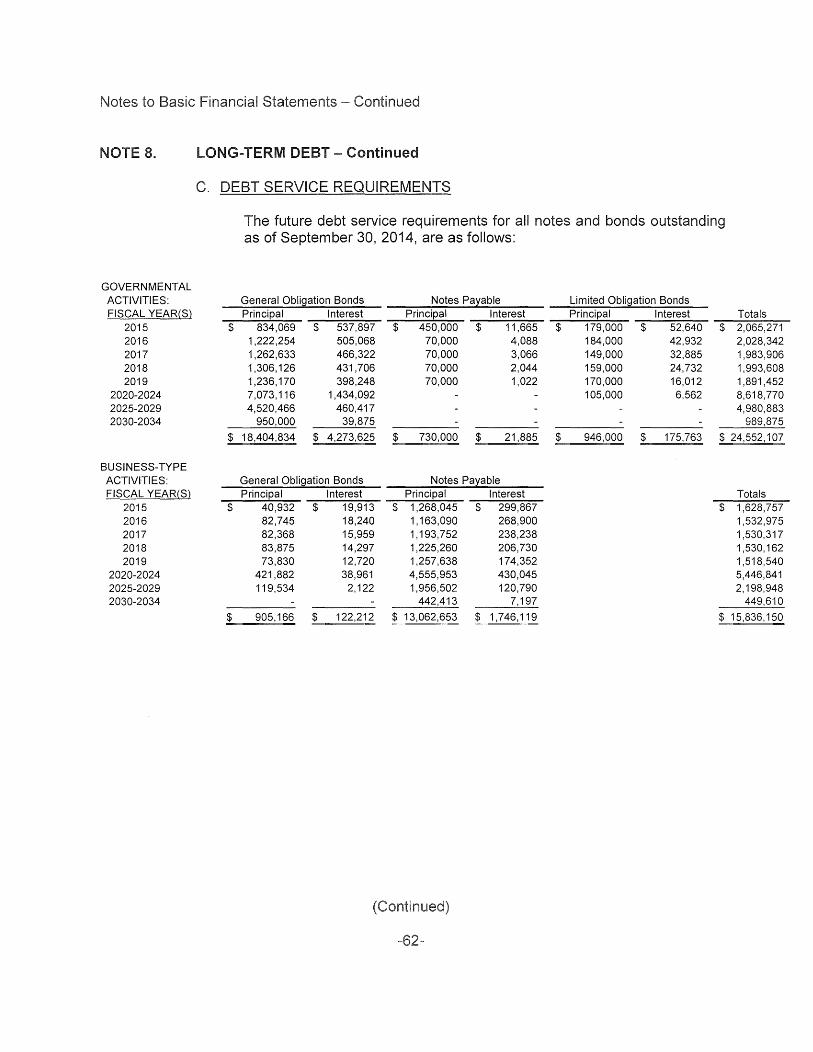
NOTE 8.
GOVERNMENTAL ACTIVITIES: FISCAL YEAR(S}
2015 2016 2017 2018 2019
2020-2024 2025-2029 2030-2034
BUSINESS-TYPE ACTIVITIES: FISCAL YEAR(S}
2015 2016 2017 2018 2019
2020-2024 2025-2029 2030-2034
LONG-TERM DEBT - Continued
C. DEBT SERVICE REQUIREMENTS
The future debt service requirements for all notes and bonds outstanding as of September 30, 2014, are as follows:
General Obli~ation Bonds Notes Payable Limited Obli~ation Bonds Principal Interest Principal Interest Principal Interest Totals
$ 834,069 $ 537,897 $ 450,000 $ 11,665 $ 179,000 $ 52,640 $ 2,065,271 1,222,254 505,068 70,000 4,088 184,000 42,932 2,028,342 1,262,633 466,322 70,000 3,066 149,000 32,885 1,983,906 1,306, 126 431,706 70,000 2,044 159,000 24,732 1,993,608 1,236, 170 398,248 70,000 1,022 170,000 16,012 1,891,452 7,073,116 1,434,092 105,000 6,562 8,618,770 4,520,466 460,417 4,980,883
950,000 39,875 989,875
$ 18,404,834 $ 4,273,625 $ 730,000 $ 21,885 $ 946,000 $ 175,763 $ 24,552,107
General Obli~ation Bonds Notes Payable Principal Interest Principal Interest Totals
$ 40,932 $ 19,913 $ 1,268,045 $ 299,867 $ 1,628,757 82,745 18,240 1, 163,090 268,900 1,532,975 82,368 15,959 1, 193,752 238,238 1,530,317 83,875 14,297 1,225,260 206,730 1,530, 162 73,830 12,720 1,257,638 174,352 1,518,540
421,882 38,961 4,555,953 430,045 5,446,841 119,534 2,122 1,956,502 120,790 2,198,948
442,413 7,197 449,610
$ 905, 166 $ 122,212 $ 13,062,653 $ 1,746,119 $ 15,836,150
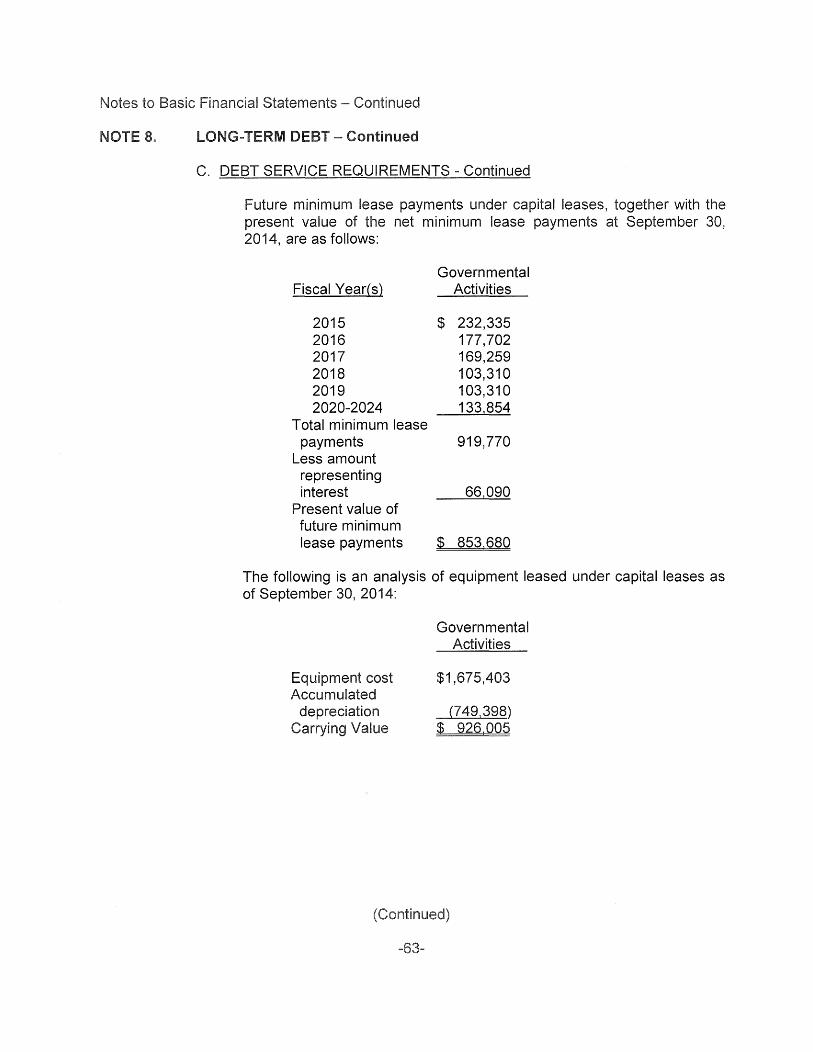
to
NOTE 8. LONG-TERM DEBT- Continued
C. DEBT SERVICE REQUIREMENTS - Continued
Future minimum lease payments under capital leases, together with the present value of the net minimum lease payments at September 30, 2014, are as follows:
Fiscal Year(s)
2015 2016 2017 2018 2019 2020-2024
Total minimum lease payments
Less amount representing interest
Present value of future minimum lease payments
Governmental Activities
$ 232,335 177,702 169,259 103,310 103,310 133,854
919,770
66,090
$ 853,680
The following is an analysis of equipment leased under capital leases as of September 30, 2014:
Equipment cost Accumulated
depreciation Carrying Value
Governmental Activities
$1,675,403
(749,398) $ 926,005
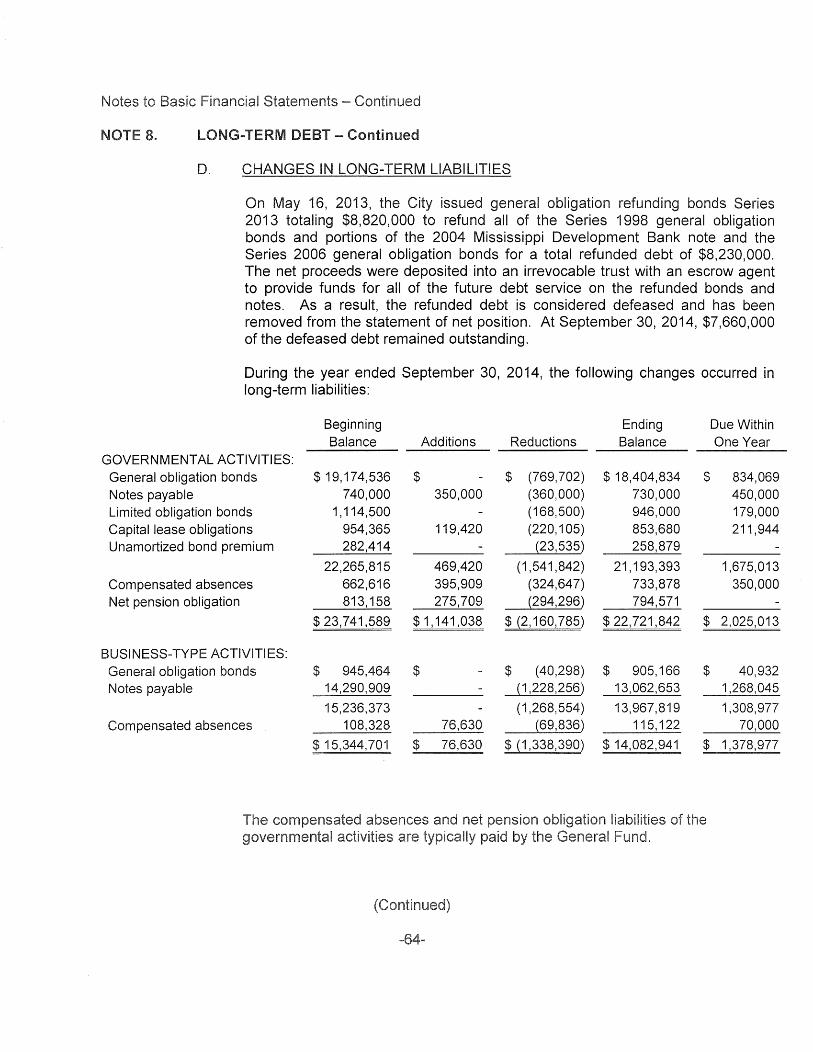
LONG-TERM DEBT- Continued
D. CHANGES IN LONG-TERM LIABILITIES
On May 16, 2013, the City issued general obligation refunding bonds Series 2013 totaling $8,820,000 to refund all of the Series 1998 general obligation bonds and portions of the 2004 Mississippi Development Bank note and the Series 2006 general obligation bonds for a total refunded debt of $8,230,000. The net proceeds were deposited into an irrevocable trust with an escrow agent to provide funds for all of the future debt service on the refunded bonds and notes. As a result, the refunded debt is considered defeased and has been removed from the statement of net position. At September 30, 2014, $7,660,000 of the defeased debt remained outstanding.
During the year ended September 30, 2014, the following changes occurred in long-term liabilities:
Beginning Ending Due Within Balance Additions Reductions Balance One Year
GOVERNMENTAL ACTIVITIES: General obligation bonds $ 19,174,536 $ $ (769,702) $ 18,404,834 $ 834,069 Notes payable 740,000 350,000 (360,000) 730,000 450,000 Limited obligation bonds 1,114,500 (168,500) 946,000 179,000 Capital lease obligations 954,365 119,420 (220, 105) 853,680 211,944 Unamortized bond premium 282,414 {23,535) 258,879
22,265,815 469,420 (1,541,842) 21, 193,393 1,675,013 Compensated absences 662,616 395,909 (324,647) 733,878 350,000 Net pension obligation 813,158 275,709 {294,296) 794,571
$ 23,741,589 $1,141,038 $ {2, 160, 785) $ 22,721,842 $ 2,025,013
BUSINESS-TYPE ACTIVITIES: General obligation bonds $ 945,464 $ $ (40,298) $ 905, 166 $ 40,932 Notes payable 14,290,909 {1,228,256) 13,062,653 1,268,045
15,236,373 (1,268,554) 13,967,819 1,308,977 Compensated absences 108,328 76,630 {69,836) 115, 122 70,000
$ 15,344,701 $ 76,630 $ {1,338,390) $ 14,082,941 $ 1,378,977
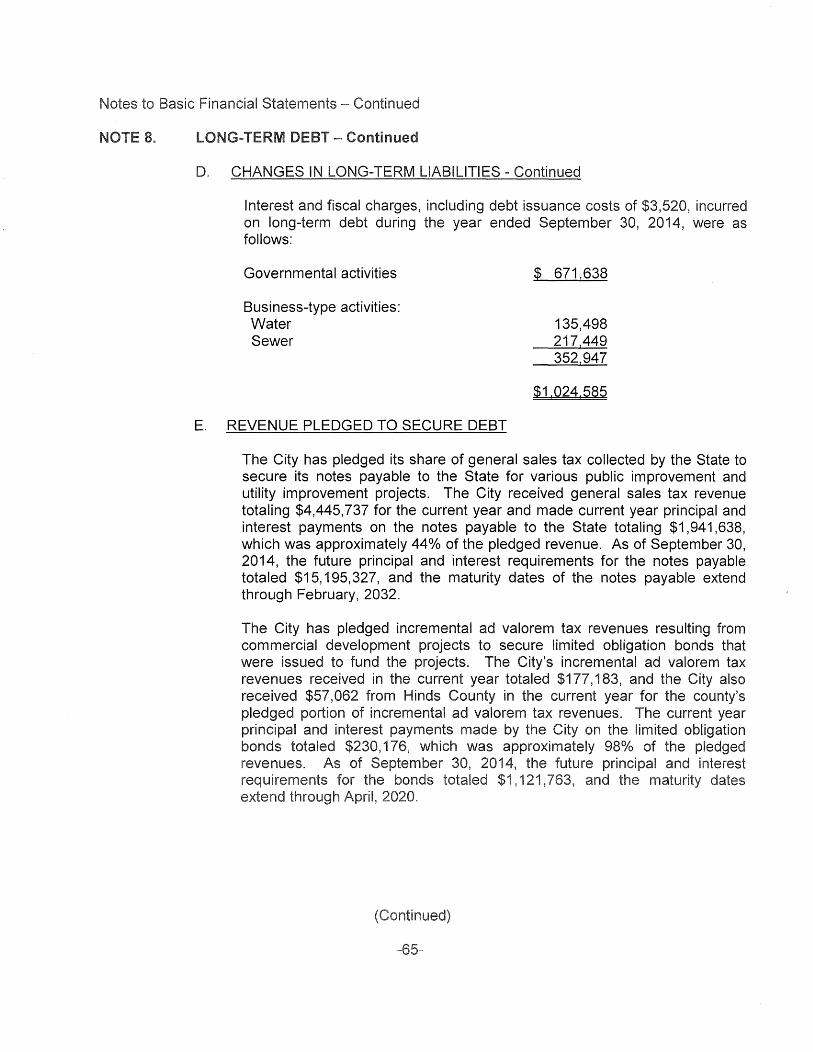
Notes
8. LONG-TERM - Continued
D. CHANGES IN LONG-TERM LIABILITIES - Continued
Interest and fiscal charges, including debt issuance costs of $3,520, incurred on long-term debt during the year ended September 30, 2014, were as follows:
Governmental activities
Business-type activities: Water Sewer
E. REVENUE PLEDGED TO SECURE DEBT
$ 671,638
135,498 217,449 352,947
$1,024,585
The City has pledged its share of general sales tax collected by the State to secure its notes payable to the State for various public improvement and utility improvement projects. The City received general sales tax revenue totaling $4,445, 737 for the current year and made current year principal and interest payments on the notes payable to the State totaling $1,941,638, which was approximately 44% of the pledged revenue. As of September 30, 2014, the future principal and interest requirements for the notes payable totaled $15, 195,327, and the maturity dates of the notes payable extend through February, 2032.
The City has pledged incremental ad valorem tax revenues resulting from commercial development projects to secure limited obligation bonds that were issued to fund the projects. The City's incremental ad valorem tax revenues received in the current year totaled $177, 183, and the City also received $57,062 from Hinds County in the current year for the county's pledged portion of incremental ad valorem tax revenues. The current year principal and interest payments made by the City on the limited obligation bonds totaled $230, 176, which was approximately 98% of the pledged
As September 30, 4, future principal and interest bonds , 1 dates
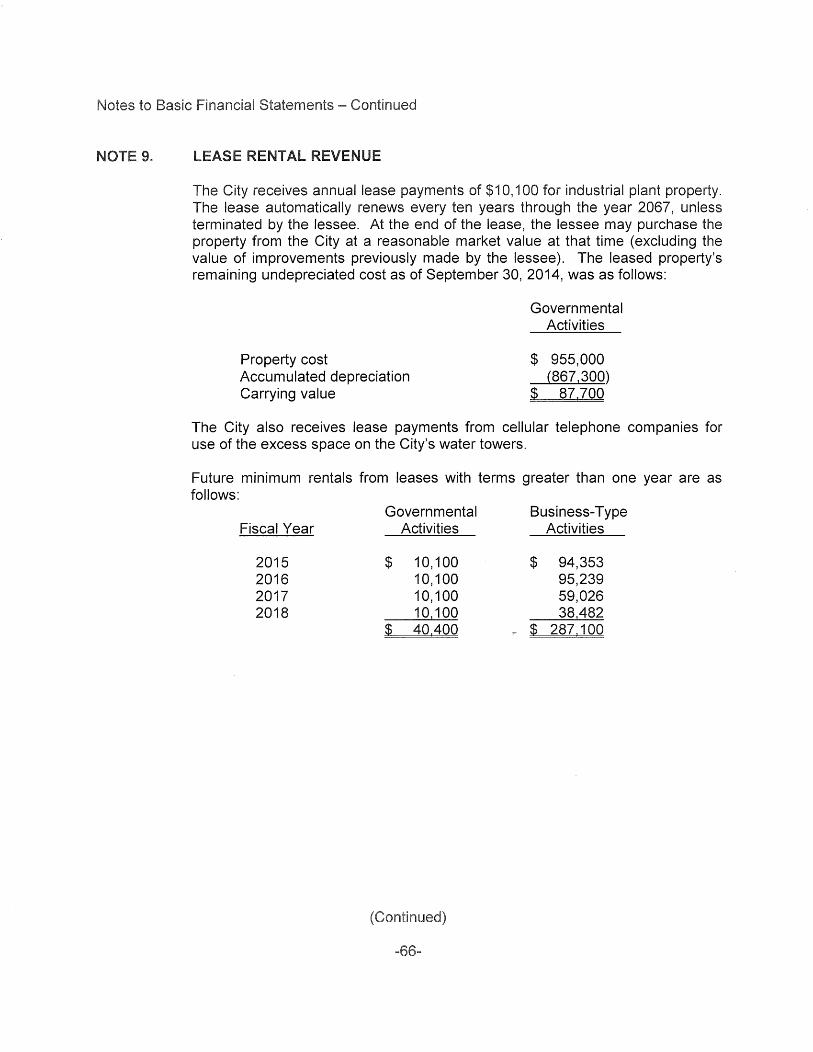
to
NOTE 9. LEASE RENTAL REVENUE
The City receives annual lease payments of $10, 100 for industrial plant property. The lease automatically renews every ten years through the year 2067, unless terminated by the lessee. At the end of the lease, the lessee may purchase the property from the City at a reasonable market value at that time (excluding the value of improvements previously made by the lessee). The leased property's remaining undepreciated cost as of September 30, 2014, was as follows:
Property cost Accumulated depreciation Carrying value
Governmental Activities
$ 955,000 (867,300)
$ 87,700
The City also receives lease payments from cellular telephone companies for use of the excess space on the City's water towers.
Future minimum rentals from leases with terms greater than one year are as follows:
Fiscal Year
2015 2016 2017 2018
Governmental Activities
$ 10,100 10, 100 10, 100 10, 100
$ 40,400
Business-Type Activities
$ 94,353 95,239 59,026 38,482
y $ 287, 100
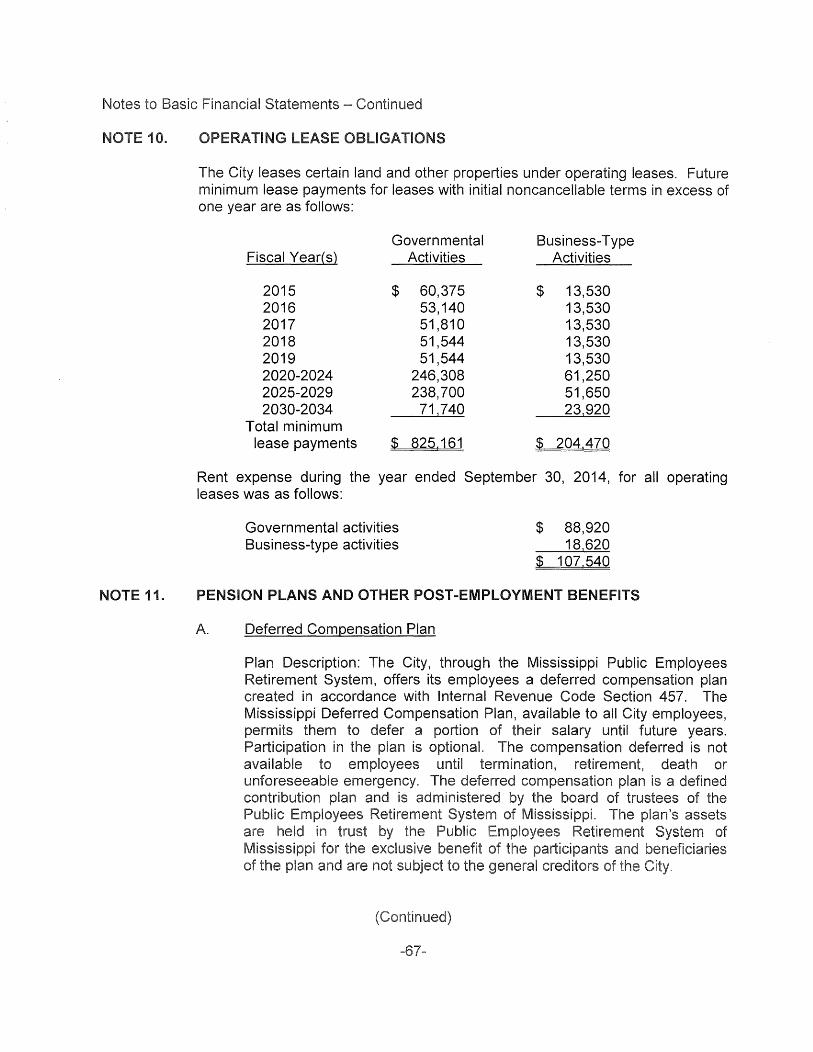
NOTE 1
NOTE 11.
OPERATING OBLIGATIONS
The City leases certain land and other properties under operating leases. Future minimum lease payments for leases with initial noncancellable terms in excess of one year are as follows:
Governmental Business-Type Fiscal Year(s) Activities Activities
2015 $ 60,375 $ 13,530 2016 53, 140 13,530 2017 51,810 13,530 2018 51,544 13,530 2019 51,544 13,530 2020-2024 246,308 61,250 2025-2029 238,700 51,650 2030-2034 71 740 231920
Total minimum lease payments $ 825, 161 $ 204,470
Rent expense during the year ended September 30, 2014, for all operating leases was as follows:
Governmental activities Business-type activities
$ 88,920 181620
$ 107,540
PENSION PLANS AND OTHER POST-EMPLOYMENT BENEFITS
A. Deferred Compensation Plan
Plan Description: The City, through the Mississippi Public Employees Retirement System, offers its employees a deferred compensation plan created in accordance with Internal Revenue Code Section 457. The Mississippi Deferred Compensation Plan, available to all City employees, permits them to defer a portion of their salary until future years. Participation in the plan is optional. The compensation deferred is not available employees until termination, retirement, death or unforeseeable emergency. The deferred compensation plan is a n°1
·1nc.n
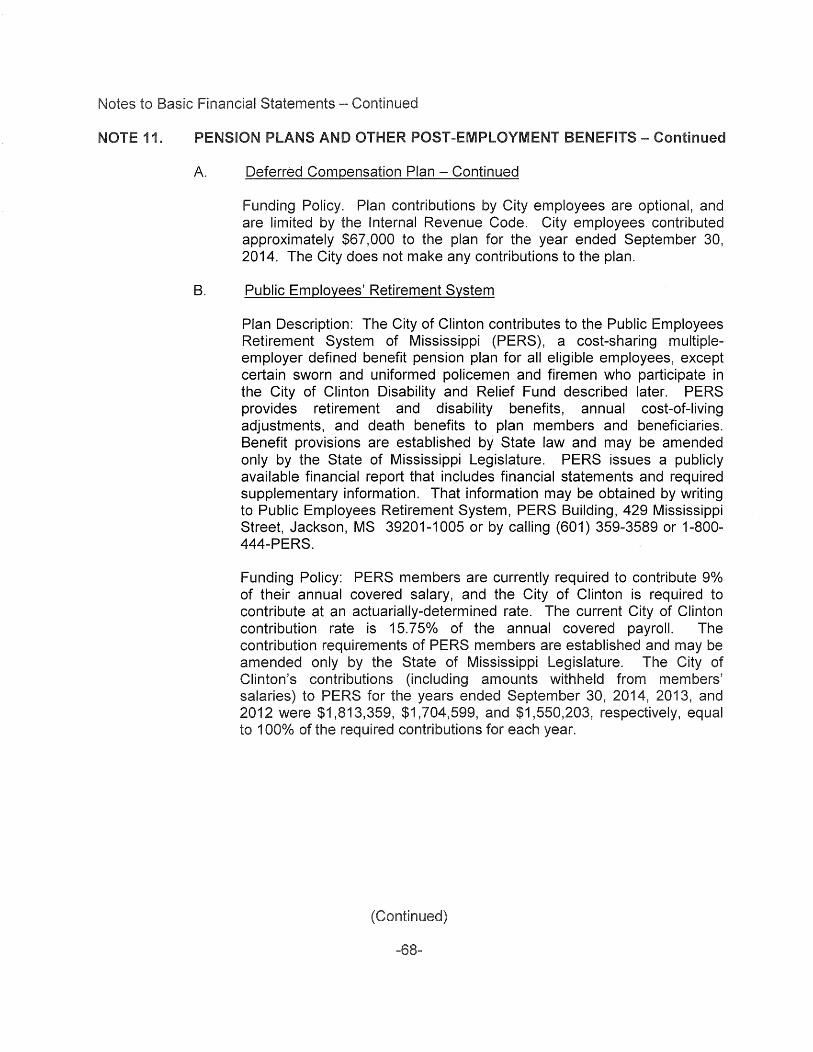
to
NOTE 11.
Statements -
PENSION PLANS AND OTHER POST-EMPLOYMENT BENEFITS - Continued
A. Deferred Compensation Plan - Continued
Funding Policy. Plan contributions by City employees are optional, and are limited by the Internal Revenue Code. City employees contributed approximately $67,000 to the plan for the year ended September 30, 2014. The City does not make any contributions to the plan.
B. Public Employees' Retirement System
Plan Description: The City of Clinton contributes to the Public Employees Retirement System of Mississippi (PERS), a cost-sharing multipleemployer defined benefit pension plan for all eligible employees, except certain sworn and uniformed policemen and firemen who participate in the City of Clinton Disability and Relief Fund described later. PERS provides retirement and disability benefits, annual cost-of-living adjustments, and death benefits to plan members and beneficiaries. Benefit provisions are established by State law and may be amended only by the State of Mississippi Legislature. PERS issues a publicly available financial report that includes financial statements and required supplementary information. That information may be obtained by writing to Public Employees Retirement System, PERS Building, 429 Mississippi Street, Jackson, MS 39201-1005 or by calling (601) 359-3589 or 1-800-444-PERS.
Funding Policy: PERS members are currently required to contribute 9% of their annual covered salary, and the City of Clinton is required to contribute at an actuarially-determined rate. The current City of Clinton contribution rate is 15. 75% of the annual covered payroll. The contribution requirements of PERS members are established and may be amended only by the State of Mississippi Legislature. The City of Clinton's contributions (including amounts withheld from members' salaries) to PERS for the years ended September 30, 2014, 2013, and 2012 were $1,813,359, $1, 704,599, and $1,550,203, respectively, equal to 100% of the required contributions for each year.
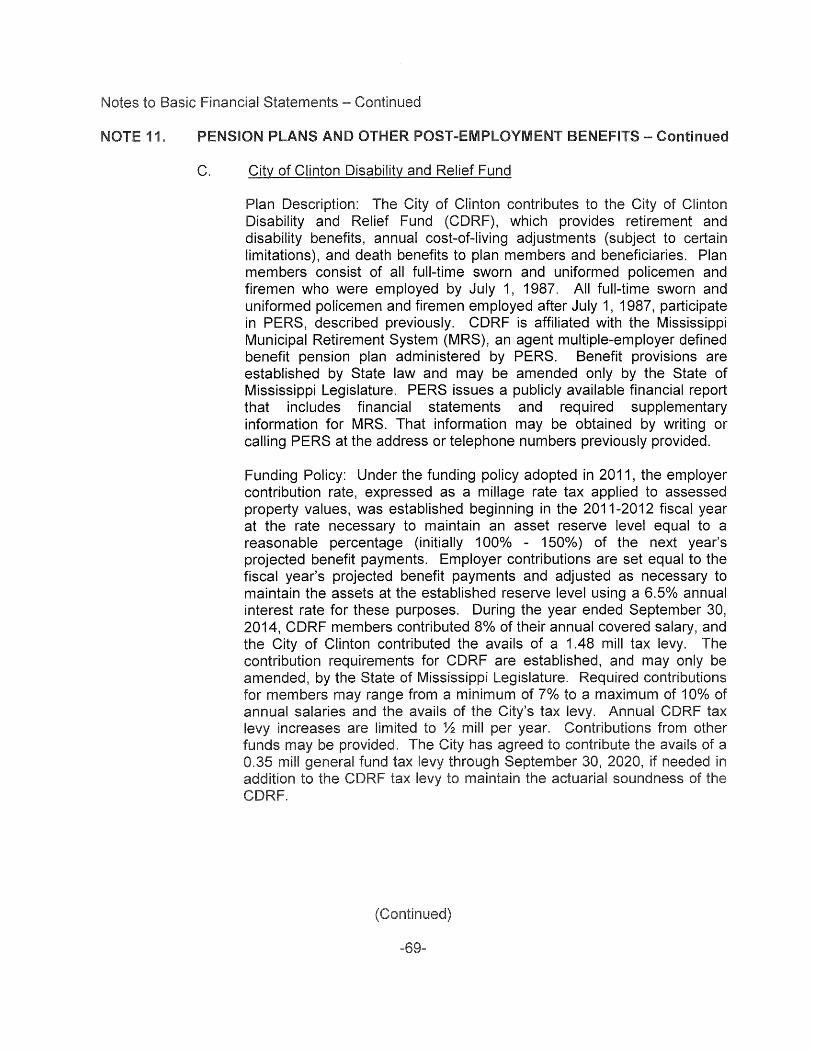
11. PENSION PLANS AND OTHER POST-EMPLOYMENT BENEFITS- Continued
C. City of Clinton Disability and Relief Fund
Plan Description: The City of Clinton contributes to the City of Clinton Disability and Relief Fund (CORF), which provides retirement and disability benefits, annual cost-of-living adjustments (subject to certain limitations), and death benefits to plan members and beneficiaries. Plan members consist of all full-time sworn and uniformed policemen and firemen who were employed by July 1, 1987. All full-time sworn and uniformed policemen and firemen employed after July 1, 1987, participate in PERS, described previously. CORF is affiliated with the Mississippi Municipal Retirement System (MRS), an agent multiple-employer defined benefit pension plan administered by PERS. Benefit provisions are established by State law and may be amended only by the State of Mississippi Legislature. PERS issues a publicly available financial report that includes financial statements and required supplementary information for MRS. That information may be obtained by writing or calling PERS at the address or telephone numbers previously provided.
Funding Policy: Under the funding policy adopted in 2011, the employer contribution rate, expressed as a millage rate tax applied to assessed property values, was established beginning in the 2011-2012 fiscal year at the rate necessary to maintain an asset reserve level equal to a reasonable percentage (initially 100% - 150%) of the next year's projected benefit payments. Employer contributions are set equal to the fiscal year's projected benefit payments and adjusted as necessary to maintain the assets at the established reserve level using a 6.5% annual interest rate for these purposes. During the year ended September 30, 2014, CORF members contributed 8% of their annual covered salary, and the City of Clinton contributed the avails of a 1.48 mill tax levy. The contribution requirements for CORF are established, and may only be amended, by the State of Mississippi Legislature. Required contributions for members may range from a minimum of 7% to a maximum of 10% of annual salaries and the avails of the City's tax levy. Annual CORF tax levy increases are limited to ~ mill per year. Contributions from other funds may be provided. The City has agreed to contribute the avails of a 0.35 mill general fund tax levy through September 30, if needed in addition to soundness
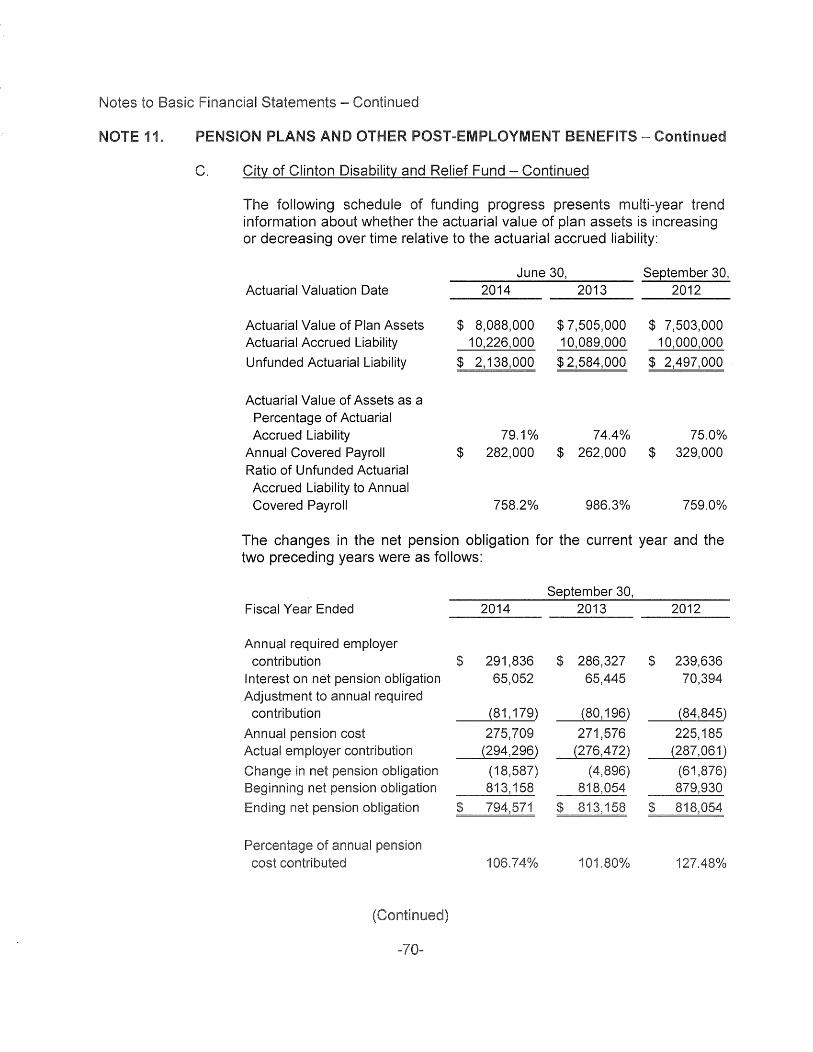
11. PENSION PLANS AND POST=EMPLOYMENT BENEFITS - Continued
C. City of Clinton Disability and Relief Fund - Continued
The following schedule of funding progress presents multi-year trend information about whether the actuarial value of plan assets is increasing or decreasing over time relative to the actuarial accrued liability:
Actuarial Valuation Date
Actuarial Value of Plan Assets Actuarial Accrued Liability
Unfunded Actuarial Liability
Actuarial Value of Assets as a Percentage of Actuarial Accrued Liability
Annual Covered Payroll Ratio of Unfunded Actuarial Accrued Liability to Annual Covered Payroll
June 30, 2014 2013
$ 8,088,000 10,226,000
$ 2,138,000
$ 79.1%
282,000
758.2%
$ 7,505,000 10,089,000
$ 2,584,000
74.4% $ 262,000
986.3%
September 30, 2012
$ 7,503,000 10,000,000
$ 2,497,000
$ 75.0%
329,000
759.0%
The changes in the net pension obligation for the current year and the two preceding years were as follows:
September 30, Fiscal Year Ended 2014 2013 2012
Annual required employer contribution $ 291,836 $ 286,327 $ 239,636
Interest on net pension obligation 65,052 65,445 70,394 Adjustment to annual required
contribution {81,179) {80, 196) {84,845)
Annual pension cost 275,709 271,576 225, 185 Actual employer contribution {294,296) {276,472) {287,061)
Change in net pension obligation (18,587) (4,896) Beginning net pension obligation 813,158 818,054
net
of annual cost contributed 06.74% .80% 127.48%
11.
NOTE 12.
NOTE 1
PENSION POST-EMPLOYMENT
C. City of Clinton Disability and Relief Fund - Continued
The annual required contribution for the year ended September 30, 2014, was determined as part of the June 30, 2013, actuarial valuation using the entry age normal actuarial cost method. The valuation date was changed to June 30th (from September 30th) beginning with this valuation. The actuarial assumptions include an 8% (including 3.5% price inflation) investment rate of return, projected salary increases of 4.5% to 6% (including 4.25% wage inflation) per year, and cost of living benefit adjustments of 2.5% per year (not to exceed 10%). The projection of benefits does not explicitly incorporate the potential effects of the legal limit on employer contributions. The actuarial value of CDRF's assets was determined using the 5-year smoothed market method. CDRF's unfunded actuarial accrued liability is being amortized as a level dollar amount on a closed basis. The remaining amortization period at June 30, 2013, was 21 years. The post-retirement mortality tables have been changed in accordance with the most recent experience study adopted in June, 2013.
COMMITMENTS
The City has entered into long-term contracts for residential solid waste collection and for the operation, management and maintenance of the City's wastewater treatment facilities. The solid waste collection contract is effective through December, 2015, and provides for a monthly charge to the City of $13.17 per residential unit and light commercial entity (subject to annual adjustment based on the Consumer Price Index). The wastewater treatment facilities contract is effective through September, 2016, and provides for a monthly charge to the City of $47,990 (subject to annual adjustment based on the Consumer Price Index) plus repair costs incurred by the contractor.
CONTINGENT UABIUTIES
The City is a defendant in several lawsuits ansmg in the normal course operations. In the opinion of the City's counsel, these lawsuits should not materially impact the financial condition of the City, each claim is within the policy City's each is being
to
14. RISK MANAGEMENT
The City is exposed to various risks of loss for which the City carries commercial insurance. There were no significant reductions in insurance coverage from the prior year, and settlements in excess of coverage for the three previous years were not material. As discussed in Note 2(c), the City's Self-Funded Group Insurance Fund had a deficit fund equity at September 30, 2014.
The City participates in the Mississippi Municipal Workers' Compensation Group (the Group), a self-insurance group. As such, the City may be assessed to pay claims or could possibly receive refunds or credits, depending on the Group surpluses available and as determined by the board of trustees of the Group (and allowed by the Mississippi Workers' Compensation Commission). The City is jointly and severally liable for claims made against the Group for the period during which the City is a participant in the Group.
Employees of the City are covered by the City's medical and dental selfinsurance plan (the "plan"). The City contributed approximately $507 per month per employee to the plan, and employees had the option of authorizing payroll withholdings to fund contributions for spouses and dependents. Claims are paid by a third party administrator acting on behalf of the City.
The City's medical self-insurance plan is protected against unanticipated catastrophic individual or aggregate loss by stop-loss coverage carried through a commercial insurer. Stop-loss coverage is in effect for individual claims exceeding $60,000 and for aggregate loss, which is based on the number of covered individuals. The aggregate stop-loss coverage attachment point for the current policy year (which began August 1, 2014) is approximately $1,436,000, while the previous policy year had an aggregate stop-loss coverage attachment point of approximately $1,564,000. The stop-loss coverage amounts apply to claims incurred during the policy period that are paid up to three months after the policy period.
The costs associated with the medical self-insurance plan are reported as interfund transactions and are treated as operating revenues of the Internal Service Fund and operating expenditures of the General Fund and the Enterprise Funds. The liabilities reported are based on the requirements that a liability for claims reported if information prior to the issuance the financial statements indicates that it is probable has been date
NOTE 14.
NOTE 15.
NOTE 16.
RISK MANAGEMENT - Continued
computing claims liability does not necessarily result in an exact amount. Claims liabilities are reevaluated periodically to take into consideration recently settled claims, the frequency of claims and other economic and social factors. Nonincremental claims adjustment expenses have not been included as part of the liability for claims because the amount would be immaterial. Changes in the claims liability amounts in the current year and the prior year were as follows:
Claims liability, October 1 Current year claims Claims paid in current year Claims liability, September 30
SUBSEQUENT EVENTS
Year Ended September 30, 2014 2013
$ 224,961 1,021,979
(1,053,873) $ 193,067
$ 332,511 1,033,514
( 1 , 141 , 064) $ 224,961
The Mississippi Department of Health has approved a $1.9 million capital project loan to the City that is to be repaid by the Water and Sewer Operations Fund over 20 years at 1.95%. As of September 30, 2014, the City had received proceeds of $59,819 under this loan.
The Mississippi Department of Environmental Quality has approved a $3 million capital project loan to the City that is to be repaid by the Water and Sewer Operations Fund over 20 years. As of September 30, 2014, the City had not yet received any proceeds under this loan.
The City has expressed its intent to issue tax increment financing bonds totaling $600,000 in relation to a commercial development project to be repaid over a period not to exceed 20 years.
SUBSEQUENT IMPLEMENTATION OF NEW ACCOUNTING STANDARD
The Governmental Accounting Standards Board (GASB) has issued Statement No. 68, Accounting and Financial Reporting for Pensions, which will be implemented the for the year ending September 5. Implementation will require
REQUIRED SUPPLEMENTARY INFORMATION
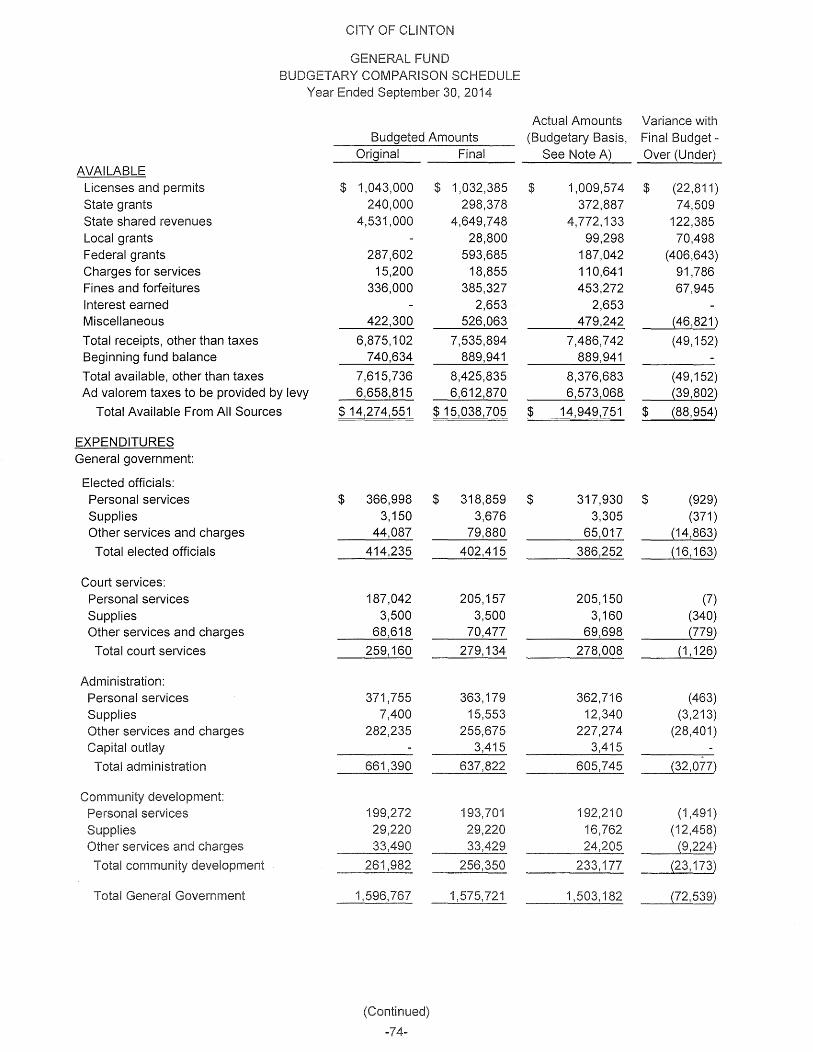
CLINTON
GENERAL FUND BUDGETARY COMPARISON SCHEDULE
Year Ended September 30, 2014
Actual Amounts Variance with Budgeted Amounts (Budgetary Basis, Final Budget -
Original Final See Note A) Over (Under) AVAILABLE
Licenses and permits $ 1,043,000 $ 1,032,385 $ 1,009,574 $ (22,811) State grants 240,000 298,378 372,887 74,509 State shared revenues 4,531,000 4,649,748 4,772, 133 122,385 Local grants 28,800 99,298 70,498 Federal grants 287,602 593,685 187,042 (406,643) Charges for services 15,200 18,855 110,641 91,786 Fines and forfeitures 336,000 385,327 453,272 67,945 Interest earned 2,653 2,653 Miscellaneous 422,300 526,063 479,242 {46,821)
Total receipts, other than taxes 6,875, 102 7,535,894 7,486,742 (49,152) Beginning fund balance 740,634 889,941 889,941
Total available, other than taxes 7,615,736 8,425,835 8,376,683 (49,152) Ad valorem taxes to be provided by levy 6,658,815 6,612,870 6,573,068 {39,802)
Total Available From All Sources $ 14,274,551 $ 15,038,705 $ 14,949,751 $ {88,954)
EXPENDITURES General government:
Elected officials: Personal services $ 366,998 $ 318,859 $ 317,930 $ (929) Supplies 3,150 3,676 3,305 (371) Other services and charges 44,087 79,880 65,017 {14,863)
Total elected officials 414,235 402,415 386,252 (16,163)
Court services: Personal services 187,042 205, 157 205, 150 (7) Supplies 3,500 3,500 3,160 (340) Other services and charges 68,618 70,477 69,698 {779)
Total court services 259, 160 279, 134 278,008 {1, 126)
Administration: Personal services 371,755 363, 179 362,716 (463) Supplies 7,400 15,553 12,340 (3,213) Other services and charges 282,235 255,675 227,274 (28,401) Capital outlay 3,415 3,415
Total administration 661,390 637,822 605,745 (32,077)
Personal services
Total General Government
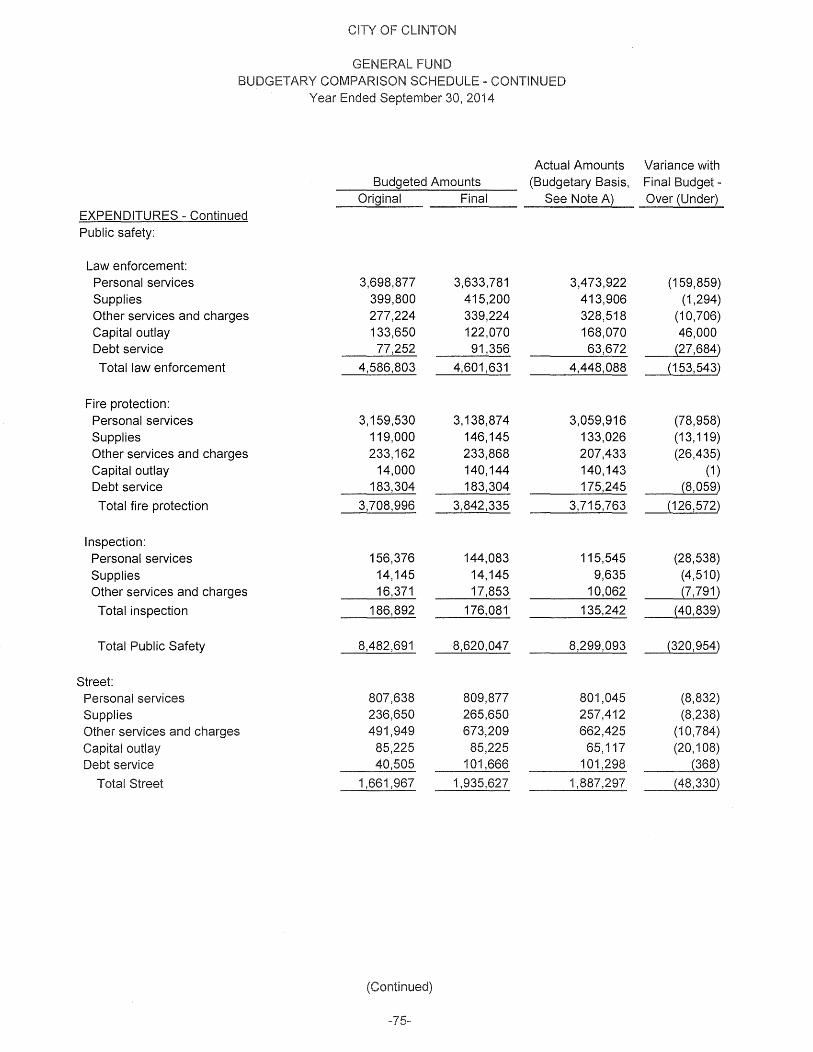
OF CLINTON
GENERAL FUND BUDGETARY COMPARISON SCHEDULE - CONTINUED
Year Ended September 30, 2014
Actual Amounts Budgeted Amounts (Budgetary Basis,
Original Final See Note EXPENDITURES - Continued Public safety:
Law enforcement: Personal services 3,698,877 3,633,781 3,473,922 Supplies 399,800 415,200 413,906 Other services and charges 277,224 339,224 328,518 Capital outlay 133,650 122,070 168,070 Debt service 77,252 91,356 63,672
Total law enforcement 4,586,803 4,601,631 4,448,088
Fire protection: Personal services 3, 159,530 3,138,874 3,059,916 Supplies 119,000 146, 145 133,026 Other services and charges 233,162 233,868 207,433 Capital outlay 14,000 140, 144 140, 143 Debt service 183,304 183,304 175,245
Total fire protection 3,708,996 3,842,335 3,715,763
Inspection: Personal services 156,376 144,083 115,545 Supplies 14, 145 14, 145 9,635 Other services and charges 16,371 17,853 10,062
Total inspection 186,892 176,081 135,242
Total Public Safety 8,482,691 8,620,047 8,299,093
Street: Personal services 807,638 809,877 801,045 Supplies 236,650 265,650 257,412 Other services and charges 491,949 673,209 662,425 Capital outlay 85,225 85,225 65, 117 Debt service 40,505 101,666
Total Street 1,661,967 1,935,627 1,887,297
-75-
Variance with Final Budget -Over (Under)
(159,859) (1,294)
(10,706) 46,000
{27,684)
(153,543)
(78,958) (13,119) (26,435)
(1) {8,059)
{126,572)
(28,538) (4,510) {7, 791)
(40,839)
{320,954)
(8,832) (8,238)
(10,784) (20, 108)
{368)
{48,330)
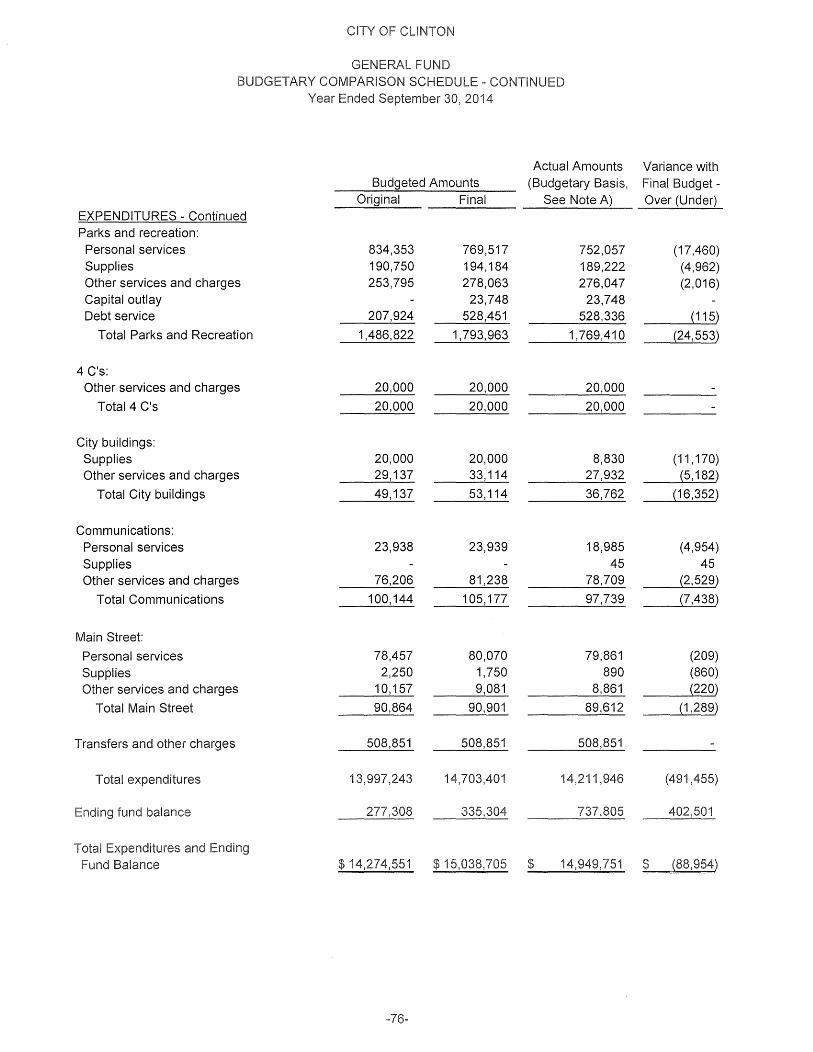
CLINTON
GENERAL FUND BUDGETARY COMPARISON SCHEDULE - CONTINUED
Year Ended September 30, 2014
Actual Amounts Budgeted .Amounts (Budgetary Basis,
Original Final See Note A) EXPENDITURES - Continued Parks and recreation:
Personal services 834,353 769,517 752,057 Supplies 190,750 194, 184 189,222 Other services and charges 253,795 278,063 276,047 Capital outlay 23,748 23,748 Debt service 207,924 528,451 528,336
Total Parks and Recreation 1,486,822 1,793,963 1,769,410
4 C's: Other services and charges 20,000 20,000 20,000
Total 4 C's 20,000 20,000 20,000
City buildings: Supplies 20,000 20,000 8,830 Other services and charges 29, 137 33, 114 27,932
Total City buildings 49,137 53, 114 36,762
Communications: Personal services 23,938 23,939 18,985 Supplies 45 Other services and charges 76,206 81,238 78,709
Total Communications 100, 144 105, 177 97,739
Main Street:
Personal services 78,457 80,070 79,861 Supplies 2,250 1,750 890 Other services and charges 10, 157 9,081 8,861
Total Main Street 90,864 90,901 89,612
Transfers and other charges 508,851 508,851 508,851
Total expenditures 13,997,243 14,703,401 1,946
fund balance
Total and Fund Balance
-76-
Variance with Final Budget -Over (Under)
(17,460) (4,962) (2,016)
{115)
(24,553)
(11,170) {5, 182)
{16,352)
(4,954) 45
{2,529)
{7,438)
(209) (860) {220)
(1,289)
(491,455)
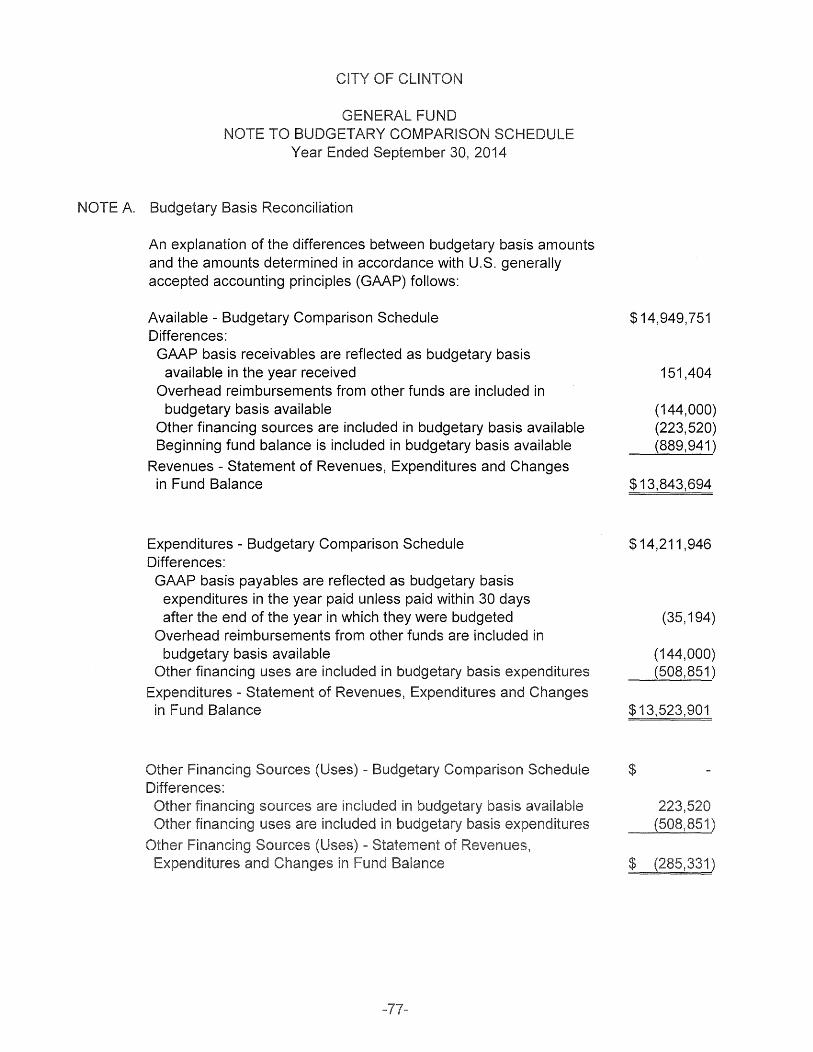
Year Ended September 30, 2014
NOTE A Budgetary Basis Reconciliation
An explanation of the differences between budgetary basis amounts and the amounts determined in accordance with U.S. generally accepted accounting principles (GAAP) follows:
Available - Budgetary Comparison Schedule Differences: GAAP basis receivables are reflected as budgetary basis
available in the year received Overhead reimbursements from other funds are included in
budgetary basis available Other financing sources are included in budgetary basis available Beginning fund balance is included in budgetary basis available
Revenues - Statement of Revenues, Expenditures and Changes in Fund Balance
Expenditures - Budgetary Comparison Schedule Differences: GAAP basis payables are reflected as budgetary basis
expenditures in the year paid unless paid within 30 days after the end of the year in which they were budgeted
Overhead reimbursements from other funds are included in budgetary basis available
Other financing uses are included in budgetary basis expenditures
Expenditures - Statement of Revenues, Expenditures and Changes in Fund Balance
$14,949,751
151,404
(144,000) (223,520) (889,941)
$13,843,694
$14,211,946
(35, 194)
(144,000) (508,851)
$13,523,901
$
OTHER SUPPLEMENTARY INFORMATION
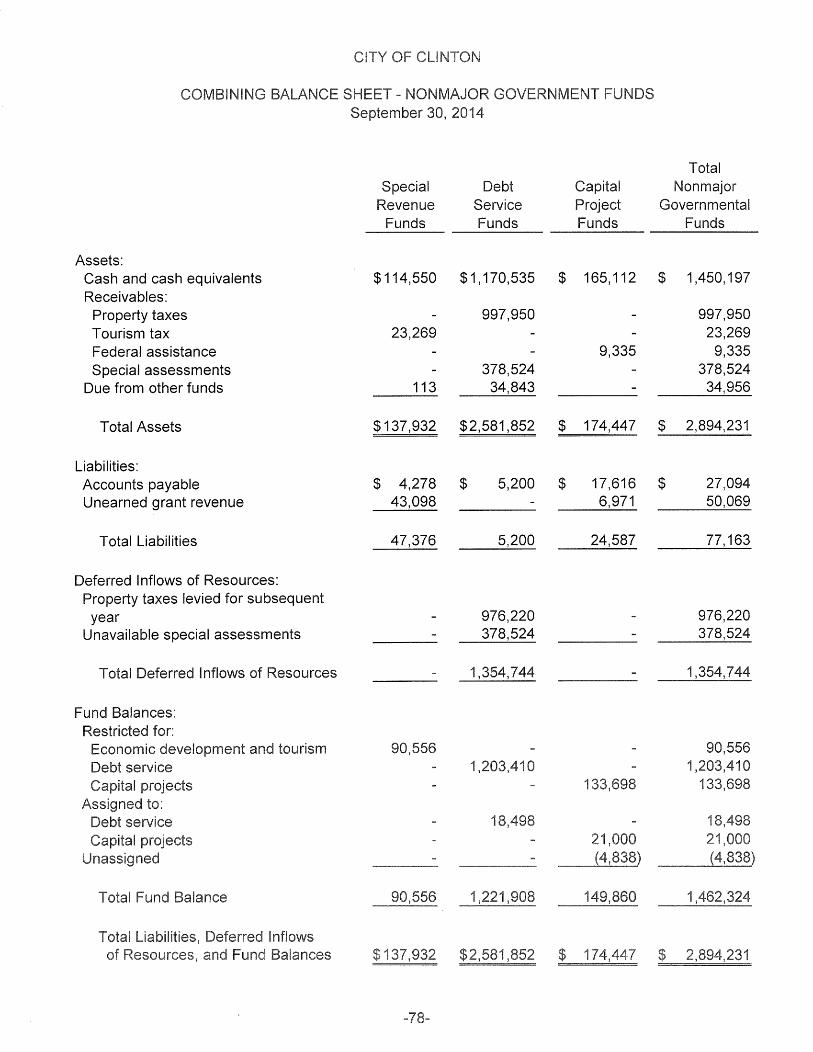
Total Special Debt Capital Non major
Revenue Service Project Governmental Funds Funds Funds Funds
Assets: Cash and cash equivalents $114,550 $1,170,535 $ 165,112 $ 1,450, 197 Receivables:
Property taxes 997,950 997,950 Tourism tax 23,269 23,269 Federal assistance 9,335 9,335 Special assessments 378,524 378,524
Due from other funds 113 34,843 34,956
Total Assets $137,932 $2,581,852 $ 174,447 $ 2,894,231
Liabilities: Accounts payable $ 4,278 $ 5,200 $ 17,616 $ 27,094 Unearned grant revenue 43,098 6,971 50,069
Total Liabilities 47,376 5,200 24,587 77, 163
Deferred Inflows of Resources: Property taxes levied for subsequent year 976,220 976,220
Unavailable special assessments 378,524 378,524
Total Deferred Inflows of Resources 1,354,744 1,354,744
Fund Balances: Restricted for:
Economic development and tourism 90,556 90,556 Debt service 1 0 1 0 Capital projects 1 133,698
Assigned to: 1
$137,932
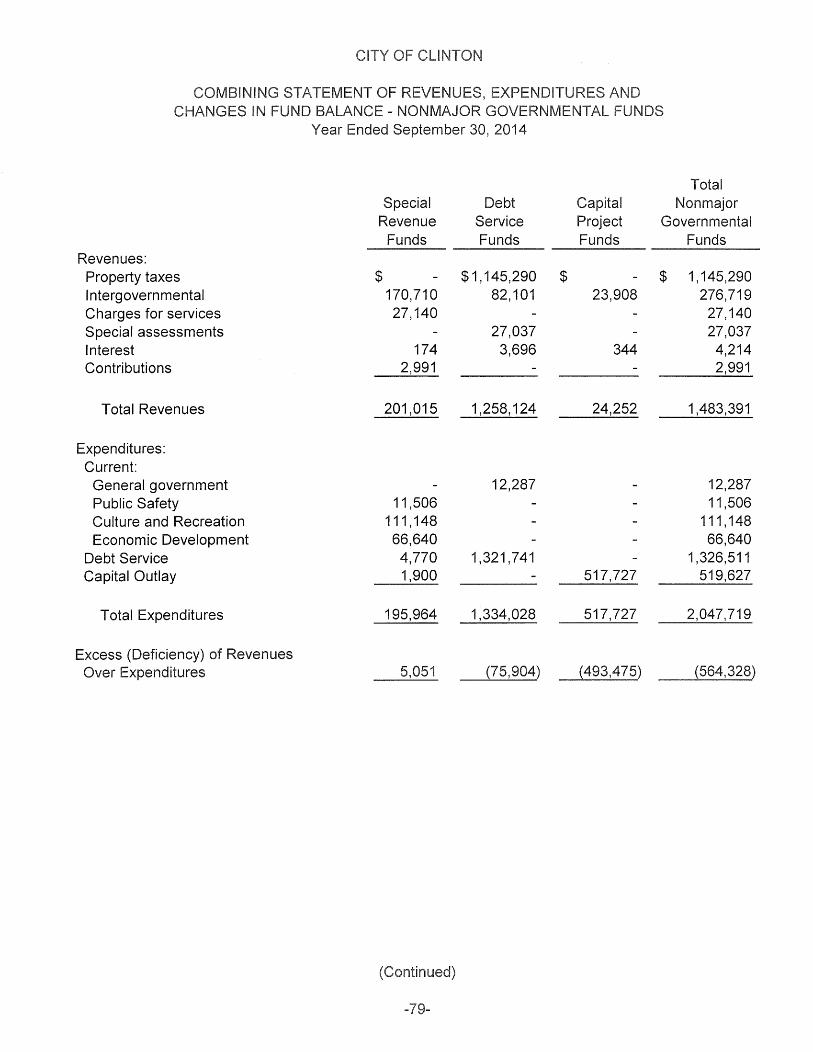
Year Ended September 30, 2014
Total Special Debt Capital Non major
Revenue Service Project Governmental Funds Funds Funds Funds
Revenues: Property taxes $ $1, 145,290 $ $ 1, 145,290 Intergovernmental 170,710 82, 101 23,908 276,719 Charges for services 27, 140 27, 140 Special assessments 27,037 27,037 Interest 174 3,696 344 4,214 Contributions 2,991 2,991
Total Revenues 201,015 1,258, 124 24,252 1,483,391
Expenditures: Current:
General government 12,287 12,287 Public Safety 11,506 11,506 Culture and Recreation 111, 148 111, 148 Economic Development 66,640 66,640
Debt Service 4,770 1,321,741 1,326,511 Capital Outlay 1,900 517,727 519,627
Total Expenditures 195,964 1,334,028 517,727 2,047,719
Excess (Deficiency) of Revenues Over Expenditures 5,051 (75,904) (493,475) (564,328)
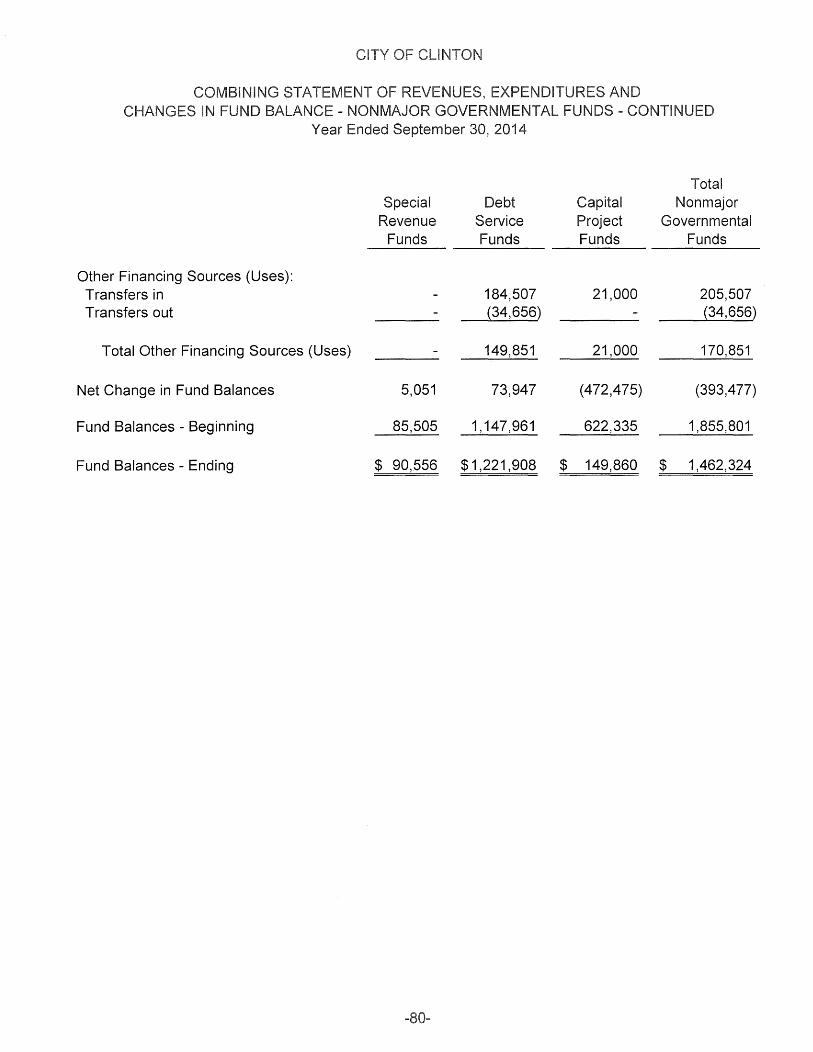
Year Ended September 30, 2014
Total Special Debt Capital Nonmajor
Revenue Service Project Governmental Funds Funds Funds Funds
Other Financing Sources (Uses): Transfers in 184,507 21,000 205,507 Transfers out (34,656) (34,656)
Total Other Financing Sources (Uses) 149,851 21,000 170,851
Net Change in Fund Balances 5,051 73,947 (472,475) (393,477)
Fund Balances - Beginning 85,505 1, 147,961 622,335 1,855,801
Fund Balances - Ending $ 90,556 $1,221,908 $ 149,860 $ 1,462,324
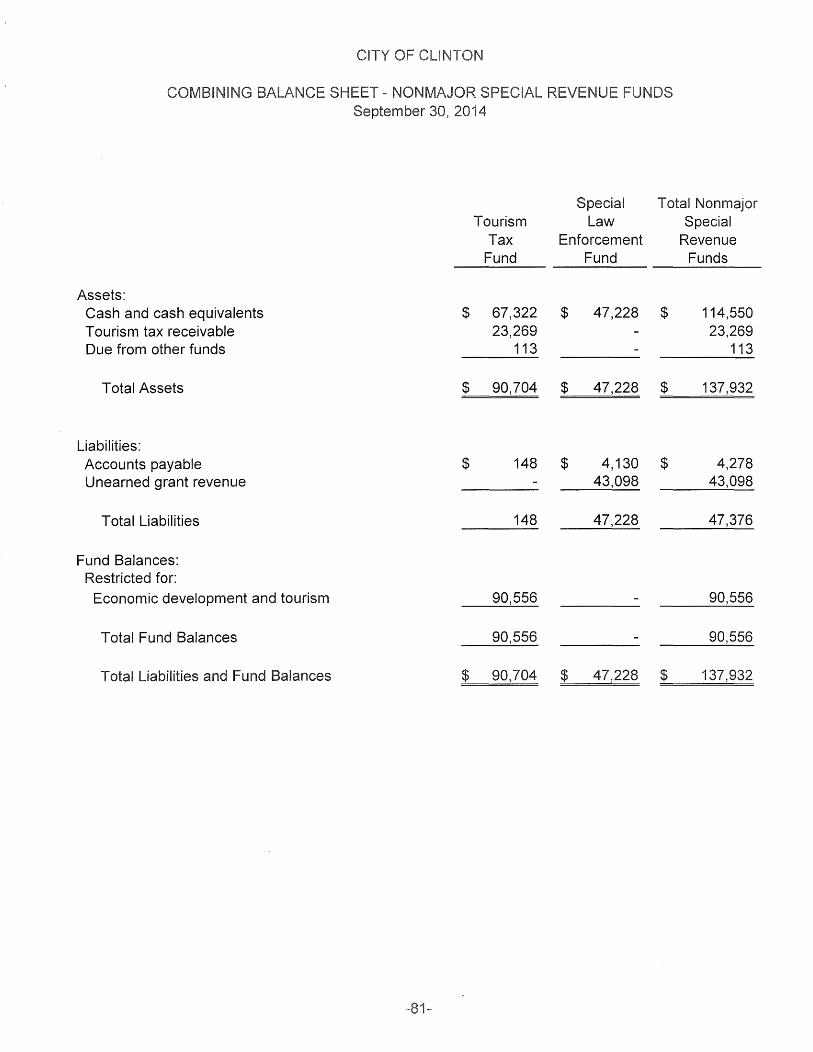
N
Special Total Nonmajor Tourism Law Special
Tax Enforcement Revenue Fund Fund Funds
Assets: Cash and cash equivalents $ 67,322 $ 47,228 $ 114,550 Tourism tax receivable 23,269 23,269 Due from other funds 113 113
Total Assets $ 90,704 $ 47,228 $ 137,932
Liabilities: Accounts payable $ 148 $ 4,130 $ 4,278 Unearned grant revenue 43,098 43,098
Total Liabilities 148 47,228 47,376
Fund Balances: Restricted for:
Economic development and tourism 90,556 90,556
Total Fund Balances 90,556 90,556
Total Liabilities and Fund Balances $ 90,704 $ 47,228 $ 137,932
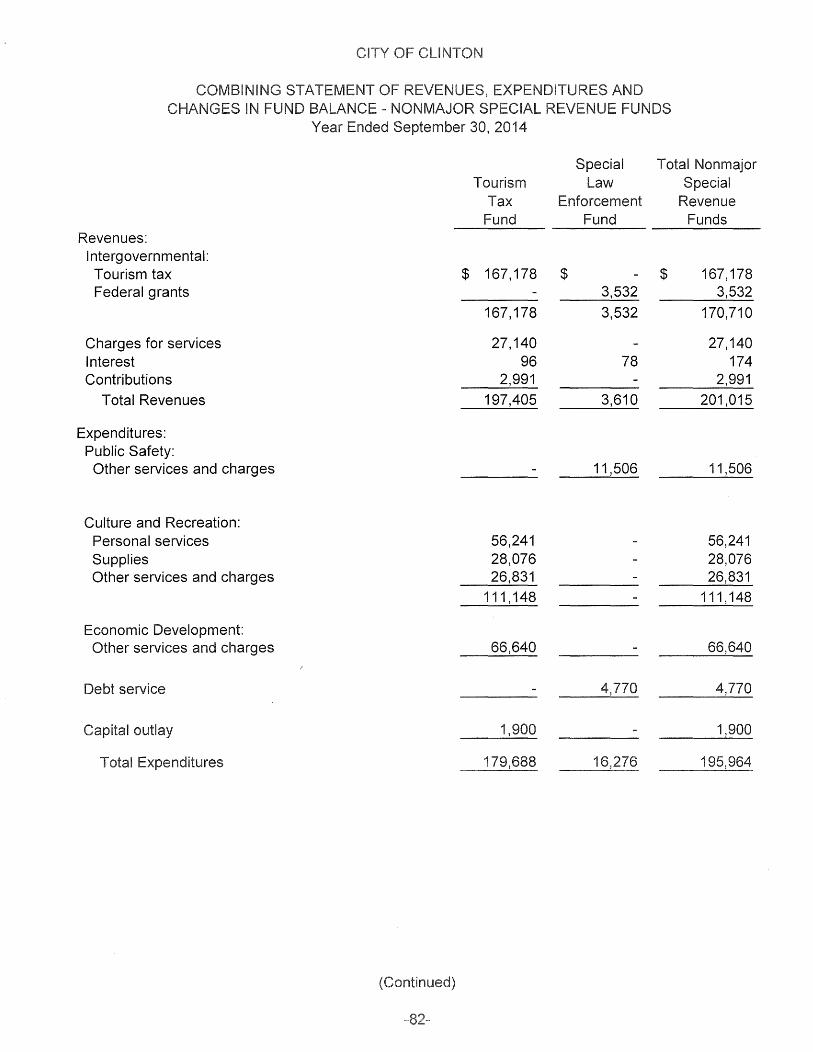
Revenues: Intergovernmental:
Tourism tax Federal grants
Charges for services Interest Contributions
Total Revenues
Expenditures: Public Safety:
Other services and charges
Culture and Recreation: Personal services Supplies Other services and charges
Economic Development: Other services and charges
Debt service
Capital outlay
Year Ended September 30, 2014
$
Tourism Tax
Fund
167, 178
167, 178
27, 140 96
2,991
197,405
56,241 28,076 26,831
111, 148
66,640
1
1
Special Law
Enforcement Fund
$ 3,532
3,532
78
3,610
11,506
Total Nonmajor Special
Revenue Funds
$ 167, 178 3,532
170,710
27, 140 174
2,991
201,015
11,506
56,241 28,076 26,831
111, 148
66,640
4,770
1
1
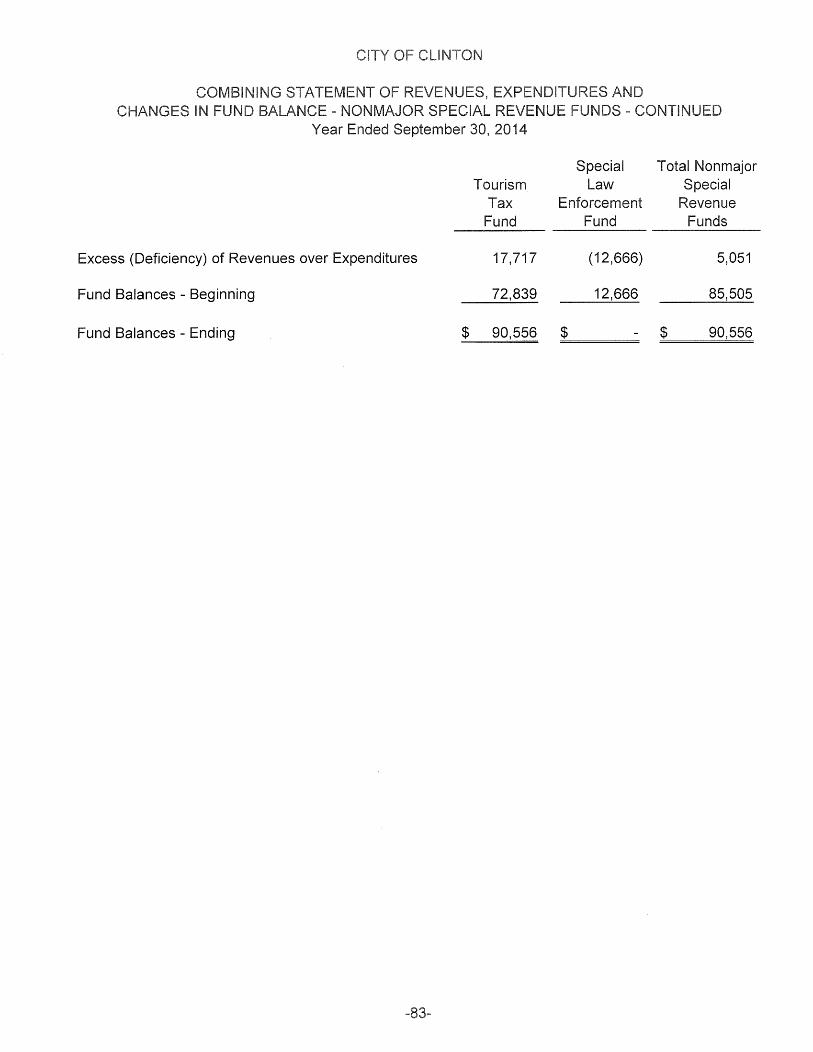
Year Ended September 30, 2014
Excess (Deficiency) of Revenues over Expenditures
Fund Balances - Beginning
Tourism Tax Fund
17,717
72,839
Special Law
Enforcement Fund
(12,666)
12,666
Fund Balances - Ending $ 90,556 $ ====
Total Nonmajor Special
Revenue Funds
5,051
85,505
$ 90,556
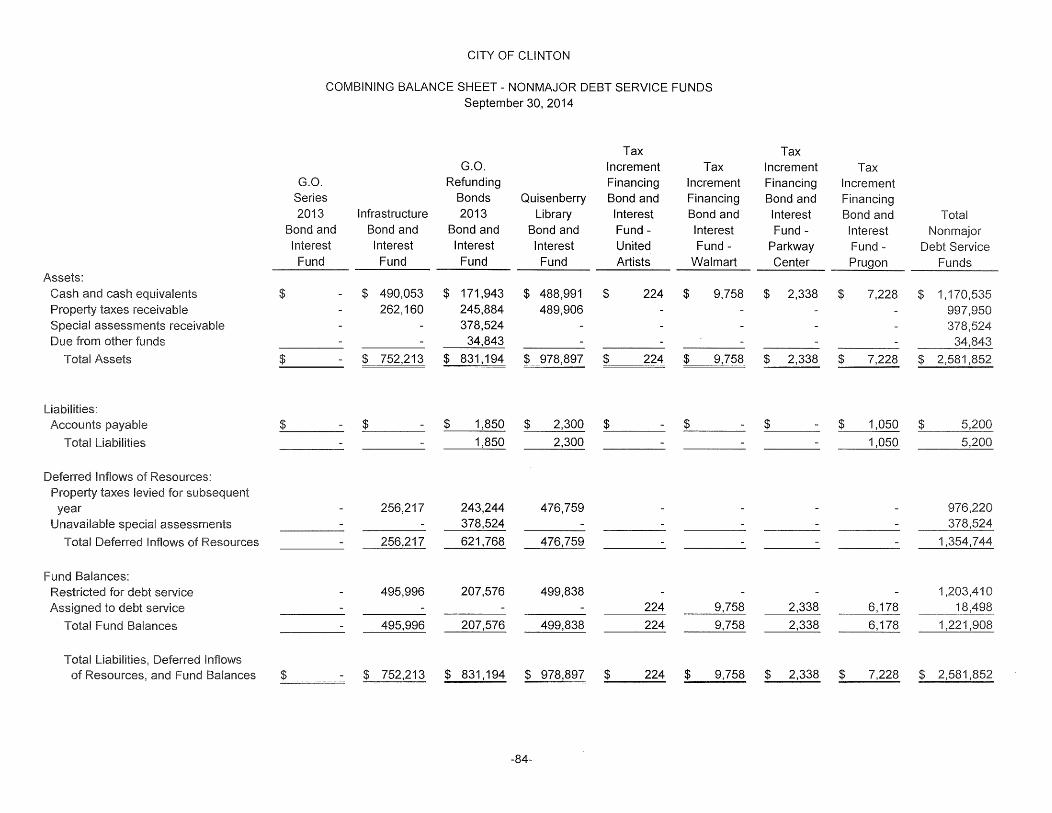
CITY OF CLINTON
COMBINING BALANCE SHEET - NONMAJOR DEBT SERVICE FUNDS September 30, 2014
Tax Tax G.O. Increment Tax Increment Tax
G.O. Refunding Financing Increment Financing Increment Series Bonds Quisenberry Bond and Financing Bond and Financing 2013 Infrastructure 2013 Library Interest Bond and Interest Bond and Total
Bond and Bond and Bond and Bond and Fund - Interest Fund - Interest Nonmajor Interest Interest Interest Interest United Fund - Parkway Fund - Debt Service
Fund Fund Fund Fund Artists Wal mart Center Prugon Funds Assets:
Cash and cash $ - $ 490,053 $ 171,943 $ 488,991 $ 224 $ 9,758 $ 2,338 $ 7,228 $ 1, 170,535 Property taxes receivable - 262, 160 245,884 489,906 - - - 997,950 Special assessments receivable - - 378,524 - - - - -
Due from other funds - - 34,843 - - - - -
Total Assets $ - $ 752,213 $ 831,194 $ 978,897 $ 224 $ 9,758 $ 2,338 $ 7,228 $ 2,581,852
Liabilities: Accounts - $ - $ 1,850 $ 2,300 $ - $ - $ - $ 1,050
Total Liabilities - - 1,850 __ 2,300 - - - 1,050 5,200
Deferred Inflows of Resources: taxes levied for
year - 256,217 243,244 476,759 - - - -Unavailable assessments - - 378,524 - - - - -
Total Deferred Inflows of Resources - 256,217 621,768 ~759 - - - - 1,354,744
Fund Balances: Restricted for debt service - 495,996 207,576 499,838 - - - - 1,203,410 Assigned to debt service - - - - 224 9,758 2,338 6,178 18,498
Total Fund Balances - 495,996 207,576 ~838 224 9,758 2,338 6,178 1,221,908
Deferred Inflows of Resources. and Fund Balances $ - $ 752,213 $ 831,194 $ 978,897 $ 224 $ 9,758 $ 2,338 $ 7,228 $ 2,581,852
-84-
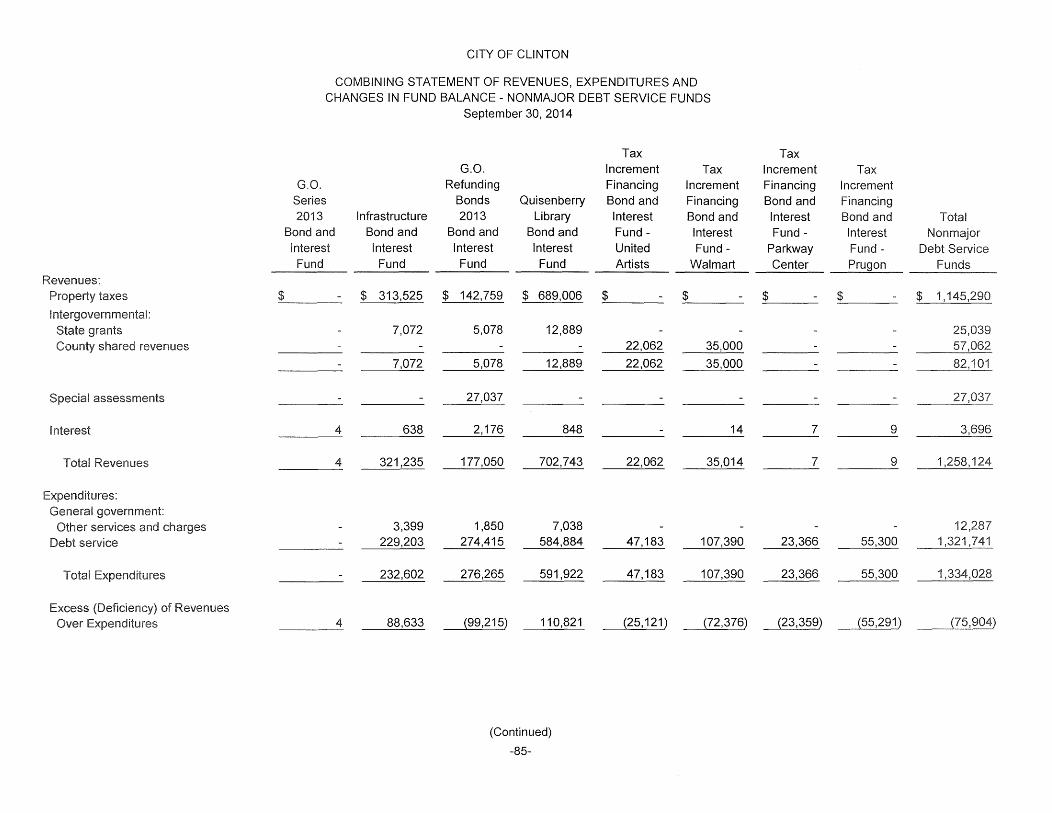
Revenues: taxes $
assessments
Interest
Total Revenues
Other services and rh~mac Debt service
Total i-vnanrM•
(LJet1c1encv) of Revenues Over i:=vnonrlit1
CITY OF CLINTON
COMBINING STATEMENT OF REVENUES, EXPENDITURES AND CHANGES IN FUND BALANCE - NONMAJOR DEBT SERVICE FUNDS
G.O. Series 2013
Bond and Interest Fund
-
-
4
4
4
Infrastructure Bond and Interest Fund
$ 313,525
7,072
7,072
-
638
321,235
3,399 229,203
232,602
88,633
September 30, 2014
G.O. Refunding
Bonds Quisenberry 2013 Library
Bond and Bond and
$
Interest Fund
142,759
5,078
5,078
27,037
2,176
177,050
1,850 274,415
276,265
(99,215)
Interest Fund
$ 689,006
12,889
12,889
-
848
702,743
7,038 584,884
591,922
110,821
(Continued)
-85-
Tax Increment Tax Financing Increment Bond and Financing Interest Bond and Fund - Interest United Fund -Artists Wal mart
$ - $ -
- -22,062 35,000
22,062 35,000
- -
- 14
22,062 35,014
47, 183 107,390
47,183 107,390
(25, 121) (72,376)
Tax Increment Financing Bond and Interest Fund -
Parkway Center
$ -
---
-
7
7
23,366
23,366
(23,359)
Tax Increment Financing Bond and Interest Fund -Prugon
$ -
-
-
-
9
9
55,300
55,300
(55,291)
Total
Debt Service
$
Funds
1,145,290
57,062
82,101
1,258, 124
1 1,321,741
(75,904)
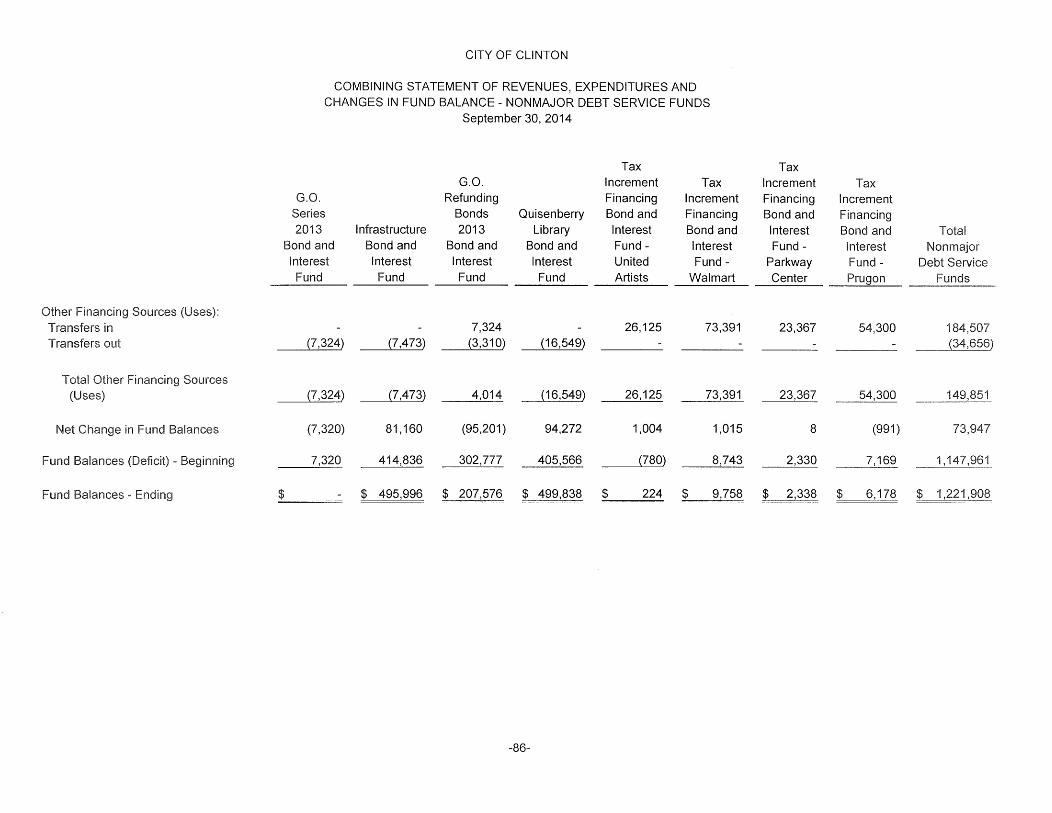
CITY OF CLINTON
COMBINING STATEMENT OF REVENUES, EXPENDITURES AND CHANGES IN FUND BALANCE - NONMAJOR DEBT SERVICE FUNDS
September 30, 2014
Tax Tax G.O. Increment Tax Increment Tax
G.O. Refunding Financing Increment Financing Increment Series Bonds Quisenberry Bond and Financing Bond and Financing 2013 Infrastructure 2013 Library Interest Bond and Interest Bond and Total
Bond and Bond and Bond and Bond and Fund - Interest Fund - Interest Non major Interest Interest Interest Interest United Fund - Parkway Fund - Debt Service Fund Fund Fund Fund Artists Wal mart Center Prugon Funds
Other Financing Sources , Transfers in - - 7,324 - 26, 125 73,391 23,367 54,300 1 Transfers out (7,324) (7,473) (3,310) (16,549) - - - - (34,656)
Total Other Financing Sources (7,324) (7,473) 4,014 (16,549) 26,125 73,391 23,367 54,300 149,851
Net Chanae in Fund Balances (7,320) 81, 160 (95,201) 94,272 1,004 1,015 8 (991)
Fund Balances <Deficit) - Beainnina 7,320 414,836 302,777 405,566 (780) 8,743 2,330 69 1, 147,961
Fund Balances - Endina $ - $ 495,996 $ 207,576 $ 499,838 $ 224 $ 9,758 $ 2,338 $ 6,178 $ 1,221,908
-86-
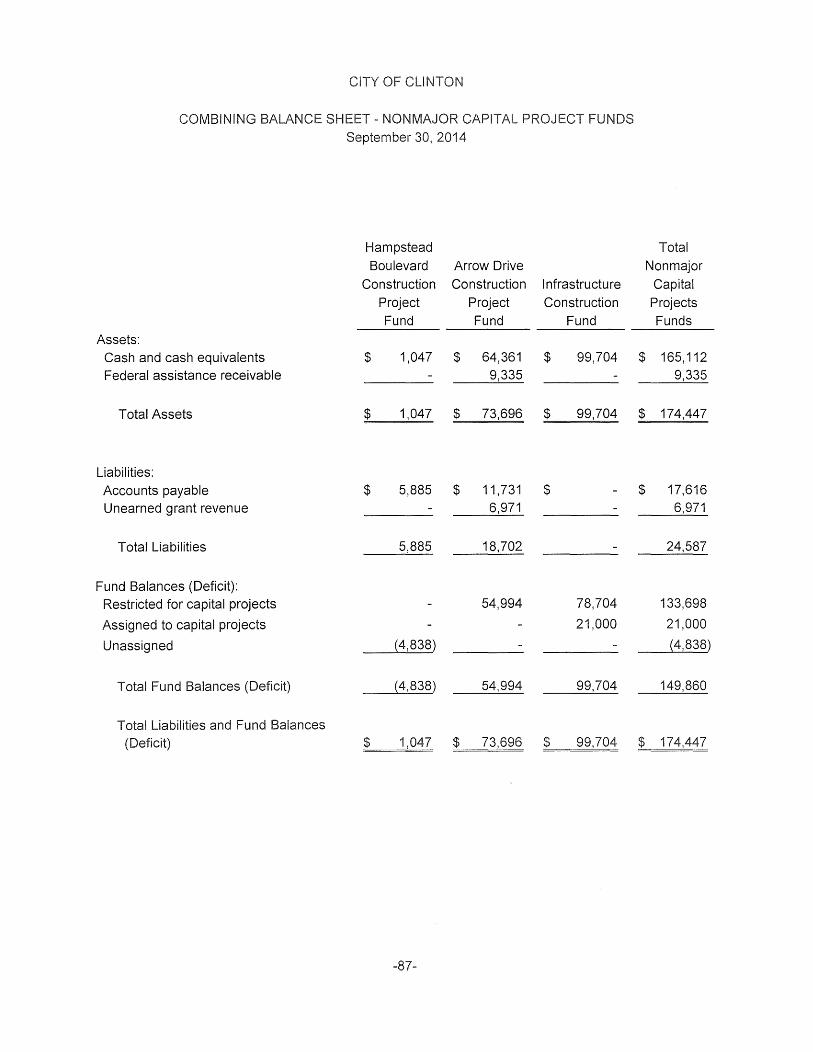
CITY OF CLINTON
COMBINING BALANCE SHEET - NONMAJOR CAPITAL PROJECT FUNDS September 30, 2014
Hampstead Boulevard Arrow Drive
Construction Construction Infrastructure Project Project Construction Fund Fund Fund
Assets: Cash and cash equivalents $ 1,047 $ 64,361 $ 99,704 Federal assistance receivable 9,335
Total Assets $ 1,047 $ 73,696 $ 99,704
Liabilities: Accounts payable $ 5,885 $ 11, 731 $ Unearned grant revenue 6,971
Total Liabilities 5,885 18,702
Fund Balances (Deficit): Restricted for capital projects 54,994 78,704
Assigned to capital projects 21,000
Unassigned (4,838)
Total Fund Balances (Deficit) (4,838) 54,994 99,704
Total Liabilities and Fund Balances (Deficit) $ 1,047 $ 73,696 $ 99,704
-87-
Total Non major
Capital Projects Funds
$ 165, 112 9,335
$ 174,447
$ 17,616 6,971
24,587
133,698
21,000
(4,838)
149,860
$ 174,447
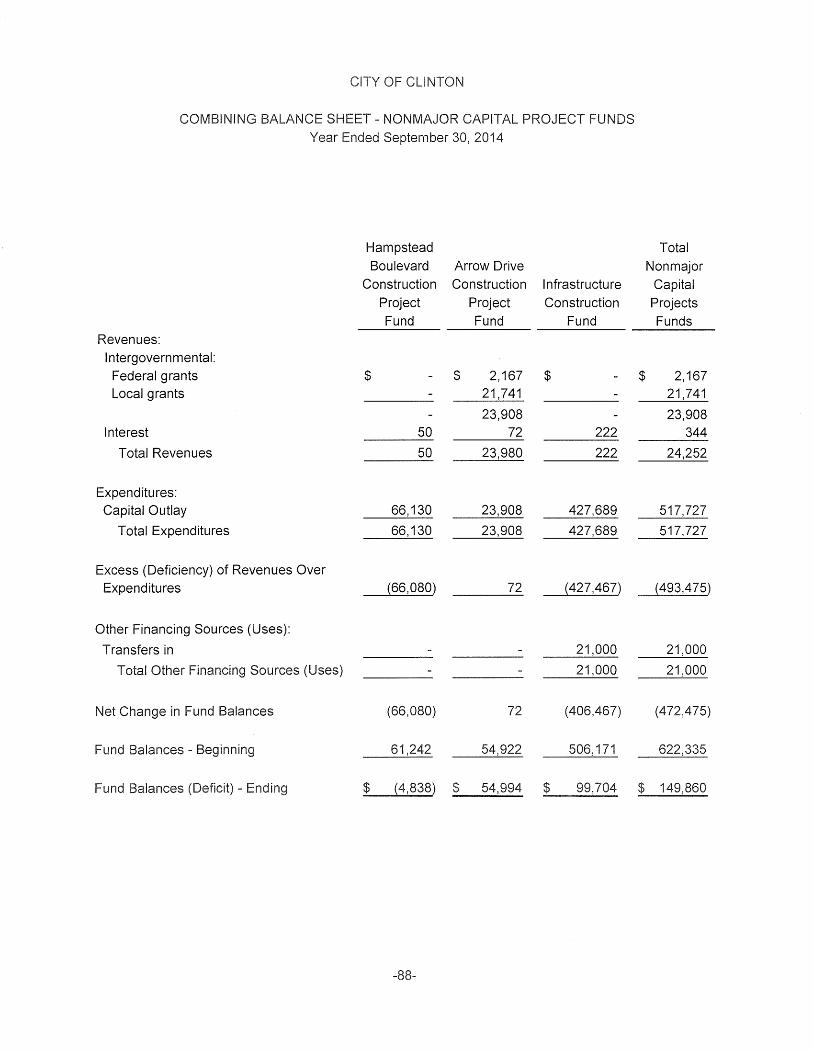
CITY OF CLINTON
COMBINING BALANCE SHEET - NONMAJOR CAPITAL PROJECT FUNDS Year Ended September 30, 2014
Hampstead Boulevard Arrow Drive
Construction Construction Infrastructure Project Project Construction Fund Fund Fund
Revenues: Intergovernmental: Federal grants $ $ 2,167 $ Local grants 21,741
23,908 Interest 50 72 222
Total Revenues 50 23,980 222
Expenditures: Capital Outlay 66, 130 23,908 427,689
Total Expenditures 66, 130 23,908 427,689
Excess (Deficiency) of Revenues Over Expenditures (66,080) 72 (427,467)
Other Financing Sources (Uses):
Transfers in 21,000
Total Other Financing Sources (Uses) 21,000
Net Change in Fund Balances (66,080) 72 (406,467)
Fund Balances - Beginning 61,242 54,922 506, 171
Fund Balances (Deficit) - $ {4,838) $ 99,704
-88-
Total Non major
Capital Projects Funds
$ 2,167 21,741
23,908 344
24,252
517,727
517,727
(493,475)
21,000
21,000
(472,475)
622,335
$ 149,860
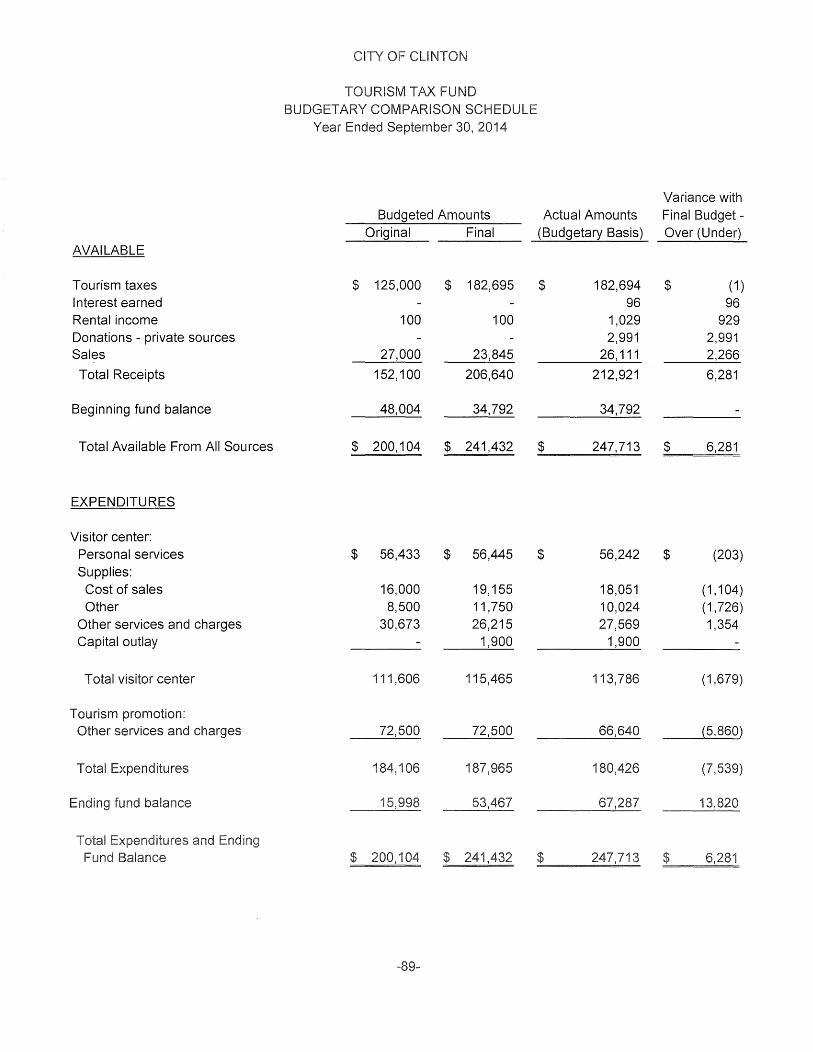
AVAILABLE
Tourism taxes Interest earned Rental income Donations - private sources Sales
Total Receipts
Beginning fund balance
Total Available From All Sources
OF CLINTON
TOURISM TAX FUND BUDGETARY COMPARISON SCHEDULE
Year Ended September 30, 2014
Budgeted Amounts Original Final
$ 125,000 $ 182,695
100 100
27,000 23,845
152, 100 206,640
48,004 34,792
$ 200, 104 $ 241,432
-89-
Variance with Actual Amounts Final Budget -
(Budgetary Basis) Over (Under)
$ 182,694 $ ( 1) 96 96
1,029 929 2,991 2,991
26, 111 2,266
212,921 6,281
34,792
$ 247,713 $ 6,281
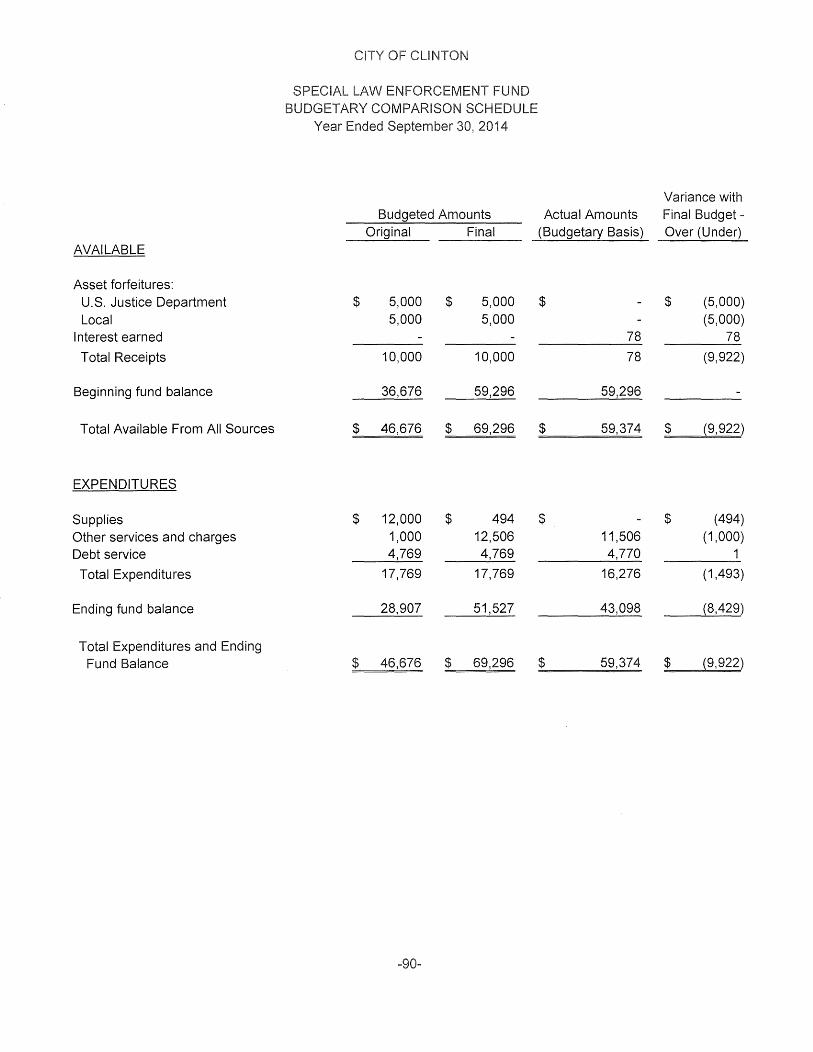
AVAILABLE
Asset forfeitures: U.S. Justice Department Local
Interest earned
Total Receipts
Beginning fund balance
Total Available From All Sources
EXPENDITURES
Supplies Other services and charges Debt service
Total Expenditures
Ending fund balance
Total Expenditures and Ending Fund Balance
NTON
SPECIAL LAW ENFORCEMENT FUND BUDGETARY COMPARISON SCHEDULE
Year Ended September 30, 2014
Budgeted Amounts Original Final
$ 5,000 $ 5,000 5,000 5,000
10,000 10,000
36,676 59,296
$ 46,676 $ 69,296
$ 12,000 $ 494 1,000 12,506 4,769 4,769
17,769 17,769
28,907 51,527
$ 46,676 $ 69,296
-90-
Variance with Actual Amounts Final Budget -
(Budgetary Basis) Over (Under)
$ $ (5,000) (5,000)
78 78
78 (9,922)
59,296
$ 59,374 $ (9,922)
$ $ (494) 11,506 (1,000) 4,770 1
16,276 (1,493)
43,098 (8,429)
$ 59,374 $ {9,922)
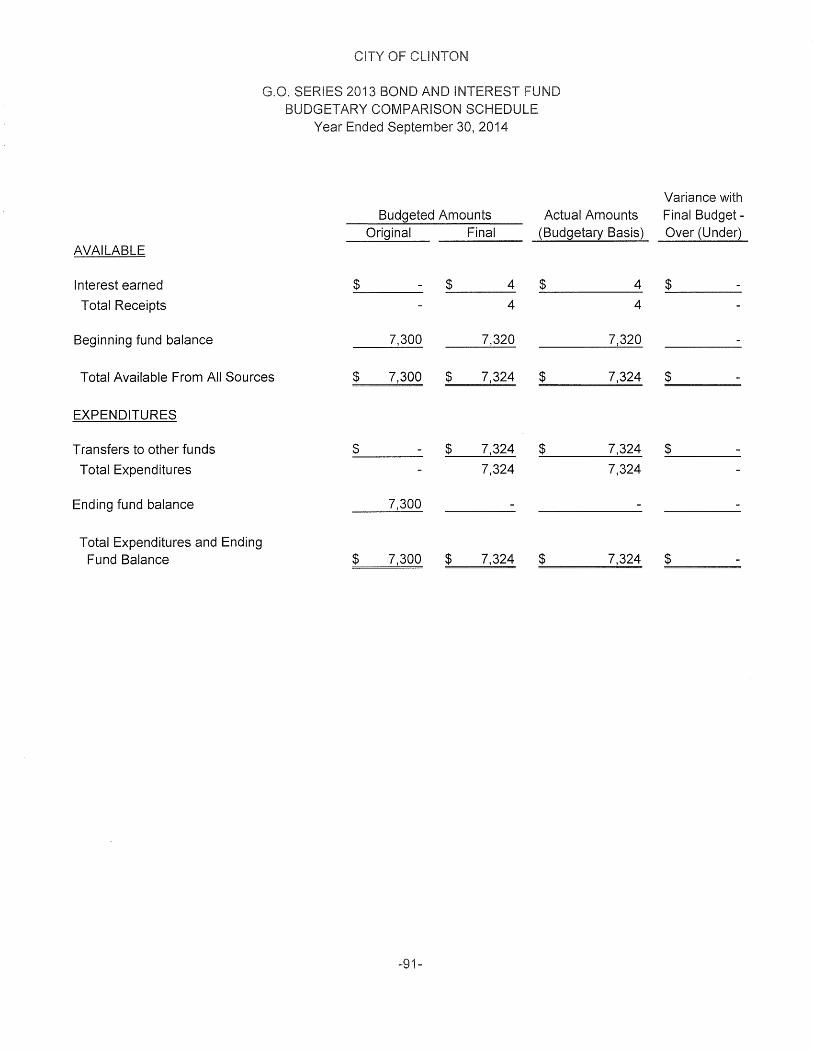
AVAILABLE
Interest earned
Total Receipts
Beginning fund balance
OF CLINTON
G.O. SERIES 2013 BOND AND INTEREST FUND BUDGETARY COMPARISON SCHEDULE
Year Ended September 30, 2014
Budgeted Amounts Actual Amounts Original Final (Budgetary Basis)
$ $ 4 $ 4
4 4
7,300 7,320 7,320
Total Available From All Sources $ 7,300 $ 7,324 $ 7,324
EXPENDITURES
Transfers to other funds $ $ 7,324 $ 7,324
Total Expenditures 7,324 7,324
Ending fund balance 7,300
Total Expenditures and Ending Fund Balance $ 7,300 $ 7,324 $ 7,324
-91-
Variance with Final Budget -Over (Under)
$
$
$
$
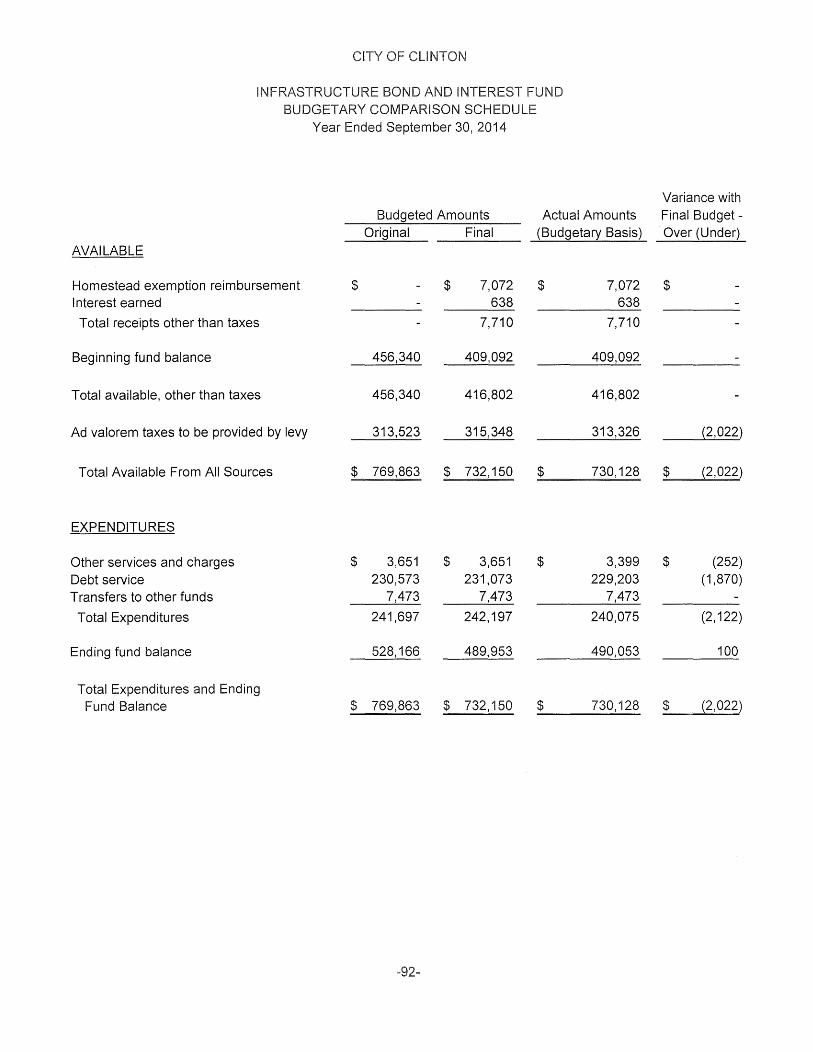
CITY CLINTON
INFRASTRUCTURE BOND AND INTEREST FUND BUDGETARY COMPARISON SCHEDULE
Year Ended September 30, 2014
Budgeted Amounts Actual Amounts Original Final (Budgetary Basis)
AVAILABLE
Homestead exemption reimbursement $ $ 7,072 $ 7,072 Interest earned 638 638
Total receipts other than taxes 7,710 7,710
Beginning fund balance 456,340 409,092 409,092
Total available, other than taxes 456,340 416,802 416,802
Ad valorem taxes to be provided by levy 313,523 315,348 313,326
Total Available From All Sources $ 769,863 $ 732, 150 $ 730, 128
EXPENDITURES
Other services and charges $ 3,651 $ 3,651 $ 3,399 Debt service 230,573 231,073 229,203 Transfers to other funds 7,473 7,473 7,473
Total Expenditures 241,697 242,197 240,075
Ending fund balance 528, 166 489,953 490,053
Total Expenditures and Ending Fund Balance $ 769,863 $ 732, 150 $ 730, 128
-92-
Variance with Final Budget -Over (Under)
$
(2,022)
$ (2,022)
$ (252) (1,870)
(2, 122)
100
$ {2,022)
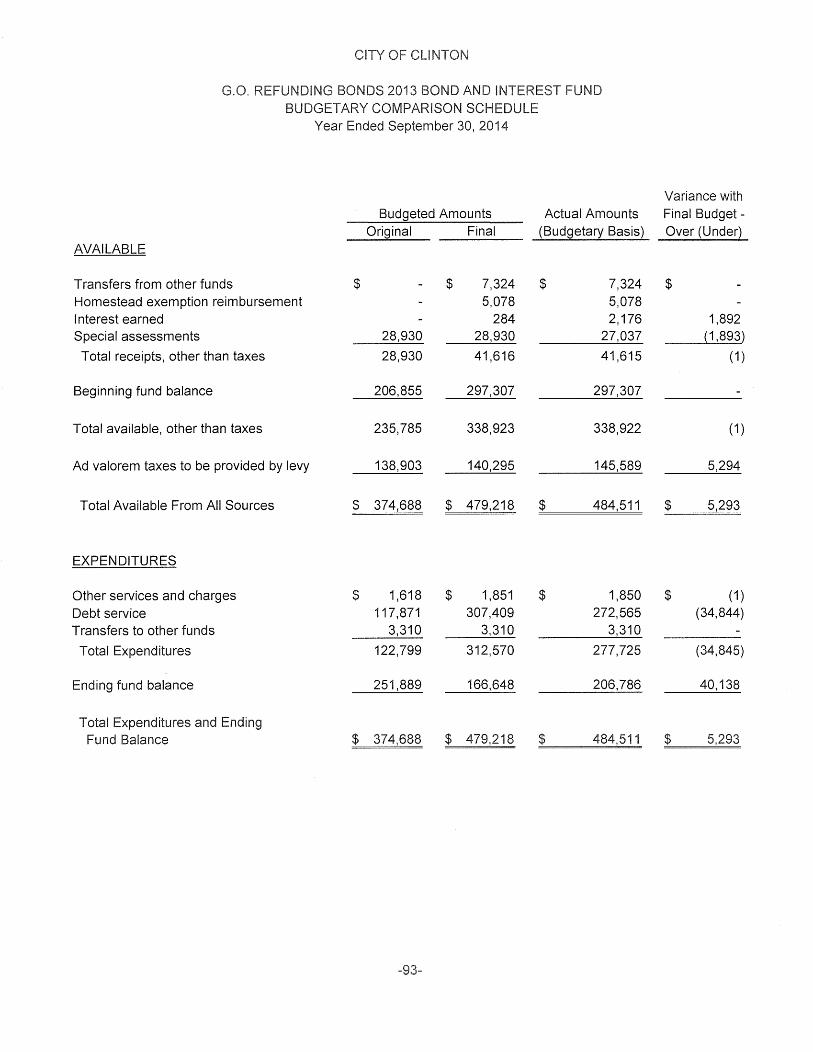
CITY OF CLINTON
G.O. REFUNDING BONDS 2013 BOND AND INTEREST FUND BUDGETARY COMPARISON SCHEDULE
Year Ended September 30, 2014
Budgeted Amounts Actual Amounts Original Final (Budgetary Basis)
AVAILABLE
Transfers from other funds $ $ 7,324 $ 7,324 Homestead exemption reimbursement 5,078 5,078 Interest earned 284 2,176 Special assessments 28,930 28,930 27,037
Total receipts, other than taxes 28,930 41,616 41,615
Beginning fund balance 206,855 297,307 297,307
Total available, other than taxes 235,785 338,923 338,922
Ad valorem taxes to be provided by levy 138,903 140,295 145,589
Total Available From All Sources $ 374,688 $ 479,218 $ 484,511
EXPENDITURES
Other services and charges $ 1,618 $ 1,851 $ 1,850 Debt service 117,871 307,409 272,565 Transfers to other funds 3,310 3,310 3,310
Total Expenditures 122,799 312,570 277,725
Ending fund balance 251,889 166,648 206,786
Total Expenditures and Ending Fund Balance $ 374,688 $ 479,218 $ 484,511
-93-
Variance with Final Budget -Over (Under)
$
1,892 {1,893)
( 1)
( 1)
5,294
$ 5,293
$ ( 1) (34,844)
(34,845)
40, 138
$ 5,293
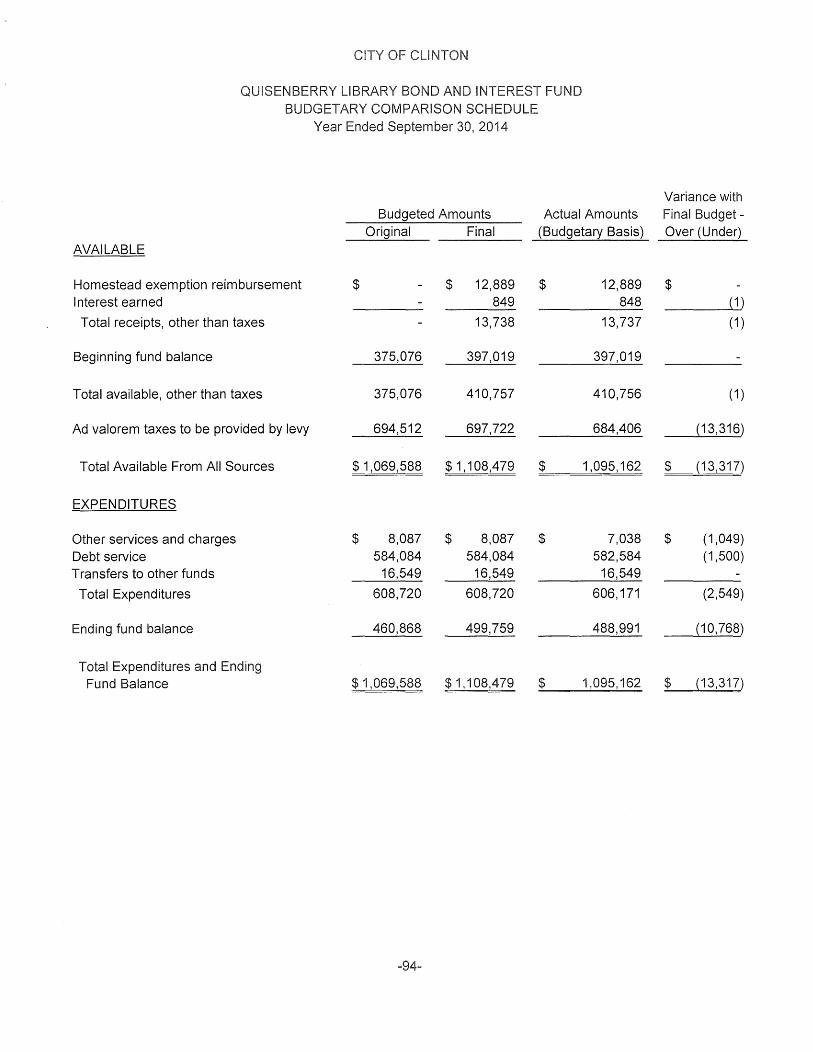
CLINTON
LIBRARY BOND AND INTEREST FUND BUDGETARY COMPARISON SCHEDULE
Year Ended September 30, 2014
Budgeted Amounts Actual Amounts Original Final (Budgetary Basis)
AVAILABLE
Homestead exemption reimbursement $ $ 12,889 $ 12,889 Interest earned 849 848
Total receipts, other than taxes 13,738 13,737
Beginning fund balance 375,076 397,019 397,019
Total available, other than taxes 375,076 410,757 410,756
Ad valorem taxes to be provided by levy 694,512 697,722 684,406
Total Available From All Sources $ 1,069,588 $ 1, 108,479 $ 1,095, 162
EXPENDITURES
Other services and charges $ 8,087 $ 8,087 $ 7,038 Debt service 584,084 584,084 582,584 Transfers to other funds 16,549 16,549 16,549
Total Expenditures 608,720 608,720 606, 171
Ending fund balance 460,868 499,759 488,991
Total Expenditures and Ending Fund Balance $1,069,588 $ 1, 108,479 $ 1,095, 162
-94-
Variance with Final Budget -Over (Under)
$ { 1)
( 1)
( 1)
{13,316)
$ {13,317)
$ (1,049) (1,500)
(2,549)
{10,768)
$ {13,317)
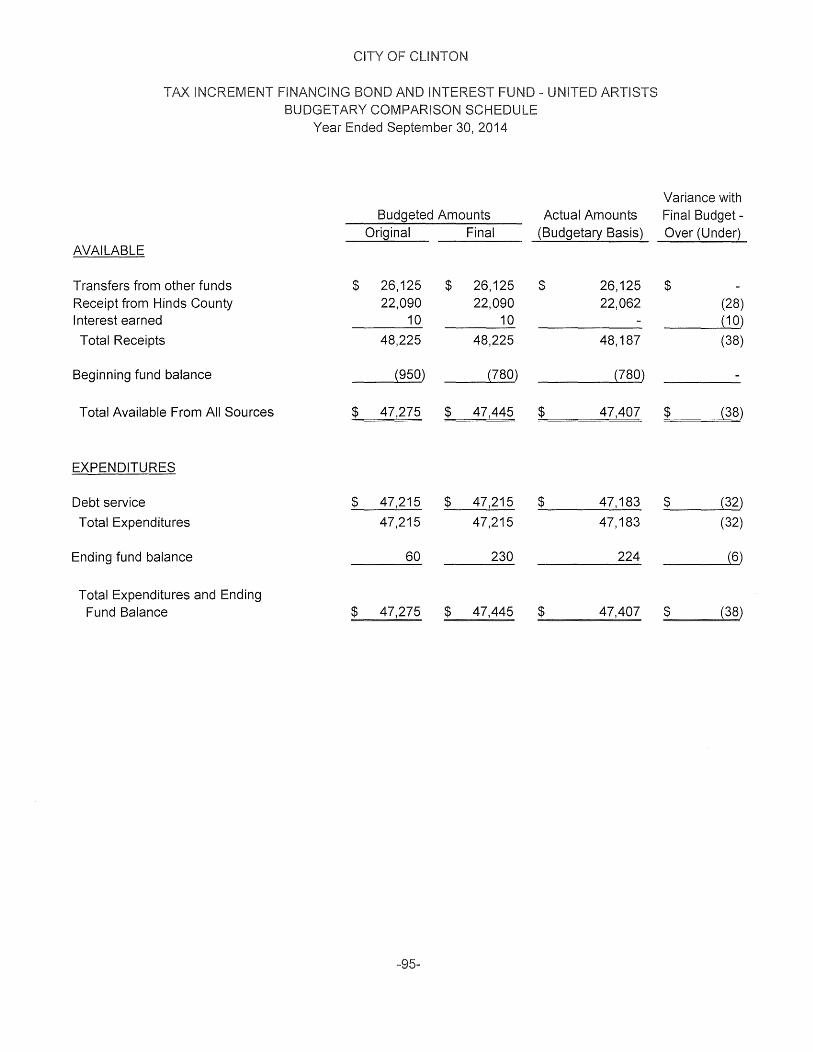
CITY CLINTON
TAX INCREMENT FINANCING BOND AND INTEREST FUND - UNITED BUDGETARY COMPARISON SCHEDULE
Year Ended September 30, 2014
Budgeted Amounts Actual Amounts Original Final (Budgetary Basis)
AVAILABLE
Transfers from other funds $ 26, 125 $ 26, 125 $ 26, 125 Receipt from Hinds County 22,090 22,090 22,062 Interest earned 10 10
Total Receipts 48,225 48,225 48, 187
Beginning fund balance (950) (780) (780)
Total Available From All Sources $ 47,275 $ 47,445 $ 47,407
EXPENDITURES
Debt service $ 47,215 $ 47,215 $ 47, 183
Total Expenditures 47,215 47,215 47,183
Ending fund balance 60 230 224
Total Expenditures and Ending Fund Balance $ 47,275 $ 47,445 $ 47,407
-95-
Variance with Final Budget -Over (Under)
$ (28) (10)
(38)
$ {38)
$ (32)
(32)
(6)
$ (38)
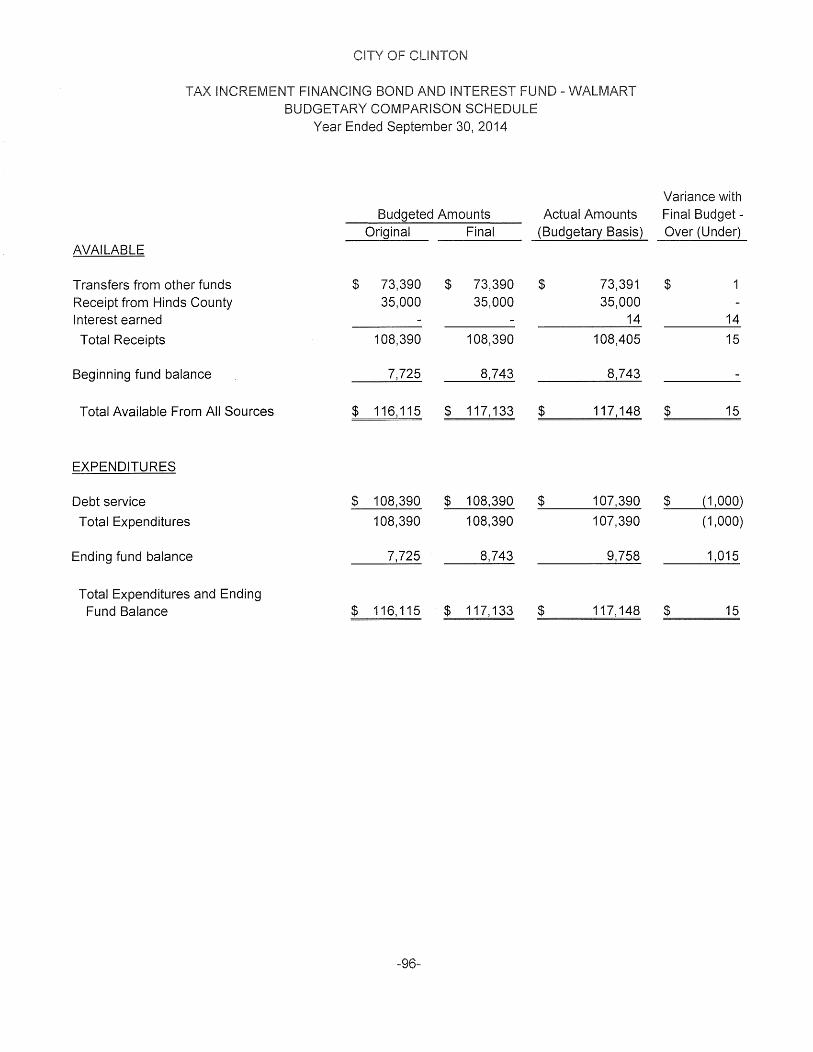
OF CLINTON
TAX INCREMENT BOND AND INTEREST FUND - WALMART
AVAILABLE
Transfers from other funds Receipt from Hinds County Interest earned
Total Receipts
Beginning fund balance
Total Available From All Sources
EXPENDITURES
Debt service
Total Expenditures
Ending fund balance
Total Expenditures and Ending Fund Balance
BUDGETARY COMPARISON SCHEDULE Year Ended September 30, 2014
Budgeted Amounts Original Final
$ 73,390 $ 73,390 35,000 35,000
108,390 108,390
7,725 8,743
$ 116,115 $ 117,133
$ 108,390 $ 108,390
108,390 108,390
7,725 8,743
$ 116, 115 $ 117, 133
-96-
Actual Amounts (Budgetary Basis)
$ 73,391 35,000
14
108,405
8,743
$ 117, 148
$ 107,390
107,390
9,758
$ 117, 148
Variance with Final Budget -Over (Under)
$
14
15
$ 15
$ {1 ,000)
(1,000)
1,015
$ 15
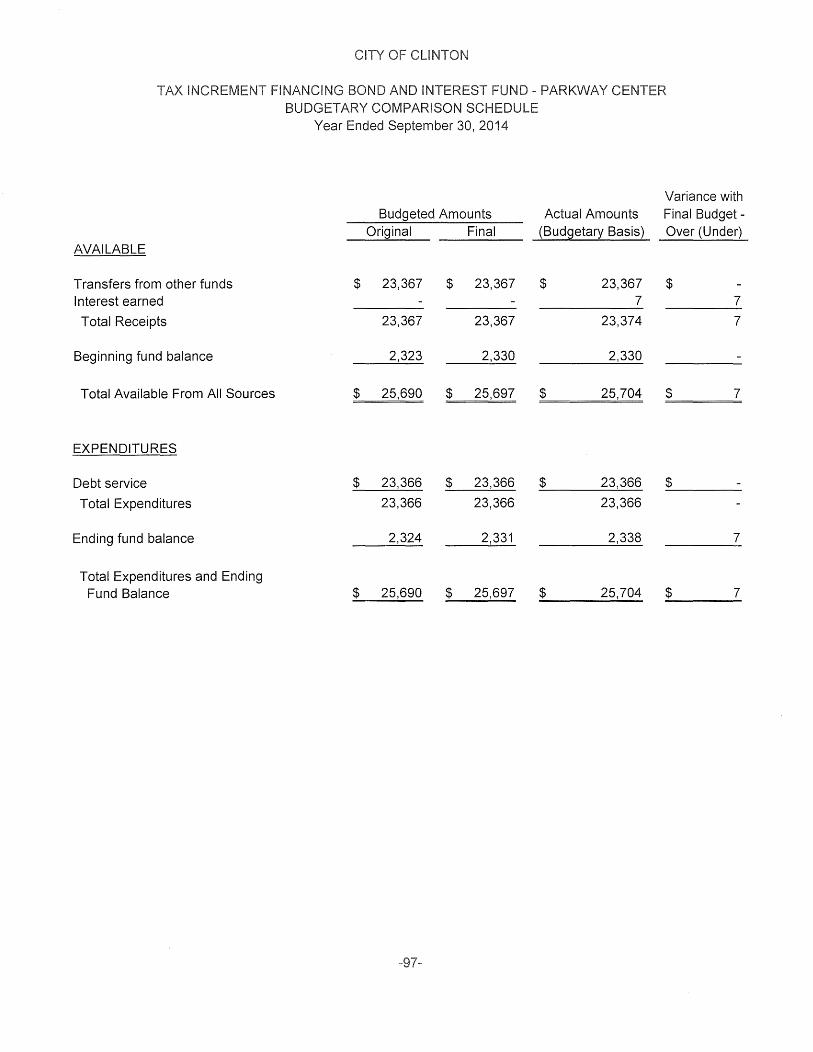
CITY OF CLINTON
TAX INCREMENT FINANCING BOND AND INTEREST FUND - PARKWAY CENTER BUDGETARY COMPARISON SCHEDULE
Year Ended September 30, 2014
Variance with Budgeted Amounts Actual Amounts Final Budget -
Original Final (Budgetary Basis) Over (Under) AVAILABLE
Transfers from other funds $ 23,367 $ 23,367 $ 23,367 $ Interest earned 7 7
Total Receipts 23,367 23,367 23,374 7
Beginning fund balance 2,323 2,330 2,330
Total Available From All Sources $ 25,690 $ 25,697 $ 25,704 $ 7
EXPENDITURES
Debt service $ 23,366 $ 23,366 $ 23,366 $
Total Expenditures 23,366 23,366 23,366
Ending fund balance 2,324 2,331 2,338 7
Total Expenditures and Ending Fund Balance $ 25,690 $ 25,697 $ 25,704 $ 7
-97-
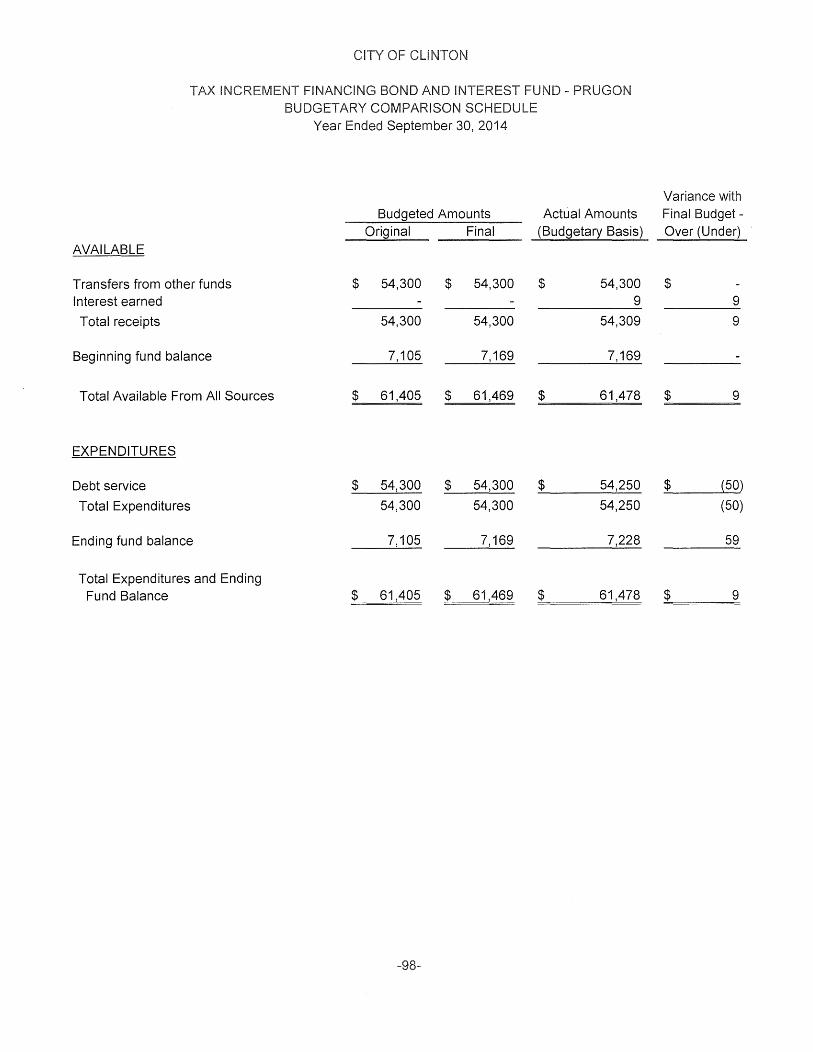
OF CLINTON
TAX INCREMENT FINANCING BOND AND INTEREST FUND - PRUGON BUDGETARY COMPARISON SCHEDULE
Year Ended September 30, 2014
Budgeted Amounts Actual Amounts Original Final (Budgetary Basis)
AVAILABLE
Transfers from other funds $ 54,300 $ 54,300 $ 54,300 Interest earned 9
Total receipts 54,300 54,300 54,309
Beginning fund balance 7, 105 7,169 7,169
Total Available From All Sources $ 61,405 $ 61,469 $ 61,478
EXPENDITURES
Debt service $ 54,300 $ 54,300 $ 54,250
Total Expenditures 54,300 54,300 54,250
Ending fund balance 7,105 7,169 7,228
Total Expenditures and Ending Fund Balance $ 61,405 $ 61,469 $ 61,478
-98-
Variance with Final Budget -Over (Under)
$ 9
9
$ 9
$ {50)
(50)
59
$ 9
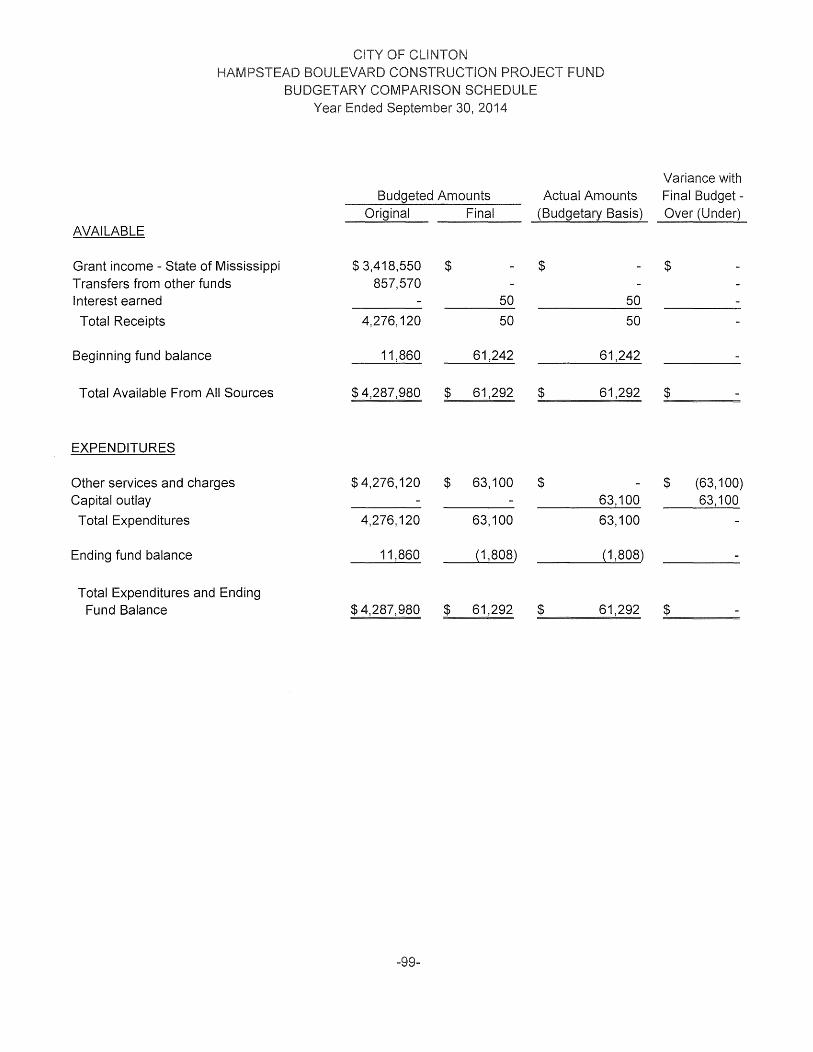
CITY OF CLINTON HAMPSTEAD BOULEVARD PROJECT FUND
AVAILABLE
Grant income - State of Mississippi Transfers from other funds Interest earned
Total Receipts
Beginning fund balance
Total Available From All Sources
EXPENDITURES
Other services and charges Capital outlay
Total Expenditures
Ending fund balance
Total Expenditures and Ending Fund Balance
BUDGETARY COMPARISON SCHEDULE Year Ended September 30, 2014
Budgeted Amounts Original Final
$ 3,418,550 $ 857,570
50
4,276, 120 50
11,860 61,242
$ 4,287,980 $ 61,292
$ 4,276, 120 $ 63, 100
4,276, 120 63, 100
11,860 (1,808)
$ 4,287,980 $ 61,292
-99-
Actual Amounts (Budgetary Basis)
$
50
50
61,242
$ 61,292
$ 63,100
63, 100
(1,808)
$ 61,292
Variance with Final Budget -Over (Under)
$
$
$ (63, 100) 63,100
$
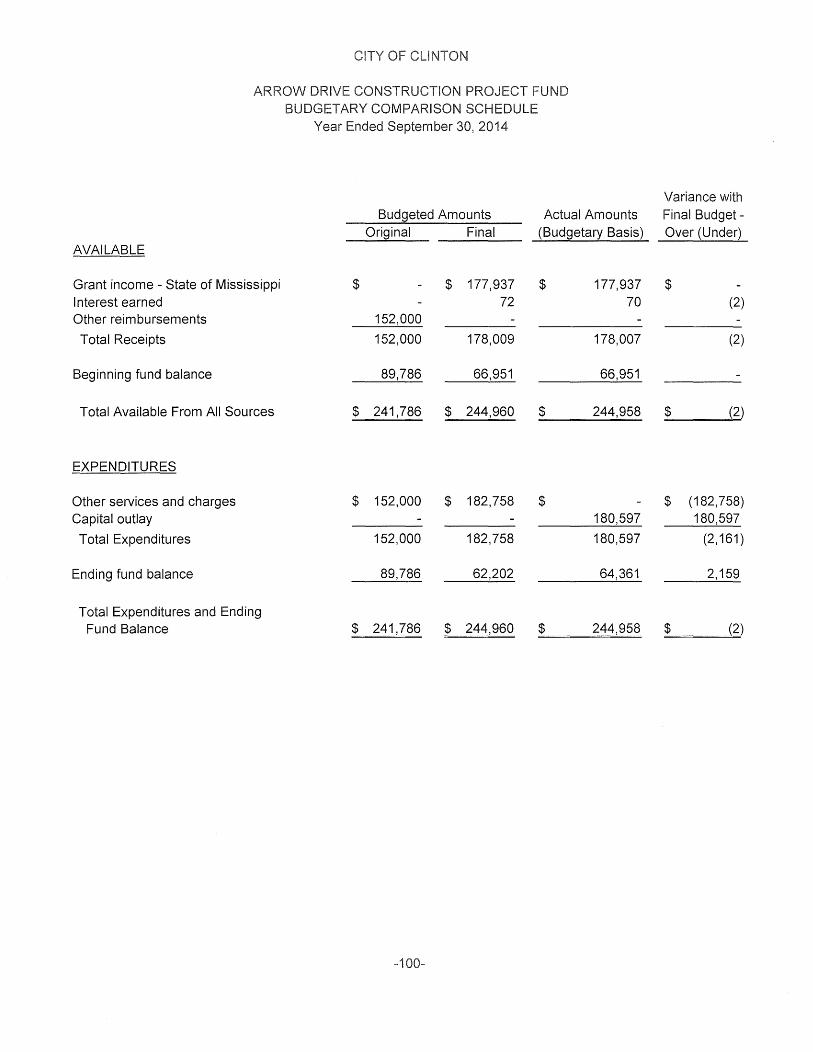
CITY CLINTON
ARROW DRIVE CONSTRUCTION PROJECT FUND BUDGETARY COMPARISON SCHEDULE
Year Ended September 30, 2014
Budgeted Amounts Actual Amounts Original Final (Budgetary Basis)
AVAILABLE
Grant income - State of Mississippi $ $ 177,937 $ 177,937 Interest earned 72 70 Other reimbursements 152,000
Total Receipts 152,000 178,009 178,007
Beginning fund balance 89,786 66,951 66,951
Total Available From All Sources $ 241,786 $ 244,960 $ 244,958
EXPENDITURES
Other services and charges $ 152,000 $ 182,758 $ Capital outlay 180,597
Total Expenditures 152,000 182,758 180,597
Ending fund balance 89,786 62,202 64,361
Total Expenditures and Ending Fund Balance $ 241,786 $ 244,960 $ 244,958
-100-
Variance with Final Budget -Over (Under)
$ (2)
(2)
$ {2)
$ (182,758) 180,597
(2,161)
2, 159
$ {2)
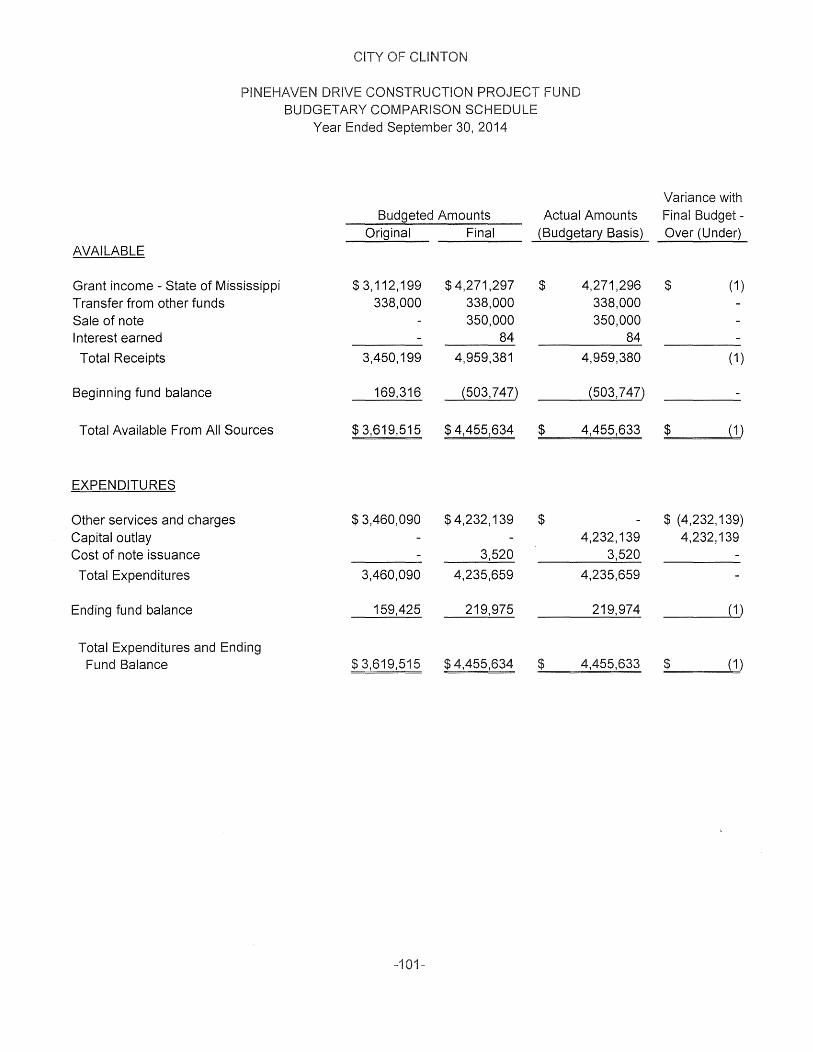
CITY OF CLINTON
PINEHAVEN DRIVE CONSTRUCTION PROJECT FUND BUDGETARY COMPARISON SCHEDULE
Year Ended September 30, 2014
Budgeted Amounts Actual Amounts Original Final (Budgetary Basis)
AVAILABLE
Grant income - State of Mississippi $3,112,199 $ 4,271,297 $ 4,271,296 Transfer from other funds 338,000 338,000 338,000 Sale of note 350,000 350,000 Interest earned 84 84
Total Receipts 3,450, 199 4,959,381 4,959,380
Beginning fund balance 169,316 (503,747) (503,747)
Total Available From All Sources $ 3,619,515 $ 4,455,634 $ 4,455,633
EXPENDITURES
Other services and charges $ 3,460,090 $ 4,232,139 $ Capital outlay 4,232, 139 Cost of note issuance 3,520 3,520
Total Expenditures 3,460,090 4,235,659 4,235,659
Ending fund balance 159,425 219,975 219,974
Total Expenditures and Ending Fund Balance $ 3,619,515 $ 4,455,634 $ 4,455,633
-101-
Variance with Final Budget -Over (Under)
$ ( 1)
( 1)
$ ( 1)
$ (4,232, 139) 4,232,139
( 1)
$ { 1)
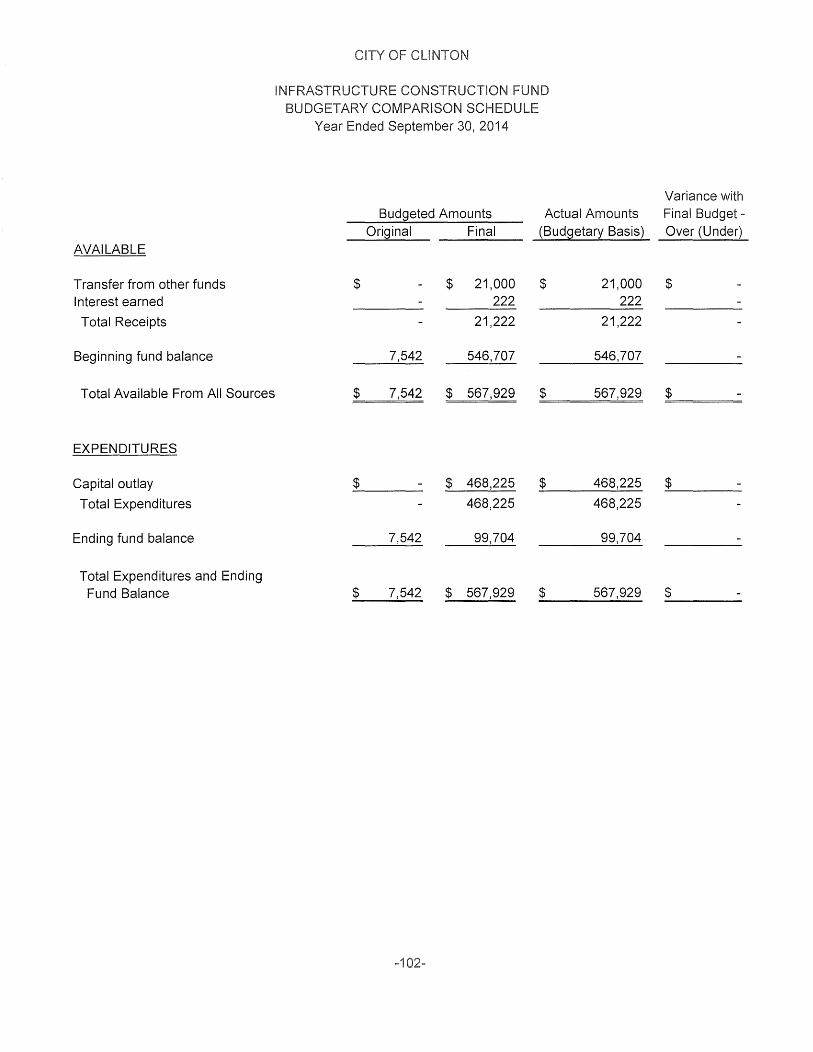
AVAILABLE
Transfer from other funds Interest earned
Total Receipts
Beginning fund balance
Total Available From All Sources
EXPENDITURES
Capital outlay
Total Expenditures
Ending fund balance
Total Expenditures and Ending Fund Balance
OF
INFRASTRUCTURE CONSTRUCTION FUND BUDGETARY COMPARISON SCHEDULE
Year Ended September 30, 2014
Budgeted Amounts Actual Amounts Original Final (Budgetary Basis)
$ $ 21,000 $ 21,000 222 222
21,222 21,222
7,542 546,707 546,707
$ 7,542 $ 567,929 $ 567,929
$ $ 468,225 $ 468,225
468,225 468,225
7,542 99,704 99,704
$ 7,542 $ 567,929 $ 567,929
-102-
Variance with Final Budget -Over (Under)
$
$
$
$
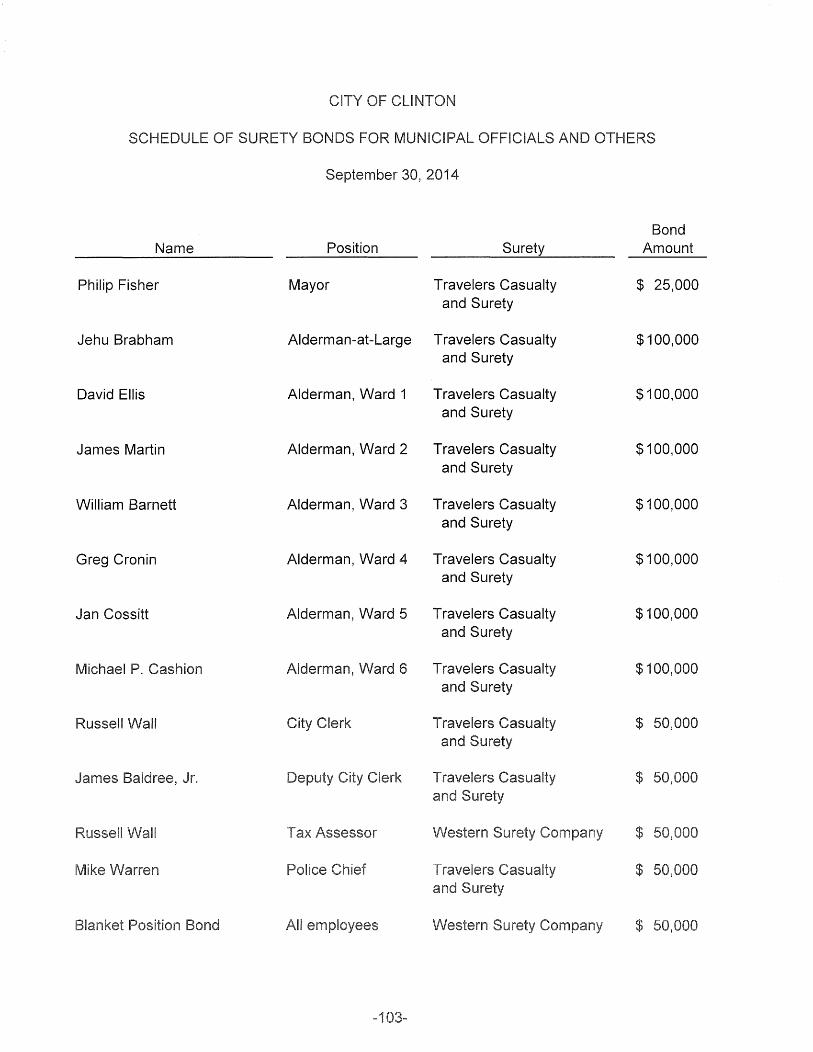
BONDS MUNICI
September 30, 2014
Bond Name Position Surety Amount
Philip Fisher Mayor Travelers Casualty $ 25,000 and Surety
Jehu Brabham Alderman-at-Large Travelers Casualty $100,000 and Surety
David Ellis Alderman, Ward 1 Travelers Casualty $100,000 and Surety
James Martin Alderman, Ward 2 Travelers Casualty $100,000 and Surety
William Barnett Alderman, Ward 3 Travelers Casualty $100,000 and Surety
Greg Cronin Alderman, Ward 4 Travelers Casualty $100,000 and Surety
Jan Cossitt Alderman, Ward 5 Travelers Casualty $100,000 and Surety
Michael Cashion Alderman, Ward 6 Travelers Casualty $100,000 and Surety
Russell Wall Clerk Travelers Casualty $ 50,000 and Surety
$
$
$
$
-1
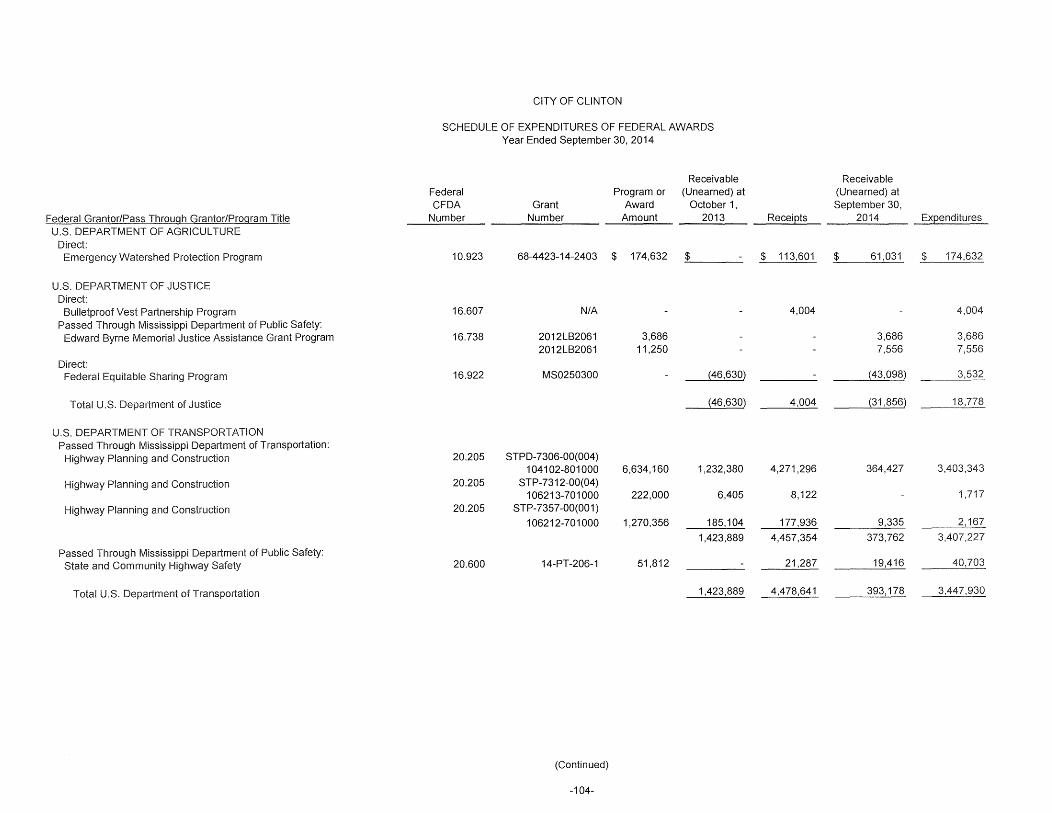
CITY OF CLINTON
SCHEDULE OF EXPENDITURES OF FEDERAL AWARDS Year Ended September 30, 2014
Receivable Receivable Federal Program or (Unearned) at (Unearned) at CFDA Grant Award October 1, September 30,
Federal Grantor/Pass Through Grantor/Program Title Number Number Amount 2013 Recei12ts 2014 Expenditures U.S. DEPARTMENT OF AGRICULTURE
Direct: Emergency Watershed Protection Program 10.923 68-4423-14-2403 $ 174,632 $ $ 113,601 $ 61,031 $ 174,632
U.S. DEPARTMENT OF JUSTICE Direct:
Bulletproof Vest Partnership Program 16.607 N/A - 4,004 4,004
Passed Through Mississippi Department of Public Safety: Edward Byrne Memorial Justice Assistance Grant Program 16.738 2012LB2061 3,686 3,686 3,686
2012LB2061 11,250 7,556 7,556
Direct: Federal Equitable Sharing Program 16.922 MS0250300 (46,630) (43,098) 3,532
Total U.S. Department of Justice (46,630) 4,004 (31,856) 18,778
U.S. DEPARTMENT OF TRANSPORTATION Passed Through Mississippi Department of Transportation:
Highway Planning and Construction 20.205 STPD-7306-00(004) 104102-801000 6,634,160 1,232,380 4,271,296 364,427 3,403,343
Highway Planning and Construction 20.205 STP-7312-00(04) 106213-701000 222,000 6,405 8,122 1,717
Highway Planning and Construction 20.205 STP-7357-00(001)
106212-701000 1,270,356 185,104 177,936 9,335 2,167
1,423,889 4,457,354 373,762 3,407,227
Passed Through Mississippi Department of Public Safety: State and Community Highway Safety 20.600 14-PT-206-1 51,812 21,287 19,416 40,703
Total U.S. Department of Transportation 1,423,889 4,478,641 393, 178 3,447,930
(Continued)
-104-
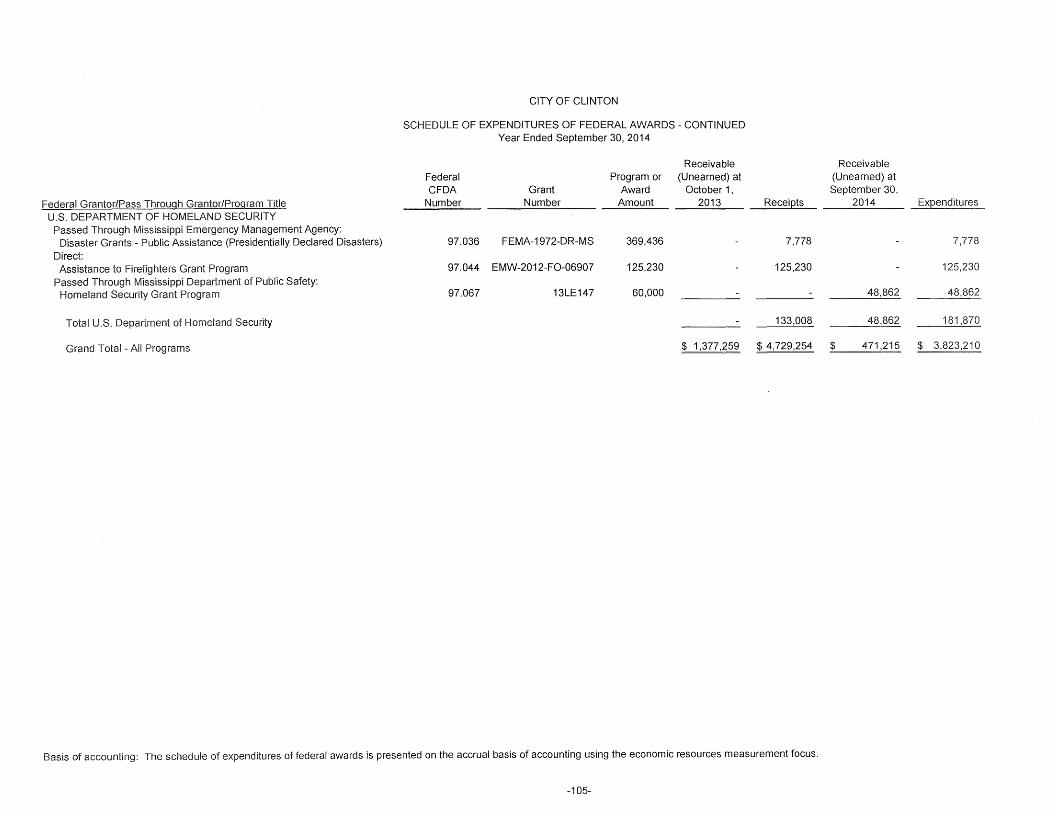
Federal Grantor/Pass Through Grantor/Program Title U.S. DEPARTMENT OF HOMELAND SECURITY
Passed Through Mississippi Emergency Management Agency: Disaster Grants - Public Assistance (Presidentially Declared Disasters)
Direct: Assistance to Firefighters Grant Program
Passed Through Mississippi Department of Public Safety: Homeland Security Grant Program
Total U.S. Department of Homeland Security
Grand Total -All Programs
CITY OF CLINTON
SCHEDULE OF EXPENDITURES OF FEDERAL AWARDS - CONTINUED Year Ended September 30, 2014
Receivable Federal Program or (Unearned) at CFDA Grant Award October 1,
Number Number Amount 2013
97.036 FEMA-1972-DR-MS 369,436
97.044 EMW-2012-F0-06907 125,230
97.067 13LE147 60,000
$ 1,377,259
Recei~
7,778
125,230
133,008
$ 4,729,254
Basis of accounting: The schedule of expenditures of federal awards is presented on the accrual basis of accounting using the economic resources measurement focus.
-105-
Receivable (Unearned) at September 30,
2014 Expenditures
7,778
125,230
48,862 48,862
48,862 181,870
$ 471,215 $ 3,823,210

STATISTICAL SECTION
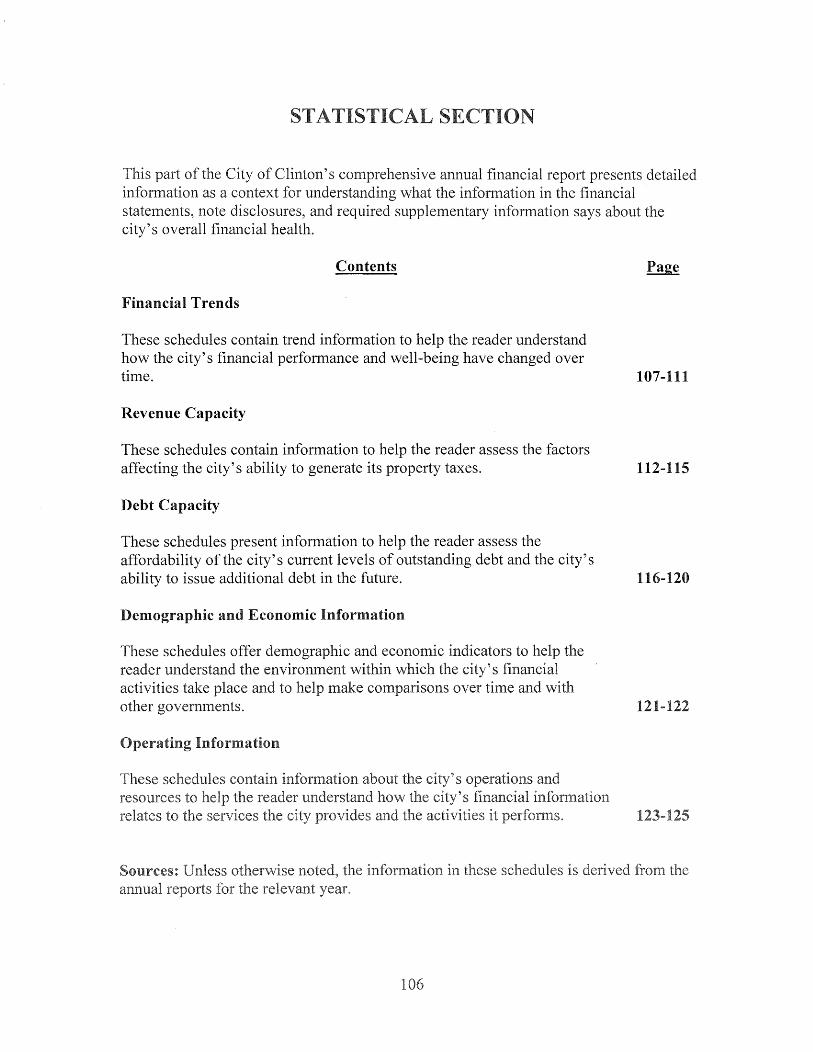
This part of the City of Clinton's comprehensive annual financial report presents detailed information as a context for understanding what the information in the financial statements, note disclosures, and required supplementary information says about the city's overall financial health.
Contents
Financial Trends
These schedules contain trend information to help the reader understand how the city's financial performance and well-being have changed over time.
Revenue Capacity
These schedules contain information to help the reader assess the factors affecting the city's ability to generate its property taxes.
Debt Capacity
These schedules present information to help the reader assess the affordability of the city's current levels of outstanding debt and the city's ability to issue additional debt in the future.
Demographic and Economic Information
These schedules offer demographic and economic indicators to help the reader understand the environment within which the city's financial activities take place and to help make comparisons over time and with other governments.
Operating Information
1
107-111
112-115
116-120
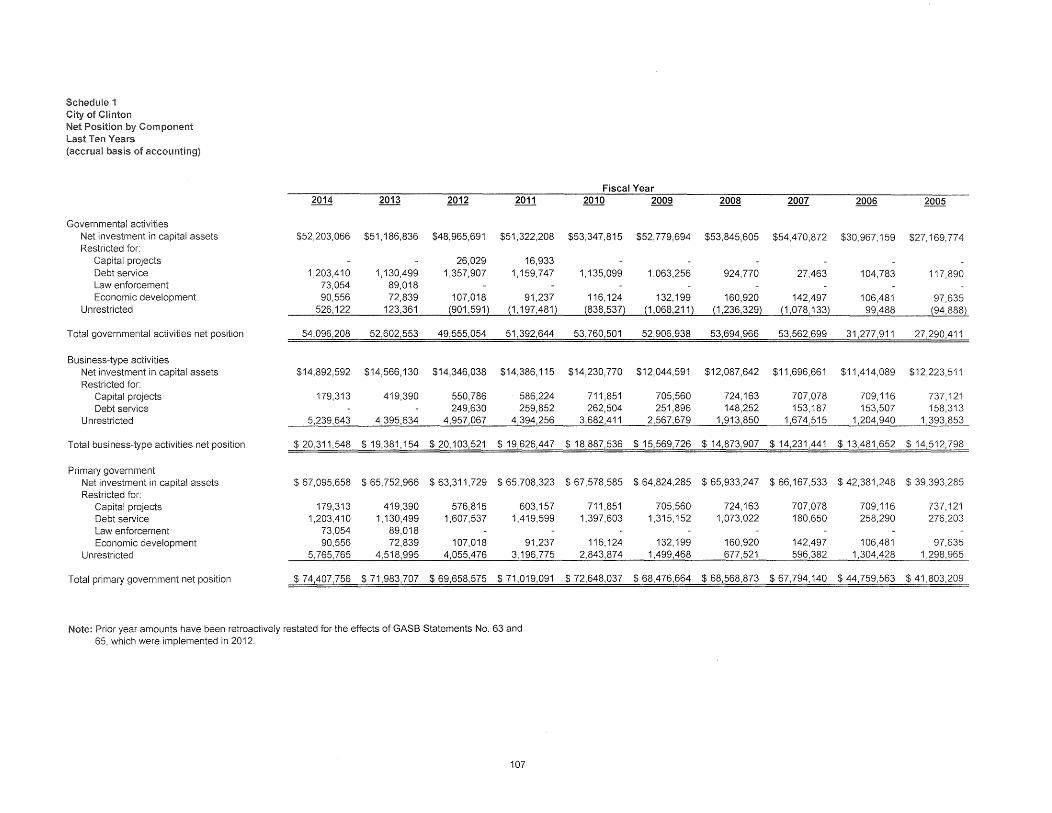
Schedule 1 City of Clinton Net Position by Component Last Ten Years (accrual basis of accounting)
2014 2013 2012 2011
Governmental activities Net investment in capital assets $52,203,066 $51, 186,836 $48,965,691 $51,322,208 Restricted for:
Capital projects 26,029 16,933 Debt service 1,203,410 1, 130,499 1,357,907 1,159,747 Law enforcement 73,054 89,018 Economic development 90,556 72,839 107,018 91,237
Unrestricted 526,122 123,361 {901,591} {1,197,481}
Total governmental activities net position 54,096,208 52,602,553 49,555,054 51,392,644
Business-type activities Net investment in capital assets $14,892,592 $14,566, 130 $14,346,038 $14,386,115 Restricted for:
Capital projects 179,313 419,390 550,786 586,224 Debt service 249,630 259,852
Unrestricted 5,239,643 4,395,634 4,957,067 4,394,256
Total business-type activities net position $ 20,311,548 $ 19,381, 154 $ 20, 103,521 $ 19,626,447
Primary government Net investment in capital assets $ 67,095,658 $ 65,752,966 $ 63,311,729 $ 65,708,323 Restricted for:
Capital projects 179,313 419,390 576,815 603,157 Debt service 1,203,410 1,130,499 1,607,537 1,419,599 Law enforcement 73,054 89,018 Economic development 90,556 72,839 107,018 91,237
Unrestricted 5,765,765 4,518,995 4,055,476 3, 196,775
Total primary government net position $ 74,407,756 $ 71,983,707 $ 69,658,575 $71,019,091
Note: Prior year amounts have been retroactively restated for the effects of GASB Statements No. 63 and 65, which were implemented in 2012.
107
Fiscal Year 2010 2009 2008 2007 2006 2005
$53,347,815 $52,779,694 $53,845,605 $54,470,872 $30,967, 159 $27, 169,774
1,135,099 1,063,256 924,770 27,463 104,783 117,890
116,124 132,199 160,920 142,497 106,481 97,635 {838,537} {1,068,211} {1,236,329} p,078,133} 99,488 (94,888}
53,760,501 52,906,938 53,694,966 53,562,699 31,277,911 27,290,411
$14,230,770 $12,044,591 $12,087,642 $11,696,661 $11,414,089 $12,223,511
711,851 705,560 724, 163 707,078 709, 116 737,121 262,504 251,896 148,252 153,187 153,507 158,313
3,682,411 2,567,679 1,913,850 1,674,515 1,204,940 1,393,853
$ 18,887,536 $ 15,569,726 $ 14,873,907 $ 14,231,441 $ 13,481,652 $ 14,512,798
$ 67,578,585 $ 64,824,285 $ 65,933,247 $ 66,167,533 $ 42,381,248 $ 39,393,285
711,851 705,560 724, 163 707,078 709,116 737, 121 1,397,603 1,315,152 1,073,022 180,650 258,290 276,203
116, 124 132,199 160,920 142,497 106,481 97,635 2,843,874 1,499,468 677,521 596,382 1,304,428 1,298,965
$ 72,648,037 $ 68,476,664 $ 68,568,873 $ 67,794, 140 $ 44,759,563 $ 41,803,209
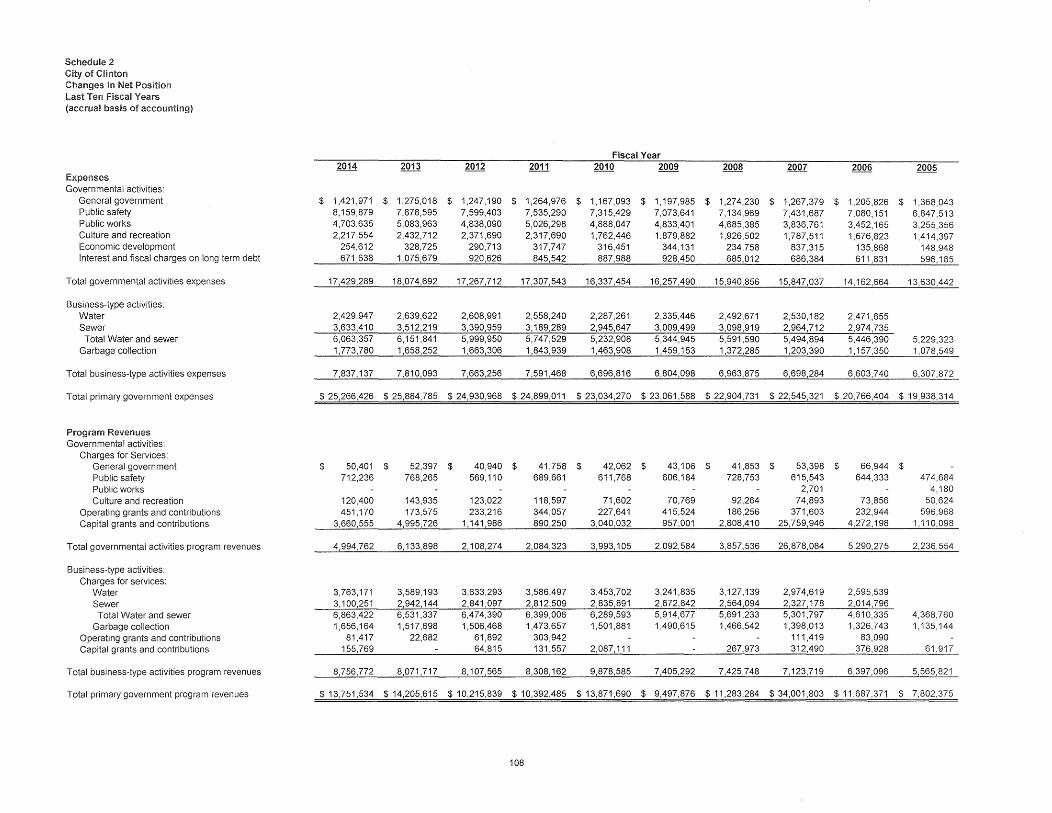
Schedule 2 City of Clinton Changes in Net Position Last Ten Fiscal Years (accrual basis of accounting)
Fiscal Year 2014 2013 2012 2011 2010 2009 2008 2007 2006 2005
Expenses Governmental activities:
General government $ 1,421,971 $ 1,275,018 $ 1,247,190 $ 1,264,976 $ 1,167,093 $ 1, 197,985 $ 1,274,230 $ 1,267,379 $ 1,205,826 $ 1,368,043 Public safety 8, 159,879 7,878,595 7,599,403 7,535,290 7,315,429 7,073,641 7,134,969 7,431,687 7,080, 151 6,847,513 Public works 4,703,635 5,083,963 4,838,090 5,026,298 4,888,047 4,833,401 4,685,385 3,836,761 3,452, 165 3,255,356 Culture and recreation 2,217,554 2,432,712 2,371,690 2,317,690 1,762,446 1,879,882 1,926,502 1,787,511 1,676,823 1,414,397 Economic development 254,612 328,725 290,713 317,747 316,451 344,131 234,758 837,315 135,868 148,948 Interest and fiscal charges on long term debt 671,638 1,075,679 920,626 845,542 887,988 928,450 685,012 686,384 611,831 596,185
Total governmental activities expenses 17,429,289 18,074,692 17,267,712 17,307,543 16,337,454 16,257,490 15,940,856 15,847,037 14,162,664 13,630,442
Business-type activities: Water 2,429,947 2,639,622 2,608,991 2,558,240 2,287,261 2,335,446 2,492,671 2,530, 182 2,471,655 Sewer 3,633,410 3,512,219 3,390,959 3,189,289 2,945,647 3,009,499 3,098,919 2,964,712 2,974,735 Total Water and sewer 6,063,357 6,151,841 5,999,950 5,747,529 5,232,908 5,344,945 5,591,590 5,494,894 5,446,390 5,229,323
Garbage collection 1,773,780 1,658,252 1,663,306 1,843,939 1,463,908 1,459, 153 1,372,285 1,203,390 1, 157,350 1,078,549
Total business-type activities expenses 7,837,137 7,810,093 7,663,256 7,591,468 6,696,816 6,804,098 6,963,875 6,698,284 6,603,740 6,307,872
Total primary government expenses $ 25,266,426 $ 25,884,785 $ 24,930,968 $ 24,899,011 $ 23,034,270 $ 23,061,588 $ 22,904,731 $ 22,545,321 $ 20,766,404 $ 19,938,314
Program Revenues Governmental activities:
Charges for Services: General government $ 50,401 $ 52,397 $ 40,940 $ 41,758 $ 42,062 $ 43,106 $ 41,853 $ 53,398 $ 66,944 $ Public safety 712,236 768,265 569,110 689,661 611,768 606,184 728,753 615,543 644,333 474,684 Public works 2,701 4,180 Culture and recreation 120,400 143,935 123,022 118,597 71,602 70,769 92,264 74,893 73,856 50,624
Operating grants and contributions 451,170 173,575 233,216 344,057 227,641 415,524 186,256 371,603 232,944 596,968 Capital grants and contributions 3,660,555 4,995,726 1,141,986 890,250 3,040,032 957,001 2,808,410 25,759,946 4,272,198 1,110,098
Total governmental activities program revenues 4,994,762 6, 133,898 2,108,274 2,084,323 3,993, 105 2,092,584 3,857,536 26,878,084 5,290,275 2,236,554
Business-type activities: Charges for services:
Water 3,763,171 3,589, 193 3,633,293 3,586,497 3,453,702 3,241,835 3,127,139 2,974,619 2,595,539 Sewer 3,100,251 2,942,144 2,841,097 2,812,509 2,835,891 2,672,842 2,564,094 2,327,178 2,014,796 Total Water and sewer 6,863,422 6,531,337 6,474,390 6,399,006 6,289,593 5,914,677 5,691,233 5,301,797 4,610,335 4,368,760
Garbage collection 1,656,164 1,517,698 1,506,468 1,473,657 1,501,881 1,490,615 1,466,542 1,398,013 1,326,743 1,135,144 Operating grants and contributions 81,417 22,682 61,892 303,942 111,419 83,090 Capital grants and contributions 155,769 64,815 131,557 2,087,111 267,973 312,490 376,928 61,917
Total business-type activities program revenues 8,756,772 8,071,717 8,107,565 8,308,162 9,878,585 7,405,292 7,425,748 7,123,719 6,397,096 5,565,821
Total primary government program revenues $ 13,751,534 $ 14,205,615 $ 10,215,839 $ 10,392,485 $ 13,871,690 $ 9,497,876 $ 11,283,284 $ 34,001,803 $ 11,687,371 $ 7,802,375
108
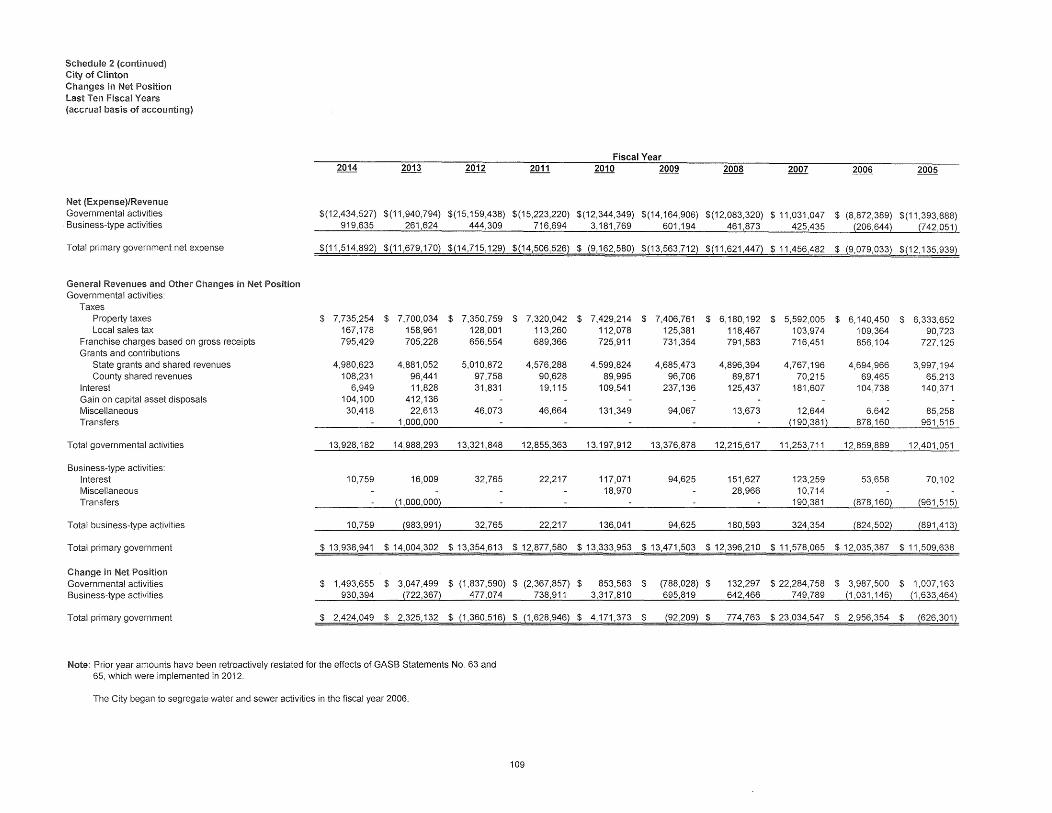
Schedule 2 (continued) City of Clinton Changes in Net Position last Ten Fiscal Years (accrual basis of accounting)
Net (Expense)/Revenue Governmental activities Business-type activities
Total primary government net expense
Genera! Revenues and Other Changes in Net Position Governmental activities:
Taxes Property taxes Local sales tax
Franchise charges based on gross receipts Grants and contributions
State grants and shared revenues County shared revenues
Interest Gain on capital asset disposals Miscellaneous Transfers
Total governmental activities
Business-type activities: Interest Miscellaneous Transfers
Total business-type activities
Total primary government
Change in Net Position Governmental activities Business-type activities
Total primary government
Fiscal Year 2014 2013 2012 2011 2010 2009 2008 2007 2006 2005
$(12,434,527) $(11,940,794) $(15,159,438) $(15,223,220) $(12,344,349) $(14,164,906) $(12,083,320) $ 11,031,047 $ (8,872,389) $(11,393,888) 919,635 261,624 444,309 716,694 3, 181,769 601, 194 461,873 425,435 (206,644) (742,051)
$(11,514,892) $(11,679, 170) $(14,715, 129) $(14,506,526) $ (9, 162,580) $(13,563,712) $(11,621,447) $ 11,456,482 $ (9,079,033) $(12, 135,939)
$ 7,735,254 $ 7,700,034 $ 7,350,759 $ 7,320,042 $ 7,429,214 $ 7,406,761 $ 6,180,192 $ 5,592,005 $ 6,140,450 $ 6,333,652 167,178 158,961 128,001 113,260 112,078 125,381 118,467 103,974 109,364 90,723 795,429 705,228 656,554 689,366 725,911 731,354 791,583 716,451 856,104 727,125
4,980,623 4,881,052 5,010,872 4,576,288 4,599,824 4,685,473 4,896,394 4,767,196 4,694,966 3,997,194 108,231 96,441 97,758 90,628 89,995 96,706 89,871 70,215 69,465 65,213
6,949 11,828 31,831 19,115 109,541 237,136 125,437 181,607 104,738 140,371 104, 100 412,136 30,418 22,613 46,073 46,664 131,349 94,067 13,673 12,644 6,642 85,258
1,000,000 {190,381} 878,160 961,515
13,928, 182 14,988,293 13,321,848 12,855,363 13, 197,912 13,376,878 12,215,617 11,253,711 12,859,889 12,401,051
10,759 16,009 32,765 22,217 117,071 94,625 151,627 123,259 53,658 70, 102 18,970 28,966 10,714
{1,000,000} 190,381 {878,160} {961,515}
10,759 {983,991i 32,765 22,217 136,041 94,625 180,593 324,354 {824,5021 {891,413l
$ 13,938,941 $ 14,004,302 $ 13,354,613 $ 12,877,580 $ 13,333,953 $ 13,471,503 $ 12,396,210 $ 11,578,065 $ 12,035,387 $ 11,509,638
$ 1,493,655 $ 3,047,499 $ (1,837,590) $ (2,367,857) $ 853,563 $ (788,028) $ 132,297 $ 22,284,758 $ 3,987,500 $ 1,007,163 930,394 (722,367) 477,074 738,911 3,317,810 695,819 642,466 749,789 (1,031,146) (1,633,464)
$ 2,424,049 $ 2,325,132 $ {1,360,516} $ (1,628,946} $ 4,171,373 $ (92,209} $ 774,763 $ 23,034,547 $ 2,956,354 $ (626,301)
Note: Prior year amounts have been retroactively restated for the effects of GASB Statements No. 63 and 65, which were implemented in 2012.
The City began to segregate water and sewer activities in the fiscal year 2006.
109
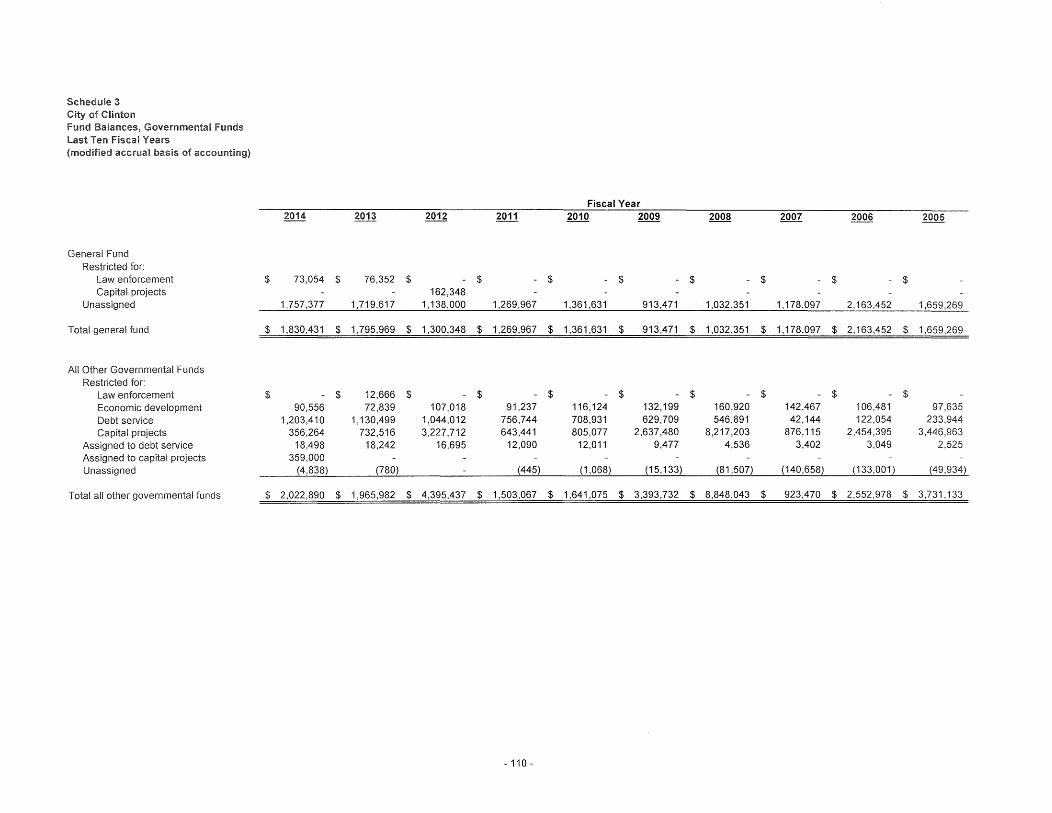
Schedule 3 City of Clinton Fund Balances, Governmental Funds Last Ten Fiscal Years (modified accrual basis of accounting)
General Fund Restricted for:
Law enforcement Capital projects
Unassigned
Total general fund
All Other Governmental Funds Restricted for:
Law enforcement Economic development Debt service Capital projects
Assigned to debt service Assigned to capital projects Unassigned
Total all other governmental funds
2014
$ 73,054
1,757,377
$ 1,830,431
$ -90,556
1,203,410 356,264
18,498 359,000
(4,838)
$ 2,022,890
2013 2012 2011
$ 76,352 $ - $ -
162,348 1,719,617 1, 138,000 1,269,967
$ 1,795,969 $ 1,300,348 $ 1,269,967
$ 12,666 $ - $ -
72,839 107,018 91,237 1,130,499 1,044,012 756,744
732,516 3,227,712 643,441 18,242 16,695 12,090
(780) (445)
$ 1,965,982 $ 4,395,437 $ 1,503,067
- 110 -
Fiscal Year 2010 2009 2008 2007 2006 2005
$ - $ - $ - $ $ $
1,361,631 913,471 1,032,351 1,178,097 2,163,452 1,659,269
$ 1,361,631 $ 913,471 $ 1,032,351 $ 1, 178,097 $ 2,163,452 $ 1,659,269
$ - $ - $ - $ - $ - $ 116,124 132,199 160,920 142,467 106,481 97,635 708,931 629,709 546,891 42, 144 122,054 233,944 805,077 2,637,480 8,217,203 876,115 2,454,395 3,446,963
12,011 9,477 4,536 3,402 3,049 2,525
(1,068) (15,133) (81,507) (140,658} (133,001) (49,934)
$ 1,641,075 $ 3,393,732 $ 8,848,043 $ 923,470 $ 2,552,978 $ 3,731,133
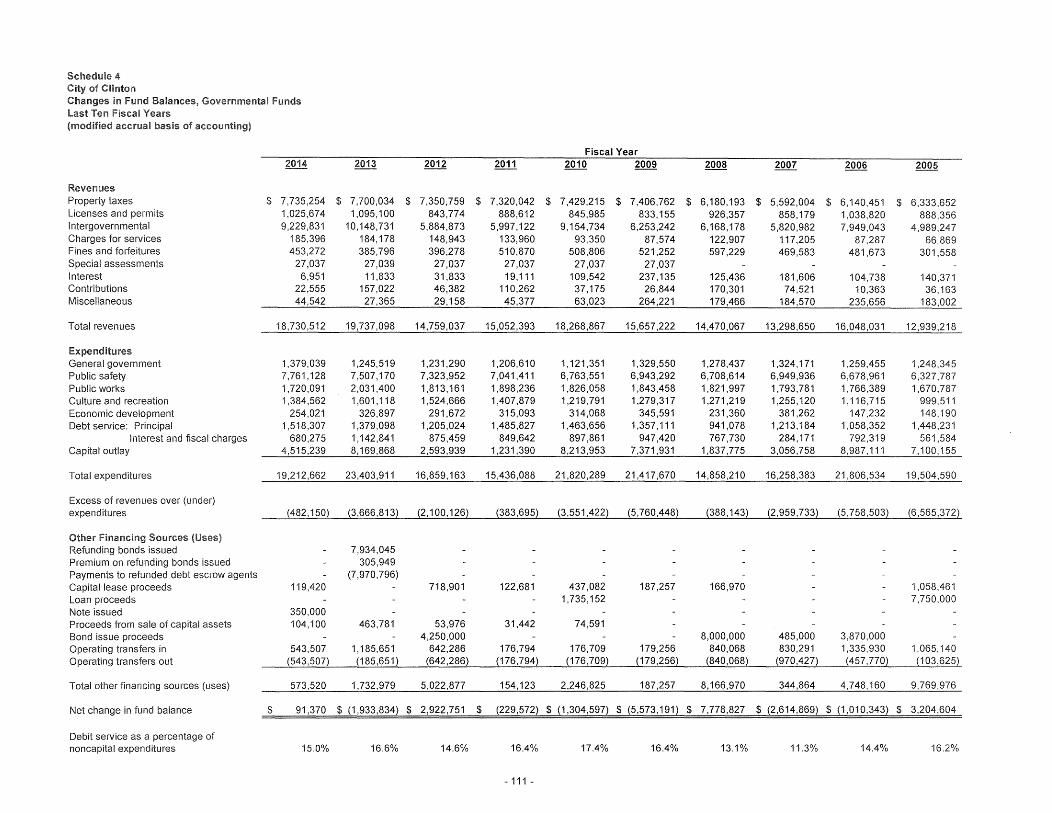
Schedule City of Clinton Changes in Fund Balances, Governmental Funds Last Ten Fiscal Years (modified accrual basis of accounting)
Fiscal Year 2014 2013 2012 2011 2010 2009 2008 2007 2006 2005
Revenues Property taxes $ 7,735,254 $ 7,700,034 $ 7,350,759 $ 7,320,042 $ 7,429,215 $ 7,406,762 $ 6,180,193 $ 5,592,004 $ 6, 140,451 $ 6,333,652 Licenses and permits i ,025,674 1,095,100 843,774 888,612 845,985 833, 155 926,357 858, 179 1,038,820 888,356 Intergovernmental 9,229,831 10,148,731 5,884,873 5,997, 122 9,154,734 6,253,242 6,168,178 5,820,982 7,949,043 4,989,247 Charges for services 185,396 184,178 148,943 133,960 93,350 87,574 122,907 117,205 87,287 66,869 Fines and forfeitures 453,272 385,796 396,278 510,870 508,806 521,252 597,229 469,583 481,673 301,558 Special assessments 27,037 27,039 27,037 27,037 27,037 27,037 Interest 6,951 11,833 31,833 19, 111 109,542 237, 135 125,436 181,606 104,738 140,371 Contributions 22,555 157,022 46,382 110,262 37,175 26,844 170,301 74,521 10,363 36,163 Miscellaneous 44,542 27,365 29, 158 45,377 63,023 264,221 179,466 184,570 235,656 183,002
Total revenues 18,730,512 19,737,098 14,759,037 15,052,393 18,268,867 15,657,222 14,470,067 13,298,650 16,048,031 12,939,218
Expendib.nes General government 1,379,039 1,245,519 1,231,290 1,206,610 1,121,351 1,329,550 1,278,437 1,324, 171 1,259,455 1,248,345 Public safety 7,761, 128 7,507,170 7,323,952 7,041,411 6,763,551 6,943,292 6,708,614 6,949,936 6,678,961 6,327,787 Public works 1,720,091 2,031,400 1,813,161 1,898,236 1,826,058 1,843,458 1,821,997 1,793,781 1,766,389 1,670,787 Culture and recreation 1,384,562 1,601, 118 1,524,666 1,407,879 1,219,791 1,279,317 1,271,219 1,255,120 1,116,715 999,511 Economic development 254,021 326,897 291,672 315,093 314,068 345,591 231,360 381,262 147,232 148, 190 Debt service: Principal 1,518,307 1,379,098 1,205,024 1,485,827 1,463,656 1,357, 111 941,078 1,213,184 1,058,352 1,448,231
Interest and fiscal charges 680,275 1, 142,841 875,459 849,642 897,861 947,420 767,730 284,171 792,319 561,584 Capital outlay 4,515,239 8,169,868 2,593,939 1,231,390 8,213,953 7,371,931 1,837,775 3,056,758 8,987,111 7,100,155
Total expenditures 19,212,662 23,403,911 16,859,163 15,436,088 21,820,289 21,417,670 14,858,210 16,258,383 21,806,534 19,504,590
Excess of revenues over (under) expenditures (482,150) (3,666,813) (2,100,126) (38~,695) j3,551,~22) (5,760,44-§2_ (3_~,143) (2,959,733) (5,758,503) (6,565,372)
Other Financing Sources (Uses) Refunding bonds issued 7,934,045 Premium on refunding bonds issued 305,949 Payments to refunded debt escrow agents (7,970,796) Capital lease proceeds 119,420 718,901 122,681 437,082 187,257 166,970 1,058,461 Loan proceeds 1,735, 152 7,750,000 Note issued 350,000 Proceeds from sale of capital assets 104,100 463,781 53,976 31,442 74,591 Bond issue proceeds 4,250,000 8,000,000 485,000 3,870,000 Operating transfers in 543,507 1, 185,651 642,286 176,794 176,709 179,256 840,068 830,291 1,335,930 1,065,140 Operating transfers out (543,507) (185,651) (642,286) ~176,794) (176,709) (179,256) (840,068) (970,427) (457,770) (103,625)
Total other financing sources (uses) 573,520 1,732,979 5,022,877 154,123 2,246,825 187,257 8,166,970 344,864 4,748, 160 9,769,$76
Net change in fund balance $ 91,370 $ (1,933,834) $ 2,922,751 $ (229,572) $ (1,304,597) $ (5,573,191) $ 7,778,827 $ (2,614,869) $ (1,010,343) $ 3,204,604
Debit service as a percentage of noncapital expenditures 15.0% 16.6% 14.6% 16.4% 17.4% 16.4% 13.1% 11.3% 14.4% 16.2%
- 111 -
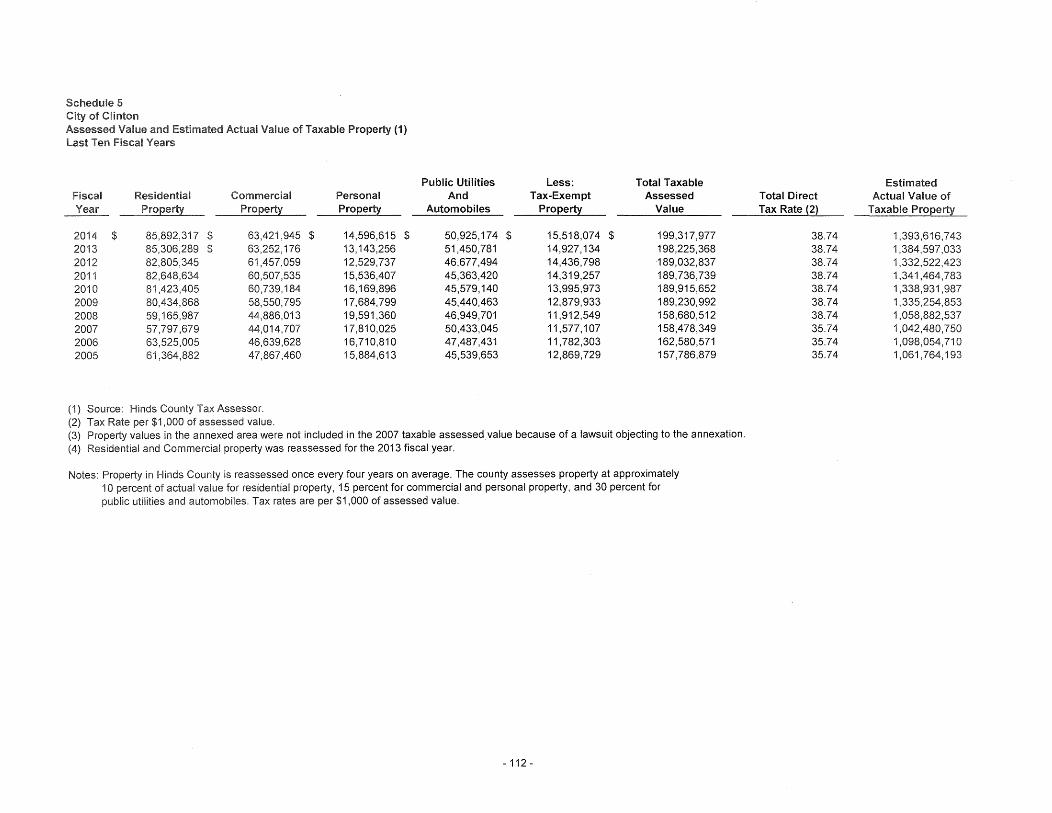
Schedule 5 City of Clinton Assessed Value and Estimated Actual Value of Taxable Property (1) Last Ten Fiscal Years
Fiscal Residential Commercial Property Property
2014 $ 85,892,317 $ 63,421,945 $ 2013 85,306,289 $ 63,252,176 2012 82,805,345 61,457,059 2011 82,648,634 60,507,535 2010 81,423,405 60,739,184 2009 80,434,868 58,550,795 2008 59,165,987 44,886,013 2007 57,797,679 44,014,707 2006 63,525,005 46,639,628 2005 61 ,364,882 47,867,460
(1) Source: Hinds County Tax Assessor. (2) Tax Rate per $1,000 of assessed value.
Personal Propert~
14,596,615 $ 13, 143,256 12,529,737 15,536,407 16,169,896 17,684,799 19,591,360 17,810,025 16,710,810 15,884,613
Public Utilities Less: Total Taxable And Tax-Exempt Assessed
Automobiles Property Value
50,925,174 $ 15,518,074 $ 199,317,977 51,450,781 14,927,134 198,225,368 46,677,494 14,436,798 189,032,837 45,363,420 14,319,257 189,736,739 45,579,140 13,995,973 189,915,652 45,440,463 12,879,933 189,230, 992 46,949,701 11,912,549 158,680,512 50,433,045 11,577,107 158,4 78,349 47,487,431 11,782,303 162,580,571 45,539,653 12,869,729 157,786,879
(3) Property values in the annexed area were not included in the 2007 taxable assessed value because of a lawsuit objecting to the annexation. (4) Residential and Commercial property was reassessed for the 2013 fiscal year.
Notes: Property in Hinds County is reassessed once every four years on average. The county assesses property at approximately 10 percent of actual value for residential property, 15 percent for commercial and personal property, and 30 percent for public utilities and automobiles. Tax rates are per $1,000 of assessed value.
- 112 -
Estimated Total Direct Actual Value of Tax Rate (2) Taxable Property
38.74 1,393,616,743 38.74 1,384,597,033 38.74 1,332,522,423 38.74 1,341,464, 783 38.74 1,338,931,987 38.74 1,335,254,853 38.74 1,058,882,537 35.74 1,042,480,750 35.74 1,098,054,710 35.74 1,061,764, 193
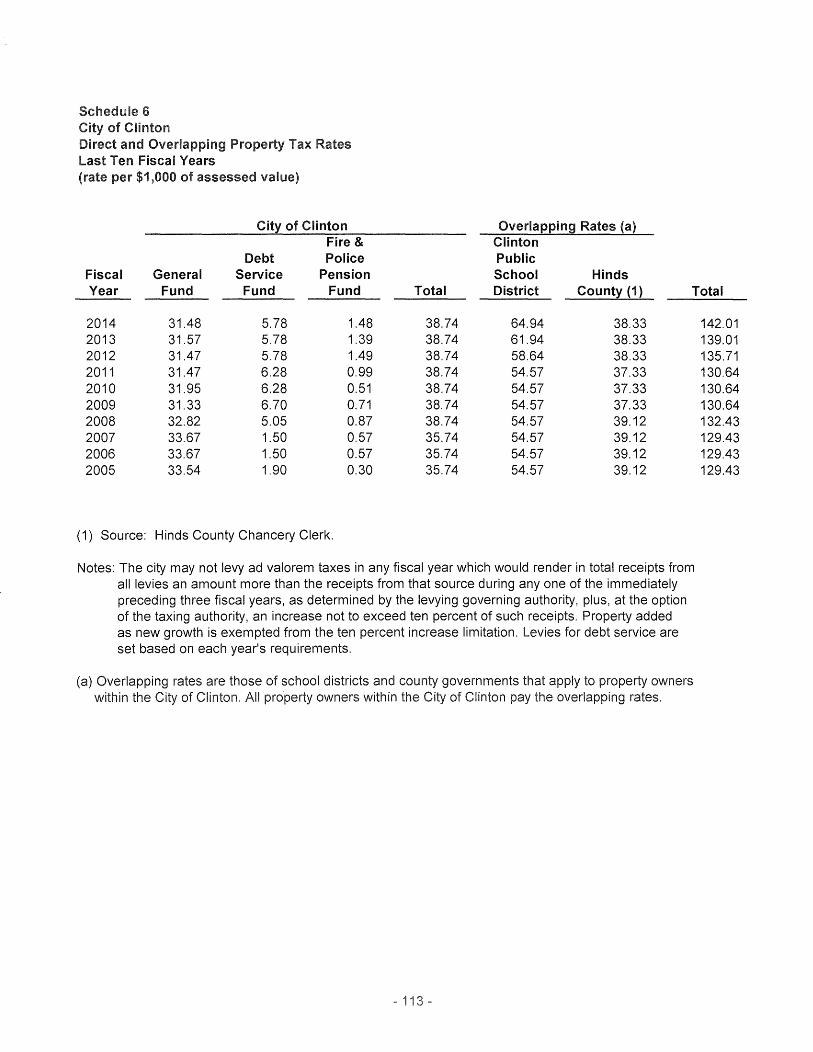
Schedule 6 City of Clinton Direct and Overlapping Property Tax Rates Last Ten Fiscal Years (rate per $1,000 of assessed value)
City of Clinton Overlappin9 Rates (a) Fire & Clinton
Debt Police Public Fiscal General Service Pension School Hinds Year Fund Fund Fund Total District County (1) Total
2014 31.48 5.78 1.48 38.74 64.94 38.33 2013 31.57 5.78 1.39 38.74 61.94 38.33 2012 31.47 5.78 1.49 38.74 58.64 38.33 2011 31.47 6.28 0.99 38.74 54.57 37.33 2010 31.95 6.28 0.51 38.74 54.57 37.33 2009 31.33 6.70 0.71 38.74 54.57 37.33 2008 32.82 5.05 0.87 38.74 54.57 39.12 2007 33.67 1.50 0.57 35.74 54.57 39.12 2006 33.67 1.50 0.57 35.74 54.57 39.12 2005 33.54 1.90 0.30 35.74 54.57 39.12
(1) Source: Hinds County Chancery Clerk.
Notes: The city may not levy ad valorem taxes in any fiscal year which would render in total receipts from all levies an amount more than the receipts from that source during any one of the immediately preceding three fiscal years, as determined by the levying governing authority, plus, at the option of the taxing authority, an increase not to exceed ten percent of such receipts. Property added as new growth is exempted from the ten percent increase limitation. Levies for debt service are set based on each year's requirements.
(a) Overlapping rates are those of school districts and county governments that apply to property owners within the City of Clinton. All property owners within the City of Clinton pay the overlapping rates.
- 1
142.01 139.01 135.71 130.64 130.64 130.64 132.43 129.43 129.43 129.43
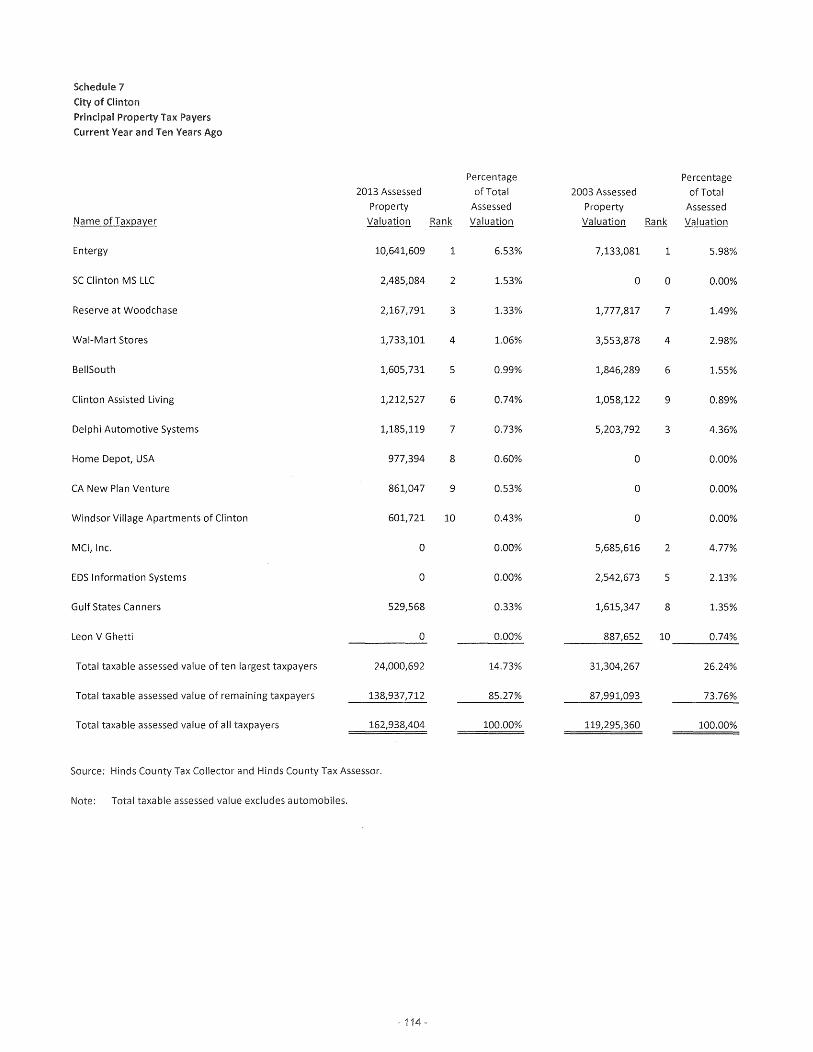
Schedule 1
City of Clinton
Principal Property Tax Payers
Current Year and Ten Years Ago
Name ofTaxpayer
Entergy
SC Clinton MS LLC
Reserve at Woodchase
Wal-Mart Stores
BellSouth
Clinton Assisted Living
Delphi Automotive Systems
Home Depot, USA
CA New Plan Venture
Windsor Village Apartments of Clinton
MCI, Inc.
EDS Information Systems
Gulf States Canners
Leon V Ghetti
Total taxable assessed value of ten largest taxpayers
Total taxable assessed value of remaining taxpayers
Total taxable assessed value of all taxpayers
2013 Assessed
Property
Valuation
10,641,609
2,485,084
2,167,791
1,733,101
1,605,731
1,212,527
1,185,119
977,394
861,047
601,721
0
0
529,568
0
24,000,692
138,937,712
162,938,404
Source: Hinds County Tax Collector and Hinds County Tax Assessor.
Note: Total taxable assessed value excludes automobiles.
- 14 -
Rank
1
2
3
4
5
6
7
8
9
10
Percentage Percentage
ofTotal 2003 Assessed ofTotal
Assessed Property Assessed
Valuation Valuation Rank Valuation
6.53% 7,133,081 1 5.98%
1.53% 0 0 0.00%
1.33% 1,777,817 7 1.49%
1.06% 3,553,878 4 2.98%
0.99% 1,846,289 6 1.55%
0.74% 1,058,122 9 0.89%
0.73% 5,203,792 3 4.36%
0.60% 0 0.00%
0.53% 0 0.00%
0.43% 0 0.00%
0.00% 5,685,616 2 4.77%
0.00% 2,542,673 5 2.13%
0.33% 1,615,347 8 1.35%
0.00% 887,652 10 0.74%
14.73% 31,304,267 26.24%
85.27% 87,991,093 73.76%
100.00% 119,295,360 100.00%
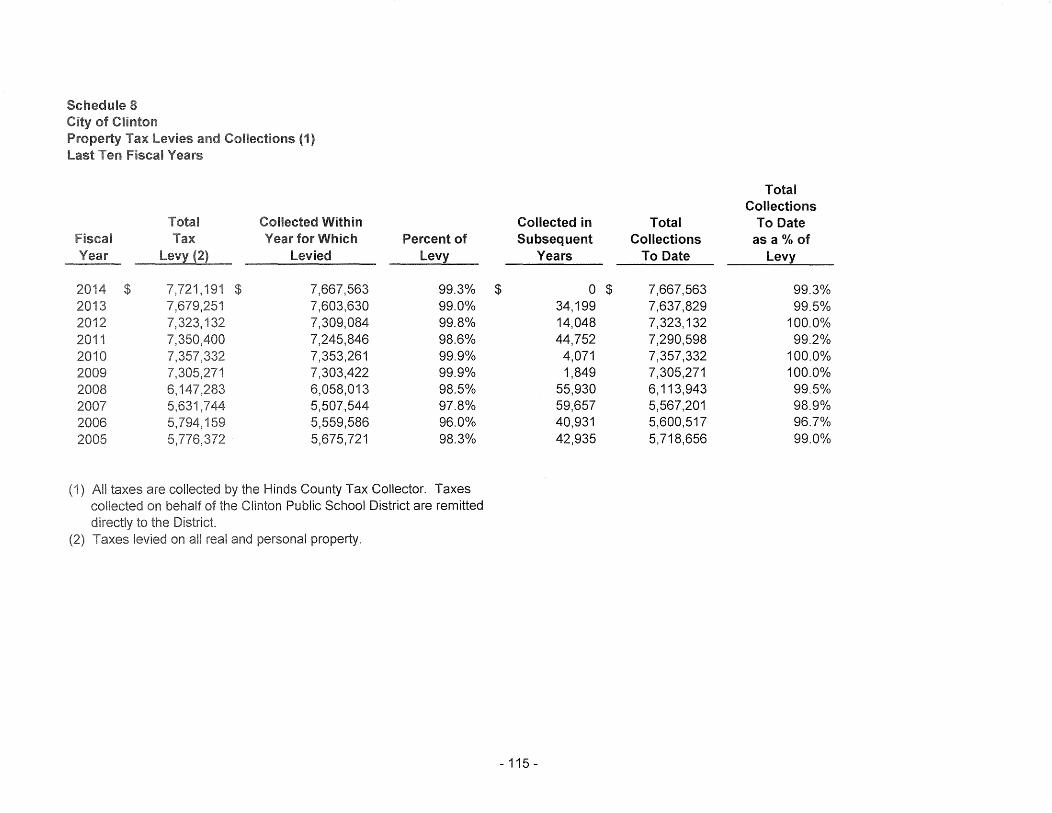
Schedule 8
Tax Levies and Collections (1) Last Ten Fiscal Years
Total Collected Within Fiscal Tax Year for Which Year Levied
2014 $ $ 7,667,563 2013 7,603,630 2012 7,309,084 2011 7,245,846 201 7,353,261 2009 7,303,422 2008 6,058,013 2007 5,507,544 2006 5,559,586 2005 5,675,721
Percent of Levy
99.3% 99.0% 99.8% 98.6% 99.9% 99.9% 98.5% 97.8% 96.0% 98.3%
(1) taxes are collected the Hinds County Tax Collector. Taxes collected on behalf of the Clinton Public School District are remitted r!irof"'Hu to the District. Taxes levied on all real and property.
Total Collections
Collected in Total To Date Subsequent Collections as a% of
Years To Date Levy
$ 0 $ 7,667,563 99.3% 34,199 7,637,829 99.5% 14,048 7,323, 132 100.0% 44,752 7,290,598 99.2%
4,071 7,357,332 100.0% 1,849 7,305,271 100.0%
55,930 6, 113,943 99.5% 59,657 5,567,201 98.9% 40,931 5,600,517 96.7% 42,935 5,718,656 99.0%
- 115 -
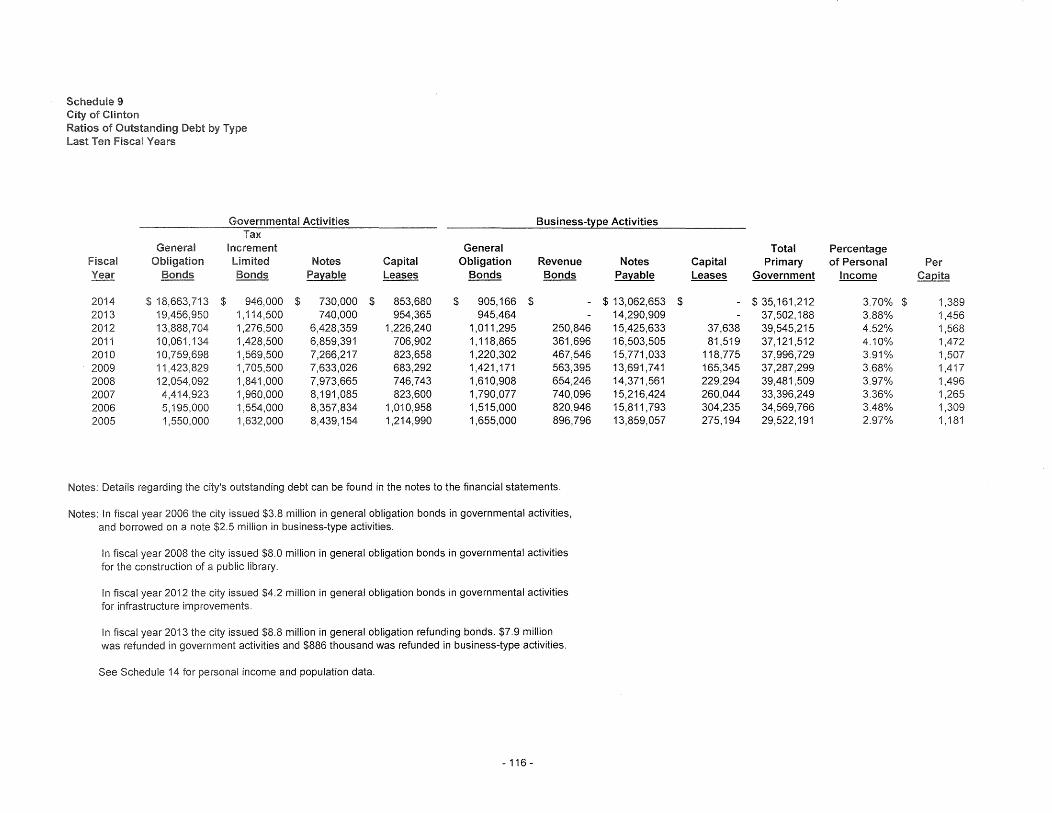
Schedule 9 City of Clinton Ratios of Outstanding Debt by Type Last Ten Fiscal Years
Governmental Activities Business-~pe Activities Tax
General Increment General Fiscal Obligation Limited Notes Capital Obligation Revenue Year Bonds Bonds Payable Leases Bonds Bonds
2014 $ 18,663,713 $ 946,000 $ 730,000 $ 853,680 $ 905, 166 $ -2013 19,456,950 1,114,500 740,000 954,365 945,464 -2012 13,888,704 1,276,500 6,428,359 1,226,240 1,011,295 250,846 2011 10,061, 134 1,428,500 6,859,391 706,902 1, 118,865 361,696 2010 10,759,698 1,569,500 7,266,217 823,658 1,220,302 467,546 2009 i 1,423,829 1,705,500 7,633,026 683,292 1,421,171 563,395 2008 12,054,092 1,841,000 7,973,665 746,743 1,610,908 654,246 2007 4,414,923 1,960,000 8, 191,085 823,600 1,790,077 740,096 2006 5,195,000 1,554,000 8,357,834 1,010,958 1,515,000 820,946 2005 1,550,000 1,632,000 8,439, 154 1,214,990 1,655,000 896,796
Notes: Details regarding the city's outstanding debt can be found in the notes to the financial statements.
Notes: In fiscal year 2006 the city issued $3.8 million in general obligation bonds in governmental activities, and borrowed on a note $2.5 million in business-type activities.
In fiscal year 2008 the city issued $8.0 million in general obligation bonds in governmental activities for the construction of a public library.
In fiscal year 2012 the city issued $4.2 million in general obligation bonds in governmental activities for infrastructure improvements.
In fiscal year 2013 the city issued $8.8 million in general obligation refunding bonds. $7.9 million was refunded in government activities and $886 thousand was refunded in business-type activities.
See Schedule 14 for personal income and population data.
- 116 -
Notes Payable
$ 13,062,653 14,290,909 15,425,633 16,503,505 15,771,033 13,691,741 14,371,561 15,216,424 15,811,793 13,859,057
Total Percentage Capital Primary of Personal Per Leases Government Income Capita
$ - $ 35,161,212 3.70% $ 1,389 - 37,502,188 3.88% 1,456
37,638 39,545,215 4.52% 1,568 81,519 37,121,512 4.10% 1,472
118,775 37,996,729 3.91% 1,507 165,345 37,287,299 3.68% 1,417 229,294 39,481,509 3.97% 1,496 260,044 33,396,249 3.36% 1,265 304,235 34,569,766 3.48% 1,309 275, 194 29,522, 191 2.97% 1, 181
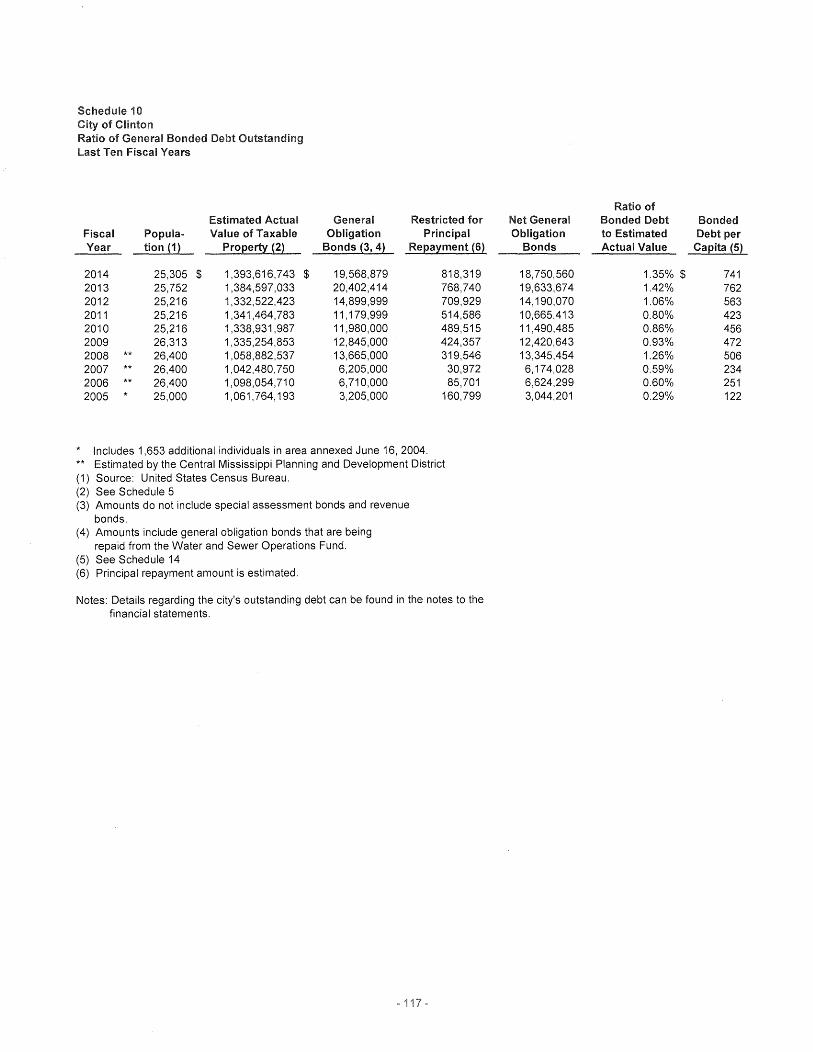
Schedule 10 City of Clinton Ratio of General Bonded Debt Outstanding Last Ten Fiscal Years
Estimated Actual Fiscal Popula- Value of Taxable Year tion ~1) Proeerty {2)
2014 25,305 $ 1,393,616,743 2013 25,752 1,384,597,033 2012 25,216 1,332,522,423 2011 25,216 1,341,464,783 2010 25,216 1,338,931,987 2009 26,313 1,335,254,853 2008 26,400 1,058,882,537 2007 26,400 1,042,480,750 2006 26,400 1,098,054,710 2005 25,000 1,061, 764, 193
General Restricted for Obligation Principal
Bonds p, 4~ Reea~ment {6~
$ 19,568,879 818,319 20,402,414 768,740 14,899,999 709,929 11, 179,999 514,586 11,980,000 489,515 12,845,000 424,357 13,665,000 319,546 6,205,000 30,972 6,710,000 85,701 3,205,000 160,799
* Includes 1,653 additional individuals in area annexed June 16, 2004. ** Estimated by the Central Mississippi Planning and Development District (1) Source: United States Census Bureau. (2) See Schedule 5 (3) Amounts do not include special assessment bonds and revenue
bonds. (4) Amounts include general obligation bonds that are being
repaid from the Water and Sewer Operations Fund. (5) See Schedule 14 (6) Principal repayment amount is estimated.
Notes: Details regarding the city's outstanding debt can be found in the notes to the financial statements.
117
Ratio of Net General Bonded Debt Bonded Obligation to Estimated Debt per
Bonds Actual Value Caeita {5~
18,750,560 1.35% $ 741 19,633,674 1.42% 762 14,190,070 1.06% 563 10,665,413 0.80% 423 11,490,485 0.86% 456 12,420,643 0.93% 472 13,345,454 1.26% 506 6,174,028 0.59% 234 6,624,299 0.60% 251 3,044,201 0.29% 122
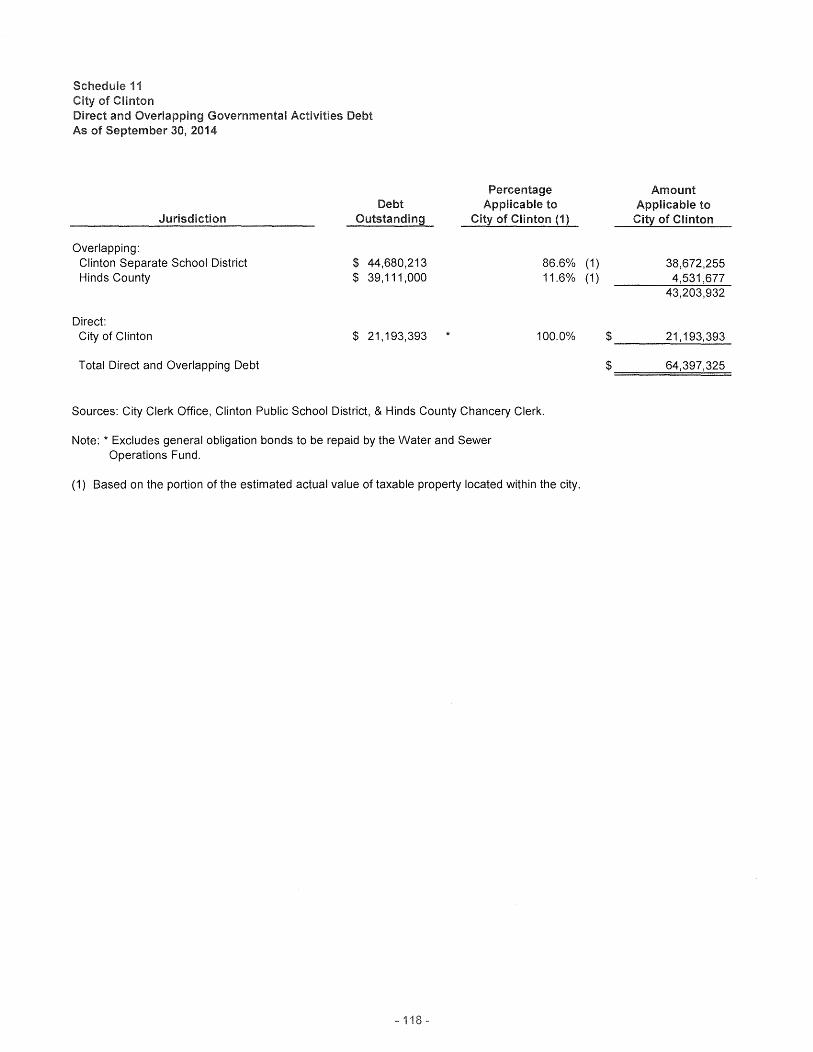
Schedule 11 of Clinton
Direct and Overlapping Governmental Activities Debt As of September 30, 2014
Jurisdiction
Overlapping: Clinton Separate School District Hinds County
Direct: City of Clinton
Total Direct and Overlapping Debt
Debt Outstanding
$ 44,680,213 $ 39,111,000
$ 21, 193,393
Percentage Applicable to
City of Clinton (1)
86.6% 11.6%
* 100.0%
Sources: City Clerk Office, Clinton Public School District, & Hinds County Chancery Clerk.
Note: * Excludes general obligation bonds to be repaid by the Water and Sewer Operations Fund.
(1) Based on the portion of the estimated actual value of taxable property located within the city.
- 1
Amount Applicable to
City of Clinton
(1) 38,672,255 (1) 4,531,677
43,203,932
$ 21, 193,393
$ 64,397,325
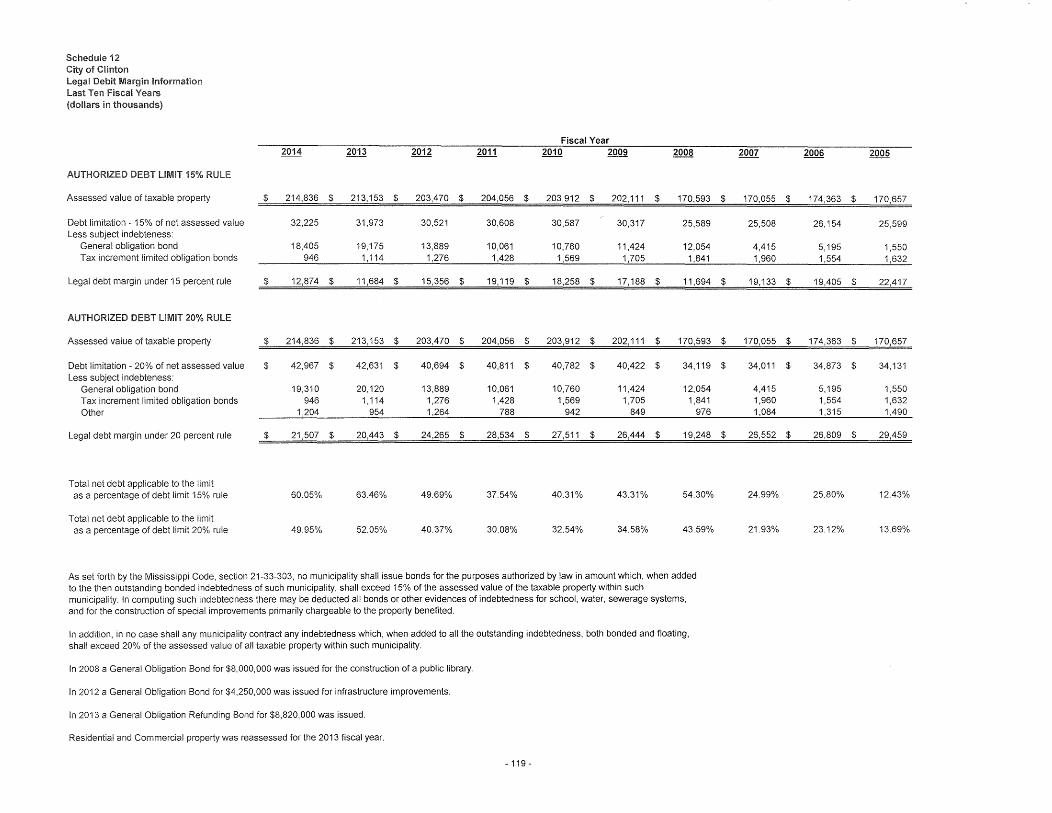
Schedule 12 City of Clinton Legal Debit Margin Information Last Ten Fiscal Years (dollars in thousands)
Fiscal Year 2014 2013 2012 2011 2010 2009 2008
AUTHORIZED DEBT LIMIT 15% RULE
Assessed value of taxable property $ 214,836 $ 213, 153 $ 203,470 $ 204,056 $ 203,912 $ 202,111 $ 170,593
Debt limitation - 15% of net assessed value 32,225 31,973 30,521 30,608 30,587 30,317 25,589 Less subject indebteness:
General obligation bond 18,405 19,175 13,889 10,061 10,760 11,424 12,054 Tax increment limited obligation bonds 946 1, 114 1,276 1,428 1,569 1,705 1,841
Legal debt margin under 15 percent rule $ 12,874 $ 11,684 $ 15,356 $ 19,119 $ 18,258 $ 17,188 $ 11,694
AUTHORIZED DEBT LIMIT 20% RULE
Assessed value of taxable property $ 214,836 $ 213, 153 $ 203,470 $ 204,056 $ 203,912 $ 202,111 $ 170,593
Debt limitation - 20% of net assessed value $ 42,967 $ 42,631 $ 40,694 $ 40,811 $ 40,782 $ 40,422 $ 34,119 Less subject indebteness:
General obligation bond 19,310 20,120 13,889 10,061 10,760 11,424 12,054 Tax increment limited obligation bonds 946 1, 114 1,276 1,428 1,569 1,705 1,841 Other 1,204 954 1,264 788 942 849 976
Legal debt margin under 20 percent rule $ 21,507 $ 20,443 $ 24,265 $ 28,534 $ 27,511 $ 26,444 $ 19,248
Total net debt applicable to the limit as a percentage of debt limit 15% rule 60.05% 63.46% 49.69% 37.54% 40.31% 43.31% 54.30%
Total net debt applicable to the limit as a percentage of debt limit 20% rule 49.95% 52.05% 40.37% 30.08% 32.54% 34.58% 43.59%
As set forth by the Mississippi Code, section 21-33-303, no municipality shall issue bonds for the purposes authorized by law in amount which, when added to the then outstanding bonded indebtedness of such municipality, shall exceed 15% of the assessed value of the taxable property within such municipality. In computing such indebtedness there may be deducted all bonds or other evidences of indebtedness for school, water, sewerage systems, and for the construction of special improvements primarily chargeable to the property benefited.
In addition, in no case shall any municipality contract any indebtedness which, when added to all the outstanding indebtedness, both bonded and floating, shall exceed 20% of the assessed value of all taxable property within such municipality.
In 2008 a General Obligation Bond for $8,000,000 was issued for the construction of a public library.
In 2012 a General Obligation Bond for $4,250,000 was issued for infrastructure improvements.
In 2013 a General Obligation Refunding Bond for $8,820,000 was issued.
Residential and Commercial property was reassessed for the 2013 fiscal year.
- 119 -
2007 2006 2005
$ 170,055 $ 174,363 $ 170,657
25,508 26,154 25,599
4,415 5,195 1,550 1,960 1,554 1,632
$ 19,133 $ 19,405 $ 22,417
$ 170,055 $ 174,363 $ 170,657
$ 34,011 $ 34,873 $ 34,131
4,415 5,195 1,550 1,960 1,554 1,632 1,084 1,315 1,490
$ 26,552 $ 26,809 $ 29,459
24.99% 25.80% 12.43%
21.93% 23.12% 13.69%
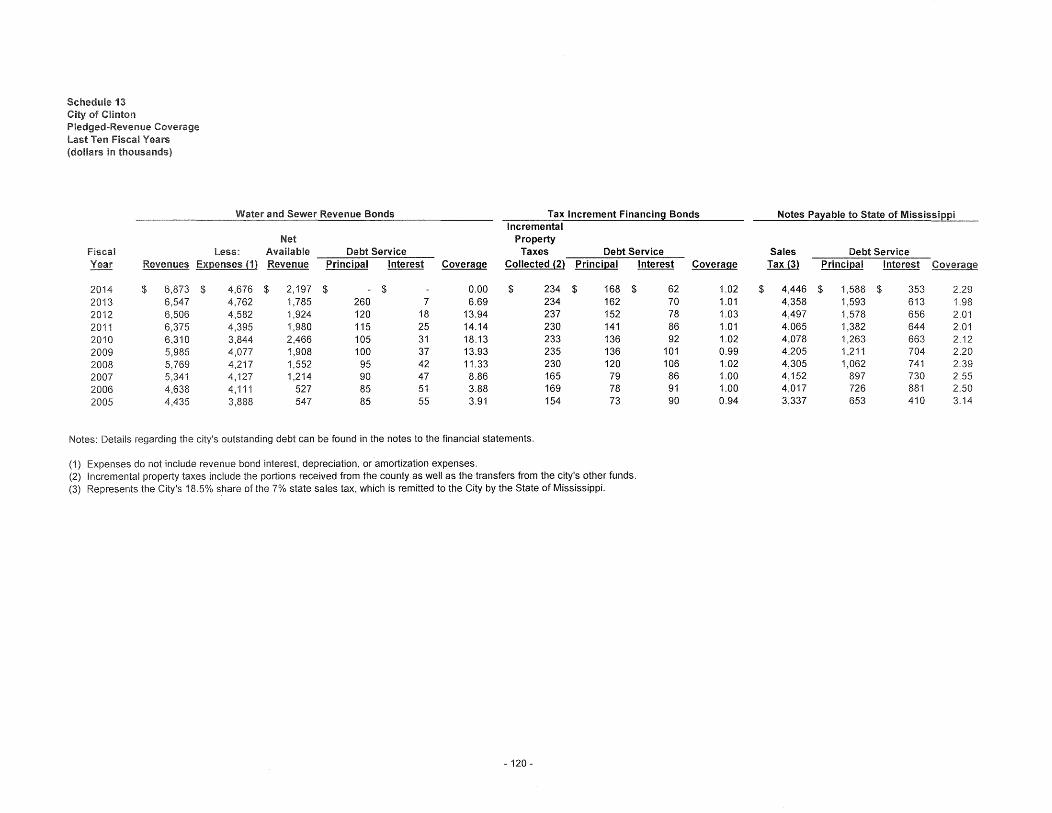
Schedule 13 City of Clinton Pledged-Revenue Coverage last Ten Fiscal Years (dollars in thousands)
Water and Sewer Revenue Bonds Tax Increment Financing Bonds Incremental
Net Property Fiscal less: Available Debt Service Taxes Debt Service Year Revenues Expenses (1) Revenue Principal Interest Coverage Collected {2} Principal
2014 $ 6,873 $ 4,676 $ 2,197 $ - $ 0.00 $ 234 $ 168 $ 2013 6,547 4,762 1,785 260 7 6.69 234 162 2012 6,506 4,582 1,924 120 18 13.94 237 152 2011 6,375 4,395 1,980 115 25 14.14 230 141 2010 6,310 3,844 2,466 105 31 18.13 233 136 2009 5,985 4,077 1,908 100 37 13.93 235 136 2008 5,769 4,217 1,552 95 42 11.33 230 120 2007 5,341 4,127 1,214 90 47 8.86 165 79 2006 4,638 4, 111 527 85 51 3.88 169 78 2005 4,435 3,888 547 85 55 3.91 154 73
Notes: Details regarding the city's outstanding debt can be found in the notes to the financial statements.
(1) Expenses do not include revenue bond interest, depreciation, or amortization expenses. (2) Incremental property taxes include the portions received from the county as well as the transfers from the city's other funds. (3) Represents the City's 18.5% share of the 7% state sales tax, which is remitted to the City by the State of Mississippi.
- 120 -
Interest
62 70 78 86 92
101 106 86 91 90
Coverage
1.02 1.01 1.03 1.01 1.02 0.99 1.02 1.00 1.00 0.94
Notes Pa~able to State of Mississippi
Sales Debt Service Tax {3) Principal Interest Cove ram~
$ 4,446 $ 1,588 $ 353 2.29 4,358 1,593 613 1.98 4,497 1,578 656 2.01 4,065 1,382 644 2.01 4,078 1,263 663 2.12 4,205 1,211 704 2.20 4,305 1,062 741 2.39 4,152 897 730 2.55 4,017 726 881 2.50 3,337 653 410 3.14
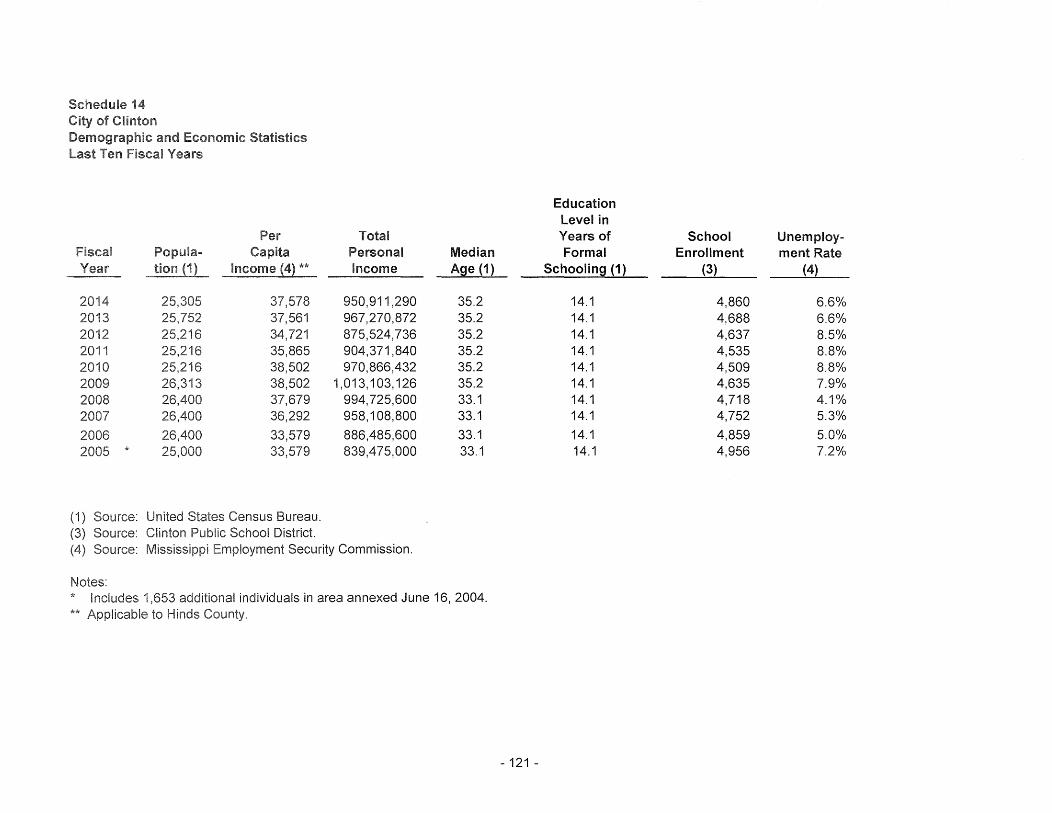
Schedule 1 of Clinton
and Economic Statistics -Last Ten Fiscal Years
Per Fiscal Year tion (1) **
2014 37,578 2013 37,561 201 34,721 2011 35,865 2010 38,502 2009 38,502 2008 37,679 2007 36,292
2006 33,579 2005 * 25.000 33,579
(1) Source: United States Census Bureau. (3) Source: Clinton Public School District.
Total Personal Income
950,911,290 967,270,872 875,524, 736 904,371,840 970,866,432
1,013,103,126 994, 725,600 958, 108,800
886,485,600 839,475,000
Source: Security Commission.
Notes:
Median Age (1)
35.2 35.2 35.2 35.2 35.2 35.2 33.1 33.1
33.1 33.1
* Includes 1 additional individuals in area annexed June 16, 2004. ** to Hinds
Education Level in Years of School Unemploy-Formal Enrollment ment Rate
Schooling (1) (3) (4)
14.1 4,860 6.6% 14.1 4,688 6.6% 14.1 4,637 8.5% 14.1 4,535 8.8% 14.1 4,509 8.8% 14.1 4,635 7.9% 14.1 4,718 4.1% 14.1 4,752 5.3%
14.1 4,859 5.0% 14.1 4,956 7.2%
- 121 -
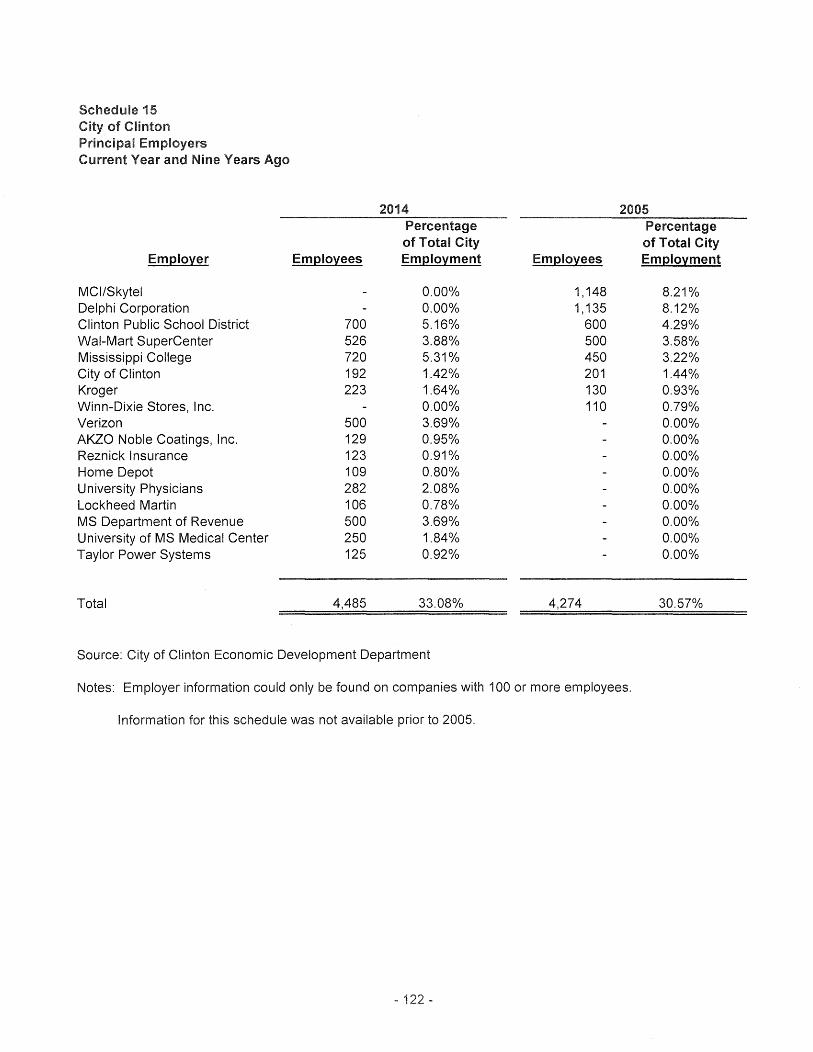
Schedule 15 City of Clinton Principal Employers Current Year and Nine Years Ago
2014 2005 Percentage Percentage of Total City of Total City
Employer Employees Employment Employees Employment
MCl/Skytel 0.00% 1, 148 8.21% Delphi Corporation 0.00% 1, 135 8.12% Clinton Public School District 700 5.16% 600 4.29% Wal-Mart SuperCenter 526 3.88% 500 3.58% Mississippi College 720 5.31% 450 3.22% City of Clinton 192 1.42% 201 1.44% Kroger 223 1.64% 130 0.93% Winn-Dixie Stores, Inc. 0.00% 110 0.79% Verizon 500 3.69% 0.00% AKZO Noble Coatings, Inc. 129 0.95% 0.00% Reznick Insurance 123 0.91% 0.00% Home Depot 109 0.80% 0.00% University Physicians 282 2.08% 0.00% Lockheed Martin 106 0.78% 0.00% MS Department of Revenue 500 3.69% 0.00% University of MS Medical Center 250 1.84% 0.00% Taylor Power Systems 125 0.92% 0.00%
Total 4,485 33.08% 4,274 30.57%
Source: City of Clinton Economic Development Department
Notes: Employer information could only be found on companies with 100 or more employees.
Information for this schedule was not available prior to 2005.
- 1
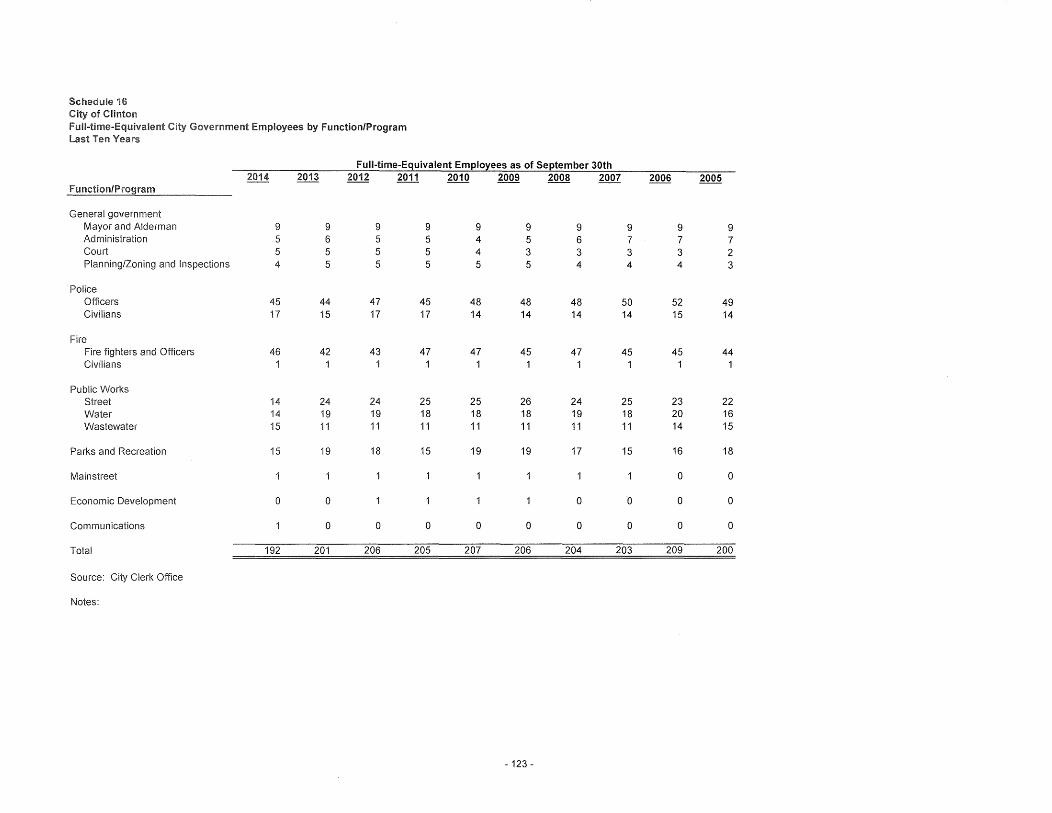
Schedule 16 City of Clinton Full-time-Equivalent City Government Employees by Function/Program Last Ten Years
Full-time-Equivalent Emplo~ees as of September 30th 2014 2013 2012 2011 2010 2009 2008 2007 2006 2005
General government Mayor and Alderman 9 9 9 9 9 9 9 9 9 9 Administration 5 6 5 5 4 5 6 7 7 7 Court 5 5 5 5 4 3 3 3 3 2 Planning/Zoning and Inspections 4 5 5 5 5 5 4 4 4 3
Police Officers 45 44 47 45 48 48 48 50 52 49 Civilians 17 15 17 17 14 14 14 14 15 14
Fire Fire fighters and Officers 46 42 43 47 47 45 47 45 45 44 Civilians 1 1 1 1 1 1 1 1 1 1
Public Works Street 14 24 24 25 25 26 24 25 23 22 Water 14 19 19 18 18 18 19 18 20 16 Wastewater 15 11 11 11 11 11 11 11 14 15
Parks and Recreation 15 19 18 15 19 19 17 15 16 18
Mainstreet 1 1 1 1 1 1 1 1 0 0
Economic Development 0 0 1 1 1 1 0 n 0 0
Communications 1 0 0 0 0 0 0 0 0 0
Total 192 201 206 205 207 206 204 203 209 200
Source: City Clerk Office
Notes:
- 123 -
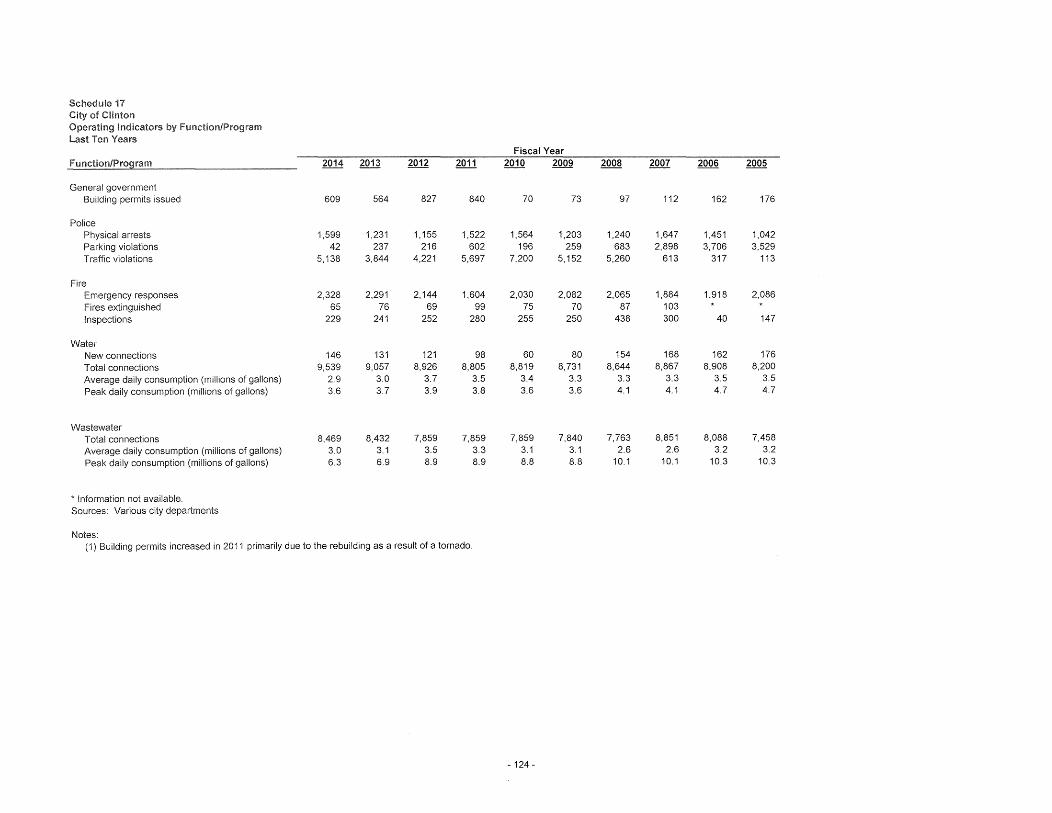
Schedule 17 City of Clinton Operating Indicators by Function/Program Last Ten Years
Fiscal Year Function/Program 2014 2013 2012 2011 2010 2009 2008 2007 2006 2005
General government Building permits issued 609 564 827 840 70 73 97 112 162 176
Police Physical arrests 1,599 1,231 1,155 1,522 1,564 1,203 1,240 1,647 1,451 1,042 Parking violations 42 237 216 602 196 259 683 2,898 3,706 3,529 Traffic violations 5,138 3,844 4,221 5,697 7,200 5,152 5,260 613 317 113
Fire Emergency responses 2,328 2,291 2,144 1,604 2,030 2,082 2,065 1,884 1,918 2,086 Fires extinguished 65 76 69 99 75 70 87 103 Inspections 229 241 252 280 255 250 438 300 40 147
Water New connections 146 131 121 98 60 80 154 168 162 176
Total connections 9,539 9,057 8,926 8,805 8,819 8,731 8,644 8,867 8,908 8,200
Average daily consumption (millions of gallons) 2.9 3.0 3.7 3.5 3.4 3.3 3.3 3.3 3.5 3.5
Peak daily consumption (millions of gallons) 3.6 3.7 3.9 3.8 3.6 3.6 4.1 4.1 4.7 4.7
Wastewater Total connections 8,469 8,432 7,859 7,859 7,859 7,840 7,763 8,851 8,088 7,458
Average daily consumption (millions of gallons) 3.0 3.1 3.5 3.3 3.1 3.1 2.6 2.6 3.2 3.2
Peak daily consumption (millions of gallons) 6.3 6.9 8.9 8.9 8.8 8.8 10.1 10.1 10.3 10.3
* Information not available. Sources: Various city departments
Notes: (1) Building permits increased in 2011 primarily due to the rebuilding as a result of a tornado.
- 124 -
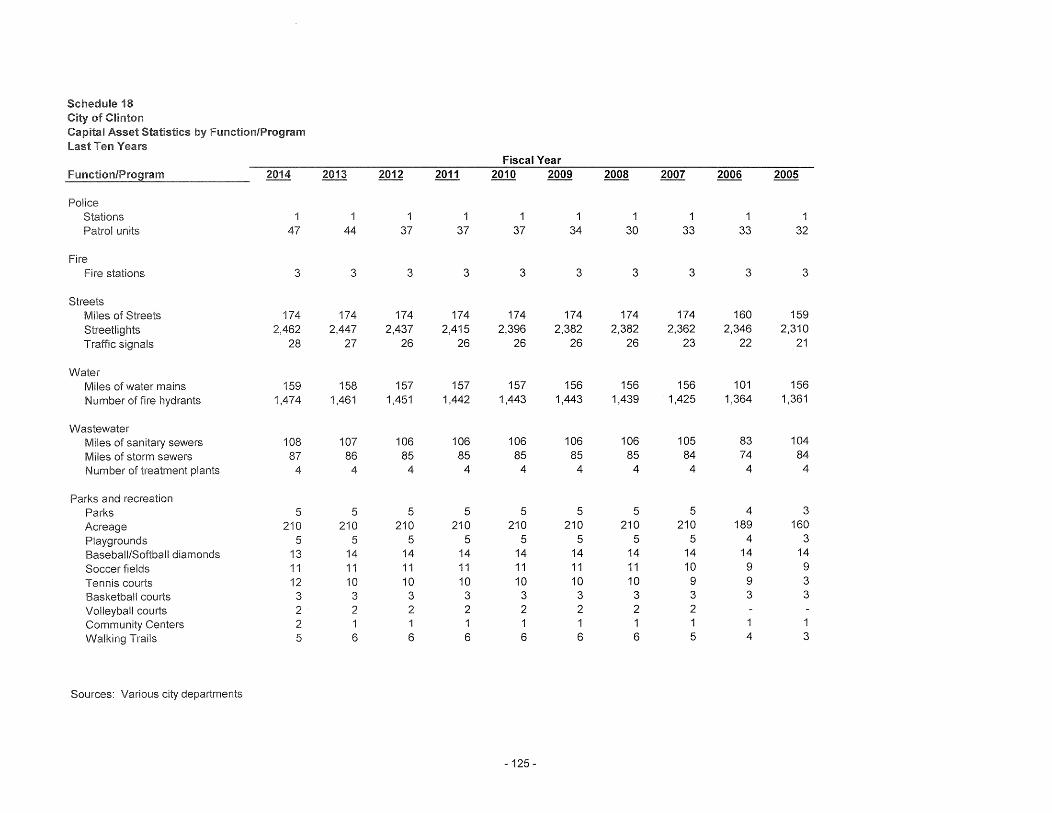
Schedule 18 of Clinton
Capital Asset Statistics by Function/ Program Last Ten Years
Fiscal Year 2014 2013 2012 2011 2010 2009 2008 2007 2006 2005
Police Stations 1 1 1 1 1 1 1 1 1 1 Patrol units 47 44 37 37 37 34 30 33 33 32
Fire Fire stations 3 3 3 3 3 3 3 3 3 3
Streets Miles of Streets 174 174 174 174 174 174 174 174 160 159 Streetlights 2,462 2,447 2,437 2,415 2,396 2,382 2,382 2,362 2,346 2,310 Traffic sianals 28 27 26 26 26 26 26 23 22 21
Water Miles of water mains 159 158 157 157 157 156 156 156 101 156 Number of fire hydrants 1,474 1,461 1,451 1,442 1,443 1,443 1,439 1,425 1,364 1,361
Wastewater Miles of sanitary sewers 108 107 106 106 106 106 106 105 83 104 Miles of storm sewers 87 86 85 85 85 85 85 84 74 84 Number of treatment plants 4 4 4 4 4 4 4 4 4 4
Parks and recreation Parks 5 5 5 5 5 5 5 5 4 3 Acreage 210 210 210 210 210 210 210 210 189 160 Playgrounds 5 5 5 5 5 5 5 5 4 3 Baseball/Softball diamonds 13 14 14 14 14 14 14 14 14 14 Soccer fields 11 11 11 11 11 11 11 10 9 9 Tennis courts 12 10 10 10 10 10 10 9 9 3 Basketball courts 3 3 3 3 3 3 3 3 3 3 Volleyball courts 2 2 2 2 2 2 2 2 Community Centers 2 1 1 1 1 1 1 1 1 1 Walking Trails 5 6 6 6 6 6 6 5 4 3
Sources: Various city departments
- 125 -
INDEPENDENT AUDITORS' REPORTS ON INTERNAL CONTROL AND COMPLIANCE
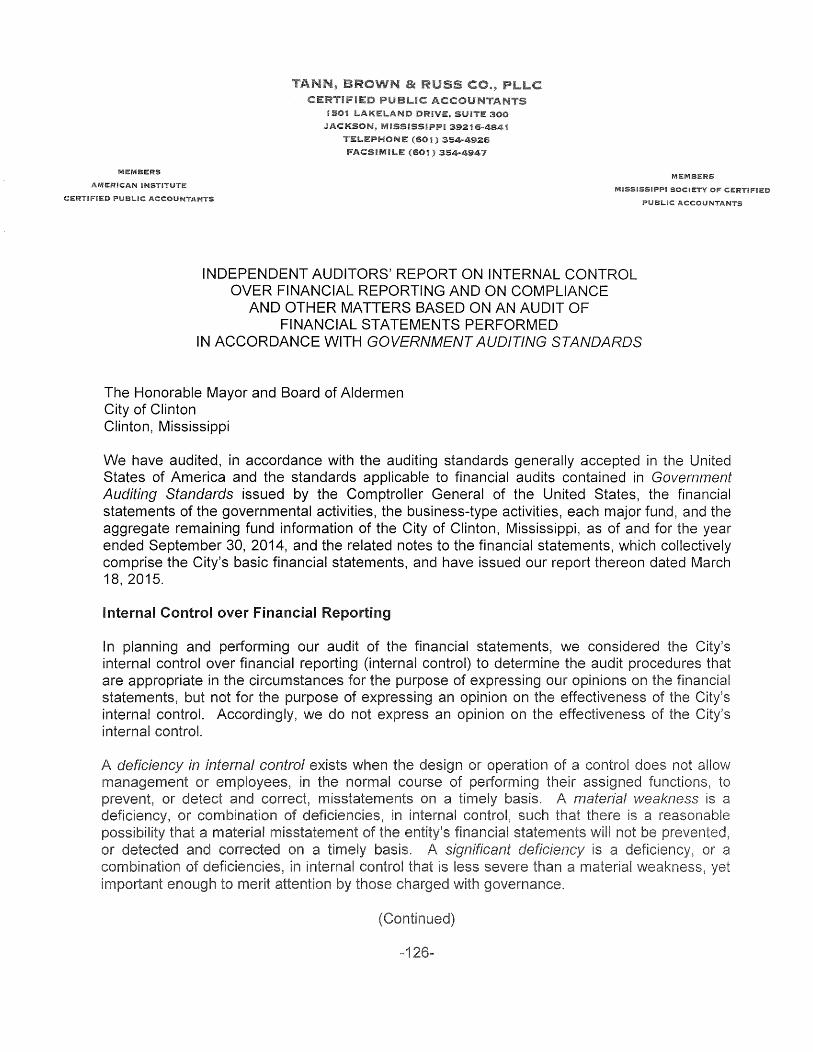
INDEPENDENT AUDITORS' REPORT ON INTERNAL CONTROL OVER FINANCIAL REPORTING AND ON COMPLIANCE
AND OTHER MATTERS BASED ON AN AUDIT OF FINANCIAL STATEMENTS PERFORMED
IN ACCORDANCE WITH GOVERNMENT AUDITING STANDARDS
The Honorable Mayor and Board of Aldermen City of Clinton Clinton, Mississippi
l"i.1161..IC ACCOUNTANTS
We have audited, in accordance with the auditing standards generally accepted in the United States of America and the standards applicable to financial audits contained in Government Auditing Standards issued by the Comptroller General of the United States, the financial statements of the governmental activities, the business-type activities, each major fund, and the aggregate remaining fund information of the City of Clinton, Mississippi, as of and for the year ended September 30, 2014, and the related notes to the financial statements, which collectively comprise the City's basic financial statements, and have issued our report thereon dated March 18, 2015.
Internal Control over Financial Reporting
In planning and performing our audit of the financial statements, we considered the City's internal control over financial reporting (internal control) to determine the audit procedures that are appropriate in the circumstances for the purpose of expressing our opinions on the financial statements, but not for the purpose of expressing an opinion on the effectiveness of the City's internal control. Accordingly, we do not express an opinion on the effectiveness of the City's internal control.
a not assigned functions,
weakness is
was in paragraph of this section and was not designed to identify all deficiencies in internal control that might be material weaknesses, or significant deficiencies. Given these limitations, during our audit we did not identify any deficiencies in internal control that we consider to be material weaknesses. However, material weaknesses may exist that have not been identified.
Compliance and Other Matters
As part of obtaining reasonable assurance about whether the City's financial statements are free of material misstatement, we performed tests of its compliance with certain provisions of laws, regulations, contracts, and grant agreements, noncompliance with which could have a direct and material effect on the determination of financial statement amounts. However, providing an opinion on compliance with those provisions was not an objective of our audit, and accordingly, we do not express such an opinion. The results of our tests disclosed no instances of noncompliance or other matters that are required to be reported under Government Auditing Standards.
Purpose of This Report
The purpose of this report is solely to describe the scope of our testing of internal control and compliance and the results of that testing, and not to provide an opinion on the effectiveness of the entity's internal control or on compliance. This report is an integral part of an audit performed in accordance with Government Auditing Standards in considering the entity's internal control and compliance. Accordingly, this communication is not suitable for any other purpose.
March 18, 2015
-1
AMERICAN INSTITUTE
INDEPENDENT AUDITORS' REPORT ON COMPLIANCE FOR EACH MAJOR PROGRAM AND ON INTERNAL CONTROL
OVER COMPLIANCE REQUIRED BY OMS CIRCULAR A-133
The Honorable Mayor and Board of Aldermen City of Clinton Clinton, Mississippi
Report on Compliance for Each Major Federal Program
We have audited the City of Clinton, Mississippi's compliance with the types of compliance requirements described in the OMB Circular A-133 Compliance Supplement that could have a direct and material effect on the City's major federal program for the year ended September 30, 2014. The City's major federal program is identified in the summary of auditors' results section of the accompanying schedule of findings and questioned costs.
Management's Responsibility
Management is responsible for compliance with the requirements of laws, regulations, contracts, and grants applicable to its federal programs.
Auditors' Responsibility
Our responsibility is to express an opinion on compliance for the City's major federal program based on our audit of the types of compliance requirements referred to above. We conducted our audit of compliance in accordance with auditing standards generally accepted in the United States of America; the standards applicable to financial audits contained in Government Auditing Standards, issued by the Comptroller General of the United States; and OMB Circular A-133, Audits of States, Local Governments, and Non-Profit Organizations. Those standards and OMB Circular A-133 require that we plan and perform the audit to obtain reasonable assurance about whether with the types compliance requirements referred to above and material effect on a
-1
on
In our opinion, the City Clinton, Mississippi, complied, in all material respects, with the types of compliance requirements referred to above that could have a direct and material effect on its major federal program for the year ended September 30, 2014.
Report on Internal Control Over Compliance
Management of the City, is responsible for establishing and maintaining effective internal control over compliance with the types of compliance requirements referred to above. In planning and performing our audit of compliance, we considered the City's internal control over compliance with the types of requirements that could have a direct and material effect on the major federal program to determine the auditing procedures that are appropriate in the circumstances for the purpose of expressing an opinion on compliance for the major federal program and to test and report on internal control over compliance in accordance with OMB Circular A-133, but not for the purpose of expressing an opinion on the effectiveness of internal control over compliance. Accordingly, we do not express an opinion on the effectiveness of the City's internal control over compliance.
A deficiency in internal control over compliance exists when the design or operation of a control over compliance does not allow management or employees, in the normal course of performing their assigned functions, to prevent, or detect and correct, noncompliance with a type of compliance requirement of a federal program on a timely basis. A material weakness in internal control over compliance is a deficiency, or combination of deficiencies, in internal control over compliance, such that there is a reasonable possibility that material noncompliance with a type of compliance requirement of a federal program will not be prevented, or detected and corrected, on a timely basis. A significant deficiency in internal control over compliance is a deficiency, or a combination of deficiencies, in internal control over compliance with a type of compliance requirement of a federal program that is less severe than a material weakness in internal control over compliance, yet important enough to merit attention by those charged with governance.
Our consideration of internal control over compliance was for the limited purpose described in the first paragraph of this section and was not designed to identify all deficiencies in internal control over compliance that might be material weaknesses or significant deficiencies. We did not identify any deficiencies in internal control over compliance that we consider to be material weaknesses. However, material weaknesses may exist that have not been identified.
The purpose of this report on internal control over compliance is solely to describe the scope of our testing internal control over compliance the results of that testing based on the
this report is not suitable
18, 5
-1
TELEPHONE FACSIMH .. E
INDEPENDENT AUDITORS' REPORT ON COMPLIANCE WITH STATE LAWS AND REGULATIONS
The Honorable Mayor and Board of Aldermen City of Clinton Clinton, Mississippi
MISSISSIPPI SOCIETY OF CERTIFIED
We have audited, in accordance with the auditing standards generally accepted in the United States of America and the standards applicable to financial audits contained in Government Auditing Standards issued by the Comptroller General of the United States, the financial statements of the governmental activities, the business-type activities, each major fund, and the aggregate remaining fund information of the City of Clinton, Mississippi, as of and for the year ended September 30, 2014, and the related notes to the financial statements, which collectively comprise the City's basic financial statements, and have issued our report thereon dated March 18, 2015.
As required by the state legal compliance audit program prescribed by the Mississippi Office of the State Auditor, we have also performed procedures to test compliance with certain state laws and regulations. However, providing an opinion on compliance with state laws and regulations was not an objective of our audit and, accordingly, we do not express such an opinion. Had we performed additional procedures, other matters may have come to our attention regarding the City's compliance with state laws and regulations.
The results of our procedures disclosed no material instances of noncompliance with state laws and regulations. However, we noted certain matters that we reported to management of the City in a separate letter dated March 18, 2015.
report is intended solely for the information and use of its the Mississippi
8, 5
-1
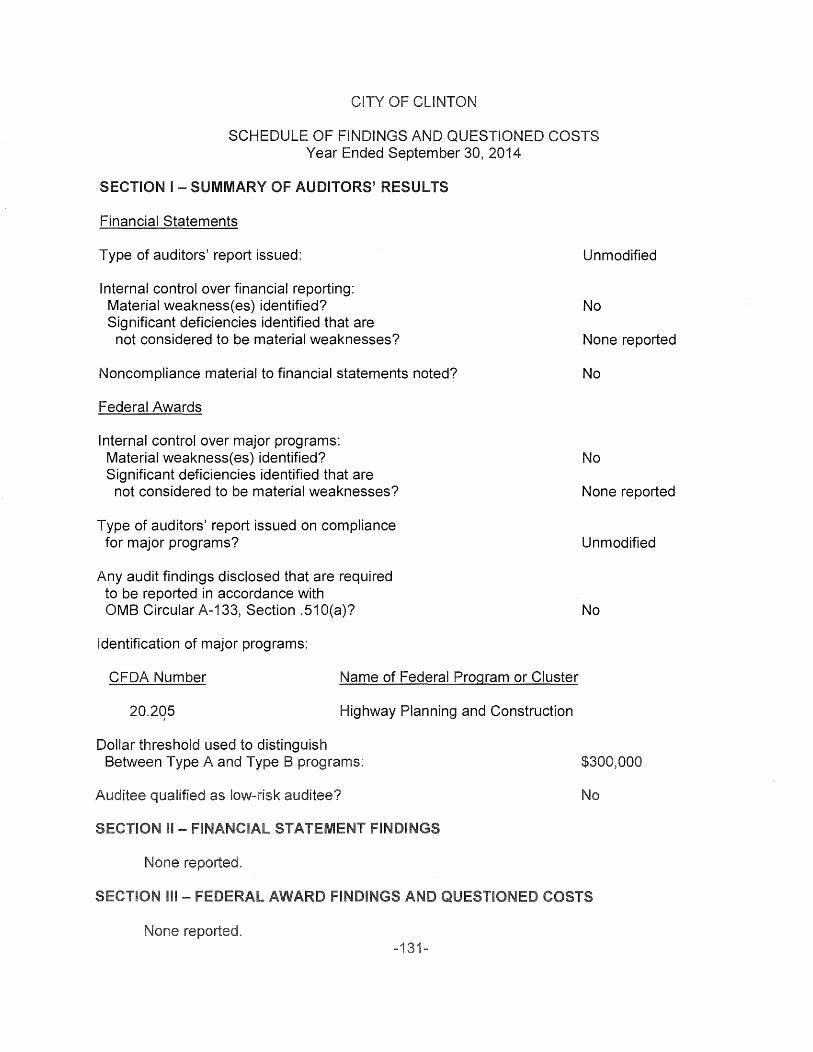
SCHEDULE OF FINDINGS AND QUESTIONED COSTS Year Ended September 30, 2014
SECTION I - SUMMARY OF AUDITORS' RESULTS
Financial Statements
Type of auditors' report issued:
Internal control over financial reporting: Material weakness( es) identified? Significant deficiencies identified that are
not considered to be material weaknesses?
Noncompliance material to financial statements noted?
Federal Awards
Internal control over major programs: Material weakness(es) identified? Significant deficiencies identified that are
not considered to be material weaknesses?
Type of auditors' report issued on compliance for major programs?
Any audit findings disclosed that are required to be reported in accordance with OMB Circular A-133, Section .51 O(a)?
Identification of major programs:
CFDA Number Name of Federal Program or Cluster
20.2Q5 Highway Planning and Construction
Dollar threshold used to distinguish Between Type A and Type B programs:
Auditee qualified as auditee?
II-
-1
Unmodified
No
None reported
No
No
None reported
Unmodified
No
$300,000
SUMMARY OF PRIOR NDINGS Year Ended September 30, 2014
No audit findings related to federal awards were reported in the audit of the year ended September 30, 2013.
-1