city of austin transportation department · city of austin transportation ... within the 32 square...
TRANSCRIPT
1
2014 AUSTIN BICYCLE PLAN
City of Austin
Transportation Department
2
Executive Summary
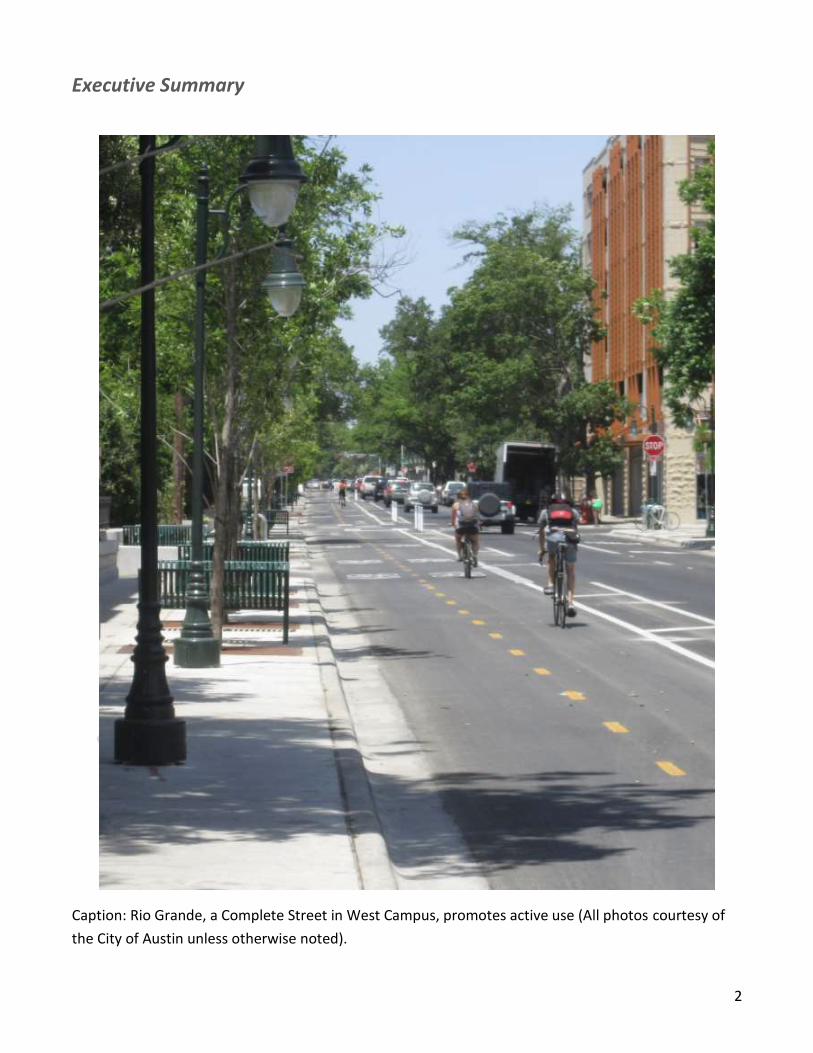
Caption: Rio Grande, a Complete Street in West Campus, promotes active use (All photos courtesy of
the City of Austin unless otherwise noted).
3
Vision
Achievements Since 2009 Bike Master Plan
Shifts in Best Practice Bicycle Planning
Activating Imagine Austin
Bicycle Plan Goals
Chapter 1: Bicycle System
Creating an All Ages and Abilities Bicycle Network
Barrier Removal
Chapter 2: Bicycle Programs
Chapter 3: Implementation
Chapter 4: Measuring Success
Vision
Austin is a place where people of all ages and abilities bicycle comfortably and safely for
transportation, fitness and enjoyment. Bicycling brings benefits not just to people who bicycle, but the
whole community by helping to activate the Imagine Austin Comprehensive Plan for our shared
sustainable future.
Achievements Since 2009 Bike Master Plan
The City of Austin Bicycle Master Plan 2014 (the Plan) reflects today’s best practices in municipal
planning for bicycling at a national and international level. An update of the 2009 Bicycle Master Plan,
this 2014 Plan reflects the latest innovation in approaches and sets a goal of creating an “all ages and
abilities” bicycle network. The “8-80” framework is a good test for all ages and abilities where an 8-
year-old or an 80-year-old should be able to navigate by bicycle comfortably and safely. The 2009 Plan
set the stage for a significant expansion of the bicycle network, primarily through painted bicycle lanes,
resulting in a substantial increase in bicycling throughout Austin.
● Austin’s bicycle network grew from 126 miles to 210 miles since 2009, a 70 percent expansion
in only five years.
● The expanded bicycle network resulted in a citywide bicycle mode share of 2 percent in 2011,
nearly doubling rates from 2009. (Mode share indicates people who primarily commute to work
by bicycle, at least three days per week.)
● Within the 32 square miles of central Austin, the mode share reported was 5.5 percent, and as
4
high as 13 percent in certain census tracts in 2012. This 5-13% mode share is already taking a
significant load off the congested motor vehicle travel lanes in Central Austin.
● The City of Austin completed dozens of new signature projects and removed barriers to cycling.
Some of these projects included creating new bicycle lanes on South Congress Avenue, Barton
Springs Road, Cameron Road, South Lamar Boulevard and Guadalupe Street. Existing bicycle
lanes were and continue to be routinely made safer and more comfortable by widening or
buffering lanes and by addressing parking concerns in the bicycle lane. Many more projects are
in construction or in design and restriping projects are often coordinated with street
resurfacing, in order to create work efficiencies.
Shifts in Best Practice Bicycle Planning
Protected Bicycle Lanes
In order to make bicycling feel safe for most people, it is necessary to physically protect bicycle lanes;
painted single lines are simply not enough of an incentive to encourage bicycle riding. National studies
have found about half of the population fits into the category of “interested but concerned” - they are
interested in bicycling for transportation, but concerned about their safety on the roads. In Austin, only
15 percent of bicyclists will ride in a painted bicycle lane on a busy road while 40 percent of bicyclists
would feel comfortable riding in a protected bicycle lane, but not a painted one. A statistically valid
phone survey conducted in 2013 by the City of Austin shows protected lanes would attract 55 percent
of Austin’s population.
Austin was selected as one of six U.S. cities to participate in the Green Lane Project to catalyze
implementation of protected bicycle lanes based on programs in bike-friendly European countries. The
Green Lane Project provided resources and technical assistance to help Austin implement quality
bicycle infrastructure. Austin officials also participated in key study trips to the Netherlands and
Denmark, and included a city council member, the city manager, the public works director, the city
traffic engineer and an assistant director of the planning department. During Austin’s two-year
participation with the Green Lane Project, the city increased the number of buffered or protected
bicycle lanes from 5 miles to 20 miles. Examples of completed protected bicycle lane projects include
Barton Springs Road, Guadalupe Street, Bluebonnet Lane and Rio Grande Street. Numerous other
protected bicycle lanes are currently in the planning and design stages.
Capturing Short Trips
Shifting short motor vehicle trips to bicycle trips is another best practice aimed at increasing bicycling.
Most trips Americans take are short: usually less than 3 miles. Short trips, or trips that consist of less
than three miles, are the most likely motor vehicle trips to convert to bicycle or walking trips.
Implementation of protected bicycle lanes should be focused where short trips most frequently occur
5
to maximize return on investment.
As a result, the 2014 Plan focuses on routes with high concentrations of existing short trips, most
notably within the central Austin area but also to neighborhood destinations throughout the city such
as schools, parks, business and shopping districts. To serve mid-length trips in the 3-9 mile range that
are still good candidates for bicycle trips, the plan focuses on key routes to central Austin from outlying
areas. To serve longer trips, the 2014 Plan focuses on linking short bicycle trips with longer transit trips
by providing protected bicycle lanes to major transit stations and secure bicycle parking at the station.
Significant bike share systems, such as an expanded Austin’s B-Cycle, are a powerful and flexible tool to
connect transit users to their destinations solving the “last mile” problem (the last mile problem refers
to the difficulty in getting people using transit to their final destination).
Building a Complete Bicycle Network
There is an international focus on the importance of creating complete networks that serve people of
all ages and abilities. Protected bicycle lanes are a great tool, but unless there is a network that serves
the variety of trips that a user desires to take, the increase in bicycling will be limited. The most
notable bicycle network success story is from Seville, Spain, where an 87-mile network of protected
bicycle lanes was installed, resulting in an increased bicycle mode share from 0.5 to 7 percent in just
three years. By comparison, it took Portland, Oregon, one of the country’s most bike-friendly cities, 20
years to create a network that resulted in a comparable shift in behavior.
Activating Imagine Austin
In 2012, the City of Austin adopted Imagine Austin, the first citywide comprehensive plan in 35 years. It
captures the community’s collective vision for how residents want Austin to grow and flourish. The
2014 Bicycle Plan is shaped by Imagine Austin and will serve as a tool for implementing the
comprehensive plan’s policies and eight priority programs, including key support for compact and
connected, affordable, healthy, workforce-related programs. Imagine Austin establishes big-picture,
long-range goals; the 2014 Plan addresses specific projects and programs to activate the
comprehensive plan’s principles over the next five years.
6
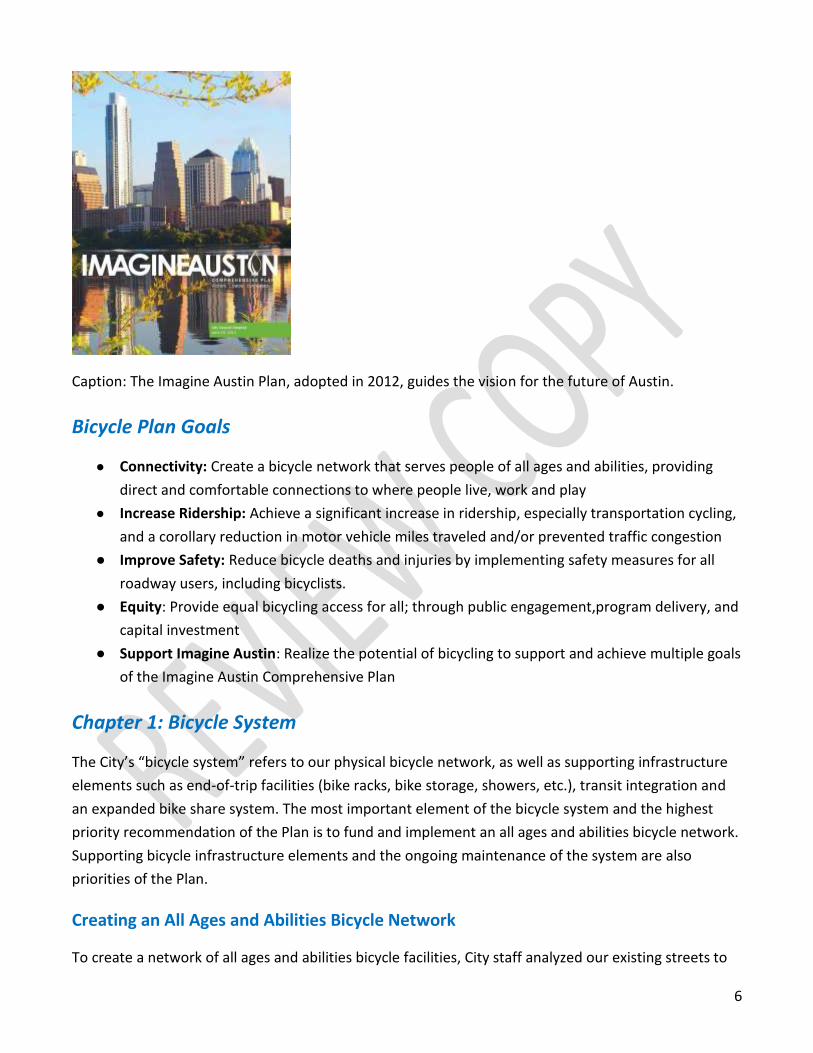
Caption: The Imagine Austin Plan, adopted in 2012, guides the vision for the future of Austin.
Bicycle Plan Goals
● Connectivity: Create a bicycle network that serves people of all ages and abilities, providing
direct and comfortable connections to where people live, work and play
● Increase Ridership: Achieve a significant increase in ridership, especially transportation cycling,
and a corollary reduction in motor vehicle miles traveled and/or prevented traffic congestion
● Improve Safety: Reduce bicycle deaths and injuries by implementing safety measures for all
roadway users, including bicyclists.
● Equity: Provide equal bicycling access for all; through public engagement,program delivery, and
capital investment
● Support Imagine Austin: Realize the potential of bicycling to support and achieve multiple goals
of the Imagine Austin Comprehensive Plan
Chapter 1: Bicycle System
The City’s “bicycle system” refers to our physical bicycle network, as well as supporting infrastructure
elements such as end-of-trip facilities (bike racks, bike storage, showers, etc.), transit integration and
an expanded bike share system. The most important element of the bicycle system and the highest
priority recommendation of the Plan is to fund and implement an all ages and abilities bicycle network.
Supporting bicycle infrastructure elements and the ongoing maintenance of the system are also
priorities of the Plan.
Creating an All Ages and Abilities Bicycle Network
To create a network of all ages and abilities bicycle facilities, City staff analyzed our existing streets to
7
determine the most cost-effective means of implementing this network. The result is a proposed
network that is compatible with existing motor vehicle volumes and parking needs, not requiring costly
street reconstruction, and focused on capturing short trips.
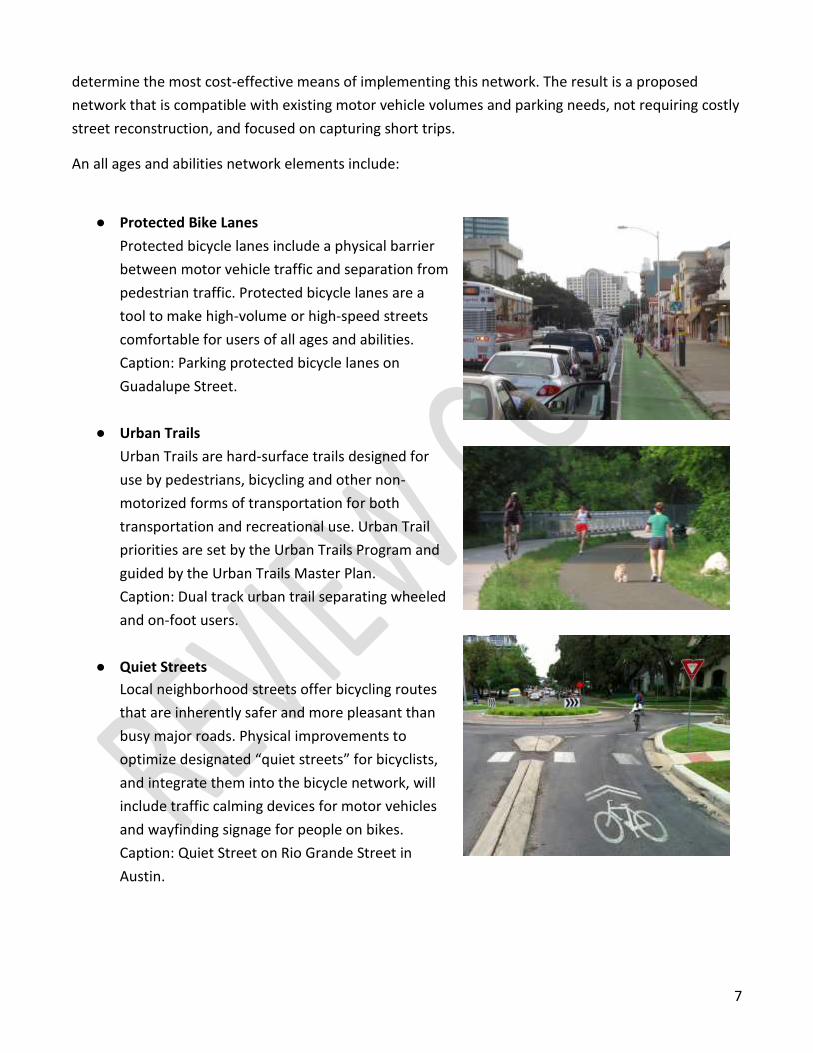
An all ages and abilities network elements include:
● Protected Bike Lanes
Protected bicycle lanes include a physical barrier
between motor vehicle traffic and separation from
pedestrian traffic. Protected bicycle lanes are a
tool to make high-volume or high-speed streets
comfortable for users of all ages and abilities.
Caption: Parking protected bicycle lanes on
Guadalupe Street.
● Urban Trails
Urban Trails are hard-surface trails designed for
use by pedestrians, bicycling and other non-
motorized forms of transportation for both
transportation and recreational use. Urban Trail
priorities are set by the Urban Trails Program and
guided by the Urban Trails Master Plan.
Caption: Dual track urban trail separating wheeled
and on-foot users.
● Quiet Streets
Local neighborhood streets offer bicycling routes
that are inherently safer and more pleasant than
busy major roads. Physical improvements to
optimize designated “quiet streets” for bicyclists,
and integrate them into the bicycle network, will
include traffic calming devices for motor vehicles
and wayfinding signage for people on bikes.
Caption: Quiet Street on Rio Grande Street in
Austin.
8
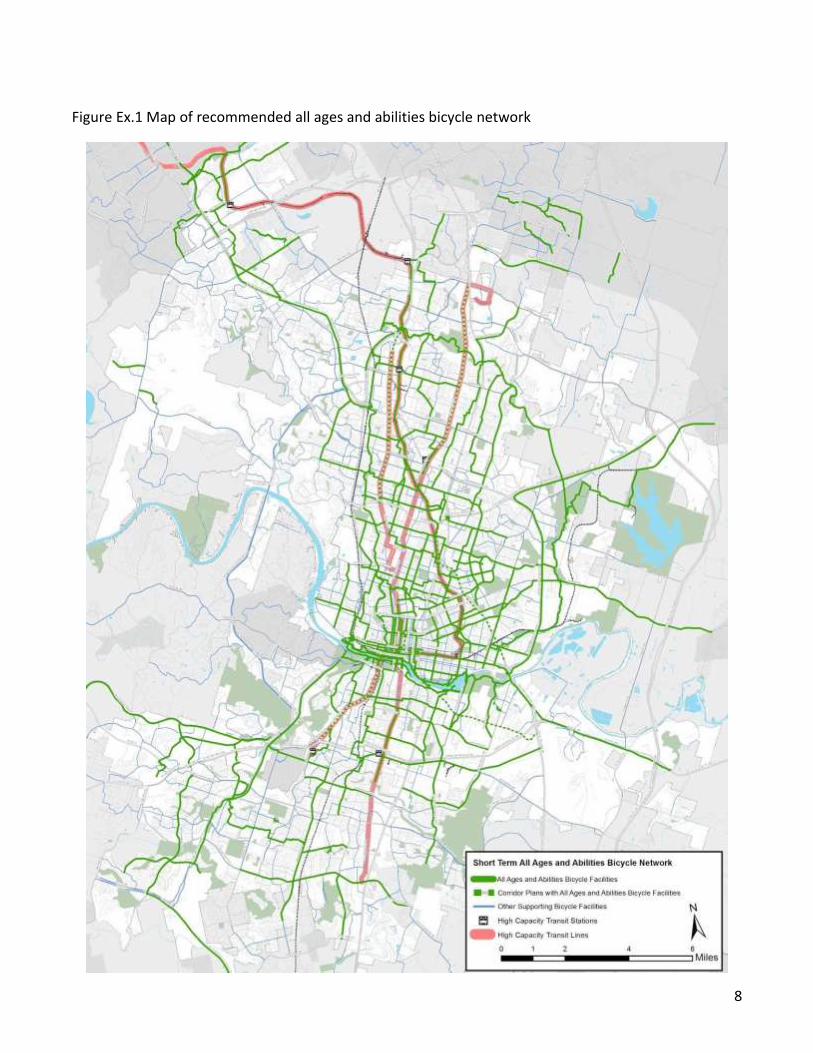
Figure Ex.1 Map of recommended all ages and abilities bicycle network
9
The planning level cost estimate for the all ages and abilities bicycle network is $151 million, and
leverages many existing and already funded bicycle facilities. The cost of priority unfunded investments
includes 200 new miles of on-street facilities for $58 million, at an average cost of $290,000 per mile.
The cost per mile for on-street facilities varies greatly upon the type of treatment and is accounted for
in the estimate. The estimate also includes 47 new miles of Urban Trails at $93 million at an average
cost of $2 million per mile. As funding for portions of the network become available, an
implementation plan would be developed, detailing the most strategic facility investments that would
be pursued at that time.
It is important to note that the Tier 1 trails recommended in the Urban Trails Master Plan, adopted by
City Council in September of 2014, are identical to the recommended urban trails in the Bicycle Plan’s
all ages and abilities bicycle network. Costs for these Tier 1 trails are included in the Bicycle Plan as
these urban trails are critical links in the bicycle network, and without them the all ages and abilities
bicycle network would be fragmented. In terms of cost of the all ages and abilities bicycle network,
urban trails account for the majority of the cost at $93 million of the total $151 million. The network
planning and cost-benefit analysis assumes that the investment in the on-street and off-street (urban
trail) networks are made in parallel to create one seamless all ages and abilities bicycle network.
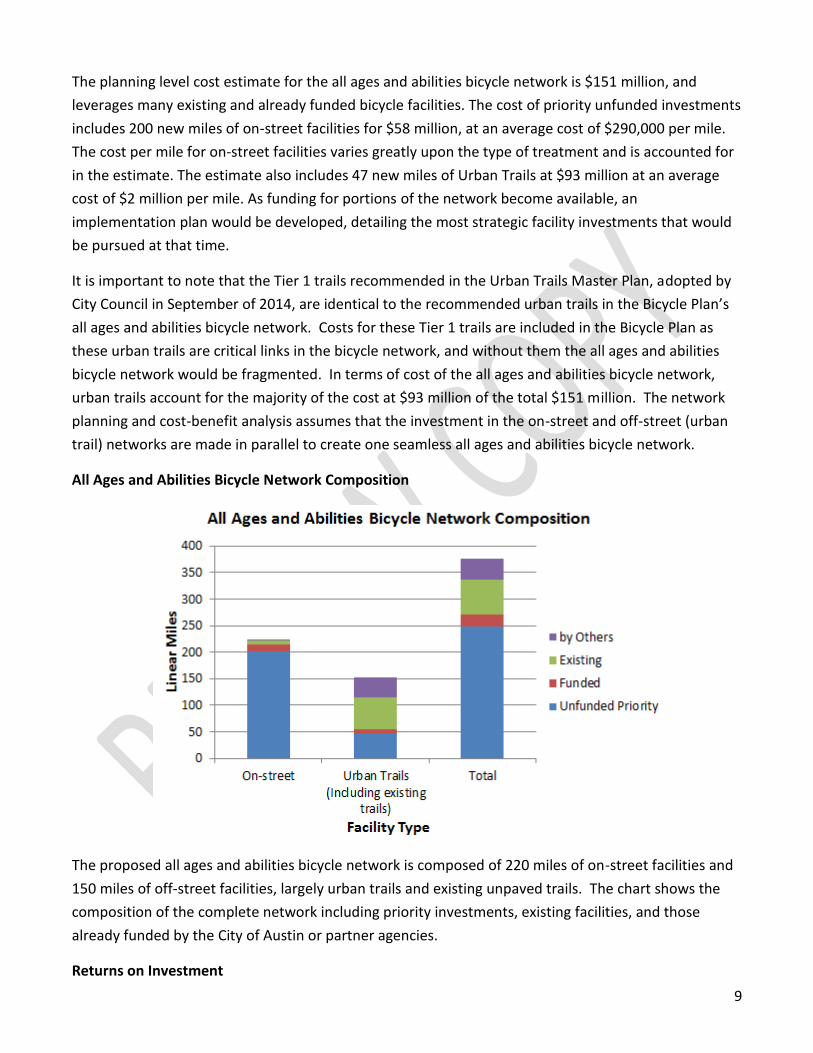
All Ages and Abilities Bicycle Network Composition
The proposed all ages and abilities bicycle network is composed of 220 miles of on-street facilities and
150 miles of off-street facilities, largely urban trails and existing unpaved trails. The chart shows the
composition of the complete network including priority investments, existing facilities, and those
already funded by the City of Austin or partner agencies.
Returns on Investment
10
City staff conducted an analysis to determine the multidimensional benefits that we would expect to
receive from the full investment in the recommended all ages and abilities network. Benefits were
conservatively calculated by forecasting the increase in bicycle use and associated decrease in motor
vehicle use. The analysis draws on data from other cities that have completed all ages and abilities
bicycle networks, and accounts for higher capture rates for short trips.
Calculated returns include:
● Reduced motor vehicle trips to downtown
Of the 300,000 motor vehicle trips bound to the central business district and university area
daily, there is an estimated reduction of 20,000 trips (7 percent) as a result of the all ages and
abilities bicycle network.
● Reduced city-wide motor vehicle trips
For citywide trips, not just those bound to the downtown area, there is an estimated reduction
of 170,000 daily driving trips, equating to 460,000 miles traveled daily.
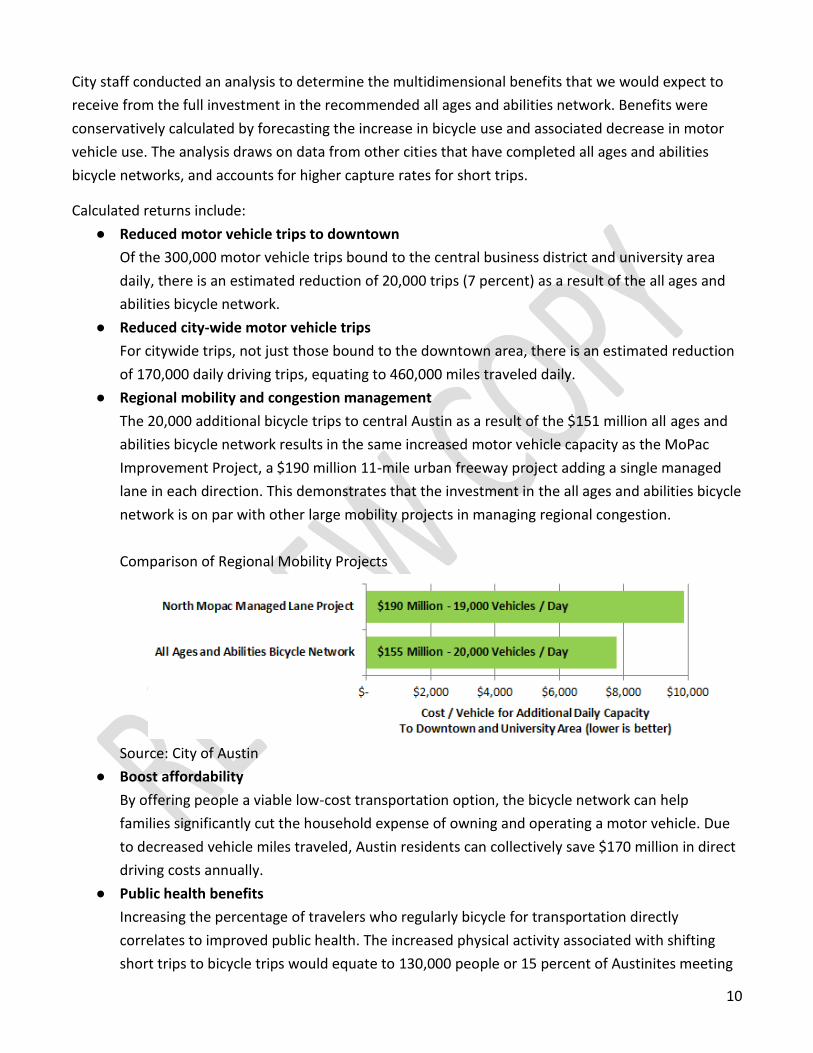
● Regional mobility and congestion management
The 20,000 additional bicycle trips to central Austin as a result of the $151 million all ages and
abilities bicycle network results in the same increased motor vehicle capacity as the MoPac
Improvement Project, a $190 million 11-mile urban freeway project adding a single managed
lane in each direction. This demonstrates that the investment in the all ages and abilities bicycle
network is on par with other large mobility projects in managing regional congestion.
Comparison of Regional Mobility Projects
Source: City of Austin
● Boost affordability
By offering people a viable low-cost transportation option, the bicycle network can help
families significantly cut the household expense of owning and operating a motor vehicle. Due
to decreased vehicle miles traveled, Austin residents can collectively save $170 million in direct
driving costs annually.
● Public health benefits
Increasing the percentage of travelers who regularly bicycle for transportation directly
correlates to improved public health. The increased physical activity associated with shifting
short trips to bicycle trips would equate to 130,000 people or 15 percent of Austinites meeting
11
their daily minimum physical activity.
● Environmental benefits
By reducing vehicle trips, bicycling reduces the pollution from motor vehicles. The reduction in
motor vehicle miles traveled would result in a reduction of 84,000 metric tons of carbon per
year, the equivalent of the carbon generated by the driving habits of Austinites over 11 days.
Barrier Removal
There is an existing and extensive network of painted bicycle lanes throughout the city that is still
incomplete. While not offering the same quality as protected bicycle lanes, these lanes can often be
installed in locations where protected lanes are not feasible. This will extend the reach of the all ages
and abilities bicycle network. The Plan prioritizes the funding and removal of barriers in the painted
bicycle lane network, estimated at a cost of $10 million.
Chapter 2: Bicycle Programs
The City of Austin seeks to help people of all ages and abilities realize the full potential of Austin’s
investment in the bicycle system through support of broad and diversified education, encouragement
and enforcement programs.
Education and encouragement programs are recommended to raise awareness, communicate the
benefits of bicycling, promote the use of the bicycle network, and help people learn how to bike safely.
These programs should target all demographic groups. The Plan recommends programs directed
toward both students, during their formative years to create changes in lifelong transportation habits,
and adults, to ensure the entire population has access to the information they need to expand their
transportation choices. The Plan recommends that the City partner with other transportation providers
to create a SmartTrips program - a proven multimodal education and encouragement model program
designed to reduce drive-alone trips. The City of Portland’s investment in a SmartTrips program
resulted in a 9 to 13 percent reduction in drive-alone trips for each neighborhood it served each year
for a decade.
In coordination with the Austin Police Department, the 2014 Plan calls for consistent enforcement of
the rules of the road in order to improve safety for all travelers. Law enforcement officers and the
bicycle community alike must understand and apply the laws in order to build a cooperative
relationship and safer streets.
Chapter 3: Implementation
The Imagine Austin plan sets forth a five-point implementation framework to ensure broad and lasting impact to
the community. The 2014 Bicycle Plan will follow this same framework in order to fully align its implementation
efforts with those of the Cityʻs comprehensive plan. The 2014 Bicycle Plan’s five points implementation program
12
is as follows:
● Education and Engagement
For successful implementation it is necessary to raise awareness, understanding and support
for the Plan and its alignment with Imagine Austin goals and elements. The Plan recommends
partnering with other transportation providers to provide systematic education and
encouragement.
● Internal Alignment
Implementing the Plan will require the City of Austin to take a collaborative, cross-
departmental approach to execution. It requires aligning City department planning efforts,
long-range and short-term capital investments, major initiatives and work programs, and long-
range budgets.
● Regulations
City code and regulations should support creation of an all ages and abilities bicycle network
and help produce a built comfortable environment for bicycling. The Land Development Code
and Transportation Criteria Manual currently are being revised to help create a more compact
and connected city. The jurisdiction of the Plan is the City of Austin, including its extraterritorial
jurisdiction.
● Public Investment
The Plan defines an overall need for approximately $161 million in capital investments for both
the all ages and abilities bicycle network ($151 million) and bicycle lane barrier removal ($10
million). In addition to capital costs (to construct protected bike lanes, paved trails and other
infrastructure), the City and its partners must budget appropriately for operating costs
(program staff, education programs, operations and maintenance). Active Transportation
Program staff under the Austin Transportation Department, responsible for the implementation
of the Plan also needs to be expanded to deliver the recommended priority infrastructure and
programs. For an investment strategy, the plan recommends accelerated investment in our
bicycle system to deliver a regional impact. Central to delivering a regional impact is making an
investment large enough to be able to create a complete bicycle network for people of all ages
and abilities, rather than isolated facilities. It recommends a multi-pronged, diverse and
creative funding strategy. Traditional funding sources include the City general fund,
transportation fund, voter-approved bonds and federal grants. Other innovative funding
approaches and partnerships should also be developed.
● Partnerships
Numerous partners could support the plan’s implementation, as the benefits of bicycling are
communitywide and help advance all aspects of the community’s Imagine Austin vision.
Implementing the plan requires the coordination of all City of Austin departments, partner
agencies and organizations, and the general public. By integrating bicycling as a tool to meet
13
the goals of groups outside the City government, a broad coalition can be built that will
significantly accelerate the realization of the plan.
Chapter 4: Measuring Success
Ongoing monitoring and evaluation are important for assessing whether the plan is meeting its goals
over time. Measuring real outcomes through the regular collection of data from bicycle facility use,
ridership counts, surveys, mode splits and other metrics used to track the growth of bicycling over
time, along with qualitatively evaluating the user experience is vital. While progress will be assessed
over the long-term, data should be collected on a regular basis to help track success of implementation
efforts. This information will allow for adjustments to improve implementation efforts toward the Plan
goals.