circulating micrornas as novel biomarkers for platelet ... · kirkby, roxanne crosby-nwaobi,...
TRANSCRIPT

MayrSivaprasad, Hugh S. Markus, Jane A. Mitchell, Timothy D. Warner, Stefan Kiechl and ManuelKirkby, Roxanne Crosby-Nwaobi, Marianna Prokopi, Ignat Drozdov, Sarah R. Langley, Sobha
Peter Willeit, Anna Zampetaki, Katarzyna Dudek, Dorothee Kaudewitz, Alice King, Nicholas S.Circulating MicroRNAs as Novel Biomarkers for Platelet Activation
Print ISSN: 0009-7330. Online ISSN: 1524-4571 Copyright © 2013 American Heart Association, Inc. All rights reserved.is published by the American Heart Association, 7272 Greenville Avenue, Dallas, TX 75231Circulation Research
doi: 10.1161/CIRCRESAHA.111.3005392013;112:595-600; originally published online January 2, 2013;Circ Res.
http://circres.ahajournals.org/content/112/4/595World Wide Web at:
The online version of this article, along with updated information and services, is located on the
http://circres.ahajournals.org/content/suppl/2013/01/02/CIRCRESAHA.111.300539.DC1.htmlData Supplement (unedited) at:
http://circres.ahajournals.org//subscriptions/
is online at: Circulation Research Information about subscribing to Subscriptions:
http://www.lww.com/reprints Information about reprints can be found online at: Reprints:
document. Permissions and Rights Question and Answer about this process is available in the
located, click Request Permissions in the middle column of the Web page under Services. Further informationEditorial Office. Once the online version of the published article for which permission is being requested is
can be obtained via RightsLink, a service of the Copyright Clearance Center, not theCirculation Researchin Requests for permissions to reproduce figures, tables, or portions of articles originally publishedPermissions:
at Queen Mary, University of London on September 10, 2013http://circres.ahajournals.org/Downloaded from

595
Brief UltraRapid Communication
Pioneering studies have revealed the presence of endoge-nous microRNAs (miRNAs) in the circulation that are not
cell-associated.1 The cellular origin and the biological func-tion of circulating miRNAs, however, are less clear.2
Editorial, see p 576We have previously quantified circulating miRNAs in a
large population-based cohort, the Bruneck study.3,4 Using concepts of network topology,5 we identified altered miRNA signatures in patients with type 2 diabetes mellitus3 and with
future myocardial infarction.4 In addition, we subjected healthy volunteers to limb ischemia-reperfusion generated by thigh cuff inflation.4 Computational analysis identified 6 distinct miRNA clusters.4 One cluster included all miRNAs associated with risk of myocardial infarction and consisted of miRNAs predominantly expressed in platelets. Microarray screening revealed that miR-126, miR-197, miR-223, miR-24, and miR-21 are among the most highly expressed miRNAs in platelets and platelet microparticles (PMPs), and their circulating levels correlated with PMPs as quantified by flow cytometry.
Original received November 14, 2012; revision received December 21, 2012; accepted December 28, 2012. In November 2012, the average time from submission to first decision for all original research papers submitted to Circulation Research was 15.8 days.
Brief UltraRapid Communications are designed to be a format for manuscripts that are of outstanding interest to the readership, report definitive observations, but have a relatively narrow scope. Less comprehensive than Regular Articles but still scientifically rigorous, BURCs present seminal findings that have the potential to open up new avenues of research. A decision on BURCs is rendered within 7 days of submission.
From the Department of Neurology, Medical University Innsbruck, Austria (P.W., S.K.); Department of Public Health and Primary Care, University of Cambridge, United Kingdom (P.W.); King’s British Heart Foundation Centre, King’s College London, United Kingdom (A.Z., K.D., D.K., M.P., I.D., S.R.L., M.M.); Stroke and Dementia Research Centre, St George’s University of London, London, United Kingdom (A.K., H.S.M.); National Heart and Lung Institute, Imperial College, London, United Kingdom (N.S.K., J.A.M.); William Harvey Research Institute, Queen Mary, University of London, London, United Kingdom (N.S.K., T.D.W.); Florence Nightingale School of Nursing and Midwifery, King’s College London, United Kingdom (R.C.-N.); and Laser and Retinal Unit, King’s College Hospital, London, United Kingdom (S.S.).
*These authors contributed equally to this study.The online-only Data Supplement is available with this article at http://circres.ahajournals.org/lookup/suppl/doi:10.1161/CIRCRESAHA.111.
300539/-/DC1.Correspondence to Manuel Mayr, King’s British Heart Foundation Centre, King’s College London, 125 Coldharbour Ln, London SE5 9NU, United
Kingdom. E-mail [email protected]© 2013 American Heart Association, Inc.
Circulation Research is available at http://circres.ahajournals.org DOI: 10.1161/CIRCRESAHA.111.300539
RES
Circulation Research
0009-7330
10.1161/CIRCRESAHA.111.300539
201564
Willeit et al Plasma miRNAs and Platelet Inhibition
15
February
2013
112
4
00
00
201211
21122012
28122012
© 2013 American Heart Association, Inc.
Rationale: MicroRNA (miRNA) biomarkers are attracting considerable interest. Effects of medication, however, have not been investigated thus far.
Objective: To analyze changes in plasma miRNAs in response to antiplatelet therapy.Methods and Results: Profiling for 377 miRNAs was performed in platelets, platelet microparticles, platelet-
rich plasma, platelet-poor plasma, and serum. Platelet-rich plasma showed markedly higher levels of miRNAs than serum and platelet-poor plasma. Few abundant platelet miRNAs, such as miR-24, miR-197, miR-191, and miR-223, were also increased in serum compared with platelet-poor plasma. In contrast, antiplatelet therapy significantly reduced miRNA levels. Using custom-made quantitative real-time polymerase chain reaction plates, 92 miRNAs were assessed in a dose-escalation study in healthy volunteers at 4 different time points: at baseline without therapy, at 1 week with 10 mg prasugrel, at 2 weeks with 10 mg prasugrel plus 75 mg aspirin, and at 3 weeks with 10 mg prasugrel plus 300 mg aspirin. Findings in healthy volunteers were confirmed by individual TaqMan quantitative real-time polymerase chain reaction assays (n=9). Validation was performed in an independent cohort of patients with symptomatic atherosclerosis (n=33), who received low-dose aspirin at baseline. Plasma levels of platelet miRNAs, such as miR-223, miR-191, and others, that is, miR-126 and miR-150, decreased on further platelet inhibition.
Conclusions: Our study demonstrated a substantial platelet contribution to the circulating miRNA pool and identified miRNAs responsive to antiplatelet therapy. It also highlights that antiplatelet therapy and preparation of blood samples could be confounding factors in case-control studies relating plasma miRNAs to cardiovascular disease. (Circ Res. 2013;112:595-600.)
Key Words: antiplatelet therapy ■ biomarkers ■ microRNAs ■ platelets ■ platelet inhibitors
Circulating MicroRNAs as Novel Biomarkers for Platelet Activation
Peter Willeit,* Anna Zampetaki,* Katarzyna Dudek, Dorothee Kaudewitz, Alice King, Nicholas S. Kirkby, Roxanne Crosby-Nwaobi, Marianna Prokopi, Ignat Drozdov, Sarah R. Langley,
Sobha Sivaprasad, Hugh S. Markus, Jane A. Mitchell, Timothy D. Warner, Stefan Kiechl, Manuel Mayr
Nancy I
33,92,135,186
Circ Res
at Queen Mary, University of London on September 10, 2013http://circres.ahajournals.org/Downloaded from
596 Circulation Research February 15, 2013
On the basis of our recent finding that circulating miRNAs may reflect platelet activation, we further investigate the plate-let contribution to circulating miRNAs. We provide proof-of-concept for the potential of platelet miRNAs as a surrogate marker of efficacy of antiplatelet therapy.
MethodsAn expanded Methods section is available in the Online Data Supplement.
Study SubjectsThe following samples were obtained: (1) platelets, PMPs, serum, platelet-rich plasma, and platelet-poor (PPP) plasma were isolated from healthy volunteers (n=3)6; (2) serum and PPP were collected from patients with type II diabetes mellitus (n=19, Online Table I); (3) PPP was collected from healthy young men (<40 years, n=9) par-ticipating in a dose-escalation study of dual antiplatelet therapy at 4 timepoints7; (4) validation was performed in PPP of patients with symptomatic carotid atherosclerosis8 (n=33, Online Table II).
Real-Time Polymerase Chain ReactionMiRNAs were measured as described previously.3,4 The layout of custom-made quantitative polymerase chain reaction (qPCR) plates is shown in Online Table III. For details and statistics or bioinformat-ics analysis, see the Online Data Supplement.
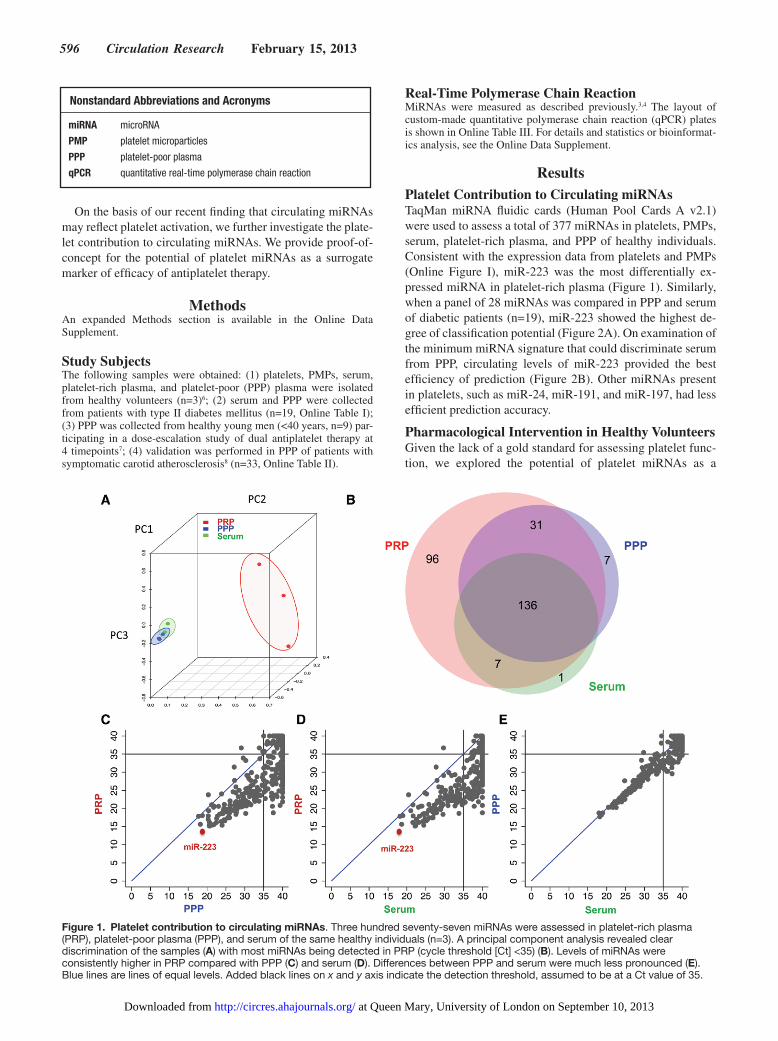
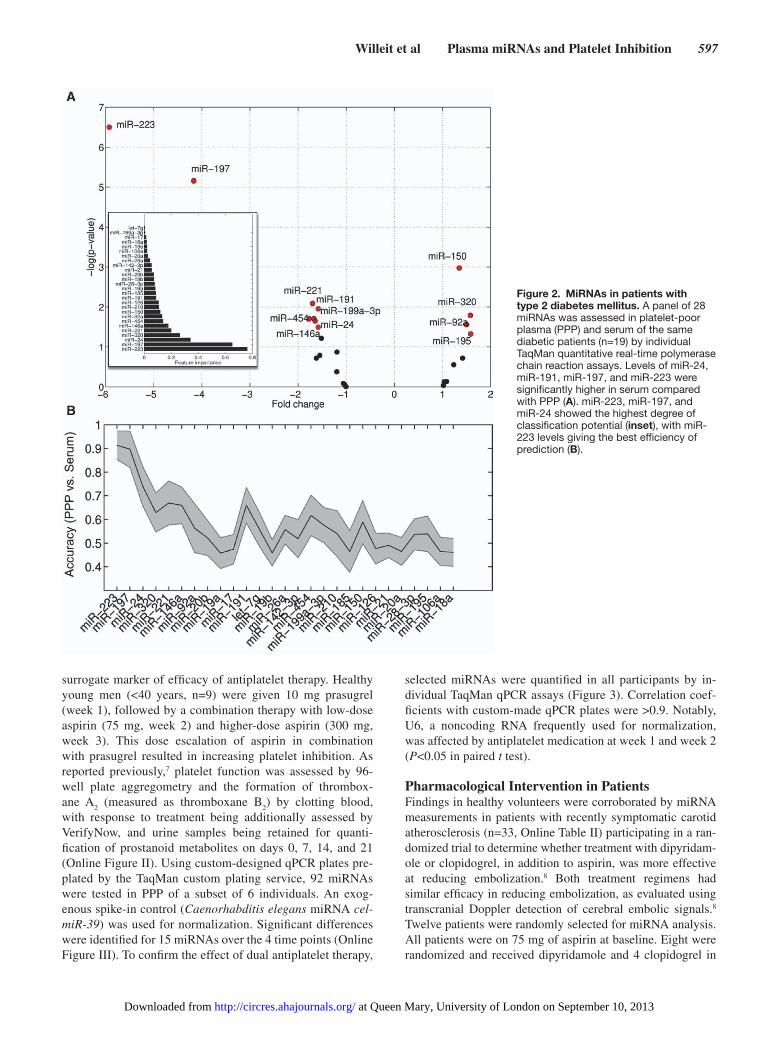
ResultsPlatelet Contribution to Circulating miRNAsTaqMan miRNA fluidic cards (Human Pool Cards A v2.1) were used to assess a total of 377 miRNAs in platelets, PMPs, serum, platelet-rich plasma, and PPP of healthy individuals. Consistent with the expression data from platelets and PMPs (Online Figure I), miR-223 was the most differentially ex-pressed miRNA in platelet-rich plasma (Figure 1). Similarly, when a panel of 28 miRNAs was compared in PPP and serum of diabetic patients (n=19), miR-223 showed the highest de-gree of classification potential (Figure 2A). On examination of the minimum miRNA signature that could discriminate serum from PPP, circulating levels of miR-223 provided the best efficiency of prediction (Figure 2B). Other miRNAs present in platelets, such as miR-24, miR-191, and miR-197, had less efficient prediction accuracy.
Pharmacological Intervention in Healthy VolunteersGiven the lack of a gold standard for assessing platelet func-tion, we explored the potential of platelet miRNAs as a
Nonstandard Abbreviations and Acronyms
miRNA microRNA
PMP platelet microparticles
PPP platelet-poor plasma
qPCR quantitative real-time polymerase chain reaction
Figure 1. Platelet contribution to circulating miRNAs. Three hundred seventy-seven miRNAs were assessed in platelet-rich plasma (PRP), platelet-poor plasma (PPP), and serum of the same healthy individuals (n=3). A principal component analysis revealed clear discrimination of the samples (A) with most miRNAs being detected in PRP (cycle threshold [Ct] <35) (B). Levels of miRNAs were consistently higher in PRP compared with PPP (C) and serum (D). Differences between PPP and serum were much less pronounced (E). Blue lines are lines of equal levels. Added black lines on x and y axis indicate the detection threshold, assumed to be at a Ct value of 35.
at Queen Mary, University of London on September 10, 2013http://circres.ahajournals.org/Downloaded from
Willeit et al Plasma miRNAs and Platelet Inhibition 597
surrogate marker of efficacy of antiplatelet therapy. Healthy young men (<40 years, n=9) were given 10 mg prasugrel (week 1), followed by a combination therapy with low-dose aspirin (75 mg, week 2) and higher-dose aspirin (300 mg, week 3). This dose escalation of aspirin in combination with prasugrel resulted in increasing platelet inhibition. As reported previously,7 platelet function was assessed by 96-well plate aggregometry and the formation of thrombox-ane A
2 (measured as thromboxane B
2) by clotting blood,
with response to treatment being additionally assessed by VerifyNow, and urine samples being retained for quanti-fication of prostanoid metabolites on days 0, 7, 14, and 21 (Online Figure II). Using custom-designed qPCR plates pre-plated by the TaqMan custom plating service, 92 miRNAs were tested in PPP of a subset of 6 individuals. An exog-enous spike-in control (Caenorhabditis elegans miRNA cel-miR-39) was used for normalization. Significant differences were identified for 15 miRNAs over the 4 time points (Online Figure III). To confirm the effect of dual antiplatelet therapy,
selected miRNAs were quantified in all participants by in-dividual TaqMan qPCR assays (Figure 3). Correlation coef-ficients with custom-made qPCR plates were >0.9. Notably, U6, a noncoding RNA frequently used for normalization, was affected by antiplatelet medication at week 1 and week 2 (P<0.05 in paired t test).
Pharmacological Intervention in PatientsFindings in healthy volunteers were corroborated by miRNA measurements in patients with recently symptomatic carotid atherosclerosis (n=33, Online Table II) participating in a ran-domized trial to determine whether treatment with dipyridam-ole or clopidogrel, in addition to aspirin, was more effective at reducing embolization.8 Both treatment regimens had similar efficacy in reducing embolization, as evaluated using transcranial Doppler detection of cerebral embolic signals.8 Twelve patients were randomly selected for miRNA analysis. All patients were on 75 mg of aspirin at baseline. Eight were randomized and received dipyridamole and 4 clopidogrel in
Figure 2. MiRNAs in patients with type 2 diabetes mellitus. A panel of 28 miRNAs was assessed in platelet-poor plasma (PPP) and serum of the same diabetic patients (n=19) by individual TaqMan quantitative real-time polymerase chain reaction assays. Levels of miR-24, miR-191, miR-197, and miR-223 were significantly higher in serum compared with PPP (A). miR-223, miR-197, and miR-24 showed the highest degree of classification potential (inset), with miR-223 levels giving the best efficiency of prediction (B).
at Queen Mary, University of London on September 10, 2013http://circres.ahajournals.org/Downloaded from

598 Circulation Research February 15, 2013
addition to aspirin. After 48 hours, effects on miRNAs were assessed in PPP using custom-designed miRNA qPCR plates based on Exiqon’s locked nucleic acid technology to further ensure robustness of data independent of the technological platform (Online Figure IV). Selected miRNAs were quanti-fied in all patients (n=33) by individual TaqMan qPCR assays (Figure 4). As in healthy volunteers, more potent platelet inhi-bition resulted in a reduction of miR-126 (P<0.001), miR-150 (P=0.003), miR-191 (P=0.004), and miR-223 (P=0.016), pro-viding independent confirmation of our findings in a patient cohort, who were not naive for antiplatelet agents. In com-parison, changes in ex vivo measurements of peak aggregation to ADP and collagen were less pronounced (Online Table II).
DiscussionThe present study identified circulating platelet miRNAs that are responsive to antiplatelet therapy. Particular strengths of
our study are as follows: (1) the repeated measurements in healthy individuals; (2) the additional investigation in patients on dual antiplatelet therapy; (3) the large number of miRNAs that were assessed by using custom-designed miRNA qPCR plates based on 2 different technologies (locked nucleic acid and TaqMan).9
Circulating Platelet miRNAsPlatelets represent the second most abundant cell type in blood. Although their miRNA content is low compared with other cells, platelets contribute substantially to the circulating miR-NA pool. Any inconsistencies in plasma preparation will have profound effects on the miRNA content. Also, platelets shed microparticles on activation. Reduced microparticle shedding on platelet inhibition is likely to be responsible for the ob-served decrease in plasma miRNAs. Antiplatelet therapy was probably a confounding factor in previous case–control studies
.1
1
10
Geo
met
ric m
ean
of m
iRN
A le
vel (
95%
CI)
Group* 1 2 3 4 1 2 3 4 1 2 3 4 1 2 3 4 1 2 3 4 1 2 3 4 1 2 3 4 1 2 3 4 1 2 3 4
Ptrend 0.113 <0.001 0.012 <0.001 0.520 <0.001 <0.001 <0.001 <0.001
MiRNA U6 126 150 191 197 20b 21 223 24
* 1 = baseline, no therapy2 = +1 week, 10mg prasugrel3 = +1 week, 10mg prasugrel + 75mg ASA4 = +1 week, 10mg prasugrel + 300mg ASA
Figure 3. Response to antiplatelet therapy in healthy individuals. After screening of 92 miRNAs using custom-made quantitative real-time polymerase chain reaction (qPCR) plates (Online Figure III), a panel of 8 miRNAs plus U6 was assessed by individual Taqman qPCR assays in platelet-poor plasma from all healthy volunteers (n=9) participating in a dose-escalation study for antiplatelet therapy. Probability values are from linear mixed models with random intercepts comparing miRNA levels over the 4 time points. ASA indicates acetylsalicylic acid.
* 1 = baseline, 75mg ASA2 = +48 h, 75mg ASA + dipyridamole 200mg bd. or
75mg ASA + 300mg clopidogrel loading dose followed by 75mg od.
.1
1
10
Geo
met
ric m
ean
of m
iRN
Ale
vel (
95%
CI)
Group* 1 2 1 2 1 2 1 2 1 2 1 2 1 2 1 2 1 2
P value
MiRNA U6 126 150 191 197 20b 21 223 24
0.629 <0.001 0.003 0.004 0.739 0.154 0.636 0.016 0.097
Figure 4. Response to antiplatelet therapy in patients. After screening of 92 miRNAs using custom-made quantitative real-time polymerase chain reaction plates (Online Figure IV), a panel of 8 miRNAs plus U6 was assessed in patients with symptomatic carotid atherosclerosis (n=33) who were on 75 mg aspirin (ASA) at baseline. Samples were taken 48 h after initiation of dual antiplatelet therapy with either dipyridamole or clopidogrel. *Groups depicted in red differ significantly in their average ΔCt value from the baseline group (tested by paired t tests, critical probability value of 0.05).
at Queen Mary, University of London on September 10, 2013http://circres.ahajournals.org/Downloaded from

Willeit et al Plasma miRNAs and Platelet Inhibition 599
reporting a loss of miRNAs in patients with coronary artery disease.10 Similarly, the transcoronary concentration gradients of noncardiac miRNAs may be related to platelet adhesion in the coronary circulation.11 Given our limited knowledge about circulating miRNAs,12 well-controlled intervention studies are needed to fill the significant gaps in our current knowledge about the effects of medication on circulating miRNAs.
Effects of Antiplatelet TherapyAntiplatelet therapy plays a prime role in treatment and prevention of myocardial infarction and strokes. Yet, there is still no widely agreed and ideal measure of platelet ac-tivation to assess antiplatelet efficacy.13 Importantly, the combination therapy of aspirin plus P2Y
12 inhibitors is as-
sociated with a significant bleeding risk, which can be life-threatening in a small but significant number of patients.14 Combination therapy is commonly used for the manage-ment of non–ST-elevation acute coronary syndromes and ST-elevation myocardial infarction. Aspirin inhibits the production of thromboxanes. P2Y
12 inhibitors, such as
clopidogrel, prasugrel, and ticagrelor, act by inhibiting ADP receptors. Thus, their mechanisms are complementary but variability in response to clopidogrel has been associated with gastrointestinal absorption, drug interactions, and P450 isoenzyme activity.15 There is currently no one measure or standard definition in tests for antiplatelet efficacy.13 Our study provides evidence that platelet miRNAs should be ex-plored as a point-of-care test for tailoring antiplatelet thera-pies. These findings could become even more important as new potent antiplatelet agents are currently developed and tested in clinical trials.
Clinical ImplicationsmiRNAs are stable and readily determined by qPCR, a tech-nique widely used for viral diagnostics in clinical laboratories. Furthermore, quantification of miRNAs may well provide information about platelet reactivity within the circulation, which is a result of a balance between pro- and antiaggregato-ry stimuli. Tests of platelet reactivity to date have concentrated on assessing platelet responses ex vivo. Such approaches have notably failed to provide any useful guidance to antiplatelet medication. Thus, a clinical introduction of platelet miRNA assays could address the need to provide tailored effective an-tiplatelet therapy. Future studies will need to explore whether platelet miRNA-guided dosing of therapy can improve thera-peutic outcomes.
ConclusionsRepeated measurements in healthy volunteers and patients on antiplatelet therapy provided proof-of-concept that miRNAs could serve as novel biomarkers of platelet activation and codiagnostic for efficacy of antiplatelet therapy. This awaits confirmation in larger studies. Our findings also highlight that antiplatelet therapy is a potential confounding factor for
miRNA measurements in case–control studies of cardiovas-cular disease.
Sources of FundingP. Willeit is supported by a nonclinical PhD studentship from the British Heart Foundation. M. Mayr is a senior fellow of the British Heart Foundation (FS/10/37/28413). The research was supported by the National Institute of Health Research Biomedical Research Center based at Guy’s and St Thomas’ National Health Service Foundation Trust and King’s College London in partnership with King’s College Hospital, the British Heart Foundation, Diabetes UK, and the Juvenile Diabetes Research Foundation. Work in the laboratory of N.S. Kirkby, J.A. Mitchell, and T.D. Warner was supported by the William Harvey Research Foundation and the Wellcome Trust (085255/Z/08/Z). This work forms part of the re-search themes contributing to the translational research portfolio of Barts and the London Cardiovascular Biomedical Research Unit, which is supported and funded by the National Institute of Health Research. The Ambulatory Dual Anti-Platelet study was funded by a Research Project Grant from the Stroke Association.
DisclosuresThe authors filed patent applications related to circulating miRNAs as cardiovascular biomarkers.
References 1. Mitchell PS, Parkin RK, Kroh EM, et al. Circulating microRNAs as sta-
ble blood-based markers for cancer detection. Proc Natl Acad Sci USA. 2008;105:10513–10518.
2. Zampetaki A, Mayr M. MicroRNAs in vascular and metabolic disease. Circ Res. 2012;110:508–522.
3. Zampetaki A, Kiechl S, Drozdov I, Willeit P, Mayr U, Prokopi M, Mayr A, Weger S, Oberhollenzer F, Bonora E, Shah A, Willeit J, Mayr M. Plasma microRNA profiling reveals loss of endothelial miR-126 and other microRNAs in type 2 diabetes. Circ Res. 2010;107: 810–817.
4. Zampetaki A, Willeit P, Tilling L, Drozdov I, Prokopi M, Renard JM, Mayr A, Weger S, Schett G, Shah A, Boulanger CM, Willeit J, Chowienczyk PJ, Kiechl S, Mayr M. Prospective study on circulat-ing microRNAs and risk of myocardial infarction. J Am Coll Cardiol. 2012;60:290–299.
5. Zampetaki A, Willeit P, Drozdov I, Kiechl S, Mayr M. Profiling of cir-culating microRNAs: from single biomarkers to re-wired networks. Cardiovasc Res. 2012;93:555–562.
6. Prokopi M, Pula G, Mayr U, Devue C, Gallagher J, Xiao Q, Boulanger CM, Westwood N, Urbich C, Willeit J, Steiner M, Breuss J, Xu Q, Kiechl S, Mayr M. Proteomic analysis reveals presence of platelet mi-croparticles in endothelial progenitor cell cultures. Blood. 2009;114: 723–732.
7. Leadbeater PD, Kirkby NS, Thomas S, Dhanji AR, Tucker AT, Milne GL, Mitchell JA, Warner TD. Aspirin has little additional anti-platelet effect in healthy volunteers receiving prasugrel. J Thromb Haemost. 2011;9:2050–2056.
8. King A, Bath PM, Markus HS. Clopidogrel versus dipyridamole in addi-tion to aspirin in reducing embolization detected with ambulatory tran-scranial Doppler: a randomized trial. Stroke. 2011;42:650–655.
9. Zampetaki A, Mayr M. Analytical challenges and technical limitations in assessing circulating miRNAs. Thromb Haemost. 2012;108:592–598.
10. Fichtlscherer S, De Rosa S, Fox H, Schwietz T, Fischer A, Liebetrau C, Weber M, Hamm CW, Röxe T, Müller-Ardogan M, Bonauer A, Zeiher AM, Dimmeler S. Circulating microRNAs in patients with coronary ar-tery disease. Circ Res. 2010;107:677–684.
11. De Rosa S, Fichtlscherer S, Lehmann R, Assmus B, Dimmeler S, Zeiher AM. Transcoronary concentration gradients of circulating microRNAs. Circulation. 2011;124:1936–1944.
12. Engelhardt S. Small RNA biomarkers come of age. J Am Coll Cardiol. 2012;60:300–303.
at Queen Mary, University of London on September 10, 2013http://circres.ahajournals.org/Downloaded from

600 Circulation Research February 15, 2013
13. Gremmel T, Steiner S, Seidinger D, Koppensteiner R, Panzer S, Kopp CW. The influencing factors for clopidogrel-mediated platelet inhibition are assay-dependent. Thromb Res. 2011;128:352–357.
14. Wallentin L, Becker RC, Budaj A, et al; PLATO Investigators. Ticagrelor versus clopidogrel in patients with acute coronary syndromes. N Engl J Med. 2009;361:1045–1057.
15. Price MJ, Murray SS, Angiolillo DJ, Lillie E, Smith EN, Tisch RL, Schork NJ, Teirstein PS, Topol EJ; GIFT Investigators. Influence of genetic polymorphisms on the effect of high- and standard-dose clopi-dogrel after percutaneous coronary intervention: the GIFT (Genotype Information and Functional Testing) study. J Am Coll Cardiol. 2012;59:1928–1937.
What Is Known?
• Platelets and platelet microparticles contain microRNAs.• Platelets shed microparticles on activation.• Platelet microparticles correlate to plasma microRNAs.
What New Information Does This Article Contribute?
• Extent of platelet contribution to circulating microRNAs.• Identification of plasma microRNAs responsive to platelet inhibition
Tests of platelet reactivity to date have concentrated on assessing platelet responses ex vivo. Such approaches have limited use in guiding antiplatelet medication. Platelets shed microparticles on activation. Microparticles contain platelet microRNAs, which can be readily determined by real-time polymerase chain reactions. Thus, a clinical introduction of platelet microRNA assays could be used to tailor antiplatelet therapy and reduce the risk of life-threatening bleeding complications. Future studies are required to determine whether tailoring antiplatelet therapies according to platelet microRNA levels might improve therapeutic outcomes in patients on dual antiplatelet therapy.
Novelty and Significance
at Queen Mary, University of London on September 10, 2013http://circres.ahajournals.org/Downloaded from

SUPPLEMENTAL MATERIAL
BRIEF ULTRARAPID COMMUNICATION
Circulating MicroRNAs as Novel Biomarkers for Platelet Activation
Peter Willeit1, 2, *, Anna Zampetaki3,*, Katarzyna Dudek3, Dorothee Kaudewitz3, Alice King4, Nicholas S Kirkby5, 6, Roxanne Crosby-Nwaobi7, Marianna Prokopi3, Ignat Drozdov3, Sarah Langley3, Sobha Sivaprasad8, Hugh Markus4, Jane A Mitchell5, Timothy D Warner6, Stefan Kiechl1, Manuel Mayr3
1 Department of Neurology, Medical University Innsbruck, Austria 2 Department of Public Health and Primary Care, University of Cambridge, UK 3 King’s British Heart Foundation Centre, King’s College London, UK 4 St George’s, University of London, London, UK 5 National Heart and Lung Institute, Imperial College, London, UK 6 William Harvey Institute, Queen Mary’s, University of London, London, UK
7 Florence Nightingale School of Nursing and Midwifery, King's College London 8 Laser and Retinal Unit, King's College Hospital * Authors contributed equally
Online Figures: 4, Online Tables: 3 Corresponding author: Prof. Manuel Mayr, King’s British Heart Foundation Centre, King’s College London, 125 Coldharbour Lane, London SE5 9NU, UK. Fax number: +44 (0)20 7848 5296, Tel number: +44 (0)20 7848 5132 E-mail: [email protected]
at Queen Mary, University of London on September 10, 2013http://circres.ahajournals.org/Downloaded from

2
MATERIALS AND METHODS Study subjects. The appropriate Ethics Committees approved the studies, and all study subjects gave their written informed consent before entering the studies. The following samples were obtained: (a) Plasma and serum samples were collected from the same diabetic patients (n=19). Baseline clinical and laboratory characteristics of the 19 subjects are shown in Online Table I. (b) Healthy young males (<40 yrs, n=9) underwent a dual anti-platelet therapy and plasma samples were collected at baseline (timepoint 1), following 1 week of 10 mg prasugrel treatment (timepoint 2), one week of 10 mg prasugrel and 75 mg of aspirin treatment (timepoint 3) and one week of 10 mg of prasugrel and 300 mg of aspirin (timepoint 4)1. (c) Findings in healthy volunteers were corroborated by miRNA measurements in 33 patients (Online Table II) participating in a randomized trial to determine whether treatment with dipyridamole or clopidogrel, in addition to aspirin, was more effective at reducing embolization in patients with recent symptomatic carotid stenosis2. Treatment efficiency was evaluated using transcranial Doppler detection of embolic signals and platelet aggregometry2. MiRNA screening in platelets and PMPs. Platelets were isolated from three healthy volunteers3. In brief, blood was drawn using acid citrate dextrose as anticoagulant (ACD: 120 mmol/L sodium citrate, 110 mmol/L glucose, 80 mmol/L citric acid, 1:7 vol/vol) and centrifuged for 17 minutes at 200g and 30°C in the presence of indomethacin (10 µmol/L; Sigma-Aldrich). The platelet-rich plasma (PRP) was then centrifuged for another 10 minutes at 1000g in the presence of prostacyclin (0.1 µg/mL; Sigma-Aldrich). The supernatant was kept as platelet-poor plasma (PPP). The pelleted platelets were resuspended in modified Tyrode-HEPES buffer (145 mmol/L NaCl, 2.9
mmol/L KCl, 10 mmol/L HEPES, 1 mmol/L MgCl2, 5 mmol/L glucose, pH 7.3) at a concentration of 4 x 10⁸/mL. PMPs were isolated following platelet activation with thrombin (0.1 U/mL; Sigma-Aldrich). Platelet aggregation was monitored with a turbidometric method (Chronolog 490; Chronolog). PMPs were harvested by ultracentrifugation at 100000g for 90 minutes at 4°C. The pellet was lysed in Qiazol reagent and RNA was extracted as described above. Total RNA was eluted in 25µl of nuclease free H2O. RNA was quantified using the NanoDrop spectrophotometer and 20ng of total RNA were used for reverse transcription. The expression profile of platelets and PMPs was assessed using the Human TaqMan miRNA Array Card A (Applied Biosystems) as described previously4. RNA isolation, reverse transcription and pre-amplification. MiRNAs were extracted using the miRNeasy kit (Qiagen) as described previously4,5. A fixed volume of 3µl of the 25µl RNA eluate was used as input in each reverse transcription (RT) reaction. An RT reaction and pre-amplification step were performed as described previously4,5. In brief, miRNAs were reversely transcribed using Megaplex Primer Pools (Human Pools A v2.1, Applied Biosystems). RT reaction products were further amplified using the Megaplex PreAmp Primers (Primers A v2.1) as recommended by the manufacturer. Both RT and PreAmp products were stored at -20°C.
at Queen Mary, University of London on September 10, 2013http://circres.ahajournals.org/Downloaded from

3
TaqMan qPCR assay. TaqMan miRNA assays were used to assess the expression of individual miRNAs. 0.5 µl diluted pre-amplification product were combined with 0.25 µl TaqMan miRNA Assay (20x) (Applied Biosystems) and 2.5 µl TaqMan Universal PCR Master Mix No AmpErase UNG (2x) to a final volume of 5 µl. QPCR was performed on an Applied Biosystems 7900HT thermocycler at 95°C for 10 min, followed by 40 cycles of 95°C for 15 sec and 60°C for 1 min. All samples were run in duplicates. Relative quantification was performed using the software SDS2.2 (Applied Biosystems). Exogenous miRNA (cel-miR-39) was used as a spike-in normalization control as described previously4. TaqMan miRNA custom-designed qPCR plates. The expression profile of miRNAs in platelet-poor plasma samples (PPP) of healthy volunteers participating in the dose escalation study was determined using custom-made Human TaqMan miRNA qPCR assay plates. A total of 92 miRNAs previously identified as consistently present in the circulation and a set of 4 targets that served as normalization controls or negative controls were quantified. The layout of the custom-made qPCR array is shown in Online Table III. Exiqon miRNA custom-designed qPCR plates. The expression profile of miRNAs in PPP of patients with recently symptomatic carotid atherosclerosis was determined using custom-made human Exiqon LNA qPCR plates. A total of 90 miRNAs were measured using the miCURY LNA Universal RT microRNA PCR protocol which is a two-part protocol consisting of first-strand cDNA synthesis followed real-time PCR amplification. For cDNA synthesis, 4µl of 5x Reaction buffer were combined with 2 µl of 10xEnzyme mix and 4µl of RNA to a final volume of 20µl. Reverse transcription was performed by incubating the samples at 42°C for 1h and subsequent heat inactivation of the enzyme at 95°C for 5 min. RT products were stored at -20°C. For PCR amplification, 2x SYBR® green master mix was used for cDNA with the reaction conditions being identical as described for TaqMan qPCR plates.
Bioinformatics and statistics. Predictive significance of all miRNAs was calculated using bootstrap aggregation for an ensemble of 10,000 decision trees. Each miRNA profile was assigned an importance value based on how well it can differentiate PPP and serum samples of the same diabetic patient (value range is from 0 to 1 with one being the greatest discriminatory power). Accuracy to discriminate plasma and serum samples for all miRNAs was quantified using the Support Vector Machines (SVM) algorithm, a supervised learning method, and a 10-fold cross validation approach. SVM were trained on half of the data selected at random and validated on the remaining samples. This procedure was repeated 10 times and the final correct classification rate (accuracy) was presented as an average of all SVM iterations. The changes in miRNA levels in response to anti-platelet therapy were evaluated using paired t-tests for comparison between two time points, with the baseline levels as reference group. For more than two time points, P-values were calculated with linear mixed models with a random intercept. Unlike ANOVA, this test takes the auto-correlation of measurements within individuals into account. Because raw miRNA expression levels were
at Queen Mary, University of London on September 10, 2013http://circres.ahajournals.org/Downloaded from

4
markedly skewed, the arithmetic mean and its confidence interval were calculated on a logarithmic scale for statistical analyses, which correspond to the geometric mean and its confidence interval after back-transformation to the normal scale. Stata version 12.0 MP was used for statistical analysis, with two-sided tests and P<0.05. Online References 1. Leadbeater PD, Kirkby NS, Thomas S, Dhanji AR, Tucker AT, Milne GL, Mitchell JA, Warner TD. Aspirin has little additional anti-platelet effect in healthy volunteers receiving prasugrel. J Thromb Haemost. 2011;9:2050-2056 2. King A, Bath PM, Markus HS. Clopidogrel versus dipyridamole in addition to aspirin in reducing embolization detected with ambulatory transcranial doppler: A randomized trial. Stroke. 2011;42:650-655 3. Prokopi M, Pula G, Mayr U, Devue C, Gallagher J, Xiao Q, Boulanger CM, Westwood N, Urbich C, Willeit J, Steiner M, Breuss J, Xu Q, Kiechl S, Mayr M. Proteomic analysis reveals presence of platelet microparticles in endothelial progenitor cell cultures. Blood. 2009;114:723-732 4. Zampetaki A, Kiechl S, Drozdov I, Willeit P, Mayr U, Prokopi M, Mayr A, Weger S, Oberhollenzer F, Bonora E, Shah A, Willeit J, Mayr M. Plasma microRNA profiling reveals loss of endothelial mir-126 and other microRNAs in type 2 diabetes. Circ Res. 2010;107:810-817 5. Zampetaki A, Willeit P, Tilling L, Drozdov I, Prokopi M, Renard JM, Mayr A, Weger S, Schett G, Shah A, Boulanger CM, Willeit J, Chowienczyk PJ, Kiechl S, Mayr M. Prospective study on circulating microRNAs and risk of myocardial infarction. J Am Coll Cardiol. 2012;60:290-299 Online Figures Online Figure I. MiRNA profile of platelets and PMPs. MiRNAs were determined by microarray screening. The average Ct value was used as a normalization control. Expression levels (2-DCt) were log transformed.
Online Figure II. Platelet function measurements upon platelet inhibition. TxB2, denotes thromboxane B2; Tx-M, urinary metabolites of thromboxane; PGI-M, urinary prostanoid metabolites; TRAP-6, thrombin receptor activator for peptide 6. Online Figure III. MiRNA response to anti-platelet therapy in healthy individuals. Levels of 92 miRNAs were measured at four time points in PPP from healthy volunteers (n=6) using custom-made TaqMan qPCR plates. *Groups depicted in red differ significantly according to the p values derived from linear mixed models with random intercepts comparing miRNA levels over the four time points.
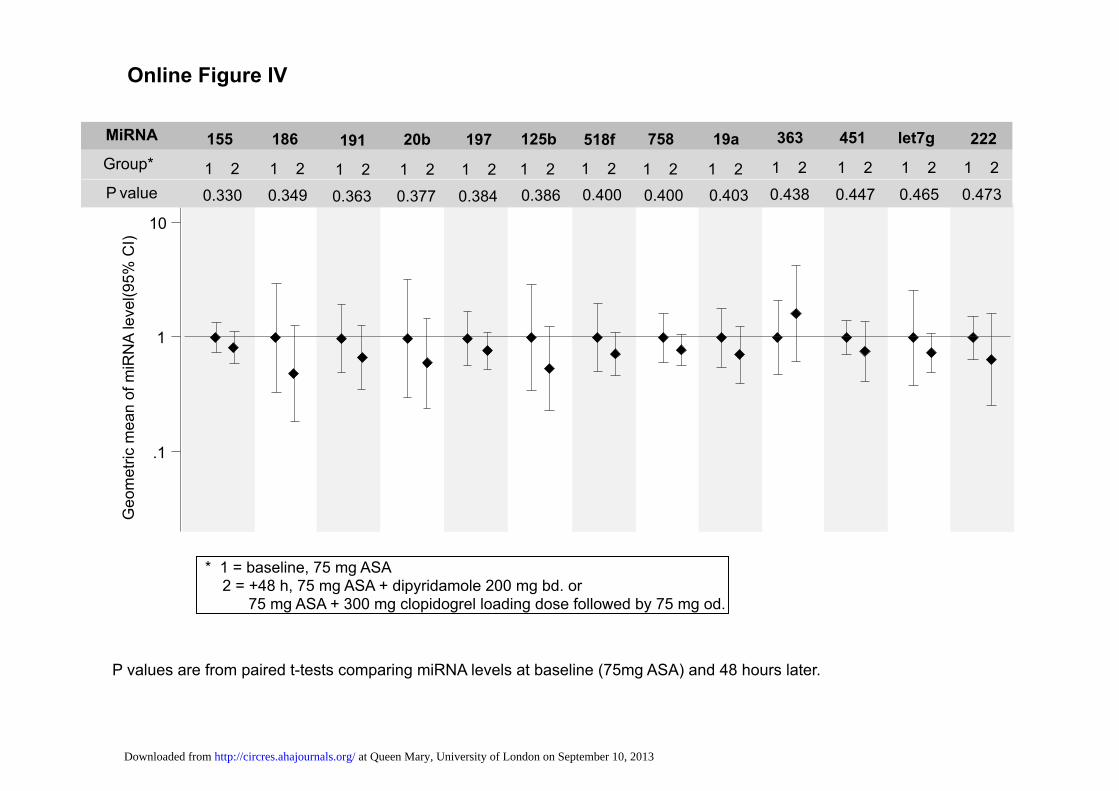
Online Figure IV. MiRNA response to anti-platelet therapy in patients. Patients with symptomatic carotid atherosclerosis (n=12) were on 75mg aspirin (ASA) at baseline and samples were taken 48h after initiation of dual anti-platelet therapy with either dipyridamole or clopidogrel. MiRNAs were assessed in PPP using custom designed miRNA qPCR plates based on Exiqon's miRCURY LNA™ Universal RT miRNA PCR system. *Groups depicted in red differ significantly in their average ΔCt value from the baseline group (tested by paired t-tests, critical P value 0.05).
at Queen Mary, University of London on September 10, 2013http://circres.ahajournals.org/Downloaded from

Online&Table&I:&Clinical&Characteristics&of&the&Diabetic&Cohort&(n=19)
Male,&n(%) 9&(47%)
EthnicityAsian,&n(%) 4&(21%)
Black,&n(%) 6&(32%)
White,&n(%) 9&(47%)Age,&years 68.5±2.5
Age&at&diagnosis,&years 46±2.4
BMI,&kg/m2 31.4±1.7
Systolic&BP,&mmHg 136.0±3.2
Diastolic&BP,&mmHg 75.5±2.8
HbA1c,&%&total&hemoglobin 7.9±0.4%
HDL,&mmol/L 1.2±0.1
LDL,&mmol/L 2.0±0.2
Triglycerides,&mmol/L 1.2±0.1
Total&cholesterol/HDL&ratio 3.2±0.3
eGFR,&mLs/min/1.73m2 69.7±3.3
Hb,&g/dL 12.3±0.4
Values&are&given&as&percentage&or&means±SE
at Queen Mary, University of London on September 10, 2013http://circres.ahajournals.org/Downloaded from

Online&Table&II:&Clinical&Characteristics&of&the&Patient&Cohort&(n=33)Male,&n(%) 27&(81.8%)Age,&years 72.1±1.9Dual&Antiplatelet
ASA&+&Dipyridamole,&n(%) 18&(54.5%)ASA&+Clopidogrel,&n(%) 15&(45.5%)
Embolic&Signal&(ES)&at&baseline,&n(%) 23&(69.7%)ES&Change&from&Baseline,&n 4.3±2.1ES&Change&from&Baseline,&% 43.5%±24.4%Time&from&Recent&Symptoms,&days& 7.9±1.0Type&of&Event
TIA/TMB,&n(%) 10&(30.3%)Stroke,&n(%) 23&(69.7%)
No.&Events&in&the&Last&Month 1.4±0.2Grade&of&Stenosis,&%&stenosis 73.7±2.5%Smoker
Never,&n(%) 6&(18.2%)ExWSmoker,&n(%) 18&(54.5%)
Current&Smoker,&n(%) 9&(27.3%)Diabetes,&n(%) 6&(18.2%)Cholesterol
None&n(%) 11&(33.3%)Untreated,&n(%) 6&(18.2%)
Treated,&n(%) 16&(48.5%)Hypertension
None&n(%) 4&(12.1%)Untreated,&n(%) 4&(12.1%)
Treated,&n(%) 25&(75.8%)Previous&MI,&n(%) 3&(9.1%)Previous&Vascular&Disease 4&(12.1%)Previous&Stroke 6&(18.2%)Family&History&of&Stroke 8&(24.2%)AntiWplatelet&at&Event
None&n(%) 20&(60.6%)Asprin,&n(%) 10&(30.3%)
Asprin&+&Dipyridamole,&n(%) 3&(9.1%)Proton&Pump&Inhibitor
None&n(%) 29&(87.9%)Omeprazole,&n(%) 1&(3.0%)Lansoprazole,&n(%) 3&(9.1%)
Event&During&30&Day&FollowWUp 1&(8.3%)None&n(%) 30&(87.9%)TMB,&n(%) 1&(3.0%)TIA,&n(%) 2&(6.1%)
ADP&Difference&in&Peak&Aggregation,&% 9.4±3.1%Collagen&Difference&in&Peak&Aggregation,&% 2.2±3.4%
Values&are&given&as&percentage&or&means±SE
TMB,&transient&monocular&blindness;&TIA,&transient&ischemic&attack.
at Queen Mary, University of London on September 10, 2013http://circres.ahajournals.org/Downloaded from

Online&Table&III:&Lay.out&of&custom.designed&qPCR&plates
Well Detector Task
A1 hsa-let-7e-002406 TargetA2 hsa-miR-16-000391 TargetA3 hsa-miR-17-002308 TargetA4 hsa-miR-19b-000396 TargetA5 hsa-miR-20a-000580 TargetA6 hsa-miR-20b-001014 TargetA7 hsa-miR-24-000402 TargetA8 hsa-miR-28-3p-002446 TargetA9 hsa-miR-30b-000602 TargetA10 hsa-miR-30c-000419 TargetA11 hsa-miR-92a-000431 TargetA12 hsa-miR-93-5p-001090 TargetA13 hsa-miR-106a-002169 TargetA14 hsa-miR-125a-5p-002198 TargetA15 hsa-miR-126-002228 TargetA16 hsa-miR-139-5p-002289 TargetA17 hsa-miR-146a-000468 TargetA18 hsa-miR-146b-001097 TargetA19 hsa-miR-150-000473 TargetA20 hsa-miR-186-002285 TargetA21 hsa-miR-191-002299 TargetA22 hsa-miR-197-000497 TargetA23 hsa-miR-222-002276 TargetA24 hsa-miR-223-002295 TargetB1 hsa-miR-320-002277 TargetB2 hsa-miR-331-000545 TargetB3 hsa-miR-342-3p-002260 TargetB4 hsa-let-7b-002619 TargetB5 hsa-miR-451a-001141 TargetB6 hsa-miR-454-002323 TargetB7 hsa-miR-483-5p-002338 TargetB8 hsa-miR-484-001821 TargetB9 hsa-miR-486-001278 TargetB10 U6 snRNA-001973 ControlB11 ath-miR159a-000338 ControlB12 H2O ControlB13 cel-miR-39-000200 ControlB14 hsa-let-7g-002282 TargetB15 hsa-miR-19a-000395 TargetB16 hsa-miR-21-000397 TargetB17 hsa-miR-25-000403 TargetB18 hsa-miR-26a-000405 TargetB19 hsa-miR-26b-000407 TargetB20 hsa-miR-27a-000408 TargetB21 hsa-miR-27b-000409 TargetB22 hsa-miR-28-000411 TargetB23 hsa-miR-29a-002112 TargetB24 hsa-miR-29b-000413 TargetC1 hsa-miR-103-000439 TargetC2 hsa-miR-107-000443 TargetC3 hsa-miR-122-002245 TargetC4 hsa-miR-125b-000449 TargetC5 hsa-miR-127-000452 TargetC6 hsa-miR-130a-000454 TargetC7 hsa-miR-139-3p-002313 TargetC8 hsa-miR-140-5p-001187 TargetC9 hsa-miR-142-3p-000464 TargetC10 hsa-miR-145-002278 TargetC11 hsa-miR-152-000475 TargetC12 hsa-miR-185-002271 TargetC13 hsa-miR-192-000491 TargetC14 hsa-miR-193b-002367 TargetC15 hsa-miR-194-000493 TargetC16 hsa-miR-195-000494 TargetC17 hsa-miR-199a-3p-002304 TargetC18 hsa-miR-200b-002251 TargetC19 hsa-miR-221-000524 TargetC20 hsa-miR-18a-002422 TargetC21 hsa-miR-503-001048 TargetC22 hsa-miR-328-000543 TargetC23 hsa-miR-335-000546 TargetC24 hsa-miR-339-3p-002184 TargetD1 hsa-miR-155-002623 TargetD2 hsa-miR-340-002258 TargetD3 hsa-miR-363-001271 TargetD4 hsa-miR-374-000563 TargetD5 hsa-miR-381-000571 TargetD6 hsa-miR-423-5p-002340 TargetD7 hsa-miR-518b-001156 TargetD8 hsa-miR-518f-002388 TargetD9 hsa-miR-532-3p-002355 TargetD10 hsa-miR-574-3p-002349 TargetD11 hsa-miR-590-5p-001984 TargetD12 hsa-miR-618-001593 TargetD13 hsa-miR-628-5p-002433 TargetD14 hsa-miR-660-001515 TargetD15 hsa-miR-744-002324 TargetD16 hsa-miR-758-001990 TargetD17 hsa-miR-210-000512 TargetD18 hsa-miR-214-002306 TargetD19 hsa-miR-885-5p-002296 TargetD20 hsa-miR-10a-000387 TargetD21 hsa-miR-15a-000389 TargetD22 hsa-miR-130b-000456 TargetD23 hsa-miR-375-000564 TargetD24 hsa-miR-202-002363 Target
Substitutes for miRNAs without LNA primers (red font):hsa-miR-126*hsa-miR-376chsa-miR-195*
at Queen Mary, University of London on September 10, 2013http://circres.ahajournals.org/Downloaded from

Online Figure I
at Queen Mary, University of London on September 10, 2013http://circres.ahajournals.org/Downloaded from

0
5
10
15
20
25M
ean
(95%
CI)
No drugPras
Pras+ASA75
Pras+ASA300
Clotting TXB2
0
.1
.2
.3
.4
Mea
n (9
5% C
I)
No drugPras
Pras+ASA75
Pras+ASA300
Urinary TX-M
.05
.1
.15
.2
.25
Mea
n (9
5% C
I)
No drugPras
Pras+ASA75
Pras+ASA300
Urinary PGI-M
0
100
200
300
Mea
n (9
5% C
I)
No drugPras
Pras+ASA75
Pras+ASA300
VerifyNow PRU
300
400
500
600
700
Mea
n (9
5% C
I)
No drugPras
Pras+ASA75
Pras+ASA300
VerifyNow ARU
0
20
40
60
80M
ean
(95%
CI)
No drugPras
Pras+ASA75
Pras+ASA300
Aggregation (arach. acid)
0
50
100
150
Mea
n (9
5% C
I)
No drugPras
Pras+ASA75
Pras+ASA300
Aggregation (ADP)
0
50
100
150
200
Mea
n (9
5% C
I)
No drugPras
Pras+ASA75
Pras+ASA300
Aggregation (collagen)
0
50
100
150
200
250
Mea
n (9
5% C
I)
No drugPras
Pras+ASA75
Pras+ASA300
Aggregation (adrenaline)
40
60
80
100
120
Mea
n (9
5% C
I)
No drugPras
Pras+ASA75
Pras+ASA300
Aggregation (TRAP-6)
0
50
100
150
200M
ean
(95%
CI)
No drugPras
Pras+ASA75
Pras+ASA300
Aggregation (U46619)
Online Figure II
Pras: 10mg prasugrel Pras+ASS75: 10mg prasugrel + 75mg ASA Pras+ASS300: 10mg prasugrel + 300mg ASA
(ng/ml)( (ng/mg(crea-nine)( (ng/mg(crea-nine)( (P2Y12(Reac-on(Units)(
(Aspirin(Reac-on(Units)( (AUC)( (AUC)(
(AUC)((AUC)( (AUC)(
(AUC)(
at Queen Mary, University of London on September 10, 2013http://circres.ahajournals.org/Downloaded from

P values are from linear mixed models with random intercepts comparing miRNA levels over the four time points.
Online Figure III G
eom
etric
mea
n of
mIR
NA
leve
l (95
% C
I)
* 1 = baseline, no therapy 2 = +1 week, 10mg prasugrel 3 = +1 week, 10mg prasugrel + 75mg ASA 4 = +1 week, 10mg prasugrel + 300mg ASA
MiRNA 191 30b 185 484 186 16 92a 19a 223 24 126 150 328 106a
Ptrend 0.006 0.211 0.011 0.403 0.311 0.229 0.685 <0.001 <0.001 0.013 0.347 0.816 0.309 0.001
.001
.01
.1
1
10
100
Group* 1 2 3 4 1 2 3 4 1 2 3 4 1 2 3 4 1 2 3 4 1 2 3 4 1 2 3 4 1 2 3 4 1 2 3 4 1 2 3 4 1 2 3 4 1 2 3 4 1 2 3 4 1 2 3 4
at Queen Mary, University of London on September 10, 2013http://circres.ahajournals.org/Downloaded from

P values are from linear mixed models with random intercepts comparing miRNA levels over the four time points.
Geo
met
ric m
ean
of m
IRN
A le
vel (
95%
CI)
Group*
MiRNA 19a-3p 320 19b U6-snRNA 221 mmu-93 146b 210 518f 28-3p 342-3p 335 483-5p
1 2 3 4 1 2 3 4 1 2 3 4 1 2 3 4 1 2 3 4 1 2 3 4 1 2 3 4 1 2 3 4 1 2 3 4 1 2 3 4 1 2 3 4 1 2 3 4 1 2 3 4
486
1 2 3 4
.001
.01
.1
1
10
100 * 1 = baseline, no therapy 2 = +1 week, 10mg prasugrel 3 = +1 week, 10mg prasugrel + 75mg ASA 4 = +1 week, 10mg prasugrel + 300mg ASA
Ptrend 0.122 0.622 0.094 0.811 0.656 0.727 0.091 0.163 0.032 0.159 0.874 0.002 0.589 0.759
Online Figure III
at Queen Mary, University of London on September 10, 2013http://circres.ahajournals.org/Downloaded from

P values are from linear mixed models with random intercepts comparing miRNA levels over the four time points.
Geo
met
ric m
ean
of m
IRN
A le
vel (
95%
CI)
Group*
MiRNA 17 744 let7g 139-3p 574-3p 331 30c 20b 10a 145 146a 130a 18a
1 2 3 4 1 2 3 4 1 2 3 4 1 2 3 4 1 2 3 4 1 2 3 4 1 2 3 4 1 2 3 4 1 2 3 4 1 2 3 4 1 2 3 4 1 2 3 4 1 2 3 4
195
1 2 3 4
.001
.01
.1
1
10
100 * 1 = baseline, no therapy 2 = +1 week, 10mg prasugrel 3 = +1 week, 10mg prasugrel + 75mg ASA 4 = +1 week, 10mg prasugrel + 300mg ASA
Ptrend 0.002 0.001 0.402 0.975 0.871 0.101 0.923 0.013 0.922 0.197 0.247 0.012 0.042 0.024
Online Figure III
at Queen Mary, University of London on September 10, 2013http://circres.ahajournals.org/Downloaded from

P values are from linear mixed models with random intercepts comparing miRNA levels over the four time points.
Geo
met
ric m
ean
of m
IRN
A le
vel (
95%
CI)
Group*
MiRNA 660 21 193b 26a 142-3p let7b 27a 197 20a mmu451 192 29a
1 2 3 4 1 2 3 4 1 2 3 4 1 2 3 4 1 2 3 4 1 2 3 4 1 2 3 4 1 2 3 4 1 2 3 4 1 2 3 4 1 2 3 4 1 2 3 4
.001
.01
.1
1
10
100 * 1 = baseline, no therapy 2 = +1 week, 10mg prasugrel 3 = +1 week, 10mg prasugrel + 75mg ASA 4 = +1 week, 10mg prasugrel + 300mg ASA
Ptrend 0.092 0.015 0.852 0.798 0.232 0.731 0.554 0.497 0.096 0.587 0.440 0.946
Online Figure III
at Queen Mary, University of London on September 10, 2013http://circres.ahajournals.org/Downloaded from

Online Figure IV
* 1 = baseline, 75 mg ASA 2 = +48 h, 75 mg ASA + dipyridamole 200 mg bd. or 75 mg ASA + 300 mg clopidogrel loading dose followed by 75 mg od.
P values are from paired t-tests comparing miRNA levels at baseline (75mg ASA) and 48 hours later.
.1
1
10
Geo
met
ric m
ean
of m
iRN
A le
vel(9
5% C
I)
Group* 1 2 1 2 1 2 1 2 1 2 1 2 1 2 1 2 1 2
P value
MiRNA
<0.001 0.004 0.004 0.008 0.020 0.021 0.022 0.025 0.029 0.030
210 214 152 106a 340 142-3p 30c 146a 28-5p 26a
1 2 1 2
126
0.004 1 2
24
0.008 1 2
223
<0.001
at Queen Mary, University of London on September 10, 2013http://circres.ahajournals.org/Downloaded from

P values are from paired t-tests comparing miRNA levels at baseline (75mg ASA) and 48 hours later.
.1
1
10
Group*
P value
MiRNA
1 2 1 2 1 2 1 2 1 2 1 2 1 2 1 2 1 2 1 2
103 199a-3p 93 885-5p 375 454 130b 107 335 17
0.045 0.049 0.051 0.053 0.064 0.072 0.079 0.086 0.097 0.109 0.032 0.038 0.042
590-5p 574-3p 19b
1 2 1 2 1 2
Geo
met
ric m
ean
of m
iRN
A le
vel(9
5% C
I)
Online Figure IV
* 1 = baseline, 75 mg ASA 2 = +48 h, 75 mg ASA + dipyridamole 200 mg bd. or 75 mg ASA + 300 mg clopidogrel loading dose followed by 75 mg od.
at Queen Mary, University of London on September 10, 2013http://circres.ahajournals.org/Downloaded from

P values are from paired t-tests comparing miRNA levels at baseline (75mg ASA) and 48 hours later.
.1
1
10
Group*
P value
MiRNA
1 2 1 2 1 2 1 2 1 2
27b 140-5p 28-3p 20a 200b
0.130 0.133 0.144 0.151 0.156
1 2 1 2 1 2
27a 26b 376c
0.164 0.169 0.179 1 2
150
0.116
1 2
U6
0.157
1 2 1 2 1 2
16 328 15a
0.112 0.121 0.121
Geo
met
ric m
ean
of m
iRN
A le
vel(9
5% C
I)
Online Figure IV
* 1 = baseline, 75 mg ASA 2 = +48 h, 75 mg ASA + dipyridamole 200 mg bd. or 75 mg ASA + 300 mg clopidogrel loading dose followed by 75 mg od.
at Queen Mary, University of London on September 10, 2013http://circres.ahajournals.org/Downloaded from

P values are from paired t-tests comparing miRNA levels at baseline (75mg ASA) and 48 hours later.
.1
1
10
Group*
P value
MiRNA
1 2 1 2 1 2 1 2 1 2 1 2 1 2
423-5p 374a 628-5p 29b 18a 221 146b-5p
0.245 0.251 0.266 0.271 0.304 0.321 0.325 1 2 1 2 1 2 1 2 1 2
30b 320a 143 192 92a
0.190 0.196 0.203 0.208 0.241 1 2
21
0.183
Geo
met
ric m
ean
of m
iRN
A le
vel(9
5% C
I)
Online Figure IV
* 1 = baseline, 75 mg ASA 2 = +48 h, 75 mg ASA + dipyridamole 200 mg bd. or 75 mg ASA + 300 mg clopidogrel loading dose followed by 75 mg od.
at Queen Mary, University of London on September 10, 2013http://circres.ahajournals.org/Downloaded from
P values are from paired t-tests comparing miRNA levels at baseline (75mg ASA) and 48 hours later.
.1
1
10
Group*
P value
MiRNA
1 2 1 2 1 2 1 2
363 451 let7g 222
0.438 0.447 0.465 0.473
1 2 1 2 1 2 1 2 1 2 1 2
155 186 125b 518f 758 19a
0.330 0.349 0.386 0.400 0.400 0.403 1 2 1 2 1 2
191 197 20b
0.363 0.384 0.377
Geo
met
ric m
ean
of m
iRN
A le
vel(9
5% C
I)
Online Figure IV
* 1 = baseline, 75 mg ASA 2 = +48 h, 75 mg ASA + dipyridamole 200 mg bd. or 75 mg ASA + 300 mg clopidogrel loading dose followed by 75 mg od.
at Queen Mary, University of London on September 10, 2013http://circres.ahajournals.org/Downloaded from

P values are from paired t-tests comparing miRNA levels at baseline (75mg ASA) and 48 hours later.
.1
1
10
Group*
P value
MiRNA
1 2 1 2 1 2 1 2
744 194 486-5p 193b
0.654 0.673 0.702 0.740
1 2 1 2 1 2 1 2 1 2 1 2 1 2 1 2 1 2
381 660 29a 127-3p 195 25 331-3p 342-3p 10a
0.479 0.498 0.513 0.535 0.577 0.578 0.587 0.641 0.644
Geo
met
ric m
ean
of m
iRN
A le
vel(9
5% C
I)
Online Figure IV
* 1 = baseline, 75 mg ASA 2 = +48 h, 75 mg ASA + dipyridamole 200 mg bd. or 75 mg ASA + 300 mg clopidogrel loading dose followed by 75 mg od.
at Queen Mary, University of London on September 10, 2013http://circres.ahajournals.org/Downloaded from

P values are from paired t-tests comparing miRNA levels at baseline (75mg ASA) and 48 hours later.
P value
.1
1
10
Group*
MiRNA
1 2 1 2 1 2
484 122 18b
0.893 0.914 0.982
1 2 1 2 1 2 1 2 1 2 1 2 1 2 1 2 1 2
503 let7e 139-5p 532-3p let7b 185 130a 125a-5p 202
0.759 0.760 0.778 0.829 0.836 0.853 0.862 0.882 0.890
Geo
met
ric m
ean
of m
iRN
A le
vel(9
5% C
I)
Online Figure IV
* 1 = baseline, 75 mg ASA 2 = +48 h, 75 mg ASA + dipyridamole 200 mg bd. or 75 mg ASA + 300 mg clopidogrel loading dose followed by 75 mg od.
at Queen Mary, University of London on September 10, 2013http://circres.ahajournals.org/Downloaded from