ciner resources lp...q4 2014 q1 2015 q2 2015 q3 2015 q4 2015 q1 2016 q2 2016 q3 2016 q4 2016 q1 2017...
TRANSCRIPT
Ciner Resources LPInvestor Presentation
November 2017
Safe Harbor Statement
This presentation may contain “forward-looking statements.” All statements that address
operating performance, events or developments that we expect or anticipate will occur in
the future are forward-looking statements. Caution should be taken not to place undue
reliance on any such forward-looking statements because actual results may differ
materially from the results suggested by these statements. We undertake no obligation
to publicly update or revise any forward-looking statements, whether as a result of new
information, future events or otherwise. In addition, forward-looking statements are
subject to certain risks and uncertainties that could cause actual results to differ
materially from our historical experience and present expectations or projections. These
risks and uncertainties include, but are not limited to, those described in the Risk Factors
section of CINR’s 10-K dated March 6, 2017, and those described from time-to-time in
our periodic and other reports filed with the Securities and Exchange Commission.
2
Ciner Resources LP - At A Glance
▪ Fixed-distribution Master Limited Partnership
– IPO in September 2013
▪ One of the largest and lowest cost producers of natural soda ash in the
world
– Soda ash, an essential raw material used in the production of glass,
chemicals and detergents, is a well structured global industry with
steadily growing demand of ~3% annually, or ~ 1.8M tons per year
▪ Over 2.75 million short tons annual soda ash production
▪ ~475 employees
▪ 66+ years of mining reserves
▪ 2016 Revenue: $475.2 million
▪ 2016 Adjusted EBITDA: $116.5 million
3
▪ Most efficient soda ash producer in North America
▪ Amongst lowest cost producers in the world
▪ Uniquely configured asset footprint
▪ Strong safety and environmental records
▪ Excellent workforce relationship; non-union
▪ Stable end markets and customer relationships
▪ Experienced management and operational team
Ciner Resources - Competitive Advantages
4
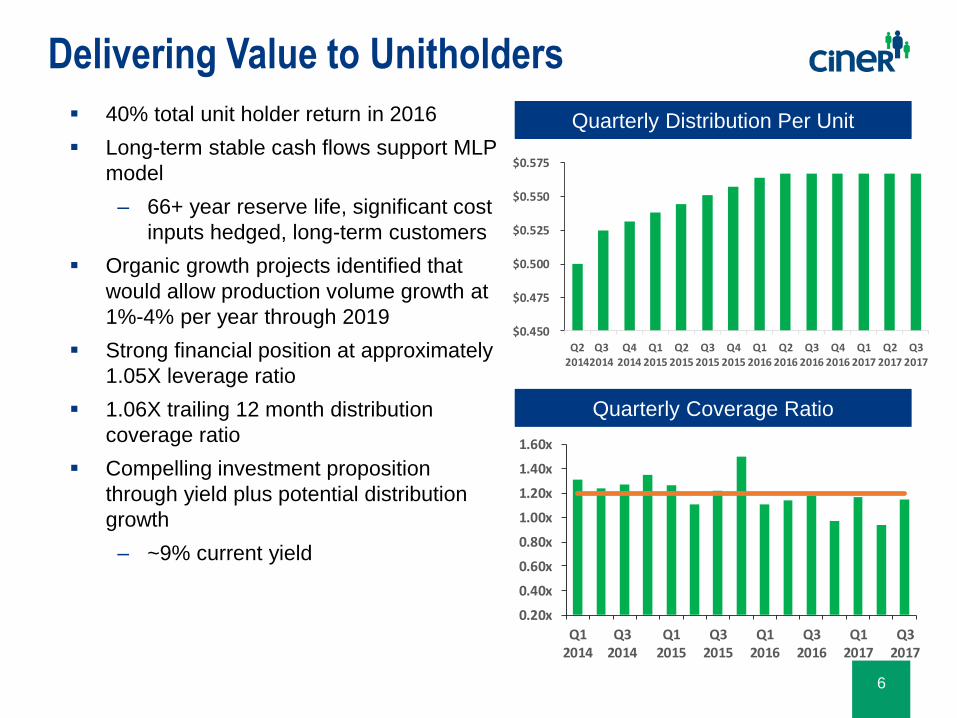
Delivering Value to Unitholders
▪ 40% total unit holder return in 2016
▪ Long-term stable cash flows support MLP
model
– 66+ year reserve life, significant cost
inputs hedged, long-term customers
▪ Organic growth projects identified that
would allow production volume growth at
1%-4% per year through 2019
▪ Strong financial position at approximately
1.05X leverage ratio
▪ 1.06X trailing 12 month distribution
coverage ratio
▪ Compelling investment proposition
through yield plus potential distribution
growth
– ~9% current yield
6
Quarterly Distribution Per Unit
Quarterly Coverage Ratio
0.20x
0.40x
0.60x
0.80x
1.00x
1.20x
1.40x
1.60x
Q12014
Q32014
Q12015
Q32015
Q12016
Q32016
Q12017
Q32017
$0.450
$0.475
$0.500
$0.525
$0.550
$0.575
Q22014
Q32014
Q42014
Q12015
Q22015
Q32015
Q42015
Q12016
Q22016
Q32016
Q42016
Q12017
Q22017
Q32017
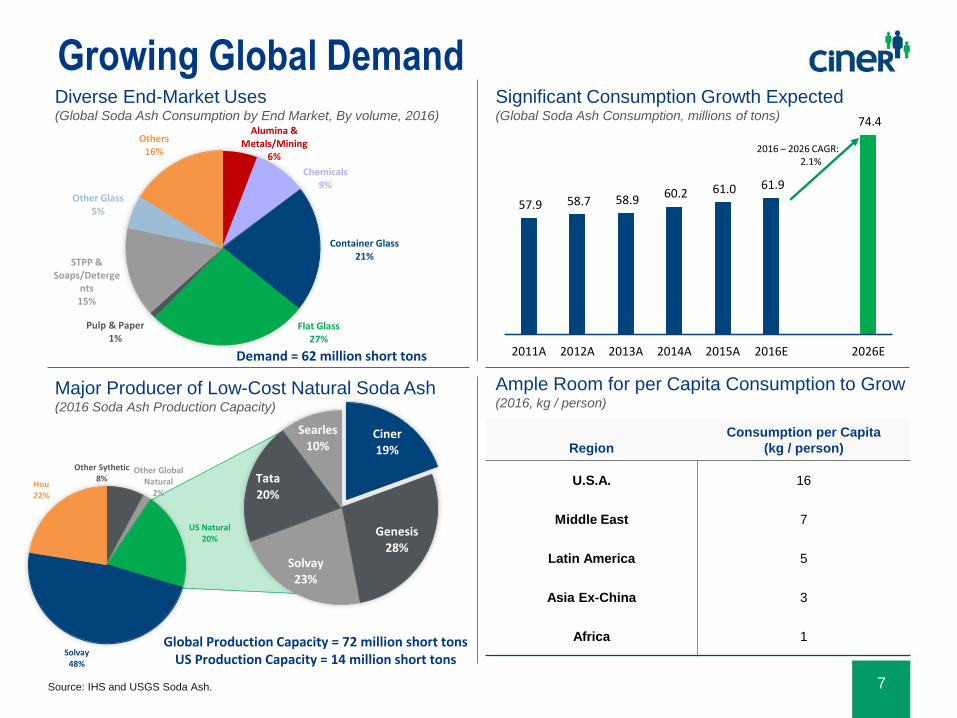
2016 – 2026 CAGR: 2.1%
57.9 58.7 58.9 60.2 61.0 61.9
74.4
2011A 2012A 2013A 2014A 2015A 2016E 2026E
Diverse End-Market Uses (Global Soda Ash Consumption by End Market, By volume, 2016)
Significant Consumption Growth Expected (Global Soda Ash Consumption, millions of tons)
Ample Room for per Capita Consumption to Grow(2016, kg / person)
Region
Consumption per Capita
(kg / person)
U.S.A. 16
Middle East 7
Latin America 5
Asia Ex-China 3
Africa 1
Source: IHS and USGS Soda Ash.
Major Producer of Low-Cost Natural Soda Ash(2016 Soda Ash Production Capacity)
7
Growing Global Demand
Demand = 62 million short tons
Alumina & Metals/Mining
6%
Chemicals9%
Container Glass21%
Flat Glass27%
Pulp & Paper1%
STPP & Soaps/Deterge
nts15%
Other Glass5%
Others16%
Other Sythetic8%
Other Global Natural
2%
US Natural20%
Solvay48%
Hou22%
Ciner19%
Genesis28%
Solvay23%
Tata20%
Searles10%
Global Production Capacity = 72 million short tonsUS Production Capacity = 14 million short tons
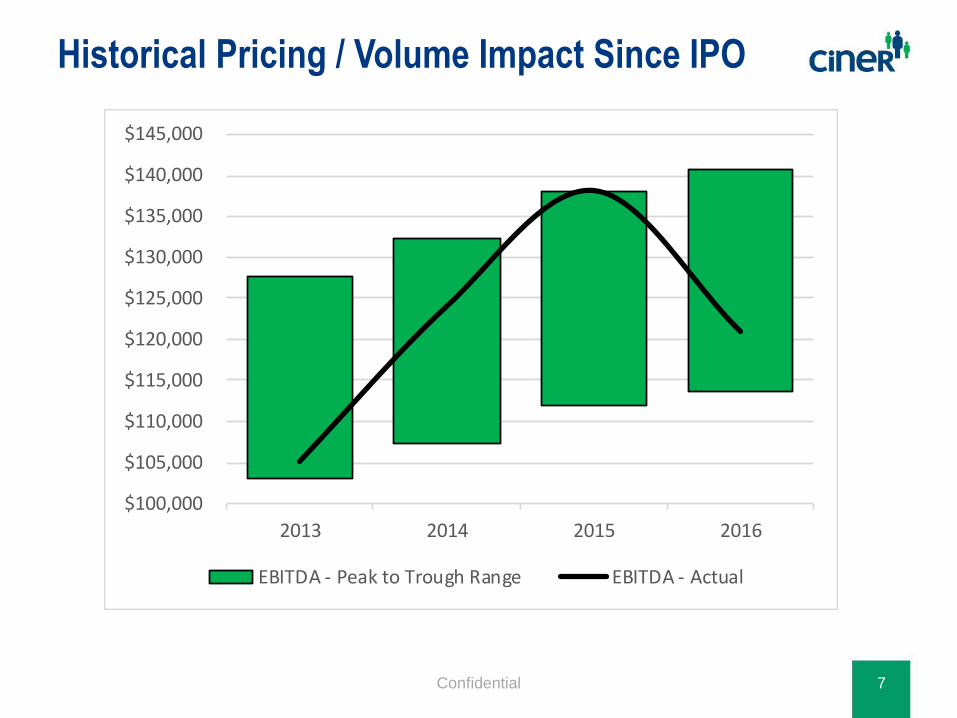
Historical Pricing / Volume Impact Since IPO
Confidential 7
$100,000
$105,000
$110,000
$115,000
$120,000
$125,000
$130,000
$135,000
$140,000
$145,000
2013 2014 2015 2016
EBITDA - Peak to Trough Range EBITDA - Actual
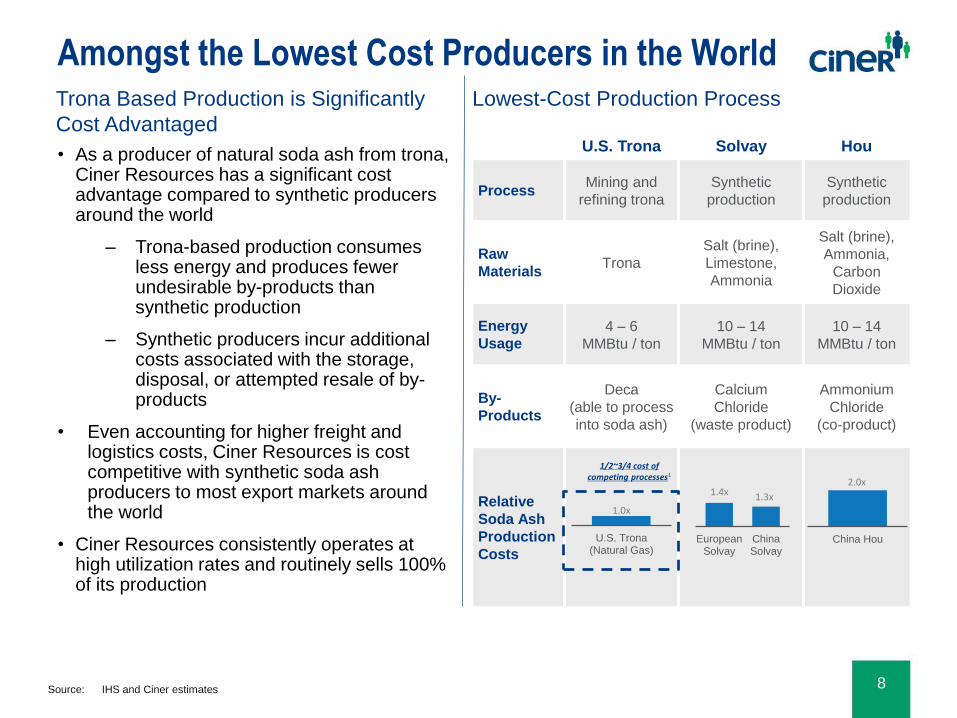
U.S. Trona Solvay Hou
ProcessMining and
refining trona
Synthetic
production
Synthetic
production
Raw
MaterialsTrona
Salt (brine),
Limestone,
Ammonia
Salt (brine),
Ammonia,
Carbon
Dioxide
Energy
Usage
4 – 6
MMBtu / ton
10 – 14
MMBtu / ton
10 – 14
MMBtu / ton
By-
Products
Deca
(able to process
into soda ash)
Calcium
Chloride
(waste product)
Ammonium
Chloride
(co-product)
Relative
Soda Ash
Production
Costs
U.S. Trona(Natural Gas)
EuropeanSolvay
ChinaSolvay
China Hou
1.0x
1.4x 1.3x
2.0x
1/2~3/4 cost ofcompeting processes1
Source: IHS and Ciner estimates
Lowest-Cost Production Process
• As a producer of natural soda ash from trona, Ciner Resources has a significant cost advantage compared to synthetic producers around the world
– Trona-based production consumes less energy and produces fewer undesirable by-products than synthetic production
– Synthetic producers incur additional costs associated with the storage, disposal, or attempted resale of by-products
• Even accounting for higher freight and logistics costs, Ciner Resources is cost competitive with synthetic soda ash producers to most export markets around the world
• Ciner Resources consistently operates at high utilization rates and routinely sells 100% of its production
Trona Based Production is Significantly
Cost Advantaged
8
Amongst the Lowest Cost Producers in the World
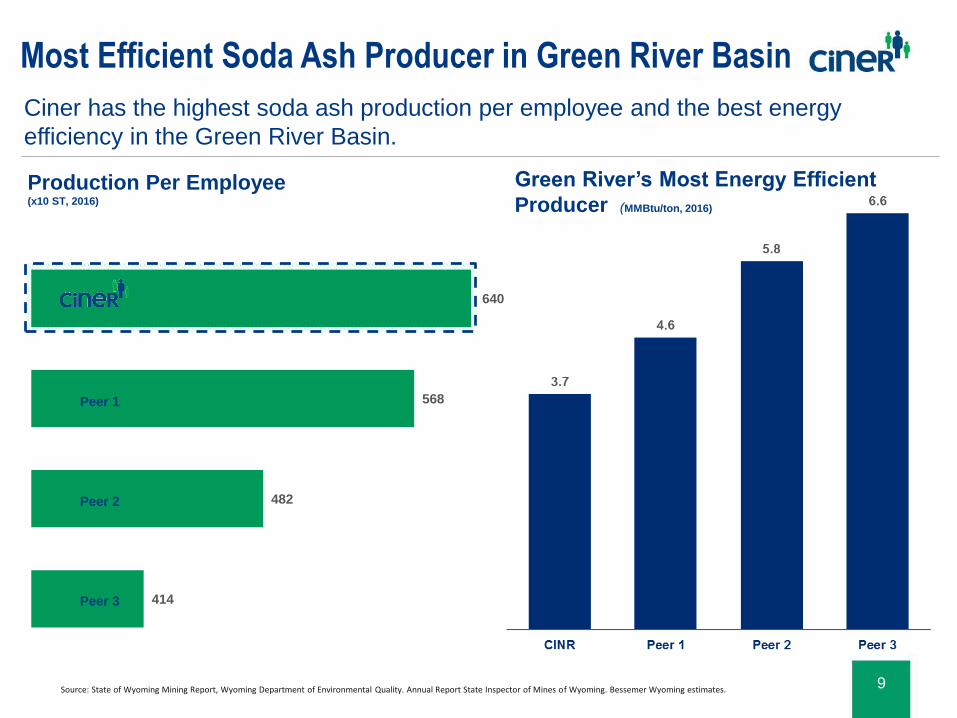
414
482
568
640
Production Per Employee(x10 ST, 2016)
Peer 1
Peer 3
Peer 2
Ciner has the highest soda ash production per employee and the best energy
efficiency in the Green River Basin.
Most Efficient Soda Ash Producer in Green River Basin
9
Green River’s Most Energy Efficient
Producer (MMBtu/ton, 2016)
Source: State of Wyoming Mining Report, Wyoming Department of Environmental Quality. Annual Report State Inspector of Mines of Wyoming. Bessemer Wyoming estimates.
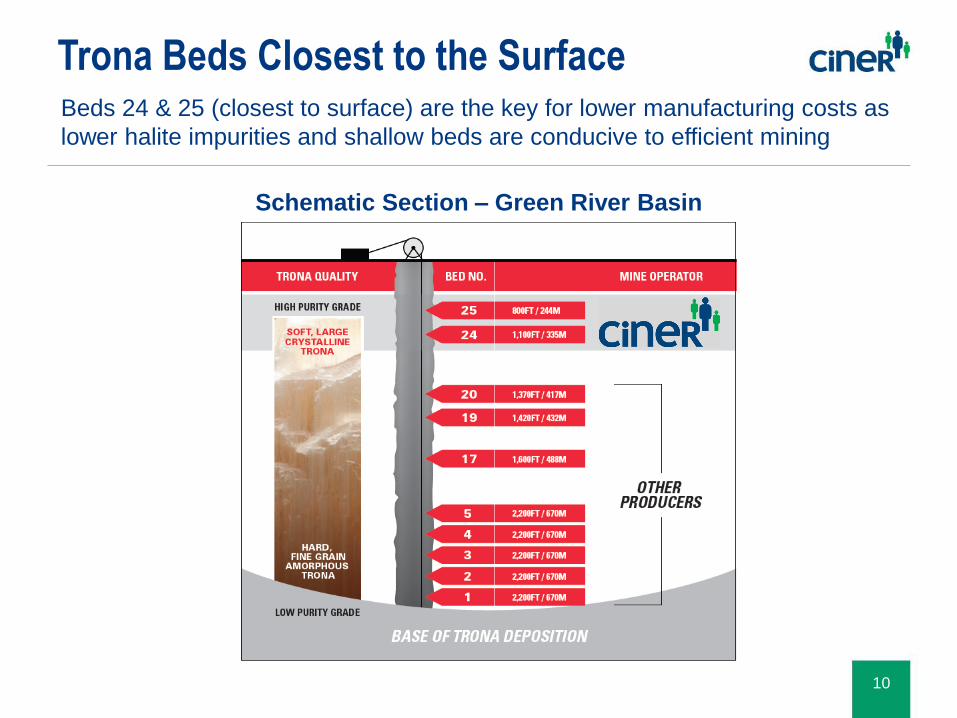
Beds 24 & 25 (closest to surface) are the key for lower manufacturing costs as
lower halite impurities and shallow beds are conducive to efficient mining
Schematic Section – Green River Basin
10
Trona Beds Closest to the Surface
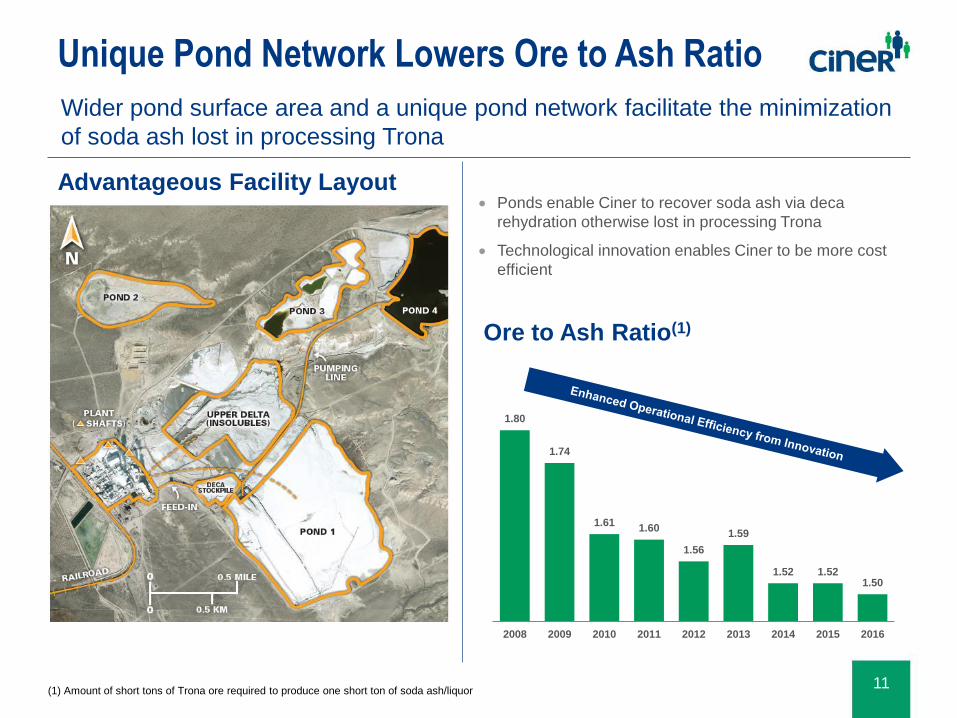
Advantageous Facility Layout• Ponds enable Ciner to recover soda ash via deca
rehydration otherwise lost in processing Trona
• Technological innovation enables Ciner to be more cost
efficient
Ore to Ash Ratio(1)
1.80
1.74
1.611.60
1.56
1.59
1.52 1.521.50
2008 2009 2010 2011 2012 2013 2014 2015 2016
(1) Amount of short tons of Trona ore required to produce one short ton of soda ash/liquor
Wider pond surface area and a unique pond network facilitate the minimization
of soda ash lost in processing Trona
11
Unique Pond Network Lowers Ore to Ash Ratio
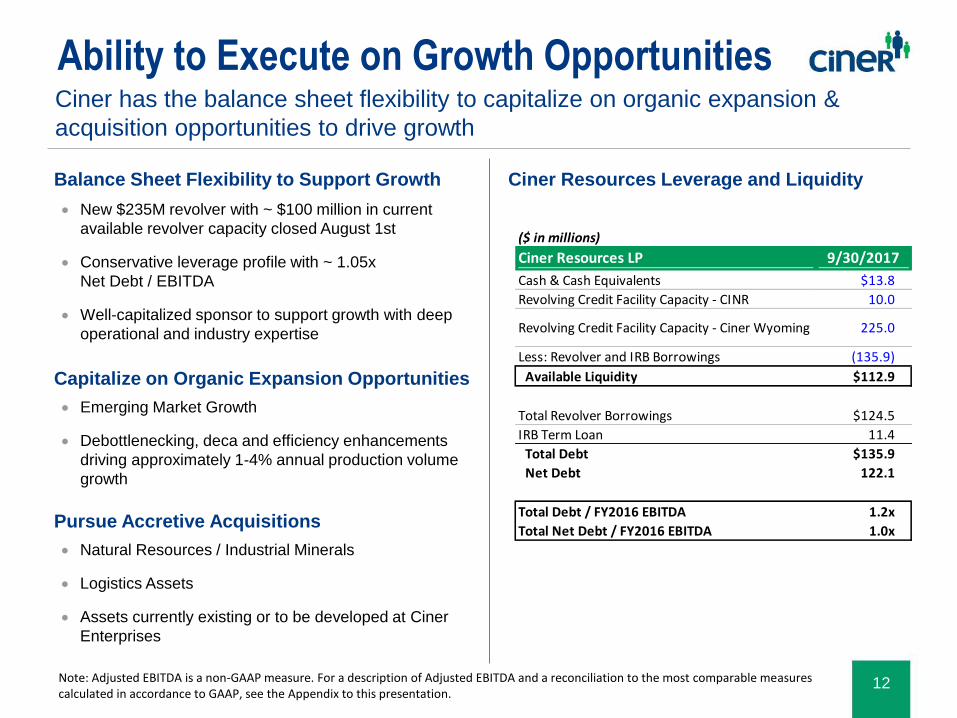
Pursue Accretive Acquisitions
• Natural Resources / Industrial Minerals
• Logistics Assets
• Assets currently existing or to be developed at Ciner
Enterprises
Capitalize on Organic Expansion Opportunities
• Emerging Market Growth
• Debottlenecking, deca and efficiency enhancements
driving approximately 1-4% annual production volume
growth
Ciner has the balance sheet flexibility to capitalize on organic expansion &
acquisition opportunities to drive growth
12
• New $235M revolver with ~ $100 million in current
available revolver capacity closed August 1st
• Conservative leverage profile with ~ 1.05x
Net Debt / EBITDA
• Well-capitalized sponsor to support growth with deep
operational and industry expertise
Balance Sheet Flexibility to Support Growth Ciner Resources Leverage and Liquidity
Note: Adjusted EBITDA is a non-GAAP measure. For a description of Adjusted EBITDA and a reconciliation to the most comparable measures calculated in accordance to GAAP, see the Appendix to this presentation.
Ability to Execute on Growth Opportunities
($ in millions)
Ciner Resources LP 9/30/2017
Cash & Cash Equivalents $13.8
Revolving Credit Facility Capacity - CINR 10.0
Revolving Credit Facility Capacity - Ciner Wyoming 225.0
Less: Revolver and IRB Borrowings (135.9)
Available Liquidity $112.9
Total Revolver Borrowings $124.5
IRB Term Loan 11.4
Total Debt $135.9
Net Debt 122.1
Total Debt / FY2016 EBITDA 1.2x
Total Net Debt / FY2016 EBITDA 1.0x
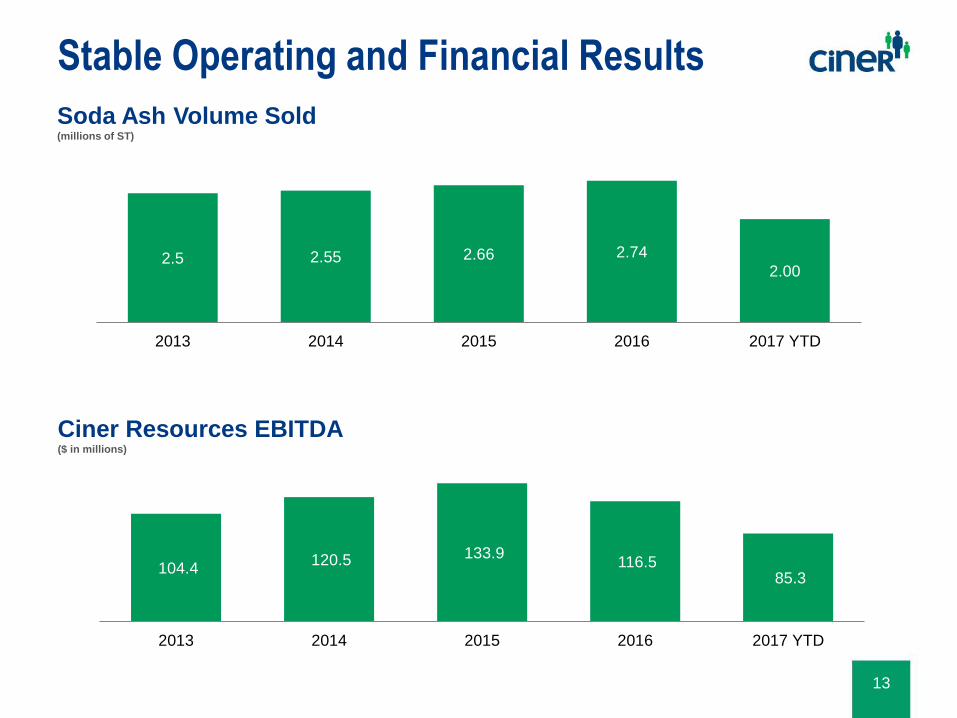
Soda Ash Volume Sold (millions of ST)
Ciner Resources EBITDA($ in millions)
2.5 2.55 2.66 2.74
2.00
2013 2014 2015 2016 2017 YTD
13
Stable Operating and Financial Results
104.4 120.5 133.9
116.5 85.3
2013 2014 2015 2016 2017 YTD
Market Trends
China prices still strong
▪ China domestic prices up sharply in Q3.
▪ Government environmental inspections resulted in temporary shutdowns, which led to a reduction in soda ash supply
▪ China exports down 24% YTD through August, which is the lowest level since 2004
▪ Asia soda ash demand up 12% YTD
Other international markets
▪ South America and Middle East pricing under pressure
▪ Expansion in Turkey pushed European synthetic producers to offer tons into other markets at lower prices
Domestic prices down slightly in 2017
▪ Ciner Turkey expansion caused a drop in prices as global market adjusts to new capacity coming online
Confidential 14
▪ Compelling investment proposition provided through yield
plus distribution growth
▪ Stable cash generation
▪ Organic and acquisition growth opportunities supporting
annual distribution growth
▪ Conservative coverage ratio
▪ Lowest cost soda ash production
▪ Significant mining reserve life
▪ Operational advantages
▪ Strong safety record and environmental responsibility
▪ Stable customer relationships
▪ Proven management and operational team
15
Ciner Resources - Investment Highlights
APPENDIX
Confidential 16
Min
ing
Pro
ce
ss
Flo
wR
efi
nin
g P
roc
es
s F
low
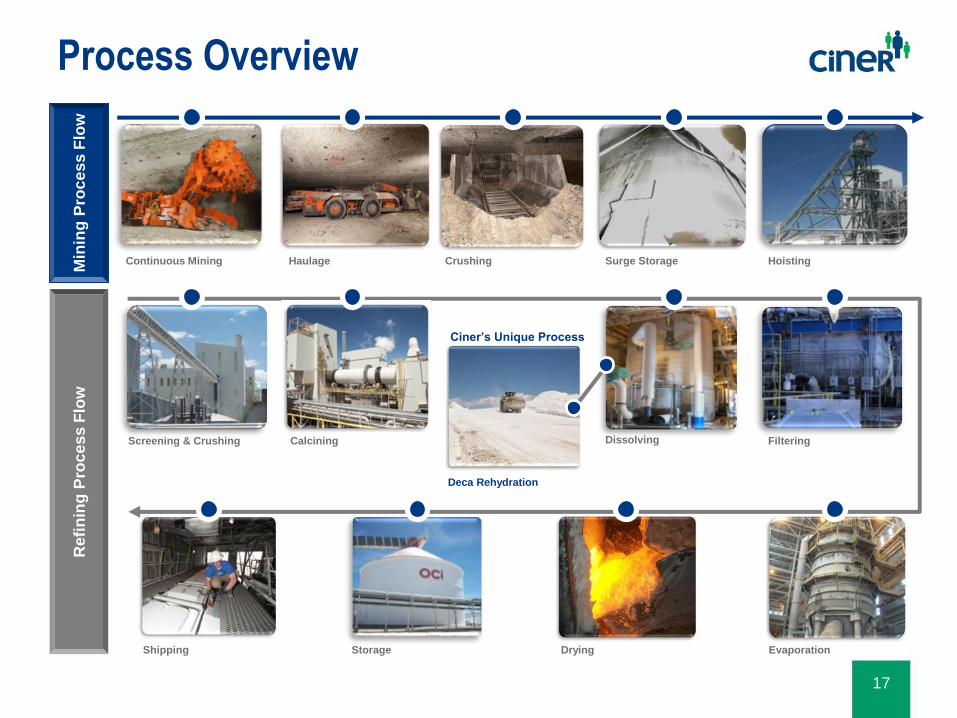
Continuous Mining Haulage Crushing HoistingSurge Storage
Deca Rehydration
Screening & Crushing Calcining Dissolving Filtering
Ciner’s Unique Process
Shipping Storage Drying Evaporation
17
Process Overview
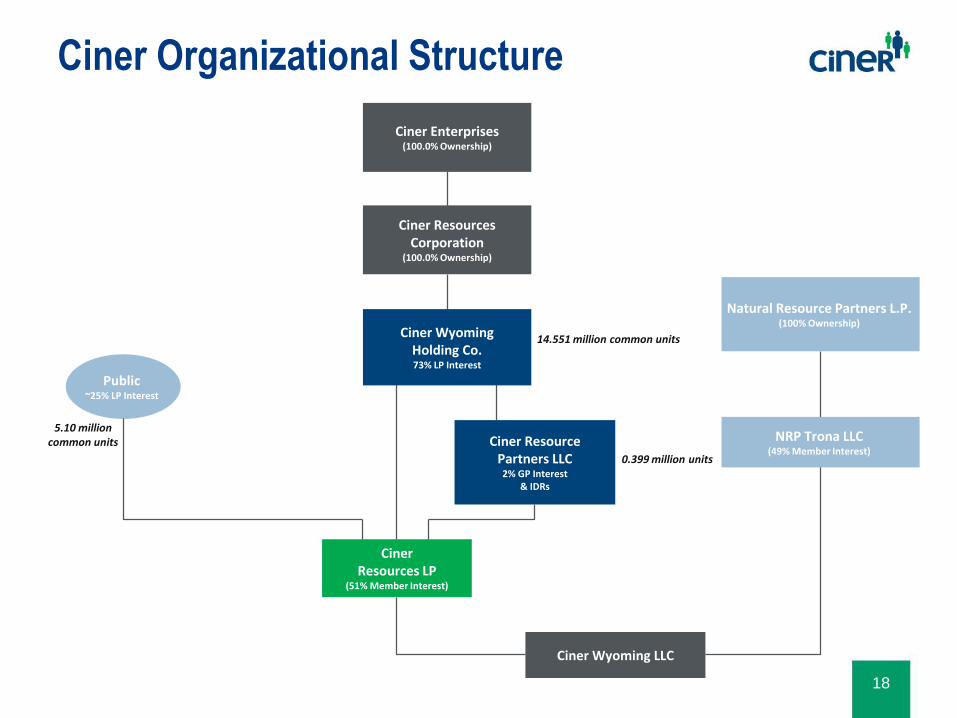
Ciner Organizational Structure
Ciner Resource Partners LLC
2% GP Interest& IDRs
Public ~25% LP Interest
Ciner ResourcesCorporation
(100.0% Ownership)
Ciner Wyoming Holding Co. 73% LP Interest
Ciner Wyoming LLC
Natural Resource Partners L.P.(100% Ownership)
0.399 million units
5.10 millioncommon units
14.551 million common units
Ciner Resources LP
(51% Member Interest)
NRP Trona LLC(49% Member Interest)
18
Ciner Enterprises(100.0% Ownership)
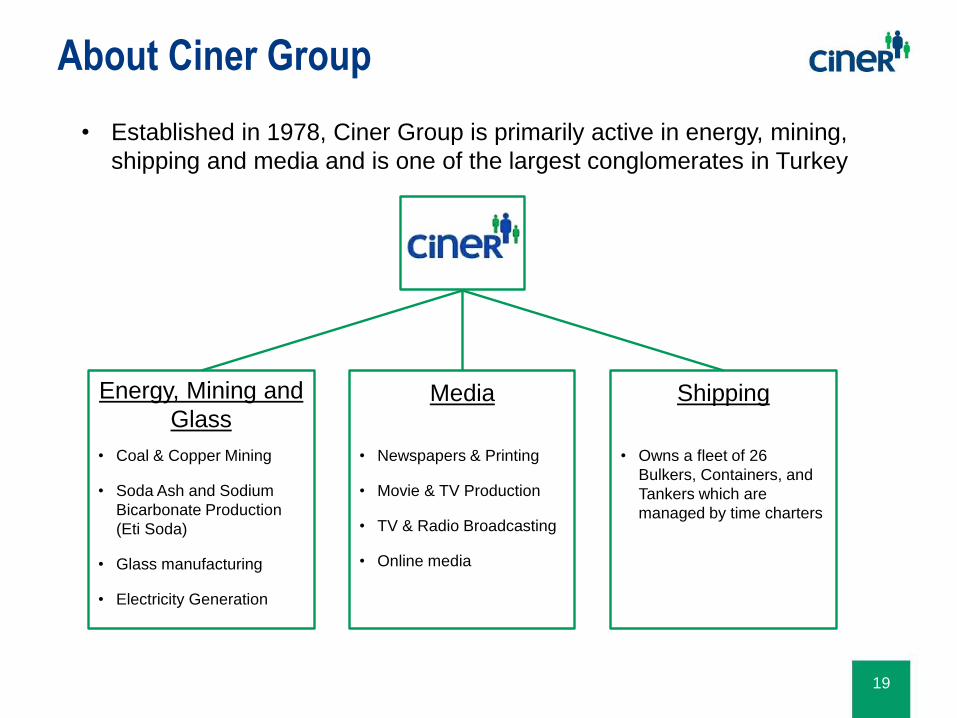
About Ciner Group
• Established in 1978, Ciner Group is primarily active in energy, mining,
shipping and media and is one of the largest conglomerates in Turkey
• Coal & Copper Mining
• Soda Ash and Sodium
Bicarbonate Production
(Eti Soda)
• Glass manufacturing
• Electricity Generation
• Newspapers & Printing
• Movie & TV Production
• TV & Radio Broadcasting
• Online media
Energy, Mining and
GlassMedia Shipping
• Owns a fleet of 26
Bulkers, Containers, and
Tankers which are
managed by time charters
19
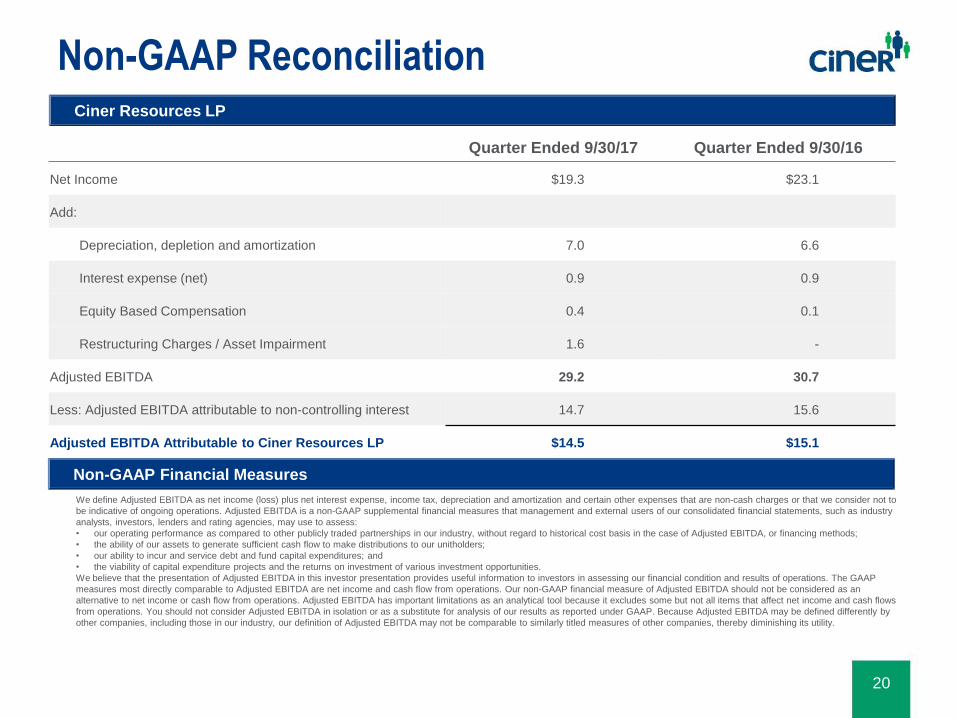
Ciner Resources LP
Quarter Ended 9/30/17 Quarter Ended 9/30/16
Net Income $19.3 $23.1
Add:
Depreciation, depletion and amortization 7.0 6.6
Interest expense (net) 0.9 0.9
Equity Based Compensation 0.4 0.1
Restructuring Charges / Asset Impairment 1.6 -
Adjusted EBITDA 29.2 30.7
Less: Adjusted EBITDA attributable to non-controlling interest 14.7 15.6
Adjusted EBITDA Attributable to Ciner Resources LP $14.5 $15.1
We define Adjusted EBITDA as net income (loss) plus net interest expense, income tax, depreciation and amortization and certain other expenses that are non-cash charges or that we consider not to
be indicative of ongoing operations. Adjusted EBITDA is a non-GAAP supplemental financial measures that management and external users of our consolidated financial statements, such as industry
analysts, investors, lenders and rating agencies, may use to assess:
• our operating performance as compared to other publicly traded partnerships in our industry, without regard to historical cost basis in the case of Adjusted EBITDA, or financing methods;
• the ability of our assets to generate sufficient cash flow to make distributions to our unitholders;
• our ability to incur and service debt and fund capital expenditures; and
• the viability of capital expenditure projects and the returns on investment of various investment opportunities.
We believe that the presentation of Adjusted EBITDA in this investor presentation provides useful information to investors in assessing our financial condition and results of operations. The GAAP
measures most directly comparable to Adjusted EBITDA are net income and cash flow from operations. Our non-GAAP financial measure of Adjusted EBITDA should not be considered as an
alternative to net income or cash flow from operations. Adjusted EBITDA has important limitations as an analytical tool because it excludes some but not all items that affect net income and cash flows
from operations. You should not consider Adjusted EBITDA in isolation or as a substitute for analysis of our results as reported under GAAP. Because Adjusted EBITDA may be defined differently by
other companies, including those in our industry, our definition of Adjusted EBITDA may not be comparable to similarly titled measures of other companies, thereby diminishing its utility.
Non-GAAP Financial Measures
20
Non-GAAP Reconciliation
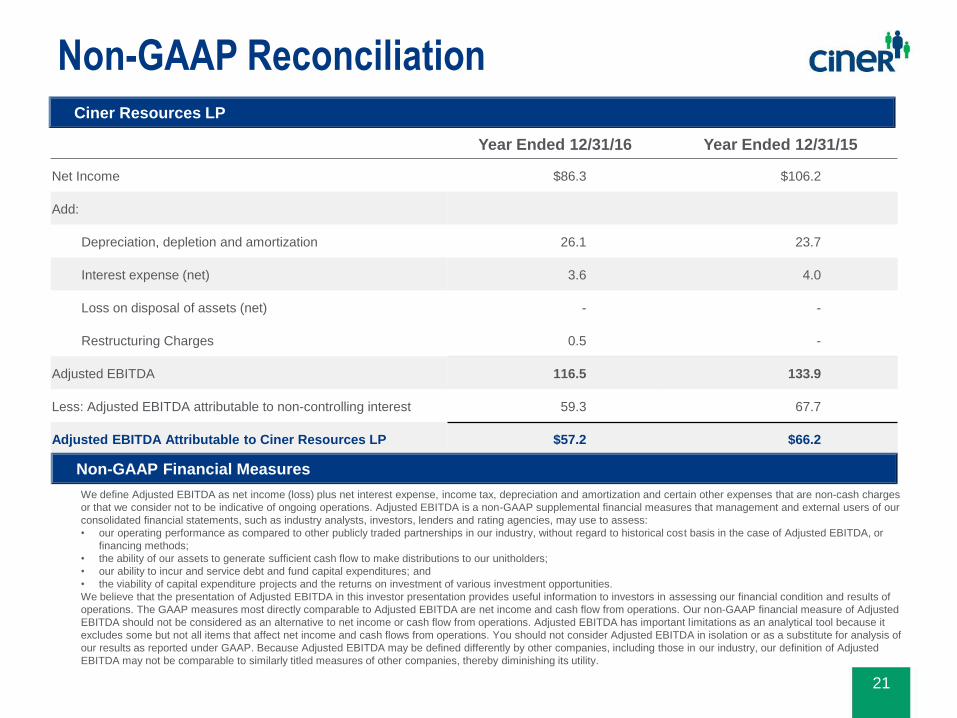
Ciner Resources LP
Year Ended 12/31/16 Year Ended 12/31/15
Net Income $86.3 $106.2
Add:
Depreciation, depletion and amortization 26.1 23.7
Interest expense (net) 3.6 4.0
Loss on disposal of assets (net) - -
Restructuring Charges 0.5 -
Adjusted EBITDA 116.5 133.9
Less: Adjusted EBITDA attributable to non-controlling interest 59.3 67.7
Adjusted EBITDA Attributable to Ciner Resources LP $57.2 $66.2
We define Adjusted EBITDA as net income (loss) plus net interest expense, income tax, depreciation and amortization and certain other expenses that are non-cash charges
or that we consider not to be indicative of ongoing operations. Adjusted EBITDA is a non-GAAP supplemental financial measures that management and external users of our
consolidated financial statements, such as industry analysts, investors, lenders and rating agencies, may use to assess:
• our operating performance as compared to other publicly traded partnerships in our industry, without regard to historical cost basis in the case of Adjusted EBITDA, or
financing methods;
• the ability of our assets to generate sufficient cash flow to make distributions to our unitholders;
• our ability to incur and service debt and fund capital expenditures; and
• the viability of capital expenditure projects and the returns on investment of various investment opportunities.
We believe that the presentation of Adjusted EBITDA in this investor presentation provides useful information to investors in assessing our financial condition and results of
operations. The GAAP measures most directly comparable to Adjusted EBITDA are net income and cash flow from operations. Our non-GAAP financial measure of Adjusted
EBITDA should not be considered as an alternative to net income or cash flow from operations. Adjusted EBITDA has important limitations as an analytical tool because it
excludes some but not all items that affect net income and cash flows from operations. You should not consider Adjusted EBITDA in isolation or as a substitute for analysis of
our results as reported under GAAP. Because Adjusted EBITDA may be defined differently by other companies, including those in our industry, our definition of Adjusted
EBITDA may not be comparable to similarly titled measures of other companies, thereby diminishing its utility.
Non-GAAP Financial Measures
21
Non-GAAP Reconciliation
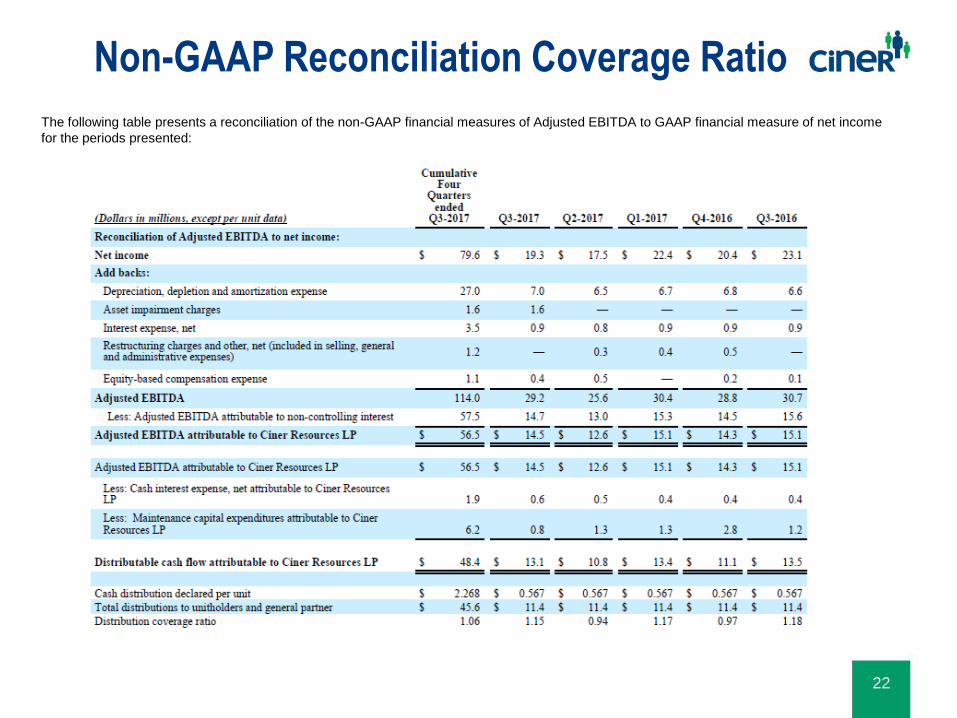
The following table presents a reconciliation of the non-GAAP financial measures of Adjusted EBITDA to GAAP financial measure of net income
for the periods presented:
Non-GAAP Reconciliation Coverage Ratio
22
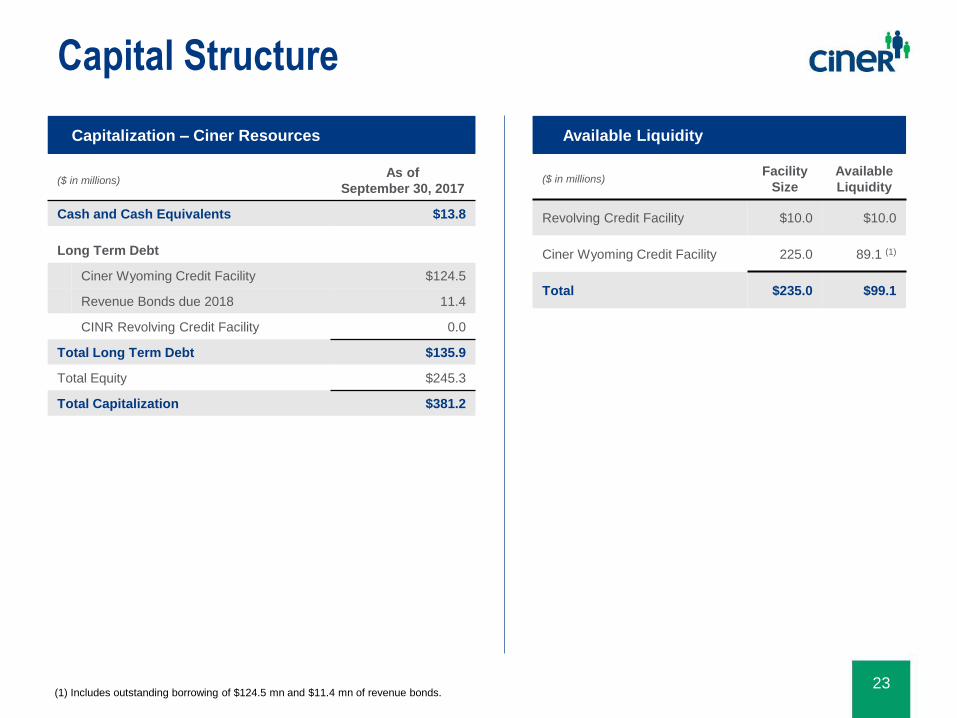
Available LiquidityCapitalization – Ciner Resources
(1) Includes outstanding borrowing of $124.5 mn and $11.4 mn of revenue bonds.
($ in millions)Facility
Size
Available
Liquidity
Revolving Credit Facility $10.0 $10.0
Ciner Wyoming Credit Facility 225.0 89.1 (1)
Total $235.0 $99.1
($ in millions)As of
September 30, 2017
Cash and Cash Equivalents $13.8
Long Term Debt
Ciner Wyoming Credit Facility $124.5
Revenue Bonds due 2018 11.4
CINR Revolving Credit Facility 0.0
Total Long Term Debt $135.9
Total Equity $245.3
Total Capitalization $381.2
23
Capital Structure
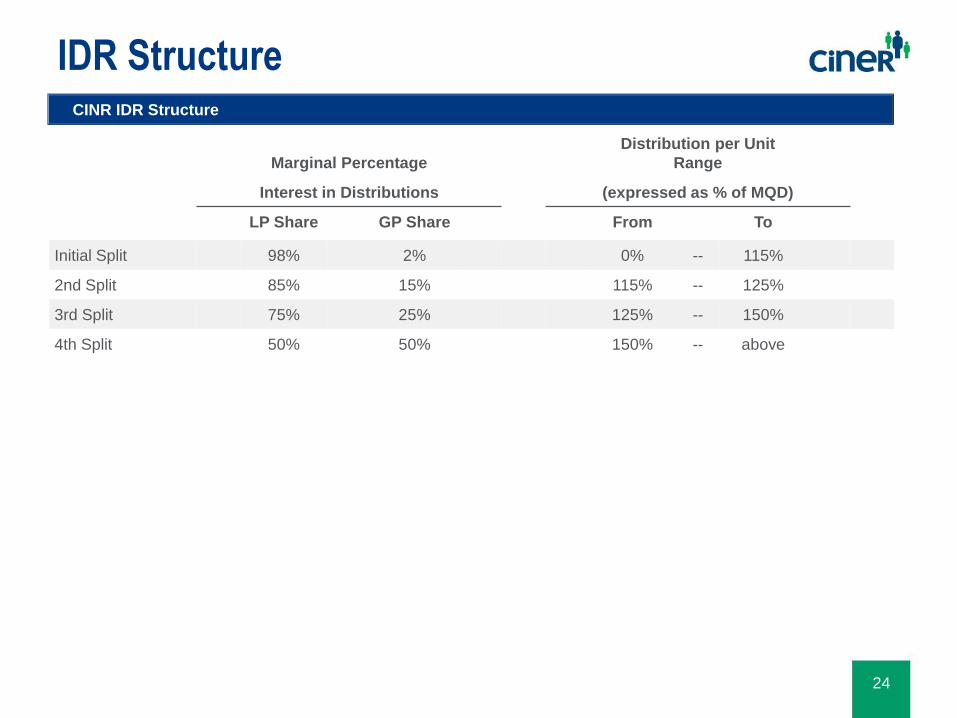
Marginal Percentage
Distribution per Unit
Range
Interest in Distributions (expressed as % of MQD)
LP Share GP Share From To
Initial Split 98% 2% 0% -- 115%
2nd Split 85% 15% 115% -- 125%
3rd Split 75% 25% 125% -- 150%
4th Split 50% 50% 150% -- above
CINR IDR Structure
24
IDR Structure