chytrid research and management in...
TRANSCRIPT

Depar tment of Pr imar y Industr ies, Par ks, Water and Environment
Chytr id Research and Management in Tasmania
Nature Conser vat ion Repor t 10/02
Contr ibutor s : Annie Phi l ips , David Wilson, Jamie Voyles , Mar t ine Cornish, Katr ina Stewar t , Charna Stowe,
Kathleen Tsimbas , Stewar t Blackhal l , Michael Dr iessen.
Chytrid
Research
and
Man
agemen
t in Tasm
ania
CONTACT DETAILS
Biodiversity Conservation Branch
Resource Managament and Conservation
GPO Box 44
Hobar t TAS 7001
Photos (L to R): DPIPWE, Jamie Voyles, Drew Lee, Annie Philips, Jamie Voyles, Iain Stych, Josh GriffithsMain photo: Jamie Voyles
BL1
0439
Chytrid Research and Management in
Tasmania
Final report by Department of Primary Industries, Parks, Water and
Environment to NRM North
Contract number FF207
Contributors: Annie Philips, David Wilson, Jamie Voyles, Martine Cornish, Katrina Stewart,
Charna Stowe, Kathleen Tsimbas, Stewart Blackhall, Michael Driessen.
i
Contents Introduction ..................................................................................................................... iii
Chapter 1. Chytrid Testing at Animal Health Laboratories, Launceston ......................... 1
Introduction .................................................................................................................. 1
Methods and Results ..................................................................................................... 1
Discussion ..................................................................................................................... 7
Appendices ................................................................................................................... 8
Chapter 2. Batrachochytrium dendrobatidis distribution, prevalence and implications
for amphibian management in Tasmania........................................................................ 16
Introduction ................................................................................................................ 16
Materials and Methods ............................................................................................... 17
Results ........................................................................................................................ 19
Discussion ................................................................................................................... 23
Appendix .................................................................................................................... 26
Chapter 3. Assessing pathogen virulence and host susceptibility: implications for risk
assessment for chytridiomycosis management in Tasmanian frogs ............................... 28
Introduction ................................................................................................................ 28
Materials and methods ................................................................................................ 30
Results ........................................................................................................................ 33
Discussion ................................................................................................................... 34
Chapter 4. Retrospective analysis of museum frogs for chytridiomycosis .................... 39
Introduction ................................................................................................................ 39
Methods ...................................................................................................................... 40
Results ........................................................................................................................ 40
Discussion ................................................................................................................... 42
Chapter 5. Detection probabilities and optimal survey methods for Tasmanian anurans
under varying environmental conditions. ....................................................................... 43
Introduction ................................................................................................................ 43
Materials and Methods ............................................................................................... 44
Results ........................................................................................................................ 47
Discussion ................................................................................................................... 52
Chapter 6. Environmental modelling of historic and current distribution for Tasmania's
two threatened and three endemic frog species .............................................................. 57
Introduction ................................................................................................................ 57
Methods ...................................................................................................................... 57
Results ........................................................................................................................ 58
Discussion ................................................................................................................... 58

ii
Chapter 7. Recent range contraction of Litoria raniformis in Tasmania inferred through
environmental modelling and repeat surveys ................................................................. 61
Introduction ................................................................................................................ 61
Methods and Results ................................................................................................... 61
Discussion ................................................................................................................... 62
Chapter 8. Skeletochronology of Litoria raniformis phalanges to assess age................ 64
Introduction ................................................................................................................ 64
Materials/ Methods ..................................................................................................... 66
Results ........................................................................................................................ 67
Discussion ................................................................................................................... 69
Chapter 9. The Tasmanian Tree Frog Litoria burrowsae; distribution, habitat use and
seasonal activity patterns ................................................................................................ 70
Introduction ................................................................................................................ 70
Materials and Methods ............................................................................................... 71
Results ........................................................................................................................ 72
Discussion ................................................................................................................... 76
Chapter 10. A survey for disease introductions via frogs imported in fresh produce .... 78
Introduction ................................................................................................................ 78
Methods ...................................................................................................................... 78
Results ........................................................................................................................ 78
Discussion ................................................................................................................... 78
References ...................................................................................................................... 80

iii
Introduction
In September 2008, NRM North contracted the Department of Primary Industries,
Parks, Water and Environment to significantly expand and accelerate Tasmania’s
response to chytrid by:
Establishing the extent of chytrid in Tasmania and identifying chytrid-free areas
Identifying the risk status of key Tasmanian species (threatened species, endemics) and where appropriate developing monitoring programs
Limiting the spread of chytrid in Tasmania through the development and implementation of a Chytrid Management Plan for Tasmania
Establishing capacity for testing field samples for chytrid fungus in Tasmania. This report documents how several of the key objectives listed above have been met and exceeded, specifically:
The distribution of chytrid positive and chytrid negative areas are documented
Monitoring methods are established for key Tasmanian frog species
The establishment of chytrid testing capabilities in Tasmania
Susceptibility determined of key Tasmanian frogs species to chytrid
A key contractual output, the Tasmanian Chytrid Management Plan, has been
completed and contains a risk assessment considering the threat chytrid poses to
Tasmanian frogs.
Key findings of this research are:
The endemic Tasmanian tree frog was found to be highly susceptible to chytrid and requires monitoring and chytrid management
Our two threatened frog species are not at as high a risk from chytrid as feared at the beginning of this survey although the populations need to be monitored
The distribution of the endemic Tasmanian froglet appears to have declined significantly in Tasmania with few recent records of the species in northern and eastern Tasmania
Further research is required to assess the susceptibility of the Tasmanian froglet to chytrid
The Tasmanian Wilderness World Heritage Area, which contains the majority of habitat for Tasmania’s three endemic frog species, remains largely free of chytrid
Chytrid was found to occur on King and Flinders islands
Methods have been developed for monitoring our key frog species.
1
Chapter 1. Chytrid Testing at Animal Health Laboratories,
Launceston
Martine Cornish
Biodiversity Conservation Branch, Department of Primary Industries, Parks, Water and
Environment, PO Box 44, Hobart, Tasmania, 7001.
Introduction
Chytridiomycosis is caused by the fungus Batrachochytrium dendrobatidis which is
associated with declines in amphibian populations worldwide (Boyle et al. 2004; Hyatt
et al. 2007). A real-time PCR TaqMan Assay has been developed that can accurately
detect the causative agent of chytrid, the zoospore using the non-invasive sampling
method of swabbing (Boyle et al. 2004).
The disease chytridiomycosis is recognised by the Office International des Epizooties
(OIE) ad hoc Group on Amphibian Diseases. Within Australia it is listed as a ‘key
threatening process’ under the Commonwealth Environment and Protection and
Biodiversity Conservation Act 1999 (EBPC Act) (Hyatt et al. 2007). Chytrid was first
detected in Tasmania in 2004 (Obendorf 2005) and the aim of this project was to
facilitate the technology transfer from the Australian Animal Health Laboratories
(AAHL) of CSIRO, Geelong to establish ongoing chytrid PCR testing capabilities at the
Animal Health Laboratories located in Launceston.
Methods and Results
DNA extraction
DNA is directly extracted from swabs using the Hyatt et al. (2007) method of
zirconia/silica beads and PrepMan® Ultra (see Appendix A). The method was adapted
to reflect the equipment available (lack of a bead beater). The Hyatt et al. (2007)
method is the standard method of extraction for the Chytrid TaqMan Assay.
0.5mm diameter zirconia/silica beads are used as these are recommended in literature
when working with fungi/spores.
PrepMan® Ultra has various potential health effects to consider; refer to the MSDS for
PrepMan® Ultra for more information.

2
Real-time PCR
The TaqMan Real-time PCR assay technology transfer from the Animal Health
Laboratories of CSIRO proved to be considerably more difficult than initially thought.
Throughout the projects duration, various troubleshooting methods were undertaken
to ensure the TaqMan assay functioned correctly. Briefly, TaqMan Universal PCR
Master Mix (1x, 2x concentration), primer purity (PCR/Seq, HPLC) and dilution, probe
dilution and activity, TaqMan Exogenous Positive Control and LightCycler® TaqMan®
Master® mix were examined in efforts to have the TaqMan PCR operational by April
2009. Full description and details can be found in Laboratory Notebook 2009-1 Chytrid
Testing submitted with this report.
The operational TaqMan method is described in Appendix B.
From the beginning of the project the conditions recommended by AAHL of CSIRO
were followed. This included use of the TaqMan Universal PCR Master mix and
TaqMan Exogenous Positive Control. The mastermix was tried at 1x and 2x
concentration and failed to amplify PCR product. It was thought that faults associated
with the primers, probe or template (zoospore standard) material resulted in the assay
failing.
The primers and zoospore were tested using conventional PCR (see Appendix H) and
found not to be at fault. It was concluded at this point that the fault lay with the probe
or mastermix.
A second batch of the mastermix was supplied by another operator within the
laboratory. This mastermix had previously been tested and proven to work
successfully. It was also at this time that the TaqMan Exogenous Positive Control was
removed from the assay, as it was discovered that it cannot be detected by the Roche®
LightCyler® detection system. It was suggested that this be removed until such time an
appropriate control could be found or removed altogether (in-house practice). The
alternative mastermix failed. This indicated that the fault lay with the probe and
possibly the primer/probe combination.
A review of the sequences and ordering details was undertaken and a new group of
primers and probe diluted and run in the Real-time PCR assay. The result remained
unchanged. The product was run on a 3.5% agarose gel (see Appendix H) and no bands
were visible, indicating that amplification had failed.
The primers and mastermix were run using real-time PCR with and without the probe
and the product run on a 3.5% agarose gel. No bands were shown. A lack of product on

3
a gel may be indicative of primer failure. It was believed that the primer purity
(Con/Seq recommended by AAHL) may have contributed to the failure. Fresh primers
were ordered of improved, HPLC purity.
The HPLC purity primers were used in real-time PCR and appeared to have no affect on
the system. They were also used in conventional PCR without changing the assay
outcome.
At this time, a new mastermix was selected, specific to the Roche® LightCycler®
System. It was determined from past precedent that various modifications are
necessary for AAHL methods to work on the Roche® LightCycler® System. The
LightCycler® TaqMan® Master mix was selected and run in real-time PCR. This was the
first point in the project that the assay was successful. It is believed that this particular
mastermix facilitates the reaction and possibly prevents PCR product from sticking to
the wall of glass capillaries.
From this point the LightCycler® TaqMan® Master mix and HPLC purity primers became
routine. The operational Real-time PCR assay (see Appendix B) was used to begin
validation of the TaqMan Real-time PCR assay.
Validation
Validation is described as the evaluation of a process to determine its fitness for a
particular use (http://www.oie.int/eng/normes/fmanual/A_00011.htm, date accessed
30/04/2009). To validate the TaqMan Real-time PCR method it was requested that the
World Organisation for Animal Health (OIE) guidelines for Diagnostic tests for Aquatic
Animals 2006 be followed. This process had previously been identified and
implemented in the Animal Health Laboratories, Launceston for another real-time PCR
test.
The method of validation requires determination of repeatability and measurement of
the test validity. Repeatability requires that within-test and between-test variation be
determined.
To demonstrate the within test variation aspect of repeatability, three samples of
different strength (high, medium and low value) are required to be run in four
replicates. In order to meet the evaluation and repeatability requirements a no-
template control and zoospore standards of 0.1, 1, 10 and 100 zoospores were run in
four replicates (quadruplicate) across four separate PCR assays. The between test
difference aspect of repeatability requires twenty samples to be assayed on different
days by different operators.
To measure test validity, the OIE requires 542 samples to be assayed and compared to
the standards determined above. Running 542 samples will complete full validation of

4
the assay. For information on the validation process refer to Section 1.1 General
Provisions, Chapter 1.1.2 and 1.1.3 of the Manual of Diagnostic Tests for Aquatic
animals 2006 (OIE website: http://www.oie.int/eng/normes/fmanual/a_00009.htm).
Progression through validation
The repeatability assays demonstrated that a high level of corroboration was possible
between samples within the assay (inter-) and between independent assays (intra-).
The values can be seen in Table 1.
The levels of agreement within inter- and intra-assay allowed validation to progress to
the point of running true samples. This stage required samples to be run in triplicate
for twenty consecutive assays. If a high level of reproducibility is achieved across
twenty assays, samples may be tested singly. Unfortunately, due to the limited
capacity of the Roche LightCycler only six samples may be run in triplicate during each
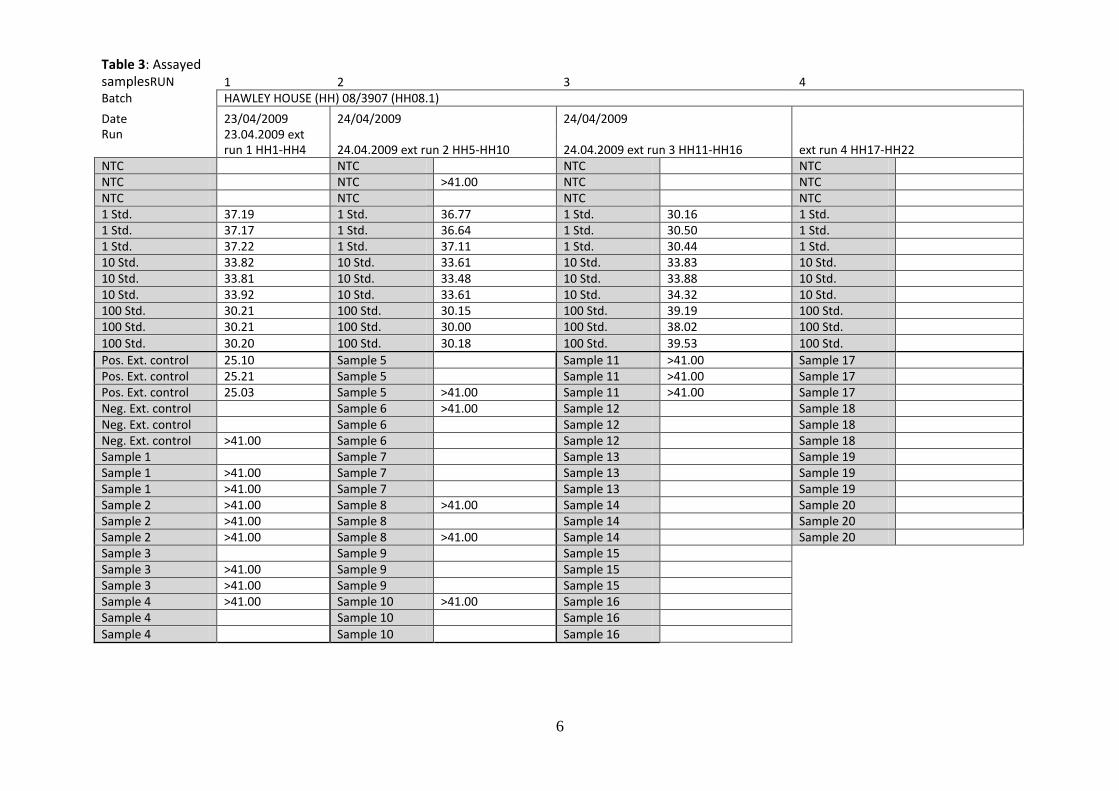
assay. The samples’ run at the time of the projects completion can be seen in Table 2.
Three of the twenty triplicate assays have been completed.
The next step of this process will be to continue running assays. A list of the extracted
samples (Appendix D) and materials and reagents remaining from the project see
(Appendix E) has been prepared.

5
Table 1: Validation - repeatability and evaluation of TaqMan Real-time PCR assay
Date 25/03/2009 25/03/2009 26/03/2009 26/03/2009
Run title 25.03 E&R.ABT
25.02.2008 avg
ext3.ABT 26.03 E&R.ABT 26.03 E&Ra.ABT
NTC
NTC Standard
deviation
between each
assay:
NTC
NTC
0.1 Std. >41.00 39.38 >41.00 >41.00
0.1 Std. >41.00 39.42 >41.00 >41.00
0.1 Std. >41.00 39.73 >41.00 >41.00
0.1 Std. >41.00 39.38 >41.00 >41.00 0.169386147
1 Std. 37.11 36.52 36.94 36.99
1 Std. 37.66 36.03 36.90 36.82
1 Std. 37.31 36.29 37.15 37.34
1 Std. 37.11 36.83 36.85 37.63 0.435652767
10 Std. 33.89 32.98 33.57 33.12
10 Std. 33.83 33.02 33.51 33.15
10 Std. 34.09 33.06 33.37 33.14
10 Std. 33.93 32.88 33.63 33.08 0.390989663
100 Std. 30.29 29.67 30.37 29.69
100 Std. 30.29 29.94 30.09 29.70
100 Std. 30.48 29.85 30.09 29.60
100 Std. 30.76 29.85 30.11 29.76 0.335099488
Table 2: NTC indicates a no-template control. Std. indicates zoospore standard (for preparation
of zoospore standard see Appendix C).
The standard deviation inter- (within) and intra- (across) assay were calculated to demonstrate
repeatability. These figures are a good indication of reproducibility and the values shown
demonstrate an excellent standard of reproducibility for the TaqMan Real-time PCR assay.
Standard deviation within each assay:
NTC
0.1 Std.
0.169386147
1 Std. 0.259406374 0.340134777 0.131909060 0.361893170
10 Std. 0.111205515 0.077244202 0.111355287 0.030956959
100 Std. 0.222186108 0.113247517 0.136991484 0.066017674
6
Table 3: Assayed samplesRUN 1 2 3 4 Batch HAWLEY HOUSE (HH) 08/3907 (HH08.1)
Date 23/04/2009 24/04/2009 24/04/2009 Run 23.04.2009 ext
run 1 HH1-HH4 24.04.2009 ext run 2 HH5-HH10 24.04.2009 ext run 3 HH11-HH16 ext run 4 HH17-HH22 NTC NTC NTC NTC NTC NTC >41.00 NTC NTC NTC NTC NTC NTC 1 Std. 37.19 1 Std. 36.77 1 Std. 30.16 1 Std. 1 Std. 37.17 1 Std. 36.64 1 Std. 30.50 1 Std. 1 Std. 37.22 1 Std. 37.11 1 Std. 30.44 1 Std. 10 Std. 33.82 10 Std. 33.61 10 Std. 33.83 10 Std. 10 Std. 33.81 10 Std. 33.48 10 Std. 33.88 10 Std. 10 Std. 33.92 10 Std. 33.61 10 Std. 34.32 10 Std. 100 Std. 30.21 100 Std. 30.15 100 Std. 39.19 100 Std. 100 Std. 30.21 100 Std. 30.00 100 Std. 38.02 100 Std. 100 Std. 30.20 100 Std. 30.18 100 Std. 39.53 100 Std.
Pos. Ext. control 25.10 Sample 5 Sample 11 >41.00 Sample 17 Pos. Ext. control 25.21 Sample 5 Sample 11 >41.00 Sample 17 Pos. Ext. control 25.03 Sample 5 >41.00 Sample 11 >41.00 Sample 17 Neg. Ext. control Sample 6 >41.00 Sample 12 Sample 18 Neg. Ext. control Sample 6 Sample 12 Sample 18 Neg. Ext. control >41.00 Sample 6 Sample 12 Sample 18 Sample 1 Sample 7 Sample 13 Sample 19 Sample 1 >41.00 Sample 7 Sample 13 Sample 19 Sample 1 >41.00 Sample 7 Sample 13 Sample 19 Sample 2 >41.00 Sample 8 >41.00 Sample 14 Sample 20 Sample 2 >41.00 Sample 8 Sample 14 Sample 20 Sample 2 >41.00 Sample 8 >41.00 Sample 14 Sample 20 Sample 3 Sample 9 Sample 15 Sample 3 >41.00 Sample 9 Sample 15 Sample 3 >41.00 Sample 9 Sample 15 Sample 4 >41.00 Sample 10 >41.00 Sample 16 Sample 4 Sample 10 Sample 16 Sample 4 Sample 10 Sample 16

7
Demand on the Roche® LightCycler® saw the development of a conventional PCR method to
analyse chytrid samples. A conventional PCR method was developed and adapted from
literature to run on the conventional PCR system in the Animal Health Laboratories (Annis et
al. 2004).
This method showed initial success, amplifying the zoospore standard up to one zoospore and
optimisation of the reaction mixture was completed. Unfortunately due to the nature of the
extraction method, positive and negative controls are amplified making differentiation
between a negative and positive sample impossible at this stage. In light of this, conventional
PCR of Chytrid was abandoned in favour of the TaqMan Real-time assay.
The developed method for conventional PCR can be seen in Appendix G. For further details on
conventional PCR experiments conducted refer to Laboratory Notebook 2009-1 Chytrid
Testing submitted with this report.
Discussion
The purpose of this project was to facilitate the technology transfer from the Animal Health
Laboratories of CSIRO, Geelong to establish ongoing chytrid PCR testing capabilities at the
Animal Health Laboratories located in Launceston.
Difficulties in the technology transfer saw a lengthy troubleshooting period to allow the
TaqMan Real-time PCR assay to function correctly. These included following the
recommended method from AAHL (the TaqMan PCR Universal Master mix and TaqMan
Exogenous Internal Positive Control), to examining the probe, template and primer purity to
finding a solution that worked on the Roche® LightCycler® system.
Unfortunately, these delays resulted in the assay not becoming operational until mid-March,
four weeks out from the project’s completion. Fortunately, initial validation of the assay –
evaluation and repeatability assays were able to be successfully completed. Subsequently, a
PrepMan® Ultra extraction method has been prepared and used to begin running true
samples through the TaqMan Real-time PCR system. A delay in success with Real-time assay
has resulted in a backlog of samples awaiting analysis. If the remaining samples can be run
through the system the Chytrid TaqMan Real-time PCR assay will progress toward full
validation.
At the time of this report, successful technology transfer of chytrid PCR testing from the
Animal Health Laboratories of CSIRO, Geelong had been made. Subsequently, the Animal
Health Laboratories of Launceston has ongoing chytrid PCR testing capabilities.
8
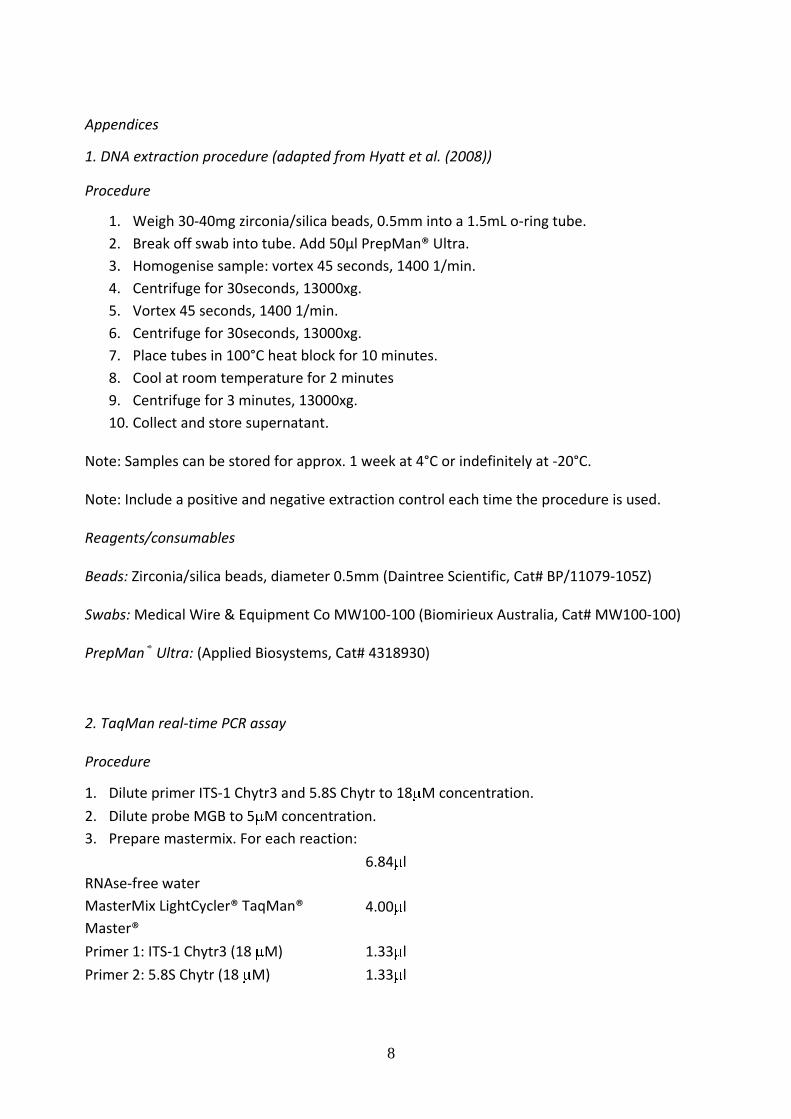
Appendices
1. DNA extraction procedure (adapted from Hyatt et al. (2008))
Procedure
1. Weigh 30-40mg zirconia/silica beads, 0.5mm into a 1.5mL o-ring tube.
2. Break off swab into tube. Add 50µl PrepMan® Ultra.
3. Homogenise sample: vortex 45 seconds, 1400 1/min.
4. Centrifuge for 30seconds, 13000xg.
5. Vortex 45 seconds, 1400 1/min.
6. Centrifuge for 30seconds, 13000xg.
7. Place tubes in 100°C heat block for 10 minutes.
8. Cool at room temperature for 2 minutes
9. Centrifuge for 3 minutes, 13000xg.
10. Collect and store supernatant.
Note: Samples can be stored for approx. 1 week at 4°C or indefinitely at -20°C.
Note: Include a positive and negative extraction control each time the procedure is used.
Reagents/consumables
Beads: Zirconia/silica beads, diameter 0.5mm (Daintree Scientific, Cat# BP/11079-105Z)
Swabs: Medical Wire & Equipment Co MW100-100 (Biomirieux Australia, Cat# MW100-100)
PrepMan® Ultra: (Applied Biosystems, Cat# 4318930)
2. TaqMan real-time PCR assay
Procedure
1. Dilute primer ITS-1 Chytr3 and 5.8S Chytr to 18 M concentration.
2. Dilute probe MGB to 5 M concentration.
3. Prepare mastermix. For each reaction:
RNAse-free water
6.84 l
MasterMix LightCycler® TaqMan®
Master®
4.00 l
Primer 1: ITS-1 Chytr3 (18 M) 1.33 l
Primer 2: 5.8S Chytr (18 M) 1.33 l

9
TaqMan Probe: Chytr MGB2 (5 M) 1.50 l
4. Prepare zoospore standard (see Appendix C).
5. Load 15 l mastermix and 5 l template (samples extracted using PrepMan® Ultra must be
diluted 1/10 as the PrepMan® Ultra reagent at higher concentrations is inhibitory of the
assay (Hyatt et al. 2008) to capillaries.
6. Run program (using Roche® LightCycler®):
95 C for 20 seconds Denaturation
95 C for 15 seconds
60 C for 1 minute 45 cycles Amplification
72 C for 0 time
40 C for 30 seconds Cooling
Reagents/consumables
Primers
Scale: 200nMole (Geneworks)
Purity: HPLC
Oligo names: ITS-1 Chytr3 and 5.8S Chytr
Sequences:
ITS-1 Chytr3 CCTTGATATAATACAGTGTGCCATATGTC
5.8S Chytr AGCCAAGAGATCCGTTGTCAAA
Probe
TaqMan MGB Probe 50,000pmol (Applied Biosystems)
Purification: HPLC
Formulations: Liquid
Diluent: 1XTE
3’ label: MGBNFQ
Pmol/ L: 100
Sequence:

10
ChytrMGB2 6FAM-CGAGTCGAACAAAT
Mastermix
LightCycler® TaqMan® Master® (Roche Diagnostics, Cat# 04735536001)
RNAse-free water
(Qiagen, Cat# 129112)
Capillaries
(Roche Diagnostics, Cat# 04929292001)
3. Preparation of zoospore standard (Hyatt et al. 2008)
Aliquot into 50 µl amounts and store at -80°C (STOCK 100)
WORKING STOCK (store at -20°C):
Make up fresh zoospore standard dilutions when doing the assay (Can store dilutions for a
week if you are doing a lot of assays).
Remove a fresh aliquot from -80°C once the working stock is used up.
To prepare the WORKING STOCK:
100 zoospores (standard 10-1)
Make a 1/10 dilution (1 µl STOCK to 9 µl water) = 10-1
10 zoospores (standard 10-2)
10-fold dilution. Make 1/10 dilution of 100 standard = 10-2
1 zoospore (standard 10-3)
10-fold dilution. Make 1/10 dilution of 10 standard = 10-3
0.1 of a zoospore (standard 10-4)
10-fold dilution. Make 1/10 dilution of 1 standard = 10-4
11
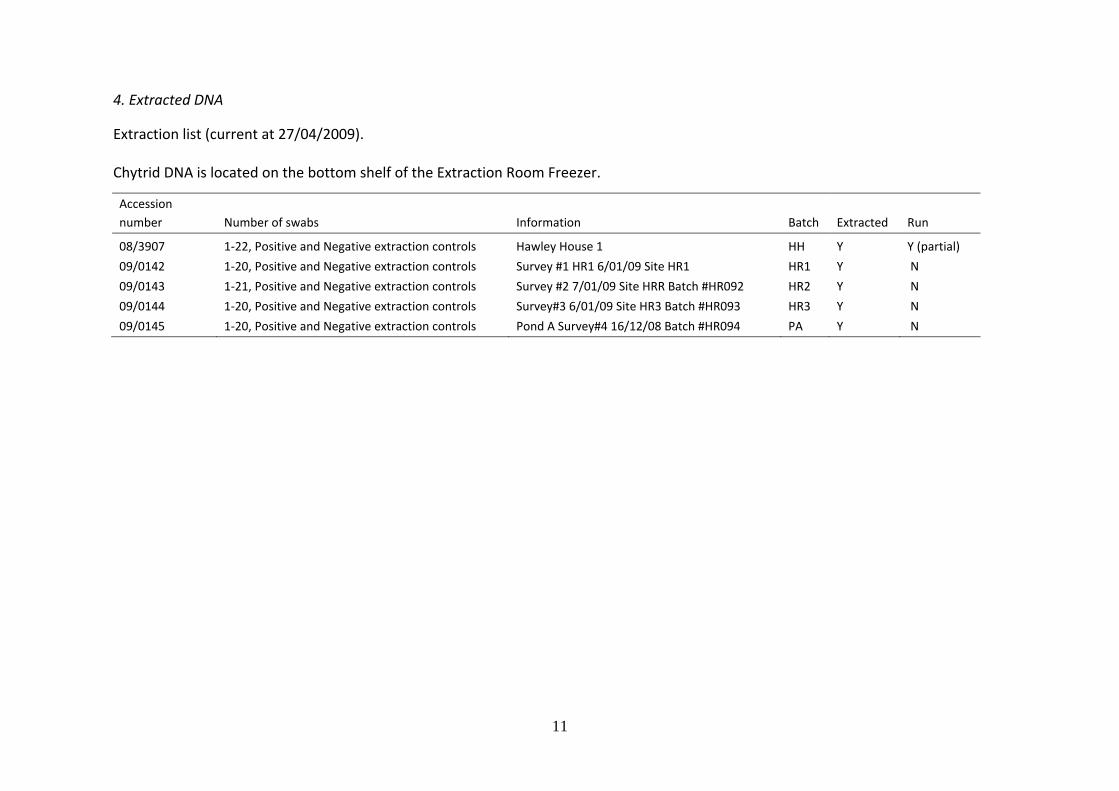
4. Extracted DNA
Extraction list (current at 27/04/2009).
Chytrid DNA is located on the bottom shelf of the Extraction Room Freezer.
Accession
number Number of swabs Information Batch Extracted Run
08/3907 1-22, Positive and Negative extraction controls Hawley House 1 HH Y Y (partial)
09/0142 1-20, Positive and Negative extraction controls Survey #1 HR1 6/01/09 Site HR1 HR1 Y N
09/0143 1-21, Positive and Negative extraction controls Survey #2 7/01/09 Site HRR Batch #HR092 HR2 Y N
09/0144 1-20, Positive and Negative extraction controls Survey#3 6/01/09 Site HR3 Batch #HR093 HR3 Y N
09/0145 1-20, Positive and Negative extraction controls Pond A Survey#4 16/12/08 Batch #HR094 PA Y N

12
5. Remaining materials
Stock level remaining post-project (1/05/2009).
Item Quantity Use Location Supplier
RNAse free water 10 x 1.9mL Real-time PCR, DNA
extraction
Mastermix suite hallway, bottom
shelf-far left
Qiagen, Cat# 129112
LightCycler® TaqMan® Master Mix 3 x 1b, 1 x 1a Real-time PCR Mastermix preparation room,
Freezer 1-top drawer
Roche Diagnostics, Cat#
04735536001
TaqMan Universal PCR Master Mix ~3mL Real-time PCR Mastermix preparation room,
Refrigerator-top shelf
Applied Biosystems,
Cat#4304437
ITS1-3 Chytr primer (HPLC purity) 5 x 100µM stock, unopened vial
Real-time PCR Mastermix preparation room,
Freezer 1-top drawer Geneworks
5.8S Chytr primer (HPLC purity) 4 x 100µM stock, unopened vial
ITS1-3 Chytr primer (PCR/seq purity) 13 x 100µM stock
5.8S Chytr primer (PCR/seq purity) 13 x 100µM stock
TaqMan Probe Chytr MGB2 3 x stock (32µl), ~300µl stock Real-time PCR Mastermix preparation room,
Freezer 1-top drawer
Applied Biosystems
Capillaries
None Real-time PCR
Roche Diagnostics, Cat#
04929292001
TaqMan Exogenous Internal Positive
Control
~50% Real-time PCR Extraction room, freezer Applied Biosystems,
Cat#4308323
10 x buffer 26 x 50µl, ~1.25mL stock Conventional PCR Mastermix preparation room,
Freezer 1-top drawer
Invitrogen, Cat#
SKU10966-034
dNTPs 10 x 50µl, ~300µl stock Conventional PCR Mastermix preparation room,
Freezer 1-top drawer
Bioline Australia, Cat#
BIO-39028
unopened vial
MgCl2 (50mM) 12 x 50µl, ~300µl stock Conventional PCR Mastermix preparation room,
Freezer 1-top drawer
Invitrogen, Cat#
SKU10966-034
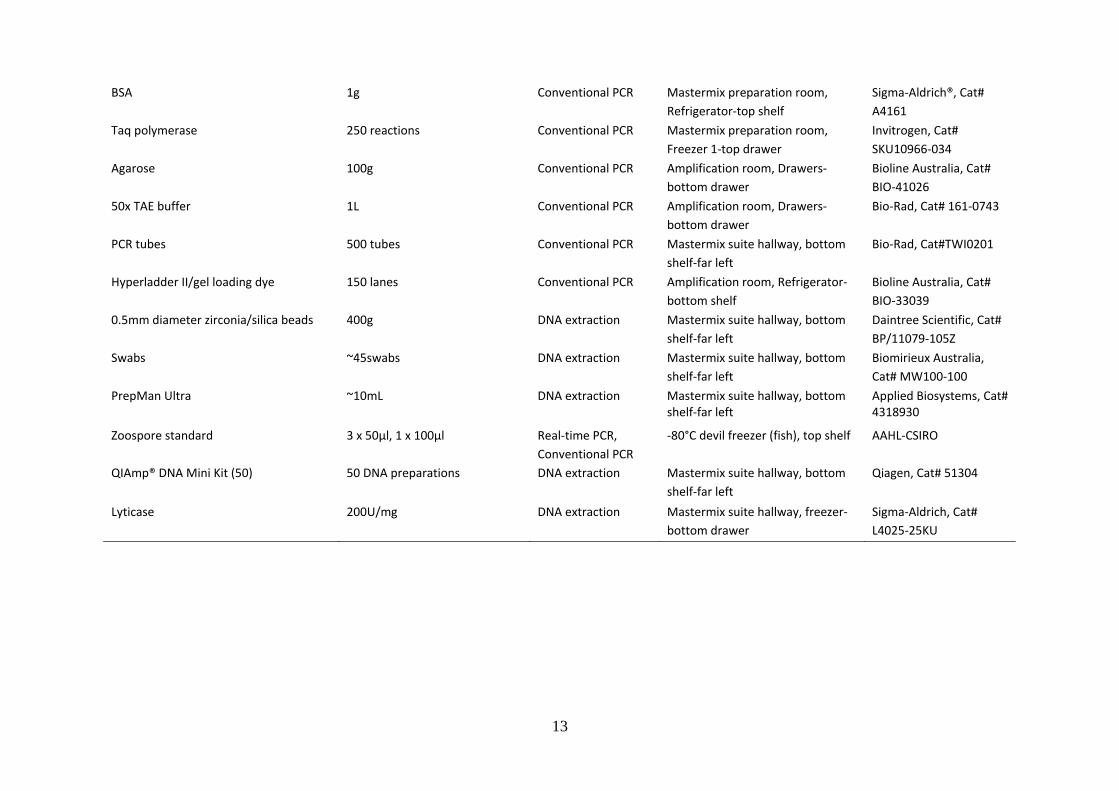
13
BSA 1g Conventional PCR Mastermix preparation room,
Refrigerator-top shelf
Sigma-Aldrich®, Cat#
A4161
Taq polymerase 250 reactions Conventional PCR Mastermix preparation room,
Freezer 1-top drawer
Invitrogen, Cat#
SKU10966-034
Agarose 100g Conventional PCR Amplification room, Drawers-
bottom drawer
Bioline Australia, Cat#
BIO-41026
50x TAE buffer 1L Conventional PCR Amplification room, Drawers-
bottom drawer
Bio-Rad, Cat# 161-0743
PCR tubes 500 tubes Conventional PCR Mastermix suite hallway, bottom
shelf-far left
Bio-Rad, Cat#TWI0201
Hyperladder II/gel loading dye 150 lanes Conventional PCR Amplification room, Refrigerator-
bottom shelf
Bioline Australia, Cat#
BIO-33039
0.5mm diameter zirconia/silica beads 400g DNA extraction Mastermix suite hallway, bottom
shelf-far left
Daintree Scientific, Cat#
BP/11079-105Z
Swabs ~45swabs DNA extraction Mastermix suite hallway, bottom
shelf-far left
Biomirieux Australia,
Cat# MW100-100
PrepMan Ultra ~10mL DNA extraction Mastermix suite hallway, bottom shelf-far left
Applied Biosystems, Cat# 4318930
Zoospore standard 3 x 50µl, 1 x 100µl Real-time PCR,
Conventional PCR
-80°C devil freezer (fish), top shelf AAHL-CSIRO
QIAmp® DNA Mini Kit (50) 50 DNA preparations DNA extraction Mastermix suite hallway, bottom
shelf-far left
Qiagen, Cat# 51304
Lyticase 200U/mg DNA extraction Mastermix suite hallway, freezer-
bottom drawer
Sigma-Aldrich, Cat#
L4025-25KU

14
6. Conventional PCR assay (adapted from Annis et al. (2004))
Procedure
Dilute primer ITS-1 Chytr3 and 5.8S Chytr to 18 M concentration. Prepare mastermix. For each reaction: RNAse-free water 14.3 l 10x buffer 2.5 l dNTPs 2.0 l MgCl2 (50mM) 1.0 l Bovine serum albumin (1%)
0.5 l
Primer 1
ITS-1 Chytr3 (18 M) 0.5 l
Primer 2
5.8S Chytr (18 M) 0.5 l
Taq polymerase 0.2 l Prepare zoospore standard (see Appendix C).
Load 21 l mastermix and 4 l template to capillaries. Run program:
50 C for 2 minutes Denaturation
95 C for 10 minutes
95 C for 15 seconds
60 C for 1 minute 45 cycles Amplification
72 C for 1 minute
72 C for 10 minutes Extension
Pour 3.5% (10.5g Agarose diluted in 525mL 1xTAE, 52.5µl 10 000xGel Red (prepares approximately 3 gels)). Run PCR products on gel, 70V for approximately 45 minutes (4µl loading dye, 5µl Hyperladder II). Reagents/consumables RNAse-free water (Qiagen, Cat# 129112) 10x buffer, MgCl2 (50mM), Taq polymerase 10x PCR buffer (200mM Tris-Hcl (pH 8.4) 500mM KCl MgCl2 (50mM) Platinum® Taq PCR (Invitrogen™, Cat# SKU10966-034)

15
dNTPs dNTP mix (100mM Final Concentration - 50µmol dNTP (Bioline Australia, Cat# BIO-39028)) Bovine serum albumin (1%) (Sigma-Aldrich®, Cat# A4161) Primers Scale: 200nMole (Geneworks) Purity: PCR/Seq Oligo names: ITS-1 Chytr3 and 5.8S Chytr Sequences: ITS-1 Chytr3: CCTTGATATAATACAGTGTGCCATATGTC 5.8S Chytr: AGCCAAGAGATCCGTTGTCAAA Agarose Molecular Grade – 100g (Bioline Australia, Cat# BIO-41026) Gel Red Gel Red 10 000x in water (Biotium, Cat#41003-0.5mL) TAE 50 x Tris/Acetic Acid/EDTA (TAE), 1 L buffer (Bio-Rad, Cat# 161-0743) Ladder/marker, gel loading dye Hyperladder™ II – 200 lanes (Bioline Australia, Cat# BIO-33039) (5x gel loading dye is supplied with the Hyperladder) PCR tubes PCR doomed capped tubes, 0.2mL (Bio-Rad, Cat#TWI0201)
16
Chapter 2. Batrachochytrium dendrobatidis distribution, prevalence
and implications for amphibian management in Tasmania
Annie K. Philips1*, David Wilson1, Jamie Voyles1, Michael Driessen1, Matthew Webb1
1Biodiversity Conservation Branch, Department Primary Industries, Parks, Water and Environment, PO Box 44, Hobart, Tasmania 7001, Australia
Introduction
Batrachochytrium dendrobatidis (hereafter Bd) is a fungal pathogen that causes the emerging infectious amphibian disease, chytridiomycosis (eg. Berger et al. 1998; Daszak et al. 2003). It has been implicated in significant declines and extinctions globally in all continents where amphibians occur (eg. Berger et al. 1998; Weldon et al. 2004; Garner et al. 2005; Lips et al. 2006; Skerratt et al. 2007). Chytridiomycosis is arguably the most significant disease affecting the biodiversity of vertebrates (Skerratt et al. 2007). It is an international notifiable disease under the World Organisation for Animal Health (OIE), and in Australia is recognised as a ‘key threatening process’ under the national Environment Protection and Biodiversity Conservation Act 1999 resulting in the development of the Threat Abatement Plan: infection of amphibians with chytrid fungus resulting in chytridiomycosis (Department of the Environment and Heritage 1996).
Whilst alternative scenarios relating to Bd emergence have been debated (Rachowicz et al. 2005; Skerratt et al. 2007), it is generally accepted that Bd is an exotic pathogen introduced via mechanisms such as the transportation of infected amphibians (eg. Fisher and Garner 2007), then spread occurs into naive populations (Skerratt et al. 2007; Lips et al. 2008). Typically low Bd prevalence and high density of susceptible individuals is followed by exponential increase in Bd prevalence and high host mortality (Brem and Lips 2008). Mass mortalities during this epizootic phase are often unobserved (e.g. Puschendorf et al. 2006) particularly in broad scale studies. Once Bd becomes enzootic susceptible amphibian populations often occur at low densities (Brem and Lips 2008) and may suffer ongoing declines (Murray et al. 2009).
The host-pathogen relationship is influenced by environmental and ecological interactions which may affect the host directly by altering immune competence, nutritional state or density related transmission opportunities, or indirectly by regulating the growth and virulence of Bd (Woodhams and Alford 2005). Temperature and rainfall are important factors that have associated with increased infection prevalence (Woodhams and Alford 2005; Kriger et al. 2007) and chytridiomycosis induced mortality (Lips et al. 2006). In vivo, (Piotrowski et al. 2004) found Bd grows and reproduces at temperatures of 4-25⁰C and at pH 4-8, while growth was maximal at 17-25⁰C and at pH 6-7. The effect of pH on host-pathogen dynamics in wild populations requires further investigation.

17
In Australia Bd is distributed along the east coast including Tasmania, South Australia and the south-west of Western Australia (Speare et al. 2005). Bd was first diagnosed in Tasmanian in a captive bred frog at the Animal Health Laboratories (AHL), Launceston in 1993 (AHL records) and in wild amphibian populations in 2004 (Obendorf and Dalton 2006). Since then two further studies have investigated Bd distribution largely within and around the Tasmanian Wilderness World Heritage Area (TWWHA, Ricardo 2006; Pauza et al. in press). Two threatened species – Litoria raniformis and Limnodynastes peronii, and three endemic species – Crinia tasmaniensis, Litoria burrowsae and Bryobatrachus nimbus, occur in Tasmania (Littlejohn 2003), and the potential impact of Bd on these species is unknown, as is the potential for environmental factors to mediate this impact. The cool moist conditions that prevail across much of Tasmania are favourable to Bd survival and growth (e.g. Woodhams and Alford 2005), increasing the risk of chytridiomycosis to susceptible species.
Furthering our understanding of Bd dynamics in temperate areas such as Tasmania provides useful comparisons with tropical areas that have been the focus of much research. It also has important implications for managing the threat chytridiomycosis poses to Tasmanian amphibians, and to frog communities in temperate areas worldwide.
Our study describes large-scale patterns of Bd presence and prevalence, and how these were influenced by environmental variables and species sampled. Specifically the aims of this study were to:
(1) determine the current distribution of Bd in Tasmania, focusing on areas containing endemic and threatened amphibians;
(2) predict the potential Bd distribution in Tasmania;
(3) understand the relationship between Bd presence or prevalence and environmental parameters, and tadpole genera assessed within different habitats.
Finally, combine this information with the distribution of threatened and endemic Tasmanian amphibians to develop appropriate management guidelines for sites based on their disease status, improve survey techniques, and highlight important areas to guide future research on Bd in temperate areas.
Materials and Methods
Tasmania is an island of approximately 55,000km2, and is separated from mainland Australia by at least 240km. The climate is temperate, with temperatures range from 3-25° C in January (austral summer) to -3-15° C in July (austral winter). Rainfall varies from 400mm to 3200mm with a strong gradient from southwest to northeast (Bureau of Meteorology 2010, Williams, 1974). The vegetation has significant Gondwanan elements and is primarily comprised of five vegetation types; rainforest, sclerophyll forest, moorland, sedgeland and coastal heath (Williams, 1974).
Sites for Bd surveys were chosen based on two research priorities: (1) areas with records of occurrence of Tasmania’s threatened and endemic amphibians, including historic infected areas and adjacent populations (recommended by Skerratt et al. 2008); and (2) potential

18
pathogen transmission entry points into the TWWHA, as Bd is largely absent from this area (Pauza et al. in press), and it supports significant populations of all Tasmania’s endemic species (Driessen and Mallick 2003; Littlejohn 2003).
Field surveys
Surveys for Bd were conducted between November 2008 and December 2009. Two sites known to be infected with Bd (high altitude forest and a coastal heath site) were sampled over a 12 month period to assess variations in seasonal prevalence to underpin sampling and treatment methods. All other sites were sampled once only.
At each site we aimed to randomly collect 20 tadpoles using dip nets or small fish traps with fluorescent bait. This number (rounded up from 19) was calculated using the formula n=3/p (Hanley and Lippman-Hand 1983), where n is the sample size and p the prevalence expressed as a proportion, to be 95% certain of detecting at least one positive individual from positive sites. Prevalence (16%) was taken from Pauza et al. (in press). This method assumes 100% specificity of the PCR test used (Skerratt et al. 2008). If possible tadpoles of endemic or threatened amphibian species were sampled, otherwise available species were used, and where possible tadpoles of a single species were swabbed from a site (Skerratt et al. 2008). Adult frogs were swabbed opportunistically if found dead or if tadpoles were not catchable.
Each tadpole was swabbed by gently rolling a sterile fine-tip swab (MW100, Medical Wire and Equipment) over the mouthparts. Adults were swabbed using three strokes on each of the digits, legs, and lateral and central vent area. Vinyl gloves were worn for handling and changed between individuals (Cashins et al. 2008). All individuals were released unharmed at their collection site. Swabs were store at room temperature until they were analysed by Taqman real-time PCR assay (Hyatt et al. 2007) at James Cook University and AHL, Launceston, or by conventional PCR assay (Pisces Laboratories, USA). Strict field hygiene procedures were followed to minimise anthropogenic pathogen spread between sites (Phillott et al. 2010). All gear and equipment was thoroughly cleaned and soaked for three minutes in 4 ml l–1 (1:250) F10 Super Concentrate Disinfectant between sites to ensure effective disinfection.
At each sampling site we recorded the following environmental characteristics: aquatic pH (Eutech pH Testr 30) and breeding habitat. We derived altitudes (m) from 1:25000 topographic and cadastral maps.
Predictive Bd modelling
Potential Bd distribution was modelled in MaxEnt which makes predictions from presence-only data. This avoids potential complications that may arise with false negatives. We used location records of Bd occurrence from our surveys (Table 1) and literature records combined with altitude and 19 climatic factors relating to temperature and rainfall to predict the distribution Bd in Tasmania. Layers consisting of altitude or single climatic factors were obtained at 30 s (±1km) resolution, downloaded from the WorldClim dataset (Adams et al. 2010; Skerratt et al. 2007) and cropped to only include Tasmania (S 39.27 - 43.90, E 143.60 – 148.70). We ran 100 replicates of the model, using 75% of the sampling sites (29 localities) as a model training dataset and the remaining 25% (9 localities) to test

19
the validity of the model (e.g. Daszak et al. 2004; Rollins-Smith et al. 2005). Based on these 100 models we calculated the mean and standard deviation for each grid-cell, which serve as a proxy for the likelihood of Bd occurrence in that cell and our confidence in that likelihood respectively. Values of 0.1 or greater represent the potential distribution of the species being modelled (Adams et al. 2010).
Statistical Analysis
We considered the effect that tadpole genus and surrounding habitat may have on the prevalence of Bd in areas where pathogen spread has occurred, through logistic regression analysis. Initially we fitted a full model including interaction. We then fitted models for each variable separately, to better guide the design of chytrid sampling to optimise the likelihood of detection when full information about site characteristics and genus present is not available.
We tested for the effect of altitude and pH on Bd presence in areas where Bd spread has occurred using student’s t-tests.
Results
We sampled 55 sites across Tasmania for the presence of Bd: 49 samples of tadpoles, six of adults and one of both (Appendix 1). Infection was found at 22 (40%) of these sites: 20 sites of tadpoles and two of adults, with Bd prevalence at positive sites varying from 5-100% (Appendix 1). One site (Low Head 2) changed from Bd negative to Bd positive during the course of the study.
The prevalence of Bd varied significantly across different habitat types in genus and species analyses in areas where pathogen spread has occurred. Prevalence was generally higher at forested sites (27-53%) and lower at heath sites (3-18%). Litoria was the most frequent genus sampled (n=363, 54%) followed by Limnodynastes (n=209, 31%), then Crinia (n=101, 15%) (Table 2). Tadpole genus and season sampled had no effect on prevalence.
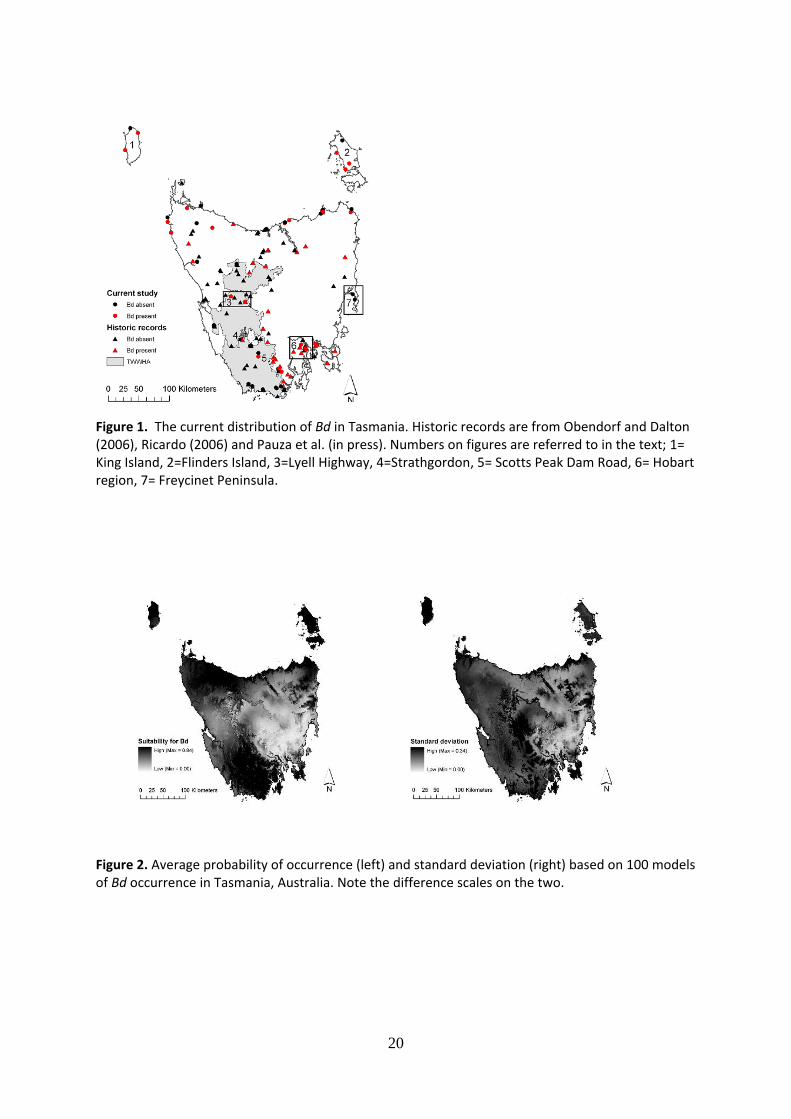
Bd distribution in Tasmania; current and predicted
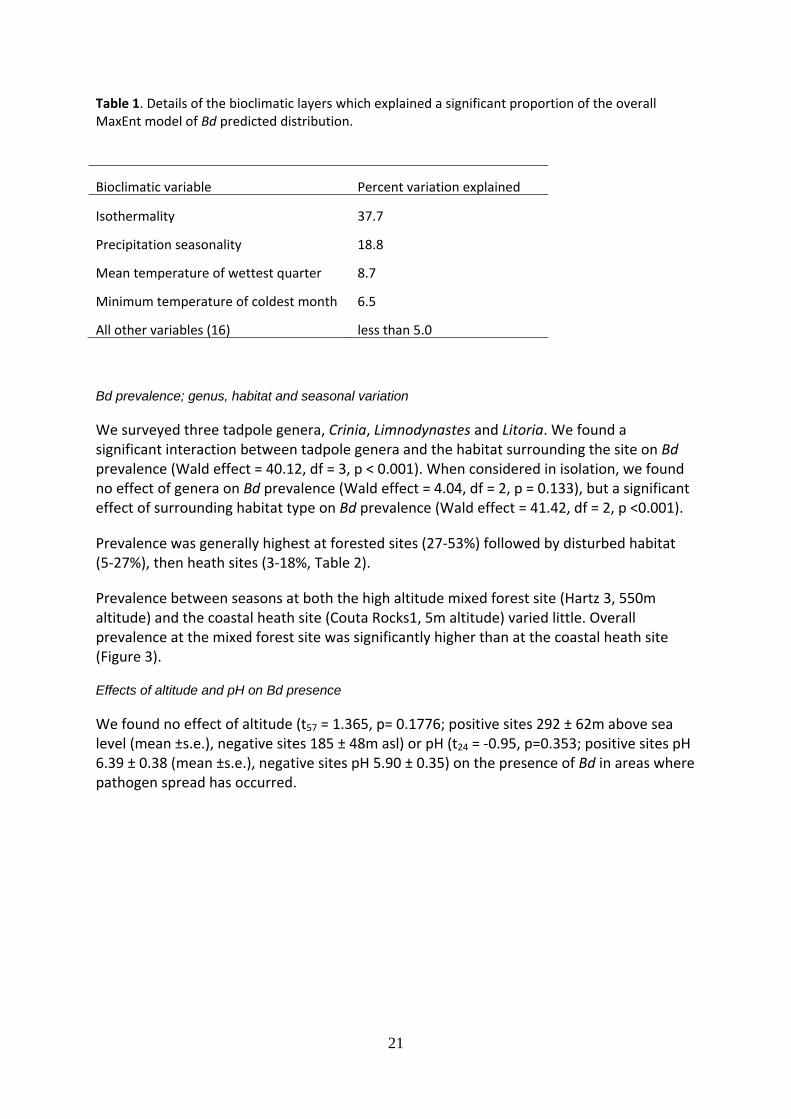
We found Bd to be widely distributed in Tasmania including Flinders and King Islands. We did not detect Bd in the Freycinet Peninsula or the TWWHA – except in some roadside ponds (Figure 1). Even within infected regions Bd is patchily distributed, with positive and negative sites often separated by small distances e.g. 85 m between Waterhouse 5 (Bd positive) and Waterhouse 2 (Bd negative). Based on these Bd positive locations, modelling suggests that most of Tasmania is environmentally suitable for Bd, including the TWWHA which is currently Bd negative (Figure 2). A large area in the central-east of Tasmania is predicted to be environmentally unsuitable for Bd with low average standard deviation, however we undertook no sampling in that area (Figure 2). Isothermality (37.7%) explained the most variation within the model, while precipitation seasonality (18.6%) was the only other variable which explained more than 10% of the variation (Table 1). Altitude accounted for only 3.8% of the variation in the model (data not shown).
20
Figure 1. The current distribution of Bd in Tasmania. Historic records are from Obendorf and Dalton (2006), Ricardo (2006) and Pauza et al. (in press). Numbers on figures are referred to in the text; 1= King Island, 2=Flinders Island, 3=Lyell Highway, 4=Strathgordon, 5= Scotts Peak Dam Road, 6= Hobart region, 7= Freycinet Peninsula.
Figure 2. Average probability of occurrence (left) and standard deviation (right) based on 100 models of Bd occurrence in Tasmania, Australia. Note the difference scales on the two.
21
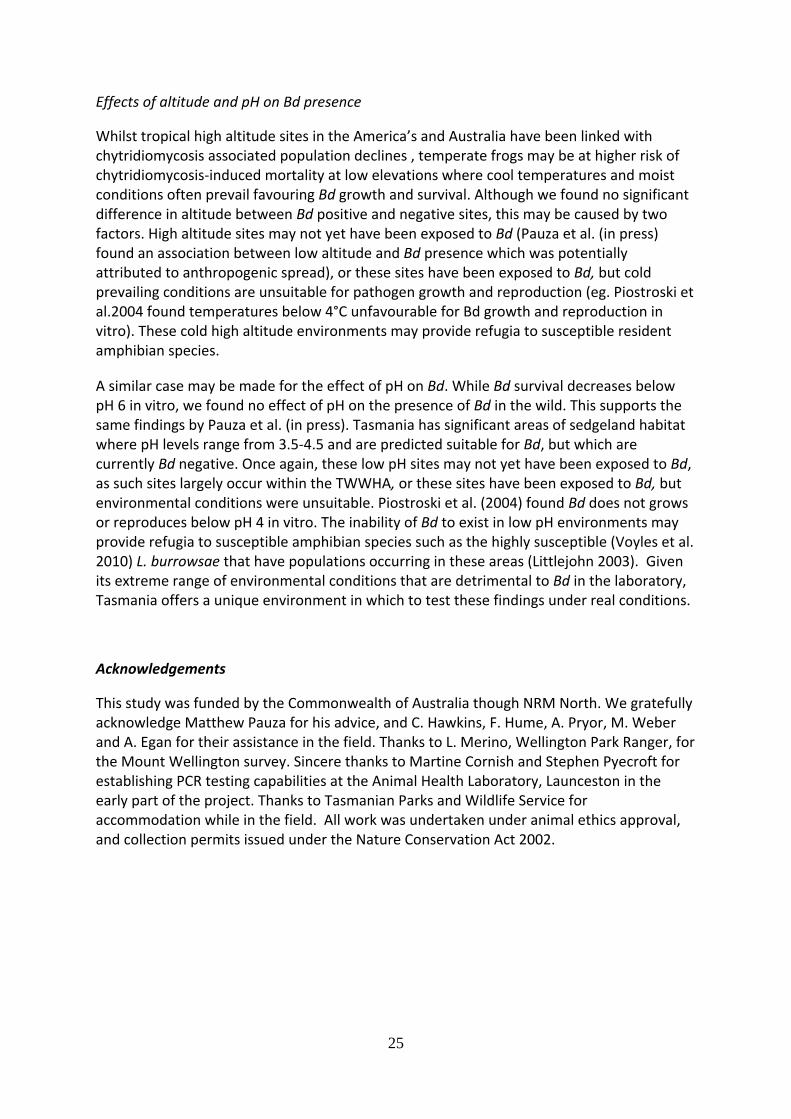
Table 1. Details of the bioclimatic layers which explained a significant proportion of the overall MaxEnt model of Bd predicted distribution.
Bioclimatic variable Percent variation explained
Isothermality 37.7
Precipitation seasonality 18.8
Mean temperature of wettest quarter 8.7
Minimum temperature of coldest month 6.5
All other variables (16) less than 5.0
Bd prevalence; genus, habitat and seasonal variation
We surveyed three tadpole genera, Crinia, Limnodynastes and Litoria. We found a significant interaction between tadpole genera and the habitat surrounding the site on Bd prevalence (Wald effect = 40.12, df = 3, p < 0.001). When considered in isolation, we found no effect of genera on Bd prevalence (Wald effect = 4.04, df = 2, p = 0.133), but a significant effect of surrounding habitat type on Bd prevalence (Wald effect = 41.42, df = 2, p <0.001).
Prevalence was generally highest at forested sites (27-53%) followed by disturbed habitat (5-27%), then heath sites (3-18%, Table 2).
Prevalence between seasons at both the high altitude mixed forest site (Hartz 3, 550m altitude) and the coastal heath site (Couta Rocks1, 5m altitude) varied little. Overall prevalence at the mixed forest site was significantly higher than at the coastal heath site (Figure 3).
Effects of altitude and pH on Bd presence
We found no effect of altitude (t57 = 1.365, p= 0.1776; positive sites 292 ± 62m above sea level (mean ±s.e.), negative sites 185 ± 48m asl) or pH (t24 = -0.95, p=0.353; positive sites pH 6.39 ± 0.38 (mean ±s.e.), negative sites pH 5.90 ± 0.35) on the presence of Bd in areas where pathogen spread has occurred.

22
Table 2. Prevalence of Bd in amphibian genera across different habitat types in areas where pathogen spread has occurred. Forest includes rainforest and sclerophyll forest, heath includes coastal, subalpine and sedgeland, disturbed includes pasture and built up areas.
Genus
n No. of
positives Prevalence (%) (95% CI)
pH range of positives
Altitudinal range of positives
Breeding habitat
Crinia
Permanent and ephemeral ponds
Forest 38 20 53 (36-69) no data 48-550
Heath 63 2 3 (0-11) 5.3-5.3 7-965
Total 101 22 22 (14-31) 5.3-5.3 7-965
Lymnodynastes Permanent and ephemeral ponds
Forest 26 10 27 (19-35) 5.3-5.4 36-38
Heath 52 4 8 (2-19) 5.1-8.2 8-13
Disturbed 131 35 27 (19-35) 4.5-8.3 8-51
Total 209 49 23 (18-30) 4.5-8.3 8-51
Litoria Permanent and ephemeral ponds
Forest 60 21 35 (23-48) 4.8-4.8 27-425
Heath 184 34 18 (13-25) 4.5-6.8 3-832
Disturbed 119 6 5 (2-11) 5.0-8.4 29-500
Total 363 61 17 (13-21) 4.5-8.4 3-832

23
Figure 3. Seasonal prevalence at a high altitude mixed forest site (Hartz 3, 550m altitude) and a
coastal heath site (Couta Rocks1, 5m altitude). Error bars around prevalence are 95% confidence
intervals. Note Couta Rocks 1 was not sampled in the autumn.
Discussion
Bd is currently distributed across much of Tasmania predominantly within areas associated with human activities and habitation (Figure 1), and including areas where both threatened amphibian species occur. Our study supports the finding of Pauza et al. (in press), that the TWWHA is largely free of Bd, although we did detect in the TWWHA at the margins in roadside ponds and it was previously recorded in the town of Strathgordon (Pauza et al. in press). Our modelling predicts that much of the TWWHA is highly suitable for pathogen occurrence (Figure 2). Prevalence in our study appears to be regulated by habitat type and associated environmental conditions rather than seasonality or the tadpole genus sampled.
Bd distribution in Tasmania; current and predicted
From its limited recorded distribution when first diagnosed in Tasmania (Obendorf and Dalton 2006), we found that Bd has spread across much of Tasmania. As has been found previously (Pauza et al. in press), we found Bd primarily occurs in areas associated with human activities and habitation, however our sampling was also biased towards these areas. Within infected areas we found Bd positive and negative sites in close proximity, supporting other studies which found that the pathogen does not generally appear to occupy every available site in regions where it occurs (Adams et al. 2010). This may be explained by variation in species susceptibility to chytridiomycosis, which may translate into variation in occurrence of Bd. Another possible explanation relates to the localised extent of human activities around a site that could serve as stressors or vectors (e.g. Woodhams et al. 2006). This heterogeneity in occurrence emphasises the benefits of strict hygiene protocols in areas which contain susceptible species, even if Bd is widely distributed in an area (Adams et al. 2010).
0
10
20
30
40
50
60
70
80
90
100
Spring Summer Autumn Winter
Bd
pre
vale
nce
(%
)
Season
Hartz 3
Couta Rocks 1

24
Modelling the potential extent of Bd is complementary to field surveys to determine current extent as this will highlight currently uninfected areas which have a high suitability for pathogen establishment. As currently Bd eradication is not possible once it has become established (Department of the Environment and Heritage 2006), effective biosecurity of identified Bd free areas is an important cost-effective method of conservation. We found Bd to be largely absent from the TWWHA, although this area is predicted to be highly suitable for pathogen occurrence (Figure 2). The TWWHA contains all three of Tasmania’s endemic species (Driessen and Mallick 2003) and is identified as a priority area for the implementation of biosecurity measures to minimise pathogen spread to at risk naive amphibian populations. Ideally, modelling of an area should use records from within the area being modelled as this may best account for local environmental conditions. A large area predicted to be Bd absent in the central east of the state was not sampled (Figures 1 and 2). This is likely to be an artefact of our biased spatial sampling despite the fact that our standard deviations for this area are small (Figure 2). This supports Murray et al. (in review) who found the whole of Tasmania including the central east to have high average environmental suitability for Bd.
Bd prevalence; genus, habitat and seasonal variation
Prevalence at Bd positive sites varied across the state from 5% to 100%, with the minimum prevalence recorded lower than the previous minimal estimate for Tasmania of 16% (Pauza et al. in press). This variation between studies may be explained by differences in sampling methods, or improvements in the detection of Bd. Variations between studies and within our study also reflect actual variations in prevalence across habitats and climatic conditions (e.g. McDonald et al. 2005; Lips et al. 2008). We found that Bd prevalence varies significantly across different habitat types with higher prevalences associated with forest sites compared to heath, while season and tadpole genus were associated with low variations in prevalence. This suggests that Bd prevalence in cool-temperate environments is regulated more by long-term environmental characteristics associated with particular habitat types than as a rapid response to short-term seasonal variation, or the genera sampled. This is in direct contrast to the findings of Kriger and Hero (2007) and Berger et al. (Piotrowski et al. 2004) who found that Bd had a highly seasonal variation in prevalence at sub-tropical and warm-temperate sites respectively. The significantly higher prevalence found at the cool high rainfall rainforest site compared with the warmer dryer coastal site is supported by other studies which have found these climatic variables explain similar variations in prevalence (Jarman et al. 1988). Variation in prevalence across habitat types informs future sampling methods and is also useful to guide management. As examples; forest habitats may be preferable for sampling to maximise pathogen detection rates, heath sites with low Bd prevalence may reduce the impact and increase survivability of translocated highly susceptible species compared to high prevalence forest sites.
Whilst prevalence is known to vary among adult amphibian species, fewer studies compare prevalence among tadpole species or genera. Minimal variation in Bd prevalence across Crinia, Limnodynastes and Litoria genera can be used to inform sampling methods. Tadpoles of these genera are comparable across sites within habitat types.
25
Effects of altitude and pH on Bd presence
Whilst tropical high altitude sites in the America’s and Australia have been linked with chytridiomycosis associated population declines , temperate frogs may be at higher risk of chytridiomycosis-induced mortality at low elevations where cool temperatures and moist conditions often prevail favouring Bd growth and survival. Although we found no significant difference in altitude between Bd positive and negative sites, this may be caused by two factors. High altitude sites may not yet have been exposed to Bd (Pauza et al. (in press) found an association between low altitude and Bd presence which was potentially attributed to anthropogenic spread), or these sites have been exposed to Bd, but cold prevailing conditions are unsuitable for pathogen growth and reproduction (eg. Piostroski et al.2004 found temperatures below 4°C unfavourable for Bd growth and reproduction in vitro). These cold high altitude environments may provide refugia to susceptible resident amphibian species.
A similar case may be made for the effect of pH on Bd. While Bd survival decreases below pH 6 in vitro, we found no effect of pH on the presence of Bd in the wild. This supports the same findings by Pauza et al. (in press). Tasmania has significant areas of sedgeland habitat where pH levels range from 3.5-4.5 and are predicted suitable for Bd, but which are currently Bd negative. Once again, these low pH sites may not yet have been exposed to Bd, as such sites largely occur within the TWWHA, or these sites have been exposed to Bd, but environmental conditions were unsuitable. Piostroski et al. (2004) found Bd does not grows or reproduces below pH 4 in vitro. The inability of Bd to exist in low pH environments may provide refugia to susceptible amphibian species such as the highly susceptible (Voyles et al. 2010) L. burrowsae that have populations occurring in these areas (Littlejohn 2003). Given its extreme range of environmental conditions that are detrimental to Bd in the laboratory, Tasmania offers a unique environment in which to test these findings under real conditions.
Acknowledgements
This study was funded by the Commonwealth of Australia though NRM North. We gratefully acknowledge Matthew Pauza for his advice, and C. Hawkins, F. Hume, A. Pryor, M. Weber and A. Egan for their assistance in the field. Thanks to L. Merino, Wellington Park Ranger, for the Mount Wellington survey. Sincere thanks to Martine Cornish and Stephen Pyecroft for establishing PCR testing capabilities at the Animal Health Laboratory, Launceston in the early part of the project. Thanks to Tasmanian Parks and Wildlife Service for accommodation while in the field. All work was undertaken under animal ethics approval, and collection permits issued under the Nature Conservation Act 2002.

26
Appendix
Table 1. Prevalence of Bd across all study sites. Locations and infection prevalence (95% Clopper-Pearson binomial confidence intervals) of all amphibians surveyed (tadpoles unless otherwise indicated).
Date Site Location
Easting Northing
No. Individuals
(No. Species)
Prevalence (%)
95% Confidence interval
26/02/2009 Bathurst Range
438312 5188218 22(2) 0* 0-13
16/12/2008 Birches Inlet 1 375397 5288112 20(1) 0* 0-17
11/02/2009 Birches Inlet 2 376192 5287073 20(1) 0* 0-17
15/10/2009 Couta Rocks 1 305350 5440026 21(2) 24 8-47
17/03/2009 Couta Rocks 2 305384 5439757 25(2) 16 5-36
4/12/2009 Cradle Mtn 412581 5388624 20(1) 0* 0-17
18/11/2009 Flinders Is. 1 585386 5590894 20(1) 0 0-17
19/11/2009 Flinders Is. 2 596675 5553148 20(1) 70 46-88
19/11/2009 Flinders Is. 3 590771 5543427 20(1) 15 3-38
18/11/2009 Flinders Is. 4 576318 5570642 20(1) 20 6-44
9/09/2009 Freycinet 1 605718 5330158 20(1) 0* 0-17
8/09/2009 Freycinet 2 602732 5338704 23(2) 0* 0-15
11/03/2009 Hartz 1 480988 5216729 34(2) 0 0-10
23/10/2009 Hartz 2 481385 5216147 5(2) 60 15-95
23/10/2009 Hartz 3 482313 5217083 20(1) 100 83-100
24/03/2009 Hartz 4 481560 5213103 20(1) 0 0-17
3/02/2009 Hartz 5 481472 5213721 20(1) 0 0-17
20/11/2008 Hawley House 461358 5445655 21(2) 5 0.1-24
25/07/2009 Hobart Airport 541555 5257257 1(1) adult 100 2.5-100
26/02/2009 Ironbounds 455479 5183097 1(1) adult 0* 0-98
25/11/2009 King Island 1 753738 5611239 22(2) 0 0-15
25/11/2009 King Island 2 250874 5603288 20(1) 5 0.1-25
26/11/2009 King Island 3 742713 5575902 20(1) 25 9-49
10/11/2009 Lake Pedder 1 436266 5254263 20(1) 0 0-17
17/11/2009 Lake Pedder 2 448053 5236706 20(1) 100 83-100
17/11/2009 Lake Pedder 3 447983 5242612 20(1) 0 0-17

27
10/11/2009 Lake Pedder 4 434649 5254370 20(1) 0 0-17
4/12/2008 Low Head 1 491783 5456695 20(1) 0* 0-17
20/01/2009 Low Head 2 498524 5460063 17(1) adults 0* 0-20
30/09/2009 Low Head 2 498524 5460063 20(1) 10 1-32
4/05/2009 Lune River 490904 5182347 20(1) 0 0-17
29/07/2009 Lyell Highway 1
403241 5335396 20(1) 5 0.1-25
29/07/2009 Lyell Highway 2
426053 5326354 6(1) 50 12-88
14/02/2009 Melaleuca 1 431867 5192020 20(1) 0* 0-17
12/02/2009 Melaleuca 2 432262 5191601 20(1) 0* 0-17
4/11/2009 Moonlight Ridge 1
485198 5187661 20(1) 0* 0-17
5/11/2009 Moonlight Ridge 2
478150 5184681 5(1) 0* 0-52
26/11/2009 Mt.Wellington 518118 5256395 20(1) 100 83-100
16/09/2009 Mt. William 1 600539 5478500 20(1) 0 0-17
18/09/2009 Mt. William 2 599387 5473403 20(1) 20 6-44
14/11/2008 Northwest 1 331334 5479865 10(1) 100 69-100
17/03/2009 Northwest 2 299549 5457470 2(1) 0 0-84
14/11/2008 Northwest 3 354135 5483904 20(1) 0 0-17
12/11/2008 Northwest 4 299440 5464711 20(1) 20 6-44
22/12/2009 Prospect House
534859 5268059 1(1) adult 0 0-98
8/04/2009 Savage River1 348023 5391934 21(1) 0 0-16
8/04/2009 Savage River2 347940 5391936 20(1) 0 0-17
8/04/2009 Savage River3 347815 5392062 20(2) 0 0-17
8/10/2009 Tarkine East 372710 5447834 20(1) 10 1-32
6/10/2009 Tarkine West 347229 5455316 20(1) 0* 0-17
17/12/2008 Waterhouse 1 550328 5470890 1(1) adult 0 0-98
6/01/2009 Waterhouse 2 554067 5473355 20(1) 0 0-17
7/01/2009 Waterhouse 3 553814 5476988 21(2) 0 0-16
6/01/2009 Waterhouse 4 553752 5477483 20(1) 0 0-17
16/12/2008 Waterhouse 5 553722 5474127 1(1) adult 100 2-100
26/11/2008 Waterhouse 6 552571 5475473 6(1) 100 54-100
Asterix (*) indicates Bd has not yet spread to areas containing these sites

28
Chapter 3. Assessing pathogen virulence and host susceptibility:
implications for risk assessment for chytridiomycosis management in
Tasmanian frogs
Jamie Voyles1*, Annie Philips1, David Wilson1, Michael Driessen1, Matthew Webb1, Lee Berger2, Katrina Harley3, Douglas C. Woodhams4, Kris Murray5, Lee Skerratt2
1. Department of Primary Industries, Parks, Water and Environment, 134 Macquarie St. Hobart, TAS 7000, Australia
2. School of Public Health, Tropical Medicine and Rehabilitation Sciences Amphibian Disease Ecology Group James Cook University, Townsville, QLD 4811, Australia.
3. Faculty of Veterinary Science, University of Sydney, NSW 2006, Australia
4.Institute of Evolutionary Biology and Environmental Studies, University of Zurich, Winterthurerstrasse 190, CH-8057 Zurich, Switzerland
5. The Ecology Centre, School of Biological Sciences, University of Queensland, Brisbane, QLD 4072, Australia
Introduction
Amphibians around the world are currently experiencing severe population declines such that they are considered to be in the most threatened class of vertebrates (Stuart et al. 2004; Skerratt et al. 2007). Some of the most serious declines are attributed to a lethal disease known as chytridiomycosis, which is caused by the fungal pathogen Batrachochytrium dendrobatidis (hereafter Bd) (Berger et al. 1998; Longcore et al. 1999).
Chytridiomycosis is considered an emerging infectious disease (EID), which is defined as a disease that has recently increased in incidence, impact or in geographic host range (Daszak et al. 2003). Initial outbreaks of chytridiomycosis are characterized by mass-mortality events that can occur in multiple species simultaneously (Lips et al. 2006; Woodhams et al. 2008). The long-term effects of chytridiomycosis differ among amphibian species and populations. Some populations persist through initial outbreaks and seem to recover despite the ongoing presence of Bd e.g. Litoria genimaculata (McDonald et al. 2005). In other cases, population sizes remain depressed e.g. Litoria lorica (Puschendorf 2010). Marked reduction in frog survival at least 30 years after pathogen establishment has been observed, suggesting that chytridiomycosis can remain virulent for long periods after initial outbreaks and could thus continue to limit population recovery (Murray et al. 2009; Murray et al. 2010).
Similar to other serious emerging infectious diseases that threaten population collapse and potentially extinctions e.g. bat white-nose syndrome (Blehert et al. 2009) or Devil Facial Tumour Disease (Jones et al. 2007), determining the most appropriate management strategies for chytridiomycosis is challenging, especially with limited time, information,

29
resources and few precedents of effective disease management. Among the more traditional options for disease management, such as disease suppression, vaccination and pathogen eradication, most are considered impractical e.g. eradication (Kriger and Hero 2009) or are currently unavailable e.g. vaccination (Stice and Briggs 2010) for wild amphibians for confronting chytridiomycosis. Nonetheless, first-step management protocols have been suggested to mitigate the threat of chytridiomycosis for amphibian conservation. These strategies include global disease surveillance (OIE 2008), containing the spread of Bd (Department of the Environment and Heritage 1996, Skerratt et al. 2007), establishing captive assurance programs (Mendelson III et al. 2005) that could select for disease resistance (Gascon et al. 2005), protecting natural disease refugia (Puschendorf et al. 2008), and promoting population recovery (Department of the Environment and Heritage 1996) with the use of in situ treatment regimes (Berger et al. in press) or anti-fungal agents in the field (Harris et al. 2009).
The successful implementation of many of these management approaches will hinge on our ability to identify amphibian species that are in the greatest need of conservation intervention. Several studies have used modelling approaches to help inform disease risk assessments (Ron 2005; Puschendorf et al. 2008; Rödder et al. 2009). Species distribution modelling approaches, for example, may help to identify relevant environmental parameters (such as temperature and precipitation) that govern Bd distribution (Ron 2005; Puschendorf et al. 2008; Rödder et al. 2009; Murray et al. in press), but they are broadly restricted to analysing patterns of pathogen occurrence, not the outcome of disease. Other analyses have focused on the ecological or life history traits that correlate with species’ declines (e.g. Lips et al. 2003). Bielby et al. (2008), for example, identified host traits that correlate with declines in Bd-positive species. More recently, studies have focused on integrating these separate data domains (pathogen distribution/environmental requirements and host life-history/ecology) for predicting species at risk of Bd infection (Murray and Skerratt in review) and for predicting declines amidst multiple threats including chytridiomycosis (Murray et al. in review). Thus, these analyses have resulted in more accurate risk assessments.
Although such modelling approaches may help to identify geographical regions and/or particular species (or groups of species) of concern, their use has some important limitations. First and foremost, they are correlative. They therefore have limited capacity to predict species’ inherent immunity to infection or disease development (Murray et al. in review). Furthermore, they do not take into account differential pathogenicity of Bd strains, which appears to be important for chytridiomycosis (Berger et al. 2005; Fisher et al. 2009). Thus, a more accurate risk assessment for a particular species will be a product of multiple epidemiological variables that are not currently captured by disease distribution modelling tools. Explicitly testing Bd pathogenicity and host susceptibility is therefore a critical step that will help to resolve the likelihood of mortality, and more importantly, the risk of population decline and extinction due to chytridiomycosis.
The herpetofauna of Tasmania provides an excellent model system to apply these principles and establish the most informed management scheme for chytridiomycosis. Tasmania is predicted to be highly suitable for the persistence of Bd within Australia, comparable to many parts of the eastern and southern seaboards where declines and extinctions have occurred (Murray et al. 2010). Optimal habitats for Bd were identified in the southeast,

30
north, and northeast regions, and King Island (Murray et al. in review). Infected amphibians have been detected in some, but not all, of these areas: around the Tasmanian central plateau, eastern and northern coasts, and near Hobart (Obendorf and Dalton 2006; Pauza et al. in press). The Tasmania Wilderness World Heritage Area (TWWHA), which provides core habitat for three of Tasmania’s endemic species (Driessen and Mallick 2003), appeared to be largely free of Bd in an exploratory survey (Pauza et al. in press). It is possible that Bd has simply not yet dispersed to these regions. These findings suggest that there is an opportunity to establish management priorities and implement conservation efforts to abate the threat of severe decline in Tasmanian amphibians, especially in the TWWHA. Our objectives were to 1) identify target species and populations of concern, 2) determine current infection statuses, 3) test the relative pathogenicity of a regional Bd isolate endemic to the region, and 4) determine the relative susceptibility of key Tasmanian species.
Materials and methods
IDENTIFYING TARGET SPECIES AND POPULATIONS
Of the 11 species that are found in Tasmania, we identified a subset of species and populations for an intensive investigation on chytridiomycosis. Our species ‘short list’ integrated information from multiple sources: species endemism, current conservation status, previous studies on host susceptibility, anecdotal evidence of amphibian declines (both in Tasmania and on mainland Australia), and predictive models on species susceptibility (Murray et al. in review). These models also guided our selection of geographical regions and amphibian populations of interest.
Species endemism and conservation status are exceptionally important criteria (Skerratt et al. 2008) and therefore, we prioritized endemic (Litoria burrowsae, Crinia tasmaniensis, Bryobatrachus nimbus) and amphibian species that are listed as vulnerable/endangered (Litoria raniformis, Limnodynastes peronii respectively; Tasmanian Threatened Species Protection Act 1995). Predictive models based on potential host exposure (i.e. an overlap in predicted environmental suitability for Bd and host species distributions), and host life-history and ecological traits, identified other important species for testing (Geocrinia laevis and Pseudophryne semimarmorata; Murray & Skerratt in review). Unfortunately, these species, along with two of the endemic species (Crinia tasmaniensis and Bryobatrachus nimbus), are highly cryptic and we were unable to find a sufficient number of individuals for testing.
We also considered species for which previous studies indicated that the impact of chytridiomycosis is likely to be negligible. For example, a group of Limnodynastes tasmaniensis frogs were unaffected in an exposure experiments (Woodhams et al. 2007) and some species are still widespread and highly abundant despite Bd-infection (Litoria ewingii, Limnodynastes dumerilii, Crinia signifera; Obendorf & Dalton 2006). Distinguishing species that could be less susceptible to chytridiomycosis is important for identifying potential Bd-carriers i.e. vector or reservoir species; (Daszak et al. 2004), but we excluded these species for laboratory testing. In summary, we collected information on current and past infection status of multiple populations and performed a laboratory experiment, for the following target species: Litoria burrowsae, Litoria raniformis and Limnodynastes peronii.
31
Striped marsh frogs (Limnodynastes peronii) inhabit moist wetlands and open forests on the north coast and on King Island. We swabbed larval and adult L. peronii populations in eight locations in Northwest Tasmania and on King Island. Green and gold frogs (Litoria raniformis) are found in woodland habitats with permanent ponds, vegetated swamps and also in disturbed areas such as dams. We swabbed L. raniformis adults at three sites on the north coast and around Hobart. Tasmanian tree frogs (Litoria burrowsae) inhabit rainforest, sedgeland, moorland and buttongrass plains and breed in permanent water bodies, ponds and dams. They are distributed across the TWWHA in the west and southwest regions of Tasmania. We swabbed larval and adult Tasmanian tree frogs at 11 sites within or near the TWWHA.
CURRENT INFECTION STATUS OF WILD POPULATIONS
Historical records of species occurrence provided a base set of sampling sites (Natural Values Atlas, www.naturalvaluesatlas.tas.gov.au; Figure 1). Sampling was conducted in summer months, November to January, 2008 and 2009, when we had the greatest chance of detecting amphibian larvae and adults. Visual and aural surveys were conducted to detect a species within a site. Dip netting and trapping techniques were used to catch amphibian larvae, which is the life stage thought to have a greater likelihood of detecting Bd infection (Skerratt et al. 2008). We aimed to collect samples from 20 individual tadpoles per species within a site. We recorded sites where we could confirm species presence (by visual or aural surveys) even if no tadpoles could be found. Dead adult frogs were collected if encountered and processed for histopathology (as above).
Swab samples for quantitative polymerase chain reaction (qPCR) were obtained by rubbing a sterile cotton swab over the ventral surfaces and digits of adults (Hyatt et al. 2007) and the mouthparts of amphibian larvae. Diagnosis of Bd infection status was performed by Taqman real-time PCR assay (Boyle et al. 2004; Hyatt et al. 2007). All samples were analysed in triplicate and compared with CSIRO-Australian Animal Health Laboratory (AAHL) zoospore standards to determine zoospore equivalents (Hyatt et al. 2007) at Department of Primary Industries, Parks, Water and Environment (DPIPWE) Mt. Pleasant Laboratories, Tasmania.
Tissue samples for histopathology were collected from dead frogs (Limnodynastes peronii brought into the laboratory and dead adult frogs encountered in the field). One small (1-2 mm2) skin biopsy was collected from the ventral abdominal region (2-3 cm lateral to midline), an anatomical location with the greatest likelihood of finding Bd (Berger et al. 2005; Puschendorf and Bolaños 2006), fixed in 10% buffered neutral formalin, embedded in paraffin, sectioned and stained with haematoxylin and eosin using routine histological techniques (Humason 1967; Berger et al. 2002). Skin tissues were examined for the presence of Bd zoosporangia and for epidermal lesions such as spongiosis, irregular epidermal layers and hyperkeratosis.
OBTAINING A LOCAL BD ISOLATE
Isolate CoutaRocks-L.peronii-09-LB-P3 was obtained from a diseased larval Limnodynastes peronii found at Couta Rocks, Tasmania. This isolate was purified and cultured on tryptone/gelatin hydrolysate/lactose (TGhL) agar with antibiotics, and then passaged into liquid TGhL broth (Longcore et al. 1999) in 25-cm2 cell culture flasks. Cultures were

32
maintained at James Cook University in TGhL broth at 4°C until they were transported to DPIPWE Newtown Laboratories, Tasmania, Australia, where they were maintained at 23°C and passaged every 4-7 days.
SURVIVAL AND INFECTION INTENSITY FOLLOWING EXPERIMENTAL INOCULATIONS
We collected four amphibian species for exposure experiments: the three Tasmanian species described above and one species known to be highly susceptible to chytridiomycosis (Litoria caerulea; Berger et al. 2005), which was used as a positive control. Frog collections occurred in January and February 2009. Each animal was collected by hand using clean vinyl gloves, transferred to an individual plastic container (200x240x330 mm3) and transported to temperature (18-23ºC) and light (12L/12D) controlled facilities. Larval L. peronii (n = 26) were collected from Tasmania’s northwest coast. Adult L. raniformis (n = 24, mean mass: 28.67 g ± 6.65 SD) were collected from Lower Head in northeast Tasmania. Adult L. burrowsae (n = 6, mean mass: 19.25 g ± 8.1 s.d.) were collected near Melaleuca in the TWWHA. Adult L. caerulea (n = 19, mean mass: 43.71 g ± 7.7 s.d.) were collected from residential areas of Townsville, Queensland.
We generally followed protocols outlined for other exposure experiments (Berger et al. 2005; Voyles et al. 2009). Frogs were fed vitamin-dusted crickets (medium-sized, Pisces Enterprises, Kenmore, Australia) ad libitum and tap water (250 ml) was changed twice per week. Frogs were randomly assigned to exposure and control groups. Exposure solutions consisted of Bd zoospores in a dilute salt solution and 20% Holtfretter’s solution. Zoospores were harvested by filtering liquid cultures through sterile filter paper to remove sporangia. Zoospore concentrations were determined using a haemocytometer (Improved Neubauer Bright-line, Hausser Scientific, PA, USA) and the concentration was adjusted as needed by addition of dilute salt solution (in mMol: KH2PO4 1.0, CaCl2.H2O 0.2, MgCl2.2H2O 0.1). Frogs were exposed to Bd zoospores in plastic containers via shallow immersion in a bath of the exposure solution. Frogs in exposure groups were held in round plastic containers (diameter- 12 cm x 6.5 cm) in a bath solution (20% Holtfretter’s solution) inoculated with 1.5 x 10⁶ Bd zoospores. Uninfected control frogs were held in a bath of Holtfretter’s solution with equal quantities of added dilute salt solution collected from sterile TGhL without Bd. After 24 h frogs were moved to fresh containers with 20% Holtfretter’s solution (250 ml, pH 6.5), which was replaced with tap water (250 ml) after three days. Frogs were also checked for changes in behaviour and clinical signs of chytridiomycosis (Voyles et al. 2009).
We used a Mantel-Cox logrank test for censored survival data (SPSS Statistics 17.0, SPSS Inc., Chicago, Illinois) to analyse survival curves in exposure experiments. To evaluate other parameters such as mass, body condition and intensity of infection we first tested for normality (Shapiro-Wilk’s test) and homogeneity of variance (Levene’s test). Nonparametric tests (Mann Whitney and Kruskal-Wallis tests) were used when the assumptions of parametric tests were violated and could not be corrected by transformation. The results for PCR were log-transformed prior to statistical tests.
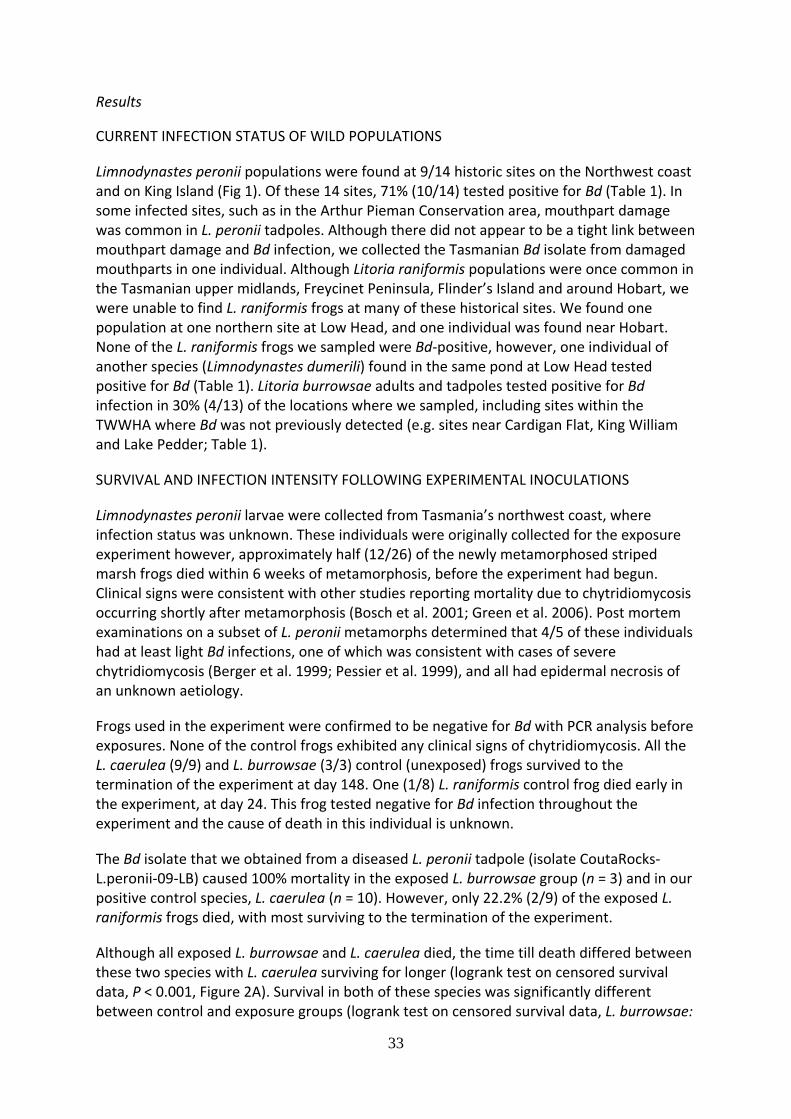
33
Results
CURRENT INFECTION STATUS OF WILD POPULATIONS
Limnodynastes peronii populations were found at 9/14 historic sites on the Northwest coast and on King Island (Fig 1). Of these 14 sites, 71% (10/14) tested positive for Bd (Table 1). In some infected sites, such as in the Arthur Pieman Conservation area, mouthpart damage was common in L. peronii tadpoles. Although there did not appear to be a tight link between mouthpart damage and Bd infection, we collected the Tasmanian Bd isolate from damaged mouthparts in one individual. Although Litoria raniformis populations were once common in the Tasmanian upper midlands, Freycinet Peninsula, Flinder’s Island and around Hobart, we were unable to find L. raniformis frogs at many of these historical sites. We found one population at one northern site at Low Head, and one individual was found near Hobart. None of the L. raniformis frogs we sampled were Bd-positive, however, one individual of another species (Limnodynastes dumerili) found in the same pond at Low Head tested positive for Bd (Table 1). Litoria burrowsae adults and tadpoles tested positive for Bd infection in 30% (4/13) of the locations where we sampled, including sites within the TWWHA where Bd was not previously detected (e.g. sites near Cardigan Flat, King William and Lake Pedder; Table 1).
SURVIVAL AND INFECTION INTENSITY FOLLOWING EXPERIMENTAL INOCULATIONS
Limnodynastes peronii larvae were collected from Tasmania’s northwest coast, where infection status was unknown. These individuals were originally collected for the exposure experiment however, approximately half (12/26) of the newly metamorphosed striped marsh frogs died within 6 weeks of metamorphosis, before the experiment had begun. Clinical signs were consistent with other studies reporting mortality due to chytridiomycosis occurring shortly after metamorphosis (Bosch et al. 2001; Green et al. 2006). Post mortem examinations on a subset of L. peronii metamorphs determined that 4/5 of these individuals had at least light Bd infections, one of which was consistent with cases of severe chytridiomycosis (Berger et al. 1999; Pessier et al. 1999), and all had epidermal necrosis of an unknown aetiology.
Frogs used in the experiment were confirmed to be negative for Bd with PCR analysis before exposures. None of the control frogs exhibited any clinical signs of chytridiomycosis. All the L. caerulea (9/9) and L. burrowsae (3/3) control (unexposed) frogs survived to the termination of the experiment at day 148. One (1/8) L. raniformis control frog died early in the experiment, at day 24. This frog tested negative for Bd infection throughout the experiment and the cause of death in this individual is unknown.
The Bd isolate that we obtained from a diseased L. peronii tadpole (isolate CoutaRocks-L.peronii-09-LB) caused 100% mortality in the exposed L. burrowsae group (n = 3) and in our positive control species, L. caerulea (n = 10). However, only 22.2% (2/9) of the exposed L. raniformis frogs died, with most surviving to the termination of the experiment.
Although all exposed L. burrowsae and L. caerulea died, the time till death differed between these two species with L. caerulea surviving for longer (logrank test on censored survival data, P < 0.001, Figure 2A). Survival in both of these species was significantly different between control and exposure groups (logrank test on censored survival data, L. burrowsae:

34
P = 0.03; L. caerulea: P < 0.001; Figure 2A). Survival for L. raniformis was not significantly different between control and exposure groups (logrank test on censored survival data, P = 0.281).
Infection intensities were measured in groups that were exposed to Bd at death or at the termination of the experiment for those frogs that survived. Zoospore equivalents (Bd-loads) were significantly different among species (Kruskal-Wallis, P < 0.001). The L. raniformis group had significantly lower Bd-loads than the L. caerulea group (logrank test, P < 0.001) and the L. burrowsae group (logrank test, P = 0.03; Figure 2B).
Field and laboratory results were integrated into a database that combines information available information on Bd in Tasmania, target species conservation status, predictive models on host-pathogen overlap, target species distributions, ecological traits (Murray & Skerratt in press) and risk assessment was generated to prioritise Tasmanian species at risk of decline due to chytridiomycosis (Table 2).
Discussion
Although we were unable to perform controlled exposure experiments on L. peronii, several pieces of evidence indicate that Bd virulence may be high in L. peronii populations. First, individuals that were brought into the laboratory for susceptibility testing experienced high levels of mortality at metamorphosis, some with epidermal changes consistent with severe chytridiomycosis. Second, the isolate collected from a diseased L. peronii tadpole was highly pathogenic to other species of frogs, inducing 100% mortality in L. burrowsae and L. caerulea frogs (Fig 3). However, in wild populations of this species we were unable to detect a contraction in its range despite chytrid occurring widely within the species’ range; and L. peronii occurs in high abundance in infected areas. Additional surveys for host (including mark-recapture) and pathogen (including seasonal prevalence and intensity of infection estimates) are needed to determine the impact of chytridiomycosis on wild L. peronii populations in Tasmania (Murray et al. in review).
Field sampling indicated that populations of L. raniformis frogs are persisting in northern Tasmania and one population near Hobart. However, we found no L. raniformis frogs in historic sites on Tasmania’s east coast (2 sites on Freycinet Peninsula) or on Flinder’s Island (4 sites). The underlying reasons for these findings are not entirely clear. Our surveys could have missed L. raniformis populations if frogs were inactive due to unsuitable environmental conditions (e.g. temperature, humidity or rainfall). Alternatively, the possibility that this species has suffered a considerable range contraction and the loss of L. raniformis populations is far more concerning and, moreover, agrees with the assertions of species status assessments (Tasmanian Threatened Species Protection Act 1995). Extensive monitoring projects, including detectability analyses that incorporate environmental conditions, are urgently needed to distinguish between these two possibilities.
The role of Bd in a putative loss of L. raniformis populations is unclear. We found that the extant L. raniformis populations in the northwest were not Bd-infected, despite results that indicate that the site is positive. Additionally, in our susceptibility trials L. raniformis frogs became infected, but only a small proportion of infected frogs developed fatal chytridiomycosis (Fig 3). These results suggest that L. raniformis frogs, at least those frogs from populations in northern Tasmania, are not highly susceptible to chytridiomycosis.

35
Resistance may have evolved in populations that survived an initial decline, or they may be an inherently less susceptible species. Considering that these frogs are often found in very disturbed areas, we suggest that evaluating other threatening processes, such as habitat degradation, should be a high priority for this species throughout their historic range.
Our field study results generally agree with Pauza et al. (in press) that the TWWHA, which roughly corresponds with the L. burrowsae distribution, is largely free of Bd. However, finding another two Bd-infected frog populations at two sites just inside TWWHA, at Lake Pedder and Cardigan Flat, suggests the disease may be spreading into the TWWHA. Our susceptibility trials demonstrate that L. burrowsae frogs are likely to be highly susceptible to chytridiomycosis. Individuals exposed to Bd sustained high intensities of infection (Fig. 3B), 100% mortality rate (Fig 3A) and died sooner than exposed L. caerulea, which is generally considered to be a highly susceptible species. Therefore, we suggest that the L. burrowsae populations along the eastern edge of the TWWHA, especially those populations in areas where Bd has been detected, should be a top priority for continued monitoring and focused investigations on chytridiomycosis.
These results are not comprehensive in that they do not address all species nor all threatening processes within Tasmania, but our study does provide a best estimate of the threat of chytridiomycosis where no information was previously available. We can make a crucial first step in chytridiomycosis mitigation: directing resources towards the most susceptible amphibians. For example, we recommend that further research on chytridiomycosis be directed towards L. burrowsae, especially those populations along the edges of the TWWHA, and L. peronii. Management schemes for target populations should include a continuous monitoring plan with multiple components; improved aural and/or visual surveys for detecting frogs with a high degree of confidence, regular screening for Bd infections in both the tadpole and adult life stages, and disease surveillance of sympatric species. Such monitoring programs could be structured to act as ‘triggers’ for further intervention. Because any effective emergency conservation measure is likely to be costly and difficult to implement, the management of declining species should be outlined a priori. For example, additional conservation actions for naïve L. burrowsae populations could include validating in situ treatment regimes in the event of a chytridiomycosis outbreak and ex situ husbandry programs to enable survival assurance captive management options.
In addition to further investigations on chytridiomycosis for L. burrowsae and L. peronii, we suggest that disease research continue for other species that could not be included in the present study and for which we have limited information: Geocrinia laevis, Pseudophryne semimarmorata, Crinia tasmaniensis and Bryobatrachus nimbus. Because B. nimbus is an unusual and endemic species with a small montane range, determining its susceptibility is a high priority. Additionally, many B. nimbus populations are found in some of the same geographical regions as L. burrowsae and could be incorporated into intervention programs for chytridiomycosis, creating a more holistic management approach for all Tasmanian amphibians.
This study offers a model approach that can be applied to other amphibian disease research programs to make a seemingly intractable problem approachable for amphibian researchers around the world. We show how to apply the best available knowledge on the disease ecology of chytridiomycosis to 1) determine the disease risk and 2) direct more informed

36
research and management schemes. Because this process targets important factors in the host-pathogen dynamic, it can be used widely to assess the disease risk for amphibians in specific regions.
Within a given region, models of predicted host susceptibility and pathogen distributions can point to geographical regions and/or species of concern (see Lips et al. 2003; Ron 2005; Bielby et al. 2008; Puschendorf et al. 2008; Rödder et al. 2009). Field surveys in these areas, using survey protocols that maximise the likelihood of detecting Bd (Skerratt et al. 2008), should indicate presence or absence of Bd with some degree of confidence. Determining infection status of amphibian populations is pivotal; subsequent research and management responses for naïve populations will differ from those for populations where Bd is endemic. In amphibian populations where Bd is endemic, mark-recapture studies (e.g. Murray et al. 2009) can help determine if Bd continues to impact the population. In naïve populations, susceptibility trials for chytridiomycosis should provide a more accurate assessment of disease risk. For example, our study demonstrates how susceptibility trials can inform the process of prioritisation of susceptible species (e.g. L. burrowsae frogs will require different management approaches compared to L. raniformis frogs).
The global loss of amphibian biodiversity has been called “the greatest species conservation challenge in the history of humanity” (Zippel and Mendelson III 2008) and chytridiomycosis is an important, but not the only, contributing factor. Although habitat degradation and destruction are most probably contributing to population decline and loss, we focused on assessing the threat of chytridiomycosis for Tasmanian amphibians. With our risk assessment approach, Tasmanian conservation programs will be better prepared for an outbreak of chytridiomycosis in naïve populations and may be able to facilitate recovery in already infected populations. This approach will useful for guiding effective preparatory action plans for chytridiomycosis in other parts of the world.
Acknowledgements
The project was funded by the Australian Government through NRM North and by the Tasmanian and Australian governments through the Tasmanian Wilderness World Heritage Area fauna program. D.C.W. is supported by the Swiss National Science Foundation (31-125099).We thank David Obendorf, Matine Cornish, Bruce Jackson, Carryn Manicom, Matt Pauza, Sarah Peck, Stephen Garland, Graeme Knowles, David Hunter, Rick Speare and Stephen Pyecroft who all assisted in various ways throughout the project.

37
Figure 1. Sites and species sampled in Tasmania
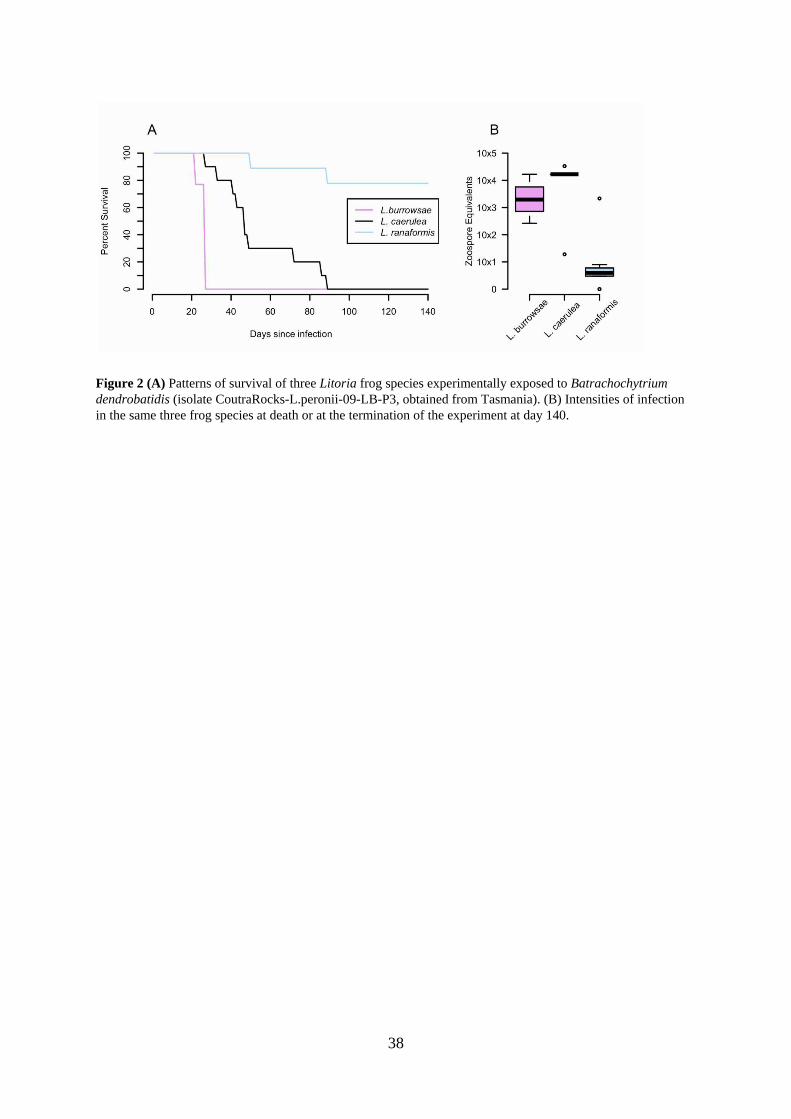
38
Figure 2 (A) Patterns of survival of three Litoria frog species experimentally exposed to Batrachochytrium
dendrobatidis (isolate CoutraRocks-L.peronii-09-LB-P3, obtained from Tasmania). (B) Intensities of infection
in the same three frog species at death or at the termination of the experiment at day 140.

39
Chapter 4. Retrospective analysis of museum frogs for
chytridiomycosis
Katrina Stewart
Veterinary Student, University of Sydney
Introduction
Chytridiomycosis is caused by B. dendrobatidis, a non-hyphal zoosporic chytrid fungus
(phylum Chytridiomycota, class Chytridiomycetes, order Chytridiales). Keratinised cells of
the amphibian epidermis are the site of chytrid infection. Larval and post-metamorphic
amphibians may be infected. Gross lesions are subtle although reports may occur of
abnormal epidermal sloughing in clinical examinations of dead or dying post-metamorphic
animals. At histologic examination irregular cell loss, erosions and segments of markedly
thickened stratum corneum containing chytrid thalli or zoosporangia are diagnostic. The life
cycle and physiology of B. dendrobatidis, as well as its survival in the wild or factors that may
precipitate amphibian casualties is largely unknown. Zoospores have been shown to survive
up to 7 weeks in water in the absence of an amphibian host .
Zoospores infect only keratinocytes and there is minimal inflammatory response in the skin.
No consistent histologic findings other than skin lesions have been observed. As yet the
mechanism by which chytridiomycosis becomes a fatal infection is still unknown. Infection
in tadpoles is restricted to the keratinised mouthparts but is not associated with illness or
mortality.
Histologic changes associated with chytrid infections are expected to be mild, including
multifocal parakeratotic hyperkeratosis (thickening of the stratum corneum) and acanthosis
(thickening of the stratum spinosum). In the stratum corneum, the chytrid is roughly
spherical with a discharge papilla projecting from the surface. This overall structure is called
a zoosporangium. Zoospores that develop in the zoosporangium escape through the open
discharge tube. The wall of the zoosporangium is smooth on outer and inner surfaces and
very uniform in thickness. Its staining characteristics vary from eosinophilic to slightly
basophilic or refractile. Variable amounts of keratin may closely surround the organism.
The contents of the zoosporangia vary with the developmental stages of the chytrid. On
histological section four stages can be identified. The earliest stage contains a central mass
which is basophilic and roughly spherical or oval. The mass is fairly homogenous in staining
characteristics. The mass divides to form zoospores. Zoospores are basophilic and appear in

40
cross section as round or oval bodies often with poorly defined margins, numbering about
4-10 depending on the plane of section. Once the zoospores are released via the discharge
papilla, the zoosporangium is empty and retains its spherical shape. In some empty stages
thin septae may divide the zoosporangium into internal compartments. The next stage is
collapse of the empty zoosporangium into an irregular shape. The empty shell may become
colonised by bacteria, seen in section as basophilic rods or cocci inside the ‘empty’
zoosporangium.
In frogs with terminal chytridiomycosis, large numbers of bacteria may be seen between
layers of sloughing keratin. Empty zoosporangia are the most common stage present
especially in the sloughing surface layer. In fact sloughed skin is a useful place to look for
evidence of chytridiomycosis.
This project aims to detect evidence of chytrid infection in frog specimens held in museum
collections at both the Queen Victoria Museum and Art Gallery, Launceston and the
Tasmanian Museum and Art Gallery, Hobart.
Methods
A 2mm skin biopsy was removed from the pelvic patch of museum specimens and examined
by light microscopy. The region sampled was chosen due to the higher likelihood of finding
disease in this region observed in previous studies.
Results
I found two specimens that show characteristics consistent with Bd from the forty six frogs
sampled.
Sample one (Figure 1) displayed hyperplasia of the epidermis underlying what appears to be
a small number of zoosporangia (approx 4) containing zoospores. The epithelia of blood
vessels underlying the lesion appear plump. This sample was sourced from a Limnodynastes
peronii specimen collected in 1997 near Stanley, NE Tasmania.
Sample two (Figure 2) did not display any increased cellularity of the underlying epidermis,
however a number of zoosporangia were observed within the keratinised stratum corneum.
This sample was from a Limnodynastes tasmaniensis specimen from Hobart Airport, date
unknown (Figure 3).
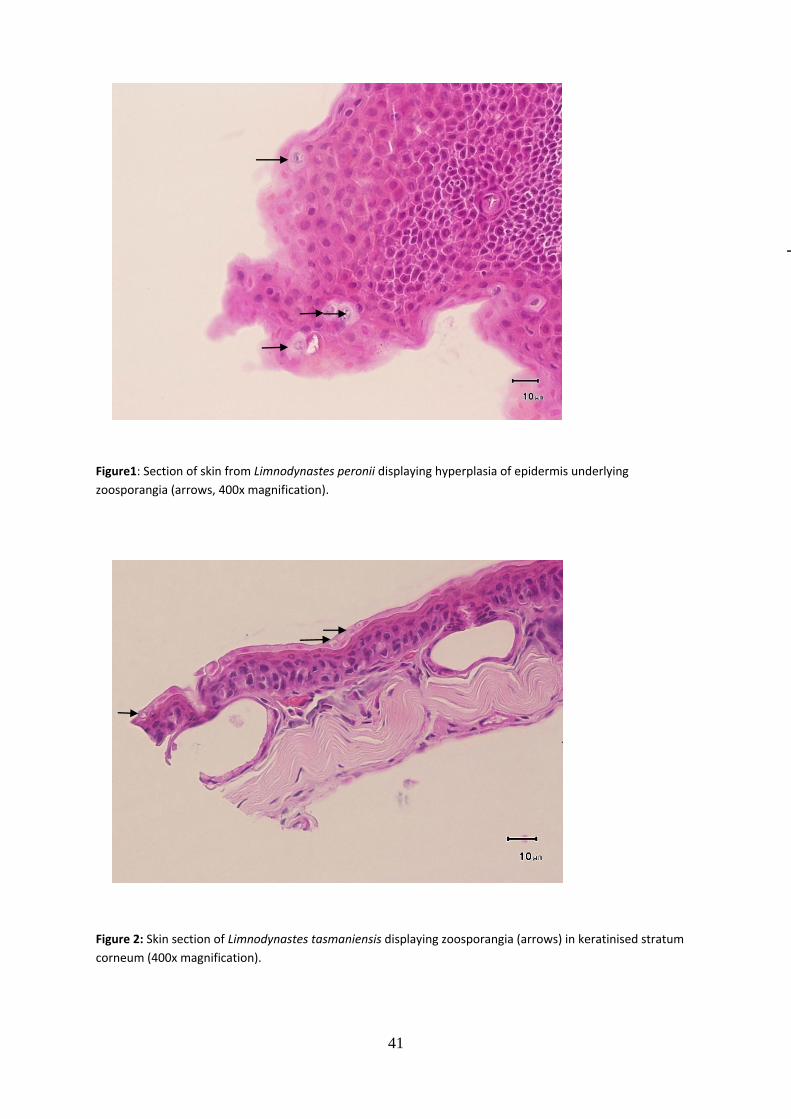
41
Figure1: Section of skin from Limnodynastes peronii displaying hyperplasia of epidermis underlying
zoosporangia (arrows, 400x magnification).
Figure 2: Skin section of Limnodynastes tasmaniensis displaying zoosporangia (arrows) in keratinised stratum
corneum (400x magnification).

42
Both these samples were sent to Lee Berger (James Cook University) for further analysis and
found to not be infected with Bd. Thus no frogs lodged with the Queen Victoria Museum
and Art Gallery, Launceston or the Tasmanian Museum and Art Gallery, Hobart were
infected with the chytrid fungus.
Discussion
The known distribution of chytridiomycosis within Tasmania is important to assess both
historically and currently for its management implications. The importance of the disease
particularly related to endemic and threatened species of frog and the relationship with the
TWWHA and other National Park sites cannot be underestimated.
Historical evidence from national and international data suggests chytridiomycosis is related
to multiple mass amphibian mortality events and species decline. Since both the Green and
Gold Frog and the Striped Marsh Frog are listed as threatened on the Tasmanian Threatened
Species Act 1995 it would be irresponsible to ignore the threat of chytridiomycosis on
potentially naïve populations. This is particularly true of those populations with restricted
distributions including the three endemic Tasmanian species, the Moss Froglet, Tasmanian
Tree Frog and Tasmanian Froglet, the bulk of whose distribution is within the TWWHA.
Previous data suggests that anthropogenic factors may play an important role in chytrid
spread, as such the DPIPWE has produced a pamphlet outlining the threat of chytrid and
how the spread can be limited.
Since museum specimens were not collected for reasons of ill health of the animals it is
expected that any histologic changes observed will be mild. Considering also that a very
small specimen was collected from a single site on the frog, it would not have been unusual
to find no abnormalities.
The importance of this study in looking at both historical data and current disease status at
key sites within Tasmania has implications for management, particularly within and around
the TWWHA. My role in collecting and analysing historic samples acts as a starting point for
contemporary data collection with a view to analysing disease dynamics at key sites within
Tasmania.