chromium - usgs mineral resources program€¦ · chromium—2000 18.1 chromium by john f. papp...
TRANSCRIPT
CHROMIUM—2000 18.1
CHROMIUM
By John F. Papp
Domestic survey data and tables were prepared by Joseph M. Krisanda, statistical assistant, and the world production
tables were prepared by Ronald L. Hatch and Glenn J. Wallace, international data coordinators.
In 2000, the U.S. chromium supply (measured in contained
chromium) was 139,000 metric tons (t) from recycled stainless
steel scrap; 453,000 t from imports; and 924,000 t from
Government and industry stocks. Supply distribution was
86,300 t to exports; 840,000 t to Government and industry
stocks; and 589,000 t to apparent consumption. Chromium
apparent consumption increased by 5.63% compared with that
of 1999.
Legislation and Government Programs
The Department of Health and Human Services (HHS)
updated the toxicological profile for chromium. HHS revises
and republishes toxicological profiles as necessary, but no less
than once every 3 years. The profiles are prepared for health
professionals and report toxicologic and health effect
information (Syracuse Research Corp., 2000).
The Defense Logistics Agency (DLA) disposed of chromium
materials under its fiscal year (FY) 2000 (October 1, 1999,
through September 30, 2000) Annual Materials Plan (AMP).
DLA’s FY 2000 AMP (as revised in April) set maximum
disposal goals for chromium materials at 90,700 t of chemical
grade chromite ore, 227,000 t of metallurgical grade chromite
ore, 90,700 t of refractory grade chromite ore, 136,000 t of
chromium ferroalloys, and 454 t of chromium metal. DLA also
developed its FY 2001 AMP, which set maximum disposal goals
of 90,700 t of chemical grade chromite ore; 227,000 t of
metallurgical grade chromite ore; 90,700 t of refractory grade
chromite ore; 136,000 t of chromium ferroalloys; and 454 t of
chromium metal (U.S. Department of Defense, 2001, p. 8, 11).
World Review
Albania.—The Government of Albania (GOA) studied the
possibility of privatizing chromite ore mines and
ferrochromium smelters (Ryan’s Notes, 2000j). GOA
contracted Darfo S.p.A. (Italy) to operate the Elbasan
ferrochromium smelter. There are two 9 megavoltampere
furnaces at the smelter, of which one is producing at the rate of
800 tons per month (t/mo) and the other is closed. Darfo
planned to install a 13 megavoltampere and a 25
megavoltampere furnace at a cost of about $15 million, raising
the plant’s annual production capacity to 40,000 t (Ryan’s
Notes, 2000a).
Australia.—Danelagh Resources Pty. Ltd. produced
chromite at Coobina Chromite Deposit 57 kilometers (km) east-
southeast of Newman, Western Australia. The Coobina Range
consists of a central core of serpentine. An associated gabbro
was formed by the serpentinization of layered peridotite, which
contains minor amounts of chlorite, talc, carbonate, chromite,
and magnetite. As of December 1997, resources were:
measured, 39,000 t graded at 38.5% chromic oxide; indicated,
86,200 t graded at 39.7% chromic oxide; and inferred, 400,000
t of similar grade. Mining process is open cut, and run-of-mine
ore is crushed and screened. Danelagh exercised its option to
take ownership of the mine leaving Consolidated Minerals
Chromium in the 20th Century
In 1900, “chromic iron ore” was used to describe what we
now call chromite ore. Chromium was used as an alloying
element, in chemical compounds, and in refractory materials. It
played an important role in metallurgy as an alloying element.
Chromium and tungsten were being alloyed with iron to make
tool steels that permitted large increases in industrial
productivity. Chromium was also used to make armor plating
hard. These, along with the use of chromite ore as a refractory
in steel-producing furnaces, made chromium a critical and
strategic material during World War I. In 1900, the United
States had resumed production of chromite ore and chromium
after a hiatus from 1897 to 1899. Prior to that, the United
States had produced 3,767 metric tons of chromite ore in 1890.
Production picked up during World War I and again during
World War II. In 1900, U.S. chromite ore production was 142
metric tons, which represented 0.27% of world production.
Chromium has played an important role in metallurgy as an
alloying element. It was not until 1910 to 1920 that the
alloying role of chromium with iron to make stainless steel
was developed in France, Germany, the United Kingdom,
and the United States. Once this was understood, however,
stainless steel became an integral part of the steel industry,
accounting for more than 2% of steel production in 2000.
Stainless steel manufacture, while small compared with steel
production of all grades, nonetheless accounts for about 60%
of chromium consumption. Stainless steel, which didn’t
even exist in 1900, accounted for most of the chromium
consumed in 2000, and its share of steel production was
growing. Chromium chemical use has grown since 1900;
chromite refractory use, however, has been reduced because
of technological developments. Superalloys, which are
engineering alloys of chromium and nickel used in
aggressive environments and were also nonexistent in 1900,
were an important strategic use of chromium in 2000,
because they were used to make the internal workings of jet
engines.
U.S. GEOLOGICAL SURVEY MINERALS YEARBOOK—200018.2
Ltd.’s interest to a royalty. Chromite ore production was 6,000 t
in 1996; 31,000 t in 1997; 130,000 t in 1998; and 85,000 t in
1999 (Resource Information Unit, 2000, p. 294-295). Danelagh
planned to construct a beneficiation plant that would permit it to
increase its recoverable resources and to produce more product
grades. Danelagh reported proven reserves of 2.2 million tons
(Mt) and probable reserves of 10 Mt. The mine produced
chromite ore graded at 37% Cr2O3 and from 6 millimeters (mm)
to 150 mm in size (Ryan’s Notes, 2001c).
Tata Iron and Steel Co. Ltd. (India) studied the possibility of
constructing a ferrochromium smelter in Gladstone, Queensland.
Tata produced chromite ore and ferrochromium in India;
however, its ferrochromium production was limited by the
availability and cost of electrical power in India. Electrical
power was available at a lower cost in Australia than it was in
India. A 120,000-ton-per-year (t/yr) capacity ferrochromium
smelter with the potential to double that capacity would cost
about $50 million (Metal Bulletin, 2000o, 2001; Ryan’s Notes,
2001b).
Dragon Mining NL studied the Range Well deposit 67 km
northwest of Cue, Western Australia. Chromium occurs
predominantly in the iron oxide minerals hematite and goethite.
The Range Well laterite resource lies directly over part of a 5.5
km thick funnel-shaped layered ultramafic complex. As of June
1998, inferred resource was estimated at 36 Mt graded at 3.60%
chromium (2% cutoff grade) (Resource Information Unit, 2000,
p. 295).
Brazil.—Brazil reported production for use in the
metallurgical and refractory industries. Brazil produced high-
and low-carbon ferrochromium. Brazil reported 1999 chromite
ore production of 420,000 t (45.2% Cr2O3), exported 194,000 t
of chromite ore (53.1% Cr2O3), and imported 8,482 t (48.0%
Cr2O3). In 1999, Brazil produced 91,000 t of chromium
ferroalloys of which 71,000 t was high-carbon ferrochromium,
8,200 t was low-carbon ferrochromium, and the remainder was
ferrochromium-silicon. Brazil imported 5,000 t of chromium
ferroalloys and metal and exported 59 t of ferrochromium
(Cesar, 2000).
Associação Brasileira dos Produtores de Ferroligas e de
Silício Metálico reported ferrochromium production in 1999 to
have been 71,291 t of high-carbon and 7,583 t of low-carbon
ferrochromium. Brazil exported 59 t of high-carbon
ferrochromium and 168 t of low-carbon ferrochromium. Brazil
imported 2,144 t of high-carbon ferrochromium and 2,827 t of
low-carbon ferrochromium (TEX Report, 2000r, s, t).
Villa Nova Mine, Amapa State, operated with an annual
production capacity of 200,000 t of chromite concentrate from
400,000 t of run-of-mine chromite ore. Villa Nova operated a
four-stage beneficiation process that it is replacing with a three-
stage spiral separator process having a through-put of 100 metric
tons per hour. The new process was expected to achieve a
recovery rate of about 96% (Mining Weekly, 2000).
Canada.—Allican Resources planned to build a low-carbon
ferrochromium smelter at Thetford Mines, Quebec. The project
was estimated to cost about $44.6 million for a 19,000-metric-
ton-year smelter. Chromite ore would be supplied initially from
imports followed by development of chromite ore deposits in the
Thetford area. At this capacity, the plant could supply about
one-half of North American low-carbon ferrochromium demand
(Ryan’s Notes, 2000c).
China.—China reported its national chromium-material trade
statistics for 1999. Chromite ore imports were 711,493 t in
1998; 816,229 t in 1999; and 1,112,838 t in 2000. High-carbon
ferrochromium exports were 74,849 t in 1997; 65,576 t in
1998; 49,652 t in 1999; and 130,446 t in 2000. Low-carbon
ferrochromium exports were 27,220 t in 1997; 36,508 t in
1998; 24,161 t in 1999; and 24,161 t in 2000 (TEX Report,
2000b, c, 2001a, b). Based on this reported trade, apparent
consumption of chromium in China was 420,000 t.
The State Economic and Trade Commission of China
embarked on a modernization program for the ferroalloys
industry. Goals of the plan are to scrap old ferroalloy plants,
prohibit construction of new plants, prevent environmental
pollution, and promote technology. China operated about
1,600 ferroalloy furnaces of which about 1,000 had electrical
power capacity under 3,000 kilovolt-amperes. Electrical
furnaces rated under 1,800 kilovolt-amperes were to have been
scrapped by the end of 2000; furnaces under 3,200 kilovolt-
amperes by the end of 2001. New furnace construction was
suspended until 2005 as were expansions. The modernization
plan was expected to reduce high-carbon ferrochromium
production in China; however, more low-carbon
ferrochromium could be produced (TEX Report, 2000d).
European Union.—The European Union (EU) permits duty-
free importation of ferrochromium from non-EU countries on a
specified amount of material from all non-EU sources. Import
duties are applied to imported materials in excess of the
specified amount of material. The EU set the duty-free
ferrochromium import quota at 1.035 Mt in January 2000
(Metal Bulletin, 2000a). The EU lifted antidumping duties
imposed on Kazakhstani and Russian low-carbon
ferrochromium producers in 1993 (Metal Bulletin, 2000b).
Since the EU made a special trade deal with South Africa, it
revised its 2000 duty-free import quota at 515,000 t for South
Africa; 520,000 t for all other countries combined. EU left its
2001 duty-free quota for South Africa unchanged while
reducing that for all other countries to 400,000 t (Ryan’s Notes,
2001c).
Finland.—Outokumpu Polarit Oy planned to merge with
Avesta Sheffield (Sweden, United Kingdom). See Sweden
section. Outokumpu reported on its ferroalloys production
process using preheated charge. Sintered pellets and other
charge components are heated before being charged into the
smelting furnace (called preheated) on a moving steel belt over
which hot gasses from the closed smelting furnace are passed.
The system was developed to process chromite ore from Kemi
Mine. The process was developed to consume little electrical
energy for smelting, have high on-line availability, good
working conditions, and adequate environmental aspects
(Nurmisalo, 2000). Outokumpu planned the addition of a new
melt shop and hot- and cold-rolling facilities that were expected
to double output at Tornio works to 800,000 t in 2002.
France.—Delachaux Metals Division produced chromium
metal by aluminothermic reduction. Delachaux reported that
world demand for chromium metal in 2000 increased to 21,000
t from 20,000 t in 1999. The major end uses for chromium
metal were the production of superalloys for use in gas turbine
engines or petrochemical production. Delachaux estimated its
CHROMIUM—2000 18.3
production in 2000 to be 5,500 t (Metal Bulletin Books, 1995, p.
42; TEX Report, 2000g).
Germany.— ThyssenKrupp Group made a purchase
guarantee with SA Chrome and Alloys (South Africa), a startup
ferrochromium producer. ThyssenKrupp committed to purchase
230,000 t/yr of high-carbon ferrochromium from SA Chrome
and Alloys for 5 years.
India.—The Ministry of Commerce conducted a review of the
antidumping duty imposed in January 1997 that found no
evidence of injury to domestic industry by the import of low-
carbon ferrochromium from Kazakhstan or Russia. Ferro Alloys
Corp. Ltd., the only domestic low-carbon ferrochromium
producer, has not produced the material for the past 2 years
(Metal Bulletin, 2000h; Platt’s Metals Week, 2000b).
Ferro Alloys Corp. Ltd. resumed production at Garividi and at
Shreeram Nagar. The Garividi plant was closed for financial
reasons. The Shreeramnagar plant was closed over a labor
dispute. Ferro Alloys Corp. Ltd. exported chromite ore for the
first time. Ferro Alloys Corp. Ltd. reported annual
ferrochromium production of 87,000 t in 1998 and 51,000 t in
1999. (Metal Bulletin, 2000d, n; TEX Report, 2000f).
Indian Metals and Ferroalloys Ltd. started opencast mining in
the Sukinda Valley. Indian Metals and Ferroalloys received 190
hectares (ha) containing 21 Mt of chromite ore reserves when
the Government redistributed Sukinda Valley resources in 1999.
Chromite ore production reached 31,000 t/mo in May, enough to
supply its ferroalloy plants. Indian Metals and Ferroalloys used
that chromite ore to feed its ferrochromium smelters at Therubali
and Choudwar. At Therubali, Indian Metals and Ferroalloys
operated three furnaces electrically rated at 48 megavolt-
amperes, 24 megavolt-amperes, and 10 megavolt-amperes. The
plant’s annual ferrochromium production capacity was 110,000
t; however, Indian Metals and Ferroalloys was producing
ferrochromium at the rate of 30,000 t/yr from the 24 megavolt-
ampere furnace. Indian Charge Chrome Ltd. was producing
ferrochromium at the annual rate of 60,000 t from a 48
megavolt-ampere furnace at Choudwar. Indian Metals and
Ferroalloys reported annual production of 56,000 t in 1998 and
67,000 t in 1999 (TEX Report, 2000h).
Jindal Strips Ltd., Ferro Alloys Division planned to exploit
chromite ore resources allocated to it when the Government
redistributed Sukinda Valley resources in 1999. Jindal planned
to produce ferrochromium at the annual rate to 60,000 t at its
plant in Andhra Pradesh State (TEX Report, 2000k).
Tata Iron and Steel Co. Ltd. reported 1999 ferrochromium
production of 100,000 t and planned to increase that in 2000.
Tata produced ferrochromium at its Bamnipal plant in India and
under agreements with five other domestic companies operating
nine furnaces and five Chinese plants operating seven furnaces.
Tata reported 1999 chromite ore production of 772,000 t with
plans to increase that to 1,000,000 t by exploiting resources
assigned to it when the Government redistributed Sukinda
Valley resources in 1999; Tata also reported chromite ore
concentrate production of 200,000 t with plans to increase that
to 300,000 t. To meet ferrochromium expansion goals, Tata bid
to buy Industrial Development Corp.’s ferroalloy plant. To
reduce electrical energy cost and assure supply, Tata requested
permission to build a powerplant in Orissa. Another plan by
Tata to increase ferrochromium production while avoiding the
high cost of electrical energy was to build a ferrochromium
plant in Australia that would use chromite ore mined by Tata in
India (see Australia section) (Lobo, 2000; Metal Bulletin,
2000m, n, p; TEX Report, 2000x).
Iran.—Abdan Ferroalloy Refinery produced ferrochromium
with an annual capacity of 15,000 t from a 12.5-megavolt-
ampere furnace. The company also operated the Ne’Mat
chromite ore mine. The mine’s annual production capacity was
400,000 t, some of which was processed in its 120,000-t/yr
concentrator.
Iran produced chromite ore in excess of its domestic needs.
To increase value added exports, the Government planned to
increase domestic annual ferrochromium production to 200,000
t by 2005. New production facilities were planned for the
provinces Kerman and Fars. Baft Ferrochrome Industrial
Company and Nahid Ehyan Sepahan contracted with ABB
Engineering Company (Sweden, Switzerland) to build two
plants, each with an annual ferrochromium production capacity
of 25,000 t, for $74 million. Construction was expected to take
2 years (Iran Daily, 2000; Ryan’s Notes, 2000l).
Japan.—Japan imported 501,727 t of chromite ore; 714,531
t of high-carbon, and 61,796 t of low-carbon ferrochromium;
and 3,202 t of chromium metal. Japan produced 131,759 t of
high- and low-carbon ferrochromium. Stainless steel
production was 3.447 Mt. Ferrochromium imports represented
85% of market share. Japan exported 2,541 t of ferrochromium
and 1.162 Mt of stainless steel. Japan had stainless steel scrap
imports of 211,581 t and exports to 70,676 t (TEX Report,
2001c, f, g, h, i, j, k).
Based on chromite ore, ferrochromium, chromium metal, and
stainless steel scrap trade, chromium apparent consumption in
Japan was 586,000 t contained chromium. Japan had a duty-
free quota for the importation of ferrochromium amounting to
28,100 t in FY 2000. There was a preferential duty of 3.18%
and a temporary duty of 5.3% imposed effective April 1, 2001
(April 1, 2000, through March 31, 2001) (TEX Report,
2001m).
The Ministry of International Trade and Industry reported its
intent to review the goals of the rare metals stockpile, which
included chromium metal, taking into account current political
conditions, budget constraints, and rare metal demand. The
rare metals stockpiling program has been active since 1984, at
which time chromium was identified as one of the rare metals
that would be stocked in the amount necessary to meet 60 days
of demand (TEX Report, 2000o). A stockpile equivalent to
78.2% of the goal for chromium had been reached. The review
found that the amount of chromium held in the stockpile could
be reduced. J S Processing Co. Ltd. is a new business setup in
Osaka to supply blended scrap to Nippon Steel Corp. The
company is a joint venture among ELG Haniel Metals Corp.
(40%), Mitsui and Co. Ltd. (19%), Mitsubishi Corp. (19%),
Nippon Steel Trading Co. Ltd. (12%), Fujimoto Kinzoku (5%),
and Sangyo Shinko (5%). The company anticipated handling
3,000 t/mo of scrap, of which 1,000 t would be blended (TEX
Report, 2000i, j).
High-carbon ferrochromium producers and production in
Japan in 2000 were: Nippon Denko Co. Ltd., 7,113 t; NKK
Materials Co. Ltd., a subsidiary of NKK Corp., 31,948 t; and
Shunan Denko K.K., a subsidiary of Showa Denko K.K.,
U.S. GEOLOGICAL SURVEY MINERALS YEARBOOK—200018.4
83,909 t (TEX Report, 2001c).
NKK Materials Co. Ltd. reported the development of a new
product, 99.5% pure chromium metal. NKK Materials
implemented its two-step electric furnace refining process
followed by vacuum degasification at its Toyama plant. NKK
expected the chromium metal to be used by master alloy
producers for the aircraft industry, a market sector that NKK
currently supplies with low-carbon ferrochromium. NKK
planned to produce about 1,000 t/yr, developing its chromium
metal production capacity to 3,000 t/yr (Metal Bulletin, 2000i;
TEX Report, 2000n).
Japan houses about one-fifth of the world’s stainless steel
industry with a production capacity well in excess of its
domestic demand. That industry has participated in the trend to
make strategic alliances between ferrochromium consumers, that
is themselves, and ferrochromium producers in South Africa.
As no new alliances have originated over the past 2 years, that
trend appears to have played out. The stainless steel industry
itself is now undergoing changes in Japan. From 1961 through
2000, stainless steel production (excluding heat resisting grades)
in Japan has grown from 199,462 t to 3,021,080 t, a
compounded growth rate of 7.22%. The major stainless steel-
producing companies that also operate blast furnaces, their
stainless steel production locations, and production in 2000 were
Kawasaki Steel Corp., Chiba, 683,858 t; Nippon Metal Industry,
Kinuura, 318,888 t; Nippon Steel, Hikari and Yawata, 1,105,318
t; Nippon Yakin Kogyo Co. Ltd., Kawasaki, 337,840 t; Nisshin
Steel Co., Shunan, 629,072 t; and Sumitomo Metal Mining Co.
Ltd., Wakayama and Naoetsu, 551,672 t. Nippon Steel and
Sumitomo agreed to specialize. Nippon Steel was to specialize
in producing stainless steel coils; Sumitomo in pipes and shaped
steels. Nippon Steel also reached an agreement with Nisshin
Steel wherein Nippon Steel would specialize in austenitic (that
is, chromium-nickel-containing) grades and Nisshin would
specialize in ferritic (that is, chromium-containing) grades. By
these agreements, each company expected to benefit
economically by producing larger volumes of fewer products
and permitting the elimination of excess production capacity
(TEX Report, 2000e, 2001d, e). Japan has exported a
substantial fraction of its stainless steel production. In recent
years, stainless steel production capacity has been developed in
Asia, namely in the Republic of Korea and Taiwan. Since new
capacity has come into production faster than demand
expansion, adjustments are necessary. Capacity reduction takes
place where production is least efficient; that is, in older
facilities. The older facilities in Asia are in Japan.
Kazakhstan.—Kazchrome was co-owned by Trans World
(Alloys) Inc. and the Government of Kazakhstan. A dispute
arose in 1997 between Trans World and local company officials
over who would control and manage the mine and
ferrochromium smelters. The dispute was settled in 2000 when
the Chodiev Group (also known as Kazakhstan Mineral
Resource Corp.) bought Trans World’s interest in the
Kazchrome. Kazchrome owns the Donskoy Ore Dressing
Complex and the Aksusky Ferroalloy Plant (Aksu) and
Aktyubinsk Ferroalloy Plant. Kazchrome was owned by
Kazakhstan Mineral Resource Corp. (28.75%), the Kazakhstani
Government (31.3%), and holds its own stock (28.75%).
Kazakhstan’s chromium industry includes Donskoy Ore
Dressing Complex, Aksu, and Aktyubinsk Ferroalloy Plant.
Donskoy extracted chromite ore from the Poiskovy open pit
and the Molodyonzhnaya underground mines (TEX Report,
2000m). Donskoy completed construction of equipment that
will produce briquettes from chromite ore fines, with an annual
capacity of 500,000 t (TEX Report, 2001l). Aksu installed a
new 64-megavolt-ampere furnace manufactured by
Mannesmann-Demag (Germany) that has a high-carbon
ferrochromium production capacity of 102,000 t/yr. Aksu
planned to add about 160,000 t of high-carbon ferrochromium
production capacity in the form of two 50-megavolt-ampere or
three 30-megavolt-ampere furnaces in 2002 (Ryan’s Notes,
2000e; TEX Report, 2000l).
Norway.—Elkem ASA produced high-carbon
ferrochromium containing 60% to 65% chromium from two
closed furnaces at its ferrochromium plant in Rana. Annual
production capacity was 160,000 t (Ryan’s Notes, 2000h).
Philippines.—The four ferrochromium producers in the
Philippines were reported to have ceased production several
years ago (Bennet, Barrand, and Clarkson, 2000). Benguet
Corporation mined foundry and refractory grades of chromite
ore at Masinloc Chromite Operation in Zambales Province.
Having developed a stockpile equivalent to 15 to 18 months of
consumption, Benguet temporarily suspended production in
1999 to reduce stocks (Industrial Minerals, 1999). Having
depleted its stockpile, Benguet started underground chromite
ore mine production (Platt’s Metals Week, 2000a).
Russia.—Serov Ferroalloy Plant reported production of
129,500 t of ferrochromium in 1999: 90,000 t of high-carbon
ferrochromium; 18,500 t of medium-carbon ferrochromium;
and 21,000 t of low-carbon ferrochromium. The plant is 359
km from Sverdlovsk. It uses locally mined and imported
chromite ore. Serov was developing a new mine at Salechard,
which it expected to yield chromite ore of higher grade than
that currently available from local sources. Serov imported ore
from Kazakhstan and Turkey (Metal Bulletin, 2000k).
Severonickel Combine, a subsidiary of RAO Norilsk Nickel,
continued development of the Sopcheozero chromite deposits.
Norilsk sought a partner to develop the chromite ore mine and
a ferrochromium smelter (Ryan’s Notes, 2000b).
Chelyabinsk Electrometallurgical Integrated Plant produced
low-carbon ferrochromium with an annual production capacity
of 144,000 t. Chelyabinsk imported its chromite ore from
Kazakhstan (Ryan’s Notes, 2001a). Chelyabinsk planned to
install a scrap recycling circuit (Ryan’s Notes, 2000g).
South Africa.—The Minerals Bureau reported that, from a
reserve base of 3,100 Mt of chromite ore, in 1999 South Africa
produced 6,817,000 t of chromite ore from which it produced
2,155,000 t of ferrochromium and other products. South Africa
exported 841,000 t of chromite ore and 1,897,100 t of
ferrochromium in 1999 (Armitage, 2000). Based on chromite
ore production and chromite ore and ferrochromium trade,
1999 South African chromium apparent consumption was
755,658 t, contained chromium. The Minerals Bureau reported
chromite ore production in 2000 of 6,620,754 t and sales of
6,744,278 t. Eighty-five percent of sales was sold locally; the
remaining 15% was exported (South African Minerals Bureau,
2001).
South Africa considered changing its mining law. Currently,
CHROMIUM—2000 18.5
companies own mineral property rights. Draft legislation would
change to government ownership of minerals and government
licensing of mining for a specified period of time (Ryan’s Notes,
2000h, k). Eskom, the South African power company, planned
to change its billing structure for the ferrochromium industry, as
their current 7-year contract with that industry comes to a close.
The current contract adjusts the price of electrical energy
between minimum and maximum rates based on the price of
ferrochromium. The proposed system would be a fixed tariff
rate of 12.2 cents per kilowatthour. Eskom was the fifth largest
electrical power producer worldwide and planned to be
privatized (Metal Bulletin, 2000l; Ryan’s Notes, 2000f, 2001d).
South African environmentalists made their desire for stricter
pollution-control standards known at public hearings held to
discuss the environmental impact of new plants or new furnaces
(Ryan’s Notes, 2000m).
ASA Metals (Pty.) Ltd. planned another furnace and an
agglomeration facility for its ferrochromium plant near
Burgersfort, Northern Province. ASA completed construction
and started production at its ferrochromium plant last year. ASA
had an annual ferrochromium production capacity of 60,000 t
from a 33 megavolt-ampere furnace. ASA is a joint venture
between Northern Province Development Corporation (40%)
and East Asian Metals Investment Co. Ltd. (60%) (Lourens,
2000).
South Africa Chrome and Alloys Ltd. (SAChrome), formerly
Southern Witwatersrand Exploration Co., studied the feasibility
of constructing a ferrochromium plant. The plant was to use
chromite ore from its Horizon and Chromeden mines.
SAChrome planned to build a pelletizing and sintering plant
with an annual capacity of 520,000 t and a ferrochromium plant
with annual production capacity of 230,000 t. They planned two
closed furnaces with electrical capacity of 54 megavolt-amperes
each. The plant was to be located near Boshoek at a rail siding
about 40 km from the mine and about 650 km from Richards
Bay. Plant cost was estimated at about $100 million.
SAChrome planned to use chromite ore from the UG-2 and LG-
6 seams to produce ferrochromium containing 51% chromium.
Thyssen Krupp Metallurgie contracted to take up to 250,000 t/yr
of ferrochromium for 5 years from SAChrome (Graulich, 2000;
Ryan’s Notes, 2000d, m, 2001b).
Associated Manganese Mines of South Africa Ltd. (Assmang)
started production at the Dwarsrivier chromite ore mine in
Mpumalanga Province about 30 km from Steelpoort (Mining
Journal, 2000b). The opencast mine and beneficiation plant
located at the mine site had an annual production capacity of
about 350,000 t/yr. Assmang planned to start underground
mining in 2001, thereby bringing production capacity up to
about 1 million tons per year. The LG-6 seam, which dips at 8
degrees to 14 degrees and has a thickness of about 180
centimeters, was being mined. Within the mine, ore was
transported by conveyor belt from the pit to the beneficiation
plant. From the plant, ore was trucked to the Steelpoort rail
terminal from which it was carried by train the remaining 60 to
65 km to Feralloys, Assmang’s ferrochromium plant at
Machadodorp (http://www.avmin.co.za/mediashop/
pressreleast.asp?story=5, downloaded April 13, 2000) (TEX
Report, 2000a). Feralloys operated three furnaces and a metal-
from-slag recovery process. The furnaces accounted for an
annual ferrochromium production capacity of about 125,000 t;
the metal-from-slag recovery was 25,000 t. Two of their three
furnaces had electrical capacity of 24 megavolt-amperes; the
third furnace, 30 megavolt-amperes. The two 24-megavolt-
ampere furnaces were upgraded to 30 megavolt-amperes,
bringing Feralloys’ ferrochromium production capacity up to
175,000 t/yr (Metal Bulletin, 2000g). A fourth furnace and
pelletizing plant of Outokumpu technology was planned. The
fourth furnace was planned to have an electrical capacity of 54
megavolt-amperes and ferrochromium production capacity of
130,000 t/yr. The pelletizing plant was planned to produce
350,000 t/yr of pellets (Metal Bulletin, 2000f).
Columbus Stainless Steel estimated its production of
stainless steel flat products to have been 440,000 t in 2000, of
which 105,000 t was sold domestically (Metal Bulletin, 2000c).
Hernic (Pty.) Ltd. brought its third furnace into production.
The third furnace is supported by pelletizing and preheating
operations manufactured by Outokumpu Oy (Finland). The
system was installed at a cost of about 200 million Rand and
increased Hernic’s annual ferrochromium production capacity
to 260,000 t (Venter, 2000b).
Samancor Ltd. planned a greenfield ferrochromium plant in
the western belt of the Bushveld Complex near its Mooinooi
Mine. Samancor planned to construct two closed furnaces to
be fed by one pelletizing and sintering plant on a 50-ha site at a
cost of 500 million Rand. Production technology is from
Outokumpu Technology (Finland) that Samancor is using at its
Ferrometals plant. This will be Samancor’s first
ferrochromium plant in the western belt of the Bushveld
complex. The mine was expected to produce about 760,000
t/yr of chromite ore. The smelter was expected to produce
520,000 t/yr of preheated pellets, from which about 300,000
t/yr of ferrochromium would be produced. The plans were
reported to have included the use of UG-2 chromite byproduct
from platinum mining and iron and steel scrap (Venter, 2000a).
Samancor anticipated proceeding with plant construction when
market conditions indicated the need for this new plant
(Gonsalves, 2000).
Xstrata S.A. (Pty.) Ltd. was developing the Townlans Mine
in the Rustenburg area, western belt of Bushveld Complex.
The mine was expected to start production in 2001 and have a
production capacity of 480,000 t/yr. The new mine
complements Xstrata’s existing mines in the western belt:
Waterval, 273,000 t/yr production capacity and Kroondal
Mine, 663,000 t/yr; and the Thorncliffe Mine, 1,056,000 t/yr in
the eastern belt (TEX Report, 2000y).
Samancor and Xstrata formed an equally owned joint venture
to develop chromite ore mining and ferrochromium production
in the Rustenburg area of the western belt of the Bushveld
Complex. The joint venture will develop chromite ore reserves
owned by Samancor that are accessable via Xstrata’s Kroondal
Mine and will expand Xstrata’s Wonderkop smelter. The
Wonderkop smelter near Rustenburg had an annual
ferrochromium production capacity of about 300,000 t from
four, 39 megavolt-ampere furnaces, two pelletizing lines, and a
recovery plant. Wonderkop obtained its chromite ore supply
primarily from the Kroondal Mine. Samancor and Xstrata
planned to add two 45 megavolt-ampere furnaces, pelletizing
and prereduction, and metal-from-slag recovery at a cost of
U.S. GEOLOGICAL SURVEY MINERALS YEARBOOK—200018.6
about $40 million. The new production equipment will add
180,000 t/yr of ferrochromium to the plant’s annual production
capacity. Additional chromite ore supplies will come through
development of the Kroondal Mine to exploit reserves owned by
Samancor. Production was expected to start in 2001 (Metal
Bulletin, 2000j; Mining Journal, 2000a; Platt’s Metals Week,
2000c; Robinson, 2000b; Ryan’s Notes, 2000i; TEX Report,
2000p).
Sweden.—Vargön Alloys AB planned to purchase a recovery
plant that would recover ferrochromium from slag. The plant
was planned to process slag at the rate of 100 metric tons per
hour. The equipment supplier was Apic Toll Treatment, a joint
venture between Mintek and Bateman Titaco Company
(Robinson, 2000a).
The European stainless steel producers Avesta Sheffield Ltd.
(Sweden, United Kingdom) and Outokumpu Polarit Oy
(Finland) merged to form AvestaPolarit Abp. Avesta Sheffield
is the result of the merger of Avesta (Sweden) and British
Stainless Steel (UK) in 1992. The merger was to be effected in
2001. The new company would have a stainless steel
production capacity of 1.7 Mt. Other stainless steel producers in
Europe include Acciai Speciali Terni SpA (Italy), Acerinox SA
(Spain), ALZ NV (Belgium), Ugine SA (France), and Krupp-
Thyssen Nirosta GmbH (Germany). Raw materials supply
appears to favor Outokumpu Polarit’s plant at Tornio because it
is near to chromium and nickel supply (Metal Bulletin Books,
1995, p. 4, 18, 30, 48, 79, 96; Avesta Sheffield, 2000; TEX
Report, 2000q).
Taiwan.—Taiwan reported production of ferrochromium to
have been 296,297 t high carbon in 1998; 387,995 t high carbon
in 1999; and 380,996 t high carbon, and 14,175 t low carbon in
2000 (TEX Report, 2001n, o). Taiwan reported stainless steel
scrap imports of 20,789 t in 2000 (TEX Report, 2000v). Taiwan
reported stainless steel scrap exports of 45,095 t in 1998 and
49,055 t in 1999 (TEX Report, 2000u).
Tang Eng Iron Works, Yieh United Steel, Walsin Carteck, and
China Steel Corp. produced about 1.2 Mt of stainless steel in
2000 (TEX Report, 2000w).
Turkey.—Eskikaya and Aydiner (Eskikaya and Aydiner,
2000) reported that Turk Maadin A.S. operated the Dagardi,
Kavak, Koycegiz, and Tavas chromite ore mines. The Kavak
Mine had 2 Mt of reserves, and annual production was about
100,000 t. Eskikaya reported that mine performance was
improved when they introduced new mining techniques and
equipment. In particular, the improvements reduced accidents,
manpower required, and timber consumption. These savings
could extend the reserves and mine life by making low-grade ore
production economical.
Zimbabwe.—Zimbabwe Alloys Ltd. reported production of
33,425 t of low-carbon ferrochromium in 1999. Zimbabwe
Alloys renovated its Gweru plant. It converted one 28-
megavolt-ampere furnace from the production of
ferrochromium-silicon to the production of high-carbon
ferrochromium. The conversion cost about $3 million. The new
furnace had a high-carbon ferrochromium production capacity
of 35,000 t/yr. Zimbabwe Alloys will continue to produce low-
carbon ferrochromium under a joint-venture agreement with
Japan Metals and Chemicals Co. (Japan) (Ryan’s Notes, 2000n).
Current Research and Technology
Mintek found that dry milling of ferrochromium slag or
chromite ore produces a buildup of chromium in the +6 valence
state. Chromium in chromite ore is in the +3 valence state.
Mintek found that longer duration milling resulted in higher
concentration of chromium in the +6 valence state (Mintek
Bulletin, 2000).
Outlook
The outlook for chromium consumption in the United States
and the rest of the world is about the same as that for stainless
steel, which is the major end use for chromium worldwide.
Thus, stainless steel industry performance largely determines
chromium industry demand worldwide. (See the following
section on stainless steel.)
Several trends are occurring simultaneously in the chromium
industry. Chromite ore production is moving from independent
producers to vertically integrated producers. In other words,
chromite ore mines tend to be owned and operated by
ferrochromium or chromium chemical producers. This trend is
associated with the migration of ferrochromium production
capacity from stainless steel-producing countries to chromite
ore-producing countries. As ferrochromium-production
capacity is rationalized in historically producing countries,
which are usually stainless steel producing countries, new
furnaces or plants are constructed in chromite ore producing
areas. The electrical power capacity and production capacity of
submerged-arc electric furnaces used to produce
ferrochromium has been increasing. Production process
improvements such as agglomeration of chromite ore,
preheating and prereduction of furnace feed, and closed furnace
technology have been retrofitted at major producer plants and
are being incorporated into newly constructed plants. When
ferrochromium plants started to be built, furnaces rated in the
low kilovoltampere range were common. Furnaces built
recently tend to approach the mid megavolt-ampere range. The
introduction of post melting refining processes in the steel
industry after 1960 started a shift in consumption from low-
carbon ferrochromium to high-carbon ferrochromium causing a
decline in low-carbon ferrochromium production that continues
today. After years of ferrochromium production, slag
stockpiles have built up. Recently developed processes
efficiently recover ferrochromium from that slag. Equipment
to use these processes was being installed at plant sites. In
South Africa, the major chromite ore- and ferrochromium-
producing country, two trends are emerging; ferrochromium
plants are being developed in the western belt of the Bushveld
Complex, and chromite ore byproduct from platinum
operations are being accommodated by new production
processes. After many years of stainless steel production,
stainless steel scrap resources have accumulated. Stainless
steel producers have been improving their production processes
by reducing scrap generated during the production process and
by increasing the amount of scrap used as feed material. As a
result, the fraction of stainless steel scrap use as feed material
has been increasing, especially from post consumer sources.
CHROMIUM—2000 18.7
References Cited
Armitage, W.K., 2000, Chromium in South Africa’s Minerals Industry 1999-
2000 (17th ed.): Republic of South Africa, Department of Minerals and
Energy, January 2001, p. 104-109.
Avesta Sheffield, 2000, Outokumpu and Avesta Sheffield form new leading
stainless steel company: Avesta Sheffield press release, September 28, 19 p.
Bennet, Amy, Barrand, Tom, and Clarkson, Dan, 2000, A strategic analysis of
the global ferro-chrome industry: United Kingdom, Metal Bulletin Research,
December, 88 p.
Cesar, José Rafael de Andrade, 2000, Chrome: Mineral Summary 2000, v. 20, p.
33-34.
Eskikaya, Sinasi, and Aydiner, Selahattin, 2000, Expectations and realization-full
achievement of the objectives in terms of profitability and safety in Kavak
chrome mine: Las Vegas, NV, Presentation at Mine Expo 2000, September
2000, 17 p. handout.
Gonsalves, Marc, 2000, Closure of two furnaces at Ferrometals: Samancor
Chrome press release, August 24, 3 p.
Graulich, Ilja, 2000, SA Chrome pins hopes on smelter: Business Day,
November 24, p. 27.
Industrial Minerals, 1999, Benguet suspends chromite output: Industrial
Minerals, no. 376, January, p. 15-16.
Iran Daily, 2000, $74 million ferrochrome deal: Iran Daily, June 18, p. 3.
Lobo, Gilbert, 2000, Tata’s plans to grow in chrome: Metal Bulletin Monthly,
no. 359, November, p. 19, 21.
Lourens, Carli, 2000, Chinese commission chrome smelter: Mining Weekly,
January 28–February 3, p. 23.
Metal Bulletin, 2000a, Eurofer welcomes new ferro-chrome quota: Metal
Bulletin, no. 8441, January 13, p. 7.
———2000b, European Commission lifting of anti-dumping duties will ‘create
world price’: Metal Bulletin, no. 8463, March 30, p. 8.
———2000c, Expansion yields profit for Columbus: Metal Bulletin, no. 8481,
June 5, p. 17.
———2000d, Facor to export chrome ore: Metal Bulletin, no. 8484, June 15,
p. 12.
———2000e, Facor to reopen Garividi plant: Metal Bulletin, no. 8483,
June 12, p. 7.
———2000f, Feralloys signs FeCr plant deal: Metal Bulletin, no. 8489, July 3,
p. 9.
———2000g, Good progress made at Assmang expansions: Metal Bulletin, no.
8455, March 2, p. 8.
———2000h, India to remove anti-dumping duty on ferro-chrome imports:
Metal Bulletin, no. 8525, November 13, p. 10.
———2000i, Japanese producer ships samples of Fe Cr metal output: Metal
Bulletin, no. 8504, August 31, p. 7.
———2000j, Samancor and Xstrata agree production joint venture: Metal
Bulletin, no. 8483, June 12, p. 6.
———2000k, Serov looks to boost FeCr exports to Asia: Metal Bulletin, no.
8468, April 17, p. 11.
———2000l, South African FeCr costs set to rise: Metal Bulletin, no. 8529,
November 27, p. 8.
———2000m, Tisco bids to take over Orissa Fe-Cr plant: Metal Bulletin, no.
8501, August 17, p. 9.
———2000n, Tisco looks to export chromite ore to customers: Metal Bulletin,
no. 8479, May 29, p. 15.
———2000o, Tisco plans FeCr plant in Australia: Metal Bulletin, no. 8534,
December 14, p. 8.
———2000p, Tisco revised FeCr production estimate: Metal Bulletin, no. 8506,
September 7, p. 15.
———2001, Ferro-chrome plant to be built in Gladstone: Metal Bulletin, no.
8540, January 11, p. 9.
Metal Bulletin Books, 1995, Stainless Steel Databook (3d ed.): England, Metal
Bulletin Books Ltd., 514 p.
———1998, Ferro-Alloy Directory and Databook (5th ed.): England, Metal
Bulletin Books Ltd., 418 p.
Mining Journal, 2000a, Chrome rivals pool assets: Mining Journal, v. 334, no.
8586, June 9, p. 450.
———2000b, Dwarsrivier mine opened: Mining Journal, v. 335, no. 8606,
October 27, p. 339.
Mining Weekly, 2000, Gauteng improves Brazilian operation: Mining Weekly,
June 16-22, p. 16.
Mintek Bulletin, 2000, Generation fo Cr (VI): Mintek Bulletin, no. 130,
December 2000-January 2001, p. 2.
Nurmisalo, Martti, 2000, Ferroalloys production with preheated charge:
Beijing, presentation at International Ferroalloys Fair 2000, October 23-26,
10 p.
Platt’s Metals Week, 2000a, Benguet resumes chrome ore mining: Platt’s
Metals Week, v. 71, no. 19, May 8, p. 9.
———2000b, India lifts duty on low-C chrome: Platt’s Metals Week, v. 71,
no. 48, November 27, p. 10.
———2000c, Samancor, Xstrata in chrome JV: Platt’s Metals Week, v. 71,
no. 24, June 12, p. 3.
Resource Information Unit, 2000, Chromium: Register of Australian Mining
2000-2001, 672 p.
Robinson, Ian, 2000a, Contract for alloy from slag plant awarded: SA Mining,
Coal, Gold and Base Minerals, January 2001, p. 17.
———2000b, South African producers look to the long-term: Metal Bulletin
Monthly/Ferro-Alloys Supplement, no. 359, November, p. 14-17.
Ryan’s Notes, 2000a, ELG to control 500,000 mt of Cr units: Ryan’s Notes,
v. 6, no. 15, April 10, p. 15.
———2000b, Etibank offers low Cr FeCr: Ryan’s Notes, v. 6, no. 38,
September 18, p. 2.
———2000c, European charge chrome talks begin: Ryan’s Notes, v. 6, no. 26,
June 26, p. 3.
———2000d, European mills to pay 2-3¢ more for charge chrome in second
quarter: Ryan’s Notes, v. 6, no. 12, March 20, p. 1-2.
———2000e, FeCr producers looking ahead: Ryan’s Notes, v. 6, no. 48,
November 27, p. 2.
———2000f, FeCr under producers dominance: Ryan’s Notes, v. 6, no. 40,
October 2, p. 1-2.
———2000g, Greens make their voice heard on chrome: Ryan’s Notes, v. 6,
no. 22, May 29, p. 1-2.
———2000h, Large tenders dominate FeCr market: Ryan’s Notes, v. 6, no.
52, December 25, p. 1.
———2000i, Samancor and Xstrata in new joint venture: Ryan’s Notes, v. 6,
no. 34, June 12, p. 1.
———2000j, Second quarter FeCr buying begins: Ryan’s Notes, v. 6, no. 9,
February 28, p. 3.
———2000k, Uneasy quiet in ferrochrome: Ryan’s Notes, v. 6, no. 46,
November 13, p. 1-2.
———2000l, US low carbon FeCr prices fall: Ryan’s Notes, v. 6, no. 25,
June 19, p. 3.
———2000m, US low-carbon FeCr prices sink: Ryan’s Notes, v. 6, no. 39,
September 25, p. 1-2.
———2000n, Zimalloys to produce HC FeCr: Ryan’s Notes, v. 6, no. 11,
March 13, p. 1.
———2001a, Chelyabinsk halves low C FeCr output: Ryan’s Notes, v. 7,
no. 2, January 1, p. 1-2.
———2001b, Etibank restructures its Cr operations: Ryan’s Notes, v. 7, no. 2,
January 8, p. 1.
———2001c, Samancor dramatically trims FeCr output: Ryan’s Notes, v. 7,
no. 3, January 15, p. 1.
———2001d, Xstrata studying further chrome cutbacks: Ryan’s Notes, v. 7,
no. 5, January 29, p. 2.
South African Minerals Bureau Report, 2001, ME-P-014: May 2, unpaginated.
Syracuse Research Corp., 2000, Toxicological profile for chromium (update),
2000: Syracuse, NY, Syracuse Research Corp., September, 435 p.
TEX Report, 2000a, Assmang/S. Africa participates in expansion of chrome
operations: TEX Report, v. 32, no. 7572, June 13, p. 2-3.
———2000b, China’s exports of ferro-alloys in 1999 increased slightly
compared to 1998: TEX Report, v. 32, no. 7613, August 10, p. 6-7.
———2000c, China’s imports of Cr-Ore in 1999 increased by 15%: TEX
Report, v. 32, no. 7621, August 23, p. 6.
———2000d, China’s policy to rectify structure of ferro-alloy industry is
gradually permeating: TEX Report, v. 32, no. 7654, October 11, p. 4-5.
———2000e, Cr-based stainless steel production is being concentrated on
Kawasaki Steel and Nippon Steel: TEX Report, v. 32, no. 7555, May 19,
p. 8-9.
———2000f, FACOR/India resumed to operate Sheeramnagar plant in last
week: TEX Report, v. 32, no. 7582, June 27, p. 1.
———2000g, Favorable world demand for Cr-met in this year is estimated at
21,000 tons: TEX Report, v. 32, no. 7682, November 21, p. 1.
———2000h, IMFA Group/India launches to develop chrome resources in
Sukinda Valley: TEX Report, v. 32, no. 7584, June 29, p. 4.
———2000i, Japan—USA joint venture company is established for S/S
blended scrap commenced its operations: TEX Report, v. 32, no. 7582,
June 27, p. 6.
U.S. GEOLOGICAL SURVEY MINERALS YEARBOOK—200018.8
———2000j, Japan—USA joint venture company is established for S/S blended
scrap to Nippon Steel: TEX Report, v. 32, no. 7500, February 28,
p. 4-5.
———2000k, Jindal/India plans to export 16,000 tons/year of Fe-Cr: TEX
Report, v. 32, no. 7652, October 6, p. 6.
———2000l, Kazakhstan expands capacity for HC-Fe-Cr to produce 880,000
tons in 2002: TEX Report, v. 32, no. 7567, June 6, p. 2.
———2000m, Kazakhstan’s plans to produce ferro-alloys in 2000: TEX Report,
v. 32, no. 7506, March 7, p. 2.
———2000n, NKK Material launches to produce high grade Cr-met: TEX
Report, v. 32, no. 7622, August 24, p. 6.
———2000o, Review of rare metals stockpile may put slight impact on
industries concerned: TEX Report, v. 32, no. 7598, June 19, p. 6.
———2000p, Samancor and Xstrata enter into Fe-Cr joint venture: TEX
Report, v. 32, no. 7572, June 13, p. 6.
———2000q, Stainless steel industry in Europe is coming at opportune time to
reorganize again: TEX Report, v. 32, no. 7650, October 4, p. 6-7.
———2000r, Supply/demand of ferro-alloys in Brazil for 1999(1): TEX Report,
v. 32, no. 7659, October 18, p. 7.
———2000s, Supply/demand of ferro-alloys in Brazil for 1999(3): TEX Report,
v. 32, no. 7661, October 20, p. 7.
———2000t, Supply/demand of ferro-alloys in Brazil for 1999(4): TEX Report,
v. 32, no. 7662, October 23, p. 6.
———2000u, Taiwan’s exports of stainless steel scrap in December 1999: TEX
Report, v. 32, no. 7519, March 27, p. 5.
———2000v, Taiwan’s imports of HC-Fe-Cr in December 1999: TEX Report,
v. 32, no. 7519, March 27, p. 3.
———2000w, Tang Eng Iron Works/Taiwan holds tender to purchase 32,000
tons Fe-Cr: TEX Report, v. 32, no. 7700, December 18, p. 8.
———2000x, TISCO/India plans to expand its chrome operations: TEX Report,
v. 32, no. 7565, June 2, p. 1.
———2000y, Xstrata/S.Africa expands its capacity to comply with increasing
SUS production: TEX Report, v. 32, no. 7562, May 30, p. 2.
———2001a, China’s exports of ferro-chrome in 2000: TEX Report, v. 33,
no. 7746, March 1, p. 6.
———2001b, China’s imports of Cr-Ore in by source in 2000: TEX Report,
v. 33, no. 7749, March 6, p. 5.
———2001c, Domestic output and imports of ferro-alloys in Japan for year
2000: TEX Report, v. 33, no. 7762, March 26, p. 8.
———2001d, General review of stainless steel in 2000 and its outlook for a new
year (1): TEX Report, v. 33, no. 7748, March 5, p. 2-3.
———2001e, General review of stainless steel in 2000 and its outlook for a new
year (2): TEX Report, v. 33, no. 7749, March 6, p. 4.
———2001f, (Custom Statistics) Japan’s exports of ferro-alloys in December
2000: TEX Report, v. 33, no. 7743, February 26, p. 7.
———2001g, Japan’s exports of stainless steel products in year 2000 decreased
by 3%: TEX Report, v. 33, no. 7745, February 28, p. 5.
———2001h, (Custom Statistics) Japan’s Imports of ferro-alloys in December
2000: TEX Report, v. 33, no. 7739, February 20, p. 7-8.
———2001i, (Custom Statistics) Japan’s imports of raw materials ores (for
ferro-alloys production) in December 2000: TEX Report, v. 33, no. 7742,
February 23, p. 6-7.
———2001j, Japan’s output of stainless steel in year 2000: TEX Report, v. 33,
no. 7736, February 15, p. 8-9.
———2001k, Japan’s trade of S/S scrap in 2000 was still excess of its imports:
TEX Report, v. 33, no. 7751, March 8, p. 10.
———2001l, Kazakhstan’s high carbon Fe-Cr is permeating into market with
its high quality: TEX Report, v. 33, no. 7754, March 13, p. 4-5.
———2001m, Quota of preferential duty for ferro-alloys and nickel in 2001
fiscal year: TEX Report, v. 33, no. 7770, April 5, p. 3.
———2001n, Taiwan’s imports of main ferro-alloys in year 2000: TEX
Report, v. 33, no. 7772, April 9, p. 5.
———2001o, Taiwan’s raw materials imports in December 2000: TEX
Report, v. 33, no. 7776, April 13, p. 7.
U.S. Department of Defense, 2001, Strategic and critical materials report to
Congress - Operations under the strategic and critical materials stock piling
act during the period October 1999, through September 2000: U.S.
Department of Defense, January, 54 p.
Venter, Irma, 2000a, Chrome producer increases production to 800 000 t/yr:
Mining Weekly, February 18-24, p. 10.
———2000b, Third furnace at 100% and fourth one being considered: Mining
Weekly, February 18-24, p. 6.
GENERAL SOURCES OF INFORMATION
U.S. Geological Survey Publications
Chromium. Ch. in Mineral Commodity Summaries, annual.
Chromium. Ch. in Minerals Yearbook, annual.
Chromium. Ch. in United States Mineral Resources,
Professional Paper 820, 1973.
Chromium. International Strategic Minerals Inventory
Summary Report, Circular 930-B, 1984.
Chromium. Mineral Industry Surveys, monthly.
Other
American Iron and Steel Institute.
American Metal Market.
Chromite. Ch. in Industrial Rocks and Minerals, 6th ed.,
Society for Mining, Metallurgy, and Exploration, Inc., 1994.
Chromium. Ch. in Mineral Facts and Problems, U.S. Bureau of
Mines Bulletin 675, 1985.
CRU Metal Monitor.
The Economics of Chromium (Roskill Information Services,
London).
Ferro-Alloy Directory and Databook (Metal Bulletin, London).
Ferro Alloys Manual (The TEX Report, Tokyo).
Ferrous Mineral Commodities Produced in the Republic of
South Africa (South African Department of Mineral and
Energy Affairs Directory D8).
International Chromium Development Association (Paris).
South Africa’s Minerals Industry (Minerals Bureau, South
Africa).
Stainless Steel Databook (Metal Bulletin Books, London).
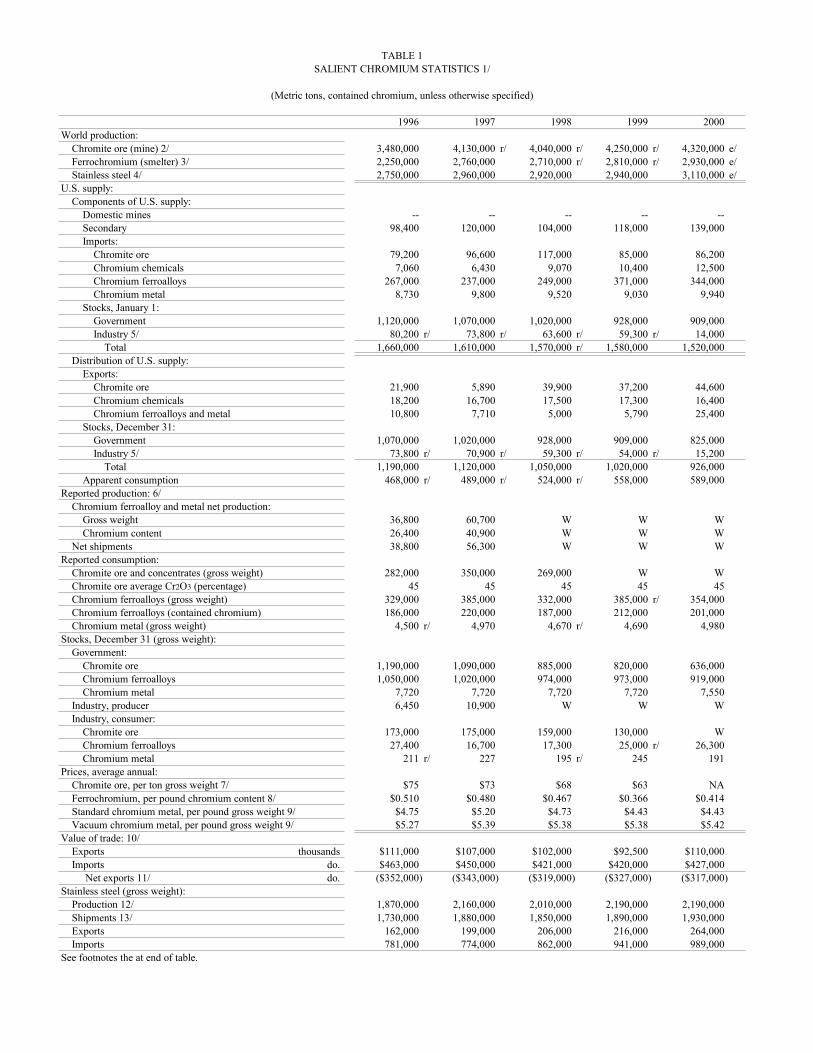
TABLE 1SALIENT CHROMIUM STATISTICS 1/
(Metric tons, contained chromium, unless otherwise specified)
1996 1997 1998 1999 2000World production: Chromite ore (mine) 2/ 3,480,000 4,130,000 r/ 4,040,000 r/ 4,250,000 r/ 4,320,000 e/ Ferrochromium (smelter) 3/ 2,250,000 2,760,000 2,710,000 r/ 2,810,000 r/ 2,930,000 e/ Stainless steel 4/ 2,750,000 2,960,000 2,920,000 2,940,000 3,110,000 e/U.S. supply: Components of U.S. supply: Domestic mines -- -- -- -- -- Secondary 98,400 120,000 104,000 118,000 139,000 Imports: Chromite ore 79,200 96,600 117,000 85,000 86,200 Chromium chemicals 7,060 6,430 9,070 10,400 12,500 Chromium ferroalloys 267,000 237,000 249,000 371,000 344,000 Chromium metal 8,730 9,800 9,520 9,030 9,940 Stocks, January 1: Government 1,120,000 1,070,000 1,020,000 928,000 909,000 Industry 5/ 80,200 r/ 73,800 r/ 63,600 r/ 59,300 r/ 14,000 Total 1,660,000 1,610,000 1,570,000 r/ 1,580,000 1,520,000 Distribution of U.S. supply: Exports: Chromite ore 21,900 5,890 39,900 37,200 44,600 Chromium chemicals 18,200 16,700 17,500 17,300 16,400 Chromium ferroalloys and metal 10,800 7,710 5,000 5,790 25,400 Stocks, December 31: Government 1,070,000 1,020,000 928,000 909,000 825,000 Industry 5/ 73,800 r/ 70,900 r/ 59,300 r/ 54,000 r/ 15,200 Total 1,190,000 1,120,000 1,050,000 1,020,000 926,000 Apparent consumption 468,000 r/ 489,000 r/ 524,000 r/ 558,000 589,000Reported production: 6/ Chromium ferroalloy and metal net production: Gross weight 36,800 60,700 W W W Chromium content 26,400 40,900 W W W Net shipments 38,800 56,300 W W WReported consumption: Chromite ore and concentrates (gross weight) 282,000 350,000 269,000 W W Chromite ore average Cr2O3 (percentage) 45 45 45 45 45 Chromium ferroalloys (gross weight) 329,000 385,000 332,000 385,000 r/ 354,000 Chromium ferroalloys (contained chromium) 186,000 220,000 187,000 212,000 201,000 Chromium metal (gross weight) 4,500 r/ 4,970 4,670 r/ 4,690 4,980Stocks, December 31 (gross weight): Government: Chromite ore 1,190,000 1,090,000 885,000 820,000 636,000 Chromium ferroalloys 1,050,000 1,020,000 974,000 973,000 919,000 Chromium metal 7,720 7,720 7,720 7,720 7,550 Industry, producer 6,450 10,900 W W W Industry, consumer: Chromite ore 173,000 175,000 159,000 130,000 W Chromium ferroalloys 27,400 16,700 17,300 25,000 r/ 26,300 Chromium metal 211 r/ 227 195 r/ 245 191Prices, average annual: Chromite ore, per ton gross weight 7/ $75 $73 $68 $63 NA Ferrochromium, per pound chromium content 8/ $0.510 $0.480 $0.467 $0.366 $0.414 Standard chromium metal, per pound gross weight 9/ $4.75 $5.20 $4.73 $4.43 $4.43 Vacuum chromium metal, per pound gross weight 9/ $5.27 $5.39 $5.38 $5.38 $5.42Value of trade: 10/ Exports thousands $111,000 $107,000 $102,000 $92,500 $110,000 Imports do. $463,000 $450,000 $421,000 $420,000 $427,000 Net exports 11/ do. ($352,000) ($343,000) ($319,000) ($327,000) ($317,000)Stainless steel (gross weight): Production 12/ 1,870,000 2,160,000 2,010,000 2,190,000 2,190,000 Shipments 13/ 1,730,000 1,880,000 1,850,000 1,890,000 1,930,000 Exports 162,000 199,000 206,000 216,000 264,000 Imports 781,000 774,000 862,000 941,000 989,000See footnotes the at end of table.
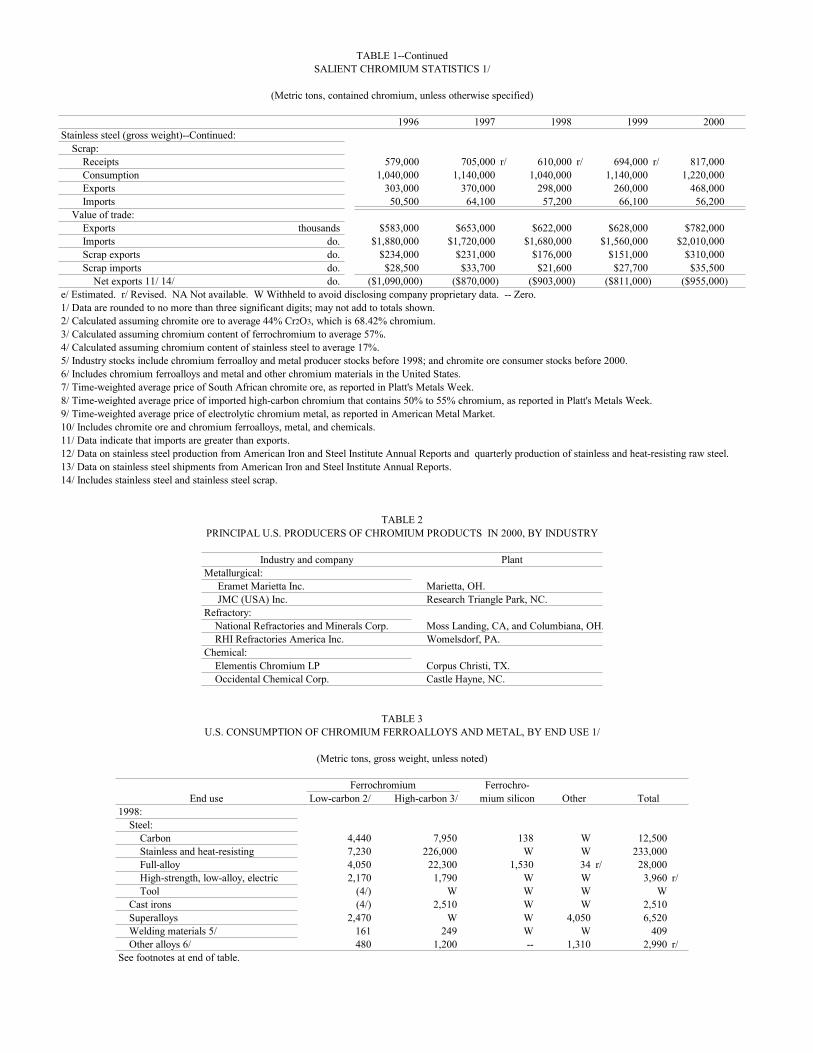
TABLE 1--ContinuedSALIENT CHROMIUM STATISTICS 1/
(Metric tons, contained chromium, unless otherwise specified)
1996 1997 1998 1999 2000Stainless steel (gross weight)--Continued: Scrap: Receipts 579,000 705,000 r/ 610,000 r/ 694,000 r/ 817,000 Consumption 1,040,000 1,140,000 1,040,000 1,140,000 1,220,000 Exports 303,000 370,000 298,000 260,000 468,000 Imports 50,500 64,100 57,200 66,100 56,200 Value of trade: Exports thousands $583,000 $653,000 $622,000 $628,000 $782,000 Imports do. $1,880,000 $1,720,000 $1,680,000 $1,560,000 $2,010,000 Scrap exports do. $234,000 $231,000 $176,000 $151,000 $310,000 Scrap imports do. $28,500 $33,700 $21,600 $27,700 $35,500 Net exports 11/ 14/ do. ($1,090,000) ($870,000) ($903,000) ($811,000) ($955,000)e/ Estimated. r/ Revised. NA Not available. W Withheld to avoid disclosing company proprietary data. -- Zero.1/ Data are rounded to no more than three significant digits; may not add to totals shown.2/ Calculated assuming chromite ore to average 44% Cr2O3, which is 68.42% chromium.3/ Calculated assuming chromium content of ferrochromium to average 57%.4/ Calculated assuming chromium content of stainless steel to average 17%.5/ Industry stocks include chromium ferroalloy and metal producer stocks before 1998; and chromite ore consumer stocks before 2000.6/ Includes chromium ferroalloys and metal and other chromium materials in the United States.7/ Time-weighted average price of South African chromite ore, as reported in Platt's Metals Week.8/ Time-weighted average price of imported high-carbon chromium that contains 50% to 55% chromium, as reported in Platt's Metals Week.9/ Time-weighted average price of electrolytic chromium metal, as reported in American Metal Market.10/ Includes chromite ore and chromium ferroalloys, metal, and chemicals.11/ Data indicate that imports are greater than exports.12/ Data on stainless steel production from American Iron and Steel Institute Annual Reports and quarterly production of stainless and heat-resisting raw steel.13/ Data on stainless steel shipments from American Iron and Steel Institute Annual Reports.14/ Includes stainless steel and stainless steel scrap.
TABLE 2PRINCIPAL U.S. PRODUCERS OF CHROMIUM PRODUCTS IN 2000, BY INDUSTRY
Industry and company PlantMetallurgical: Eramet Marietta Inc. Marietta, OH. JMC (USA) Inc. Research Triangle Park, NC. Refractory: National Refractories and Minerals Corp. Moss Landing, CA, and Columbiana, OH. RHI Refractories America Inc. Womelsdorf, PA.Chemical: Elementis Chromium LP Corpus Christi, TX. Occidental Chemical Corp. Castle Hayne, NC.
TABLE 3U.S. CONSUMPTION OF CHROMIUM FERROALLOYS AND METAL, BY END USE 1/
(Metric tons, gross weight, unless noted)
Ferrochromium Ferrochro-End use Low-carbon 2/ High-carbon 3/ mium silicon Other Total
1998: Steel: Carbon 4,440 7,950 138 W 12,500 Stainless and heat-resisting 7,230 226,000 W W 233,000 Full-alloy 4,050 22,300 1,530 34 r/ 28,000 High-strength, low-alloy, electric 2,170 1,790 W W 3,960 r/ Tool (4/) W W W W Cast irons (4/) 2,510 W W 2,510 Superalloys 2,470 W W 4,050 6,520 Welding materials 5/ 161 249 W W 409 Other alloys 6/ 480 1,200 -- 1,310 2,990 r/See footnotes at end of table.
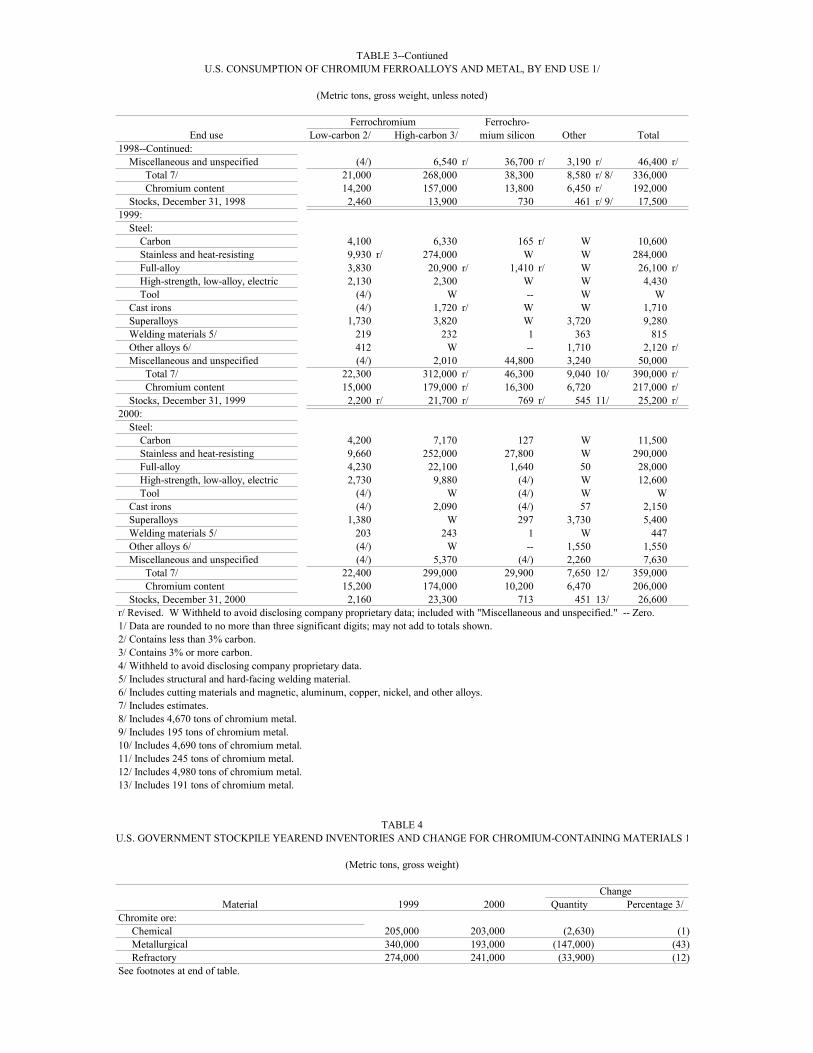
TABLE 3--ContiunedU.S. CONSUMPTION OF CHROMIUM FERROALLOYS AND METAL, BY END USE 1/
(Metric tons, gross weight, unless noted)
Ferrochromium Ferrochro-End use Low-carbon 2/ High-carbon 3/ mium silicon Other Total
1998--Continued: Miscellaneous and unspecified (4/) 6,540 r/ 36,700 r/ 3,190 r/ 46,400 r/ Total 7/ 21,000 268,000 38,300 8,580 r/ 8/ 336,000 Chromium content 14,200 157,000 13,800 6,450 r/ 192,000 Stocks, December 31, 1998 2,460 13,900 730 461 r/ 9/ 17,5001999: Steel: Carbon 4,100 6,330 165 r/ W 10,600 Stainless and heat-resisting 9,930 r/ 274,000 W W 284,000 Full-alloy 3,830 20,900 r/ 1,410 r/ W 26,100 r/ High-strength, low-alloy, electric 2,130 2,300 W W 4,430 Tool (4/) W -- W W Cast irons (4/) 1,720 r/ W W 1,710 Superalloys 1,730 3,820 W 3,720 9,280 Welding materials 5/ 219 232 1 363 815 Other alloys 6/ 412 W -- 1,710 2,120 r/ Miscellaneous and unspecified (4/) 2,010 44,800 3,240 50,000 Total 7/ 22,300 312,000 r/ 46,300 9,040 10/ 390,000 r/ Chromium content 15,000 179,000 r/ 16,300 6,720 217,000 r/ Stocks, December 31, 1999 2,200 r/ 21,700 r/ 769 r/ 545 11/ 25,200 r/2000: Steel: Carbon 4,200 7,170 127 W 11,500 Stainless and heat-resisting 9,660 252,000 27,800 W 290,000 Full-alloy 4,230 22,100 1,640 50 28,000 High-strength, low-alloy, electric 2,730 9,880 (4/) W 12,600 Tool (4/) W (4/) W W Cast irons (4/) 2,090 (4/) 57 2,150 Superalloys 1,380 W 297 3,730 5,400 Welding materials 5/ 203 243 1 W 447 Other alloys 6/ (4/) W -- 1,550 1,550 Miscellaneous and unspecified (4/) 5,370 (4/) 2,260 7,630 Total 7/ 22,400 299,000 29,900 7,650 12/ 359,000 Chromium content 15,200 174,000 10,200 6,470 206,000 Stocks, December 31, 2000 2,160 23,300 713 451 13/ 26,600r/ Revised. W Withheld to avoid disclosing company proprietary data; included with "Miscellaneous and unspecified." -- Zero.1/ Data are rounded to no more than three significant digits; may not add to totals shown.2/ Contains less than 3% carbon.3/ Contains 3% or more carbon.4/ Withheld to avoid disclosing company proprietary data.5/ Includes structural and hard-facing welding material.6/ Includes cutting materials and magnetic, aluminum, copper, nickel, and other alloys.7/ Includes estimates.8/ Includes 4,670 tons of chromium metal.9/ Includes 195 tons of chromium metal.10/ Includes 4,690 tons of chromium metal.11/ Includes 245 tons of chromium metal.12/ Includes 4,980 tons of chromium metal.13/ Includes 191 tons of chromium metal.
TABLE 4U.S. GOVERNMENT STOCKPILE YEAREND INVENTORIES AND CHANGE FOR CHROMIUM-CONTAINING MATERIALS 1
(Metric tons, gross weight)
Change Material 1999 2000 Quantity Percentage 3/
Chromite ore: Chemical 205,000 203,000 (2,630) (1) Metallurgical 340,000 193,000 (147,000) (43) Refractory 274,000 241,000 (33,900) (12)See footnotes at end of table.
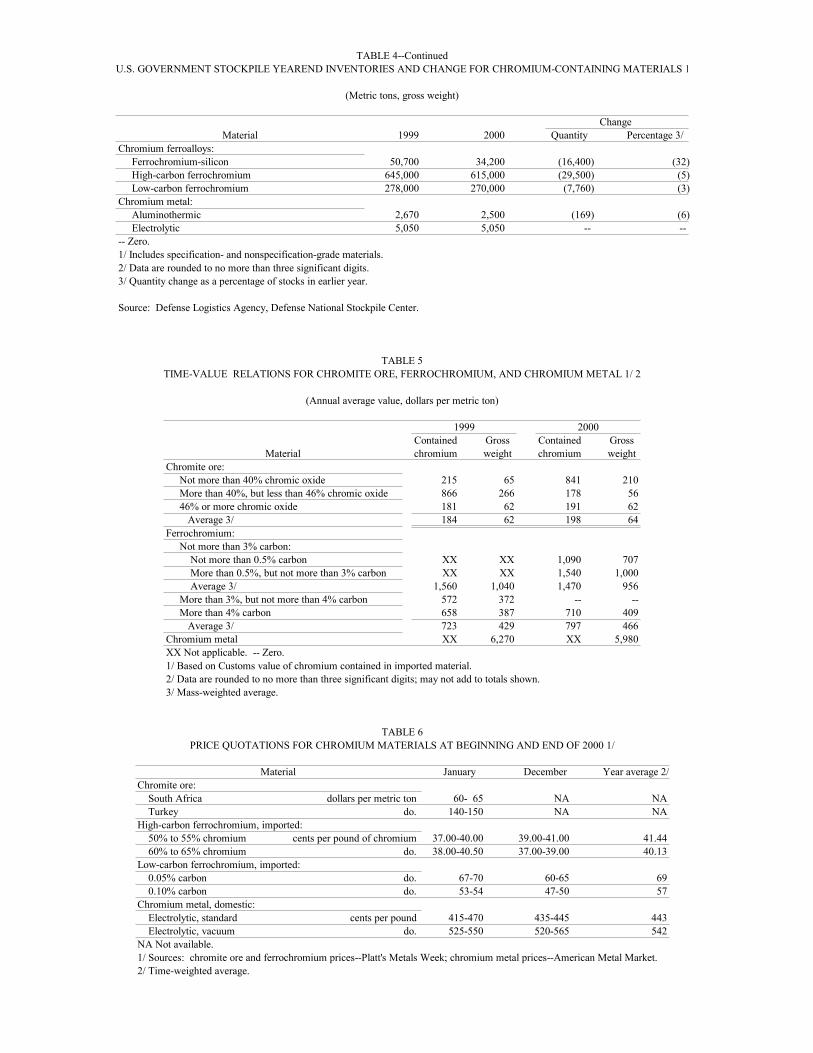
TABLE 4--ContinuedU.S. GOVERNMENT STOCKPILE YEAREND INVENTORIES AND CHANGE FOR CHROMIUM-CONTAINING MATERIALS 1
(Metric tons, gross weight)
Change Material 1999 2000 Quantity Percentage 3/
Chromium ferroalloys: Ferrochromium-silicon 50,700 34,200 (16,400) (32) High-carbon ferrochromium 645,000 615,000 (29,500) (5) Low-carbon ferrochromium 278,000 270,000 (7,760) (3)Chromium metal: Aluminothermic 2,670 2,500 (169) (6) Electrolytic 5,050 5,050 -- ---- Zero.1/ Includes specification- and nonspecification-grade materials.2/ Data are rounded to no more than three significant digits.3/ Quantity change as a percentage of stocks in earlier year.
Source: Defense Logistics Agency, Defense National Stockpile Center.
TABLE 5TIME-VALUE RELATIONS FOR CHROMITE ORE, FERROCHROMIUM, AND CHROMIUM METAL 1/ 2/
(Annual average value, dollars per metric ton)
1999 2000Contained Gross Contained Gross
Material chromium weight chromium weightChromite ore: Not more than 40% chromic oxide 215 65 841 210 More than 40%, but less than 46% chromic oxide 866 266 178 56 46% or more chromic oxide 181 62 191 62 Average 3/ 184 62 198 64Ferrochromium: Not more than 3% carbon: Not more than 0.5% carbon XX XX 1,090 707 More than 0.5%, but not more than 3% carbon XX XX 1,540 1,000 Average 3/ 1,560 1,040 1,470 956 More than 3%, but not more than 4% carbon 572 372 -- -- More than 4% carbon 658 387 710 409 Average 3/ 723 429 797 466Chromium metal XX 6,270 XX 5,980XX Not applicable. -- Zero.1/ Based on Customs value of chromium contained in imported material.2/ Data are rounded to no more than three significant digits; may not add to totals shown.3/ Mass-weighted average.
TABLE 6PRICE QUOTATIONS FOR CHROMIUM MATERIALS AT BEGINNING AND END OF 2000 1/
Material January December Year average 2/Chromite ore: South Africa dollars per metric ton 60- 65 NA NA Turkey do. 140-150 NA NAHigh-carbon ferrochromium, imported: 50% to 55% chromium cents per pound of chromium 37.00-40.00 39.00-41.00 41.44 60% to 65% chromium do. 38.00-40.50 37.00-39.00 40.13Low-carbon ferrochromium, imported: 0.05% carbon do. 67-70 60-65 69 0.10% carbon do. 53-54 47-50 57Chromium metal, domestic: Electrolytic, standard cents per pound 415-470 435-445 443 Electrolytic, vacuum do. 525-550 520-565 542NA Not available.1/ Sources: chromite ore and ferrochromium prices--Platt's Metals Week; chromium metal prices--American Metal Market.2/ Time-weighted average.
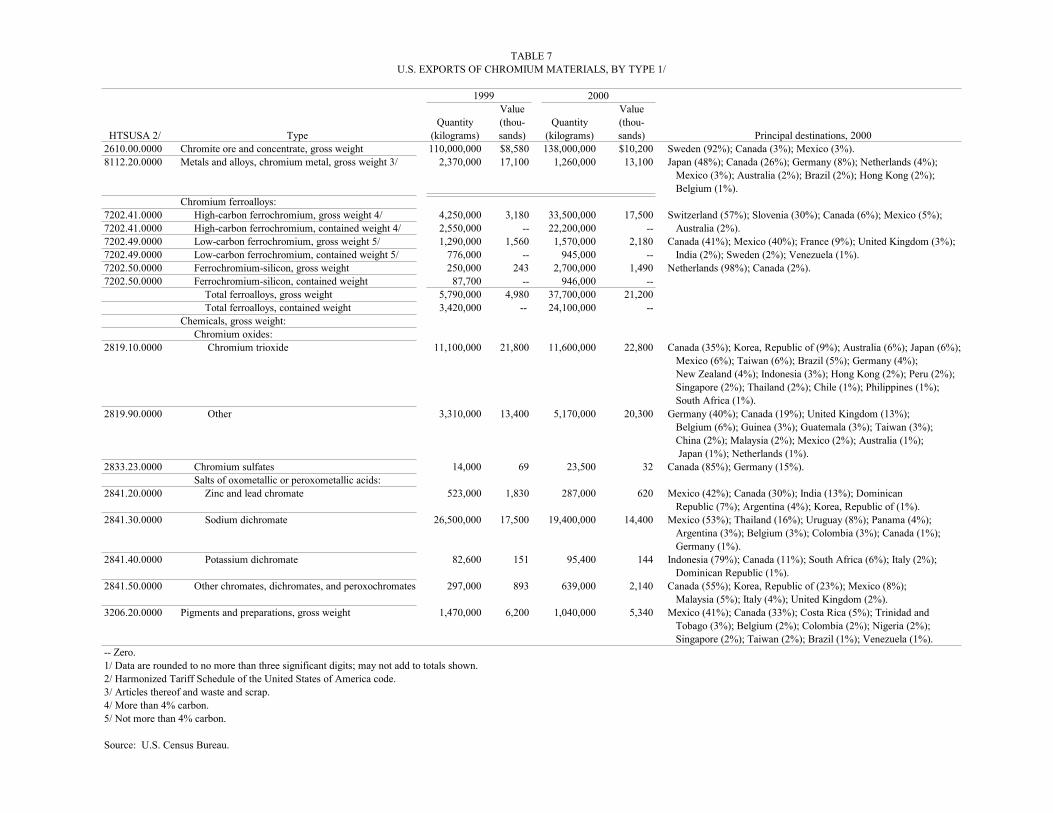
TABLE 7U.S. EXPORTS OF CHROMIUM MATERIALS, BY TYPE 1/
1999 2000Value Value
Quantity (thou- Quantity (thou-HTSUSA 2/ Type (kilograms) sands) (kilograms) sands) Principal destinations, 2000
2610.00.0000 Chromite ore and concentrate, gross weight 110,000,000 $8,580 138,000,000 $10,200 Sweden (92%); Canada (3%); Mexico (3%).8112.20.0000 Metals and alloys, chromium metal, gross weight 3/ 2,370,000 17,100 1,260,000 13,100 Japan (48%); Canada (26%); Germany (8%); Netherlands (4%);
Mexico (3%); Australia (2%); Brazil (2%); Hong Kong (2%); Belgium (1%).
Chromium ferroalloys:7202.41.0000 High-carbon ferrochromium, gross weight 4/ 4,250,000 3,180 33,500,000 17,500 Switzerland (57%); Slovenia (30%); Canada (6%); Mexico (5%); 7202.41.0000 High-carbon ferrochromium, contained weight 4/ 2,550,000 -- 22,200,000 -- Australia (2%).7202.49.0000 Low-carbon ferrochromium, gross weight 5/ 1,290,000 1,560 1,570,000 2,180 Canada (41%); Mexico (40%); France (9%); United Kingdom (3%); 7202.49.0000 Low-carbon ferrochromium, contained weight 5/ 776,000 -- 945,000 -- India (2%); Sweden (2%); Venezuela (1%).7202.50.0000 Ferrochromium-silicon, gross weight 250,000 243 2,700,000 1,490 Netherlands (98%); Canada (2%).7202.50.0000 Ferrochromium-silicon, contained weight 87,700 -- 946,000 --
Total ferroalloys, gross weight 5,790,000 4,980 37,700,000 21,200 Total ferroalloys, contained weight 3,420,000 -- 24,100,000 --Chemicals, gross weight: Chromium oxides:
2819.10.0000 Chromium trioxide 11,100,000 21,800 11,600,000 22,800 Canada (35%); Korea, Republic of (9%); Australia (6%); Japan (6%); Mexico (6%); Taiwan (6%); Brazil (5%); Germany (4%); New Zealand (4%); Indonesia (3%); Hong Kong (2%); Peru (2%); Singapore (2%); Thailand (2%); Chile (1%); Philippines (1%); South Africa (1%).
2819.90.0000 Other 3,310,000 13,400 5,170,000 20,300 Germany (40%); Canada (19%); United Kingdom (13%); Belgium (6%); Guinea (3%); Guatemala (3%); Taiwan (3%); China (2%); Malaysia (2%); Mexico (2%); Australia (1%); Japan (1%); Netherlands (1%).
2833.23.0000 Chromium sulfates 14,000 69 23,500 32 Canada (85%); Germany (15%). Salts of oxometallic or peroxometallic acids:
2841.20.0000 Zinc and lead chromate 523,000 1,830 287,000 620 Mexico (42%); Canada (30%); India (13%); Dominican Republic (7%); Argentina (4%); Korea, Republic of (1%).
2841.30.0000 Sodium dichromate 26,500,000 17,500 19,400,000 14,400 Mexico (53%); Thailand (16%); Uruguay (8%); Panama (4%); Argentina (3%); Belgium (3%); Colombia (3%); Canada (1%); Germany (1%).
2841.40.0000 Potassium dichromate 82,600 151 95,400 144 Indonesia (79%); Canada (11%); South Africa (6%); Italy (2%); Dominican Republic (1%).
2841.50.0000 Other chromates, dichromates, and peroxochromates 297,000 893 639,000 2,140 Canada (55%); Korea, Republic of (23%); Mexico (8%); Malaysia (5%); Italy (4%); United Kingdom (2%).
3206.20.0000 Pigments and preparations, gross weight 1,470,000 6,200 1,040,000 5,340 Mexico (41%); Canada (33%); Costa Rica (5%); Trinidad and Tobago (3%); Belgium (2%); Colombia (2%); Nigeria (2%); Singapore (2%); Taiwan (2%); Brazil (1%); Venezuela (1%).
-- Zero.1/ Data are rounded to no more than three significant digits; may not add to totals shown.2/ Harmonized Tariff Schedule of the United States of America code.3/ Articles thereof and waste and scrap.4/ More than 4% carbon.5/ Not more than 4% carbon.
Source: U.S. Census Bureau.
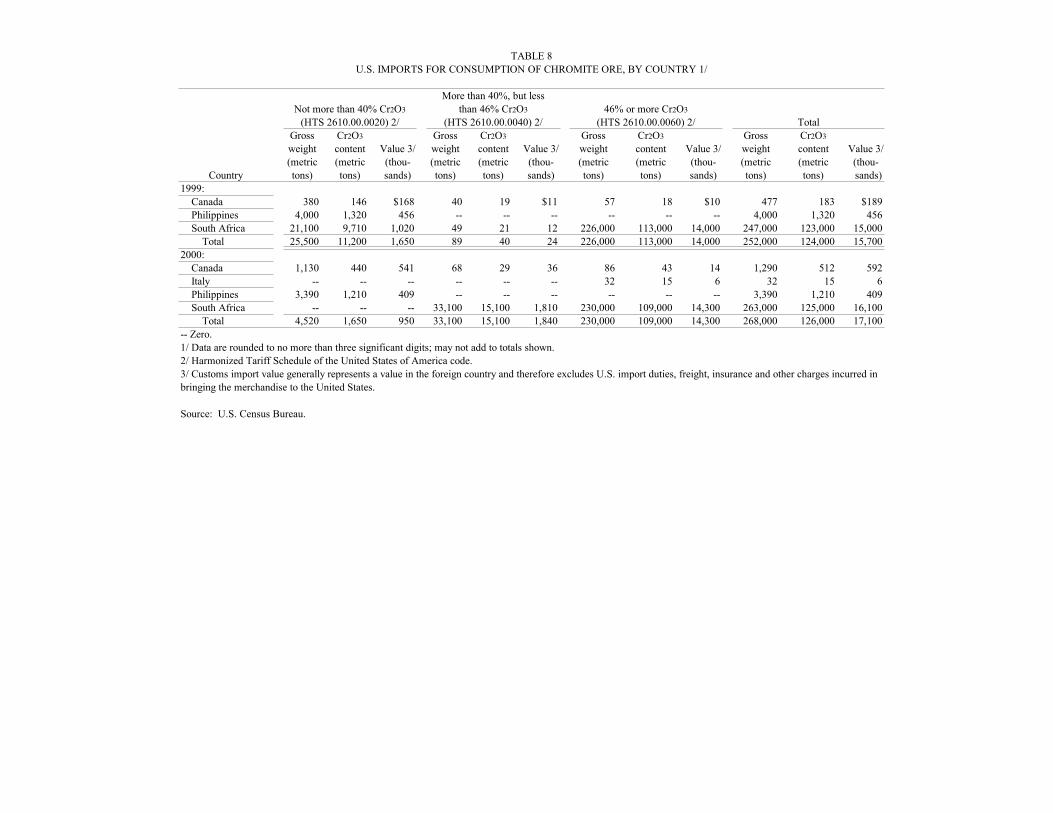
TABLE 8U.S. IMPORTS FOR CONSUMPTION OF CHROMITE ORE, BY COUNTRY 1/
More than 40%, but lessNot more than 40% Cr2O3 than 46% Cr2O3 46% or more Cr2O3
(HTS 2610.00.0020) 2/ (HTS 2610.00.0040) 2/ (HTS 2610.00.0060) 2/ TotalGross Cr2O3 Gross Cr2O3 Gross Cr2O3 Gross Cr2O3
weight content Value 3/ weight content Value 3/ weight content Value 3/ weight content Value 3/(metric (metric (thou- (metric (metric (thou- (metric (metric (thou- (metric (metric (thou-
Country tons) tons) sands) tons) tons) sands) tons) tons) sands) tons) tons) sands)1999: Canada 380 146 $168 40 19 $11 57 18 $10 477 183 $189 Philippines 4,000 1,320 456 -- -- -- -- -- -- 4,000 1,320 456 South Africa 21,100 9,710 1,020 49 21 12 226,000 113,000 14,000 247,000 123,000 15,000 Total 25,500 11,200 1,650 89 40 24 226,000 113,000 14,000 252,000 124,000 15,7002000: Canada 1,130 440 541 68 29 36 86 43 14 1,290 512 592 Italy -- -- -- -- -- -- 32 15 6 32 15 6 Philippines 3,390 1,210 409 -- -- -- -- -- -- 3,390 1,210 409 South Africa -- -- -- 33,100 15,100 1,810 230,000 109,000 14,300 263,000 125,000 16,100 Total 4,520 1,650 950 33,100 15,100 1,840 230,000 109,000 14,300 268,000 126,000 17,100-- Zero.1/ Data are rounded to no more than three significant digits; may not add to totals shown.2/ Harmonized Tariff Schedule of the United States of America code.3/ Customs import value generally represents a value in the foreign country and therefore excludes U.S. import duties, freight, insurance and other charges incurred inbringing the merchandise to the United States.
Source: U.S. Census Bureau.
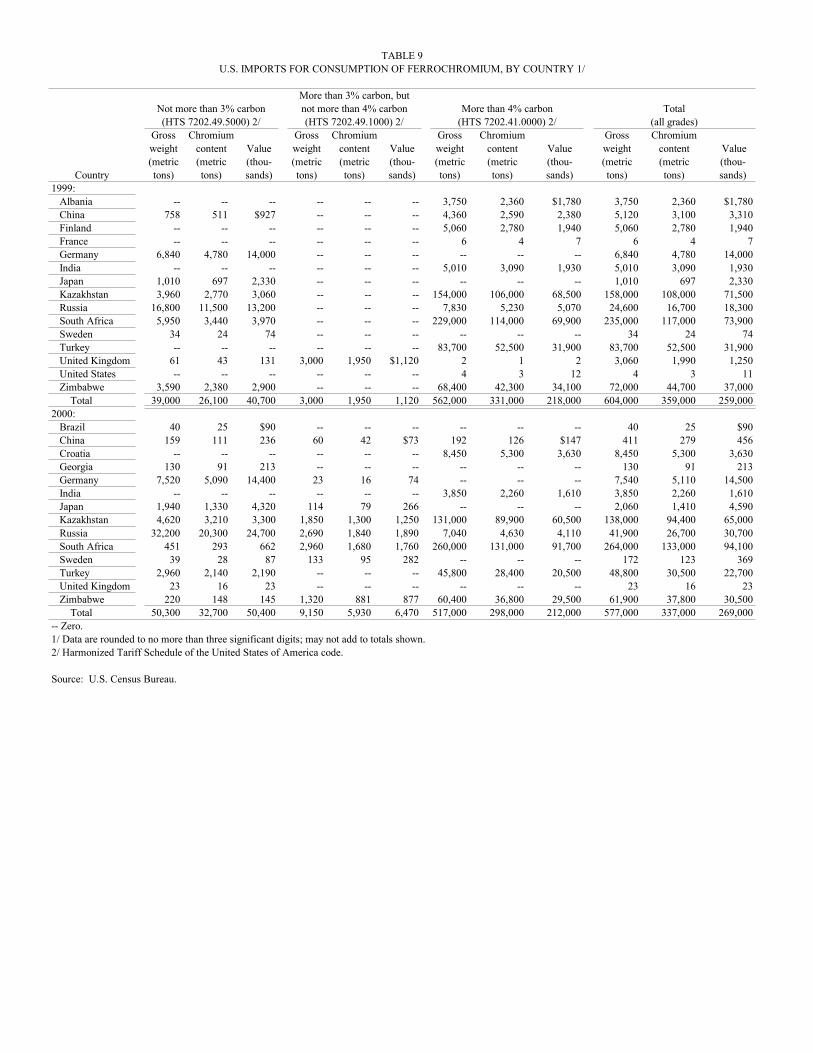
TABLE 9U.S. IMPORTS FOR CONSUMPTION OF FERROCHROMIUM, BY COUNTRY 1/
More than 3% carbon, but Not more than 3% carbon not more than 4% carbon More than 4% carbon Total(HTS 7202.49.5000) 2/ (HTS 7202.49.1000) 2/ (HTS 7202.41.0000) 2/ (all grades)
Gross Chromium Gross Chromium Gross Chromium Gross Chromiumweight content Value weight content Value weight content Value weight content Value(metric (metric (thou- (metric (metric (thou- (metric (metric (thou- (metric (metric (thou-
Country tons) tons) sands) tons) tons) sands) tons) tons) sands) tons) tons) sands)1999: Albania -- -- -- -- -- -- 3,750 2,360 $1,780 3,750 2,360 $1,780 China 758 511 $927 -- -- -- 4,360 2,590 2,380 5,120 3,100 3,310 Finland -- -- -- -- -- -- 5,060 2,780 1,940 5,060 2,780 1,940 France -- -- -- -- -- -- 6 4 7 6 4 7 Germany 6,840 4,780 14,000 -- -- -- -- -- -- 6,840 4,780 14,000 India -- -- -- -- -- -- 5,010 3,090 1,930 5,010 3,090 1,930 Japan 1,010 697 2,330 -- -- -- -- -- -- 1,010 697 2,330 Kazakhstan 3,960 2,770 3,060 -- -- -- 154,000 106,000 68,500 158,000 108,000 71,500 Russia 16,800 11,500 13,200 -- -- -- 7,830 5,230 5,070 24,600 16,700 18,300 South Africa 5,950 3,440 3,970 -- -- -- 229,000 114,000 69,900 235,000 117,000 73,900 Sweden 34 24 74 -- -- -- -- -- -- 34 24 74 Turkey -- -- -- -- -- -- 83,700 52,500 31,900 83,700 52,500 31,900 United Kingdom 61 43 131 3,000 1,950 $1,120 2 1 2 3,060 1,990 1,250 United States -- -- -- -- -- -- 4 3 12 4 3 11 Zimbabwe 3,590 2,380 2,900 -- -- -- 68,400 42,300 34,100 72,000 44,700 37,000 Total 39,000 26,100 40,700 3,000 1,950 1,120 562,000 331,000 218,000 604,000 359,000 259,0002000: Brazil 40 25 $90 -- -- -- -- -- -- 40 25 $90 China 159 111 236 60 42 $73 192 126 $147 411 279 456 Croatia -- -- -- -- -- -- 8,450 5,300 3,630 8,450 5,300 3,630 Georgia 130 91 213 -- -- -- -- -- -- 130 91 213 Germany 7,520 5,090 14,400 23 16 74 -- -- -- 7,540 5,110 14,500 India -- -- -- -- -- -- 3,850 2,260 1,610 3,850 2,260 1,610 Japan 1,940 1,330 4,320 114 79 266 -- -- -- 2,060 1,410 4,590 Kazakhstan 4,620 3,210 3,300 1,850 1,300 1,250 131,000 89,900 60,500 138,000 94,400 65,000 Russia 32,200 20,300 24,700 2,690 1,840 1,890 7,040 4,630 4,110 41,900 26,700 30,700 South Africa 451 293 662 2,960 1,680 1,760 260,000 131,000 91,700 264,000 133,000 94,100 Sweden 39 28 87 133 95 282 -- -- -- 172 123 369 Turkey 2,960 2,140 2,190 -- -- -- 45,800 28,400 20,500 48,800 30,500 22,700 United Kingdom 23 16 23 -- -- -- -- -- -- 23 16 23 Zimbabwe 220 148 145 1,320 881 877 60,400 36,800 29,500 61,900 37,800 30,500 Total 50,300 32,700 50,400 9,150 5,930 6,470 517,000 298,000 212,000 577,000 337,000 269,000-- Zero.1/ Data are rounded to no more than three significant digits; may not add to totals shown.2/ Harmonized Tariff Schedule of the United States of America code.
Source: U.S. Census Bureau.
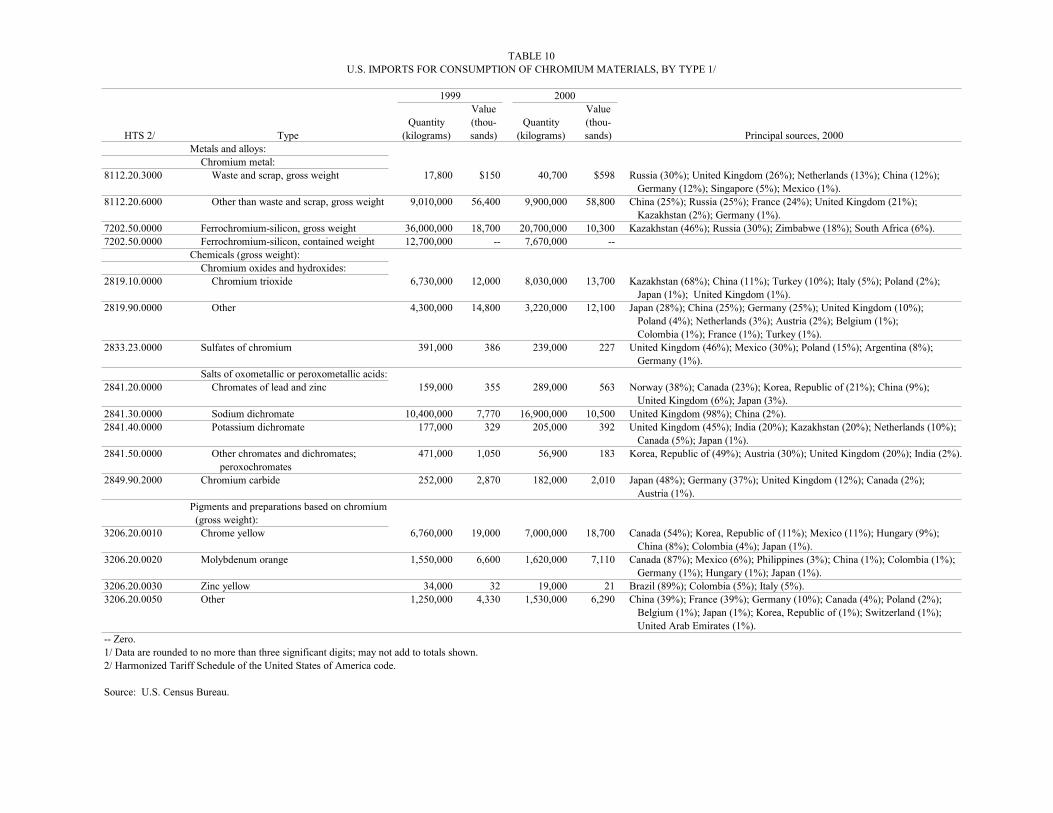
TABLE 10U.S. IMPORTS FOR CONSUMPTION OF CHROMIUM MATERIALS, BY TYPE 1/
1999 2000Value Value
Quantity (thou- Quantity (thou-HTS 2/ Type (kilograms) sands) (kilograms) sands) Principal sources, 2000
Metals and alloys: Chromium metal:
8112.20.3000 Waste and scrap, gross weight 17,800 $150 40,700 $598 Russia (30%); United Kingdom (26%); Netherlands (13%); China (12%); Germany (12%); Singapore (5%); Mexico (1%).
8112.20.6000 Other than waste and scrap, gross weight 9,010,000 56,400 9,900,000 58,800 China (25%); Russia (25%); France (24%); United Kingdom (21%); Kazakhstan (2%); Germany (1%).
7202.50.0000 Ferrochromium-silicon, gross weight 36,000,000 18,700 20,700,000 10,300 Kazakhstan (46%); Russia (30%); Zimbabwe (18%); South Africa (6%).7202.50.0000 Ferrochromium-silicon, contained weight 12,700,000 -- 7,670,000 --
Chemicals (gross weight): Chromium oxides and hydroxides:
2819.10.0000 Chromium trioxide 6,730,000 12,000 8,030,000 13,700 Kazakhstan (68%); China (11%); Turkey (10%); Italy (5%); Poland (2%); Japan (1%); United Kingdom (1%).
2819.90.0000 Other 4,300,000 14,800 3,220,000 12,100 Japan (28%); China (25%); Germany (25%); United Kingdom (10%); Poland (4%); Netherlands (3%); Austria (2%); Belgium (1%); Colombia (1%); France (1%); Turkey (1%).
2833.23.0000 Sulfates of chromium 391,000 386 239,000 227 United Kingdom (46%); Mexico (30%); Poland (15%); Argentina (8%); Germany (1%).
Salts of oxometallic or peroxometallic acids:2841.20.0000 Chromates of lead and zinc 159,000 355 289,000 563 Norway (38%); Canada (23%); Korea, Republic of (21%); China (9%);
United Kingdom (6%); Japan (3%).2841.30.0000 Sodium dichromate 10,400,000 7,770 16,900,000 10,500 United Kingdom (98%); China (2%).2841.40.0000 Potassium dichromate 177,000 329 205,000 392 United Kingdom (45%); India (20%); Kazakhstan (20%); Netherlands (10%);
Canada (5%); Japan (1%).2841.50.0000 Other chromates and dichromates; 471,000 1,050 56,900 183 Korea, Republic of (49%); Austria (30%); United Kingdom (20%); India (2%).
peroxochromates 2849.90.2000 Chromium carbide 252,000 2,870 182,000 2,010 Japan (48%); Germany (37%); United Kingdom (12%); Canada (2%);
Austria (1%).Pigments and preparations based on chromium (gross weight):
3206.20.0010 Chrome yellow 6,760,000 19,000 7,000,000 18,700 Canada (54%); Korea, Republic of (11%); Mexico (11%); Hungary (9%); China (8%); Colombia (4%); Japan (1%).
3206.20.0020 Molybdenum orange 1,550,000 6,600 1,620,000 7,110 Canada (87%); Mexico (6%); Philippines (3%); China (1%); Colombia (1%); Germany (1%); Hungary (1%); Japan (1%).
3206.20.0030 Zinc yellow 34,000 32 19,000 21 Brazil (89%); Colombia (5%); Italy (5%).3206.20.0050 Other 1,250,000 4,330 1,530,000 6,290 China (39%); France (39%); Germany (10%); Canada (4%); Poland (2%);
Belgium (1%); Japan (1%); Korea, Republic of (1%); Switzerland (1%); United Arab Emirates (1%).
-- Zero.1/ Data are rounded to no more than three significant digits; may not add to totals shown.2/ Harmonized Tariff Schedule of the United States of America code.
Source: U.S. Census Bureau.
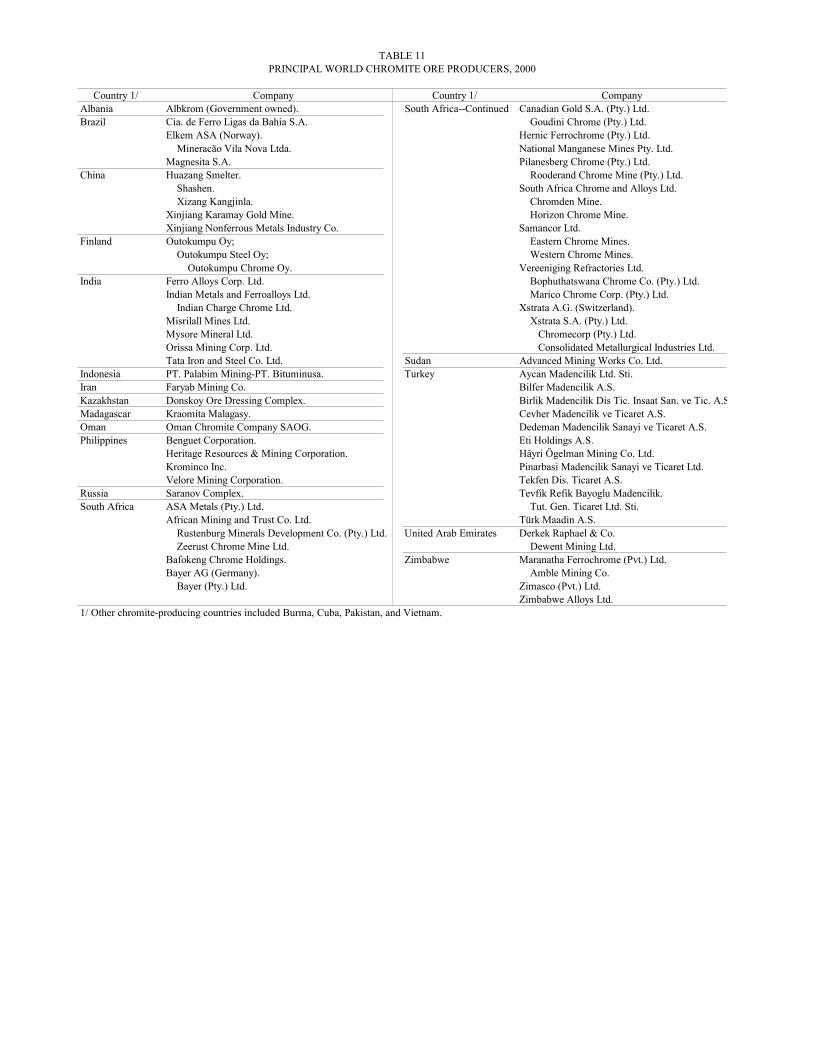
TABLE 11PRINCIPAL WORLD CHROMITE ORE PRODUCERS, 2000
Country 1/ Company Country 1/ CompanyAlbania Albkrom (Government owned). South Africa--Continued Canadian Gold S.A. (Pty.) Ltd.Brazil Cia. de Ferro Ligas da Bahia S.A. Goudini Chrome (Pty.) Ltd.
Elkem ASA (Norway). Hernic Ferrochrome (Pty.) Ltd. Mineracão Vila Nova Ltda. National Manganese Mines Pty. Ltd.Magnesita S.A. Pilanesberg Chrome (Pty.) Ltd.
China Huazang Smelter. Rooderand Chrome Mine (Pty.) Ltd. Shashen. South Africa Chrome and Alloys Ltd. Xizang Kangjinla. Chromden Mine.Xinjiang Karamay Gold Mine. Horizon Chrome Mine.Xinjiang Nonferrous Metals Industry Co. Samancor Ltd.
Finland Outokumpu Oy; Eastern Chrome Mines. Outokumpu Steel Oy; Western Chrome Mines. Outokumpu Chrome Oy. Vereeniging Refractories Ltd.
India Ferro Alloys Corp. Ltd. Bophuthatswana Chrome Co. (Pty.) Ltd.Indian Metals and Ferroalloys Ltd. Marico Chrome Corp. (Pty.) Ltd. Indian Charge Chrome Ltd. Xstrata A.G. (Switzerland).Misrilall Mines Ltd. Xstrata S.A. (Pty.) Ltd.Mysore Mineral Ltd. Chromecorp (Pty.) Ltd.Orissa Mining Corp. Ltd. Consolidated Metallurgical Industries Ltd.Tata Iron and Steel Co. Ltd. Sudan Advanced Mining Works Co. Ltd.
Indonesia PT. Palabim Mining-PT. Bituminusa. Turkey Aycan Madencilik Ltd. Sti.Iran Faryab Mining Co. Bilfer Madencilik A.S.Kazakhstan Donskoy Ore Dressing Complex. Birlik Madencilik Dis Tic. Insaat San. ve Tic. A.SMadagascar Kraomita Malagasy. Cevher Madencilik ve Ticaret A.S.Oman Oman Chromite Company SAOG. Dedeman Madencilik Sanayi ve Ticaret A.S.Philippines Benguet Corporation. Eti Holdings A.S.
Heritage Resources & Mining Corporation. Hâyri Ögelman Mining Co. Ltd.Krominco Inc. Pinarbasi Madencilik Sanayi ve Ticaret Ltd.Velore Mining Corporation. Tekfen Dis. Ticaret A.S.
Russia Saranov Complex. Tevfik Refik Bayoglu Madencilik.South Africa ASA Metals (Pty.) Ltd. Tut. Gen. Ticaret Ltd. Sti.
African Mining and Trust Co. Ltd. Türk Maadin A.S. Rustenburg Minerals Development Co. (Pty.) Ltd. United Arab Emirates Derkek Raphael & Co. Zeerust Chrome Mine Ltd. Dewent Mining Ltd.Bafokeng Chrome Holdings. Zimbabwe Maranatha Ferrochrome (Pvt.) Ltd.Bayer AG (Germany). Amble Mining Co. Bayer (Pty.) Ltd. Zimasco (Pvt.) Ltd.
Zimbabwe Alloys Ltd.1/ Other chromite-producing countries included Burma, Cuba, Pakistan, and Vietnam.
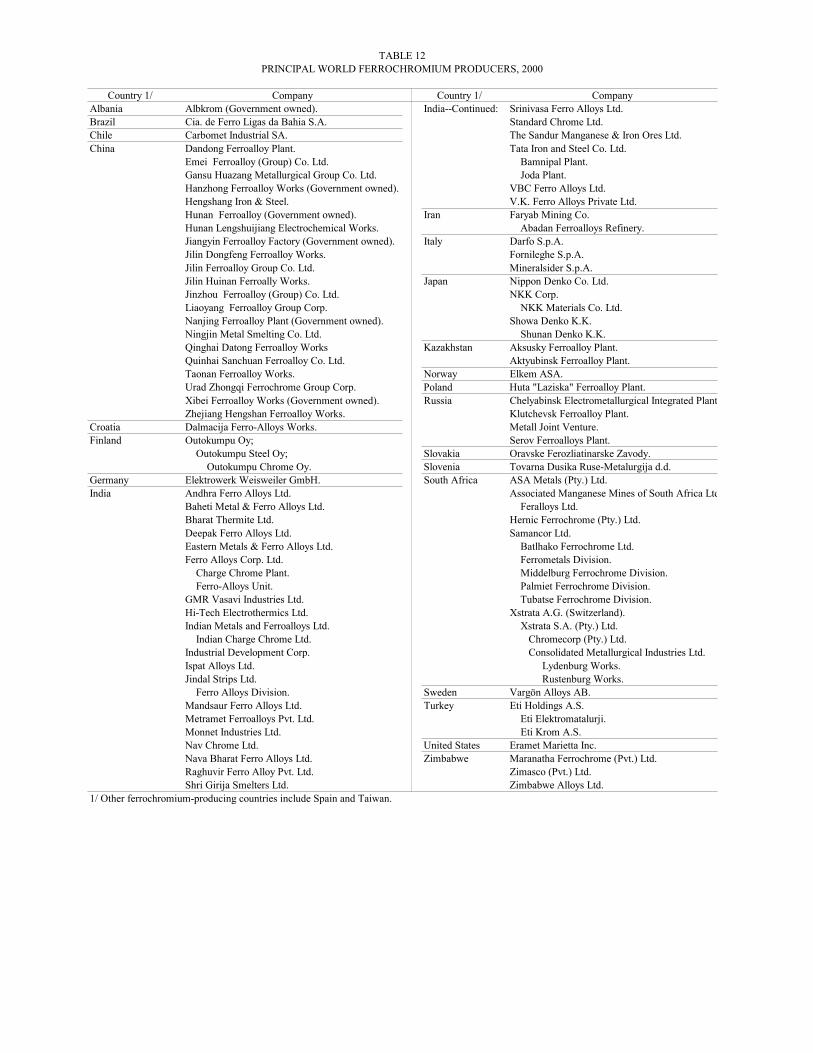
TABLE 12PRINCIPAL WORLD FERROCHROMIUM PRODUCERS, 2000
Country 1/ Company Country 1/ CompanyAlbania Albkrom (Government owned). India--Continued: Srinivasa Ferro Alloys Ltd.Brazil Cia. de Ferro Ligas da Bahia S.A. Standard Chrome Ltd. Chile Carbomet Industrial SA. The Sandur Manganese & Iron Ores Ltd.China Dandong Ferroalloy Plant. Tata Iron and Steel Co. Ltd.
Emei Ferroalloy (Group) Co. Ltd. Bamnipal Plant.Gansu Huazang Metallurgical Group Co. Ltd. Joda Plant.Hanzhong Ferroalloy Works (Government owned). VBC Ferro Alloys Ltd.Hengshang Iron & Steel. V.K. Ferro Alloys Private Ltd.Hunan Ferroalloy (Government owned). Iran Faryab Mining Co.Hunan Lengshuijiang Electrochemical Works. Abadan Ferroalloys Refinery.Jiangyin Ferroalloy Factory (Government owned). Italy Darfo S.p.A.Jilin Dongfeng Ferroalloy Works. Fornileghe S.p.A.Jilin Ferroalloy Group Co. Ltd. Mineralsider S.p.A.Jilin Huinan Ferroally Works. Japan Nippon Denko Co. Ltd.Jinzhou Ferroalloy (Group) Co. Ltd. NKK Corp.Liaoyang Ferroalloy Group Corp. NKK Materials Co. Ltd.Nanjing Ferroalloy Plant (Government owned). Showa Denko K.K.Ningjin Metal Smelting Co. Ltd. Shunan Denko K.K.Qinghai Datong Ferroalloy Works Kazakhstan Aksusky Ferroalloy Plant.Quinhai Sanchuan Ferroalloy Co. Ltd. Aktyubinsk Ferroalloy Plant.Taonan Ferroalloy Works. Norway Elkem ASA.Urad Zhongqi Ferrochrome Group Corp. Poland Huta "Laziska" Ferroalloy Plant.Xibei Ferroalloy Works (Government owned). Russia Chelyabinsk Electrometallurgical Integrated PlantZhejiang Hengshan Ferroalloy Works. Klutchevsk Ferroalloy Plant.
Croatia Dalmacija Ferro-Alloys Works. Metall Joint Venture.Finland Outokumpu Oy; Serov Ferroalloys Plant.
Outokumpu Steel Oy; Slovakia Oravske Ferozliatinarske Zavody. Outokumpu Chrome Oy. Slovenia Tovarna Dusika Ruse-Metalurgija d.d.
Germany Elektrowerk Weisweiler GmbH. South Africa ASA Metals (Pty.) Ltd.India Andhra Ferro Alloys Ltd. Associated Manganese Mines of South Africa Ltd
Baheti Metal & Ferro Alloys Ltd. Feralloys Ltd.Bharat Thermite Ltd. Hernic Ferrochrome (Pty.) Ltd.Deepak Ferro Alloys Ltd. Samancor Ltd.Eastern Metals & Ferro Alloys Ltd. Batlhako Ferrochrome Ltd.Ferro Alloys Corp. Ltd. Ferrometals Division. Charge Chrome Plant. Middelburg Ferrochrome Division. Ferro-Alloys Unit. Palmiet Ferrochrome Division.GMR Vasavi Industries Ltd. Tubatse Ferrochrome Division.Hi-Tech Electrothermics Ltd. Xstrata A.G. (Switzerland).Indian Metals and Ferroalloys Ltd. Xstrata S.A. (Pty.) Ltd. Indian Charge Chrome Ltd. Chromecorp (Pty.) Ltd.Industrial Development Corp. Consolidated Metallurgical Industries Ltd.Ispat Alloys Ltd. Lydenburg Works.Jindal Strips Ltd. Rustenburg Works. Ferro Alloys Division. Sweden Vargön Alloys AB.Mandsaur Ferro Alloys Ltd. Turkey Eti Holdings A.S.Metramet Ferroalloys Pvt. Ltd. Eti Elektromatalurji.Monnet Industries Ltd. Eti Krom A.S.Nav Chrome Ltd. United States Eramet Marietta Inc.Nava Bharat Ferro Alloys Ltd. Zimbabwe Maranatha Ferrochrome (Pvt.) Ltd.Raghuvir Ferro Alloy Pvt. Ltd. Zimasco (Pvt.) Ltd.Shri Girija Smelters Ltd. Zimbabwe Alloys Ltd.
1/ Other ferrochromium-producing countries include Spain and Taiwan.
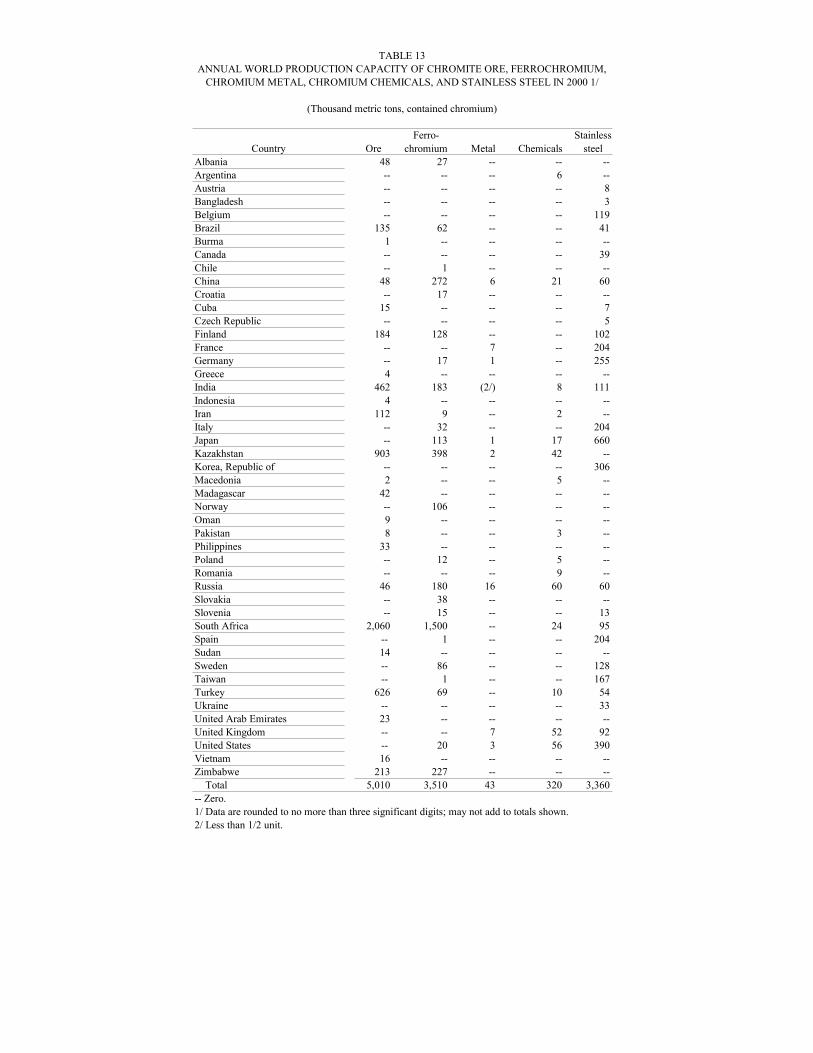
TABLE 13ANNUAL WORLD PRODUCTION CAPACITY OF CHROMITE ORE, FERROCHROMIUM,
CHROMIUM METAL, CHROMIUM CHEMICALS, AND STAINLESS STEEL IN 2000 1/
(Thousand metric tons, contained chromium)
Ferro- StainlessCountry Ore chromium Metal Chemicals steel
Albania 48 27 -- -- --Argentina -- -- -- 6 --Austria -- -- -- -- 8Bangladesh -- -- -- -- 3Belgium -- -- -- -- 119Brazil 135 62 -- -- 41Burma 1 -- -- -- --Canada -- -- -- -- 39Chile -- 1 -- -- --China 48 272 6 21 60Croatia -- 17 -- -- --Cuba 15 -- -- -- 7Czech Republic -- -- -- -- 5Finland 184 128 -- -- 102France -- -- 7 -- 204Germany -- 17 1 -- 255Greece 4 -- -- -- --India 462 183 (2/) 8 111Indonesia 4 -- -- -- --Iran 112 9 -- 2 --Italy -- 32 -- -- 204Japan -- 113 1 17 660Kazakhstan 903 398 2 42 --Korea, Republic of -- -- -- -- 306Macedonia 2 -- -- 5 --Madagascar 42 -- -- -- --Norway -- 106 -- -- --Oman 9 -- -- -- --Pakistan 8 -- -- 3 --Philippines 33 -- -- -- --Poland -- 12 -- 5 --Romania -- -- -- 9 --Russia 46 180 16 60 60Slovakia -- 38 -- -- --Slovenia -- 15 -- -- 13South Africa 2,060 1,500 -- 24 95Spain -- 1 -- -- 204Sudan 14 -- -- -- --Sweden -- 86 -- -- 128Taiwan -- 1 -- -- 167Turkey 626 69 -- 10 54Ukraine -- -- -- -- 33United Arab Emirates 23 -- -- -- --United Kingdom -- -- 7 52 92United States -- 20 3 56 390Vietnam 16 -- -- -- --Zimbabwe 213 227 -- -- -- Total 5,010 3,510 43 320 3,360-- Zero.1/ Data are rounded to no more than three significant digits; may not add to totals shown.2/ Less than 1/2 unit.
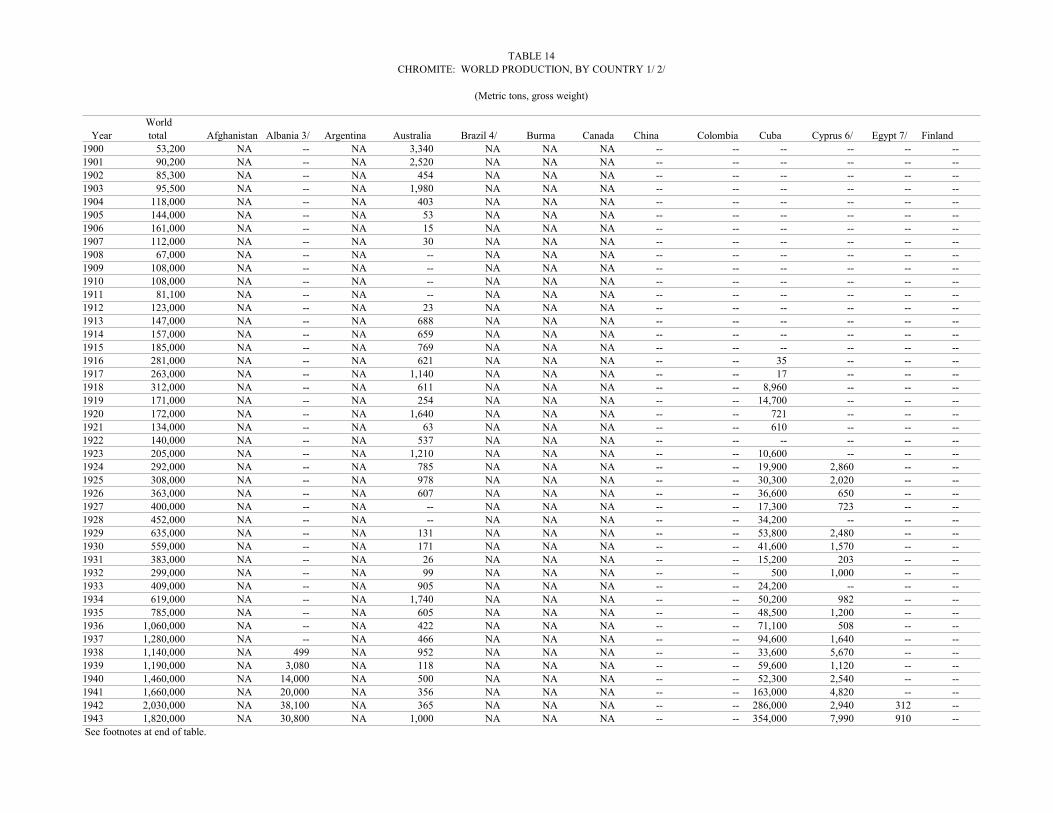
TABLE 14CHROMITE: WORLD PRODUCTION, BY COUNTRY 1/ 2/
(Metric tons, gross weight)
WorldYear total Afghanistan Albania 3/ Argentina Australia Brazil 4/ Burma Canada China Colombia Cuba Cyprus 6/ Egypt 7/ Finland
1900 53,200 NA -- NA 3,340 NA NA NA -- -- -- -- -- --1901 90,200 NA -- NA 2,520 NA NA NA -- -- -- -- -- --1902 85,300 NA -- NA 454 NA NA NA -- -- -- -- -- --1903 95,500 NA -- NA 1,980 NA NA NA -- -- -- -- -- --1904 118,000 NA -- NA 403 NA NA NA -- -- -- -- -- --1905 144,000 NA -- NA 53 NA NA NA -- -- -- -- -- --1906 161,000 NA -- NA 15 NA NA NA -- -- -- -- -- --1907 112,000 NA -- NA 30 NA NA NA -- -- -- -- -- --1908 67,000 NA -- NA -- NA NA NA -- -- -- -- -- --1909 108,000 NA -- NA -- NA NA NA -- -- -- -- -- --1910 108,000 NA -- NA -- NA NA NA -- -- -- -- -- --1911 81,100 NA -- NA -- NA NA NA -- -- -- -- -- --1912 123,000 NA -- NA 23 NA NA NA -- -- -- -- -- --1913 147,000 NA -- NA 688 NA NA NA -- -- -- -- -- --1914 157,000 NA -- NA 659 NA NA NA -- -- -- -- -- --1915 185,000 NA -- NA 769 NA NA NA -- -- -- -- -- --1916 281,000 NA -- NA 621 NA NA NA -- -- 35 -- -- --1917 263,000 NA -- NA 1,140 NA NA NA -- -- 17 -- -- --1918 312,000 NA -- NA 611 NA NA NA -- -- 8,960 -- -- --1919 171,000 NA -- NA 254 NA NA NA -- -- 14,700 -- -- --1920 172,000 NA -- NA 1,640 NA NA NA -- -- 721 -- -- --1921 134,000 NA -- NA 63 NA NA NA -- -- 610 -- -- --1922 140,000 NA -- NA 537 NA NA NA -- -- -- -- -- --1923 205,000 NA -- NA 1,210 NA NA NA -- -- 10,600 -- -- --1924 292,000 NA -- NA 785 NA NA NA -- -- 19,900 2,860 -- --1925 308,000 NA -- NA 978 NA NA NA -- -- 30,300 2,020 -- --1926 363,000 NA -- NA 607 NA NA NA -- -- 36,600 650 -- --1927 400,000 NA -- NA -- NA NA NA -- -- 17,300 723 -- --1928 452,000 NA -- NA -- NA NA NA -- -- 34,200 -- -- --1929 635,000 NA -- NA 131 NA NA NA -- -- 53,800 2,480 -- --1930 559,000 NA -- NA 171 NA NA NA -- -- 41,600 1,570 -- --1931 383,000 NA -- NA 26 NA NA NA -- -- 15,200 203 -- --1932 299,000 NA -- NA 99 NA NA NA -- -- 500 1,000 -- --1933 409,000 NA -- NA 905 NA NA NA -- -- 24,200 -- -- --1934 619,000 NA -- NA 1,740 NA NA NA -- -- 50,200 982 -- --1935 785,000 NA -- NA 605 NA NA NA -- -- 48,500 1,200 -- --1936 1,060,000 NA -- NA 422 NA NA NA -- -- 71,100 508 -- --1937 1,280,000 NA -- NA 466 NA NA NA -- -- 94,600 1,640 -- --1938 1,140,000 NA 499 NA 952 NA NA NA -- -- 33,600 5,670 -- --1939 1,190,000 NA 3,080 NA 118 NA NA NA -- -- 59,600 1,120 -- --1940 1,460,000 NA 14,000 NA 500 NA NA NA -- -- 52,300 2,540 -- --1941 1,660,000 NA 20,000 NA 356 NA NA NA -- -- 163,000 4,820 -- --1942 2,030,000 NA 38,100 NA 365 NA NA NA -- -- 286,000 2,940 312 --1943 1,820,000 NA 30,800 NA 1,000 NA NA NA -- -- 354,000 7,990 910 --See footnotes at end of table.
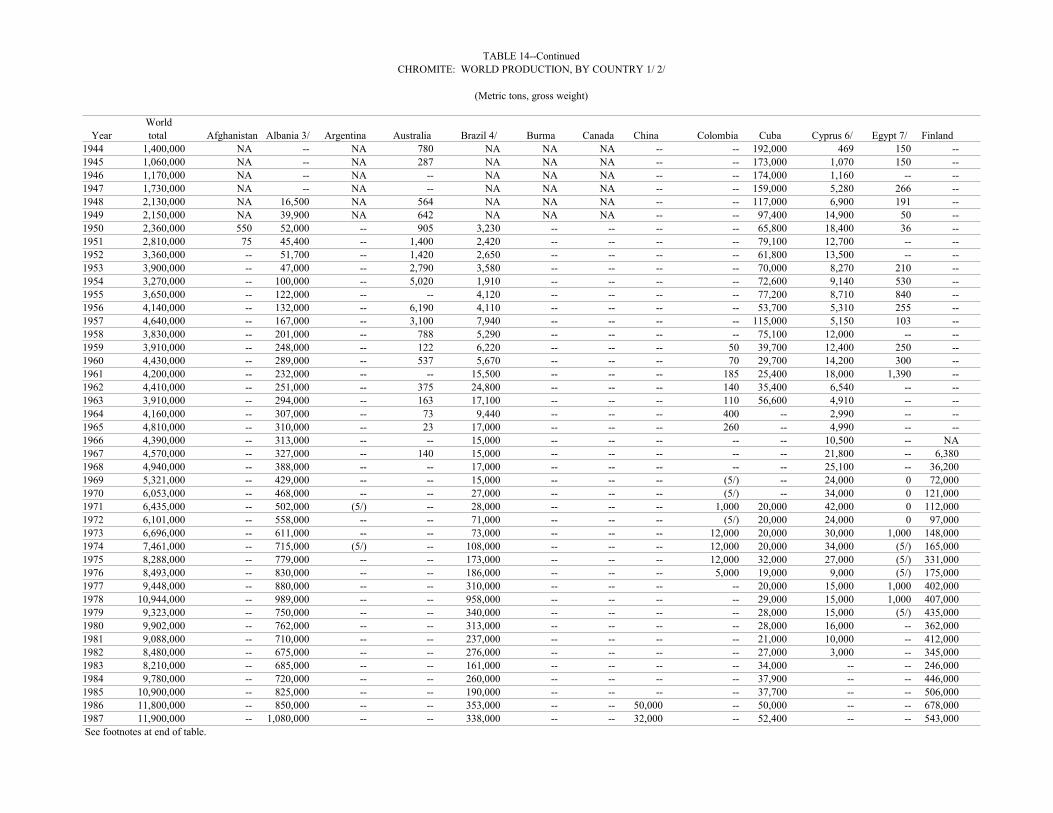
TABLE 14--ContinuedCHROMITE: WORLD PRODUCTION, BY COUNTRY 1/ 2/
(Metric tons, gross weight)
WorldYear total Afghanistan Albania 3/ Argentina Australia Brazil 4/ Burma Canada China Colombia Cuba Cyprus 6/ Egypt 7/ Finland
1944 1,400,000 NA -- NA 780 NA NA NA -- -- 192,000 469 150 --1945 1,060,000 NA -- NA 287 NA NA NA -- -- 173,000 1,070 150 --1946 1,170,000 NA -- NA -- NA NA NA -- -- 174,000 1,160 -- --1947 1,730,000 NA -- NA -- NA NA NA -- -- 159,000 5,280 266 --1948 2,130,000 NA 16,500 NA 564 NA NA NA -- -- 117,000 6,900 191 --1949 2,150,000 NA 39,900 NA 642 NA NA NA -- -- 97,400 14,900 50 --1950 2,360,000 550 52,000 -- 905 3,230 -- -- -- -- 65,800 18,400 36 --1951 2,810,000 75 45,400 -- 1,400 2,420 -- -- -- -- 79,100 12,700 -- --1952 3,360,000 -- 51,700 -- 1,420 2,650 -- -- -- -- 61,800 13,500 -- --1953 3,900,000 -- 47,000 -- 2,790 3,580 -- -- -- -- 70,000 8,270 210 --1954 3,270,000 -- 100,000 -- 5,020 1,910 -- -- -- -- 72,600 9,140 530 --1955 3,650,000 -- 122,000 -- -- 4,120 -- -- -- -- 77,200 8,710 840 --1956 4,140,000 -- 132,000 -- 6,190 4,110 -- -- -- -- 53,700 5,310 255 --1957 4,640,000 -- 167,000 -- 3,100 7,940 -- -- -- -- 115,000 5,150 103 --1958 3,830,000 -- 201,000 -- 788 5,290 -- -- -- -- 75,100 12,000 -- --1959 3,910,000 -- 248,000 -- 122 6,220 -- -- -- 50 39,700 12,400 250 --1960 4,430,000 -- 289,000 -- 537 5,670 -- -- -- 70 29,700 14,200 300 --1961 4,200,000 -- 232,000 -- -- 15,500 -- -- -- 185 25,400 18,000 1,390 --1962 4,410,000 -- 251,000 -- 375 24,800 -- -- -- 140 35,400 6,540 -- --1963 3,910,000 -- 294,000 -- 163 17,100 -- -- -- 110 56,600 4,910 -- --1964 4,160,000 -- 307,000 -- 73 9,440 -- -- -- 400 -- 2,990 -- --1965 4,810,000 -- 310,000 -- 23 17,000 -- -- -- 260 -- 4,990 -- --1966 4,390,000 -- 313,000 -- -- 15,000 -- -- -- -- -- 10,500 -- NA1967 4,570,000 -- 327,000 -- 140 15,000 -- -- -- -- -- 21,800 -- 6,3801968 4,940,000 -- 388,000 -- -- 17,000 -- -- -- -- -- 25,100 -- 36,2001969 5,321,000 -- 429,000 -- -- 15,000 -- -- -- (5/) -- 24,000 0 72,0001970 6,053,000 -- 468,000 -- -- 27,000 -- -- -- (5/) -- 34,000 0 121,0001971 6,435,000 -- 502,000 (5/) -- 28,000 -- -- -- 1,000 20,000 42,000 0 112,0001972 6,101,000 -- 558,000 -- -- 71,000 -- -- -- (5/) 20,000 24,000 0 97,0001973 6,696,000 -- 611,000 -- -- 73,000 -- -- -- 12,000 20,000 30,000 1,000 148,0001974 7,461,000 -- 715,000 (5/) -- 108,000 -- -- -- 12,000 20,000 34,000 (5/) 165,0001975 8,288,000 -- 779,000 -- -- 173,000 -- -- -- 12,000 32,000 27,000 (5/) 331,0001976 8,493,000 -- 830,000 -- -- 186,000 -- -- -- 5,000 19,000 9,000 (5/) 175,0001977 9,448,000 -- 880,000 -- -- 310,000 -- -- -- -- 20,000 15,000 1,000 402,0001978 10,944,000 -- 989,000 -- -- 958,000 -- -- -- -- 29,000 15,000 1,000 407,0001979 9,323,000 -- 750,000 -- -- 340,000 -- -- -- -- 28,000 15,000 (5/) 435,0001980 9,902,000 -- 762,000 -- -- 313,000 -- -- -- -- 28,000 16,000 -- 362,0001981 9,088,000 -- 710,000 -- -- 237,000 -- -- -- -- 21,000 10,000 -- 412,0001982 8,480,000 -- 675,000 -- -- 276,000 -- -- -- -- 27,000 3,000 -- 345,0001983 8,210,000 -- 685,000 -- -- 161,000 -- -- -- -- 34,000 -- -- 246,0001984 9,780,000 -- 720,000 -- -- 260,000 -- -- -- -- 37,900 -- -- 446,0001985 10,900,000 -- 825,000 -- -- 190,000 -- -- -- -- 37,700 -- -- 506,0001986 11,800,000 -- 850,000 -- -- 353,000 -- -- 50,000 -- 50,000 -- -- 678,0001987 11,900,000 -- 1,080,000 -- -- 338,000 -- -- 32,000 -- 52,400 -- -- 543,000See footnotes at end of table.
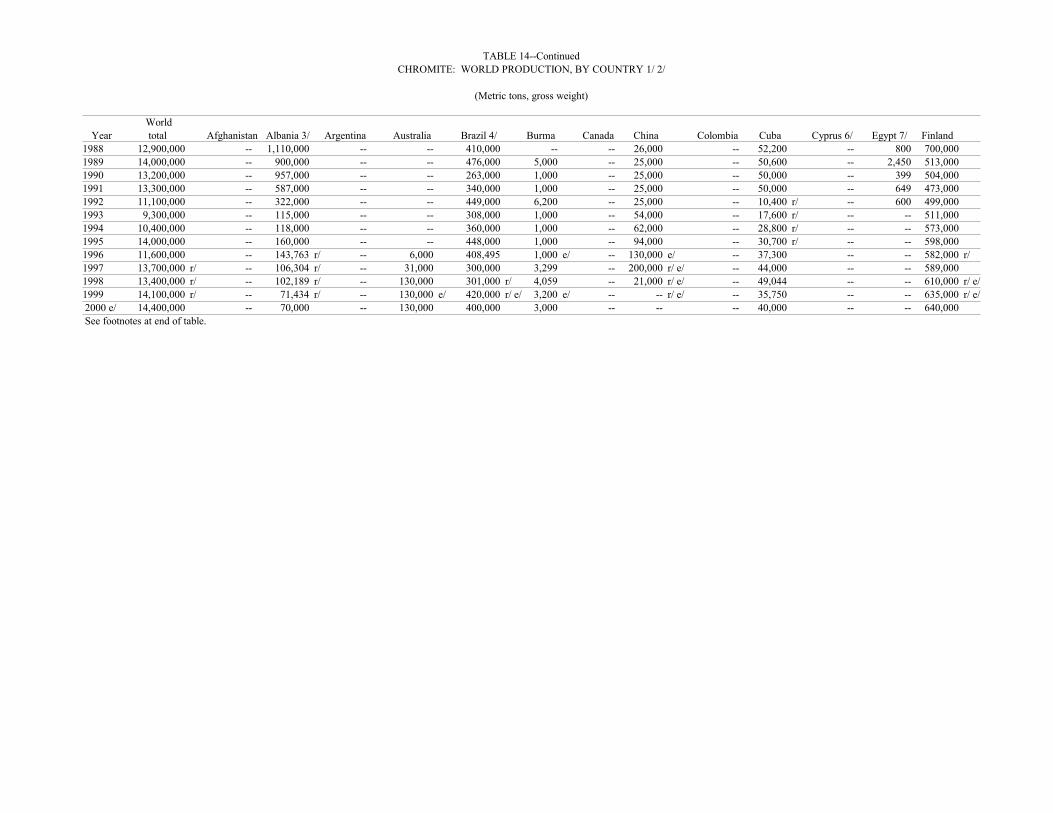
TABLE 14--ContinuedCHROMITE: WORLD PRODUCTION, BY COUNTRY 1/ 2/
(Metric tons, gross weight)
WorldYear total Afghanistan Albania 3/ Argentina Australia Brazil 4/ Burma Canada China Colombia Cuba Cyprus 6/ Egypt 7/ Finland
1988 12,900,000 -- 1,110,000 -- -- 410,000 -- -- 26,000 -- 52,200 -- 800 700,0001989 14,000,000 -- 900,000 -- -- 476,000 5,000 -- 25,000 -- 50,600 -- 2,450 513,0001990 13,200,000 -- 957,000 -- -- 263,000 1,000 -- 25,000 -- 50,000 -- 399 504,0001991 13,300,000 -- 587,000 -- -- 340,000 1,000 -- 25,000 -- 50,000 -- 649 473,0001992 11,100,000 -- 322,000 -- -- 449,000 6,200 -- 25,000 -- 10,400 r/ -- 600 499,0001993 9,300,000 -- 115,000 -- -- 308,000 1,000 -- 54,000 -- 17,600 r/ -- -- 511,0001994 10,400,000 -- 118,000 -- -- 360,000 1,000 -- 62,000 -- 28,800 r/ -- -- 573,0001995 14,000,000 -- 160,000 -- -- 448,000 1,000 -- 94,000 -- 30,700 r/ -- -- 598,0001996 11,600,000 -- 143,763 r/ -- 6,000 408,495 1,000 e/ -- 130,000 e/ -- 37,300 -- -- 582,000 r/1997 13,700,000 r/ -- 106,304 r/ -- 31,000 300,000 3,299 -- 200,000 r/ e/ -- 44,000 -- -- 589,0001998 13,400,000 r/ -- 102,189 r/ -- 130,000 301,000 r/ 4,059 -- 21,000 r/ e/ -- 49,044 -- -- 610,000 r/ e/1999 14,100,000 r/ -- 71,434 r/ -- 130,000 e/ 420,000 r/ e/ 3,200 e/ -- -- r/ e/ -- 35,750 -- -- 635,000 r/ e/2000 e/ 14,400,000 -- 70,000 -- 130,000 400,000 3,000 -- -- -- 40,000 -- -- 640,000See footnotes at end of table.
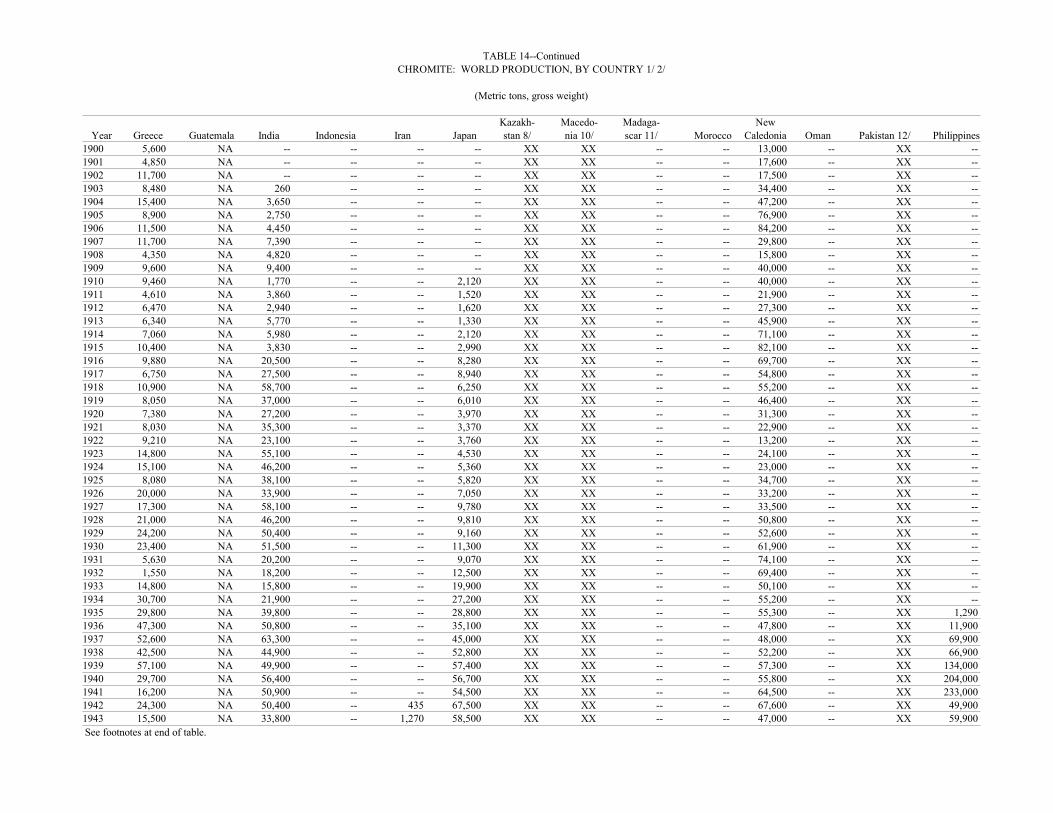
TABLE 14--ContinuedCHROMITE: WORLD PRODUCTION, BY COUNTRY 1/ 2/
(Metric tons, gross weight)
Kazakh- Macedo- Madaga- NewYear Greece Guatemala India Indonesia Iran Japan stan 8/ nia 10/ scar 11/ Morocco Caledonia Oman Pakistan 12/ Philippines
1900 5,600 NA -- -- -- -- XX XX -- -- 13,000 -- XX --1901 4,850 NA -- -- -- -- XX XX -- -- 17,600 -- XX --1902 11,700 NA -- -- -- -- XX XX -- -- 17,500 -- XX --1903 8,480 NA 260 -- -- -- XX XX -- -- 34,400 -- XX --1904 15,400 NA 3,650 -- -- -- XX XX -- -- 47,200 -- XX --1905 8,900 NA 2,750 -- -- -- XX XX -- -- 76,900 -- XX --1906 11,500 NA 4,450 -- -- -- XX XX -- -- 84,200 -- XX --1907 11,700 NA 7,390 -- -- -- XX XX -- -- 29,800 -- XX --1908 4,350 NA 4,820 -- -- -- XX XX -- -- 15,800 -- XX --1909 9,600 NA 9,400 -- -- -- XX XX -- -- 40,000 -- XX --1910 9,460 NA 1,770 -- -- 2,120 XX XX -- -- 40,000 -- XX --1911 4,610 NA 3,860 -- -- 1,520 XX XX -- -- 21,900 -- XX --1912 6,470 NA 2,940 -- -- 1,620 XX XX -- -- 27,300 -- XX --1913 6,340 NA 5,770 -- -- 1,330 XX XX -- -- 45,900 -- XX --1914 7,060 NA 5,980 -- -- 2,120 XX XX -- -- 71,100 -- XX --1915 10,400 NA 3,830 -- -- 2,990 XX XX -- -- 82,100 -- XX --1916 9,880 NA 20,500 -- -- 8,280 XX XX -- -- 69,700 -- XX --1917 6,750 NA 27,500 -- -- 8,940 XX XX -- -- 54,800 -- XX --1918 10,900 NA 58,700 -- -- 6,250 XX XX -- -- 55,200 -- XX --1919 8,050 NA 37,000 -- -- 6,010 XX XX -- -- 46,400 -- XX --1920 7,380 NA 27,200 -- -- 3,970 XX XX -- -- 31,300 -- XX --1921 8,030 NA 35,300 -- -- 3,370 XX XX -- -- 22,900 -- XX --1922 9,210 NA 23,100 -- -- 3,760 XX XX -- -- 13,200 -- XX --1923 14,800 NA 55,100 -- -- 4,530 XX XX -- -- 24,100 -- XX --1924 15,100 NA 46,200 -- -- 5,360 XX XX -- -- 23,000 -- XX --1925 8,080 NA 38,100 -- -- 5,820 XX XX -- -- 34,700 -- XX --1926 20,000 NA 33,900 -- -- 7,050 XX XX -- -- 33,200 -- XX --1927 17,300 NA 58,100 -- -- 9,780 XX XX -- -- 33,500 -- XX --1928 21,000 NA 46,200 -- -- 9,810 XX XX -- -- 50,800 -- XX --1929 24,200 NA 50,400 -- -- 9,160 XX XX -- -- 52,600 -- XX --1930 23,400 NA 51,500 -- -- 11,300 XX XX -- -- 61,900 -- XX --1931 5,630 NA 20,200 -- -- 9,070 XX XX -- -- 74,100 -- XX --1932 1,550 NA 18,200 -- -- 12,500 XX XX -- -- 69,400 -- XX --1933 14,800 NA 15,800 -- -- 19,900 XX XX -- -- 50,100 -- XX --1934 30,700 NA 21,900 -- -- 27,200 XX XX -- -- 55,200 -- XX --1935 29,800 NA 39,800 -- -- 28,800 XX XX -- -- 55,300 -- XX 1,2901936 47,300 NA 50,800 -- -- 35,100 XX XX -- -- 47,800 -- XX 11,9001937 52,600 NA 63,300 -- -- 45,000 XX XX -- -- 48,000 -- XX 69,9001938 42,500 NA 44,900 -- -- 52,800 XX XX -- -- 52,200 -- XX 66,9001939 57,100 NA 49,900 -- -- 57,400 XX XX -- -- 57,300 -- XX 134,0001940 29,700 NA 56,400 -- -- 56,700 XX XX -- -- 55,800 -- XX 204,0001941 16,200 NA 50,900 -- -- 54,500 XX XX -- -- 64,500 -- XX 233,0001942 24,300 NA 50,400 -- 435 67,500 XX XX -- -- 67,600 -- XX 49,9001943 15,500 NA 33,800 -- 1,270 58,500 XX XX -- -- 47,000 -- XX 59,900See footnotes at end of table.
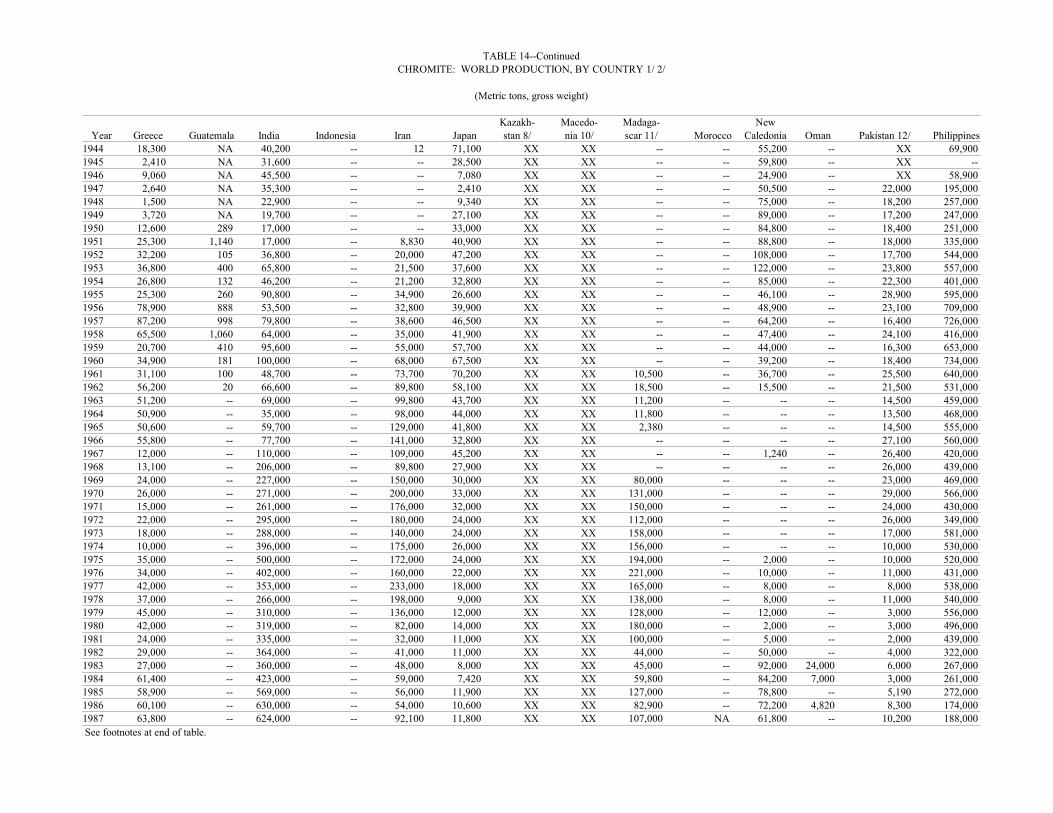
TABLE 14--ContinuedCHROMITE: WORLD PRODUCTION, BY COUNTRY 1/ 2/
(Metric tons, gross weight)
Kazakh- Macedo- Madaga- NewYear Greece Guatemala India Indonesia Iran Japan stan 8/ nia 10/ scar 11/ Morocco Caledonia Oman Pakistan 12/ Philippines
1944 18,300 NA 40,200 -- 12 71,100 XX XX -- -- 55,200 -- XX 69,9001945 2,410 NA 31,600 -- -- 28,500 XX XX -- -- 59,800 -- XX --1946 9,060 NA 45,500 -- -- 7,080 XX XX -- -- 24,900 -- XX 58,9001947 2,640 NA 35,300 -- -- 2,410 XX XX -- -- 50,500 -- 22,000 195,0001948 1,500 NA 22,900 -- -- 9,340 XX XX -- -- 75,000 -- 18,200 257,0001949 3,720 NA 19,700 -- -- 27,100 XX XX -- -- 89,000 -- 17,200 247,0001950 12,600 289 17,000 -- -- 33,000 XX XX -- -- 84,800 -- 18,400 251,0001951 25,300 1,140 17,000 -- 8,830 40,900 XX XX -- -- 88,800 -- 18,000 335,0001952 32,200 105 36,800 -- 20,000 47,200 XX XX -- -- 108,000 -- 17,700 544,0001953 36,800 400 65,800 -- 21,500 37,600 XX XX -- -- 122,000 -- 23,800 557,0001954 26,800 132 46,200 -- 21,200 32,800 XX XX -- -- 85,000 -- 22,300 401,0001955 25,300 260 90,800 -- 34,900 26,600 XX XX -- -- 46,100 -- 28,900 595,0001956 78,900 888 53,500 -- 32,800 39,900 XX XX -- -- 48,900 -- 23,100 709,0001957 87,200 998 79,800 -- 38,600 46,500 XX XX -- -- 64,200 -- 16,400 726,0001958 65,500 1,060 64,000 -- 35,000 41,900 XX XX -- -- 47,400 -- 24,100 416,0001959 20,700 410 95,600 -- 55,000 57,700 XX XX -- -- 44,000 -- 16,300 653,0001960 34,900 181 100,000 -- 68,000 67,500 XX XX -- -- 39,200 -- 18,400 734,0001961 31,100 100 48,700 -- 73,700 70,200 XX XX 10,500 -- 36,700 -- 25,500 640,0001962 56,200 20 66,600 -- 89,800 58,100 XX XX 18,500 -- 15,500 -- 21,500 531,0001963 51,200 -- 69,000 -- 99,800 43,700 XX XX 11,200 -- -- -- 14,500 459,0001964 50,900 -- 35,000 -- 98,000 44,000 XX XX 11,800 -- -- -- 13,500 468,0001965 50,600 -- 59,700 -- 129,000 41,800 XX XX 2,380 -- -- -- 14,500 555,0001966 55,800 -- 77,700 -- 141,000 32,800 XX XX -- -- -- -- 27,100 560,0001967 12,000 -- 110,000 -- 109,000 45,200 XX XX -- -- 1,240 -- 26,400 420,0001968 13,100 -- 206,000 -- 89,800 27,900 XX XX -- -- -- -- 26,000 439,0001969 24,000 -- 227,000 -- 150,000 30,000 XX XX 80,000 -- -- -- 23,000 469,0001970 26,000 -- 271,000 -- 200,000 33,000 XX XX 131,000 -- -- -- 29,000 566,0001971 15,000 -- 261,000 -- 176,000 32,000 XX XX 150,000 -- -- -- 24,000 430,0001972 22,000 -- 295,000 -- 180,000 24,000 XX XX 112,000 -- -- -- 26,000 349,0001973 18,000 -- 288,000 -- 140,000 24,000 XX XX 158,000 -- -- -- 17,000 581,0001974 10,000 -- 396,000 -- 175,000 26,000 XX XX 156,000 -- -- -- 10,000 530,0001975 35,000 -- 500,000 -- 172,000 24,000 XX XX 194,000 -- 2,000 -- 10,000 520,0001976 34,000 -- 402,000 -- 160,000 22,000 XX XX 221,000 -- 10,000 -- 11,000 431,0001977 42,000 -- 353,000 -- 233,000 18,000 XX XX 165,000 -- 8,000 -- 8,000 538,0001978 37,000 -- 266,000 -- 198,000 9,000 XX XX 138,000 -- 8,000 -- 11,000 540,0001979 45,000 -- 310,000 -- 136,000 12,000 XX XX 128,000 -- 12,000 -- 3,000 556,0001980 42,000 -- 319,000 -- 82,000 14,000 XX XX 180,000 -- 2,000 -- 3,000 496,0001981 24,000 -- 335,000 -- 32,000 11,000 XX XX 100,000 -- 5,000 -- 2,000 439,0001982 29,000 -- 364,000 -- 41,000 11,000 XX XX 44,000 -- 50,000 -- 4,000 322,0001983 27,000 -- 360,000 -- 48,000 8,000 XX XX 45,000 -- 92,000 24,000 6,000 267,0001984 61,400 -- 423,000 -- 59,000 7,420 XX XX 59,800 -- 84,200 7,000 3,000 261,0001985 58,900 -- 569,000 -- 56,000 11,900 XX XX 127,000 -- 78,800 -- 5,190 272,0001986 60,100 -- 630,000 -- 54,000 10,600 XX XX 82,900 -- 72,200 4,820 8,300 174,0001987 63,800 -- 624,000 -- 92,100 11,800 XX XX 107,000 NA 61,800 -- 10,200 188,000See footnotes at end of table.
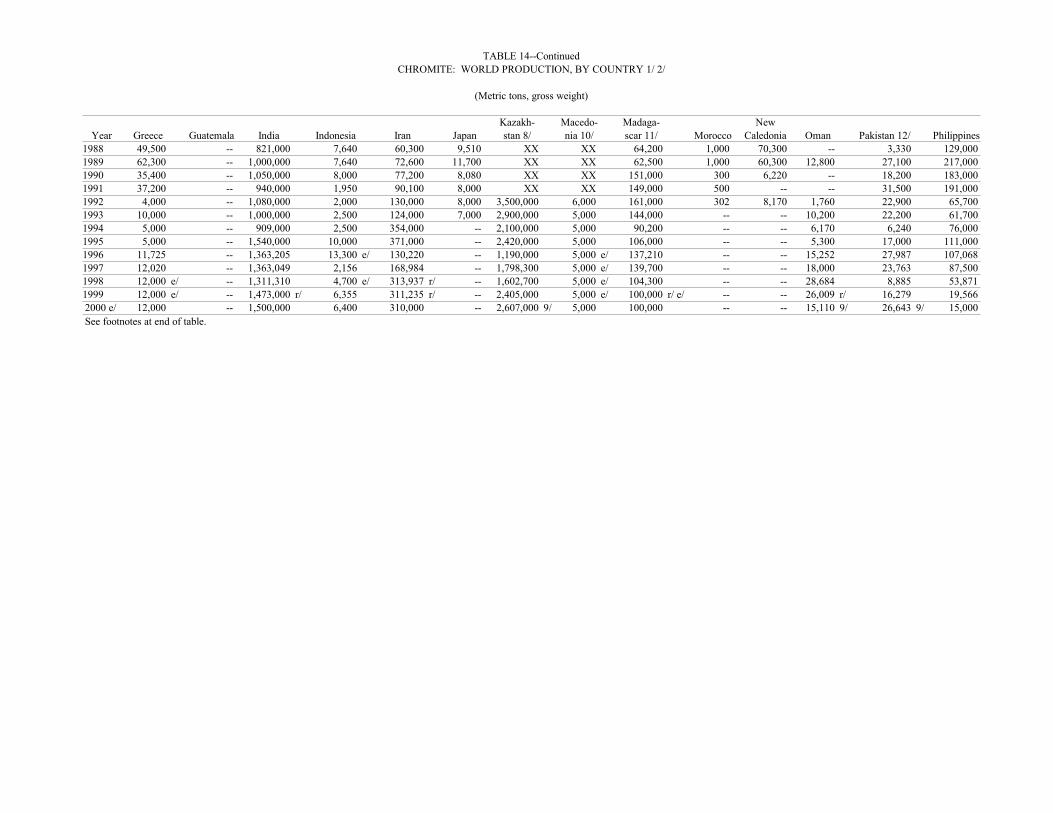
TABLE 14--ContinuedCHROMITE: WORLD PRODUCTION, BY COUNTRY 1/ 2/
(Metric tons, gross weight)
Kazakh- Macedo- Madaga- NewYear Greece Guatemala India Indonesia Iran Japan stan 8/ nia 10/ scar 11/ Morocco Caledonia Oman Pakistan 12/ Philippines
1988 49,500 -- 821,000 7,640 60,300 9,510 XX XX 64,200 1,000 70,300 -- 3,330 129,0001989 62,300 -- 1,000,000 7,640 72,600 11,700 XX XX 62,500 1,000 60,300 12,800 27,100 217,0001990 35,400 -- 1,050,000 8,000 77,200 8,080 XX XX 151,000 300 6,220 -- 18,200 183,0001991 37,200 -- 940,000 1,950 90,100 8,000 XX XX 149,000 500 -- -- 31,500 191,0001992 4,000 -- 1,080,000 2,000 130,000 8,000 3,500,000 6,000 161,000 302 8,170 1,760 22,900 65,7001993 10,000 -- 1,000,000 2,500 124,000 7,000 2,900,000 5,000 144,000 -- -- 10,200 22,200 61,7001994 5,000 -- 909,000 2,500 354,000 -- 2,100,000 5,000 90,200 -- -- 6,170 6,240 76,0001995 5,000 -- 1,540,000 10,000 371,000 -- 2,420,000 5,000 106,000 -- -- 5,300 17,000 111,0001996 11,725 -- 1,363,205 13,300 e/ 130,220 -- 1,190,000 5,000 e/ 137,210 -- -- 15,252 27,987 107,0681997 12,020 -- 1,363,049 2,156 168,984 -- 1,798,300 5,000 e/ 139,700 -- -- 18,000 23,763 87,5001998 12,000 e/ -- 1,311,310 4,700 e/ 313,937 r/ -- 1,602,700 5,000 e/ 104,300 -- -- 28,684 8,885 53,8711999 12,000 e/ -- 1,473,000 r/ 6,355 311,235 r/ -- 2,405,000 5,000 e/ 100,000 r/ e/ -- -- 26,009 r/ 16,279 19,5662000 e/ 12,000 -- 1,500,000 6,400 310,000 -- 2,607,000 9/ 5,000 100,000 -- -- 15,110 9/ 26,643 9/ 15,000See footnotes at end of table.
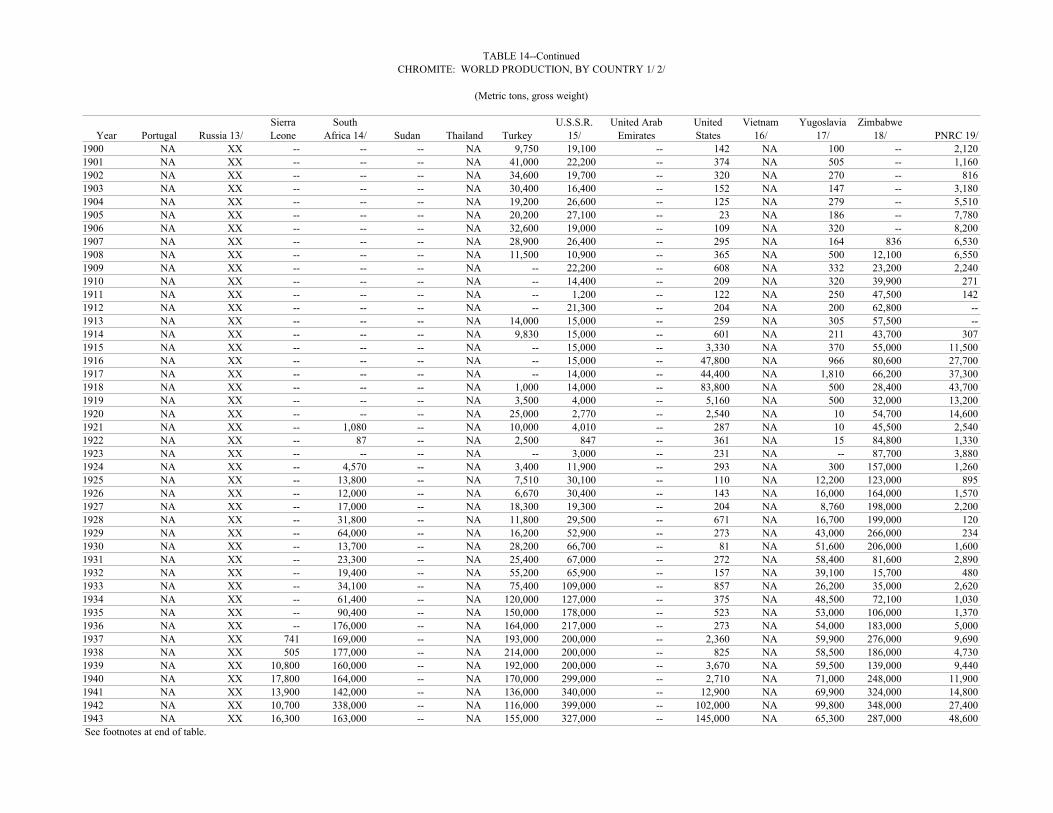
TABLE 14--ContinuedCHROMITE: WORLD PRODUCTION, BY COUNTRY 1/ 2/
(Metric tons, gross weight)
Sierra South U.S.S.R. United Arab United Vietnam Yugoslavia ZimbabweYear Portugal Russia 13/ Leone Africa 14/ Sudan Thailand Turkey 15/ Emirates States 16/ 17/ 18/ PNRC 19/
1900 NA XX -- -- -- NA 9,750 19,100 -- 142 NA 100 -- 2,1201901 NA XX -- -- -- NA 41,000 22,200 -- 374 NA 505 -- 1,1601902 NA XX -- -- -- NA 34,600 19,700 -- 320 NA 270 -- 8161903 NA XX -- -- -- NA 30,400 16,400 -- 152 NA 147 -- 3,1801904 NA XX -- -- -- NA 19,200 26,600 -- 125 NA 279 -- 5,5101905 NA XX -- -- -- NA 20,200 27,100 -- 23 NA 186 -- 7,7801906 NA XX -- -- -- NA 32,600 19,000 -- 109 NA 320 -- 8,2001907 NA XX -- -- -- NA 28,900 26,400 -- 295 NA 164 836 6,5301908 NA XX -- -- -- NA 11,500 10,900 -- 365 NA 500 12,100 6,5501909 NA XX -- -- -- NA -- 22,200 -- 608 NA 332 23,200 2,2401910 NA XX -- -- -- NA -- 14,400 -- 209 NA 320 39,900 2711911 NA XX -- -- -- NA -- 1,200 -- 122 NA 250 47,500 1421912 NA XX -- -- -- NA -- 21,300 -- 204 NA 200 62,800 --1913 NA XX -- -- -- NA 14,000 15,000 -- 259 NA 305 57,500 --1914 NA XX -- -- -- NA 9,830 15,000 -- 601 NA 211 43,700 3071915 NA XX -- -- -- NA -- 15,000 -- 3,330 NA 370 55,000 11,5001916 NA XX -- -- -- NA -- 15,000 -- 47,800 NA 966 80,600 27,7001917 NA XX -- -- -- NA -- 14,000 -- 44,400 NA 1,810 66,200 37,3001918 NA XX -- -- -- NA 1,000 14,000 -- 83,800 NA 500 28,400 43,7001919 NA XX -- -- -- NA 3,500 4,000 -- 5,160 NA 500 32,000 13,2001920 NA XX -- -- -- NA 25,000 2,770 -- 2,540 NA 10 54,700 14,6001921 NA XX -- 1,080 -- NA 10,000 4,010 -- 287 NA 10 45,500 2,5401922 NA XX -- 87 -- NA 2,500 847 -- 361 NA 15 84,800 1,3301923 NA XX -- -- -- NA -- 3,000 -- 231 NA -- 87,700 3,8801924 NA XX -- 4,570 -- NA 3,400 11,900 -- 293 NA 300 157,000 1,2601925 NA XX -- 13,800 -- NA 7,510 30,100 -- 110 NA 12,200 123,000 8951926 NA XX -- 12,000 -- NA 6,670 30,400 -- 143 NA 16,000 164,000 1,5701927 NA XX -- 17,000 -- NA 18,300 19,300 -- 204 NA 8,760 198,000 2,2001928 NA XX -- 31,800 -- NA 11,800 29,500 -- 671 NA 16,700 199,000 1201929 NA XX -- 64,000 -- NA 16,200 52,900 -- 273 NA 43,000 266,000 2341930 NA XX -- 13,700 -- NA 28,200 66,700 -- 81 NA 51,600 206,000 1,6001931 NA XX -- 23,300 -- NA 25,400 67,000 -- 272 NA 58,400 81,600 2,8901932 NA XX -- 19,400 -- NA 55,200 65,900 -- 157 NA 39,100 15,700 4801933 NA XX -- 34,100 -- NA 75,400 109,000 -- 857 NA 26,200 35,000 2,6201934 NA XX -- 61,400 -- NA 120,000 127,000 -- 375 NA 48,500 72,100 1,0301935 NA XX -- 90,400 -- NA 150,000 178,000 -- 523 NA 53,000 106,000 1,3701936 NA XX -- 176,000 -- NA 164,000 217,000 -- 273 NA 54,000 183,000 5,0001937 NA XX 741 169,000 -- NA 193,000 200,000 -- 2,360 NA 59,900 276,000 9,6901938 NA XX 505 177,000 -- NA 214,000 200,000 -- 825 NA 58,500 186,000 4,7301939 NA XX 10,800 160,000 -- NA 192,000 200,000 -- 3,670 NA 59,500 139,000 9,4401940 NA XX 17,800 164,000 -- NA 170,000 299,000 -- 2,710 NA 71,000 248,000 11,9001941 NA XX 13,900 142,000 -- NA 136,000 340,000 -- 12,900 NA 69,900 324,000 14,8001942 NA XX 10,700 338,000 -- NA 116,000 399,000 -- 102,000 NA 99,800 348,000 27,4001943 NA XX 16,300 163,000 -- NA 155,000 327,000 -- 145,000 NA 65,300 287,000 48,600See footnotes at end of table.
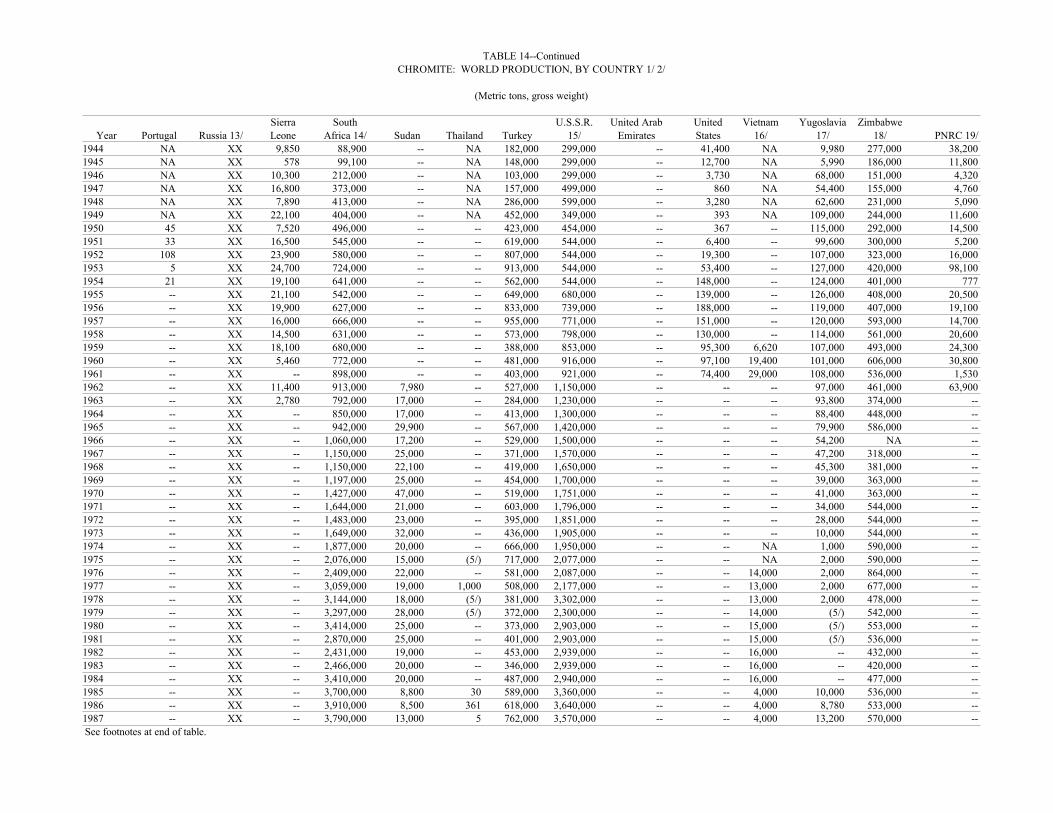
TABLE 14--ContinuedCHROMITE: WORLD PRODUCTION, BY COUNTRY 1/ 2/
(Metric tons, gross weight)
Sierra South U.S.S.R. United Arab United Vietnam Yugoslavia ZimbabweYear Portugal Russia 13/ Leone Africa 14/ Sudan Thailand Turkey 15/ Emirates States 16/ 17/ 18/ PNRC 19/
1944 NA XX 9,850 88,900 -- NA 182,000 299,000 -- 41,400 NA 9,980 277,000 38,2001945 NA XX 578 99,100 -- NA 148,000 299,000 -- 12,700 NA 5,990 186,000 11,8001946 NA XX 10,300 212,000 -- NA 103,000 299,000 -- 3,730 NA 68,000 151,000 4,3201947 NA XX 16,800 373,000 -- NA 157,000 499,000 -- 860 NA 54,400 155,000 4,7601948 NA XX 7,890 413,000 -- NA 286,000 599,000 -- 3,280 NA 62,600 231,000 5,0901949 NA XX 22,100 404,000 -- NA 452,000 349,000 -- 393 NA 109,000 244,000 11,6001950 45 XX 7,520 496,000 -- -- 423,000 454,000 -- 367 -- 115,000 292,000 14,5001951 33 XX 16,500 545,000 -- -- 619,000 544,000 -- 6,400 -- 99,600 300,000 5,2001952 108 XX 23,900 580,000 -- -- 807,000 544,000 -- 19,300 -- 107,000 323,000 16,0001953 5 XX 24,700 724,000 -- -- 913,000 544,000 -- 53,400 -- 127,000 420,000 98,1001954 21 XX 19,100 641,000 -- -- 562,000 544,000 -- 148,000 -- 124,000 401,000 7771955 -- XX 21,100 542,000 -- -- 649,000 680,000 -- 139,000 -- 126,000 408,000 20,5001956 -- XX 19,900 627,000 -- -- 833,000 739,000 -- 188,000 -- 119,000 407,000 19,1001957 -- XX 16,000 666,000 -- -- 955,000 771,000 -- 151,000 -- 120,000 593,000 14,7001958 -- XX 14,500 631,000 -- -- 573,000 798,000 -- 130,000 -- 114,000 561,000 20,6001959 -- XX 18,100 680,000 -- -- 388,000 853,000 -- 95,300 6,620 107,000 493,000 24,3001960 -- XX 5,460 772,000 -- -- 481,000 916,000 -- 97,100 19,400 101,000 606,000 30,8001961 -- XX -- 898,000 -- -- 403,000 921,000 -- 74,400 29,000 108,000 536,000 1,5301962 -- XX 11,400 913,000 7,980 -- 527,000 1,150,000 -- -- -- 97,000 461,000 63,9001963 -- XX 2,780 792,000 17,000 -- 284,000 1,230,000 -- -- -- 93,800 374,000 --1964 -- XX -- 850,000 17,000 -- 413,000 1,300,000 -- -- -- 88,400 448,000 --1965 -- XX -- 942,000 29,900 -- 567,000 1,420,000 -- -- -- 79,900 586,000 --1966 -- XX -- 1,060,000 17,200 -- 529,000 1,500,000 -- -- -- 54,200 NA --1967 -- XX -- 1,150,000 25,000 -- 371,000 1,570,000 -- -- -- 47,200 318,000 --1968 -- XX -- 1,150,000 22,100 -- 419,000 1,650,000 -- -- -- 45,300 381,000 --1969 -- XX -- 1,197,000 25,000 -- 454,000 1,700,000 -- -- -- 39,000 363,000 --1970 -- XX -- 1,427,000 47,000 -- 519,000 1,751,000 -- -- -- 41,000 363,000 --1971 -- XX -- 1,644,000 21,000 -- 603,000 1,796,000 -- -- -- 34,000 544,000 --1972 -- XX -- 1,483,000 23,000 -- 395,000 1,851,000 -- -- -- 28,000 544,000 --1973 -- XX -- 1,649,000 32,000 -- 436,000 1,905,000 -- -- -- 10,000 544,000 --1974 -- XX -- 1,877,000 20,000 -- 666,000 1,950,000 -- -- NA 1,000 590,000 --1975 -- XX -- 2,076,000 15,000 (5/) 717,000 2,077,000 -- -- NA 2,000 590,000 --1976 -- XX -- 2,409,000 22,000 -- 581,000 2,087,000 -- -- 14,000 2,000 864,000 --1977 -- XX -- 3,059,000 19,000 1,000 508,000 2,177,000 -- -- 13,000 2,000 677,000 --1978 -- XX -- 3,144,000 18,000 (5/) 381,000 3,302,000 -- -- 13,000 2,000 478,000 --1979 -- XX -- 3,297,000 28,000 (5/) 372,000 2,300,000 -- -- 14,000 (5/) 542,000 --1980 -- XX -- 3,414,000 25,000 -- 373,000 2,903,000 -- -- 15,000 (5/) 553,000 --1981 -- XX -- 2,870,000 25,000 -- 401,000 2,903,000 -- -- 15,000 (5/) 536,000 --1982 -- XX -- 2,431,000 19,000 -- 453,000 2,939,000 -- -- 16,000 -- 432,000 --1983 -- XX -- 2,466,000 20,000 -- 346,000 2,939,000 -- -- 16,000 -- 420,000 --1984 -- XX -- 3,410,000 20,000 -- 487,000 2,940,000 -- -- 16,000 -- 477,000 --1985 -- XX -- 3,700,000 8,800 30 589,000 3,360,000 -- -- 4,000 10,000 536,000 --1986 -- XX -- 3,910,000 8,500 361 618,000 3,640,000 -- -- 4,000 8,780 533,000 --1987 -- XX -- 3,790,000 13,000 5 762,000 3,570,000 -- -- 4,000 13,200 570,000 --See footnotes at end of table.
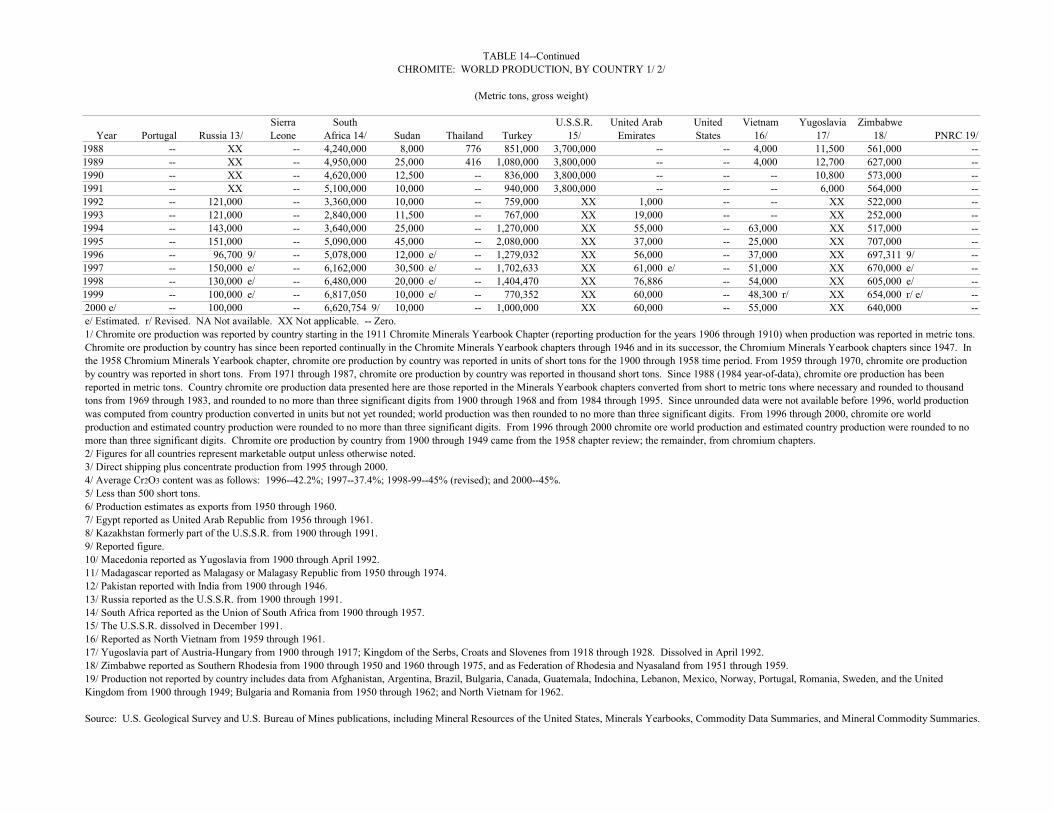
TABLE 14--ContinuedCHROMITE: WORLD PRODUCTION, BY COUNTRY 1/ 2/
(Metric tons, gross weight)
Sierra South U.S.S.R. United Arab United Vietnam Yugoslavia ZimbabweYear Portugal Russia 13/ Leone Africa 14/ Sudan Thailand Turkey 15/ Emirates States 16/ 17/ 18/ PNRC 19/
1988 -- XX -- 4,240,000 8,000 776 851,000 3,700,000 -- -- 4,000 11,500 561,000 --1989 -- XX -- 4,950,000 25,000 416 1,080,000 3,800,000 -- -- 4,000 12,700 627,000 --1990 -- XX -- 4,620,000 12,500 -- 836,000 3,800,000 -- -- -- 10,800 573,000 --1991 -- XX -- 5,100,000 10,000 -- 940,000 3,800,000 -- -- -- 6,000 564,000 --1992 -- 121,000 -- 3,360,000 10,000 -- 759,000 XX 1,000 -- -- XX 522,000 --1993 -- 121,000 -- 2,840,000 11,500 -- 767,000 XX 19,000 -- -- XX 252,000 --1994 -- 143,000 -- 3,640,000 25,000 -- 1,270,000 XX 55,000 -- 63,000 XX 517,000 --1995 -- 151,000 -- 5,090,000 45,000 -- 2,080,000 XX 37,000 -- 25,000 XX 707,000 --1996 -- 96,700 9/ -- 5,078,000 12,000 e/ -- 1,279,032 XX 56,000 -- 37,000 XX 697,311 9/ --1997 -- 150,000 e/ -- 6,162,000 30,500 e/ -- 1,702,633 XX 61,000 e/ -- 51,000 XX 670,000 e/ --1998 -- 130,000 e/ -- 6,480,000 20,000 e/ -- 1,404,470 XX 76,886 -- 54,000 XX 605,000 e/ --1999 -- 100,000 e/ -- 6,817,050 10,000 e/ -- 770,352 XX 60,000 -- 48,300 r/ XX 654,000 r/ e/ --2000 e/ -- 100,000 -- 6,620,754 9/ 10,000 -- 1,000,000 XX 60,000 -- 55,000 XX 640,000 --e/ Estimated. r/ Revised. NA Not available. XX Not applicable. -- Zero.1/ Chromite ore production was reported by country starting in the 1911 Chromite Minerals Yearbook Chapter (reporting production for the years 1906 through 1910) when production was reported in metric tons.Chromite ore production by country has since been reported continually in the Chromite Minerals Yearbook chapters through 1946 and in its successor, the Chromium Minerals Yearbook chapters since 1947. Inthe 1958 Chromium Minerals Yearbook chapter, chromite ore production by country was reported in units of short tons for the 1900 through 1958 time period. From 1959 through 1970, chromite ore productionby country was reported in short tons. From 1971 through 1987, chromite ore production by country was reported in thousand short tons. Since 1988 (1984 year-of-data), chromite ore production has beenreported in metric tons. Country chromite ore production data presented here are those reported in the Minerals Yearbook chapters converted from short to metric tons where necessary and rounded to thousandtons from 1969 through 1983, and rounded to no more than three significant digits from 1900 through 1968 and from 1984 through 1995. Since unrounded data were not available before 1996, world productionwas computed from country production converted in units but not yet rounded; world production was then rounded to no more than three significant digits. From 1996 through 2000, chromite ore worldproduction and estimated country production were rounded to no more than three significant digits. From 1996 through 2000 chromite ore world production and estimated country production were rounded to nomore than three significant digits. Chromite ore production by country from 1900 through 1949 came from the 1958 chapter review; the remainder, from chromium chapters.2/ Figures for all countries represent marketable output unless otherwise noted.3/ Direct shipping plus concentrate production from 1995 through 2000.4/ Average Cr2O3 content was as follows: 1996--42.2%; 1997--37.4%; 1998-99--45% (revised); and 2000--45%.5/ Less than 500 short tons.6/ Production estimates as exports from 1950 through 1960.7/ Egypt reported as United Arab Republic from 1956 through 1961.8/ Kazakhstan formerly part of the U.S.S.R. from 1900 through 1991.9/ Reported figure.10/ Macedonia reported as Yugoslavia from 1900 through April 1992.11/ Madagascar reported as Malagasy or Malagasy Republic from 1950 through 1974.12/ Pakistan reported with India from 1900 through 1946.13/ Russia reported as the U.S.S.R. from 1900 through 1991.14/ South Africa reported as the Union of South Africa from 1900 through 1957.15/ The U.S.S.R. dissolved in December 1991.16/ Reported as North Vietnam from 1959 through 1961.17/ Yugoslavia part of Austria-Hungary from 1900 through 1917; Kingdom of the Serbs, Croats and Slovenes from 1918 through 1928. Dissolved in April 1992.18/ Zimbabwe reported as Southern Rhodesia from 1900 through 1950 and 1960 through 1975, and as Federation of Rhodesia and Nyasaland from 1951 through 1959.19/ Production not reported by country includes data from Afghanistan, Argentina, Brazil, Bulgaria, Canada, Guatemala, Indochina, Lebanon, Mexico, Norway, Portugal, Romania, Sweden, and the UnitedKingdom from 1900 through 1949; Bulgaria and Romania from 1950 through 1962; and North Vietnam for 1962.
Source: U.S. Geological Survey and U.S. Bureau of Mines publications, including Mineral Resources of the United States, Minerals Yearbooks, Commodity Data Summaries, and Mineral Commodity Summaries.
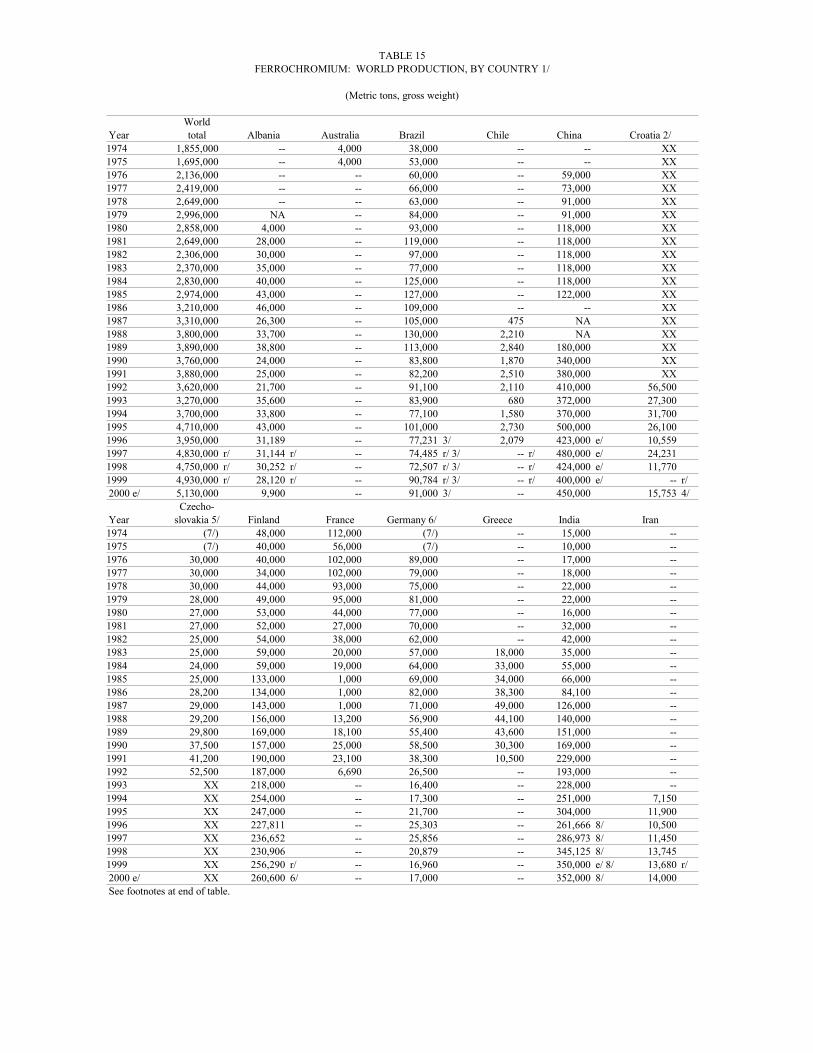
TABLE 15FERROCHROMIUM: WORLD PRODUCTION, BY COUNTRY 1/
(Metric tons, gross weight)
WorldYear total Albania Australia Brazil Chile China Croatia 2/1974 1,855,000 -- 4,000 38,000 -- -- XX1975 1,695,000 -- 4,000 53,000 -- -- XX1976 2,136,000 -- -- 60,000 -- 59,000 XX1977 2,419,000 -- -- 66,000 -- 73,000 XX1978 2,649,000 -- -- 63,000 -- 91,000 XX1979 2,996,000 NA -- 84,000 -- 91,000 XX1980 2,858,000 4,000 -- 93,000 -- 118,000 XX1981 2,649,000 28,000 -- 119,000 -- 118,000 XX1982 2,306,000 30,000 -- 97,000 -- 118,000 XX1983 2,370,000 35,000 -- 77,000 -- 118,000 XX1984 2,830,000 40,000 -- 125,000 -- 118,000 XX1985 2,974,000 43,000 -- 127,000 -- 122,000 XX1986 3,210,000 46,000 -- 109,000 -- -- XX1987 3,310,000 26,300 -- 105,000 475 NA XX1988 3,800,000 33,700 -- 130,000 2,210 NA XX1989 3,890,000 38,800 -- 113,000 2,840 180,000 XX1990 3,760,000 24,000 -- 83,800 1,870 340,000 XX1991 3,880,000 25,000 -- 82,200 2,510 380,000 XX1992 3,620,000 21,700 -- 91,100 2,110 410,000 56,5001993 3,270,000 35,600 -- 83,900 680 372,000 27,3001994 3,700,000 33,800 -- 77,100 1,580 370,000 31,7001995 4,710,000 43,000 -- 101,000 2,730 500,000 26,1001996 3,950,000 31,189 -- 77,231 3/ 2,079 423,000 e/ 10,5591997 4,830,000 r/ 31,144 r/ -- 74,485 r/ 3/ -- r/ 480,000 e/ 24,2311998 4,750,000 r/ 30,252 r/ -- 72,507 r/ 3/ -- r/ 424,000 e/ 11,7701999 4,930,000 r/ 28,120 r/ -- 90,784 r/ 3/ -- r/ 400,000 e/ -- r/2000 e/ 5,130,000 9,900 -- 91,000 3/ -- 450,000 15,753 4/
Czecho-Year slovakia 5/ Finland France Germany 6/ Greece India Iran1974 (7/) 48,000 112,000 (7/) -- 15,000 --1975 (7/) 40,000 56,000 (7/) -- 10,000 --1976 30,000 40,000 102,000 89,000 -- 17,000 --1977 30,000 34,000 102,000 79,000 -- 18,000 --1978 30,000 44,000 93,000 75,000 -- 22,000 --1979 28,000 49,000 95,000 81,000 -- 22,000 --1980 27,000 53,000 44,000 77,000 -- 16,000 --1981 27,000 52,000 27,000 70,000 -- 32,000 --1982 25,000 54,000 38,000 62,000 -- 42,000 --1983 25,000 59,000 20,000 57,000 18,000 35,000 --1984 24,000 59,000 19,000 64,000 33,000 55,000 --1985 25,000 133,000 1,000 69,000 34,000 66,000 --1986 28,200 134,000 1,000 82,000 38,300 84,100 --1987 29,000 143,000 1,000 71,000 49,000 126,000 --1988 29,200 156,000 13,200 56,900 44,100 140,000 --1989 29,800 169,000 18,100 55,400 43,600 151,000 --1990 37,500 157,000 25,000 58,500 30,300 169,000 --1991 41,200 190,000 23,100 38,300 10,500 229,000 --1992 52,500 187,000 6,690 26,500 -- 193,000 --1993 XX 218,000 -- 16,400 -- 228,000 --1994 XX 254,000 -- 17,300 -- 251,000 7,1501995 XX 247,000 -- 21,700 -- 304,000 11,9001996 XX 227,811 -- 25,303 -- 261,666 8/ 10,5001997 XX 236,652 -- 25,856 -- 286,973 8/ 11,4501998 XX 230,906 -- 20,879 -- 345,125 8/ 13,7451999 XX 256,290 r/ -- 16,960 -- 350,000 e/ 8/ 13,680 r/2000 e/ XX 260,600 6/ -- 17,000 -- 352,000 8/ 14,000See footnotes at end of table.
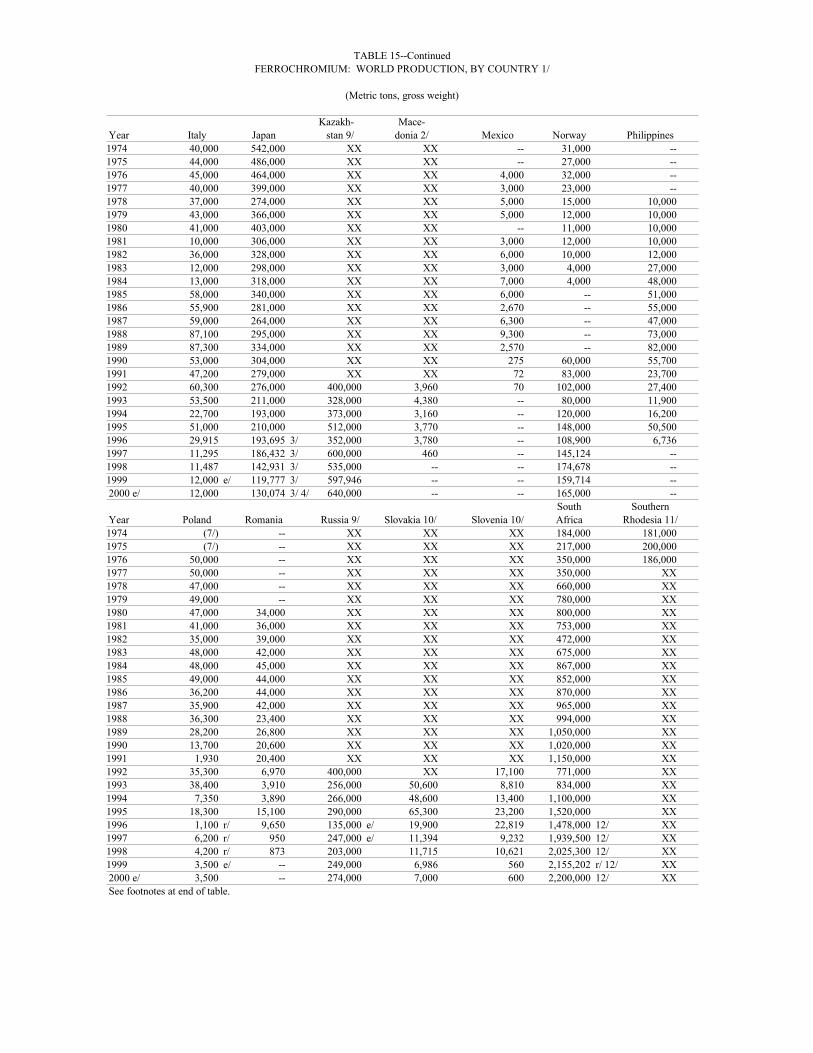
TABLE 15--ContinuedFERROCHROMIUM: WORLD PRODUCTION, BY COUNTRY 1/
(Metric tons, gross weight)
Kazakh- Mace-Year Italy Japan stan 9/ donia 2/ Mexico Norway Philippines1974 40,000 542,000 XX XX -- 31,000 --1975 44,000 486,000 XX XX -- 27,000 --1976 45,000 464,000 XX XX 4,000 32,000 --1977 40,000 399,000 XX XX 3,000 23,000 --1978 37,000 274,000 XX XX 5,000 15,000 10,0001979 43,000 366,000 XX XX 5,000 12,000 10,0001980 41,000 403,000 XX XX -- 11,000 10,0001981 10,000 306,000 XX XX 3,000 12,000 10,0001982 36,000 328,000 XX XX 6,000 10,000 12,0001983 12,000 298,000 XX XX 3,000 4,000 27,0001984 13,000 318,000 XX XX 7,000 4,000 48,0001985 58,000 340,000 XX XX 6,000 -- 51,0001986 55,900 281,000 XX XX 2,670 -- 55,0001987 59,000 264,000 XX XX 6,300 -- 47,0001988 87,100 295,000 XX XX 9,300 -- 73,0001989 87,300 334,000 XX XX 2,570 -- 82,0001990 53,000 304,000 XX XX 275 60,000 55,7001991 47,200 279,000 XX XX 72 83,000 23,7001992 60,300 276,000 400,000 3,960 70 102,000 27,4001993 53,500 211,000 328,000 4,380 -- 80,000 11,9001994 22,700 193,000 373,000 3,160 -- 120,000 16,2001995 51,000 210,000 512,000 3,770 -- 148,000 50,5001996 29,915 193,695 3/ 352,000 3,780 -- 108,900 6,7361997 11,295 186,432 3/ 600,000 460 -- 145,124 --1998 11,487 142,931 3/ 535,000 -- -- 174,678 --1999 12,000 e/ 119,777 3/ 597,946 -- -- 159,714 --2000 e/ 12,000 130,074 3/ 4/ 640,000 -- -- 165,000 --
South SouthernYear Poland Romania Russia 9/ Slovakia 10/ Slovenia 10/ Africa Rhodesia 11/1974 (7/) -- XX XX XX 184,000 181,0001975 (7/) -- XX XX XX 217,000 200,0001976 50,000 -- XX XX XX 350,000 186,0001977 50,000 -- XX XX XX 350,000 XX1978 47,000 -- XX XX XX 660,000 XX1979 49,000 -- XX XX XX 780,000 XX1980 47,000 34,000 XX XX XX 800,000 XX1981 41,000 36,000 XX XX XX 753,000 XX1982 35,000 39,000 XX XX XX 472,000 XX1983 48,000 42,000 XX XX XX 675,000 XX1984 48,000 45,000 XX XX XX 867,000 XX1985 49,000 44,000 XX XX XX 852,000 XX1986 36,200 44,000 XX XX XX 870,000 XX1987 35,900 42,000 XX XX XX 965,000 XX1988 36,300 23,400 XX XX XX 994,000 XX1989 28,200 26,800 XX XX XX 1,050,000 XX1990 13,700 20,600 XX XX XX 1,020,000 XX1991 1,930 20,400 XX XX XX 1,150,000 XX1992 35,300 6,970 400,000 XX 17,100 771,000 XX1993 38,400 3,910 256,000 50,600 8,810 834,000 XX1994 7,350 3,890 266,000 48,600 13,400 1,100,000 XX1995 18,300 15,100 290,000 65,300 23,200 1,520,000 XX1996 1,100 r/ 9,650 135,000 e/ 19,900 22,819 1,478,000 12/ XX1997 6,200 r/ 950 247,000 e/ 11,394 9,232 1,939,500 12/ XX1998 4,200 r/ 873 203,000 11,715 10,621 2,025,300 12/ XX1999 3,500 e/ -- 249,000 6,986 560 2,155,202 r/ 12/ XX2000 e/ 3,500 -- 274,000 7,000 600 2,200,000 12/ XXSee footnotes at end of table.
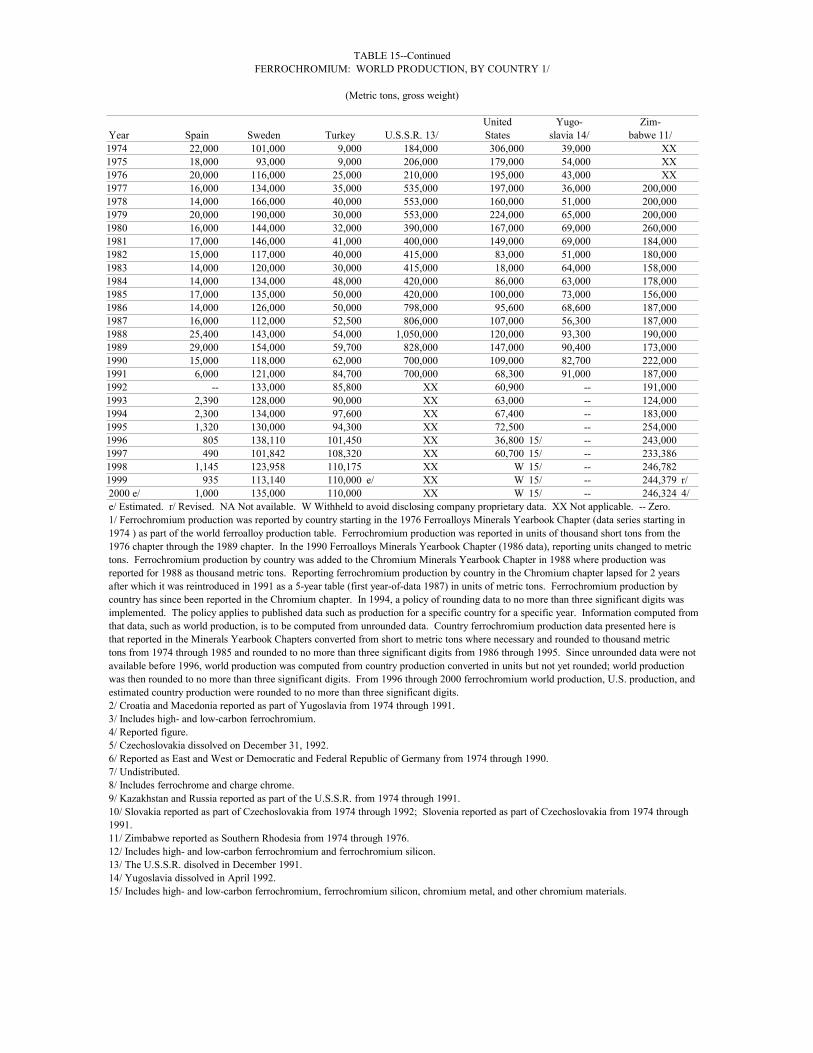
TABLE 15--ContinuedFERROCHROMIUM: WORLD PRODUCTION, BY COUNTRY 1/
(Metric tons, gross weight)
United Yugo- Zim-Year Spain Sweden Turkey U.S.S.R. 13/ States slavia 14/ babwe 11/1974 22,000 101,000 9,000 184,000 306,000 39,000 XX1975 18,000 93,000 9,000 206,000 179,000 54,000 XX1976 20,000 116,000 25,000 210,000 195,000 43,000 XX1977 16,000 134,000 35,000 535,000 197,000 36,000 200,0001978 14,000 166,000 40,000 553,000 160,000 51,000 200,0001979 20,000 190,000 30,000 553,000 224,000 65,000 200,0001980 16,000 144,000 32,000 390,000 167,000 69,000 260,0001981 17,000 146,000 41,000 400,000 149,000 69,000 184,0001982 15,000 117,000 40,000 415,000 83,000 51,000 180,0001983 14,000 120,000 30,000 415,000 18,000 64,000 158,0001984 14,000 134,000 48,000 420,000 86,000 63,000 178,0001985 17,000 135,000 50,000 420,000 100,000 73,000 156,0001986 14,000 126,000 50,000 798,000 95,600 68,600 187,0001987 16,000 112,000 52,500 806,000 107,000 56,300 187,0001988 25,400 143,000 54,000 1,050,000 120,000 93,300 190,0001989 29,000 154,000 59,700 828,000 147,000 90,400 173,0001990 15,000 118,000 62,000 700,000 109,000 82,700 222,0001991 6,000 121,000 84,700 700,000 68,300 91,000 187,0001992 -- 133,000 85,800 XX 60,900 -- 191,0001993 2,390 128,000 90,000 XX 63,000 -- 124,0001994 2,300 134,000 97,600 XX 67,400 -- 183,0001995 1,320 130,000 94,300 XX 72,500 -- 254,0001996 805 138,110 101,450 XX 36,800 15/ -- 243,0001997 490 101,842 108,320 XX 60,700 15/ -- 233,3861998 1,145 123,958 110,175 XX W 15/ -- 246,7821999 935 113,140 110,000 e/ XX W 15/ -- 244,379 r/2000 e/ 1,000 135,000 110,000 XX W 15/ -- 246,324 4/e/ Estimated. r/ Revised. NA Not available. W Withheld to avoid disclosing company proprietary data. XX Not applicable. -- Zero.1/ Ferrochromium production was reported by country starting in the 1976 Ferroalloys Minerals Yearbook Chapter (data series starting in 1974 ) as part of the world ferroalloy production table. Ferrochromium production was reported in units of thousand short tons from the 1976 chapter through the 1989 chapter. In the 1990 Ferroalloys Minerals Yearbook Chapter (1986 data), reporting units changed to metric tons. Ferrochromium production by country was added to the Chromium Minerals Yearbook Chapter in 1988 where production was reported for 1988 as thousand metric tons. Reporting ferrochromium production by country in the Chromium chapter lapsed for 2 years after which it was reintroduced in 1991 as a 5-year table (first year-of-data 1987) in units of metric tons. Ferrochromium production by country has since been reported in the Chromium chapter. In 1994, a policy of rounding data to no more than three significant digits was implemented. The policy applies to published data such as production for a specific country for a specific year. Information computed fromthat data, such as world production, is to be computed from unrounded data. Country ferrochromium production data presented here is that reported in the Minerals Yearbook Chapters converted from short to metric tons where necessary and rounded to thousand metric tons from 1974 through 1985 and rounded to no more than three significant digits from 1986 through 1995. Since unrounded data were not available before 1996, world production was computed from country production converted in units but not yet rounded; world production was then rounded to no more than three significant digits. From 1996 through 2000 ferrochromium world production, U.S. production, and estimated country production were rounded to no more than three significant digits.2/ Croatia and Macedonia reported as part of Yugoslavia from 1974 through 1991.3/ Includes high- and low-carbon ferrochromium.4/ Reported figure.5/ Czechoslovakia dissolved on December 31, 1992.6/ Reported as East and West or Democratic and Federal Republic of Germany from 1974 through 1990.7/ Undistributed.8/ Includes ferrochrome and charge chrome.9/ Kazakhstan and Russia reported as part of the U.S.S.R. from 1974 through 1991.10/ Slovakia reported as part of Czechoslovakia from 1974 through 1992; Slovenia reported as part of Czechoslovakia from 1974 through 1991.11/ Zimbabwe reported as Southern Rhodesia from 1974 through 1976.12/ Includes high- and low-carbon ferrochromium and ferrochromium silicon.13/ The U.S.S.R. disolved in December 1991.14/ Yugoslavia dissolved in April 1992.15/ Includes high- and low-carbon ferrochromium, ferrochromium silicon, chromium metal, and other chromium materials.
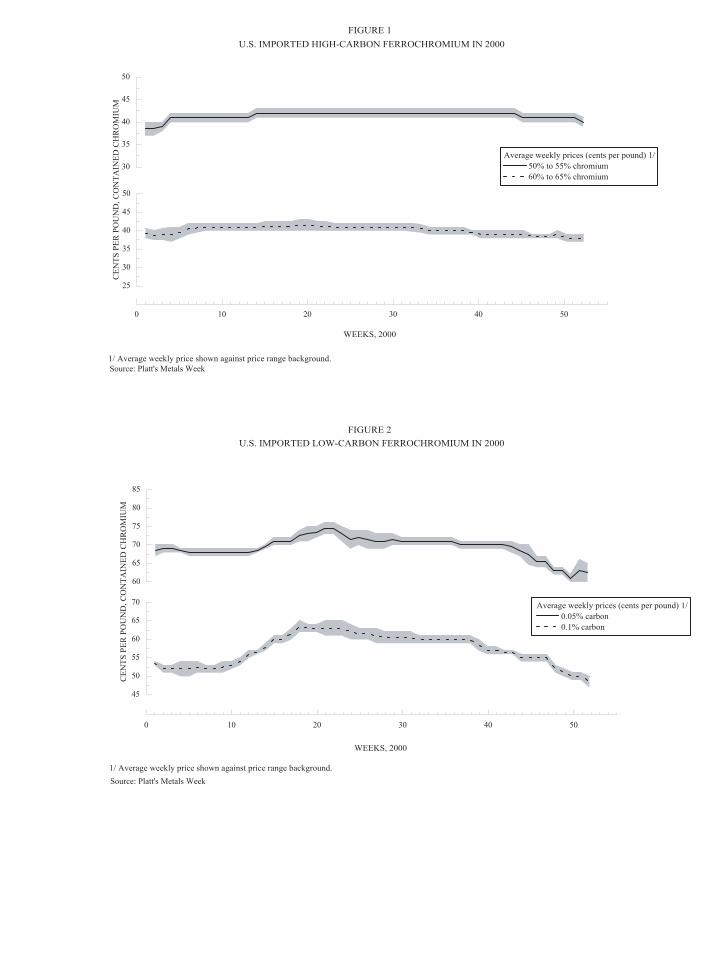
0 10 20 30 40 50
0 10 20 30 40 50
Source: Platt's Metals Week1/ Average weekly price shown against price range background.
1/ Average weekly price shown against price range background.
FIGURE 1
Source: Platt's Metals Week
U.S. IMPORTED HIGH-CARBON FERROCHROMIUM IN 2000
CEN
TS P
ER P
OU
ND
, CO
NTA
INED
CH
RO
MIU
M
WEEKS, 2000
Average weekly prices (cents per pound) 1/ 0.05% carbon 0.1% carbon
FIGURE 2U.S. IMPORTED LOW-CARBON FERROCHROMIUM IN 2000
CEN
TS P
ER P
OU
ND
, CO
NTA
INED
CH
RO
MIU
M
WEEKS, 2000
Average weekly prices (cents per pound) 1/ 50% to 55% chromium 60% to 65% chromium
30
35
40
45
50
25
30
35
40
45
50
60
65
70
75
80
85
45
50
55
60
65
70