christopher l. dobbins - dtic · 2017-03-28 · christopher l. dobbins. weapons development and...
TRANSCRIPT
TECHNICAL REPORT RDMR-WD-16-15
MMEEAASSUURRIINNGG CCOOLLLLIIMMAATTOORR
IINNFFRRAARREEDD ((IIRR)) SSPPEECCTTRRAALL TTRRAANNSSMMIISSSSIIOONN
Christopher L. Dobbins Weapons Development and Integration Directorate
Aviation and Missile Research, Development, and Engineering Center
May 2016
Distribution Statement A: Approved for public release; distribution unlimited.
DESTRUCTION NOTICE
FOR CLASSIFIED DOCUMENTS, FOLLOW THE PROCEDURES IN DoD 5200.22-M, INDUSTRIAL SECURITY MANUAL, SECTION II-19 OR DoD 5200.1-R, INFORMATION SECURITY PROGRAM REGULATION, CHAPTER IX. FOR UNCLASSIFIED, LIMITED DOCUMENTS, DESTROY BY ANY METHOD THAT WILL PREVENT DISCLOSURE OF CONTENTS OR RECONSTRUCTION OF THE DOCUMENT.
DISCLAIMER
THE FINDINGS IN THIS REPORT ARE NOT TO BE CONSTRUED AS AN OFFICIAL DEPARTMENT OF THE ARMY POSITION UNLESS SO DESIGNATED BY OTHER AUTHORIZED DOCUMENTS.
TRADE NAMES
USE OF TRADE NAMES OR MANUFACTURERS IN THIS REPORT DOES NOT CONSTITUTE AN OFFICIAL ENDORSEMENT OR APPROVAL OF THE USE OF SUCH COMMERCIAL HARDWARE OR SOFTWARE.
i/ii (Blank)
REPORT DOCUMENTATION PAGE Form Approved OMB No. 074-0188
Public reporting burden for this collection of information is estimated to average 1 hour per response, including the time for reviewing instructions, searching existing data sources, gathering and maintaining the data needed, and completing and reviewing this collection of information. Send comments regarding this burden estimate or any other aspect of this collection of information, including suggestions for reducing this burden to Washington Headquarters Services, Directorate for Information Operations and Reports, 1215 Jefferson Davis Highway, Suite 1204, Arlington, VA 22202-4302, and to the Office of Management and Budget, Paperwork Reduction Project (0704-0188), Washington, DC 20503 1.AGENCY USE ONLY 2. REPORT DATE
May 20163. REPORT TYPE AND DATES COVERED
Final4. TITLE AND SUBTITLEMeasuring Collimator Infrared (IR) Spectral Transmission
5. FUNDING NUMBERS
6. AUTHOR(S)Christopher L. Dobbins
7. PERFORMING ORGANIZATION NAME(S) AND ADDRESS(ES)Commander, U.S. Army Research, Development, and Engineering Command ATTN: RDMR-WDG-I Redstone Arsenal, AL 35898-5000
8. PERFORMING ORGANIZATIONREPORT NUMBER
TR-RDMR-WD-16-15
9. SPONSORING / MONITORING AGENCY NAME(S) AND ADDRESS(ES) 10. SPONSORING / MONITORINGAGENCY REPORT NUMBER
11. SUPPLEMENTARY NOTES
12a. DISTRIBUTION / AVAILABILITY STATEMENT Approved for public release; distribution is unlimited.
12b. DISTRIBUTION CODE
A
13. ABSTRACT (Maximum 200 Words) Several Infrared (IR) imaging systems have been measured looking down a collimator and a standalone large surface blackbody. They were both focused and had the same total atmospheric path length between source and sensor, yet discrepancies were noticed in that the standalone blackbody measurements were providing more perceived flux even when compensating for vendor provided collimator transmission losses. This report provides the background and discusses the methodology used to measure the actual losses in a collimator.
14. SUBJECT TERMSInfrared (IR), Long-Wave Infrared (LWIR), Mid-Wave Infrared (MWIR), Spectroradiometer, Spectrometer
15. NUMBER OF PAGES16
16. PRICE CODE
17. SECURITY CLASSIFICATIONOF REPORT
UNCLASSIFIED
18. SECURITY CLASSIFICATIONOF THIS PAGE
UNCLASSIFIED
19. SECURITY CLASSIFICATIONOF ABSTRACT
UNCLASSIFIED
20. LIMITATION OF ABSTRACT
SAR NSN 7540-01-280-5500 Standard Form 298 (Rev. 2-89)
Prescribed by ANSI Std. Z39-18 298-102
iii
TABLE OF CONTENTS
Page
I. INTRODUCTION ................................................................................................... 1
II. BACKGROUND ...................................................................................................... 1
III. SETUP AND TESTING .......................................................................................... 2
IV. RESULTS AND ANALYSIS .................................................................................. 7
V. CONCLUSION AND FUTURE WORK ............................................................... 8
REFERENCES ........................................................................................................ 9
LIST OF ABBREVIATIONS, ACRONYMS, AND SYMBOLS ........................ 10
iv
LIST OF ILLUSTRATIONS
Figure Title Page
1. Collimated, Distance, and Flooded Test Configurations ..................................... 2
2. Collimator Transmission ........................................................................................ 3
3. Setup of SR5000 With Atmospheric Paths Equal at 4 m ..................................... 4
4. Response Function at 100 °C .................................................................................. 5
5. Response at Distance Divided by Response at Infinity ........................................ 6
6. Change in F/# Due to Change in Focus for Each Distance .................................. 6
7. Radiance at 100 °C .................................................................................................. 7
8. Radiance at 100 °C Zoomed-In .............................................................................. 7
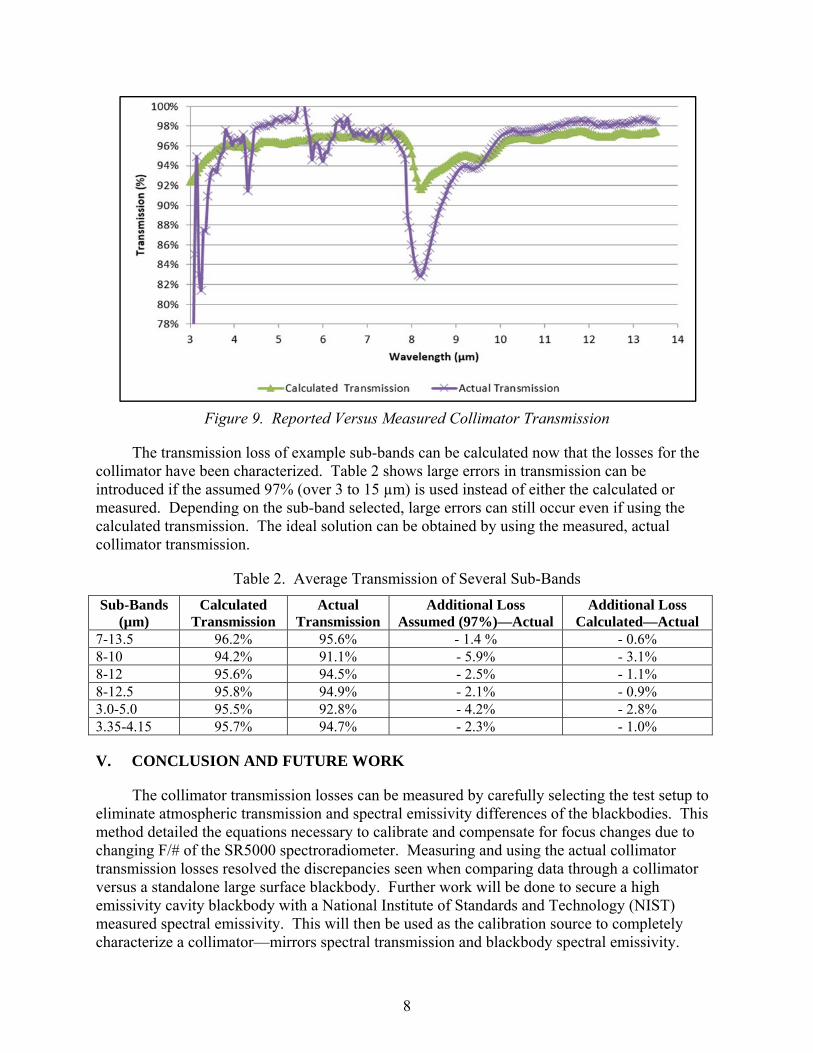
9. Reported Versus Measured Collimator Transmission ......................................... 8
LIST OF TABLES
Table Title Page
1. Parameters for Calculation Maximum Working Distance .................................. 3
2. Average Transmission of Several Sub-Bands ....................................................... 8
1
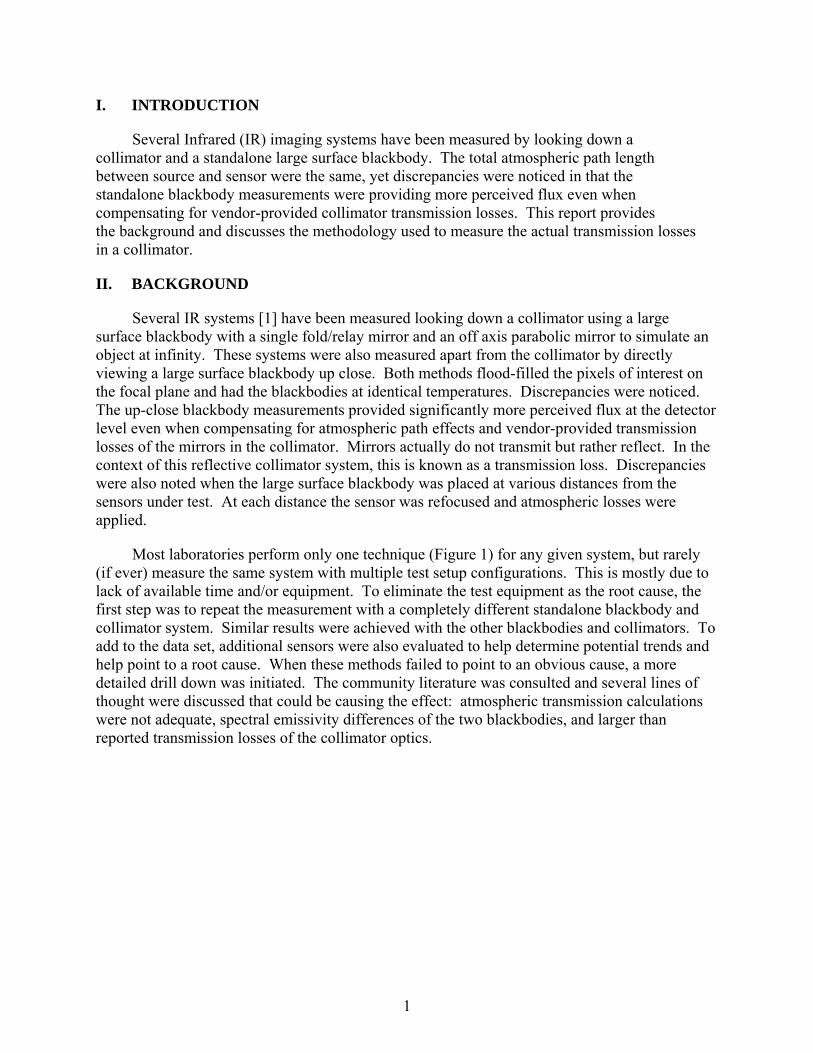
I. INTRODUCTION
Several Infrared (IR) imaging systems have been measured by looking down a collimator and a standalone large surface blackbody. The total atmospheric path length between source and sensor were the same, yet discrepancies were noticed in that the standalone blackbody measurements were providing more perceived flux even when compensating for vendor-provided collimator transmission losses. This report provides the background and discusses the methodology used to measure the actual transmission losses in a collimator.
II. BACKGROUND
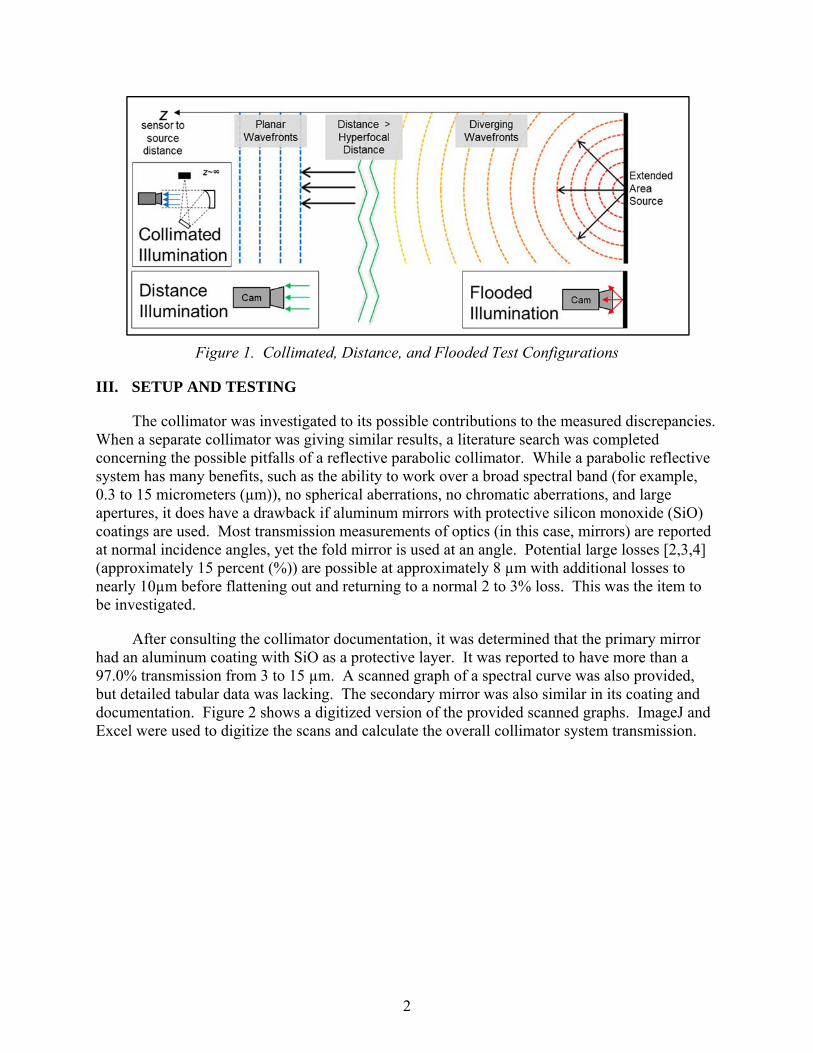
Several IR systems [1] have been measured looking down a collimator using a large surface blackbody with a single fold/relay mirror and an off axis parabolic mirror to simulate an object at infinity. These systems were also measured apart from the collimator by directly viewing a large surface blackbody up close. Both methods flood-filled the pixels of interest on the focal plane and had the blackbodies at identical temperatures. Discrepancies were noticed. The up-close blackbody measurements provided significantly more perceived flux at the detector level even when compensating for atmospheric path effects and vendor-provided transmission losses of the mirrors in the collimator. Mirrors actually do not transmit but rather reflect. In the context of this reflective collimator system, this is known as a transmission loss. Discrepancies were also noted when the large surface blackbody was placed at various distances from the sensors under test. At each distance the sensor was refocused and atmospheric losses were applied.
Most laboratories perform only one technique (Figure 1) for any given system, but rarely (if ever) measure the same system with multiple test setup configurations. This is mostly due to lack of available time and/or equipment. To eliminate the test equipment as the root cause, the first step was to repeat the measurement with a completely different standalone blackbody and collimator system. Similar results were achieved with the other blackbodies and collimators. To add to the data set, additional sensors were also evaluated to help determine potential trends and help point to a root cause. When these methods failed to point to an obvious cause, a more detailed drill down was initiated. The community literature was consulted and several lines of thought were discussed that could be causing the effect: atmospheric transmission calculations were not adequate, spectral emissivity differences of the two blackbodies, and larger than reported transmission losses of the collimator optics.
2
Figure 1. Collimated, Distance, and Flooded Test Configurations
III. SETUP AND TESTING
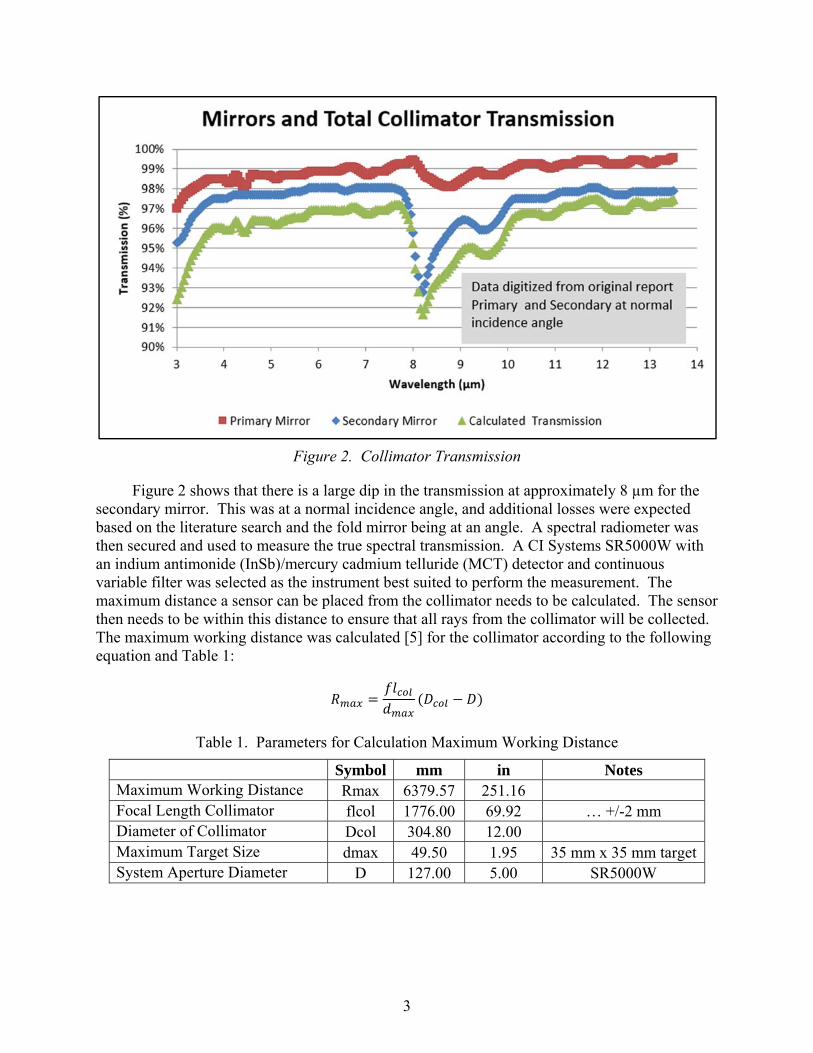
The collimator was investigated to its possible contributions to the measured discrepancies. When a separate collimator was giving similar results, a literature search was completed concerning the possible pitfalls of a reflective parabolic collimator. While a parabolic reflective system has many benefits, such as the ability to work over a broad spectral band (for example, 0.3 to 15 micrometers (µm)), no spherical aberrations, no chromatic aberrations, and large apertures, it does have a drawback if aluminum mirrors with protective silicon monoxide (SiO) coatings are used. Most transmission measurements of optics (in this case, mirrors) are reported at normal incidence angles, yet the fold mirror is used at an angle. Potential large losses [2,3,4] (approximately 15 percent (%)) are possible at approximately 8 µm with additional losses to nearly 10µm before flattening out and returning to a normal 2 to 3% loss. This was the item to be investigated.
After consulting the collimator documentation, it was determined that the primary mirror had an aluminum coating with SiO as a protective layer. It was reported to have more than a 97.0% transmission from 3 to 15 µm. A scanned graph of a spectral curve was also provided, but detailed tabular data was lacking. The secondary mirror was also similar in its coating and documentation. Figure 2 shows a digitized version of the provided scanned graphs. ImageJ and Excel were used to digitize the scans and calculate the overall collimator system transmission.
3
Figure 2. Collimator Transmission
Figure 2 shows that there is a large dip in the transmission at approximately 8 µm for the secondary mirror. This was at a normal incidence angle, and additional losses were expected based on the literature search and the fold mirror being at an angle. A spectral radiometer was then secured and used to measure the true spectral transmission. A CI Systems SR5000W with an indium antimonide (InSb)/mercury cadmium telluride (MCT) detector and continuous variable filter was selected as the instrument best suited to perform the measurement. The maximum distance a sensor can be placed from the collimator needs to be calculated. The sensor then needs to be within this distance to ensure that all rays from the collimator will be collected. The maximum working distance was calculated [5] for the collimator according to the following equation and Table 1:
Table 1. Parameters for Calculation Maximum Working Distance
Symbol mm in Notes Maximum Working Distance Rmax 6379.57 251.16 Focal Length Collimator flcol 1776.00 69.92 … +/-2 mm Diameter of Collimator Dcol 304.80 12.00 Maximum Target Size dmax 49.50 1.95 35 mm x 35 mm targetSystem Aperture Diameter D 127.00 5.00 SR5000W
4
Rmax in a reflective collimator is measured from the primary output mirror; whereas, in a refractive collimator, it is from the last optic.
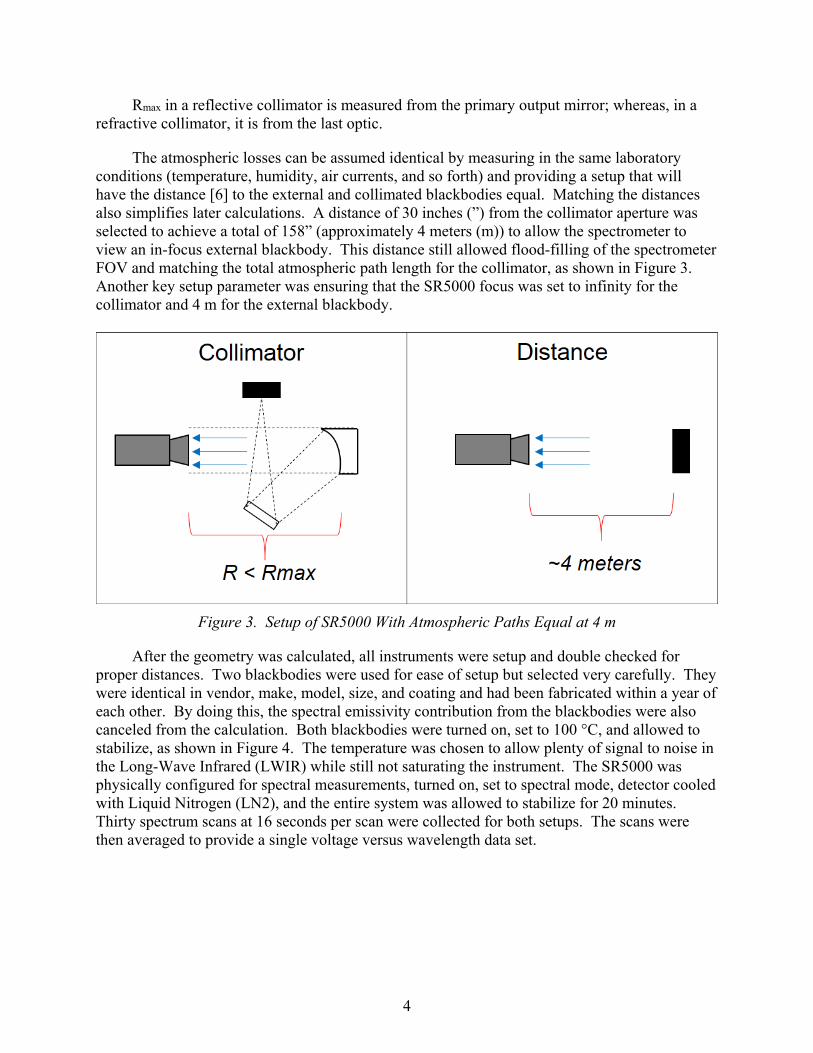
The atmospheric losses can be assumed identical by measuring in the same laboratory conditions (temperature, humidity, air currents, and so forth) and providing a setup that will have the distance [6] to the external and collimated blackbodies equal. Matching the distances also simplifies later calculations. A distance of 30 inches (”) from the collimator aperture was selected to achieve a total of 158” (approximately 4 meters (m)) to allow the spectrometer to view an in-focus external blackbody. This distance still allowed flood-filling of the spectrometer FOV and matching the total atmospheric path length for the collimator, as shown in Figure 3. Another key setup parameter was ensuring that the SR5000 focus was set to infinity for the collimator and 4 m for the external blackbody.
Figure 3. Setup of SR5000 With Atmospheric Paths Equal at 4 m
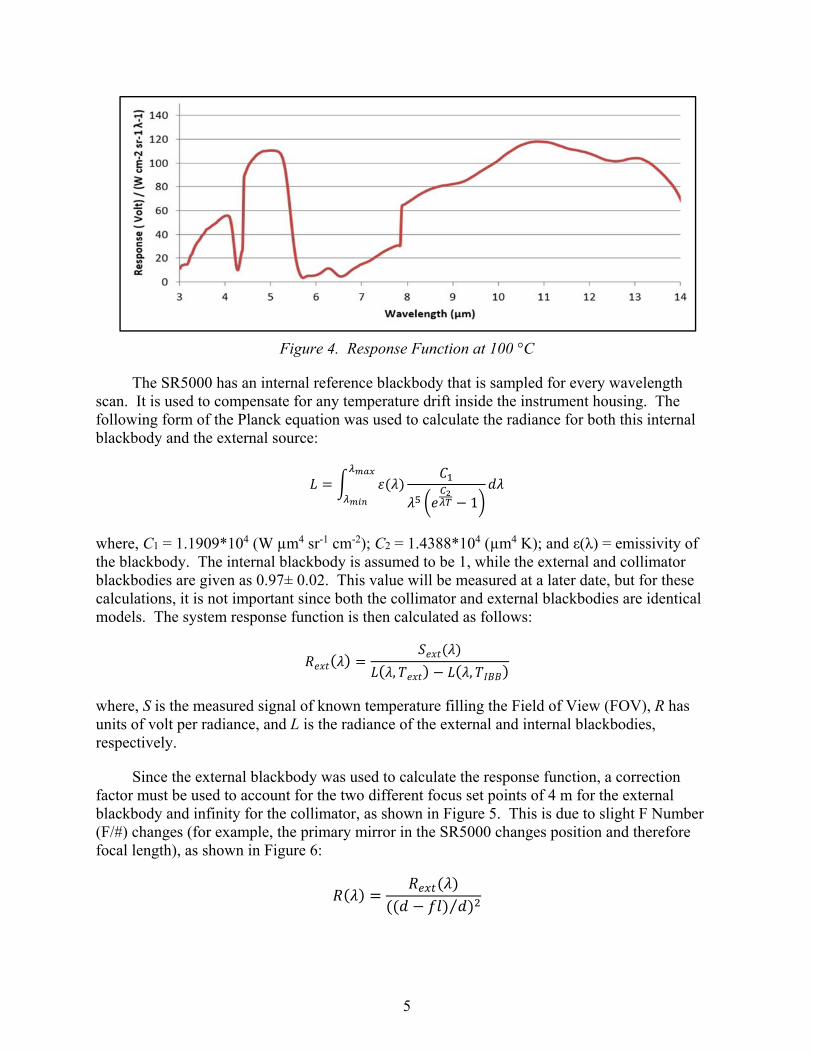
After the geometry was calculated, all instruments were setup and double checked for proper distances. Two blackbodies were used for ease of setup but selected very carefully. They were identical in vendor, make, model, size, and coating and had been fabricated within a year of each other. By doing this, the spectral emissivity contribution from the blackbodies were also canceled from the calculation. Both blackbodies were turned on, set to 100 °C, and allowed to stabilize, as shown in Figure 4. The temperature was chosen to allow plenty of signal to noise in the Long-Wave Infrared (LWIR) while still not saturating the instrument. The SR5000 was physically configured for spectral measurements, turned on, set to spectral mode, detector cooled with Liquid Nitrogen (LN2), and the entire system was allowed to stabilize for 20 minutes. Thirty spectrum scans at 16 seconds per scan were collected for both setups. The scans were then averaged to provide a single voltage versus wavelength data set.
5
Figure 4. Response Function at 100 °C
The SR5000 has an internal reference blackbody that is sampled for every wavelength scan. It is used to compensate for any temperature drift inside the instrument housing. The following form of the Planck equation was used to calculate the radiance for both this internal blackbody and the external source:
1
where, C1 = 1.1909*104 (W µm4 sr-1 cm-2); C2 = 1.4388*104 (µm4 K); and ε(λ) = emissivity of the blackbody. The internal blackbody is assumed to be 1, while the external and collimator blackbodies are given as 0.97± 0.02. This value will be measured at a later date, but for these calculations, it is not important since both the collimator and external blackbodies are identical models. The system response function is then calculated as follows:
, ,
where, S is the measured signal of known temperature filling the Field of View (FOV), R has units of volt per radiance, and L is the radiance of the external and internal blackbodies, respectively.
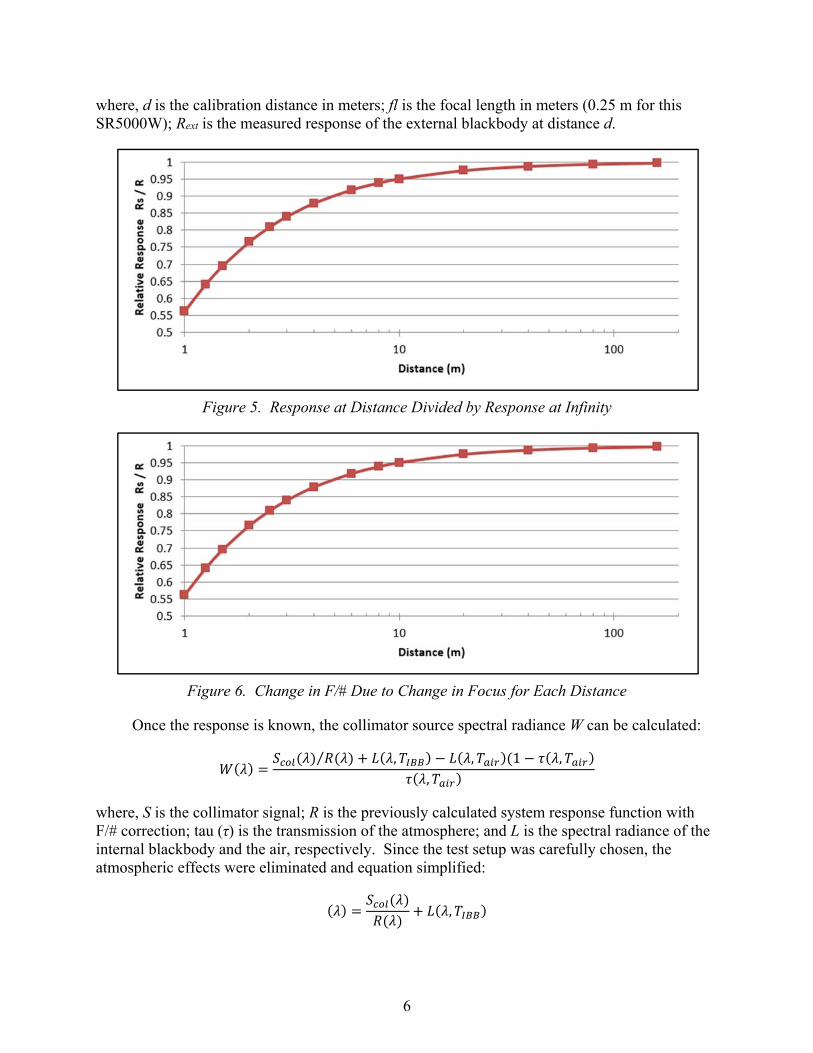
Since the external blackbody was used to calculate the response function, a correction factor must be used to account for the two different focus set points of 4 m for the external blackbody and infinity for the collimator, as shown in Figure 5. This is due to slight F Number (F/#) changes (for example, the primary mirror in the SR5000 changes position and therefore focal length), as shown in Figure 6:
⁄
6
where, d is the calibration distance in meters; fl is the focal length in meters (0.25 m for this SR5000W); Rext is the measured response of the external blackbody at distance d.
Figure 5. Response at Distance Divided by Response at Infinity
Figure 6. Change in F/# Due to Change in Focus for Each Distance
Once the response is known, the collimator source spectral radiance W can be calculated:
⁄ , , 1 ,,
where, S is the collimator signal; R is the previously calculated system response function with F/# correction; tau (τ) is the transmission of the atmosphere; and L is the spectral radiance of the internal blackbody and the air, respectively. Since the test setup was carefully chosen, the atmospheric effects were eliminated and equation simplified:
,
7
IV. RESULTS AND ANALYSIS
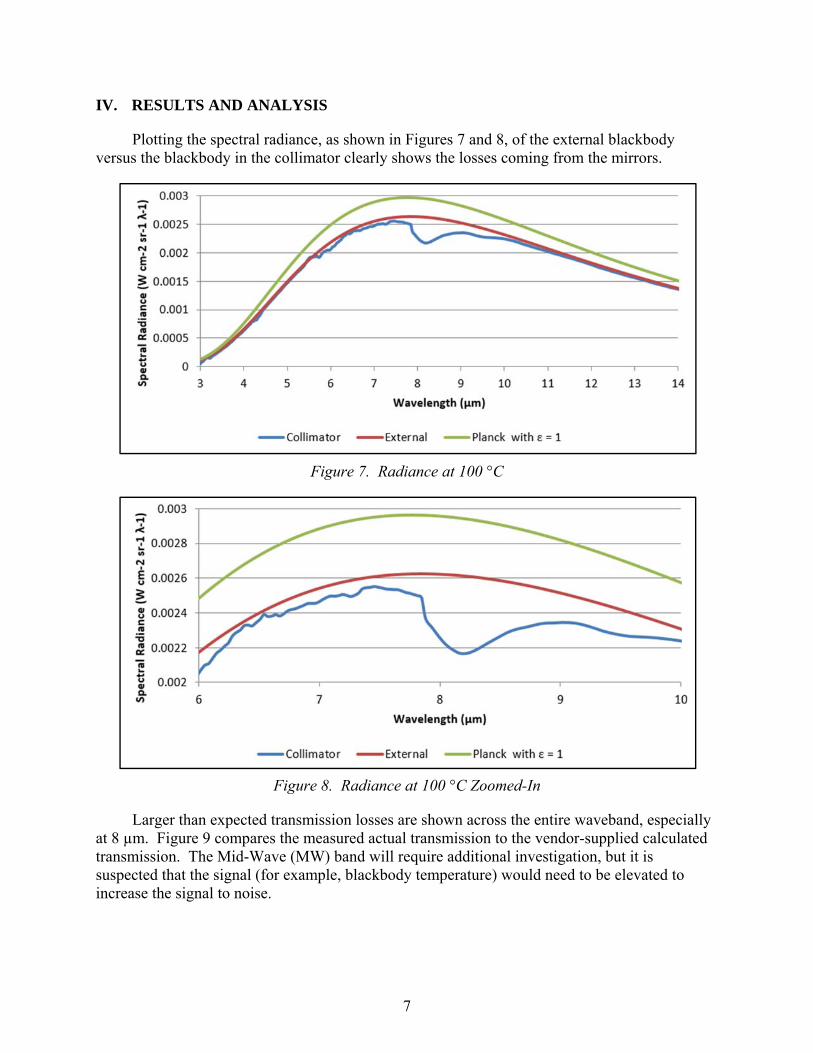
Plotting the spectral radiance, as shown in Figures 7 and 8, of the external blackbody versus the blackbody in the collimator clearly shows the losses coming from the mirrors.
Figure 7. Radiance at 100 °C
Figure 8. Radiance at 100 °C Zoomed-In
Larger than expected transmission losses are shown across the entire waveband, especially at 8 µm. Figure 9 compares the measured actual transmission to the vendor-supplied calculated transmission. The Mid-Wave (MW) band will require additional investigation, but it is suspected that the signal (for example, blackbody temperature) would need to be elevated to increase the signal to noise.
8
Figure 9. Reported Versus Measured Collimator Transmission
The transmission loss of example sub-bands can be calculated now that the losses for the collimator have been characterized. Table 2 shows large errors in transmission can be introduced if the assumed 97% (over 3 to 15 µm) is used instead of either the calculated or measured. Depending on the sub-band selected, large errors can still occur even if using the calculated transmission. The ideal solution can be obtained by using the measured, actual collimator transmission.
Table 2. Average Transmission of Several Sub-Bands
Sub-Bands (µm)
Calculated Transmission
Actual Transmission
Additional Loss Assumed (97%)—Actual
Additional Loss Calculated—Actual
7-13.5 96.2% 95.6% - 1.4 % - 0.6% 8-10 94.2% 91.1% - 5.9% - 3.1% 8-12 95.6% 94.5% - 2.5% - 1.1% 8-12.5 95.8% 94.9% - 2.1% - 0.9% 3.0-5.0 95.5% 92.8% - 4.2% - 2.8% 3.35-4.15 95.7% 94.7% - 2.3% - 1.0%
V. CONCLUSION AND FUTURE WORK
The collimator transmission losses can be measured by carefully selecting the test setup to eliminate atmospheric transmission and spectral emissivity differences of the blackbodies. This method detailed the equations necessary to calibrate and compensate for focus changes due to changing F/# of the SR5000 spectroradiometer. Measuring and using the actual collimator transmission losses resolved the discrepancies seen when comparing data through a collimator versus a standalone large surface blackbody. Further work will be done to secure a high emissivity cavity blackbody with a National Institute of Standards and Technology (NIST) measured spectral emissivity. This will then be used as the calibration source to completely characterize a collimator—mirrors spectral transmission and blackbody spectral emissivity.
9
REFERENCES
1. Rogers, R. K. et al., “Reporting NETD: Why Measurement Techniques Matter,” SPIE, Volume 9,071, 2014.
2. Cox J. T. and Hass, G., “Protected Al Mirrors with High Reflectance in the 8-12 µm Region from Normal to High Angles of Incidence,” Applied Optics, Volume 17 Number 14, pp. 2125-2126, 1978.
3. Cox, J. T.; Hass, G.; and Hunter, W. R., “Infrared Reflectance of Silicon Oxide and Magnesium Fluoride Protected Aluminum Mirrors at Various Angles of Incidence from 8µm to 12µm,” Applied Optics, Volume 14, Number 6, pp. 1247-1250, 1975.
4. Cox J. T. and Hass, G., “Aluminum Mirrors Al203-protected with high reflectance at normal but Greatly Decreased Reflectance at Higher Angles of Incidence in the 8-12µm region,” Applied Optics, Volume 17, Number 3, pp. 333-334, 1978.
5. Holst, G. C., Testing and Evaluation of Infrared Imaging Systems, 3rd Edition, JCD Publishing, Winter Park, FL, 2008.
6. Jacobs, P. A., Thermal Infrared Characterization of Ground Targets and Backgrounds, 2nd Edition, SPIE, Bellingham, WA, 2006.
10
LIST OF ABBREVIATIONS, ACRONYMS, AND SYMBOLS
% percent
” inch
~ approximately
< less than
< greater than
° degree
µm micrometers
C Celsius
Cam Camera
cm centimeter
F/# F-Number
fl Focal Length
FOV Field of View
IBB Internal Blackbody
in inch
InSb indium antimonide
IR Infrared
K Kelvin
L Radiance
LN2 Liquid Nitrogen
LWIR Long-Wave Infrared
m meter
MCT mercury cadmium telluride
mm millimeter
MW Mid-Wave
MWIR Mid-Wave Infrared
NIST National Institute of Standards and Technology
11/12 (Blank)
LIST OF ABBREVIATIONS, ACRONYMS, AND SYMBOLS (CONCLUDED)
SiO silicon oxide
sr steradian
T Temperature
W watt
x times
ε emissivity
λ wavelength
τ transmission