chris/proba atmospheric correction module
TRANSCRIPT
Algorithm Theoretical Basis Document
CHRIS/PROBA
Atmospheric Correction Module
Version 2.0, May 20, 2008
Luis Guanter1, Luis Alonso2, Luis Gomez-Chova2, Jose Moreno2
1GeoForschungsZentrum Potsdam, Telegrafenberg 14473, Potsdam (Germany)
2University of Valencia, Dr. Moliner 50, 46100, Burjassot–Valencia (Spain)
Development of CHRIS/PROBA modules for the BEAM toolbox
ESA ESRIN Contract No. 20442/07/I-LG
Contents
Abstract 3
Acronyms and Abbreviations 4
1 Introduction 5
1.1 Purpose . . . . . . . . . . . . . . . . . . . . . . . . . . . . . . . . . . . . . . . . . . 5
1.2 CHRIS/PROBA data . . . . . . . . . . . . . . . . . . . . . . . . . . . . . . . . . . 5
1.3 On the atmospheric correction of hyperspectral data . . . . . . . . . . . . . . . . . 6
1.4 Document outline . . . . . . . . . . . . . . . . . . . . . . . . . . . . . . . . . . . . . 8
2 Algorithm Description 8
2.1 Theoretical description . . . . . . . . . . . . . . . . . . . . . . . . . . . . . . . . . . 8
2.1.1 Radiative transfer calculations and LUT . . . . . . . . . . . . . . . . . . . . 8
2.1.2 Spectral calibration . . . . . . . . . . . . . . . . . . . . . . . . . . . . . . . 10
2.1.3 Retrieval of aerosol optical thickness . . . . . . . . . . . . . . . . . . . . . . 11
2.1.4 Retrieval of columnar water vapor . . . . . . . . . . . . . . . . . . . . . . . 13
2.1.5 Retrieval of surface reflectance . . . . . . . . . . . . . . . . . . . . . . . . . 15
2.2 Practical considerations . . . . . . . . . . . . . . . . . . . . . . . . . . . . . . . . . 16
3 Algorithm Validation 18
3.1 Reference ground-based data for validation . . . . . . . . . . . . . . . . . . . . . . 18
3.2 Retrieval of atmospheric parameters . . . . . . . . . . . . . . . . . . . . . . . . . . 20
3.3 Retrieval of surface reflectance . . . . . . . . . . . . . . . . . . . . . . . . . . . . . 21
3.3.1 Results from land targets . . . . . . . . . . . . . . . . . . . . . . . . . . . . 21
3.3.2 Results from inland water targets . . . . . . . . . . . . . . . . . . . . . . . . 23
4 Summary 24
Acknowledgement 25
Bibliography 25
2
Development of CHRIS/PROBA modules for the BEAM toolbox ESRIN/Contract No. 20442/07/I-LG
Abstract
The so-called atmospheric correction, i.e. the conversion from Top-of-Atmosphere radiance to
reflectance images, is normally necessary for the relieble exploitation of remote sensing informa-
tion. The theoretical basis of the atmospheric correction algorithm for Compact High Resolution
Imaging Spectrometer (CHRIS) on board the PRoject for On-Board Autonomy (PROBA) to be
implemented in the Basic ERS & Envisat (A)ATSR and MERIS (BEAM) software is described
in this document. Atmospheric correction should be performed on the outputs from the noise
reduction and cloud screening modules also implemented in BEAM. The atmospheric correction
module can process data from the 5 di!erent CHRIS acquisition modes, which define the spectral
and spatial specifications of the data. Depending on the acquisition mode, assessment of spec-
tral calibration, retrieval of aerosol optical thickness and columnar water vapor, and radiometric
recalibration are carried out along the complete processing. The validation exercise consisting
in the comparison of CHRIS/PROBA-derived data with ground-based measurements performed
during the development phase is also presented in this document. Special e!ort has been put on
the validation of the atmospheric parameters retrieved from CHRIS/PROBA by comparison with
data from the AErosol RObotic NETwork (AERONET).
Atmospheric Correction ATBD L. Guanter et al. 3
ESRIN/Contract No. 20442/07/I-LG Development of CHRIS/PROBA modules for the BEAM toolbox
Acronyms and Abbreviations
AERONET AErosol RObotic NETwork
AOT Aerosol Optical Thickness
ASD Analytical Spectral Devices FieldSpec Pro FR Spectroradiometer
ATBD Algorithm Theoretical Basis Document
BEAM Basic ERS & Envisat (A)ATSR and MERIS
BRDF Bidirectional Reflectance Distribution Function
CHRIS Compact High Resolution Imaging Spectrometer
CWV Columnar Water Vapor
DEM Digital Elevation Model
ELEV ELEVation
FZA Fly-by Zenith Angle
LUT Look-Up Table
MODTRAN MODerate resolution TRANsmittance
NDVI Normalized Di!erence Vegetation Index
NIR Near–infraRed
PROBA PRoject for On-Board Autonomy
RAA Relative Azimuth Angle
SPARC SPectra bARrax Campaign
SZA Sun Zenith Angle
TOA Top Of Atmosphere
VZA View Zenith Angle
4 L. Guanter et al. Atmospheric Correction ATBD
Development of CHRIS/PROBA modules for the BEAM toolbox ESRIN/Contract No. 20442/07/I-LG
1 Introduction
1.1 Purpose
This Algorithm Theoretical Basis Document (ATBD) describes an algorithm for the at-
mospheric correction of data acquired by the Compact High Resolution Imaging Spectrometer
(CHRIS) on board the Project for On-Board Autonomy (PROBA) platform (Barnsley et al.,
2004). The algorithm is to be implemented in the Basic ERS & Envisat (A)ATSR and MERIS
(BEAM) software (Fomferra and Brockmann, 2005), together with other packages for the process-
ing and exploitation of CHRIS/PROBA data. This atmospheric correction module will convert
from Top-of-Atmosphere (TOA) radiance to surface reflectance images in an automatic man-
ner. The di!erent steps to be performed along the atmospheric correction process depend on the
CHRIS acquisition mode. The aerosol optical thickness (AOT) characterising the atmospheric
aerosol loading is calculated for all the CHRIS acquisition modes, while columnar water vapor
(CWV) is only derived for modes 1, 3 and 5, as no su"cient sampling of water vapor absorption
features is provided by modes 2 and 4. On the other hand, spectral calibration and an optional
spectral polishing are only performed on modes 1 and 5, which are the ones resolving most of
the atmospheric absorption bands in the 400-1000 nm spectral range. The algorithm is imple-
mented so that it must be applied after noise removal and cloud screening. The interface between
atmospheric and geometric correction modules is not established at this stage of this project,
so elevation and topographic e!ects calculated from a geo-located digital elevation model are
not considered in current version of the atmospheric correction module. This document outlines
the algorithm physical and mathematical basis, and lists the assumptions and limitations of the
proposed algorithm.
1.2 CHRIS/PROBA data
The CHRIS/PROBA system (Barnsley et al., 2004), launched on 22 October 2001, was im-
plemented as a technology demonstration experiment to take advantage of autonomous pointing
capabilities of a generic platform suitable for Earth Observation purposes. It provides high spa-
tial resolution hyperspectral and multiangular data, what constitutes a new generation of remote
sensing information to be processed and exploited.
On one hand, the PROBA platform provides pointing in both across–track and along–track
directions. In this way, the CHRIS/PROBA system has multiangular capabilities, acquiring up
to 5 consecutive images from 5 di!erent view angles in the same satellite overpass. Each imaged
target has an associated “fly–by” position, that is the position on the ground track when the
platform zenith angle, as seen from the target, is a minimum. The platform acquires the images
at times when the zenith angle of the platform with respect to the fly–by position is equal to a
set of Fly–by Zenith Angles (FZA): 0!, ±36! or ±55!. Negative FZAs correspond to acquisition
geometries for which the satellite has already flown over the target position.
On the other hand, CHRIS measures over the visible and near–infrared (NIR) bands from
Atmospheric Correction ATBD L. Guanter et al. 5
ESRIN/Contract No. 20442/07/I-LG Development of CHRIS/PROBA modules for the BEAM toolbox
410 nm to 1050 nm, with the internal spectral resolution ranging between 1.25 (@400 nm) and
11 nm (@1000 nm). The spectral configuration is set in advance through the selection of one
of 5 possible acquisition modes, which define combinations of number, position and width of
spectral channels, as well as spatial resolution and coverage. For each of those acquisition modes,
bands spectral position are expected to change from one acquisition to another due to thermal
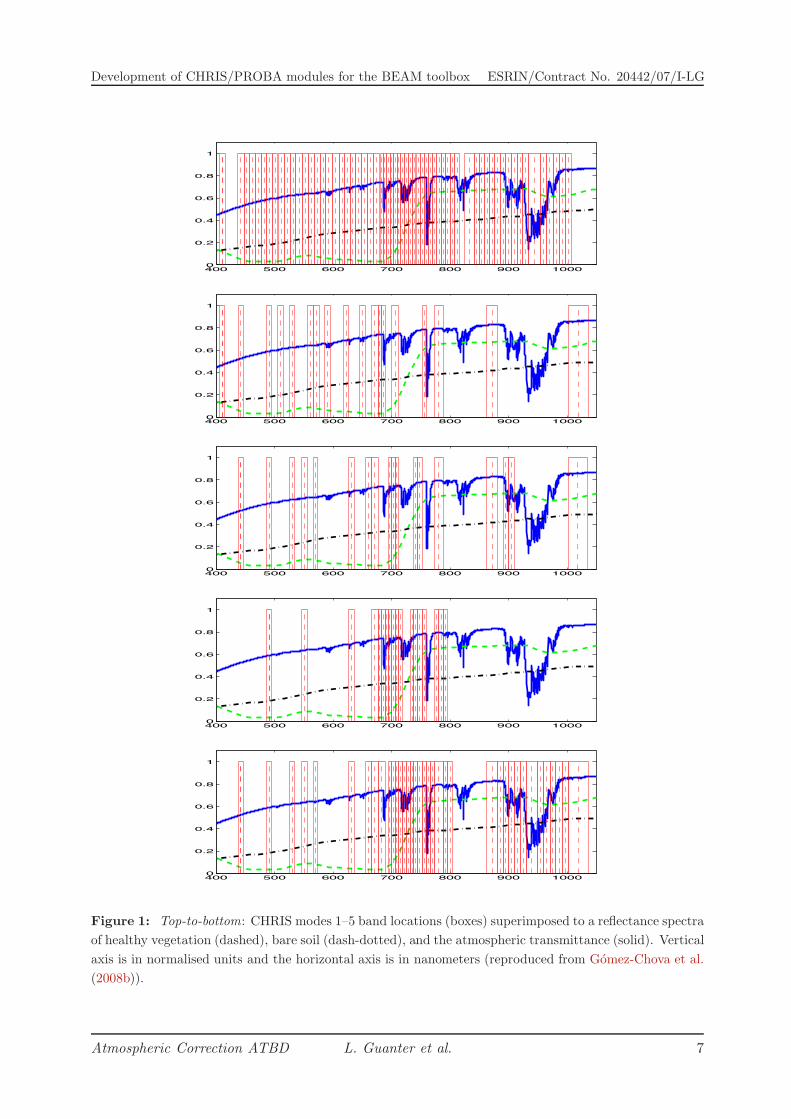
variations in the instrument. The spectral coverage of bands acquired by the di!erent CHRIS
modes is depicted in Fig. 1.
Apart from the particular band setting, acquisition modes also define the ground sampling
distance (GSD) and the swath width. Nominal GSD is 34 m for mode 1, and 18 m for the rest of
the modes, while the nominal swath width is about 13 km for all the modes except for mode 5,
which operates with half-swath.
1.3 On the atmospheric correction of hyperspectral data
Airborne or spaceborne imaging spectrometers allow the remote monitoring of surface and
atmospheric processes. In particular, a wide range of scientific fields, such as mineral mapping,
vegetation phenology, water quality or atmospheric chemistry, can be covered by instruments
with a fine spectral resolution. When the acquired remote sensing data set is to be used in the
characterisation of the surface state, the target reflectance becomes the natural magnitude to be
evaluated. The atmospheric contribution to the radiance spectra measured by the sensor becomes
an error source that must be removed from the useful signal reflected by the surface, which is the
principle of atmospheric correction.
Advanced atmospheric correction algorithms for hyperspectral data lie on a radiative transfer
approach to invert the surface reflectance from the at-sensor radiance registered by the sensor.
The atmospheric components with the highest optical activity in the solar spectrum range are
aerosols and water vapor. The general situation is that no ancillary information about particulate
matter or water vapor abundances simultaneous to image acquisitions is available except for some
dedicated field experiments. For these reason, algorithms for the estimation of AOT or CWV
from the hyperspectral data themselves must be coupled to atmospheric radiative transfer codes
to simulate the atmospheric interaction with the solar radiation traveling across it.
However, apart from the atmosphere there are other error sources a!ecting the retrieved
surface reflectance. One of the most important ones is the deviation of spectral channels position
and width from nominal values. Optical aberrations in pushbroom systems, such as CHRIS, may
cause the spectrometer entrance slit to be projected as a curve on the rectilinear detector array
(Mouroulis et al., 2000; Qu et al., 2003). This originates a combination of bending of spectral lines
across the spatial axis and of the spatial lines across the spectral axis. The first e!ect, known
as “smile”, originates a non-linear variation of the spectral shift with the across-track position of
the di!erent detectors compounding the sensor. Degradation in the instrument calibration can
also lead to a wrong spectral response. Spectral shifts from the band positions defined at the
laboratory and provided to the users lead to noticeable errors in surface reflectance, especially in
6 L. Guanter et al. Atmospheric Correction ATBD
Development of CHRIS/PROBA modules for the BEAM toolbox ESRIN/Contract No. 20442/07/I-LG
400 500 600 700 800 900 10000
0.2
0.4
0.6
0.8
1
400 500 600 700 800 900 10000
0.2
0.4
0.6
0.8
1
400 500 600 700 800 900 10000
0.2
0.4
0.6
0.8
1
400 500 600 700 800 900 10000
0.2
0.4
0.6
0.8
1
400 500 600 700 800 900 10000
0.2
0.4
0.6
0.8
1
Figure 1: Top-to-bottom: CHRIS modes 1–5 band locations (boxes) superimposed to a reflectance spectra
of healthy vegetation (dashed), bare soil (dash-dotted), and the atmospheric transmittance (solid). Vertical
axis is in normalised units and the horizontal axis is in nanometers (reproduced from Gomez-Chova et al.
(2008b)).
Atmospheric Correction ATBD L. Guanter et al. 7
ESRIN/Contract No. 20442/07/I-LG Development of CHRIS/PROBA modules for the BEAM toolbox
those bands located in the surroundings of gaseous absorptions. A detailed analysis of the errors
in at-sensor radiances caused by systematic shifts was presented by Green (1998). Synthetic
data with a systematic spectral shift of 1 nm for channels with Full Width at Half Maximum
(FWHM) of 10 nm showed associated errors in the measured radiance of up to ±25% in strong
water vapor absorption bands. In addition, instrumental noise or errors in calibration coe"cients
or atmospheric characterisation may cause errors in the retrieved reflectance to appear all over
the spectral range.
The influence of both atmospheric and instrumental factors over the retrieval of surface re-
flectance is addressed in the proposed algorithm. However, the complete processing chain is
conditioned by the CHRIS acquisition mode. Good spectral resolution and sampling are neces-
sary for water vapor retrieval and the assessment of the spectral calibration, as those are achieved
by means of the resolution of atmospheric absorption features. For the same reason, errors in
reflectance associated to a bad characterisation of CWV or sensor calibration are minimised for
coarser spectral resolutions or when atmospheric absorption features are skipped. In the case of
CHRIS acquisition modes, the entire 400-1000 nm spectral range is only registered by mode 1,
as it is shown in Fig. 1. Atmospheric oxygen A and B bands, at 687 and 760 nm respectively,
are only registered in modes 1 and 5, and the strong water vapor absorption feature centered at
940 nm is totally or partially covered in modes 1, 3 and 5. For this reason, CWV retrieval is
not carried out in modes 2 and 4, and the assessment of sensor calibration is only performed on
modes 1 and 5. AOT retrieval is performed for all the acquisition modes, as it is mostly driven
by aerosol scattering, which presents a continuous spectral dependence.
1.4 Document outline
A full description of the algorithm is presented in this document. Two sections follow this
introduction. The first one deals with the description of the algorithm physical basis, covering
the di!erent processing steps leading to the final reflectance product. Some notes about the
algorithm performance and general input and output parameters are also provided. A second
section presents results about previous validation of the algorithm over both land and water
targets. It must be remarked that some of the assumptions and steps described hereinafter apply
only to modes 1 and 5, the other three modes being considered particular cases.
2 Algorithm Description
2.1 Theoretical description
2.1.1 Radiative transfer calculations and LUT
The retrieval of atmospheric constituents and surface reflectance involves modeling the radia-
tive transfer across the atmosphere. A simple but accurate formulation of the TOA signal in terms
of surface reflectance and atmospheric optical parameters is necessary. Since no knowledge of the
8 L. Guanter et al. Atmospheric Correction ATBD
Development of CHRIS/PROBA modules for the BEAM toolbox ESRIN/Contract No. 20442/07/I-LG
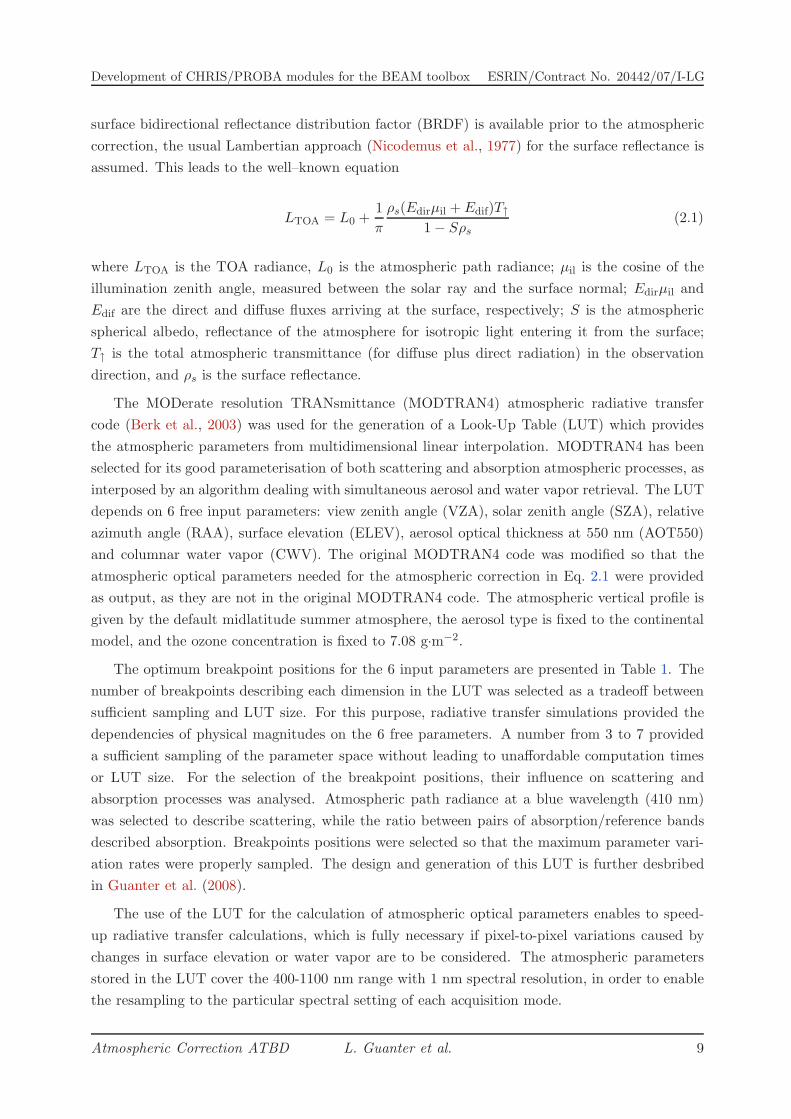
surface bidirectional reflectance distribution factor (BRDF) is available prior to the atmospheric
correction, the usual Lambertian approach (Nicodemus et al., 1977) for the surface reflectance is
assumed. This leads to the well–known equation
LTOA = L0 +1
!
"s(Edirµil + Edif)T"
1 ! S"s(2.1)
where LTOA is the TOA radiance, L0 is the atmospheric path radiance; µil is the cosine of the
illumination zenith angle, measured between the solar ray and the surface normal; Edirµil and
Edif are the direct and di!use fluxes arriving at the surface, respectively; S is the atmospheric
spherical albedo, reflectance of the atmosphere for isotropic light entering it from the surface;
T" is the total atmospheric transmittance (for di!use plus direct radiation) in the observation
direction, and "s is the surface reflectance.
The MODerate resolution TRANsmittance (MODTRAN4) atmospheric radiative transfer
code (Berk et al., 2003) was used for the generation of a Look-Up Table (LUT) which provides
the atmospheric parameters from multidimensional linear interpolation. MODTRAN4 has been
selected for its good parameterisation of both scattering and absorption atmospheric processes, as
interposed by an algorithm dealing with simultaneous aerosol and water vapor retrieval. The LUT
depends on 6 free input parameters: view zenith angle (VZA), solar zenith angle (SZA), relative
azimuth angle (RAA), surface elevation (ELEV), aerosol optical thickness at 550 nm (AOT550)
and columnar water vapor (CWV). The original MODTRAN4 code was modified so that the
atmospheric optical parameters needed for the atmospheric correction in Eq. 2.1 were provided
as output, as they are not in the original MODTRAN4 code. The atmospheric vertical profile is
given by the default midlatitude summer atmosphere, the aerosol type is fixed to the continental
model, and the ozone concentration is fixed to 7.08 g·m#2.
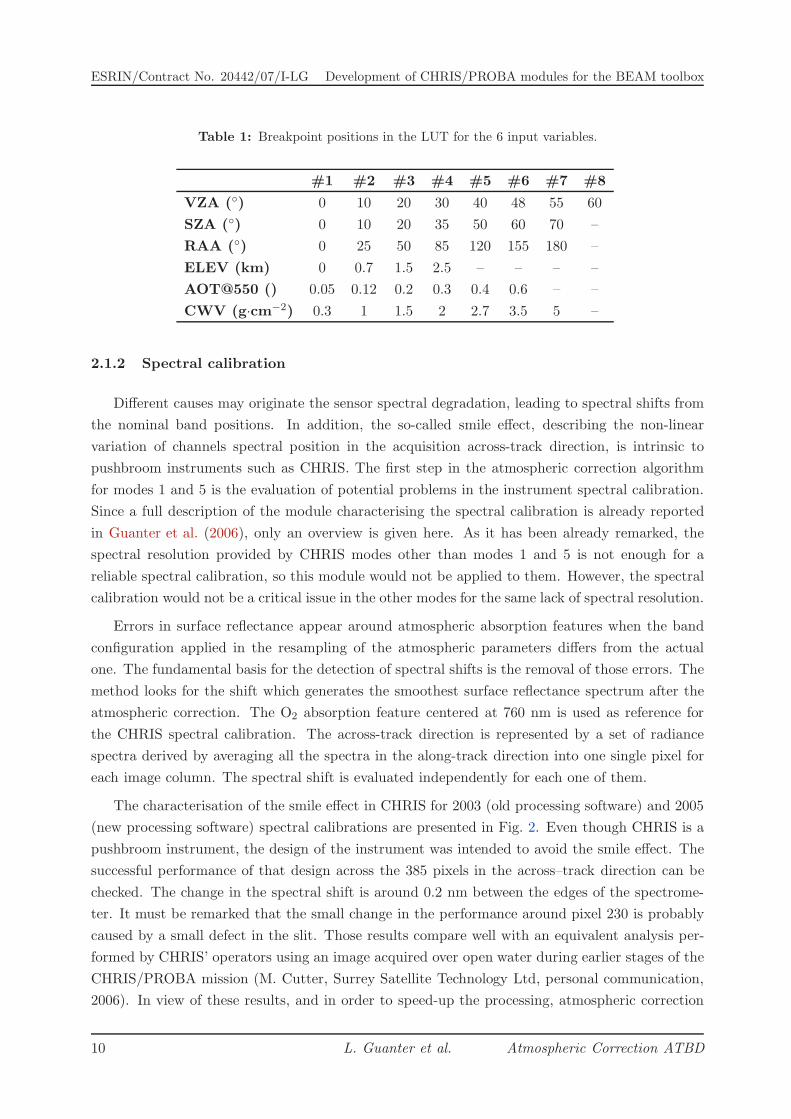
The optimum breakpoint positions for the 6 input parameters are presented in Table 1. The
number of breakpoints describing each dimension in the LUT was selected as a tradeo! between
su"cient sampling and LUT size. For this purpose, radiative transfer simulations provided the
dependencies of physical magnitudes on the 6 free parameters. A number from 3 to 7 provided
a su"cient sampling of the parameter space without leading to una!ordable computation times
or LUT size. For the selection of the breakpoint positions, their influence on scattering and
absorption processes was analysed. Atmospheric path radiance at a blue wavelength (410 nm)
was selected to describe scattering, while the ratio between pairs of absorption/reference bands
described absorption. Breakpoints positions were selected so that the maximum parameter vari-
ation rates were properly sampled. The design and generation of this LUT is further desbribed
in Guanter et al. (2008).
The use of the LUT for the calculation of atmospheric optical parameters enables to speed-
up radiative transfer calculations, which is fully necessary if pixel-to-pixel variations caused by
changes in surface elevation or water vapor are to be considered. The atmospheric parameters
stored in the LUT cover the 400-1100 nm range with 1 nm spectral resolution, in order to enable
the resampling to the particular spectral setting of each acquisition mode.
Atmospheric Correction ATBD L. Guanter et al. 9
ESRIN/Contract No. 20442/07/I-LG Development of CHRIS/PROBA modules for the BEAM toolbox
Table 1: Breakpoint positions in the LUT for the 6 input variables.
#1 #2 #3 #4 #5 #6 #7 #8
VZA (!) 0 10 20 30 40 48 55 60
SZA (!) 0 10 20 35 50 60 70 –
RAA (!) 0 25 50 85 120 155 180 –
ELEV (km) 0 0.7 1.5 2.5 – – – –
AOT@550 () 0.05 0.12 0.2 0.3 0.4 0.6 – –
CWV (g·cm#2) 0.3 1 1.5 2 2.7 3.5 5 –
2.1.2 Spectral calibration
Di!erent causes may originate the sensor spectral degradation, leading to spectral shifts from
the nominal band positions. In addition, the so-called smile e!ect, describing the non-linear
variation of channels spectral position in the acquisition across-track direction, is intrinsic to
pushbroom instruments such as CHRIS. The first step in the atmospheric correction algorithm
for modes 1 and 5 is the evaluation of potential problems in the instrument spectral calibration.
Since a full description of the module characterising the spectral calibration is already reported
in Guanter et al. (2006), only an overview is given here. As it has been already remarked, the
spectral resolution provided by CHRIS modes other than modes 1 and 5 is not enough for a
reliable spectral calibration, so this module would not be applied to them. However, the spectral
calibration would not be a critical issue in the other modes for the same lack of spectral resolution.
Errors in surface reflectance appear around atmospheric absorption features when the band
configuration applied in the resampling of the atmospheric parameters di!ers from the actual
one. The fundamental basis for the detection of spectral shifts is the removal of those errors. The
method looks for the shift which generates the smoothest surface reflectance spectrum after the
atmospheric correction. The O2 absorption feature centered at 760 nm is used as reference for
the CHRIS spectral calibration. The across-track direction is represented by a set of radiance
spectra derived by averaging all the spectra in the along-track direction into one single pixel for
each image column. The spectral shift is evaluated independently for each one of them.
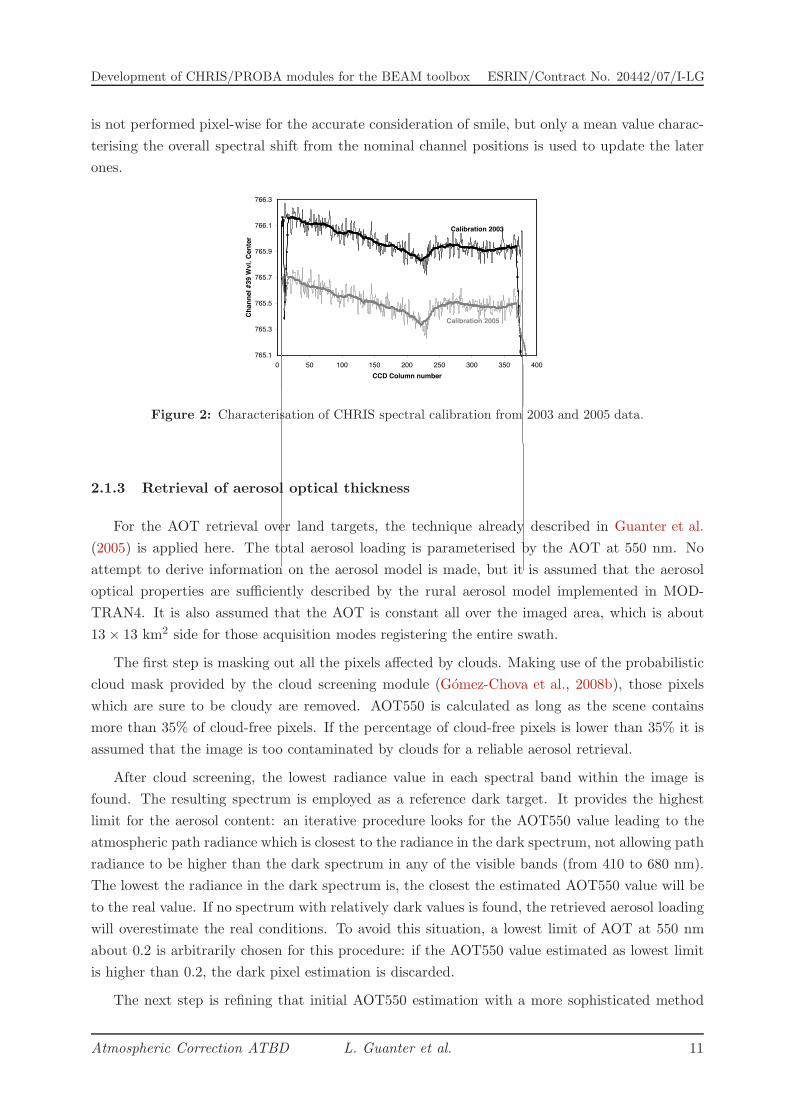
The characterisation of the smile e!ect in CHRIS for 2003 (old processing software) and 2005
(new processing software) spectral calibrations are presented in Fig. 2. Even though CHRIS is a
pushbroom instrument, the design of the instrument was intended to avoid the smile e!ect. The
successful performance of that design across the 385 pixels in the across–track direction can be
checked. The change in the spectral shift is around 0.2 nm between the edges of the spectrome-
ter. It must be remarked that the small change in the performance around pixel 230 is probably
caused by a small defect in the slit. Those results compare well with an equivalent analysis per-
formed by CHRIS’ operators using an image acquired over open water during earlier stages of the
CHRIS/PROBA mission (M. Cutter, Surrey Satellite Technology Ltd, personal communication,
2006). In view of these results, and in order to speed-up the processing, atmospheric correction
10 L. Guanter et al. Atmospheric Correction ATBD
Development of CHRIS/PROBA modules for the BEAM toolbox ESRIN/Contract No. 20442/07/I-LG
is not performed pixel-wise for the accurate consideration of smile, but only a mean value charac-
terising the overall spectral shift from the nominal channel positions is used to update the later
ones.
765.1
765.3
765.5
765.7
765.9
766.1
766.3
0 50 100 150 200 250 300 350 400CCD Column number
Chan
nel #
39 W
vl. C
ente
r
Calibration 2003
Calibration 2005
Figure 2: Characterisation of CHRIS spectral calibration from 2003 and 2005 data.
2.1.3 Retrieval of aerosol optical thickness
For the AOT retrieval over land targets, the technique already described in Guanter et al.
(2005) is applied here. The total aerosol loading is parameterised by the AOT at 550 nm. No
attempt to derive information on the aerosol model is made, but it is assumed that the aerosol
optical properties are su"ciently described by the rural aerosol model implemented in MOD-
TRAN4. It is also assumed that the AOT is constant all over the imaged area, which is about
13 " 13 km2 side for those acquisition modes registering the entire swath.
The first step is masking out all the pixels a!ected by clouds. Making use of the probabilistic
cloud mask provided by the cloud screening module (Gomez-Chova et al., 2008b), those pixels
which are sure to be cloudy are removed. AOT550 is calculated as long as the scene contains
more than 35% of cloud-free pixels. If the percentage of cloud-free pixels is lower than 35% it is
assumed that the image is too contaminated by clouds for a reliable aerosol retrieval.
After cloud screening, the lowest radiance value in each spectral band within the image is
found. The resulting spectrum is employed as a reference dark target. It provides the highest
limit for the aerosol content: an iterative procedure looks for the AOT550 value leading to the
atmospheric path radiance which is closest to the radiance in the dark spectrum, not allowing path
radiance to be higher than the dark spectrum in any of the visible bands (from 410 to 680 nm).
The lowest the radiance in the dark spectrum is, the closest the estimated AOT550 value will be
to the real value. If no spectrum with relatively dark values is found, the retrieved aerosol loading
will overestimate the real conditions. To avoid this situation, a lowest limit of AOT at 550 nm
about 0.2 is arbitrarily chosen for this procedure: if the AOT550 value estimated as lowest limit
is higher than 0.2, the dark pixel estimation is discarded.
The next step is refining that initial AOT550 estimation with a more sophisticated method
Atmospheric Correction ATBD L. Guanter et al. 11
ESRIN/Contract No. 20442/07/I-LG Development of CHRIS/PROBA modules for the BEAM toolbox
involving the inversion of TOA radiances in combinations of green vegetation and bare soil pixels.
This is performed only over those pixels which are classified as land pixels. AOT550 is then re-
trieved from 5 pixels with high spectral contrast inside this window, by means of a multiparameter
inversion of the TOA spectral radiances in those pixels. To provide an estimation of the surface
reflectance, each of the 5 reference pixels is represented by a linear combination of two vegetation
and soil spectra, which act as endmembers:
"s = Cv"veg + Cs"soil Cv,s > 0, "s # [0, 1] (2.2)
where "veg, "soil are representative vegetation and bare soil reflectance spectra, and Cv,s the
weighting coe"cients. The proportions of vegetation and soil are allowed to be larger than 1.0,
covering those cases in which the surface reflectance is brighter than the endmembers. The
constraint is that the generated surface reflectance must be in the range [0, 1]. The ten abundance
coe"cients Cv,s (2 for each of the 5 pixels) are free parameters in the inversion, as well as the
aerosol loading. The resulting 11-D inversion is performed by the Powell Minimization Method
(Press et al., 1986). It must be remarked that the vegetation and bare soil endmembers are not
real endmembers characterising every single scene, but they are only used to represent the average
surface reflectance contribution by means of its linear combination. Thus, there is no need for
the retrieval of endmembers from the image, but it is enough if the a priori selected spectra can
be combined to reproduce the actual spectral shape of the reference pixels. A similar idea using
linear combinations of endmembers to be inverted inside an AOT retrieval scheme was proposed
by von Hoyningen-Huene et al. (2003).
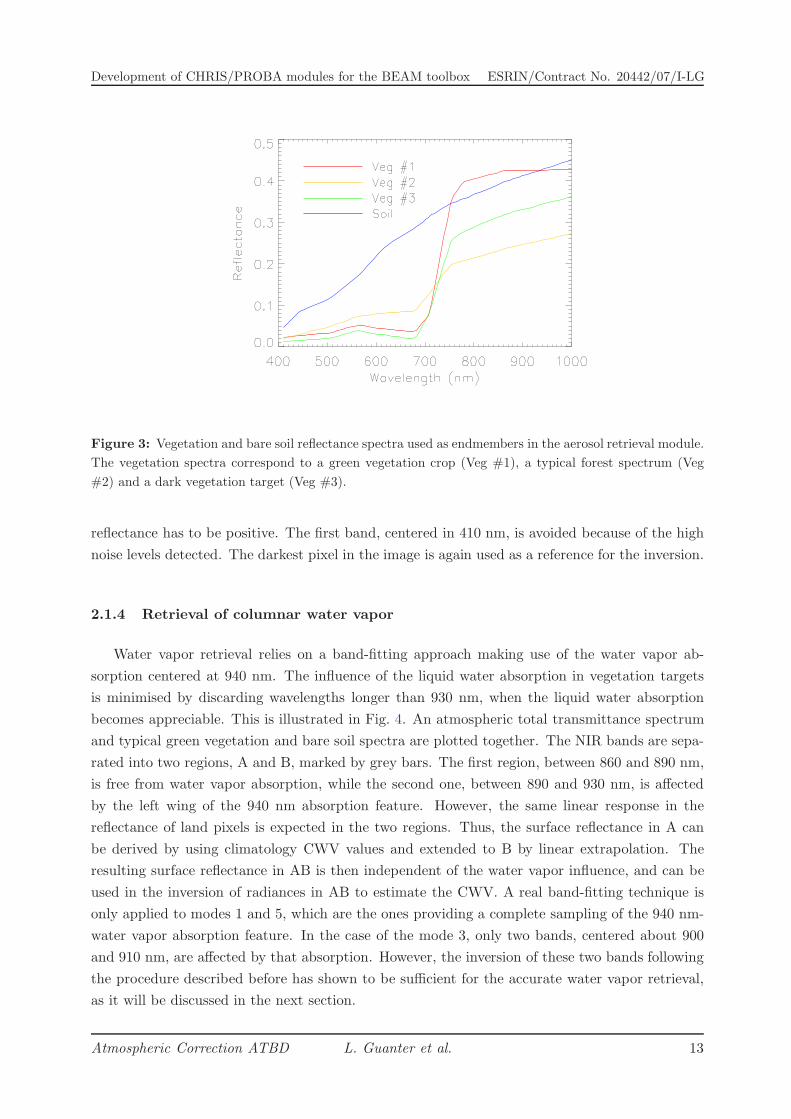
The 5 reference pixels must have as much spectral contrast as possible (ranging from pixels
with high vegetation content to high bare soil content). The reason is that this contrast in the
surface, while assuming a constant atmosphere above, is used in the discrimination of the radiative
transfer contribution of surface and atmosphere to the TOA signal. In order to minimise possible
biases due to a bad representation of the actual surface reflectance by endmember combinations,
three di!erent vegetation spectra are combined with one bare soil spectrum to simulate each
reference pixel. Those three vegetation spectra, plotted in Fig. 3, correspond to a green vegetation
crop, a typical forest spectrum and a dark vegetation target. The aerosol loading is calculated
independently for each of the three pairs of vegetation and soil endmembers. The AOT value
leading to the minimum value of the merit function driving the inversion is selected for the image.
The reason for having 3 vegetation spectra accounting for di!erent vegetation types and only one
for bare soil is that vegetation is considered to have a wider range of spectral patterns than bare
soils.
In the case of inland water pixels, the particular performance of CHRIS in the mode 2 config-
uration (optimised for the observation of water bodies) causes that a di!erent approach must be
followed in the retrieval of the atmospheric parameters. The use of land pixels is avoided for mode
2 data, due to the saturation usually found for surface albedoes higher than 20-25%. An iterative
procedure is again performed for aerosol retrieval over water pixels. It seeks for the AOT550 that
minimises the subsequent water reflectance in CHRIS bands 2 and 3 (centered around 440 and
490 nm in mode 2), where the aerosol scattering is maximal, with the physical constraint that the
12 L. Guanter et al. Atmospheric Correction ATBD
Development of CHRIS/PROBA modules for the BEAM toolbox ESRIN/Contract No. 20442/07/I-LG
Figure 3: Vegetation and bare soil reflectance spectra used as endmembers in the aerosol retrieval module.
The vegetation spectra correspond to a green vegetation crop (Veg #1), a typical forest spectrum (Veg
#2) and a dark vegetation target (Veg #3).
reflectance has to be positive. The first band, centered in 410 nm, is avoided because of the high
noise levels detected. The darkest pixel in the image is again used as a reference for the inversion.
2.1.4 Retrieval of columnar water vapor
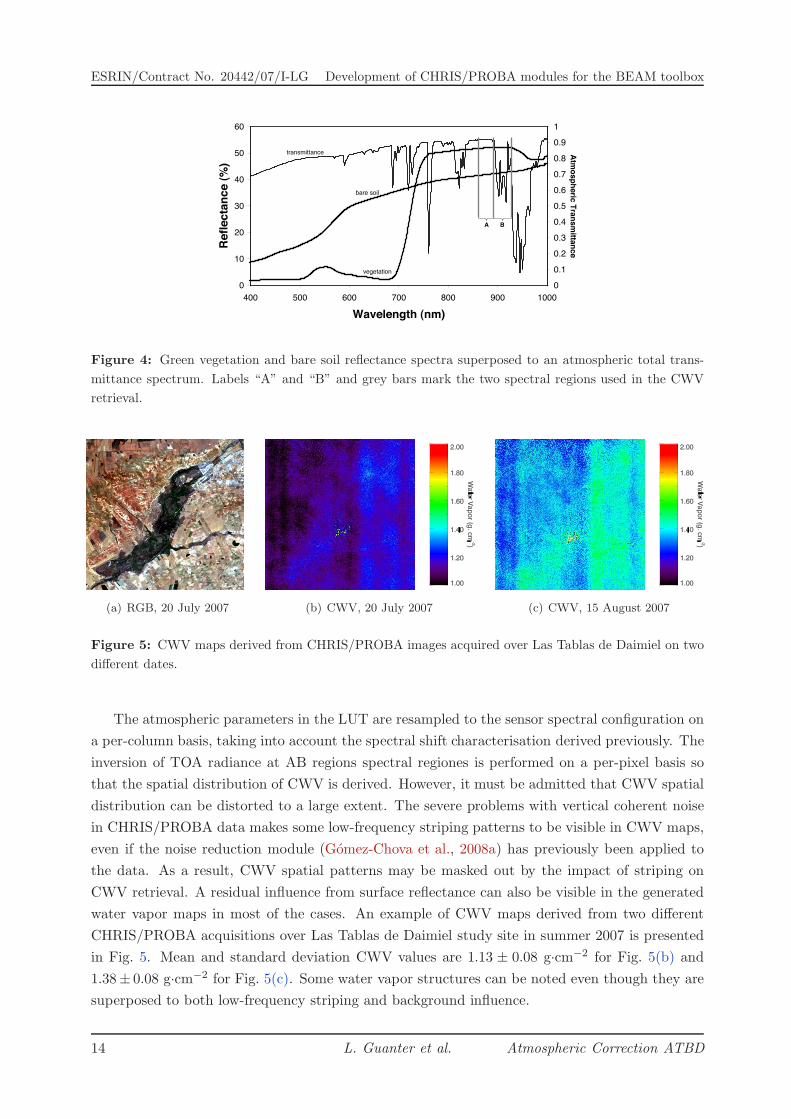
Water vapor retrieval relies on a band-fitting approach making use of the water vapor ab-
sorption centered at 940 nm. The influence of the liquid water absorption in vegetation targets
is minimised by discarding wavelengths longer than 930 nm, when the liquid water absorption
becomes appreciable. This is illustrated in Fig. 4. An atmospheric total transmittance spectrum
and typical green vegetation and bare soil spectra are plotted together. The NIR bands are sepa-
rated into two regions, A and B, marked by grey bars. The first region, between 860 and 890 nm,
is free from water vapor absorption, while the second one, between 890 and 930 nm, is a!ected
by the left wing of the 940 nm absorption feature. However, the same linear response in the
reflectance of land pixels is expected in the two regions. Thus, the surface reflectance in A can
be derived by using climatology CWV values and extended to B by linear extrapolation. The
resulting surface reflectance in AB is then independent of the water vapor influence, and can be
used in the inversion of radiances in AB to estimate the CWV. A real band-fitting technique is
only applied to modes 1 and 5, which are the ones providing a complete sampling of the 940 nm-
water vapor absorption feature. In the case of the mode 3, only two bands, centered about 900
and 910 nm, are a!ected by that absorption. However, the inversion of these two bands following
the procedure described before has shown to be su"cient for the accurate water vapor retrieval,
as it will be discussed in the next section.
Atmospheric Correction ATBD L. Guanter et al. 13
ESRIN/Contract No. 20442/07/I-LG Development of CHRIS/PROBA modules for the BEAM toolbox
0
10
20
30
40
50
60
400 500 600 700 800 900 1000
Wavelength (nm)
Refle
ctan
ce (%
)
0
0.1
0.2
0.3
0.4
0.5
0.6
0.7
0.8
0.9
1
Atmospheric Transm
ittanceA B
vegetation
bare soil
transmittance
Figure 4: Green vegetation and bare soil reflectance spectra superposed to an atmospheric total trans-
mittance spectrum. Labels “A” and “B” and grey bars mark the two spectral regions used in the CWV
retrieval.
(a) RGB, 20 July 2007 (b) CWV, 20 July 2007 (c) CWV, 15 August 2007
Figure 5: CWV maps derived from CHRIS/PROBA images acquired over Las Tablas de Daimiel on two
di!erent dates.
The atmospheric parameters in the LUT are resampled to the sensor spectral configuration on
a per-column basis, taking into account the spectral shift characterisation derived previously. The
inversion of TOA radiance at AB regions spectral regiones is performed on a per-pixel basis so
that the spatial distribution of CWV is derived. However, it must be admitted that CWV spatial
distribution can be distorted to a large extent. The severe problems with vertical coherent noise
in CHRIS/PROBA data makes some low-frequency striping patterns to be visible in CWV maps,
even if the noise reduction module (Gomez-Chova et al., 2008a) has previously been applied to
the data. As a result, CWV spatial patterns may be masked out by the impact of striping on
CWV retrieval. A residual influence from surface reflectance can also be visible in the generated
water vapor maps in most of the cases. An example of CWV maps derived from two di!erent
CHRIS/PROBA acquisitions over Las Tablas de Daimiel study site in summer 2007 is presented
in Fig. 5. Mean and standard deviation CWV values are 1.13 ± 0.08 g·cm#2 for Fig. 5(b) and
1.38± 0.08 g·cm#2 for Fig. 5(c). Some water vapor structures can be noted even though they are
superposed to both low-frequency striping and background influence.
14 L. Guanter et al. Atmospheric Correction ATBD
Development of CHRIS/PROBA modules for the BEAM toolbox ESRIN/Contract No. 20442/07/I-LG
In view of this fact, and taking into account that the per-pixel water vapor retrieval can be
highly time consuming, an option for the code to perform water vapor ertrieval only on a selected
subset of pixels, the retrieved mean value been applied to the complete image, can be selected
by the user. This option is specially recommended in the case of flat, horizontally-homogeneous
areas, where small variations in the spatial distribution of water vapor are expected.
2.1.5 Retrieval of surface reflectance
The derivation of the reflectance images is performed simultaneously to CWV retrieval, as the
atmospheric parameters calculated for the inversion of CWV for each pixel can be used to invert
Eq. 2.1 to obtain "s. The spectral channel positions after the smile characterisation for modes 1
and 5 is already considered in the resampling of the corresponding atmospheric parameters.
Those initial reflectance images are refined by the removal of the image blurring caused by
those photons reflected by the target environment and scattered by the atmosphere particles into
the sensor’s line-of-sight. This e!ect is called adjacency e!ect, because the apparent signal at the
TOA for a given pixel comes also from the adjacent ones. The simple formulation proposed by
Vermote et al. (1997) is followed here. It is based on the idea of weighting the strength of the
adjacency e!ect by the ratio of di!use to direct ground–to–sensor transmittance,
"$s = "s +td(µv)
e#!/µv
["s ! "], (2.3)
where "$s is the final surface reflectance, td(µv), e#!/µv the transmittances for di!use and direct
radiation in the ground-to-sensor path, and " is the average of the environment reflectance.
The final step in the atmospheric correction scheme for modes 1 and 5 is the removal of
systematic errors in surface reflectance. We refer to this step as “recalibration” or “spectral
polishing”. As systematic we consider the errors happening in surface reflectance with the same
intensity and sign for all the targets. Out of absorption regions these errors are mostly due to
problems in the instrument gain coe"cients (radiometric calibration), but inside atmospheric
absorptions they can also be associated to inaccurate radiative transfer simulations. The fact
that they are systematic enables the correlation with an error-free reference reflectance for the
correction. We assume that no errors are caused by dark current e!ects, but they are only due
to problems in the gain coe"cients.
The inversion of artificial endmembers is utilised again to provide the reference reflectance.
The procedure works calculating equivalent smooth spectra by the inversion of the abundances Cv,s
in Eq. 2.2 against “spiky” spectra. Up to 50 reference spectra are extracted from the reflectance
images derived using Eq. 2.1. The selection is made from a previous classification of the area
based on three Normalized Di!erence Vegetation Index (NDVI) categories: vegetation, bare soil
and mixtures. An equivalent smooth reflectance spectrum is calculated for each of the 50 reference
spectra by inversion of Cv,s. A recalibration coe"cient Ai for each channel is calculated then by
correlating the 50 pairs of spectral reflectance from the spiky and smooth spectra. The reflectance
image is finally multiplied by those coe"cients to generate the final reflectance hypercube. Small
Atmospheric Correction ATBD L. Guanter et al. 15
ESRIN/Contract No. 20442/07/I-LG Development of CHRIS/PROBA modules for the BEAM toolbox
(a) (b)
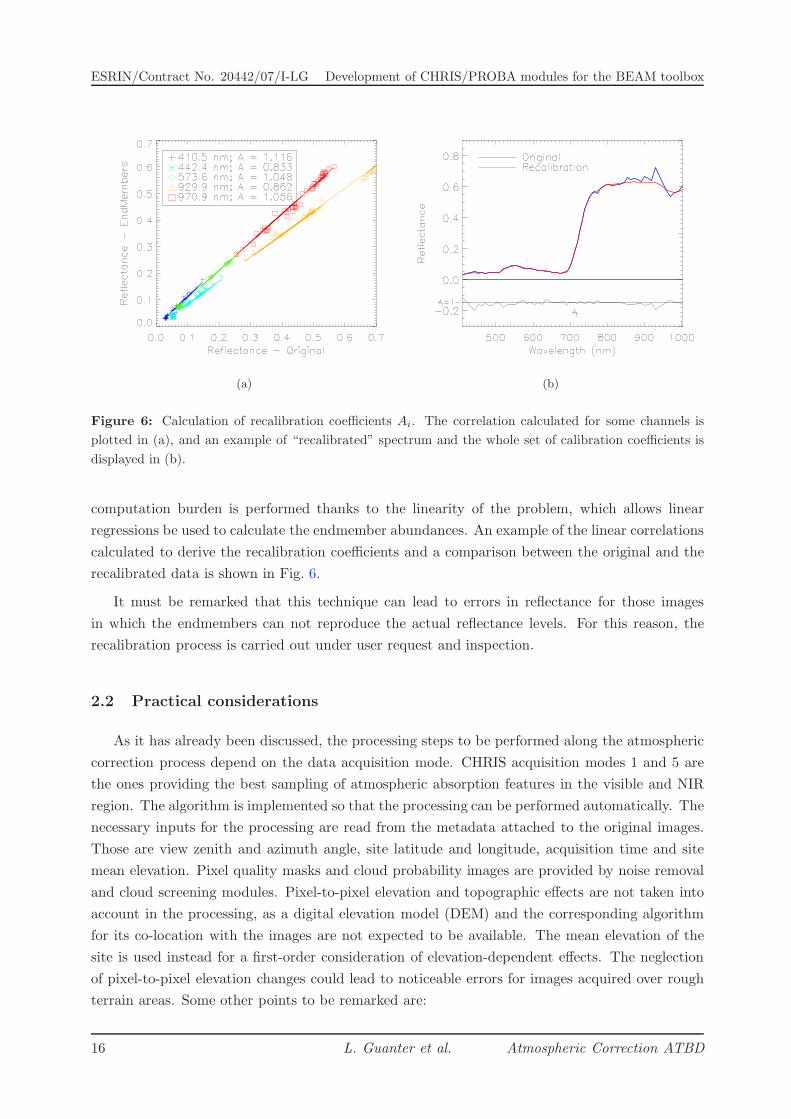
Figure 6: Calculation of recalibration coe"cients Ai. The correlation calculated for some channels is
plotted in (a), and an example of “recalibrated” spectrum and the whole set of calibration coe"cients is
displayed in (b).
computation burden is performed thanks to the linearity of the problem, which allows linear
regressions be used to calculate the endmember abundances. An example of the linear correlations
calculated to derive the recalibration coe"cients and a comparison between the original and the
recalibrated data is shown in Fig. 6.
It must be remarked that this technique can lead to errors in reflectance for those images
in which the endmembers can not reproduce the actual reflectance levels. For this reason, the
recalibration process is carried out under user request and inspection.
2.2 Practical considerations
As it has already been discussed, the processing steps to be performed along the atmospheric
correction process depend on the data acquisition mode. CHRIS acquisition modes 1 and 5 are
the ones providing the best sampling of atmospheric absorption features in the visible and NIR
region. The algorithm is implemented so that the processing can be performed automatically. The
necessary inputs for the processing are read from the metadata attached to the original images.
Those are view zenith and azimuth angle, site latitude and longitude, acquisition time and site
mean elevation. Pixel quality masks and cloud probability images are provided by noise removal
and cloud screening modules. Pixel-to-pixel elevation and topographic e!ects are not taken into
account in the processing, as a digital elevation model (DEM) and the corresponding algorithm
for its co-location with the images are not expected to be available. The mean elevation of the
site is used instead for a first-order consideration of elevation-dependent e!ects. The neglection
of pixel-to-pixel elevation changes could lead to noticeable errors for images acquired over rough
terrain areas. Some other points to be remarked are:
16 L. Guanter et al. Atmospheric Correction ATBD
Development of CHRIS/PROBA modules for the BEAM toolbox ESRIN/Contract No. 20442/07/I-LG
• The assessment of spectral calibration and spectral polishing are only carried out over data
acquired under modes 1 and 5.
• Band-fitting water vapor retrieval is performed on modes 1 and 5, while a retrieval algorithm
based on the inversion of two spectral channels at the left wing of the 940 nm water vapor
absorption feature is applied to mode 3 data. A climatology water vapor value is used for
the processing of the other modes. This value can be changed by the user.
• AOT retrieval is performed automatically for the 5 acquisition modes. AOT can also be de-
fined by the user if some a priori information from external data is available. An AOT value
calculated by the aerosol optical depth retrieval module (Grey and North, 2007) can also be
ingested by the algorithm. This would be recommended for arid or semi-arid environments,
where no dark vegetation is available.
• Reflectance images and atmospheric AOT and CWV calculated as by-products are provided
as outputs.
• The final step is the spectral polishing of the resulting reflectance data in modes 1 and
5. A comparison of initial and polished reflectance spectra is shown for 4 reference pixels
during the processing. In view of those results, the user must confirm the application of the
recalibration. This is the only interactive step along the processing.
According to the previous comments, there are some input parameters that can be changed
by the user:
• Cloud mask probability threshold: It is the probability threshold to be applied to the
probabilistic cloud mask for the discrimination between cloud-free and cloud-contaminated
pixels. The default value is 0.05.
• Aerosol Optical Thickness, 550 nm: AOT at 550 nm which overrides the automatically-
calculated value. It is recommended when ground-based aerosol measurements are available,
or in arid or semi-arid regions where the AOT retrieval method is expected to fail. The
aerosol optical depth retrieval module (Grey and North, 2007) can be used for the calcula-
tion of AOT in those cases.
• Columnar Water Vapor Value: Only in modes 2 and 4, water vapor value to be used for
the processing of the complete image. A default season-dependent climatology value is used
instead if this parameter is not provided.
• Perform spectral polishing: Only in modes 1 and 5, flag activating the final reflectance
spectral polishing. The results from the polishing for 4 reference targets are displayed in
the screen for user confirmation.
• Perform derivation of water vapor map: Only in modes 1, 3 and 5, flag activating
the per-pixel water vapor retrieval procedure. By default, water vapor retrieval is only
Atmospheric Correction ATBD L. Guanter et al. 17
ESRIN/Contract No. 20442/07/I-LG Development of CHRIS/PROBA modules for the BEAM toolbox
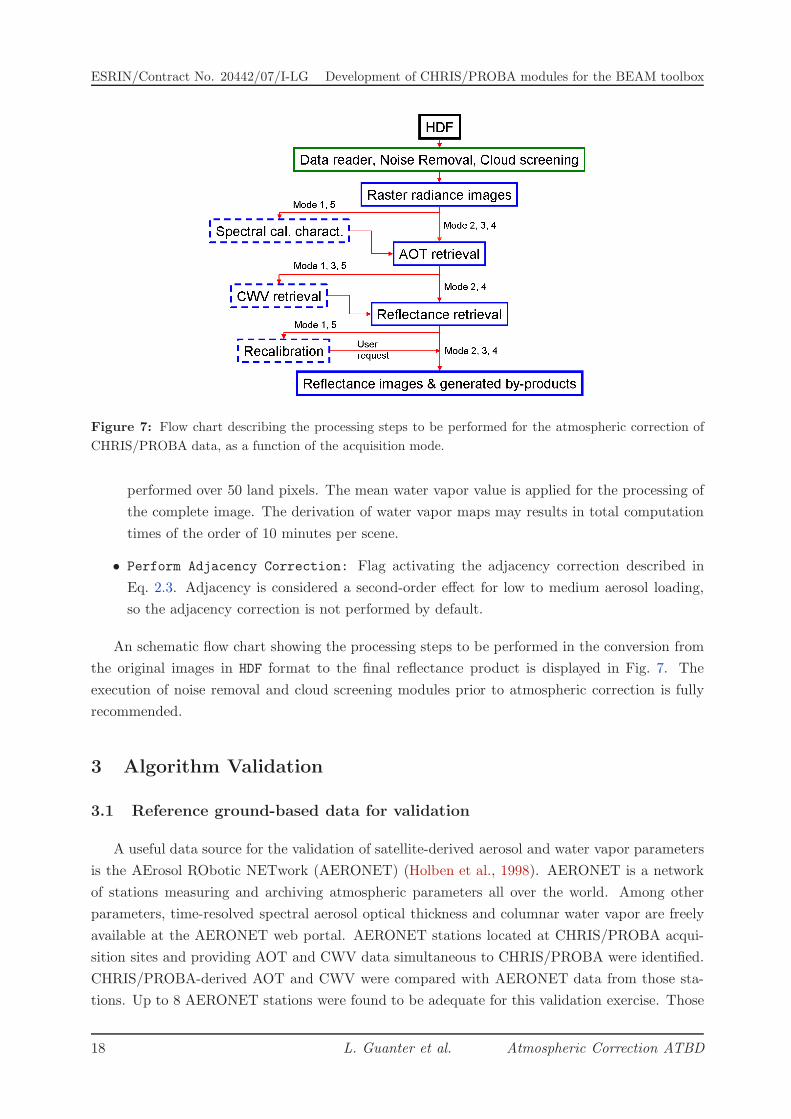
Figure 7: Flow chart describing the processing steps to be performed for the atmospheric correction of
CHRIS/PROBA data, as a function of the acquisition mode.
performed over 50 land pixels. The mean water vapor value is applied for the processing of
the complete image. The derivation of water vapor maps may results in total computation
times of the order of 10 minutes per scene.
• Perform Adjacency Correction: Flag activating the adjacency correction described in
Eq. 2.3. Adjacency is considered a second-order e!ect for low to medium aerosol loading,
so the adjacency correction is not performed by default.
An schematic flow chart showing the processing steps to be performed in the conversion from
the original images in HDF format to the final reflectance product is displayed in Fig. 7. The
execution of noise removal and cloud screening modules prior to atmospheric correction is fully
recommended.
3 Algorithm Validation
3.1 Reference ground-based data for validation
A useful data source for the validation of satellite-derived aerosol and water vapor parameters
is the AErosol RObotic NETwork (AERONET) (Holben et al., 1998). AERONET is a network
of stations measuring and archiving atmospheric parameters all over the world. Among other
parameters, time-resolved spectral aerosol optical thickness and columnar water vapor are freely
available at the AERONET web portal. AERONET stations located at CHRIS/PROBA acqui-
sition sites and providing AOT and CWV data simultaneous to CHRIS/PROBA were identified.
CHRIS/PROBA-derived AOT and CWV were compared with AERONET data from those sta-
tions. Up to 8 AERONET stations were found to be adequate for this validation exercise. Those
18 L. Guanter et al. Atmospheric Correction ATBD
Development of CHRIS/PROBA modules for the BEAM toolbox ESRIN/Contract No. 20442/07/I-LG
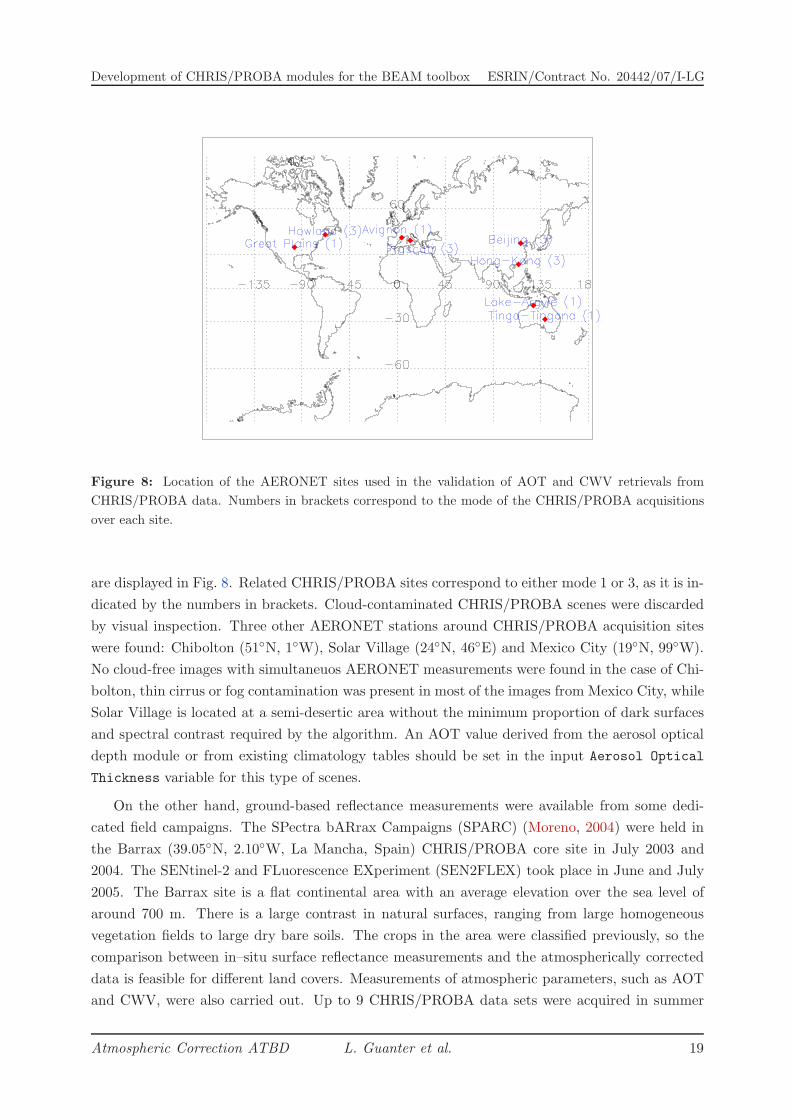
Figure 8: Location of the AERONET sites used in the validation of AOT and CWV retrievals from
CHRIS/PROBA data. Numbers in brackets correspond to the mode of the CHRIS/PROBA acquisitions
over each site.
are displayed in Fig. 8. Related CHRIS/PROBA sites correspond to either mode 1 or 3, as it is in-
dicated by the numbers in brackets. Cloud-contaminated CHRIS/PROBA scenes were discarded
by visual inspection. Three other AERONET stations around CHRIS/PROBA acquisition sites
were found: Chibolton (51!N, 1!W), Solar Village (24!N, 46!E) and Mexico City (19!N, 99!W).
No cloud-free images with simultaneuos AERONET measurements were found in the case of Chi-
bolton, thin cirrus or fog contamination was present in most of the images from Mexico City, while
Solar Village is located at a semi-desertic area without the minimum proportion of dark surfaces
and spectral contrast required by the algorithm. An AOT value derived from the aerosol optical
depth module or from existing climatology tables should be set in the input Aerosol Optical
Thickness variable for this type of scenes.
On the other hand, ground-based reflectance measurements were available from some dedi-
cated field campaigns. The SPectra bARrax Campaigns (SPARC) (Moreno, 2004) were held in
the Barrax (39.05!N, 2.10!W, La Mancha, Spain) CHRIS/PROBA core site in July 2003 and
2004. The SENtinel-2 and FLuorescence EXperiment (SEN2FLEX) took place in June and July
2005. The Barrax site is a flat continental area with an average elevation over the sea level of
around 700 m. There is a large contrast in natural surfaces, ranging from large homogeneous
vegetation fields to large dry bare soils. The crops in the area were classified previously, so the
comparison between in–situ surface reflectance measurements and the atmospherically corrected
data is feasible for di!erent land covers. Measurements of atmospheric parameters, such as AOT
and CWV, were also carried out. Up to 9 CHRIS/PROBA data sets were acquired in summer
Atmospheric Correction ATBD L. Guanter et al. 19
ESRIN/Contract No. 20442/07/I-LG Development of CHRIS/PROBA modules for the BEAM toolbox
0.0 0.2 0.4 0.6 0.8AOT550 - AERONET
0.0
0.2
0.4
0.6
0.8
AOT5
50 -
CHRI
S/PR
OBA
(a)
0 1 2 3 4CWV - AERONET (gcm-2)
0
1
2
3
4
CWV
- CHR
IS/P
ROBA
(gcm
-2)
(b)
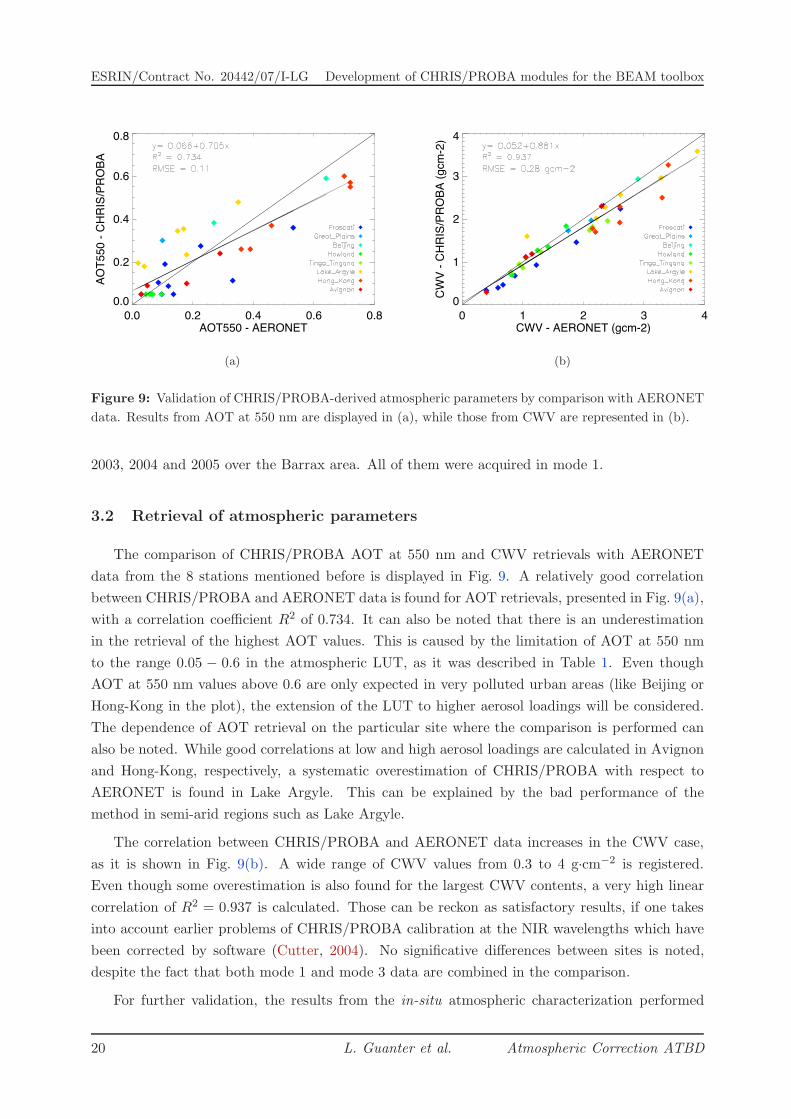
Figure 9: Validation of CHRIS/PROBA-derived atmospheric parameters by comparison with AERONET
data. Results from AOT at 550 nm are displayed in (a), while those from CWV are represented in (b).
2003, 2004 and 2005 over the Barrax area. All of them were acquired in mode 1.
3.2 Retrieval of atmospheric parameters
The comparison of CHRIS/PROBA AOT at 550 nm and CWV retrievals with AERONET
data from the 8 stations mentioned before is displayed in Fig. 9. A relatively good correlation
between CHRIS/PROBA and AERONET data is found for AOT retrievals, presented in Fig. 9(a),
with a correlation coe"cient R2 of 0.734. It can also be noted that there is an underestimation
in the retrieval of the highest AOT values. This is caused by the limitation of AOT at 550 nm
to the range 0.05 ! 0.6 in the atmospheric LUT, as it was described in Table 1. Even though
AOT at 550 nm values above 0.6 are only expected in very polluted urban areas (like Beijing or
Hong-Kong in the plot), the extension of the LUT to higher aerosol loadings will be considered.
The dependence of AOT retrieval on the particular site where the comparison is performed can
also be noted. While good correlations at low and high aerosol loadings are calculated in Avignon
and Hong-Kong, respectively, a systematic overestimation of CHRIS/PROBA with respect to
AERONET is found in Lake Argyle. This can be explained by the bad performance of the
method in semi-arid regions such as Lake Argyle.
The correlation between CHRIS/PROBA and AERONET data increases in the CWV case,
as it is shown in Fig. 9(b). A wide range of CWV values from 0.3 to 4 g·cm#2 is registered.
Even though some overestimation is also found for the largest CWV contents, a very high linear
correlation of R2 = 0.937 is calculated. Those can be reckon as satisfactory results, if one takes
into account earlier problems of CHRIS/PROBA calibration at the NIR wavelengths which have
been corrected by software (Cutter, 2004). No significative di!erences between sites is noted,
despite the fact that both mode 1 and mode 3 data are combined in the comparison.
For further validation, the results from the in-situ atmospheric characterization performed
20 L. Guanter et al. Atmospheric Correction ATBD

Development of CHRIS/PROBA modules for the BEAM toolbox ESRIN/Contract No. 20442/07/I-LG
during the SPARC 2003 and 2004 campaigns (Martınez-Lozano et al., 2007) have been compared
to CHRIS/PROBA results. The same exercise was already carried out with an older version of
the algorithm (Guanter et al., 2005). Apart from a positive bias about 0.2 g·cm#2, the good
performance of CWV retrievals from CHRIS/PROBA data observed in the comparison with
AERONET was confirmed for the 4 SPARC acquisition dates ({1.31, 1.62, 2.02, 2.13} g·cm#2
from ground measurements, {1.58, 1.94, 1.83, 2.31} g·cm#2 from CHRIS/PROBA). However, a
worst correlation in AOT at 550 nm was found ({0.20, 0.28, 0.15, 0.24} from ground measurements,
{0.31, 0.19, 0.42, 0.26} from CHRIS/PROBA) with respect to the old version of the algorithm. No
solid explanation to this fact can be given, as the new models are based on a longer experience
with CHRIS/PROBA data and other sensors, what led to more sophisticated approaches, and
MODTRAN-based radiative transfer calculations have substituted the simpler 6S approach. It is
expected that future tests at the same Barrax area can provide more information to be used for
further algorithm improvement.
3.3 Retrieval of surface reflectance
3.3.1 Results from land targets
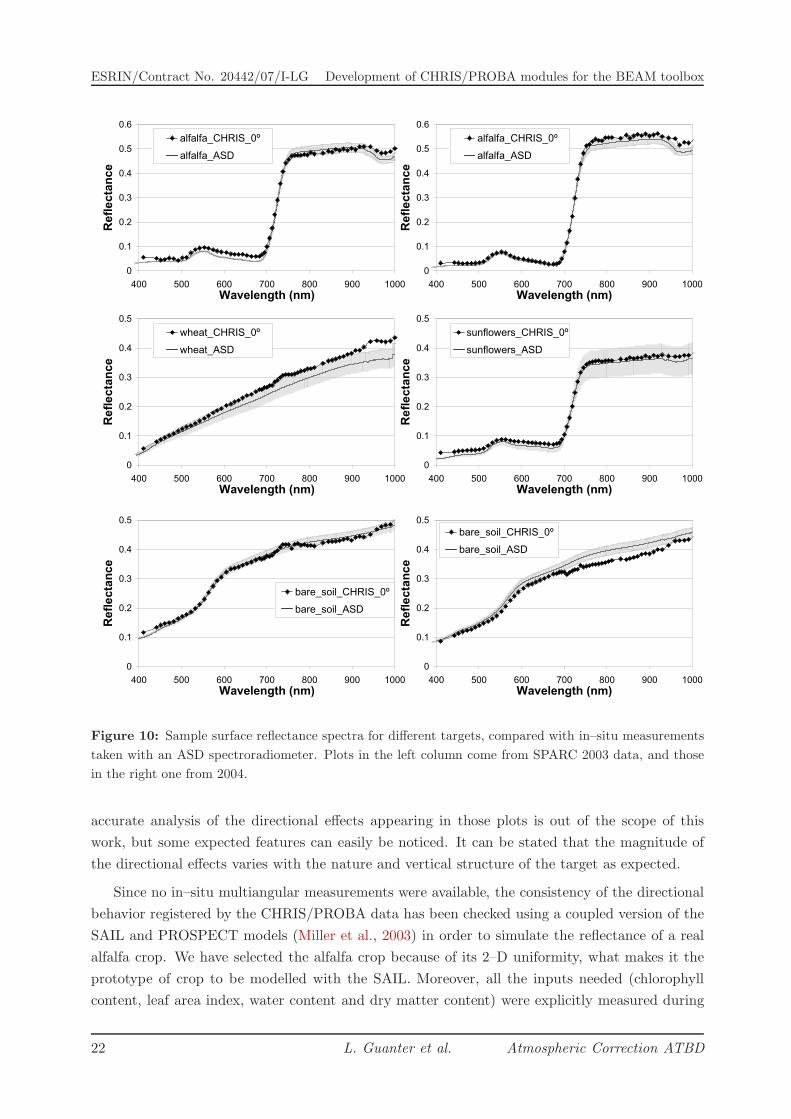
CHRIS/PROBA-derived surface reflectance is compared to ground-based measurements in
Fig. 10. In–situ reflectance measurements were taken with an Analytical Spectral Devices (ASD)
FieldSpec Pro FR Spectroradiometer (footprint around 0.8 m, 2 nm of spectral resolution). These
measurements were acquired almost simultaneously to PROBA overpasses (time di!erences were
always smaller than 30 minutes) from a nadir view while walking across the target, integrating
in one spectrum all the measurements taken for every path of around 10 m. The reason for this
procedure is to ensure that most of the natural variability in the target could be reproduced. The
grey stripe in the plot gives the mean value and the standard deviation calculated from all the
acquisitions made for the same target, in order to provide information on the spatial variability
of the target.
The agreement between in-situ and CHRIS/PROBA data is relatively good, both in the shape
and in the reflectance levels. It must be taken into account that the field spectra were acquired
from a nadir view, not coincident with any of the PROBA view angles, so small deviations due to
angular trends are expected a priori. This is confirmed by the fact that the maximum agreement
with the in–situ measurements is found for the minimum view zenith angle angle. It can be stated
that the comparison is especially good in the case of alfalfa and sunflowers targets. Large natural
variations were found in the case of the sunflower crop, which consisted of plant rows separated by
bare soil. The agreement reinforces the integrating procedure used in the ground measurements.
For bare soils the directional e!ects are more important, what makes larger deviations are found
in some targets. Finally, the bad comparison with the dry wheat crop might be explained by the
practical di"culties in the measurement process, arisen because of the density and height of the
plants.
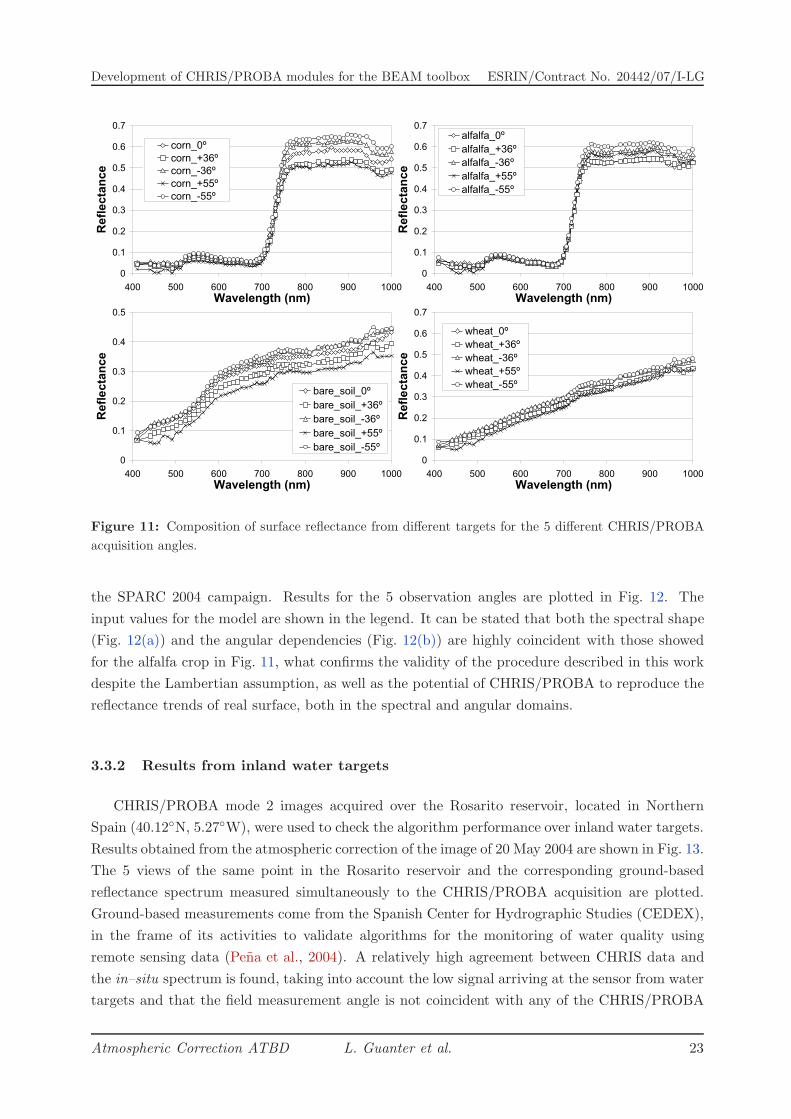
Surface reflectance from the 5 view angles in 4 di!erent targets are plotted in Fig. 11. An
Atmospheric Correction ATBD L. Guanter et al. 21
ESRIN/Contract No. 20442/07/I-LG Development of CHRIS/PROBA modules for the BEAM toolbox
0
0.1
0.2
0.3
0.4
0.5
0.6
400 500 600 700 800 900 1000
Wavelength (nm)
Re
fle
cta
nc
e
alfalfa_CHRIS_0º
alfalfa_ASD
0
0.1
0.2
0.3
0.4
0.5
400 500 600 700 800 900 1000
Wavelength (nm)
Re
fle
cta
nc
e
wheat_CHRIS_0º
wheat_ASD
0
0.1
0.2
0.3
0.4
0.5
400 500 600 700 800 900 1000
Wavelength (nm)
Re
fle
cta
nc
e
bare_soil_CHRIS_0º
bare_soil_ASD
0
0.1
0.2
0.3
0.4
0.5
0.6
400 500 600 700 800 900 1000
Wavelength (nm)
Re
fle
cta
nc
e
alfalfa_CHRIS_0º
alfalfa_ASD
0
0.1
0.2
0.3
0.4
0.5
400 500 600 700 800 900 1000
Wavelength (nm)
Re
fle
cta
nc
e
sunflowers_CHRIS_0º
sunflowers_ASD
0
0.1
0.2
0.3
0.4
0.5
400 500 600 700 800 900 1000
Wavelength (nm)
Re
fle
cta
nc
e
bare_soil_CHRIS_0º
bare_soil_ASD
Figure 10: Sample surface reflectance spectra for di!erent targets, compared with in–situ measurements
taken with an ASD spectroradiometer. Plots in the left column come from SPARC 2003 data, and those
in the right one from 2004.
accurate analysis of the directional e!ects appearing in those plots is out of the scope of this
work, but some expected features can easily be noticed. It can be stated that the magnitude of
the directional e!ects varies with the nature and vertical structure of the target as expected.
Since no in–situ multiangular measurements were available, the consistency of the directional
behavior registered by the CHRIS/PROBA data has been checked using a coupled version of the
SAIL and PROSPECT models (Miller et al., 2003) in order to simulate the reflectance of a real
alfalfa crop. We have selected the alfalfa crop because of its 2–D uniformity, what makes it the
prototype of crop to be modelled with the SAIL. Moreover, all the inputs needed (chlorophyll
content, leaf area index, water content and dry matter content) were explicitly measured during
22 L. Guanter et al. Atmospheric Correction ATBD
Development of CHRIS/PROBA modules for the BEAM toolbox ESRIN/Contract No. 20442/07/I-LG
0
0.1
0.2
0.3
0.4
0.5
0.6
0.7
400 500 600 700 800 900 1000
Wavelength (nm)
Re
fle
cta
nc
e
corn_0ºcorn_+36ºcorn_-36ºcorn_+55ºcorn_-55º
0
0.1
0.2
0.3
0.4
0.5
0.6
0.7
400 500 600 700 800 900 1000
Wavelength (nm)
Re
fle
cta
nc
e
wheat_0º
wheat_+36º
wheat_-36º
wheat_+55º
wheat_-55º
0
0.1
0.2
0.3
0.4
0.5
400 500 600 700 800 900 1000
Wavelength (nm)
Re
fle
cta
nc
e
bare_soil_0º
bare_soil_+36º
bare_soil_-36º
bare_soil_+55º
bare_soil_-55º
0
0.1
0.2
0.3
0.4
0.5
0.6
0.7
400 500 600 700 800 900 1000
Wavelength (nm)
Re
fle
cta
nc
e
alfalfa_0º
alfalfa_+36º
alfalfa_-36º
alfalfa_+55º
alfalfa_-55º
Figure 11: Composition of surface reflectance from di!erent targets for the 5 di!erent CHRIS/PROBA
acquisition angles.
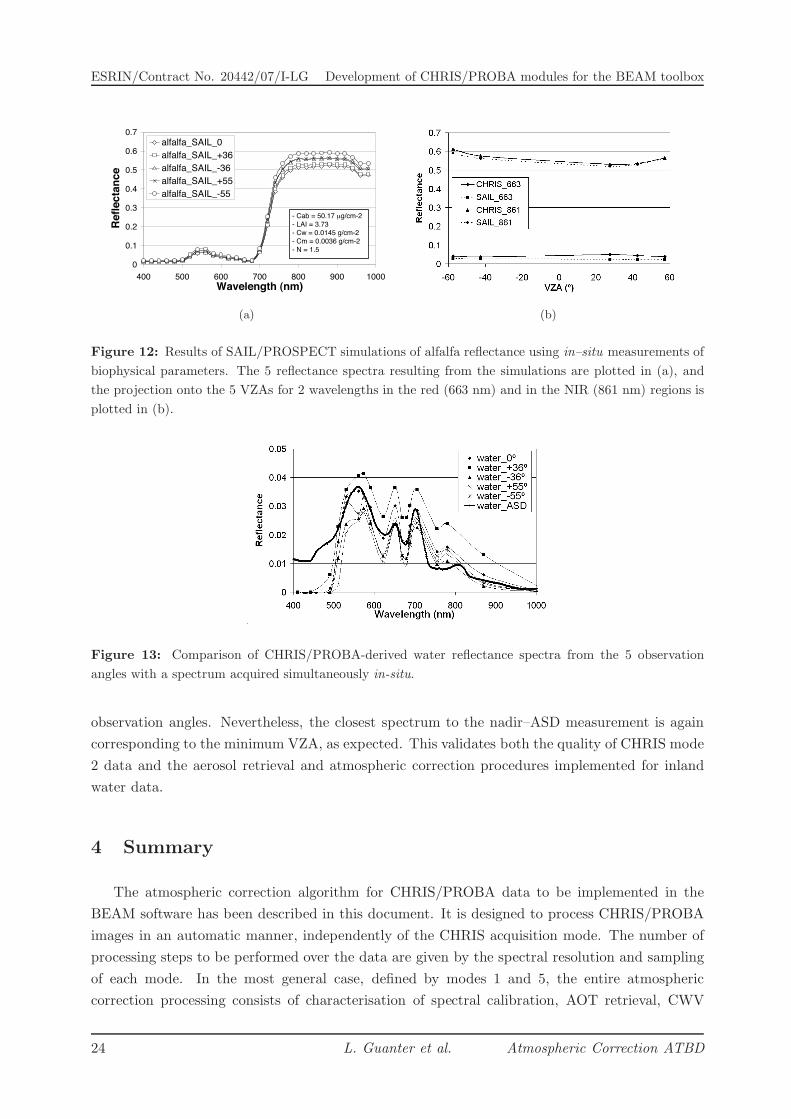
the SPARC 2004 campaign. Results for the 5 observation angles are plotted in Fig. 12. The
input values for the model are shown in the legend. It can be stated that both the spectral shape
(Fig. 12(a)) and the angular dependencies (Fig. 12(b)) are highly coincident with those showed
for the alfalfa crop in Fig. 11, what confirms the validity of the procedure described in this work
despite the Lambertian assumption, as well as the potential of CHRIS/PROBA to reproduce the
reflectance trends of real surface, both in the spectral and angular domains.
3.3.2 Results from inland water targets
CHRIS/PROBA mode 2 images acquired over the Rosarito reservoir, located in Northern
Spain (40.12!N, 5.27!W), were used to check the algorithm performance over inland water targets.
Results obtained from the atmospheric correction of the image of 20 May 2004 are shown in Fig. 13.
The 5 views of the same point in the Rosarito reservoir and the corresponding ground-based
reflectance spectrum measured simultaneously to the CHRIS/PROBA acquisition are plotted.
Ground-based measurements come from the Spanish Center for Hydrographic Studies (CEDEX),
in the frame of its activities to validate algorithms for the monitoring of water quality using
remote sensing data (Pena et al., 2004). A relatively high agreement between CHRIS data and
the in–situ spectrum is found, taking into account the low signal arriving at the sensor from water
targets and that the field measurement angle is not coincident with any of the CHRIS/PROBA
Atmospheric Correction ATBD L. Guanter et al. 23
ESRIN/Contract No. 20442/07/I-LG Development of CHRIS/PROBA modules for the BEAM toolbox
0
0.1
0.2
0.3
0.4
0.5
0.6
0.7
400 500 600 700 800 900 1000Wavelength (nm)
Refle
ctan
ce
alfalfa_SAIL_0alfalfa_SAIL_+36alfalfa_SAIL_-36alfalfa_SAIL_+55alfalfa_SAIL_-55
- Cab = 50.17 µg/cm-2- LAI = 3.73- Cw = 0.0145 g/cm-2- Cm = 0.0036 g/cm-2- N = 1.5
(a) (b)
Figure 12: Results of SAIL/PROSPECT simulations of alfalfa reflectance using in–situ measurements of
biophysical parameters. The 5 reflectance spectra resulting from the simulations are plotted in (a), and
the projection onto the 5 VZAs for 2 wavelengths in the red (663 nm) and in the NIR (861 nm) regions is
plotted in (b).
Figure 13: Comparison of CHRIS/PROBA-derived water reflectance spectra from the 5 observation
angles with a spectrum acquired simultaneously in-situ.
observation angles. Nevertheless, the closest spectrum to the nadir–ASD measurement is again
corresponding to the minimum VZA, as expected. This validates both the quality of CHRIS mode
2 data and the aerosol retrieval and atmospheric correction procedures implemented for inland
water data.
4 Summary
The atmospheric correction algorithm for CHRIS/PROBA data to be implemented in the
BEAM software has been described in this document. It is designed to process CHRIS/PROBA
images in an automatic manner, independently of the CHRIS acquisition mode. The number of
processing steps to be performed over the data are given by the spectral resolution and sampling
of each mode. In the most general case, defined by modes 1 and 5, the entire atmospheric
correction processing consists of characterisation of spectral calibration, AOT retrieval, CWV
24 L. Guanter et al. Atmospheric Correction ATBD
Development of CHRIS/PROBA modules for the BEAM toolbox ESRIN/Contract No. 20442/07/I-LG
retrieval, reflectance retrieval and data recalibration. Calibration assessment and CWV retrieval
are not performed over modes 2, and 4 due to the insu"cient sampling of atmospheric absorption
features. This atmospheric correction module must follow noise reduction and cloud screening
modules in the complete CHRIS/PROBA processing chain, even though cloud screening could be
skipped when no cloud is observed in the image.
A general description of each processing step is provided in the first part of this docu-
ment. Results from the application of previous versions of the algorithm to data acquired by
the AERONET network or during specific validation campaigns are presented in the second part.
Comparison with direct atmospheric measurements, ground-based reflectance measurements and
modeled BRDF data show consistent results. Further validation through the processing of se-
lected CHRIS/PROBA data representing the 5 acquisition modes and di!erent environments and
conditions is foreseen.
Acknowledgement
This work has been done in the frame of the project Development of CHRIS/PROBA mod-
ules for the BEAM toolbox (ESA ESRIN Contract No. 20442/07/I-LG). Previous algorithm
developments were funded by the ESA–SPARC Project (ESA ESTEC–18307/04/NL/FF), the
ESA–SEN2FLEX project (ESA ESRIN–19187/05/I-EC) and the DATASAT project (ESP2005-
07724-C05-01, Ministry of Education and Science). The first author (LG) acknowledges the
support by a PhD grant from the Spanish Government, Ministry of Education and Science. The
authors also want to thank M. Cutter from Surrey Satellite Technology Ltd for his assistance
with CHRIS technical issues, to R. Pena, J. A. Domınguez and A. Verdu from CEDEX for the
provision with inland waters data, and to T. Schmidt, from CIEMAT, for Tablas de Daimiel data.
The authors also want to thank the NASA and the Personal Investigators of all the AERONET
stations providing data for this work.
Bibliography
Barnsley, M. J., Settle, J. J., Cutter, M., Lobb, D., and Teston, F. (2004). The PROBA/CHRIS
mission: a low-cost smallsat for hyperspectral, multi-angle, observations of the earth surface
and atmosphere. IEEE Transactions on Geoscience and Remote Sensing, 42:1512–1520.
Berk, A., Anderson, G. P., Acharya, P. K., Hoke, M. L., Chetwynd, J. H., Bernstein, L. S., Shettle,
E. P., Matthew, M. W., and Adler-Golden, S. M. (2003). MODTRAN4 Version 3 Revision 1
User’s Manual. Technical report, Air Force Research Laboratory, Hanscom Air Force Base,
MA, USA.
Cutter, M. (2004). Review of aspects associated with the CHRIS calibration. In ESA/ESRIN,
editor, Proceedings of 2nd CHRIS/PROBA Workshop, Frascati, Italy.
Atmospheric Correction ATBD L. Guanter et al. 25
ESRIN/Contract No. 20442/07/I-LG Development of CHRIS/PROBA modules for the BEAM toolbox
Fomferra, N. and Brockmann, C. (2005). BEAM - the ENVISAT MERIS and AATSR Toolbox.
In ESA/ESRIN, editor, Proceedings of the MERIS-(A)ATSR workshop, Frascati, Italy.
Gomez-Chova, L., Alonso, L., Guanter, L., Calpe, J., and Moreno, J. (2008a). Algorithm Theoreti-
cal Basis Document for CHRIS/PROBA noise reduction. ESA ESRIN Contract No. 20442/07/I-
LG.
Gomez-Chova, L., Guanter, L., Alonso, L., Calpe, J., and Moreno, J. (2008b). Algorithm Theoreti-
cal Basis Document for CHRIS/PROBA cloud screening. ESA ESRIN Contract No. 20442/07/I-
LG.
Green, R. (1998). Spectral calibration requirement for earth–looking imaging spectrometers in
the solar–reflected spectrum. Applied Optics, 37:683–690.
Grey, W. M. F. and North, P. R. J. (2007). PROBA/CHRIS Aerosol Optical Depth Retrieval
Algorithm Theoretical Basis Document. ESA ESRIN Contract No. 20442/07/I-LG.
Guanter, L., Alonso, L., and Moreno, J. (2005). A method for the surface reflectance retrieval from
PROBA/CHRIS data over land: Application to ESA SPARC campaigns. IEEE Transactions
on Geoscience and Remote Sensing, 43:2908–2917.
Guanter, L., Richter, R., and Kaufmann, H. (2008). On the application of the MODTRAN4
atmospheric radiative transfer code to optical remote sensing. International Journal of Remote
Sensing. In press.
Guanter, L., Richter, R., and Moreno, J. (2006). Spectral calibration of hyperspectral imagery
using atmospheric absorption features. Applied Optics, 45:2360–2370.
Holben, B. N., Eck, T. F., Slutsker, I., Tanre, D., Buis, J. P., Setzer, A., Vermote, E., Rea-
gan, J. A., Kaufman, Y., Nakajima, T., Lavenu, F., Jankowiak, I., and Smirnov, A. (1998).
AERONET – a federated instrument network and data archive for aerosol characterization.
Remote Sensing of Environment, 66:1–16.
Martınez-Lozano, J. A., Estelles, V., Molero, F., Gomez-Amo, J. L., Utrillas, M. P., Pujadas, M.,
Fortea, J. C., and Guanter, L. (2007). Atmospheric components determination from ground-
level measurements during the Spectra Barax Campaigns (SPARC) field campaigns. IEEE
Transactions on Geoscience and Remote Sensing, 45:2778–2793.
Miller, J. R., Berger, M., Alonso, L., Cerovic, Z., Goulas, Y., Jacquemoud, S., Louis, J., Mo-
hammed, G., Moya, I., Pedros, R., Moreno, J. F., Verhoef, W., and Zarco-Tejada, P. J. (2003).
Progress on the development of an integrated canopy fluorescence model. In Proceedings of
IGARSS, Toulouse (France).
Moreno, J. (2004). The SPECTRA Barrax Campaign (SPARC): Overview and first results from
CHRIS data. In ESA/ESRIN, editor, Proceedings of 2nd CHRIS/PROBA Workshop, Frascati,
Italy.
26 L. Guanter et al. Atmospheric Correction ATBD
Development of CHRIS/PROBA modules for the BEAM toolbox ESRIN/Contract No. 20442/07/I-LG
Mouroulis, P., Green, R. O., and Chrien, T. G. (2000). Design of pushbroom imaging spectrom-
eters for optimum recovery of spectroscopic and spatial information. Applied Optics, 39:2210–
2220.
Nicodemus, F. E., Richmond, J. C., Hsia, J. J., Ginsberg, I. W., and Limperis, T. (1977). Geo-
metrical considerations and nomenclature for reflectance. Technical report, National Bureau of
Standards, US Department of Commerce, Washington, DC, USA.
Pena, R., Ruiz, A., and Domınguez, J. A. (2004). CEDEX proposal for CHRIS/PROBA activities
in 2004 on validation of MERIS models. In Proceedings of CHRIS/Proba Workshop, ESA–
ESRIN, Frascati (Italy).
Press, W. H., Flannery, B. P., Teukolosky, S. A., and Vetterling, W. T. (1986). Numerical Recipes.
Cambridge University Press.
Qu, Z., Kindel, B. C., and Goetz, A. F. H. (2003). The High Accuracy Atmospheric Correction for
Hyperspectral Data (HATCH) Model. IEEE Transactions on Geoscience and Remote Sensing,
41:1223–1231.
Vermote, E. F., El-Saleous, N., Justice, C. O., Kaufman, Y. J., Privette, J. L., Remer, L.,
Roger, J. C., and Tanre, D. (1997). Atmospheric correction of visible to middle infrared EOS-
MODIS data over land surface: Background, operational algorithm and validation. Journal of
Geophysical Research, 102:17131–17141.
von Hoyningen-Huene, W., Freitag, M., and Burrows, J. P. (2003). Retrieval of aerosol optical
thickness over land surfaces from top-of-atmosphere radiance. Journal of Geophysical Research,
108:4260–4279.
Atmospheric Correction ATBD L. Guanter et al. 27