choosing the right projects - information technology ... the ri… · choosing the right projects...
TRANSCRIPT
Choosing the right projects
- A Lean-inspired process for IT project portfolio selection. Stina Sandberg Hannes Ullman
Choosing the right projects
Copyright © Sandberg, Stina; Ullman, Hannes Department of Industrial Management and Logistics Lund Institute of Technology, Lund University Box 118 SE-22100 Lund Sweden Department of Business Administration Lund School of Economics and Management, Lund University Box 7080 SE-22007 Lund Sweden Master Thesis Technology Management - Nr 217/2011 ISSN 1651-0100 ISRN LUTVDG/TVTM-- 11/5217--/SE E-husets tryckeri, Lund 2011 Printed in Sweden
Choosing the right projects
I
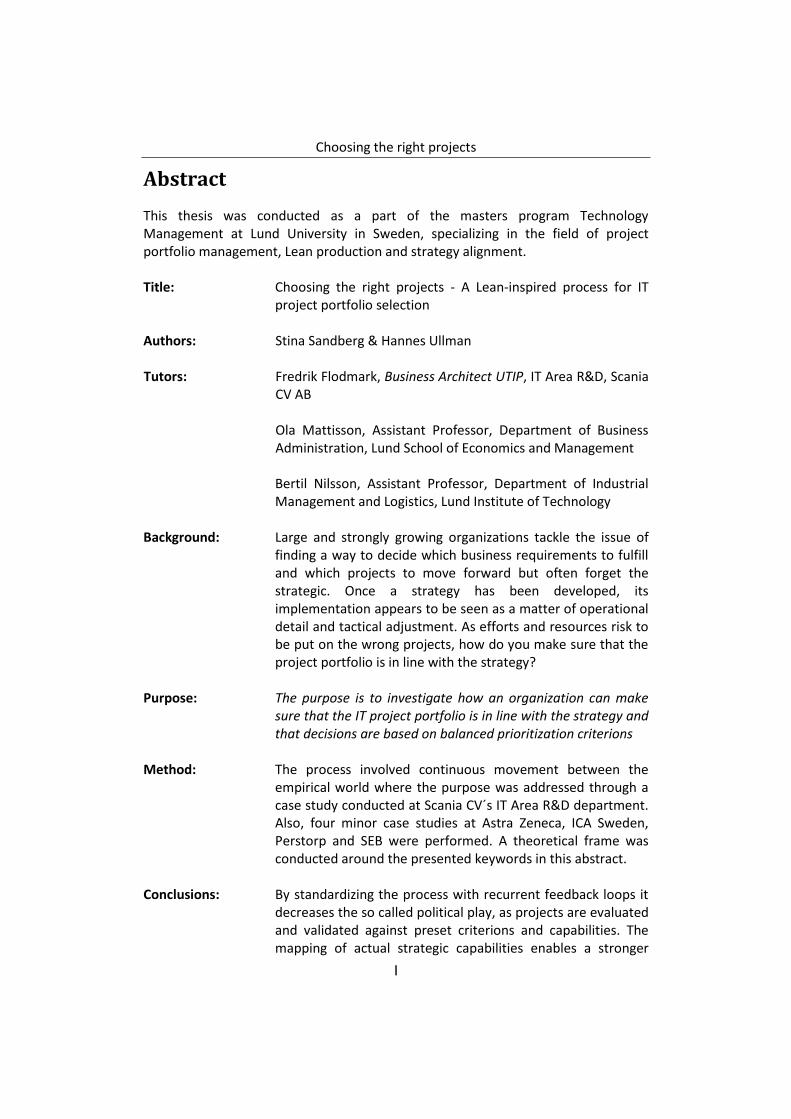
Abstract
This thesis was conducted as a part of the masters program Technology Management at Lund University in Sweden, specializing in the field of project portfolio management, Lean production and strategy alignment. Title: Choosing the right projects - A Lean-inspired process for IT
project portfolio selection Authors: Stina Sandberg & Hannes Ullman Tutors: Fredrik Flodmark, Business Architect UTIP, IT Area R&D, Scania
CV AB Ola Mattisson, Assistant Professor, Department of Business
Administration, Lund School of Economics and Management
Bertil Nilsson, Assistant Professor, Department of Industrial Management and Logistics, Lund Institute of Technology
Background: Large and strongly growing organizations tackle the issue of
finding a way to decide which business requirements to fulfill and which projects to move forward but often forget the strategic. Once a strategy has been developed, its implementation appears to be seen as a matter of operational detail and tactical adjustment. As efforts and resources risk to be put on the wrong projects, how do you make sure that the project portfolio is in line with the strategy?
Purpose: The purpose is to investigate how an organization can make
sure that the IT project portfolio is in line with the strategy and that decisions are based on balanced prioritization criterions
Method: The process involved continuous movement between the
empirical world where the purpose was addressed through a case study conducted at Scania CV´s IT Area R&D department. Also, four minor case studies at Astra Zeneca, ICA Sweden, Perstorp and SEB were performed. A theoretical frame was conducted around the presented keywords in this abstract.
Conclusions: By standardizing the process with recurrent feedback loops it
decreases the so called political play, as projects are evaluated and validated against preset criterions and capabilities. The mapping of actual strategic capabilities enables a stronger
Choosing the right projects
II
strategic fit and decreases the risk of allocating resources into the wrong projects.
Key words: Strategy implementation, PPM, Project Portfolio selection,
Lean production, PMO.
Choosing the right projects
III
Acknowledgements
First and foremost, we would like to thank all employees at the UTI division of the IT Area R&D and especially the UTIP group at Scania CV in Södertälje, Sweden. Your support and experience have guided us through the process of completing this master thesis project. It has been a great and valuable opportunity for us to come and take part of the daily work at your department and we are grateful for your generosity and acceptance. The results from this thesis have required many hours of work including several interviews and meetings with different members of your staff. We thank you all for sharing your knowledge and giving us access to the data. To all the organizations we visited when conducting the minor cases study, we would like to thank for the openness during the interviews and the engagement in our work. We would especially like to emphasize the support and guidance from our tutors, Fredrik Flodmark and Michael Thel. Without your expertise and contribution this master thesis would not have been possible. At times, you have challenged us and made us bring the conclusions further. We appreciate this and believe it has guided us in the right direction. We would also like to thank Jimmy Thiel. Our discussions and your input and engagement in our thesis work has been invaluable, and made us explore new possibilities for the solution of this thesis. To our tutors at Lund University, Ola Mattisson and Bertil Nilsson, we would like to express our gratitude for your guidance and support throughout the process. You have motivated us to bring the thesis to a higher academic level, and made us realize the benefits of combining the empirical and the theoretical world. We would also like to thank our opponents, Caroline Nyquist and Malin Eklund. Your inputs and comments have inspired us to clarify and highlight some concepts. Finally, we would like to thank each other for a great cooperation. Throughout the process of conducting the thesis we have challenged and motivated each other. This has made us think outside the box and inspired us during long nights of writing. Södertälje, 2011-05-10 Stina Sandberg & Hannes Ullman
Choosing the right projects
IV
Glossary
Activity A task that needs to be accomplished within a defined period of time. Refers to the process of dividing a project into different individual tasks which must be done before the deliverables can be considered completed.(McIlree, 2007)
Benefit A measurable improvement. An advantage on a behalf of a particular stakeholder or group of stakeholders. (Ward & Daniel, 2006)
Business Case A well-structured written document that captures the reasoning for initiating a project or task.(Hut, 2009)
Business Requirement A single documented need of what a certain product or service should be or perform. Sets of requirements are used as inputs into the design stages of the development process.(Stellman & Greene, 2005)
Capability A strategically important area of resources, techniques and skills to deliver a competitive advantage.(Flodmark, 2011)
Need Compare to Business Requirement. Paradigms The set of beliefs and assumptions commonly viewed
and taken for granted in an organization.(Pellegrinelli & Bowman, 1994)
Political influence Using the potential influence on others to achieve the desired outcome for oneself.
Process “A unique process, consisting of a set of coordinated and controlled activities with start and finish dates, undertaken to achieve an objective conforming to specific requirements, including the constraints of time, cost and resources”. (SS-ISO 10006:1997)
Project “A complex effort, usually less than three years in duration, made up of interrelated tasks, performed by various organizations, with a well-defined objective, schedule, and budget”.(Archibald, 1992)
Project portfolio “A group of projects that are carried out under the sponsorship and/or management of a particular organization. These projects must compete for scarce resources (people, finance, time etcetera) available from the sponsor”. (Archer & Ghasemzadeh, 1999)
Project portfolio selection “The periodic activity involved in selecting a portfolio, from available project proposals and projects currently underway, that meets the organization’s stated objectives in a desirable manner without exceeding
Choosing the right projects
V
available resources or violating other constrains”.(Archer & Ghasemzadeh, 1999)
Strategic Fit How well the opportunity or project goal ensures the correct path for a company to get them where they want to go.(Cooper, Edgett, & Kleinschmidt, 2001)
Technology Roadmap A plan that applies to a new product or process, or to an emerging technology. It matches short- and long-term goals with specific solutions to help meet those goals.(Phaal, Farrukh, & Probert, 2001)
Abbreviations
BR Business Requirement. EM Evaluation Matrix. A Scania specific method for
evaluating projects before giving a formal “Go”.(Flodmark, 2011)
FNTD From Need To Delivery. A Scania specific process that illustrates how an idea is realized by a project. (Flodmark, 2011)
IR Initiation Report. A Scania specific template that is filled out before evaluation in EM. (Flodmark, 2011)
ITPMF IT Portfolio Management Forum. A Scania specific term describing their PPM process. (Flodmark, 2011)
ITRD IT Roadmap Description. A Scania specific template document for creating the short notes that describes the BR on the roadmap. (Flodmark, 2011)
POAP Project-On-A-Page. A Scania specific document. A first draft of the transformation from BR to an actual project. (Flodmark, 2011)
PPM Project Portfolio Management PMO Portfolio Management Office. The appointed group of
individuals that are in control of the PPM process. (Flodmark, 2011)
R&D Research and Development. UTI The IT organization for the research and development,
IT Area R&D, at Scania. (Flodmark, 2011) UTIP Product Description and Strategic Initiatives. Section
at Scania within UTI responsible for the long term initiatives within the IT environment. (Flodmark, 2011)
Choosing the right projects
VI
Table of Contents
1 INTRODUCTION............................................................................................................ 1
1.1 BACKGROUND ............................................................................................................... 1 1.2 PROBLEM DISCUSSION ..................................................................................................... 2 1.3 PURPOSE ...................................................................................................................... 3 1.4 DELIMITATIONS ............................................................................................................. 3 1.5 OUTLINE ...................................................................................................................... 4
2 METHODOLOGY ........................................................................................................... 5
2.1 CASE INTRODUCTION ...................................................................................................... 5 2.1.1 The minor cases .................................................................................................... 5
2.2 METHOD APPROACH ....................................................................................................... 6 2.3 METHOD FOR THEORETICAL COLLECTION ............................................................................ 7 2.4 METHOD FOR EMPIRICAL COLLECTION ................................................................................ 8
2.4.1 Interviews ............................................................................................................. 8 2.4.2 Observations at Scania ......................................................................................... 9
2.5 METHOD FOR ANALYSIS ................................................................................................. 10 2.6 RELIABILITY AND VALIDITY .............................................................................................. 12
3 THEORETICAL FRAMEWORK ....................................................................................... 13
3.1 PROJECT PORTFOLIO MANAGEMENT (PPM) ..................................................................... 13 3.1.1 PMO and the organization ................................................................................. 14 3.1.2 Strategic fit ......................................................................................................... 15 3.1.3 Scoring methods and Prioritization .................................................................... 16 3.1.4 Balancing the IT portfolio ................................................................................... 18 3.1.5 Project auditing .................................................................................................. 19
3.2 CREATING A STRATEGY .................................................................................................. 19 3.2.1 Implementing strategy in large organizations.................................................... 21
3.3 LEAN PRODUCTION AND LEAN IN SERVICES ........................................................................ 24 3.3.1 Lean principles .................................................................................................... 25
3.4 TYING THE THEORETICAL FRAME ...................................................................................... 26
4 EMPIRICS ................................................................................................................... 29
4.1 PRIMARY CASE, SCANIA CV AB ...................................................................................... 29 4.1.1 Governance structure at Scania IT Area R&D ..................................................... 29
4.2 PPM AT SCANIA .......................................................................................................... 30 4.2.1 Process forums .................................................................................................... 31 4.2.2 Formalized BR ..................................................................................................... 32 4.2.3 IT Roadmap R&D ................................................................................................ 32 4.2.4 PQ decisions/projects ......................................................................................... 32 4.2.5 Project On A Page (POAP) ................................................................................... 33 4.2.6 Pipeline planning ................................................................................................ 33 4.2.7 Project initiation and evaluation matrix ............................................................. 33
4.3 MINOR CASES.............................................................................................................. 34
Choosing the right projects
VII
5 DRIVERS THAT OUTLINE THE DECISION-MAKING CONCERNING IT PROJECT PORTFOLIO SELECTION .......................................................................................................................... 35
5.1 WHO MAKES THE DECISIONS?......................................................................................... 35 5.1.1 The impact of the different structures ................................................................ 37
5.2 WHAT ARE THE DECISIONS BASED ON? ............................................................................. 38 5.2.1 Value (e.g. Financial metrics, ROI, NPV, etcetera) .............................................. 38 5.2.2 Strategy (e.g. supporting corporate strategy, strategic fit, etcetera) ................ 39 5.2.3 Balance (e.g. Risk, duration, demand of resource, etcetera) .............................. 39 5.2.4 Interdependence (e.g. Linkage to other projects) ............................................... 40
5.3 REPORTED AND IDENTIFIED ISSUES ................................................................................... 40 5.4 CONCLUSION............................................................................................................... 41
6 A PROCESS FOR SCANIA R&D AND THE IT PROJECT PORTFOLIO SELECTION ............... 43
6.1 SCANIA TODAY............................................................................................................. 43 6.1.1 Prioritization, balance and selection................................................................... 43 6.1.2 Ownership and governance ................................................................................ 44 6.1.3 Long term view ................................................................................................... 45
6.2 ADDRESSING THE PROCESS AT SCANIA .............................................................................. 45 6.2.1 Step one – Easier flow into the roadmap ............................................................ 46 6.2.2 Step two – prioritization and evaluation upon POAP ......................................... 47 6.2.3 Step three – validation and project go/no go ..................................................... 50
6.3 CONCLUSION............................................................................................................... 50
7 THE ACCUMULATIVE INFORMATION CERTAINTY MODEL ........................................... 53
7.1 THE AIC MODEL – CREATING AN INFORMATION FLOW ......................................................... 53 7.2 AIC AND SCANIA .......................................................................................................... 55 7.3 BENEFITS AND DISBENEFITS WITH THE AIC MODEL .............................................................. 56 7.4 CONCLUSION............................................................................................................... 58
8 CONCLUSION ............................................................................................................. 59
8.1 ACADEMIC CONTRIBUTION ............................................................................................. 59 8.2 WILL IT WORK AT SCANIA?............................................................................................. 60 8.3 OUTLOOK AT SCANIA .................................................................................................... 60 8.4 CAN THE AIC MODEL BE APPLIED TO OTHER ORGANIZATIONS? .............................................. 61 8.5 METHODOLOGICAL IMPLICATIONS ................................................................................... 62 8.6 CONCLUDING REMARK .................................................................................................. 63
REFERENCES ....................................................................................................................... 65
APPENDIX A INTERVIEW GUIDE (SCANIA) ..................................................................... A-1
APPENDIX B INTERVIEW GUIDE (MINOR CASES)........................................................... B-1
APPENDIX C THE MINOR CASES .................................................................................... C-1
APPENDIX D SCANIA FROM NEED TO DELIVERY ............................................................ D-1
Choosing the right projects
1
1 Introduction
This opening chapter is intended to provide the reader with an introduction to the background and the scope with a brief introduction to selected theoretical areas. The problem that this thesis aims to unravel is discussed and followed with presenting the purpose. Finally it provides the reader with an outline of the thesis to get and overall view.
1.1 Background
“Imagine having ten doctors show up on the same morning, all with prepped patients. No one person “owns” the operating room schedule. The operating room support staff report to different supervisors. The supervisor decides that she doesn´t want to have any surgeon be mad at her, so she instructs the operating staff to multitask in order to assist all surgeons in the operating room. All surgeons will have access to the precious resource, the operating table, and the one anesthesiologist and the one surgical assistant, but only for 15 minutes at a time. Surgeon #1 begins surgery, but must relinquish the table to Surgeon #2 after 15 minutes. Surgeon #2 must relinquish to Surgeon #3 after 15 minutes, etcetera Surgeon #1, who would perform his surgery in one hour dedicated time, is now stuck for 10 to 15 hours, trying to keep the patient stable. Each time a surgeon is given the precious resource, the operating room table, he struggles to remember how far along he had gotten in his last 15-minute slot, several hours earlier. Fifty percent of the 15-minutes slot is wasted just getting restarted.” (Kendall & Rollins, 2003:4) Do you find this absurd? Good! But the reality is that this is how many projects are managed in actual organizations today. Most organizations today work with what they call a project portfolio, or in other words a group of projects within an organization that must compete for the same resources available (Archer & Ghasemzadeh, 1999). When an organization is presented with hundreds of project ideas, but only have the potential to move forward with five or ten, it is hard to make the right choice and at the same time make sure that the chosen projects generate as much value as possible (Merkhofer, 2010). Prioritizing among the projects in the project portfolio can be a challenging task as the portfolio grows larger. As projects demand more and more resources, the choice of projects is becoming increasingly important for the companies (Rajegopal, McGuin, & Waller, 2007). This has driven the development of Project Portfolio Management (PPM), a way for companies to better grasp their current and proposed projects in a more structural way. Wen (2010, p. 1) describes it like this, “View project management as “doing projects right”, then project portfolio management is “doing right projects””. Using a correct process of evaluation and
Choosing the right projects
2
prioritization of potential projects are of high value for any organization. The choice of model or process for selection should make sure that the projects that are selected are in line with the strategy. Bonham (2004) as well as Pennypacker and Retna (2009) mean that the selection should be based on multiple criterions to better reflect the different aspects of the project. Pellegrinelli and Bowman (1994) tackle the issue of implementing strategic initiatives throughout an organization and argue that strategic initiatives tend not to function as planned despite ambitious efforts made in steering committees and planning systems. Through their studies, they have created a method using a programme implementation with projects as “carriers of change”. The project acts outside the existing processes and culture to transform the way an organization operates and helps embed new behaviors required by a strategy. As more and more work related tasks are getting digitalized, the spending on IT-related investment has grown significantly over the last decade, touting better business performance for the companies (Willcocks, Petherbridge, & Olson, 2002). And even if many studies have dismantled the former concept of “production paradox” (Brynjolfsson & Hitt, 1996), there is a continuous work to better understand the complexity and value of IT-systems and the investment in them. Creating value requires a good deal of decisions, compromises and continuous work for the whole company (Wagter, van den Berg, Luijpers, & van Steenbergen, 2005). A concept for identifying and creating value that is more and more used throughout many organizations is Lean production. The purpose of Lean production is to identify and eliminate every factor within a process that does not create value for the end customer (Wei, 2009). Lean production was originally developed for production processes in an organization but successful efforts have been made to implement Lean on other processes within an organization as well. As IT value can be hard to quantify, IT managers struggle to justify the investment needed (Holland & Fathi, 2007). Frei (2006) discovered that a lot of waste in service processes, such as IT, could be corrected if the design of the process followed ten principles (Frei, 2006: in Wei, 2009). Ballard (2000) also means that it is important for all stakeholders to be involved in front end planning and design. Feedback loops need to be incorporated at every level to eliminate waste. He suggests that too many organizations rely on after-the-fact variance detection instead of using a process that controls and investigates projects continuously.
1.2 Problem discussion
Let’s go back to the example in 1.3. The surgeon goes to the supervisor to explain what needs to be done and demand the right amount of resources. Sooner or later, the supervisor handling more need than the hospital can cater. How can the supervisor prioritize and decide which needs to serve that is, not only right for the
Choosing the right projects
3
patients but also right for the hospital. If the overall goal for the hospital is to be the best children’s hospital should not the young patient be prioritized? But how do you make that decision if you also have grown up patients with other illnesses? Several books have been written in the area of PPM and its principles, methods and models. These give detailed information of every part of the process, from how to implement PPM in the enterprise to evaluation and selection of projects. One of the most important areas in PPM is the evaluation and prioritization of projects. The theories state that the process should use the information in a proposed business case to create an optimal balanced project portfolio (Bonham, 2004; Pennypacker & Retna, 2009; Kendall & Rollins, 2003). But creating a business case for every business requirement might be a long and costly process even if you accept uncertain facts and estimated information. In a large and strongly growing organization the time factor is of high importance. And even if you find a way to decide which needs to fulfill and which projects to move forward with the issue of strategic fit is often left unattended. Strategies are often viewed as blurry and hard to concretize. Pellegrinelli and Bowman (1994) argue that once a strategy has been developed, the implementation of it often fails when implemented into previously set paradigms, hence a new way of addressing strategic initiatives is needed for it to be fully fulfilled. The Lean principles are said to be a way of identifying value and gain benefits in processes. Would it be possible to combine the thoughts from PPM with the basics of creating value through a Lean inspired workflow? Would that be a good way of addressing IT project portfolios to gain the optimal benefits in line with strategy? By studying strategy implementation approaches in collaboration with the principles from Lean and theoretical PPM processes, the following purpose will be addressed in this thesis.
1.3 Purpose
The purpose is to investigate how an organization can make sure that the IT project portfolio is in line with the strategy and that decisions are based on balanced prioritization criterions.
1.4 Delimitations
The thesis addresses project portfolios at large organizations where the needs and requirements are coming both from the operational level and the management level. IT projects are in this thesis viewed as internal services and not viewed as a product for the end customer. The thesis will not fully approach the implementation parts of the suggested outcome.
Choosing the right projects
4
1.5 Outline
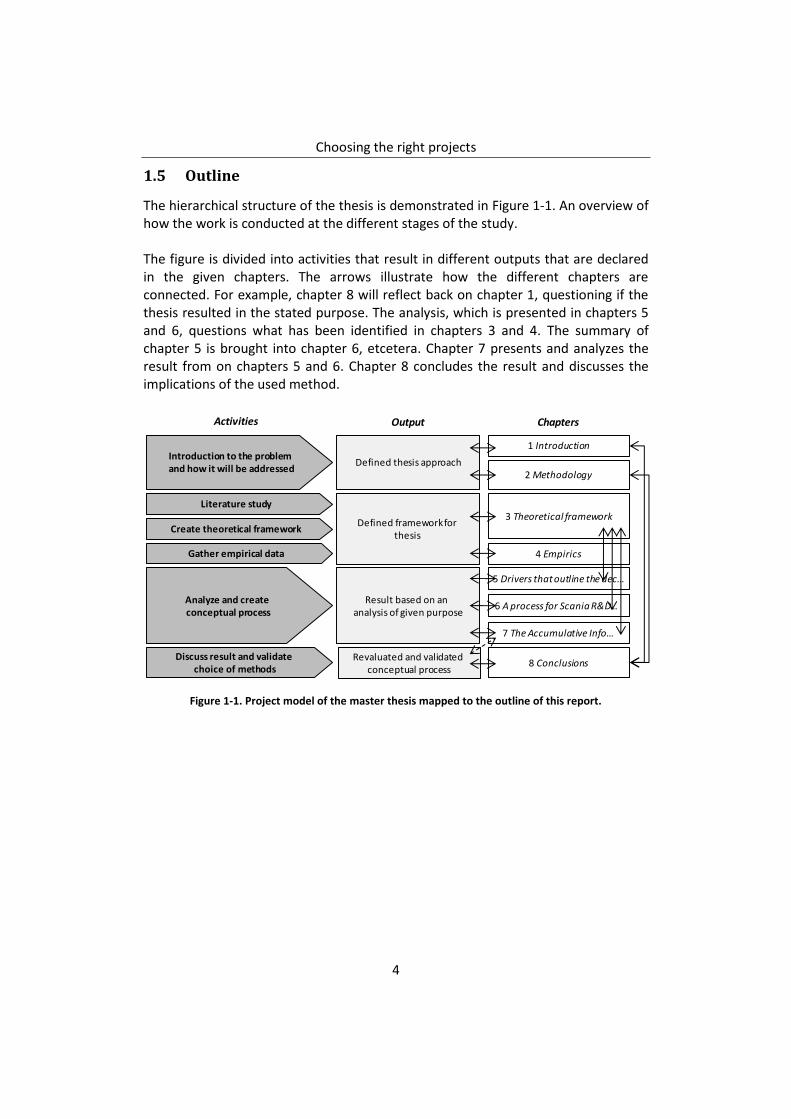
The hierarchical structure of the thesis is demonstrated in Figure 1-1. An overview of how the work is conducted at the different stages of the study. The figure is divided into activities that result in different outputs that are declared in the given chapters. The arrows illustrate how the different chapters are connected. For example, chapter 8 will reflect back on chapter 1, questioning if the thesis resulted in the stated purpose. The analysis, which is presented in chapters 5 and 6, questions what has been identified in chapters 3 and 4. The summary of chapter 5 is brought into chapter 6, etcetera. Chapter 7 presents and analyzes the result from on chapters 5 and 6. Chapter 8 concludes the result and discusses the implications of the used method.
Figure 1-1. Project model of the master thesis mapped to the outline of this report.
5 Drivers that outline the dec…
6 A process for Scania R&D…
7 The Accumulative Info…
Result based on an analysis of given purpose
Analyze and create conceptual process
Revaluated and validated conceptual process
Discuss result and validate choice of methods
8 Conclusions
3 Theoretical framework
4 Empirics
Defined framework for thesis
Literature study
Create theoretical framework
Gather empirical data
Introduction to the problem and how it will be addressed
Defined thesis approach2 Methodology
1 Introduction
Activities Output Chapters
Choosing the right projects
5
2 Methodology
This chapter aims to provide the reader with an understanding of the methodological process which has been conducted in the execution of this thesis. It will provide a motive to what has been done and that it has been conducted in an appropriate way. Initially the case study and chosen organization is presented followed by the literature study and the empirical study, including interviews, observations and secondary data. Finally a review of how the analysis has been performed is given and the chapter ends with defining reliability and validity.
2.1 Case introduction
This thesis was conducted as a part of the master’s program Technology Management at Lund University in Sweden, specializing in the field of Project Portfolio Management, Lean production and Strategy Alignment. The purpose presented in 1.3 will be addressed through a major case study conducted at Scania CV´s IT Area R&D department and four minor case studies at Astra Zeneca, ICA Sweden, Perstorp and SEB during the spring of 2011. The Swedish truck company Scania CV AB (Scania) and their IT department for research and development (IT Area R&D) presented an opportunity to investigate a real case problem with project portfolio management as the main priority. The complexity and size of Scania’s R&D organization provides a challenging environment for a PPM process. The development of trucks and components demands many different types of IT system support, to function well. Discussions with the IT Area R&D at Scania, about how their PPM process is implemented and the issues they have experienced gave the standpoint for this thesis. Together with the tutors at Scania, the two following questions where formulated to address the purpose given in 1.3;
What drives and outlines the decision-making surrounding IT project portfolio selection?
What would be an optimal process for Scania IT Area R&D and their IT Project Portfolio?
2.1.1 The minor cases
The minor case companies were chosen to broaden the perspective and to get a more solid base to extract best-practices and to better understand how the theories are used in real situations. To enable openness and avoid impaired information, the chosen minor case companies are not competitors with Scania. The interviewees at each company were either the manager of the IT portfolio or in charge of the strategical parts of the IT PPM process. The companies are active in different industries; pharmaceuticals, retail, chemicals and finance, to give different insights
Choosing the right projects
6
about how PPM is implemented in different industries. This enabled a gathering of best practices from different organizations to learn from them. It was also a way of indentifying issues that others have experienced (Patterson, 1995) and explores the phenomena from a more general base.
Astra Zeneca is chosen because of the similarities as a production company. Its size is about the double as Scania, employee-wise. The IT environment is mainly a supportive function.
ICA Sweden is smaller than Scania, about one sixth employee-wise, and has
more IT functions closer to the customer but IT is still mainly a support function. Their IT environment is interesting because of their wide geographical spread of their users.
Perstorp is the smallest company in the study and their IT portfolio is the
smallest of the studied companies. Their IT function is strictly a support function.
SEB is about half of Scania employee-wise, and their IT environment is closer
to the product than the other minor case companies. They are interesting because they use IT in their product, as well as in a support function.
2.2 Method approach
The choice of a case study fit the purpose well as the studied object is a contemporary phenomenon, which is hard to study with controlled experiments. A case also lets one probe deeper into the phenomena to get a deeper understanding of it (Höst, Regnell, & Runeson, 2006). The qualitative approach was best suited, as it supports collection of different types of information, such as, non-numeric facts, interviews and observations (Blaxter, Huges, & Tight, 2006). A flexible approach was chosen as the purpose was a bit unclear at the beginning of the study. The flexible approach gave the possibility to alter and redefine the parameters during the process as new information was unraveled. The objective for the study is an improving focus, where the aim is to provide an improved model for the studied area (Höst & Runesson, 2008). The method used is of abductive nature, a combination of the inductive and deductive methods that allows the gathered information to be analyzed against the chosen theories throughout the whole process (Alvesson & Sköldberg, 1994). The initial analysis gave indications of where to go to next and when new methods were given in the empirics, they could quickly be compared against relevant theories. The abductive nature fits well with a flexible case study.
Choosing the right projects
7
2.3 Method for theoretical collection
An initial study of literature was the first step towards getting the knowledge needed to carry out the thesis. A broad theoretical frame was determined at an early stage by first conducting a wide perspective search. It was a good way of gaining knowledge about the proposed area of the study. It helped to map out what others have done within the area, to understand the dynamics of the studied phenomena and also prevented making the same study as somebody has already done (Blaxter, Huges, & Tight, 2006). Studying PPM literature identified a number of recurring authors that have had great influence on the topic, such as James Pennypacker, Sam Retna, Gerald Kendall and Steven Rollins. Their research within the area of PPM is recognized as cornerstones of the area and wildly used in articles. Their focus lies much in the general theories about PPM, not any exact types of projects. Stephen Bonham focuses on the IT PPM which especially suits this thesis well. As strategy alignment is a part of the PPM theories, literature regarding how to create strategies within companies was studied to give a better understanding of the different levels of strategy among manufacturing companies. Literature from the author Terry Hill, an acclaimed author of the area of operations strategy, has served as the base for understanding corporate strategy. To better grasp the intentions of how a strategy is implemented in a company, the article from Sergio Pellegrinelli and Cliff Bowman about how projects can help implement strategy, is used. As the concept of Lean is foremost intended for manufacturing, a different angle was chosen by using Jerry Wei’s (2009) article about how the Lean concept can be transferred to service processes. This is because the purpose with Scania IT Area R&D is to provide the truck developers with a hassle-free IT service. The theory chapter addresses the methods, structures and workflows of PPM, Lean in services and strategy implementations. To collect the literature, the tutors at Scania and from the university have been of service, giving good tips on interesting books and articles. Databases, such as Lib-hub (Lund university article database) and Google Scholar, and libraries, both physical and digital, have also been used to collect the material. Gathering information from tutors, co-workers, and fellow students helped broaden the search for good articles and books and is a way of securing a diversity of sources (Blaxter, Huges, & Tight, 2006). The diversity gave a deeper understanding and a broad base to analyze the empiric findings from. The literature study was conducted in parallel with the most of the empirical collection conducted in this thesis. An iterative process that refined the chosen theories during the empiric gathering was used, even of the broad frame of theories was developed at the initial literature study. When issues were discovered at Scania, it was easier to pinpoint theories that could explain why these issues arise. The reason for that being the character of the project shifting as new ideas and angles of
Choosing the right projects
8
the problem at hand was developed. As the work developed and the course drifted somewhat, new theories were added and old ones taken away (Dan, Kalof, & Dietz, 2008).
2.4 Method for empirical collection
After the initiated literature study, the empirical collecting began, using a triangular approach where interviews, observations and workshops were used. Using different techniques enabled a structure for validating the findings and helped corroborate collected information given from the different methods (Cohen, Manion, & Morrison, 2007). Also, by using different methods the shortcoming of every method by itself can be bridged by another. Triangulation has been proven as a better way of ensuring validity in qualitative research (Campbell & Fiske, 1959). To better comprehend and analyze the findings at the major case company, the four additional minor case companies were studied through interviews.
2.4.1 Interviews
By examining the PPM process at Scania together with the tutors at Scania, key persons within that process were identified and contacted for interviews. As a Portfolio Management Office (PMO) is a cross-functional organization, it was important to interview different roles within the PPM process because it gave different insights on how the current process is working. The interviews also gave validity to identified issues as they concurred with each other. A semi-structured interview approach for the interviews was chosen as it let the interviewee talk freely about their experiences. It is also regarded as a good method when the research is qualitatively based (Saunders, Lewis, & Thornhill, 2009). The interview guide was based on the identified initial theories together with the collaboration with the tutor at Scania. The question probes into the different areas that were implicated by Scania together with the common issues that the theories mention. The guide uses PPM process model used by IT Area R&D, see Figure 4-2, to facilitate the interview. First, the process as a whole is addressed with general questions, then funneling it down to more specific questions about the interface between the different activities (Höst & Runesson, 2008). After every conducted interview, the key findings were summarized and mapped out at a process map of the studied model as Höst and Runesson (2008) suggests. A copy of the interview guide used during all interviews can be found in Appendix A. The aim was to only perform personal interviews face to face with the interviewee. The advantage of a physical meeting with the interviewee is that the questioning techniques are not limited. Opposite to performing telephone interviews, there is a possibility to use visual material to communicate with, such as digital slides or other illustrations. Attendant questions can be asked right away to elaborate the interviewee’s answer, which can give a deeper qualitative result (Bernard, 2000).
Choosing the right projects
9
This helped the study because graphical illustrations could be collected and explained at the same time as the interview. It also enabled the interviewees to demonstrate their tools and methods used in their PPM process, which gave a better insight in how they work. On top of that, numerous unstructured interviews have been conducted with different individuals from UTI and UTIP. This method worked well for in-depth informal interviews where the interviewer wishes to probe deeper into a specific area without pre-decided questions (Saunders, Lewis, & Thornhill, 2009; Dan, Kalof, & Dietz, 2008). These unstructured interviews assisted when collected material was unclear. They have also been of great interest as they have given broader insights about Scania and the different systems used at R&D. The interviews at the minor case were also semi-structured with general questions about their implementation of the IT PPM. Then more specific questions about metrologies and activities along the process were used. Open-ended questions made the interviewees talk as freely as possible about the possibilities and issues with their process. From some of the interviews, materials and sketches were collected that helped describe the process better. A copy of the used interview guide can be found in Appendix B. Since only interviews were conducted at the minor cases, observations were not made to verify the issues mentioned in the interviews. This could be a potential weakness when evaluating Scania against the other case companies. The potential weaknesses have been minimized by trying to interview those responsible for the process at each company. Also choosing companies that are not competitors to Scania has helped minimize the weakness.
2.4.2 Observations at Scania
According to Lantz (1993), observations can be used as a tool if the method is used for a specified purpose, is systematically registered and planned with a good relation to validity and reliability. During four months, the every-day-work at the UTI department was observed. By being a part of the organization, active observations and participation in the practical workflow could be made. How the employees at UTI act and behave in the situations concerning activities connected to the studied area could then be registered. This brought out perspectives and insights that could not been extracted from interviews alone, as some of the interviewed are not aware of their full communicative pattern, as Lantz (1993) mentions. This helped validate the empiric material collected at Scania. Observations were passively conducted at different decision levels to get an understanding of how the governance structure works and how the environment affects their actions. This have led to a deeper understanding of the situation and helped determine what is “real”, i.e. what actually happens, and what is “official”,
Choosing the right projects
10
i.e. what they say happens (Höst & Runesson, 2008). Both primary and secondary observations have been used to collect input for the analysis. The secondary observations have been in line with how Saunders et. al. (2009), as this information has been observed by other individuals than the authors. The secondary observations have been more critically reviewed as they are colored by the observer’s interpretations (Saunders, Lewis, & Thornhill, 2009). It has been important to understand the communicative patterns at Scania, how the discussions are developed throughout meetings and how they communicate their strategy regarding the studied area. This has helped create an understanding for how Scania, as a company, works and have deepened the understanding of the cultural system that exists at Scania. It is possible that the objective analysis might have been compromised by being present at Scania for such a long period of time. Participating in the everyday work conducted at Scania make it easier to connect the issues to Scania specific solutions. Also, the close collaboration with the tutors might has influenced the process and impaired the objectivity. However, being present at Scania has given a deeper understanding for the studied area and enabled a richer context to analyze.
2.5 Method for analysis
Due to the chosen methods, the analysis has been an ongoing process where the empirical data collected have been evaluated against the theories. The models created throughout the process has been tested at Scania through workshops and informal discussions which have given an iterative analytical process. Different approaches have been tested and rejected during the process, which has given a better understanding of the problem at hand. The theoretical frame combines the structural theories about PPM, from Bonham (2004), Pennypacker (2009, Kendall and Rollins (2003), etcetera, with the implementations of strategy suggested by Pellegrinelli and Bowman. The PPM theories are used to explain how project portfolios are structured and how the components of the process are combined to get the desired output. It helped to get both an overview of the process as well as information about different activities within the PPM process. As strategy alignment is a great part in PPM, the general concepts of strategy in production companies are used to understand the different levels of strategy. To better comprehend how strategy could be implemented in the organization, the Pellegrinelli and Bowman (1994) article is used, as it gives a perspective closely connected with projects and project portfolios. The Lean concept for services are used when the suggested alteration to the current process have been constructed.
Choosing the right projects
11
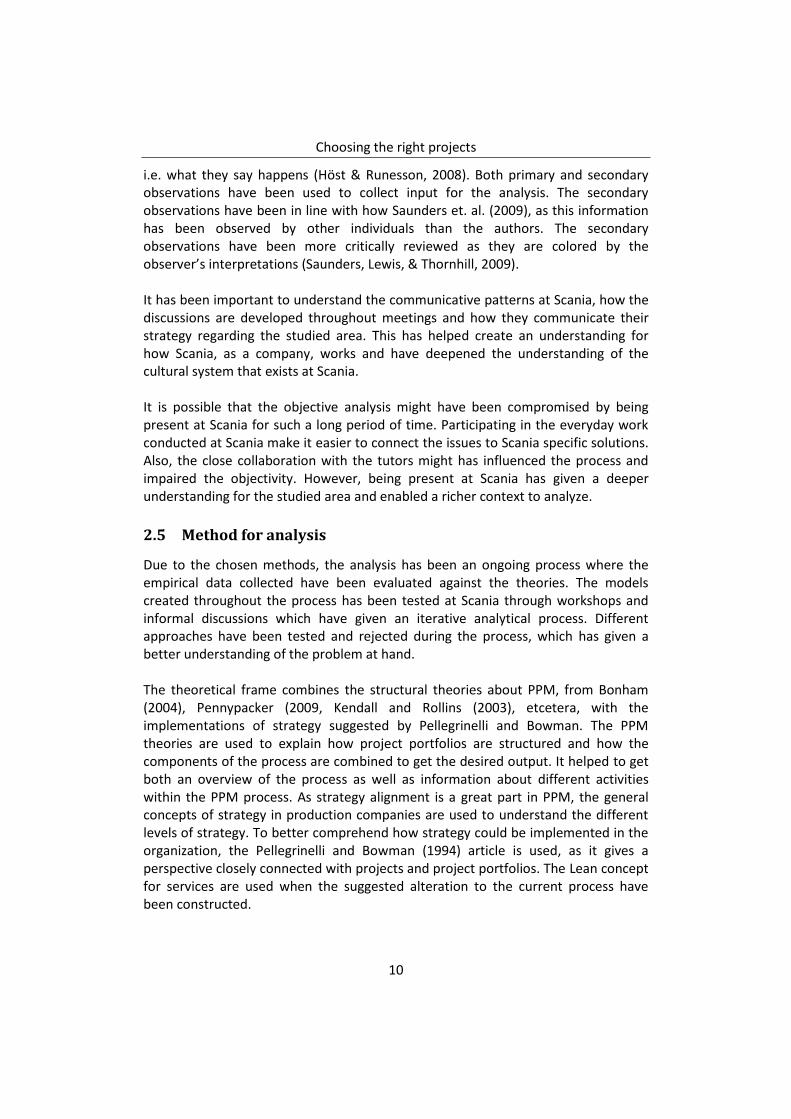
As a qualitative approach is used, a lot of different types of data have been collected, such as, written words, illustrations and electronic documents. These have been sorted and categorized like Saunders et. al. (2009) describes. For the empirical material gathered at Scania, a model of their current process was used to map the findings from each interview to illustrate where issues have been reported. It helped identify common areas where issues were found. For the minor cases, the findings were categorized in Table 2-1.
Table 2-1. Labels used for categorization of empiric findings form minor cases.
Label Description
Key findings Their thoughts and methods for achieving a well functioning project portfolio. The findings are used to identify the things that make their process function well.
Vs. Scania How their way of working differs or resembles the process at Scania. Used to understand what works well for Scania and what might be altered.
Reported Issues The problems they have identified with their implementation and the weaknesses they have experienced with their process.
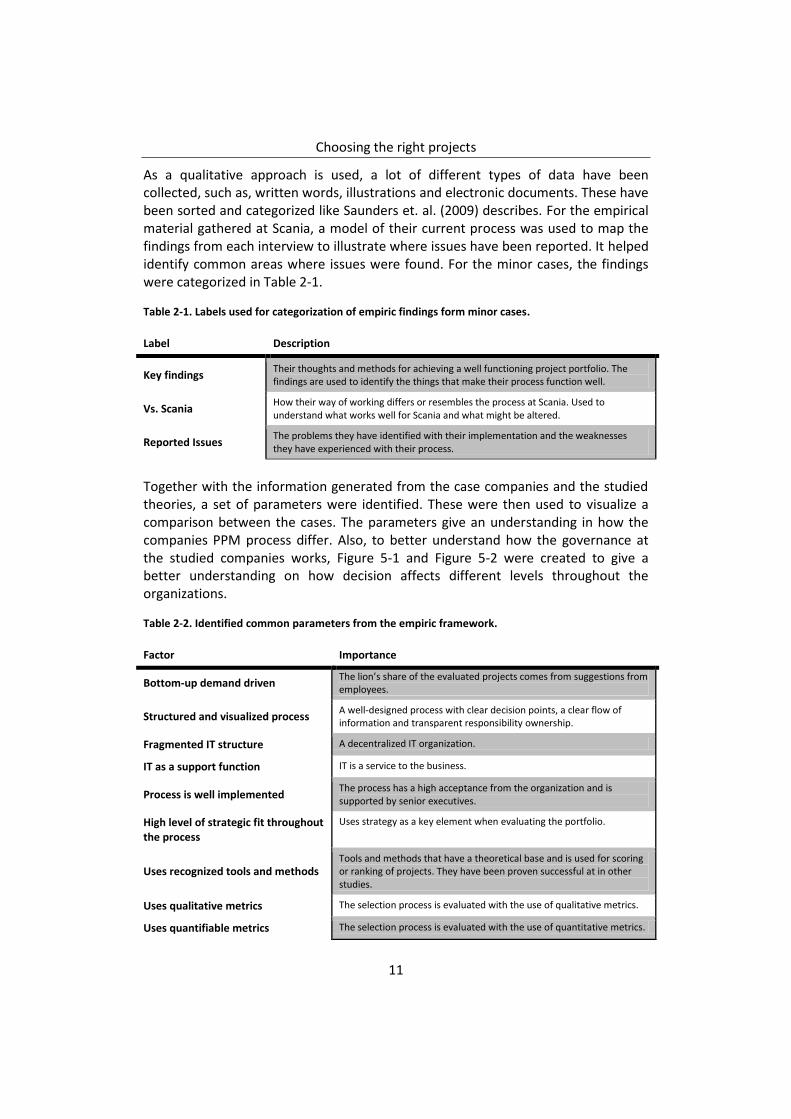
Together with the information generated from the case companies and the studied theories, a set of parameters were identified. These were then used to visualize a comparison between the cases. The parameters give an understanding in how the companies PPM process differ. Also, to better understand how the governance at the studied companies works, Figure 5-1 and Figure 5-2 were created to give a better understanding on how decision affects different levels throughout the organizations.
Table 2-2. Identified common parameters from the empiric framework.
Factor Importance
Bottom-up demand driven The lion’s share of the evaluated projects comes from suggestions from employees.
Structured and visualized process A well-designed process with clear decision points, a clear flow of information and transparent responsibility ownership.
Fragmented IT structure A decentralized IT organization.
IT as a support function IT is a service to the business.
Process is well implemented The process has a high acceptance from the organization and is supported by senior executives.
High level of strategic fit throughout the process
Uses strategy as a key element when evaluating the portfolio.
Uses recognized tools and methods Tools and methods that have a theoretical base and is used for scoring or ranking of projects. They have been proven successful at in other studies.
Uses qualitative metrics The selection process is evaluated with the use of qualitative metrics.
Uses quantifiable metrics The selection process is evaluated with the use of quantitative metrics.

Choosing the right projects
12
This iterative process enabled small generalizations to be made at every step, creating a formalized body of knowledge at the end (Höst & Runesson, 2008). From that body of knowledge a finalized conceptual process for Scania was crafted, addressing the key findings from the empiric analysis. As a way of validating the result of the study a SWOT analysis was performed where strengths, weaknesses, opportunities and threats were considered. The SWOT analysis is a common method used for evaluating strategic initiatives, projects etcetera. By addressing both strengths and weaknesses with the result as it is, as well as consider external factors, such as opportunities and threats, a good overall view about the proposed result is given (Bradford & Duncan, 1999). This is used to question the proposed model and to concentrate the key benefit the model delivers.
2.6 Reliability and validity
The development of the process was tested theoretically against the minor cases to establish reliability to the study. It ensures a transparency between the presented logic and the raw data. It also makes sure that the collected material would be the same if yielded at another occasion (Saunders, Lewis, & Thornhill, 2009). By interviewing persons with different roles in the portfolio at Scania, the issues were validated by more than one of the interviewees. Furthermore at Scania the empirical framework was collected through several observations and workshops where the empirical findings were reviewed and discussed, led by the findings of the study and complemented by representatives from Scania. It enabled a richer and more realistic approach to the result and also gave a way of testing the model at different stages of the development. By also implementing the minor cases in the study and discussing them during the Scania workshops the result presents a collected outcome from a wide study. Thorough assistance from tutors, both at Scania and from Lund University, together with the triangulation method, the validity has been ensured the way Höst & Runesson (2008) describes it. Since this is a qualitative case study, there are no ways to be completely conclusive about the findings of this study. However, the material gathered and analyzed in this report provides important insights into the IT-PPM practice.
Choosing the right projects
13
3 Theoretical framework
This chapter aims to provide the reader with the theoretical framework used in this thesis. Theories considering strategy implementation, project portfolio management, Lean production and benefit management is highlighted and finally a summarized framework is presented were theories are mapped to the purpose.
3.1 Project Portfolio Management (PPM)
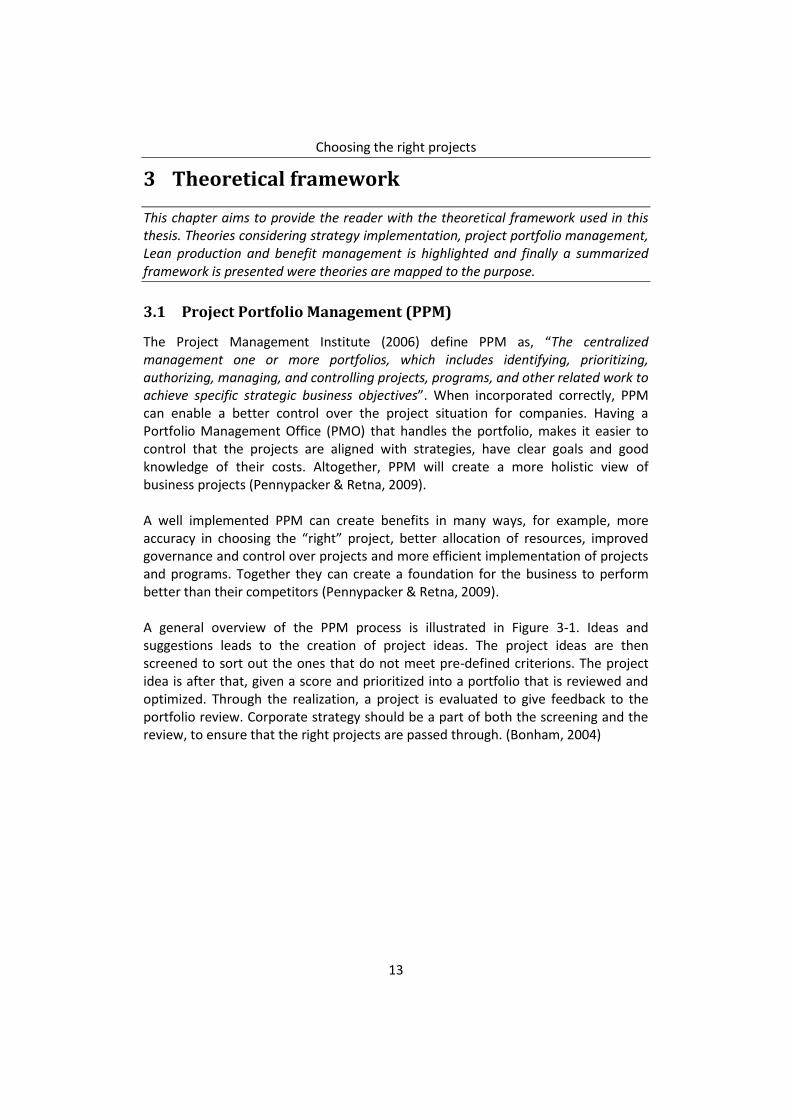
The Project Management Institute (2006) define PPM as, “The centralized management one or more portfolios, which includes identifying, prioritizing, authorizing, managing, and controlling projects, programs, and other related work to achieve specific strategic business objectives”. When incorporated correctly, PPM can enable a better control over the project situation for companies. Having a Portfolio Management Office (PMO) that handles the portfolio, makes it easier to control that the projects are aligned with strategies, have clear goals and good knowledge of their costs. Altogether, PPM will create a more holistic view of business projects (Pennypacker & Retna, 2009). A well implemented PPM can create benefits in many ways, for example, more accuracy in choosing the “right” project, better allocation of resources, improved governance and control over projects and more efficient implementation of projects and programs. Together they can create a foundation for the business to perform better than their competitors (Pennypacker & Retna, 2009). A general overview of the PPM process is illustrated in Figure 3-1. Ideas and suggestions leads to the creation of project ideas. The project ideas are then screened to sort out the ones that do not meet pre-defined criterions. The project idea is after that, given a score and prioritized into a portfolio that is reviewed and optimized. Through the realization, a project is evaluated to give feedback to the portfolio review. Corporate strategy should be a part of both the screening and the review, to ensure that the right projects are passed through. (Bonham, 2004)
Choosing the right projects
14
Figure 3-1. A general overview of the different stages in the PPM process.
3.1.1 PMO and the organization
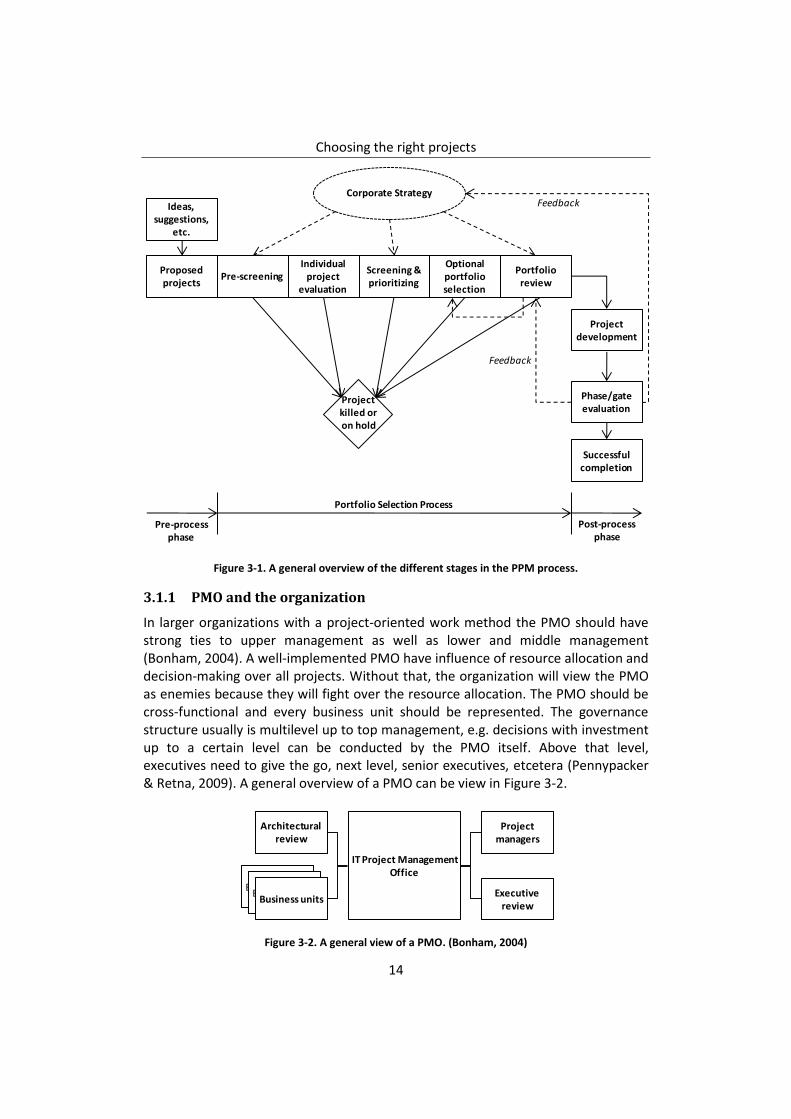
In larger organizations with a project-oriented work method the PMO should have strong ties to upper management as well as lower and middle management (Bonham, 2004). A well-implemented PMO have influence of resource allocation and decision-making over all projects. Without that, the organization will view the PMO as enemies because they will fight over the resource allocation. The PMO should be cross-functional and every business unit should be represented. The governance structure usually is multilevel up to top management, e.g. decisions with investment up to a certain level can be conducted by the PMO itself. Above that level, executives need to give the go, next level, senior executives, etcetera (Pennypacker & Retna, 2009). A general overview of a PMO can be view in Figure 3-2.
Figure 3-2. A general view of a PMO. (Bonham, 2004)
Ideas, suggestions,
etc.
Project development
Phase/gate evaluation
Successful completion
Corporate Strategy
Pre-process phase
Portfolio Selection Process
Post-process phase
Pre-screeningIndividual
project evaluation
Screening & prioritizing
Optional portfolio selection
Portfolio review
Proposed projects
Project killed or on hold
Feedback
Feedback
Business UnitsBusiness Units
Business units
Architectural review
IT Project Management Office
Executive review
Project managers

Choosing the right projects
15
3.1.2 Strategic fit
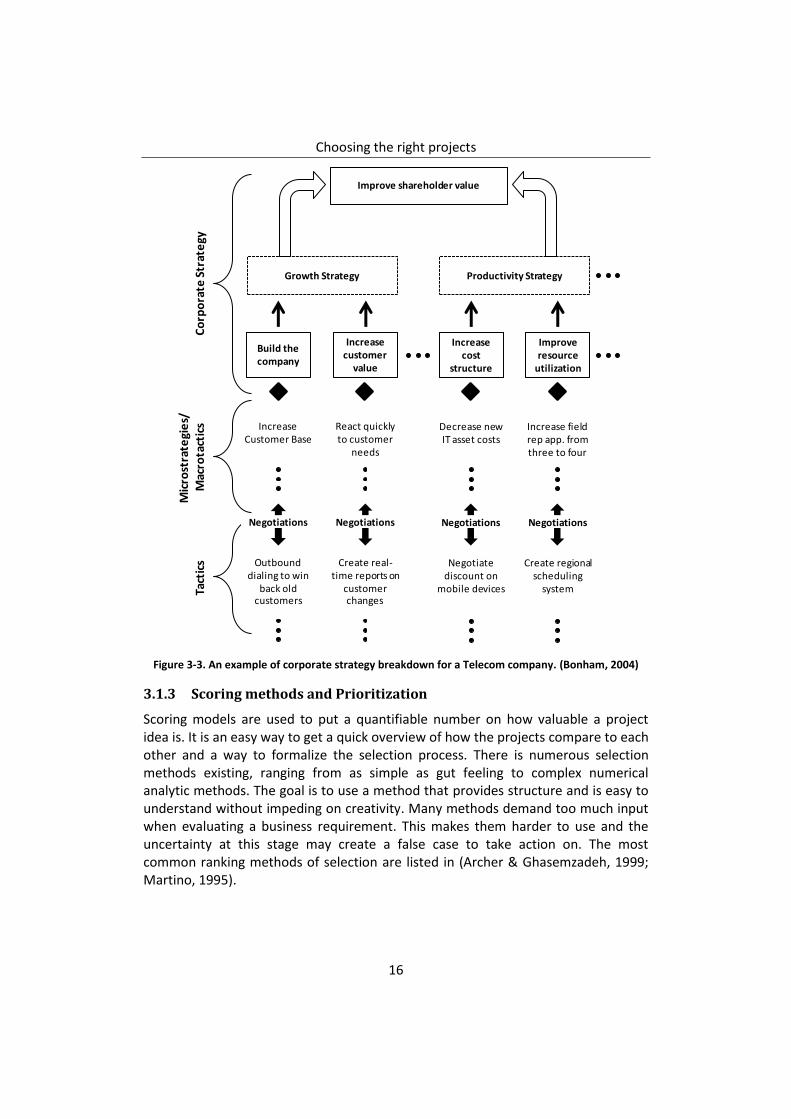
Strategic fit as a term is a rather straight forward term, but can carry a lot of different interpretations. At its core, it is all about ensuring that the project goals get the company where they want to be. It may seem to be a rudimentary task but in reality it has been proven to be quite challenging. Often the strategy is formed at a too high level and is not concrete enough to link to the operational project (Cooper, Edgett, & Kleinschmidt, 2001). Also, when using IT PPM in a support function at a company, the link between the corporate strategy and the support projects can be complex and indistinct (Pennypacker & Retna, 2009). Before PPM can be successfully implemented, the company must ensure that their corporate strategy is well defined and broken down as explicit as possible. Creating microstrategies deriving from the general corporate strategy could act as tactical instructions for the different business units in the company, see Figure 3-3.(Bonham, 2004) To handle the complexity, three different approaches are stated, top-down, bottom-up and a mix between them both. The top-down perspective starts at a high corporate level where the overall strategy is created. They then translate this into microstrategies for different departments (see Figure 3-3), using roadmaps or strategic buckets (see Figure 3-5), showing the departments where they invest, to secure the overall strategy. The figure shows how an overall strategy is broken down to sub-strategies and then into tactics for each respective business area. The top-down approach provides directives how to invest properly to achieve the strategical goals. The bottom-up approach generates business requirements or opportunities from within the organization. It involves the lower-level managers and employees that have suggestions or ideas to drive the company forward. Both methods have some insufficiencies that the combined approach tends to solve. Having a combined approach stimulates both parties and through iteration they can achieve a better overall result (Pennypacker & Retna, 2009).
Choosing the right projects
16
Figure 3-3. An example of corporate strategy breakdown for a Telecom company. (Bonham, 2004)
3.1.3 Scoring methods and Prioritization
Scoring models are used to put a quantifiable number on how valuable a project idea is. It is an easy way to get a quick overview of how the projects compare to each other and a way to formalize the selection process. There is numerous selection methods existing, ranging from as simple as gut feeling to complex numerical analytic methods. The goal is to use a method that provides structure and is easy to understand without impeding on creativity. Many methods demand too much input when evaluating a business requirement. This makes them harder to use and the uncertainty at this stage may create a false case to take action on. The most common ranking methods of selection are listed in (Archer & Ghasemzadeh, 1999; Martino, 1995).
Growth Strategy Productivity Strategy
Improve shareholder valueC
orp
ora
te S
trat
egy
Mic
rost
rate
gie
s/M
acro
tact
ics
Tact
ics
Increase Customer Base
Negotiations
Outbound dialing to win
back old customers
Build the company
Increase customer
value
React quickly to customer
needs
Create real-time reports on
customer changes
Negotiations
Decrease new IT asset costs
Negotiations
Negotiate discount on
mobile devices
Increase cost
structure
Improve resource
utilization
Increase field rep app. from three to four
Create regional scheduling
system
Negotiations
Choosing the right projects
17
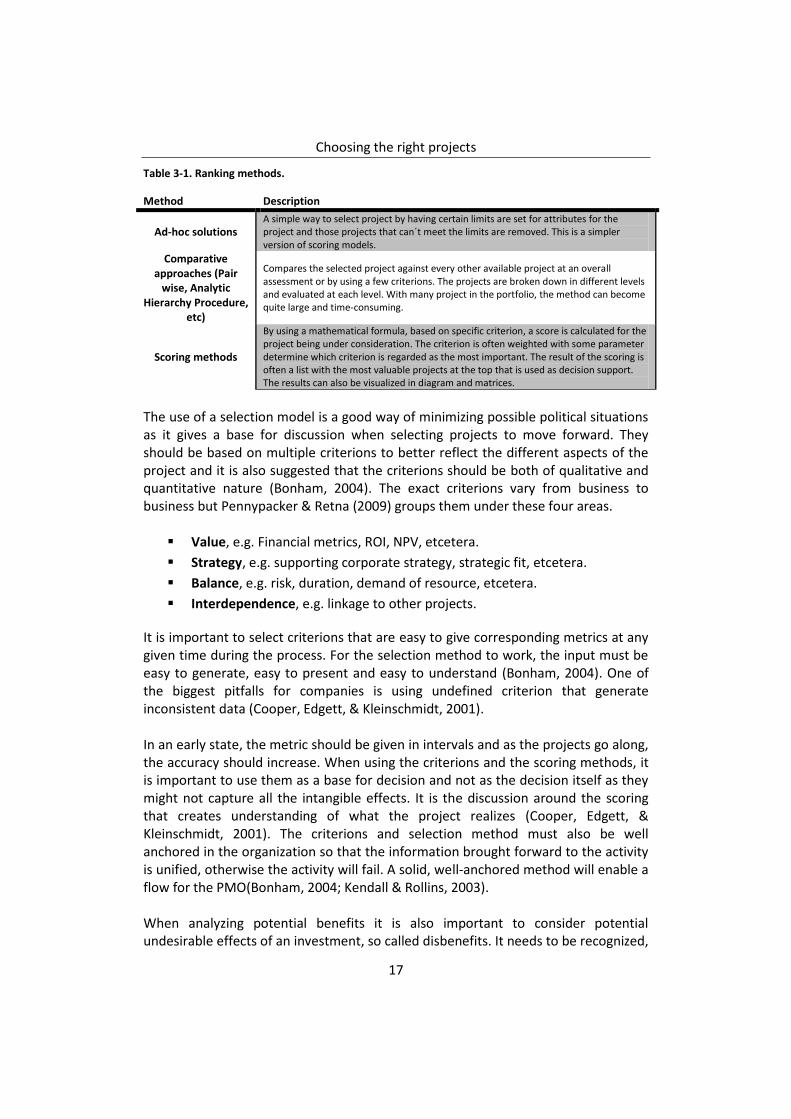
Table 3-1. Ranking methods.
Method Description
Ad-hoc solutions A simple way to select project by having certain limits are set for attributes for the project and those projects that can´t meet the limits are removed. This is a simpler version of scoring models.
Comparative approaches (Pair
wise, Analytic Hierarchy Procedure,
etc)
Compares the selected project against every other available project at an overall assessment or by using a few criterions. The projects are broken down in different levels and evaluated at each level. With many project in the portfolio, the method can become quite large and time-consuming.
Scoring methods
By using a mathematical formula, based on specific criterion, a score is calculated for the project being under consideration. The criterion is often weighted with some parameter determine which criterion is regarded as the most important. The result of the scoring is often a list with the most valuable projects at the top that is used as decision support. The results can also be visualized in diagram and matrices.
The use of a selection model is a good way of minimizing possible political situations as it gives a base for discussion when selecting projects to move forward. They should be based on multiple criterions to better reflect the different aspects of the project and it is also suggested that the criterions should be both of qualitative and quantitative nature (Bonham, 2004). The exact criterions vary from business to business but Pennypacker & Retna (2009) groups them under these four areas.
Value, e.g. Financial metrics, ROI, NPV, etcetera.
Strategy, e.g. supporting corporate strategy, strategic fit, etcetera.
Balance, e.g. risk, duration, demand of resource, etcetera.
Interdependence, e.g. linkage to other projects.
It is important to select criterions that are easy to give corresponding metrics at any given time during the process. For the selection method to work, the input must be easy to generate, easy to present and easy to understand (Bonham, 2004). One of the biggest pitfalls for companies is using undefined criterion that generate inconsistent data (Cooper, Edgett, & Kleinschmidt, 2001). In an early state, the metric should be given in intervals and as the projects go along, the accuracy should increase. When using the criterions and the scoring methods, it is important to use them as a base for decision and not as the decision itself as they might not capture all the intangible effects. It is the discussion around the scoring that creates understanding of what the project realizes (Cooper, Edgett, & Kleinschmidt, 2001). The criterions and selection method must also be well anchored in the organization so that the information brought forward to the activity is unified, otherwise the activity will fail. A solid, well-anchored method will enable a flow for the PMO(Bonham, 2004; Kendall & Rollins, 2003). When analyzing potential benefits it is also important to consider potential undesirable effects of an investment, so called disbenefits. It needs to be recognized,
Choosing the right projects
18
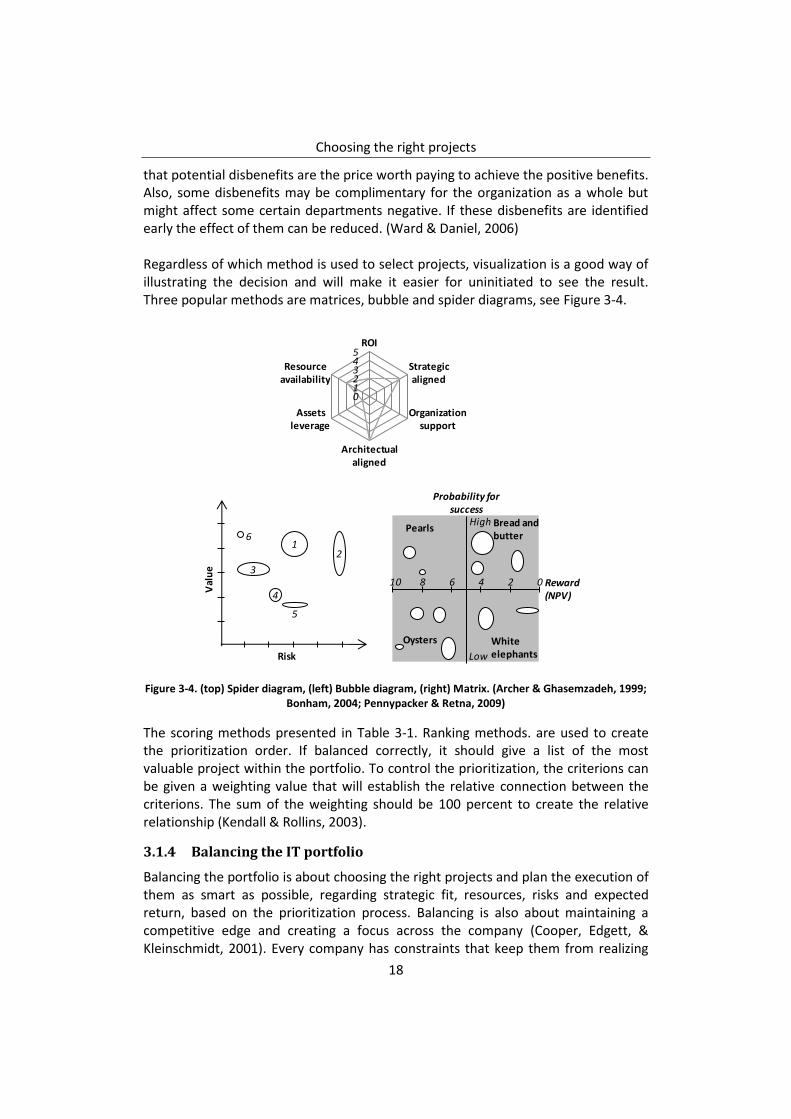
that potential disbenefits are the price worth paying to achieve the positive benefits. Also, some disbenefits may be complimentary for the organization as a whole but might affect some certain departments negative. If these disbenefits are identified early the effect of them can be reduced. (Ward & Daniel, 2006) Regardless of which method is used to select projects, visualization is a good way of illustrating the decision and will make it easier for uninitiated to see the result. Three popular methods are matrices, bubble and spider diagrams, see Figure 3-4.
Figure 3-4. (top) Spider diagram, (left) Bubble diagram, (right) Matrix. (Archer & Ghasemzadeh, 1999; Bonham, 2004; Pennypacker & Retna, 2009)
The scoring methods presented in Table 3-1. Ranking methods. are used to create the prioritization order. If balanced correctly, it should give a list of the most valuable project within the portfolio. To control the prioritization, the criterions can be given a weighting value that will establish the relative connection between the criterions. The sum of the weighting should be 100 percent to create the relative relationship (Kendall & Rollins, 2003).
3.1.4 Balancing the IT portfolio
Balancing the portfolio is about choosing the right projects and plan the execution of them as smart as possible, regarding strategic fit, resources, risks and expected return, based on the prioritization process. Balancing is also about maintaining a competitive edge and creating a focus across the company (Cooper, Edgett, & Kleinschmidt, 2001). Every company has constraints that keep them from realizing
012345
ROI
Strategic aligned
Organization support
Architectual aligned
Assets leverage
Resource availability
4
12
3
Risk
Val
ue
5
6
Reward (NPV)
Low
High
0246810
Probability for success
Pearls Bread and butter
Oysters Whiteelephants
Choosing the right projects
19
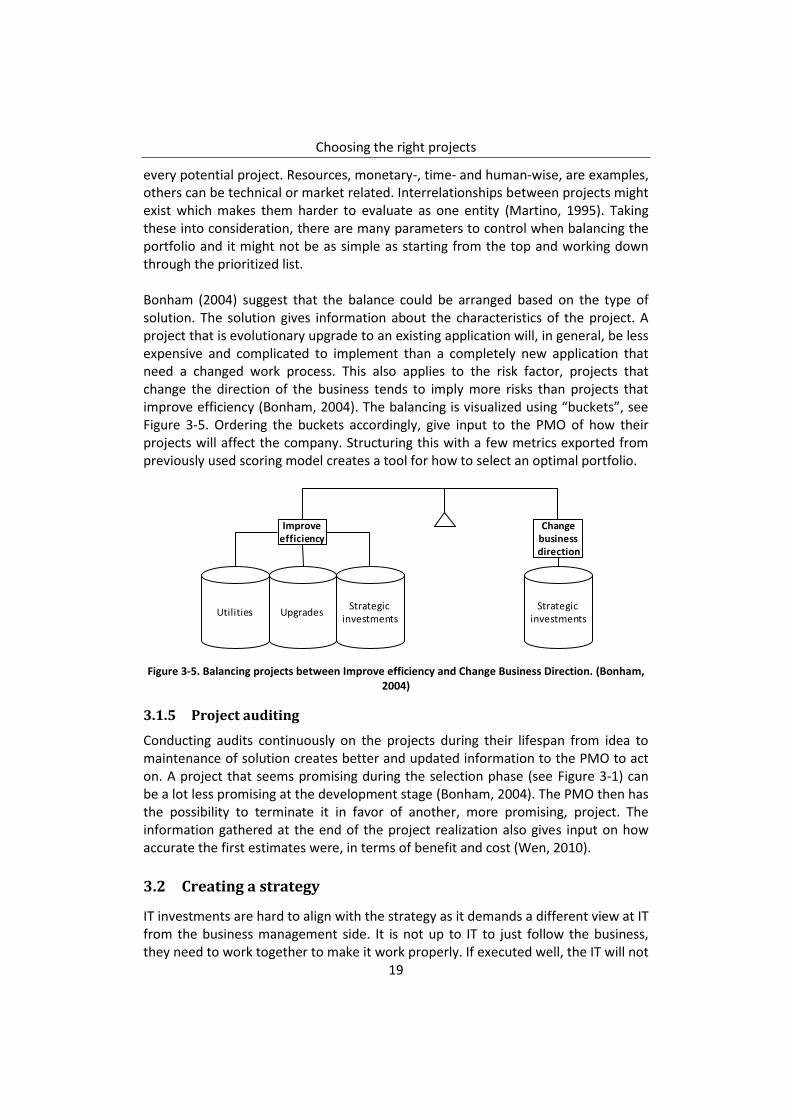
every potential project. Resources, monetary-, time- and human-wise, are examples, others can be technical or market related. Interrelationships between projects might exist which makes them harder to evaluate as one entity (Martino, 1995). Taking these into consideration, there are many parameters to control when balancing the portfolio and it might not be as simple as starting from the top and working down through the prioritized list. Bonham (2004) suggest that the balance could be arranged based on the type of solution. The solution gives information about the characteristics of the project. A project that is evolutionary upgrade to an existing application will, in general, be less expensive and complicated to implement than a completely new application that need a changed work process. This also applies to the risk factor, projects that change the direction of the business tends to imply more risks than projects that improve efficiency (Bonham, 2004). The balancing is visualized using “buckets”, see Figure 3-5. Ordering the buckets accordingly, give input to the PMO of how their projects will affect the company. Structuring this with a few metrics exported from previously used scoring model creates a tool for how to select an optimal portfolio.
Figure 3-5. Balancing projects between Improve efficiency and Change Business Direction. (Bonham, 2004)
3.1.5 Project auditing
Conducting audits continuously on the projects during their lifespan from idea to maintenance of solution creates better and updated information to the PMO to act on. A project that seems promising during the selection phase (see Figure 3-1) can be a lot less promising at the development stage (Bonham, 2004). The PMO then has the possibility to terminate it in favor of another, more promising, project. The information gathered at the end of the project realization also gives input on how accurate the first estimates were, in terms of benefit and cost (Wen, 2010).
3.2 Creating a strategy
IT investments are hard to align with the strategy as it demands a different view at IT from the business management side. It is not up to IT to just follow the business, they need to work together to make it work properly. If executed well, the IT will not
Change businessdirection
Strategic investments
Utilities UpgradesStrategic
investments
Improve efficiency
Choosing the right projects
20
only support the business requirement but also drive competitive advantage and be an enabler of new opportunities (Abdi, 2010 ). Numerous academic studies have also shown that companies with their business strategy aligned with their IT strategy do better than those who do not (Chan & Reich, 2007). In larger organizations strategy often needs to be developed at three levels; Corporate, Business unit and Functional. Hill (2005) describes them in Table 3-2.
Table 3-2. Levels of strategy and their distinctive tasks(Hill, 2005)
Level of strategy Distinctive tasks
Corporate “Concerns the direction of the total business and addresses issues such as where to invest and/or divest and priorities in terms of sales revenue growth. Implementation concerns the allocation of investment funds in line with these priorities.”
Business unit
“Comprise different parts of a total business. Strategic directions concerns identifying the market in which it competes, agreeing where it intends to grow, the nature of competition and the relevant competitive criteria in its current and future markets, in terms of maintaining and growth share. Implementation concerns discussing and agreeing how and where to invest, in terms of functional tasks and alternative approaches.”
Functional
“Each business unit will comprise a number of functions such as sales and marketing, operations and IT that make up the total activities within a business unit. The strategic role of each function is to support those competitive dimensions within a market for which it is wholly or partly responsible. In this way, the market comprises the agenda for functional strategies and becomes the mechanism for determining development and investment priorities. Implementation concerns consistently meeting the competitive norms involved and selecting from alternative approached to attain the improvement goals laid down.”
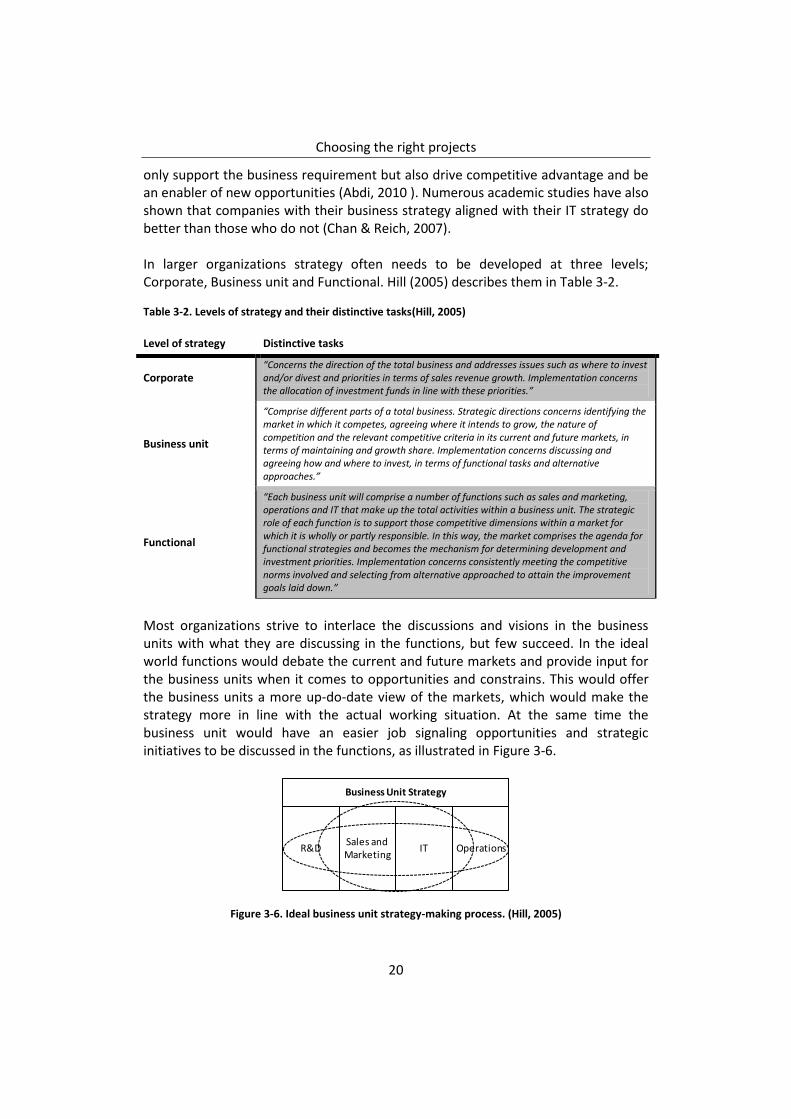
Most organizations strive to interlace the discussions and visions in the business units with what they are discussing in the functions, but few succeed. In the ideal world functions would debate the current and future markets and provide input for the business units when it comes to opportunities and constrains. This would offer the business units a more up-do-date view of the markets, which would make the strategy more in line with the actual working situation. At the same time the business unit would have an easier job signaling opportunities and strategic initiatives to be discussed in the functions, as illustrated in Figure 3-6.
Figure 3-6. Ideal business unit strategy-making process. (Hill, 2005)
Business Unit Strategy
R&DSales and Marketing
IT Operations
Choosing the right projects
21
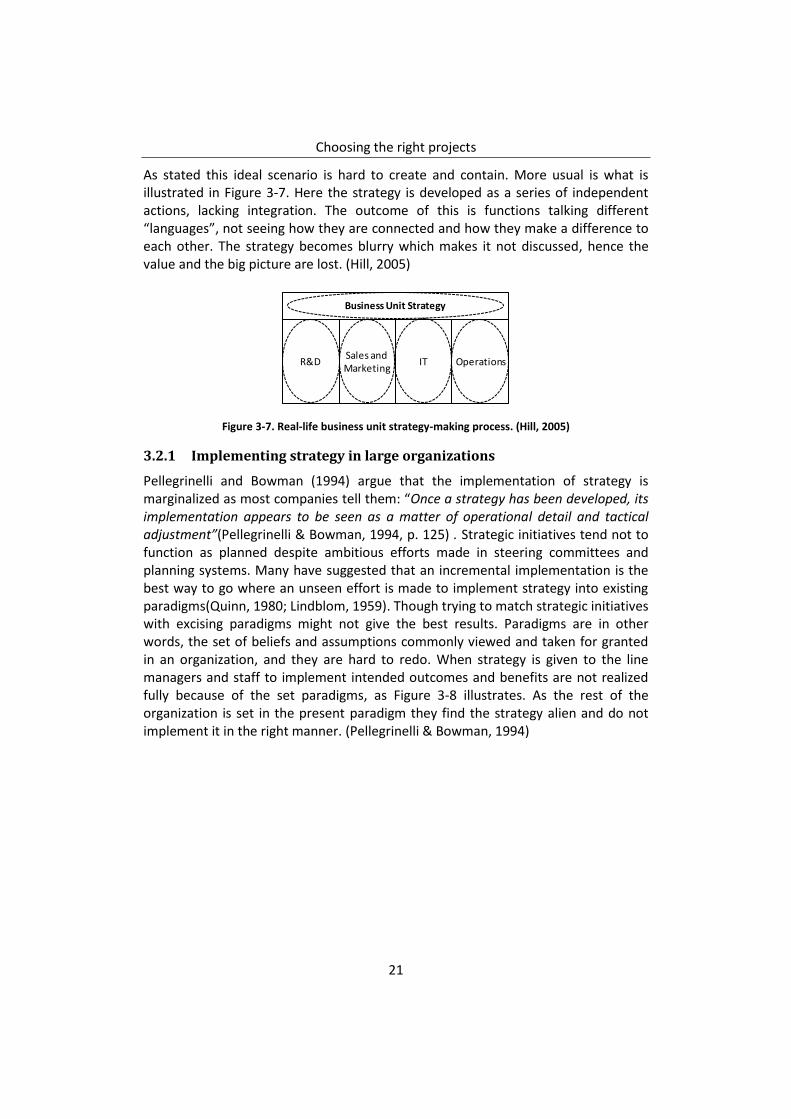
As stated this ideal scenario is hard to create and contain. More usual is what is illustrated in Figure 3-7. Here the strategy is developed as a series of independent actions, lacking integration. The outcome of this is functions talking different “languages”, not seeing how they are connected and how they make a difference to each other. The strategy becomes blurry which makes it not discussed, hence the value and the big picture are lost. (Hill, 2005)
Figure 3-7. Real-life business unit strategy-making process. (Hill, 2005)
3.2.1 Implementing strategy in large organizations
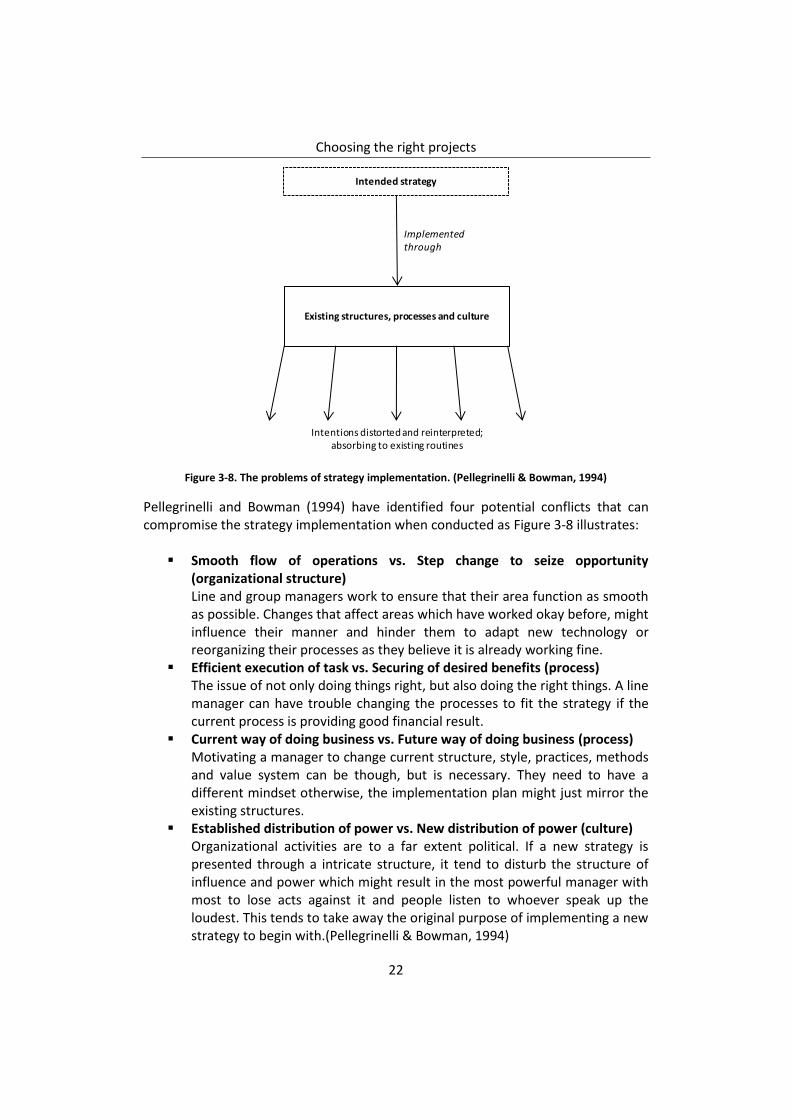
Pellegrinelli and Bowman (1994) argue that the implementation of strategy is marginalized as most companies tell them: “Once a strategy has been developed, its implementation appears to be seen as a matter of operational detail and tactical adjustment”(Pellegrinelli & Bowman, 1994, p. 125) . Strategic initiatives tend not to function as planned despite ambitious efforts made in steering committees and planning systems. Many have suggested that an incremental implementation is the best way to go where an unseen effort is made to implement strategy into existing paradigms(Quinn, 1980; Lindblom, 1959). Though trying to match strategic initiatives with excising paradigms might not give the best results. Paradigms are in other words, the set of beliefs and assumptions commonly viewed and taken for granted in an organization, and they are hard to redo. When strategy is given to the line managers and staff to implement intended outcomes and benefits are not realized fully because of the set paradigms, as Figure 3-8 illustrates. As the rest of the organization is set in the present paradigm they find the strategy alien and do not implement it in the right manner. (Pellegrinelli & Bowman, 1994)
Business Unit Strategy
R&DSales and Marketing
IT Operations
Choosing the right projects
22
Figure 3-8. The problems of strategy implementation. (Pellegrinelli & Bowman, 1994)
Pellegrinelli and Bowman (1994) have identified four potential conflicts that can compromise the strategy implementation when conducted as Figure 3-8 illustrates:
Smooth flow of operations vs. Step change to seize opportunity (organizational structure) Line and group managers work to ensure that their area function as smooth as possible. Changes that affect areas which have worked okay before, might influence their manner and hinder them to adapt new technology or reorganizing their processes as they believe it is already working fine.
Efficient execution of task vs. Securing of desired benefits (process) The issue of not only doing things right, but also doing the right things. A line manager can have trouble changing the processes to fit the strategy if the current process is providing good financial result.
Current way of doing business vs. Future way of doing business (process) Motivating a manager to change current structure, style, practices, methods and value system can be though, but is necessary. They need to have a different mindset otherwise, the implementation plan might just mirror the existing structures.
Established distribution of power vs. New distribution of power (culture) Organizational activities are to a far extent political. If a new strategy is presented through a intricate structure, it tend to disturb the structure of influence and power which might result in the most powerful manager with most to lose acts against it and people listen to whoever speak up the loudest. This tends to take away the original purpose of implementing a new strategy to begin with.(Pellegrinelli & Bowman, 1994)
Intentions distorted and reinterpreted; absorbing to existing routines
Intended strategy
Existing structures, processes and culture
Implemented through
Choosing the right projects
23
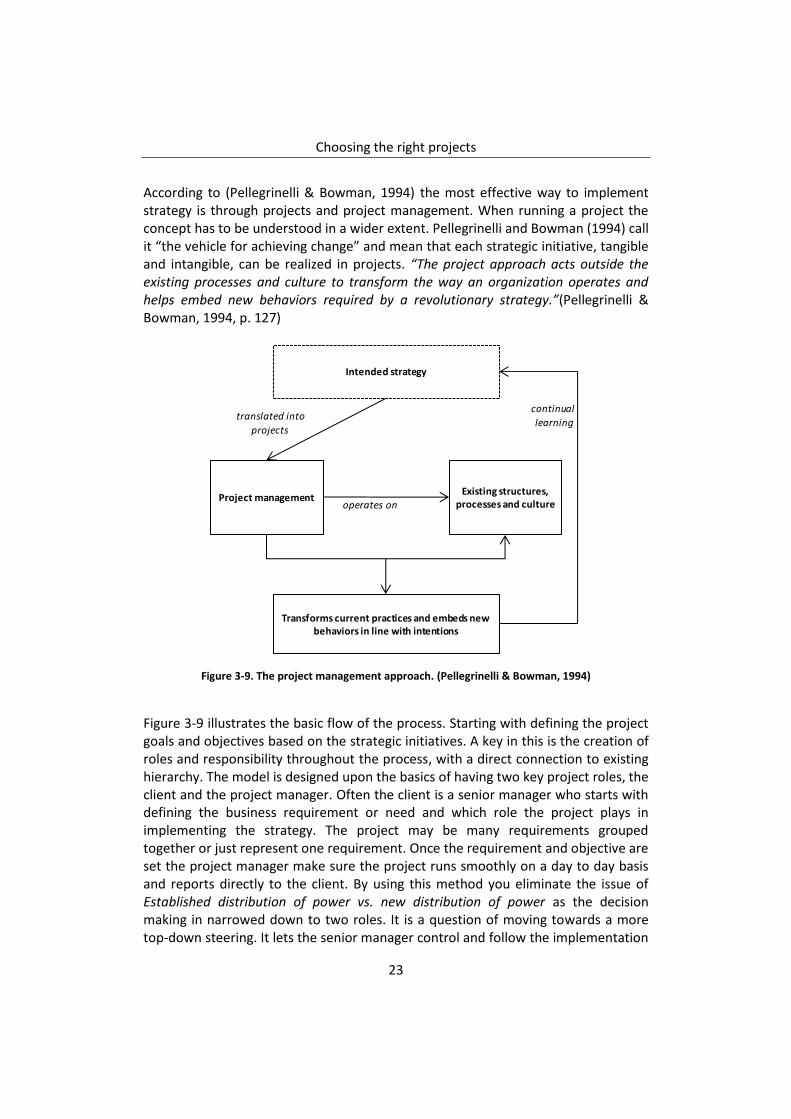
According to (Pellegrinelli & Bowman, 1994) the most effective way to implement strategy is through projects and project management. When running a project the concept has to be understood in a wider extent. Pellegrinelli and Bowman (1994) call it “the vehicle for achieving change” and mean that each strategic initiative, tangible and intangible, can be realized in projects. “The project approach acts outside the existing processes and culture to transform the way an organization operates and helps embed new behaviors required by a revolutionary strategy.”(Pellegrinelli & Bowman, 1994, p. 127)
Figure 3-9. The project management approach. (Pellegrinelli & Bowman, 1994)
Figure 3-9 illustrates the basic flow of the process. Starting with defining the project goals and objectives based on the strategic initiatives. A key in this is the creation of roles and responsibility throughout the process, with a direct connection to existing hierarchy. The model is designed upon the basics of having two key project roles, the client and the project manager. Often the client is a senior manager who starts with defining the business requirement or need and which role the project plays in implementing the strategy. The project may be many requirements grouped together or just represent one requirement. Once the requirement and objective are set the project manager make sure the project runs smoothly on a day to day basis and reports directly to the client. By using this method you eliminate the issue of Established distribution of power vs. new distribution of power as the decision making in narrowed down to two roles. It is a question of moving towards a more top-down steering. It lets the senior manager control and follow the implementation
translated into
projects
Intended strategy
Project managementExisting structures,
processes and culture
Transforms current practices and embeds new behaviors in line with intentions
continual
learning
operates on
Choosing the right projects
24
of the strategy in a more direct manner which hinder the risk of important parts being lost in translation or removed do to it colliding with set paradigms. The strategic initiatives become unambiguous. The role of the client has to be active throughout the project and after to make sure that the required benefit was achieved. The client needs significant knowledge of the strategy which means that the role cannot be given to a project manager nor a junior manager.(Pellegrinelli & Bowman, 1994) When using the project management approach model there are two important difficulties to take into account:
The independence of projects The action of implementing strategy through projects is often a question of starting several projects at once that together implements a strategic goal. It is important that the relationship between these projects is functioning. Something that is difficult to achieve due to the complexity of them and the quest for each project to act independently. For the strategy to be implemented correctly the integration between the projects are essential.
Learning during projects A strategy is a subject to modification, which is opposite to a project structure that relies on fixed objectives, constrains and time. The remaking of strategy into tightly scoped projects and at the same time learning during implementation is essential but can be difficult to achieve due to the mix of structures. (Pellegrinelli & Bowman, 1994)
By introducing a PPM process, these difficulties can be erased. By gathering all projects inside the framework for a programme creates an easier base for co-ordination which leads to extraction of benefits and goal achievement that would not have been if each project were handled independently. By using the programme approach, a more distinct bridge between project and strategy is created. Pellegrinelli and Bowman (1994) means that it “operationalizes” strategy by:
Creating framework for the strategy implementation process. - Critical elements are identified. - Set of action is specified and assigned.
Making project definition more systematic and objective. - Reducing the prevalence of long duration and high risk projects.
3.3 Lean Production and Lean in services
Lean production can be described as a philosophy of how to handle resources. The purpose is to identify and eliminate every factor within a process that does not create value for the end customer. Today, information is no longer scarce and the new economics have new ways of calculating profit such as: Price minus cost equals
Choosing the right projects
25
profit. This implies that to achieve a higher profit, the cost has to go down, and that is what Lean is all about. (Dennis, 2007) The Lean Project Deliver System (LPDS) was developed by the Lean Construction Institute (LCI) and is a step towards finding new and better ways to create improved capital facilities. According to the LPDS, projects should be structured and managed as a value generating process. It is important for all stakeholders to be involved in front end planning and design through cross functional teams. Feedback loops need to be incorporated at every level to eliminate waste and learn. Projects are to be controlled and executed after investigations and not rely on after-the-fact variance detection. What is also significant is that focus should lie on making the work flow reliable, opposite to improving productivity. It is about being effective, not productive.(Ballard, 2000) The concept of Lean production will not be defined further. For a deeper understanding of the concept, the book Lean Production Simplified by Pascal Dennis is recommended. The focus lies instead on the principles of Lean applied on service processes by Jerry Wei (2009).
3.3.1 Lean principles
Wei (2009) presents theories and principles of designing Lean service processes and agrees with Hopp and Spearman (2008, p. 825) that “the small details of the production process can confer a substantial competitive advantage”. After reviewing 150 student projects investigating Lean processes within a variety of different operations in the field, Wei discovered that a lot of waste could be corrected if the design of the process followed ten principles. In the centre of each principle the understanding of value is essential. For the management team it is of high importance to make sure that the organizations core competency are in line with the value the organization want to communicate. This is hard and it often gets to a decision of either choosing the excellence paired with poorer performance or mediocrity across all dimensions (Frei, 2006: in Wei, 2009). Of the ten principles that Wei (2009) suggests, six of them have been identified as adaptable into the IT PPM process. The selected principles support the intended flow of information for a IT PPM process. They give a guidence to how a process can be structured and designed with the Lean principles. LP1. The baseline: Walk the value stream Go through each step of the process and use visual tools to document the stream of value as clear as possible. LP2. Identify waste and ask “5 whys?” When process is visualized, go through each step and identify waste and search for solution that results in an improved process. LP3. Error-proof the process
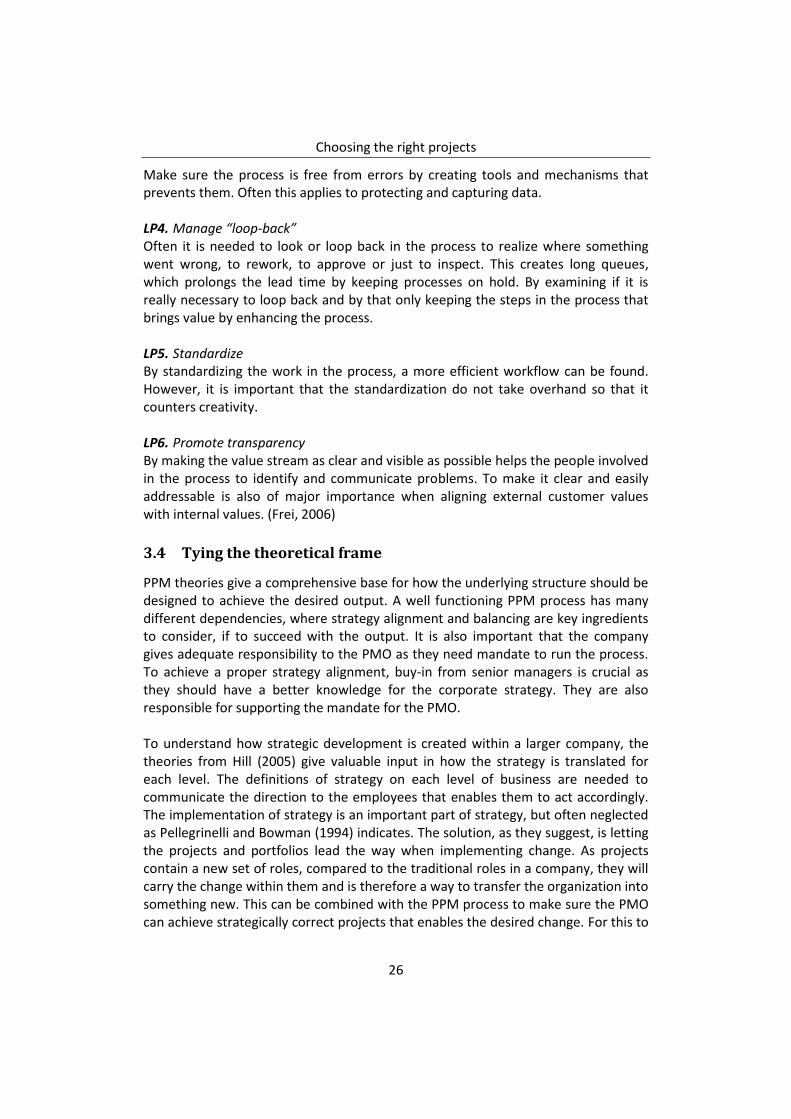
Choosing the right projects
26
Make sure the process is free from errors by creating tools and mechanisms that prevents them. Often this applies to protecting and capturing data.
LP4. Manage “loop-back” Often it is needed to look or loop back in the process to realize where something went wrong, to rework, to approve or just to inspect. This creates long queues, which prolongs the lead time by keeping processes on hold. By examining if it is really necessary to loop back and by that only keeping the steps in the process that brings value by enhancing the process. LP5. Standardize By standardizing the work in the process, a more efficient workflow can be found. However, it is important that the standardization do not take overhand so that it counters creativity. LP6. Promote transparency By making the value stream as clear and visible as possible helps the people involved in the process to identify and communicate problems. To make it clear and easily addressable is also of major importance when aligning external customer values with internal values. (Frei, 2006)
3.4 Tying the theoretical frame
PPM theories give a comprehensive base for how the underlying structure should be designed to achieve the desired output. A well functioning PPM process has many different dependencies, where strategy alignment and balancing are key ingredients to consider, if to succeed with the output. It is also important that the company gives adequate responsibility to the PMO as they need mandate to run the process. To achieve a proper strategy alignment, buy-in from senior managers is crucial as they should have a better knowledge for the corporate strategy. They are also responsible for supporting the mandate for the PMO. To understand how strategic development is created within a larger company, the theories from Hill (2005) give valuable input in how the strategy is translated for each level. The definitions of strategy on each level of business are needed to communicate the direction to the employees that enables them to act accordingly. The implementation of strategy is an important part of strategy, but often neglected as Pellegrinelli and Bowman (1994) indicates. The solution, as they suggest, is letting the projects and portfolios lead the way when implementing change. As projects contain a new set of roles, compared to the traditional roles in a company, they will carry the change within them and is therefore a way to transfer the organization into something new. This can be combined with the PPM process to make sure the PMO can achieve strategically correct projects that enables the desired change. For this to
Choosing the right projects
27
be achieved, the strategies must be formulated at the level of use so they can easily be interpreted and incorporated. The Lean philosophy is infused with the notion to make everything more efficient and to minimize the amount of waste created within the process. This is something equally important for a PPM process as it continuously handles a lot of information that need to be given at certain stages to achieve a correct base for decisions. Using the principles to restructure the process creates a logical path with clearer ownership at each stage. The Lean philosophy is also a way of addressing the refinements of information along the way in a PPM process which can add a transparency to the process. The process will be easier to understand for third parties, i.e. the people at the company that thinks the process is slow when addressing new business needs.

Choosing the right projects
28
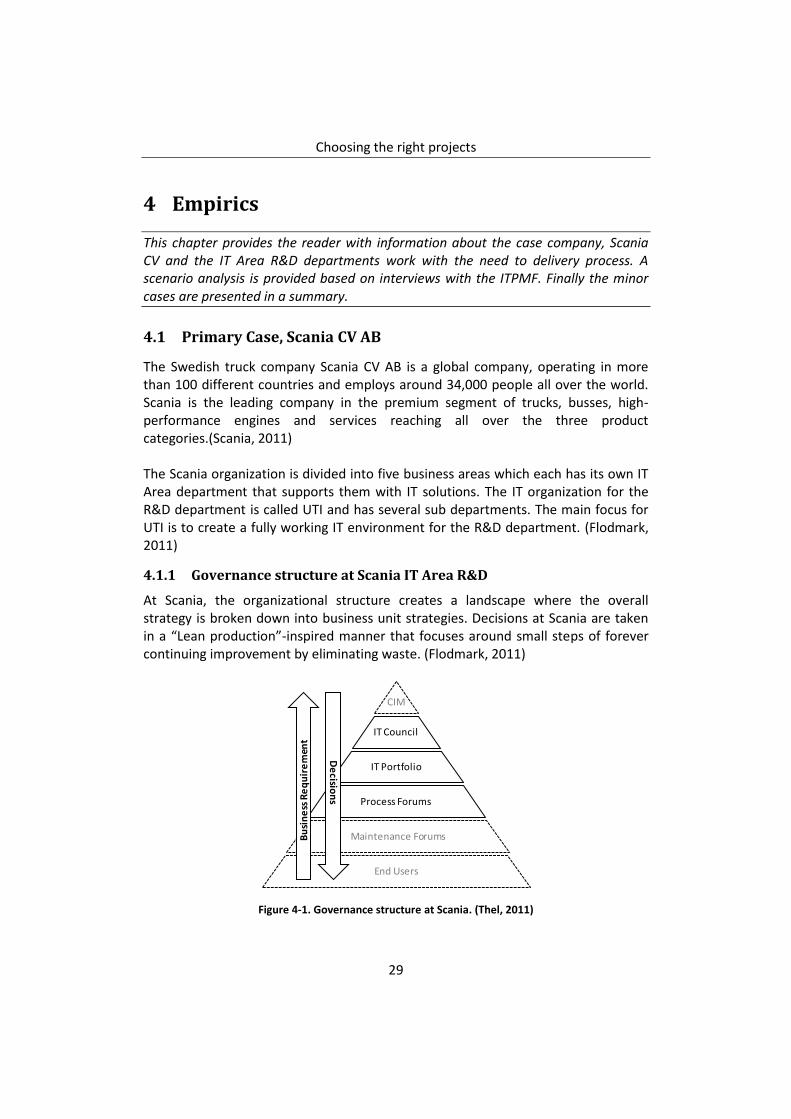
Choosing the right projects
29
4 Empirics
This chapter provides the reader with information about the case company, Scania CV and the IT Area R&D departments work with the need to delivery process. A scenario analysis is provided based on interviews with the ITPMF. Finally the minor cases are presented in a summary.
4.1 Primary Case, Scania CV AB
The Swedish truck company Scania CV AB is a global company, operating in more than 100 different countries and employs around 34,000 people all over the world. Scania is the leading company in the premium segment of trucks, busses, high-performance engines and services reaching all over the three product categories.(Scania, 2011) The Scania organization is divided into five business areas which each has its own IT Area department that supports them with IT solutions. The IT organization for the R&D department is called UTI and has several sub departments. The main focus for UTI is to create a fully working IT environment for the R&D department. (Flodmark, 2011)
4.1.1 Governance structure at Scania IT Area R&D
At Scania, the organizational structure creates a landscape where the overall strategy is broken down into business unit strategies. Decisions at Scania are taken in a “Lean production”-inspired manner that focuses around small steps of forever continuing improvement by eliminating waste. (Flodmark, 2011)
Figure 4-1. Governance structure at Scania. (Thel, 2011)
CIM
IT Council
IT Portfolio
Process Forums
Maintenance Forums
End Users
Bu
sin
ess
Re
qu
ire
men
t
De
cision
s
Choosing the right projects
30
Figure 4-1 illustrates the governance structure at Scania IT Area R&D from a PPM perspective. The solid lines are the groups mainly targeted in this thesis.
Corporate Information Management (CIM)
The top management for IT within Scania as a whole. Members are chief executives of Scania together with the CEO of InfoMate, IT provider and fully-owned Scania Company. CIM are responsible for the global corporate IT operation.(Thel, 2011)
IT Council (ITC)
The top management for IT operations at Scania R&D. Members is the executives from the different business areas within R&D. They aim to identify and decide on needed changes in the IT-environment and with directions from the R&D management team make sure that the IT-resources are to be used in the most efficient way. (Thel, 2011)
IT Portfolio Management Forum (ITPMF)
The management responsible for the project portfolio for IT area R&D. The members are the chairmen of each process forum together with representatives from UTI. They are in charge of handling the portfolio by investigating and evaluating proposed project ideas and project plans. (Flodmark, 2011)
Process Forums (PF)
Responsible for the aggregation of new business requirements and owner of existing requirements for each respective area within R&D. Members are managers from each respective area together with a representative from UTI, called Business Maintenance Manager (BMM) and a representative from InfoMate. (Flodmark, 2011)
Maintenance Forums
Groups responsible for the actively used systems within R&D. Members from organizations which uses the respectively system together with a BMM that act as the facilitator. (Flodmark, 2011)
4.2 PPM at Scania
The PMO at Scania is a cross functional group, called IT Portfolio Management Forum (ITPMF). They control the portfolio and their purpose is to secure a long term hassle-free IT environment for R&D that enables R&D to work more efficiently. They have been active in this form since 2008. (Flodmark, 2011)
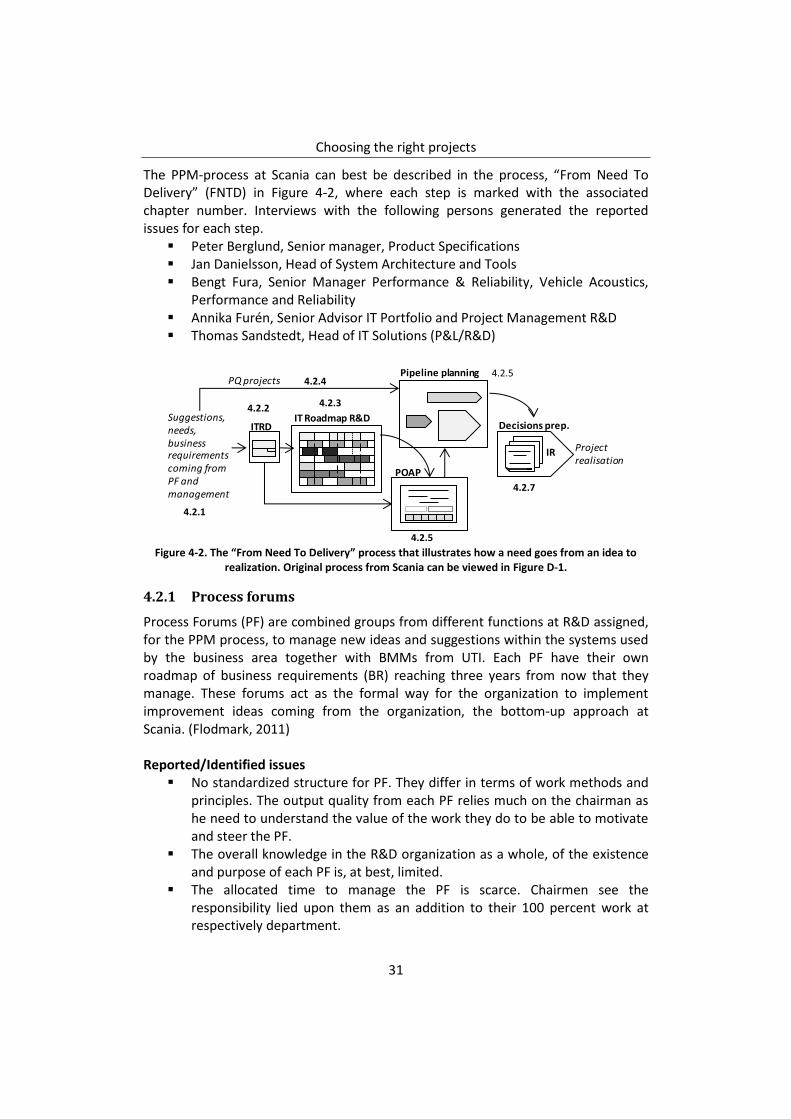
Choosing the right projects
31
The PPM-process at Scania can best be described in the process, “From Need To Delivery” (FNTD) in Figure 4-2, where each step is marked with the associated chapter number. Interviews with the following persons generated the reported issues for each step.
Peter Berglund, Senior manager, Product Specifications Jan Danielsson, Head of System Architecture and Tools Bengt Fura, Senior Manager Performance & Reliability, Vehicle Acoustics,
Performance and Reliability Annika Furén, Senior Advisor IT Portfolio and Project Management R&D Thomas Sandstedt, Head of IT Solutions (P&L/R&D)
Figure 4-2. The “From Need To Delivery” process that illustrates how a need goes from an idea to realization. Original process from Scania can be viewed in Figure D-1.
4.2.1 Process forums
Process Forums (PF) are combined groups from different functions at R&D assigned, for the PPM process, to manage new ideas and suggestions within the systems used by the business area together with BMMs from UTI. Each PF have their own roadmap of business requirements (BR) reaching three years from now that they manage. These forums act as the formal way for the organization to implement improvement ideas coming from the organization, the bottom-up approach at Scania. (Flodmark, 2011) Reported/Identified issues
No standardized structure for PF. They differ in terms of work methods and principles. The output quality from each PF relies much on the chairman as he need to understand the value of the work they do to be able to motivate and steer the PF.
The overall knowledge in the R&D organization as a whole, of the existence and purpose of each PF is, at best, limited.
The allocated time to manage the PF is scarce. Chairmen see the responsibility lied upon them as an addition to their 100 percent work at respectively department.
Project realisation
Suggestions, needs, business requirements coming from PF and management
IT Roadmap R&D
Pipeline planning
POAP
Decisions prep.ITRD
IR
PQ projects
4.2.1
4.2.2 4.2.3
4.2.5
4.2.5
4.2.7
4.2.4
Choosing the right projects
32
4.2.2 Formalized BR
The BR gets formalized through a pre-defined template, called IT Roadmap Description (ITRD). The ITRD has a short description of the BR, a target date for delivery, an expected timeframe in quarters, a categorization, mapping against relevant capabilities and suggested roles, e.g. sponsor, owner and project manager, allocation. (Flodmark, 2011) Reported/Identified issues
Lack of standardized work methods in PF make the quality of information given at the ITRD very mixed. The ITRD are not filled out properly which make them hard to understand for other PFs.
There is no real knowledge about the capabilities among the chairmen. They have heard about the capabilities but do not know the purpose or how to use them.
4.2.3 IT Roadmap R&D
The roadmap has a “Swim lane” for each PF where their ITRDs are placed to visualize their upcoming BR over a three year span. The purpose is to achieve a longer time horizon for planning which BR to realize. The roadmap exist both in physical and digital form, where the physical make it easier for members from other PF to compare and merge similar BRs. The roadmap has existed, in its current form, since December 2010. (Flodmark, 2011) Reported/Identified issues
Differences in quality output from PF reflect on to the roadmap as some “swim lanes” have many ITRDs and some has very few.
The interpreted purpose of the roadmap is reported to differ among the chairmen. Some view it as a “bulletin board” where BR is discussed.
There exist no formal way of selecting which BRs to move forward with to the next stage, creating a POAP. The selection is more driven by delivery date for the BR than long term planning.
4.2.4 PQ decisions/projects
At IT Area R&D, the human resources that create and maintain the systems for the R&D department can also be used when creating solutions/applications that are a part of the actual product, e.g. a fleet management system for controlling a fleet of trucks. Because of this, the resources can also be allocated to product development project, called PQ-projects. They have a higher priority than projects within IT Roadmap R&D. (Thel, 2011) Reported/identified issues
The PQ decisions sidestep the roadmap and the POAP, which make them hard to plan for as they have priority over the regular projects.
Choosing the right projects
33
The governance over these projects undermines the ITPMF as they can allocate resources without permission.
4.2.5 Project On A Page (POAP)
After coordinating the BR with each other and selecting one or more business requirements to satisfy, the template POAP is used to give a more detailed description on what the project will address. The template contains a more specified resource allocation, a short description of how the project will target the problem and consequences if the project is not catered for. The POAP is used to plan the pipeline. (Flodmark, 2011) Reported/identified issues
It is unclear when they move forward from the roadmap to create a POAP. They do not have any recurring activity to do so. It is supposed to be the bridge between the pipeline planning and the roadmap but since the formal way is lacking, the process is perceived as two separate processes, one for BR and the other for projects.
4.2.6 Pipeline planning
The pipeline is used to plan when to start projects within the current fiscal year based on POAPs. The pipeline is limited by a “budget roof” for each quarter. The limit is a pure economical limit, e.g. it does not account for the actual full time employees to allocate to the project.(Flodmark, 2011) Reported/identified issues
When they get a time slot open, they do not have a prioritized list to fill the open spot with, they just select the POAP that fits without considering that maybe there could be more valuable BR in the roadmap.
4.2.7 Project initiation and evaluation matrix
Before a project can begin, a detailed Initiation Report (IE) is created that act as the steering document for the project. It is also the base for an evaluation that the ITPMF does with every project before it starts. The IE contains a detailed project plan, benefits, costs, a Net Present Value calculation (NPV), deliverables, resources allocation, requirements and risks. After a presentation of the IE, the ITPMF scores the project by using the evaluation matrix (EM). The matrix has three main criterions, benefit, strategic fit and risk with a number of corresponding sub-criterions. Then they map benefit plus strategic fit against risk in a graph where already running projects are situated and give a decision to “Go” or “No go” with the evaluated project. Depending on the size of the project, the decision to start can be given by the ITPMF but if larger than 1900 hours, the decision is escalated to the IT Council. (Thel, 2011)
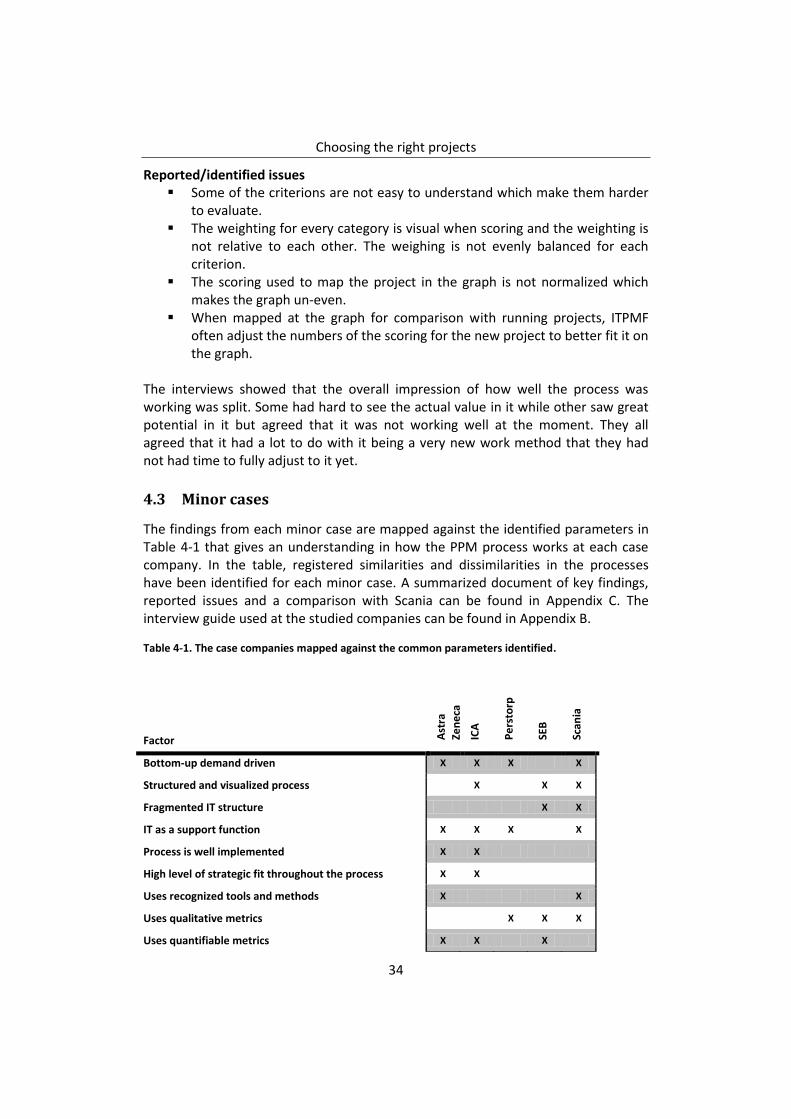
Choosing the right projects
34
Reported/identified issues Some of the criterions are not easy to understand which make them harder
to evaluate. The weighting for every category is visual when scoring and the weighting is
not relative to each other. The weighing is not evenly balanced for each criterion.
The scoring used to map the project in the graph is not normalized which makes the graph un-even.
When mapped at the graph for comparison with running projects, ITPMF often adjust the numbers of the scoring for the new project to better fit it on the graph.
The interviews showed that the overall impression of how well the process was working was split. Some had hard to see the actual value in it while other saw great potential in it but agreed that it was not working well at the moment. They all agreed that it had a lot to do with it being a very new work method that they had not had time to fully adjust to it yet.
4.3 Minor cases
The findings from each minor case are mapped against the identified parameters in Table 4-1 that gives an understanding in how the PPM process works at each case company. In the table, registered similarities and dissimilarities in the processes have been identified for each minor case. A summarized document of key findings, reported issues and a comparison with Scania can be found in Appendix C. The interview guide used at the studied companies can be found in Appendix B.
Table 4-1. The case companies mapped against the common parameters identified.
Factor Ast
ra
Zen
eca
ICA
Pe
rsto
rp
SEB
Scan
ia
Bottom-up demand driven X X X X
Structured and visualized process X X X
Fragmented IT structure X X
IT as a support function X X X X
Process is well implemented X X
High level of strategic fit throughout the process X X
Uses recognized tools and methods X X
Uses qualitative metrics X X X
Uses quantifiable metrics X X X
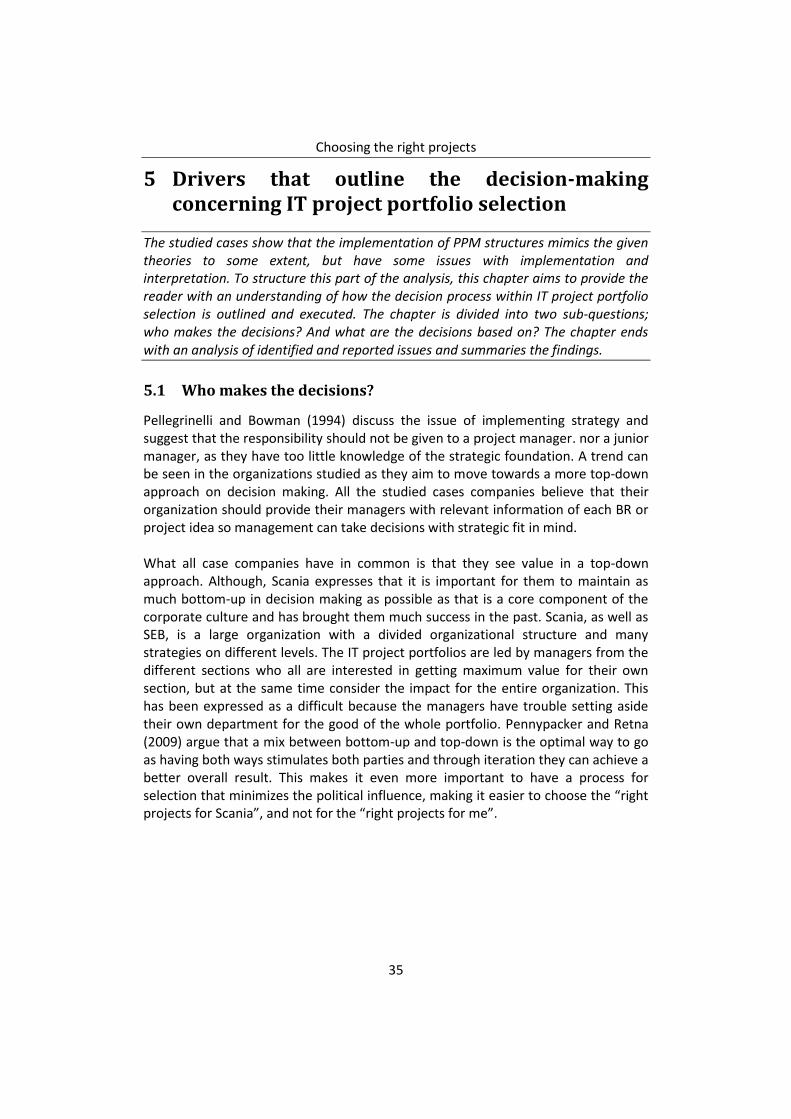
Choosing the right projects
35
5 Drivers that outline the decision-making concerning IT project portfolio selection
The studied cases show that the implementation of PPM structures mimics the given theories to some extent, but have some issues with implementation and interpretation. To structure this part of the analysis, this chapter aims to provide the reader with an understanding of how the decision process within IT project portfolio selection is outlined and executed. The chapter is divided into two sub-questions; who makes the decisions? And what are the decisions based on? The chapter ends with an analysis of identified and reported issues and summaries the findings.
5.1 Who makes the decisions?
Pellegrinelli and Bowman (1994) discuss the issue of implementing strategy and suggest that the responsibility should not be given to a project manager. nor a junior manager, as they have too little knowledge of the strategic foundation. A trend can be seen in the organizations studied as they aim to move towards a more top-down approach on decision making. All the studied cases companies believe that their organization should provide their managers with relevant information of each BR or project idea so management can take decisions with strategic fit in mind. What all case companies have in common is that they see value in a top-down approach. Although, Scania expresses that it is important for them to maintain as much bottom-up in decision making as possible as that is a core component of the corporate culture and has brought them much success in the past. Scania, as well as SEB, is a large organization with a divided organizational structure and many strategies on different levels. The IT project portfolios are led by managers from the different sections who all are interested in getting maximum value for their own section, but at the same time consider the impact for the entire organization. This has been expressed as a difficult because the managers have trouble setting aside their own department for the good of the whole portfolio. Pennypacker and Retna (2009) argue that a mix between bottom-up and top-down is the optimal way to go as having both ways stimulates both parties and through iteration they can achieve a better overall result. This makes it even more important to have a process for selection that minimizes the political influence, making it easier to choose the “right projects for Scania”, and not for the “right projects for me”.
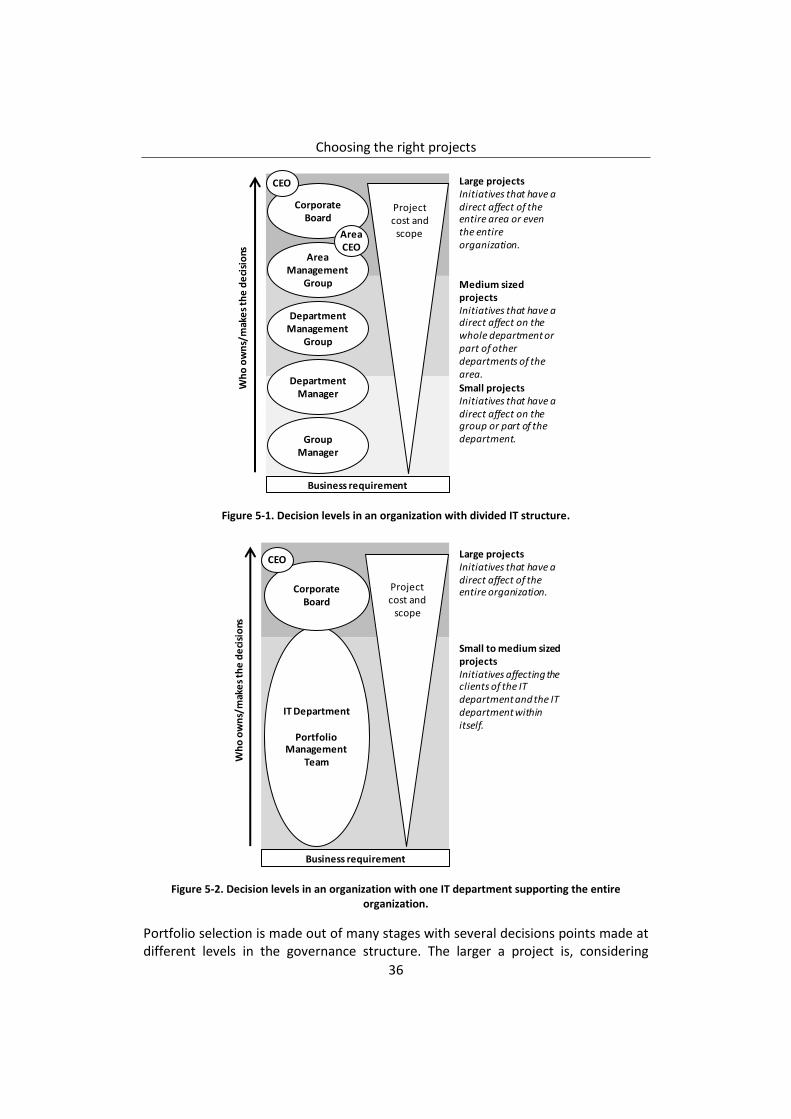
Choosing the right projects
36
Figure 5-1. Decision levels in an organization with divided IT structure.
Figure 5-2. Decision levels in an organization with one IT department supporting the entire organization.
Portfolio selection is made out of many stages with several decisions points made at different levels in the governance structure. The larger a project is, considering
Business requirement
Group Manager
Department Manager
Department Management
Group
Area Management
Group
Corporate Board
Project cost and
scopeArea CEO
CEO
Small projectsInitiatives that have a direct affect on the group or part of the department.
Medium sized projectsInitiatives that have a direct affect on the whole department or part of other departments of the area.
Large projectsInitiatives that have a direct affect of the entire area or even the entire organization.
Wh
oo
wn
s/m
ake
s th
e d
eci
sio
ns
Business requirement
IT Department
Portfolio Management
Team
Corporate Board
Projectcost and
scope
CEO
Wh
oo
wn
s/m
ake
s th
e d
eci
sio
ns
Large projectsInitiatives that have a direct affect of the entire organization.
Small to medium sized projectsInitiatives affecting the clients of the IT department and the IT department within itself.
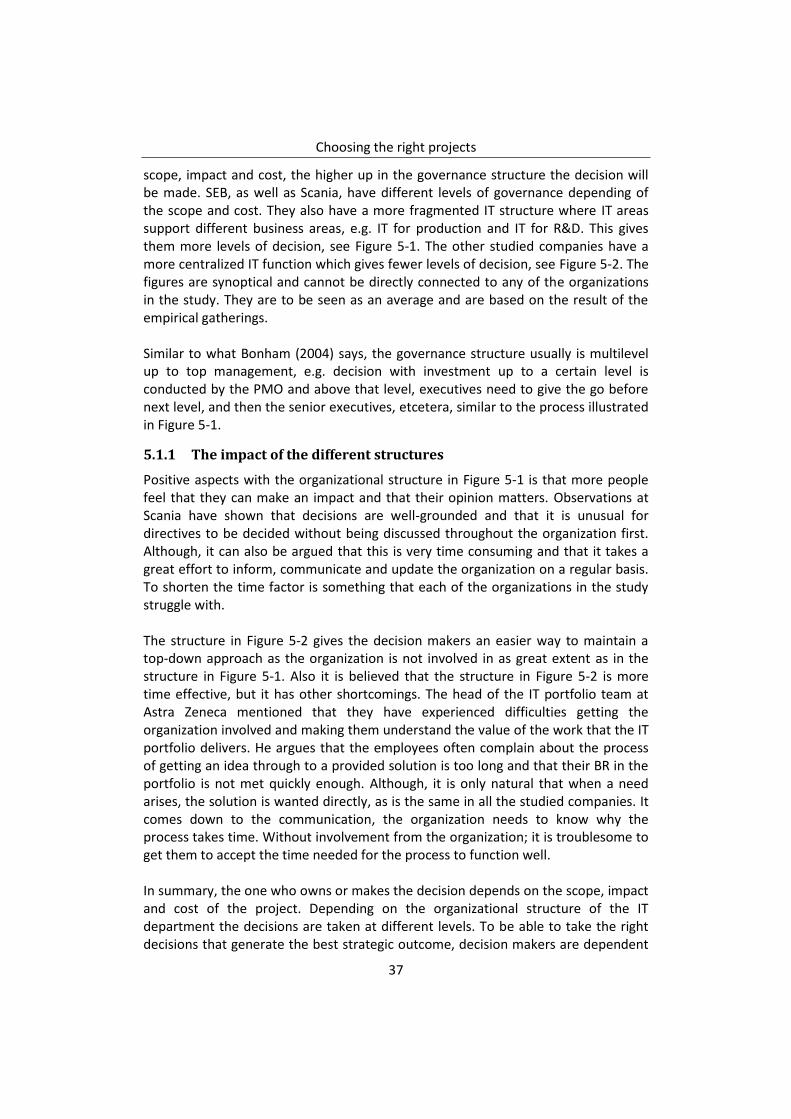
Choosing the right projects
37
scope, impact and cost, the higher up in the governance structure the decision will be made. SEB, as well as Scania, have different levels of governance depending of the scope and cost. They also have a more fragmented IT structure where IT areas support different business areas, e.g. IT for production and IT for R&D. This gives them more levels of decision, see Figure 5-1. The other studied companies have a more centralized IT function which gives fewer levels of decision, see Figure 5-2. The figures are synoptical and cannot be directly connected to any of the organizations in the study. They are to be seen as an average and are based on the result of the empirical gatherings. Similar to what Bonham (2004) says, the governance structure usually is multilevel up to top management, e.g. decision with investment up to a certain level is conducted by the PMO and above that level, executives need to give the go before next level, and then the senior executives, etcetera, similar to the process illustrated in Figure 5-1.
5.1.1 The impact of the different structures
Positive aspects with the organizational structure in Figure 5-1 is that more people feel that they can make an impact and that their opinion matters. Observations at Scania have shown that decisions are well-grounded and that it is unusual for directives to be decided without being discussed throughout the organization first. Although, it can also be argued that this is very time consuming and that it takes a great effort to inform, communicate and update the organization on a regular basis. To shorten the time factor is something that each of the organizations in the study struggle with. The structure in Figure 5-2 gives the decision makers an easier way to maintain a top-down approach as the organization is not involved in as great extent as in the structure in Figure 5-1. Also it is believed that the structure in Figure 5-2 is more time effective, but it has other shortcomings. The head of the IT portfolio team at Astra Zeneca mentioned that they have experienced difficulties getting the organization involved and making them understand the value of the work that the IT portfolio delivers. He argues that the employees often complain about the process of getting an idea through to a provided solution is too long and that their BR in the portfolio is not met quickly enough. Although, it is only natural that when a need arises, the solution is wanted directly, as is the same in all the studied companies. It comes down to the communication, the organization needs to know why the process takes time. Without involvement from the organization; it is troublesome to get them to accept the time needed for the process to function well. In summary, the one who owns or makes the decision depends on the scope, impact and cost of the project. Depending on the organizational structure of the IT department the decisions are taken at different levels. To be able to take the right decisions that generate the best strategic outcome, decision makers are dependent

Choosing the right projects
38
upon the facts surrounding the given parameters that the organization uses as base for the decisions. Both type of organizational structure given in Figure 5-1 and Figure 5-2 have trouble with their processes being perceived as too tedious and time consuming.
5.2 What are the decisions based on?
By reviewing both the theoretical and empirical framework it is easy to see that value, risk and strategic fit are parameters that both frameworks consider important when making decisions. Bonham (2004) argues that selection methods should be based on multiple criterions to better reflect the different aspects of the project and that the criterions should be both qualitative and quantitative parameters. In 3.1.3, Pennypacker and Retna’s (2009) four areas of valuation criterions; Value, Strategy, Balance and Interdependence, are defined to classify the most common criterions used. How these parameters are valued or weighted against each other varies between the organizations in the study, but equivalent to them all are how hard they find it to balance between just qualitative and quantitative parameters.
5.2.1 Value (e.g. Financial metrics, ROI, NPV, etcetera)
The study shows that this area is considered differently among the organizations and at different stages in the PPM process. For Scania, the value area is not considered before the IE is conducted which is late in the process. Although the IE contains a NPV, it is not used when prioritizing the pipeline. For SEB this area is significant and evaluated at an early stage. Astra Zeneca uses an unfolding method where the area is considered early, at first at a level of uncertainty that is high then declining throughout the process. The closer you get to project realization the stricter the uncertainty level is. No organization want to invest without financial return, but for ICA Sweden the value area has not been brought to light before the financial crisis, in 2008, when they for the first time experienced working with low financial resources. The area was valued before then but not to the same extent and projects needed to be harder measured against it. ICA Sweden creates large business cases with many parameters, including the value area, early in the process. Whether or not the value area is important, the study has shown that it is and that all organizations value against it at some stage in their processes. The question is if it is of importance whether it is considered early or late in the process? The study has not given any indication of whether or not organizations gain on placing it early or late, but if used early, the organization might lose many good BR just because the BR cannot show a positive financial value. The issue of qualitative vs. quantitative facts is important here, where often qualitative facts are easier to explain at an early stage of a BR.
Choosing the right projects
39
5.2.2 Strategy (e.g. supporting corporate strategy, strategic fit, etcetera)
This area is stated as highly valuable for each organization in the study. Scania value each project against strategic fit in the evaluation matrix late in the process, similar to SEB, Perstorp and Astra Zeneca. ICA Sweden work with business architects that are responsible for making sure that the strategy is considered in the discussions and when decisions are made. An identified issue within this area is to understand what the strategy really says and how the strategic fit should be valued against the other areas. All organizations say that it is the major area to consider, still many issues exists. What they say is not always how they do it. As discussed in 5.1, the strategic fit risk to be lost if not addressed in a well manner where set paradigms are put aside so that old structures do not compromise the new strategic incentives. Observations at Scania have shown that ITPMF has different opinions of what the strategy says and which strategy the projects are mapped against in an effort to align them. The IT department standing between R&D and corporate IT has no stated strategy of its own, hence why the opinions are split and the weighting, prioritizing and valuation tend to not be equal nor constant.
5.2.3 Balance (e.g. Risk, duration, demand of resource, etcetera)
The balance area is considered by all organizations in the study and viewed as highly important when decisions are made. This area decides on which level of management that the decisions need to be made as it states the scope and possible impact of the BR or project. The higher the output of the balance area is, the higher the level of management gets involved, see Figure 5-1 and Figure 5-2. Scania, SEB and ICA Sweden expressed that they are working to find better ways to address this area. The risk parameter is hard to define early in a BR and different types of risk were estimated at different stages of the process. At Astra Zeneca risk mitigation, i.e. risk that you delete by carrying out the project, is estimated early in the process while project risk, i.e. the risk the project itself, is estimated later. Scania, SEB, ICA Sweden and Perstorp all focus on the project risk and little effort is assigned to risk mitigation. The duration parameter is viewed upon a bit differently by the organizations in the study. It is often hard to estimate for how long the project needs to be run and the parameter is highly dependent of the other parameters of the balance area. The study showed that duration is often a parameter that is neglected, “It is hard to estimate and you never know what will happen”, is an explanation given by some of the interviewees. When the parameter is estimated, no follow up is made to validate the estimate.
Choosing the right projects
40
5.2.4 Interdependence (e.g. Linkage to other projects)
To be able to see the “big picture” and enable a strategic fit, it is important to see how the BR or the project affects other requirements or projects. This can often be hard due to high complexity. Pellegrinelli and Bowman (1994) mean that by introducing the programme approach, projects will easier be aligned. The shape of strategic initiatives is easier to see and understand for all involved which gives a better basis for acceptance. By working with the roadmap, Scania strive to achieve a common view of the overall BR of the IT Area R&D. In theory, it works, but the issue lies in how to make ITPMF understand the value in seeing how their BR links to the other BRs on the roadmap. The mindset for the ITPMF need to be similar for each member, so their actions are what is best for Scania R&D. Also ICA Sweden and SEB find it hard to get the portfolio board to think cross functional.
5.3 Reported and identified issues
All organizations in the study have a hard time implementing new strategic initiatives due to set paradigms and so called political discussions. The processes were viewed as highly time consuming and often the manager with best rhetorical competence got his or her project cleared. The decision was then depending on the willingness to fight for it, rather than being strategically right for the organization. Considering what Pellegrinelli and Bowman (1994) discuss regarding the implications of implementing strategy through set paradigms, the empirical study has shown that the four conflicts and difficulties that can arise from implementing strategy through paradigms, can be identified at some level of all the studied organizations, especially at Scania as followed:
Smooth flow of operations vs. Step change to seize opportunity The members of the ITPMF do not always feel the information given at ITPMF is relevant to their part of the organization, which affects their contribution. Other companies struggle with getting the PMO to think and act cross-functional, where they have their company as a whole in mind when prioritizing instead of fighting for their own projects.
Efficient execution of task vs. Securing of desired benefits The problem with IT projects is that they can be hard to calculate tangible benefits earned directly from them, making them hard to justify. As the benefit is realized through steps within the organization, they can be hard to pinpoint. The weak prioritization process used today does not give a secure way of choosing the right projects to move forward with. Tangible benefits beat intangible benefits.
Current way of doing business vs. Future way of doing business Scania work hard with developing new methods and structures that will eliminate waste and bring out ultimate benefits. As to this point, it is not
Choosing the right projects
41
believed that this could lead to conflict or any other difficulties. Although they are not hostile for change, the time aspect needs to be taken into consideration since it is observed that new methods take a long time to implement well.
Established distribution of power vs. New distribution of power Today the IT PPM process involves many different individuals at many different levels. Observations have shown that the political discussions influence the decision making at Scania, setting aside strategic initiatives. Good presentation skills and close relationships to decision makers play an important role.
5.4 Conclusion
This chapter has shown that what the organizations aim to measure and outline their decisions making with, is very similar to what theory recommends. The issue of complexity and benefit identification, both qualitative and quantitative, are what most companies struggle with, as well as getting the PMO to think cross functional. There is also an issue when evaluating the strategic fit as the strategy might not be broken down properly or not applicable for the purpose in the PPM process. Each organization need to find their own weighting between the four areas; value, balance, strategy and interdependence as different areas are more or less important to different organizations and also depending on what happens in the surrounding world. Whatever tools or methods chosen, they need to be flexible and easy to analyze and restructure to match the strategic shifts.

Choosing the right projects
42

Choosing the right projects
43
6 A process for Scania R&D and the IT Project Portfolio selection
This chapter aims to provide the reader with a process where the current PPM process implemented at Scania is analyzed with the theories given in chapter 3 and the findings from chapter 5 to establish where the issues lies and why they exist. Alterations to the process aim to make it more transparent for every involved party, structure the information flow in a way that minimizes unnecessary information before each decision and create a more unified flow from an idea to the realized project.
6.1 Scania today
Today, Scania’s PPM process, see Figure 4-2, is up and running but compared to theories, lacks a few important components. The perceived gap in the FNTD is one of them. This gap exists because there is no clear way for a BR to get from the roadmap to the pipeline and POAP. Archer and Ghasemzadeh (1999) suggest that a unified flow for the process is an important step to make the process logical and fully utilized. The gap exists mainly because the implementations of the roadmap is newly established at Scania and the purpose might not have been explained thoroughly, although the formal way is lacking when moving a BR into the POAP stage.
6.1.1 Prioritization, balance and selection
At present, ITMPF do not use a method to prioritize their whole portfolio. Instead they select projects based on the individual prioritization order from the PF and the resources available. The current focus is short term as they look at the roadmap to see what they must start to make sure it finishes on time. A central prioritization should be conducted, as Bonham (2004) and Pennypacker and Retna (2009) suggest, minimizing the political influence in this process and creating a more long term plan. There are several advantages for using a structured prioritization model for the whole portfolio. For example, a more objective ground for selection and a formalized way to ensure that the selection is based same principles. The roadmap visualizes the upcoming BR, with the use of the template ITRD, over a three year span and works well for grouping similar BRs from different PF. However, the information the ITRD is lacking because of unclear ownership from within the PF. This poses a problem, as the chairman for respectively PF can have trouble knowing the full intention of a BR. The responsibility should be clearer on who owns and fills out the ITRD and this need to be addressed by each chairman before they add it to the roadmap. For the process to be efficient, the correct information and the correct amount of information needs to be present at every decision point. By coordinating the responsible individual for each step along the process will add transparency (Wei,
Choosing the right projects
44
2009). Also, using a prioritization model to evaluate POAP could bridge the gap between the roadmap and the pipeline. The balancing today is only done when planning the portfolio and there, it is only based on the budget limits. They take no consideration to the type of project, whether it is an incremental change or if it is a completely new system that needs to be implemented. Also, the manpower available is not considered. This poses a threat to the long term strategy as it may favor the projects that have a high and fast return of investment, as Bonham (2004) mentions. Without proper balance, the human resources allocation risk being clogged down which can cause chain-reactions across the portfolio. The EM is their current way to score the projects. The issue with this comparison is that they only use it to compare the scored project idea to already running projects, not to other potential projects. The chosen criterion does intend to capture the most commonly criterions, stated by Cooper et. al. (2001), Bonham (2004) and Pennypacker and Retna (2009). Although, the implementation of the criterion is not coherent to what Cooper states about them being easy to understand and interpret, as ITPMF have trouble using them. This can explain why the ITPMF have difficulties to interpret the result of the first round of scoring and why they thereafter adjust the score to better fit their thoughts about the project. They are adjusting the score to better fit the graph and do not trust their original scoring. Doing this consequently will lead to a graph where all projects are nested to each other, since the discussion of where the project should be placed at the graph, will be more subjectively influenced. This impairs the whole idea of the scoring as they do not trust the initial score. Another identified issue in the empirics is how the different criterions are weighted today in the EM. First, the weighting for each criterion is known, making it easier to manipulate the result. Second, the weighting is not balanced between the criterions, benefit, strategic fit and risk. The sub-criterions for strategic fit have all been given the weight 2 out of 10. This can be compared to that two out of five sub-criterions for benefit have been given the weight 10. This makes it easier to score high on benefit, which might give a too optimistic score and signal that strategic fit is not that important for this portfolio. It also indicates that they have trouble with the interpretation of strategic fit. This could lead to that projects that contribute well to the long term strategy plan, but not offer a high return, can be canceled.
6.1.2 Ownership and governance
The issue with the overall process being perceived as divided causes disturbances in the flow. By using stages as Pennypacker and Retna (2009) suggest, the roles within the PPM process can be defined for each stage, making the ownership of the BR more transparent. The intention of the PF and the ITPMF is unknown to the rest of the R&D organization at Scania. This is regarded as a hinder for ITPMF to carry out

Choosing the right projects
45
their work properly because it enables a way to sidestep the process. This is the reality with the PQ-decisions, as they can go directly into the pipeline without going through a PF. This is a complicated situation as the manpower responsible for support to R&D also can be used within R&D to develop IT products. Even if the theoretical view is that ITPMF should control their resources, this is not addressed in this thesis. It needs to be handled by the R&D management.
6.1.3 Long term view
Scania have chosen to use 13 capabilities, describing the different types of IT environments/areas used at Scania, to connect projects with strategy. Mapping the BR against the capabilities gives ITPMF an indication of which areas the project will affect. As the issue of strategy alignment in the IT project portfolio today is seen as very complex the responsibility of implementing it is pushed aside by the PF managers and given to the BMMs. The chairmen’s feelings towards the capabilities as a way of creating strategy alignment might be based on low or no knowledge of them and they might not see the top-down perspective that the capabilities are intended for. As stated in 5.1, the top-down perspective on strategic fit should be owed by senior managers as they have a better understanding of how the strategy should be valued. Therefore the ownership of prioritizing which capabilities that are most strategically right should be selected by ITC and not ITPMF. That the PMO should be cross-functional, as it is at Scania, is supported by Kendall and Rollins (2003). When the team is cross functional, they will utilize information from every part of the organization. They will also bring the need they have to the table which will spark them to participate; as otherwise, somebody else will have their need satisfied instead of themselves. This can also be an issue if they have trouble putting the organizations best interest first, which is something that was reported at most of the studied companies.
6.2 Addressing the process at Scania
By comparing the PPM process at Scania with the theories presented by Bonham (2004), Pennypacker and Retna (2009) and Kendall and Rollins (2003) together with the other studied companies, some alterations to the Scania process could be the solution to their current issues. The suggestion to solve these identified issues at Scania is a remodeling of their current process to better bridge the gap between the roadmap and the pipeline. This way, the responsibility of ownership will be clearer and the refinements of information will be more efficient. The remodeled process is viewed in Figure 6-1. The design of the suggested alteration to the process is made with the selected Lean principles in 3.3.1 as the foundation and is mapped against them by referencing to them as (LP: X).
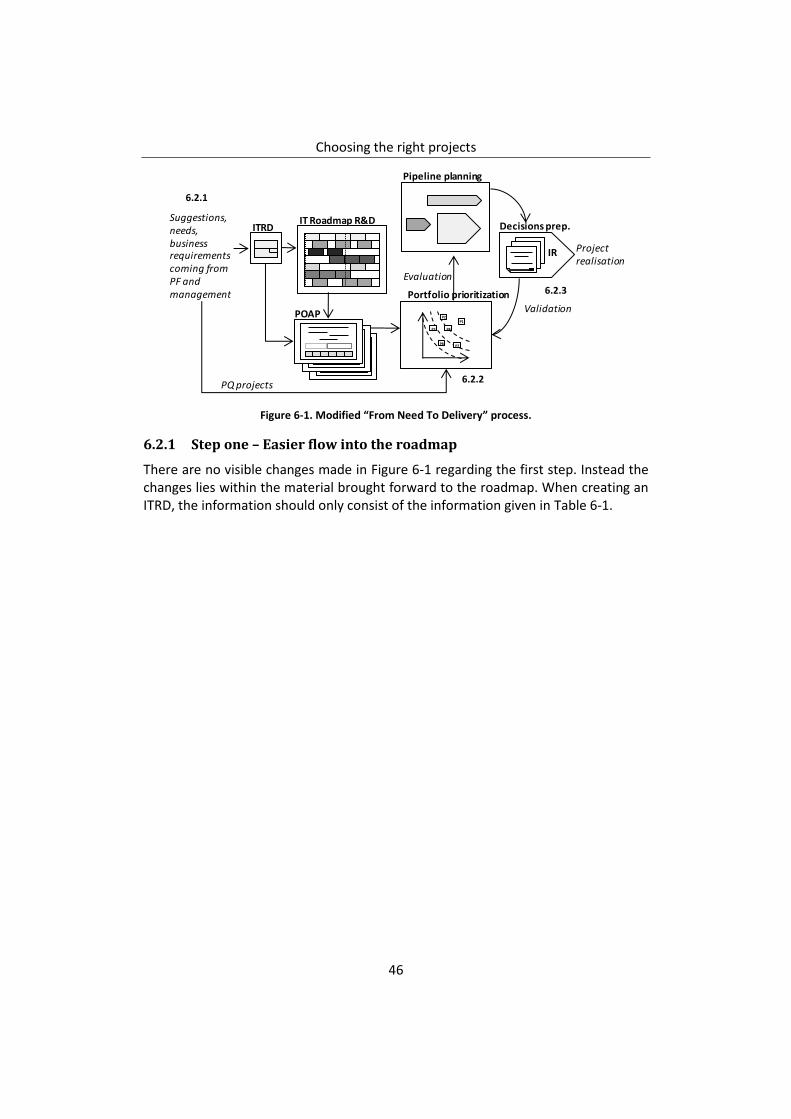
Choosing the right projects
46
Figure 6-1. Modified “From Need To Delivery” process.
6.2.1 Step one – Easier flow into the roadmap
There are no visible changes made in Figure 6-1 regarding the first step. Instead the changes lies within the material brought forward to the roadmap. When creating an ITRD, the information should only consist of the information given in Table 6-1.
Suggestions, needs, business requirements coming from PF and management
IT Roadmap R&D
Pipeline planning
POAP
Decisions prep.ITRD
Project realisation
IR
Portfolio prioritization
Validation
Evaluation
P2
P3 P4
P7
P1
P8
PQ projects
6.2.1
6.2.2
6.2.3
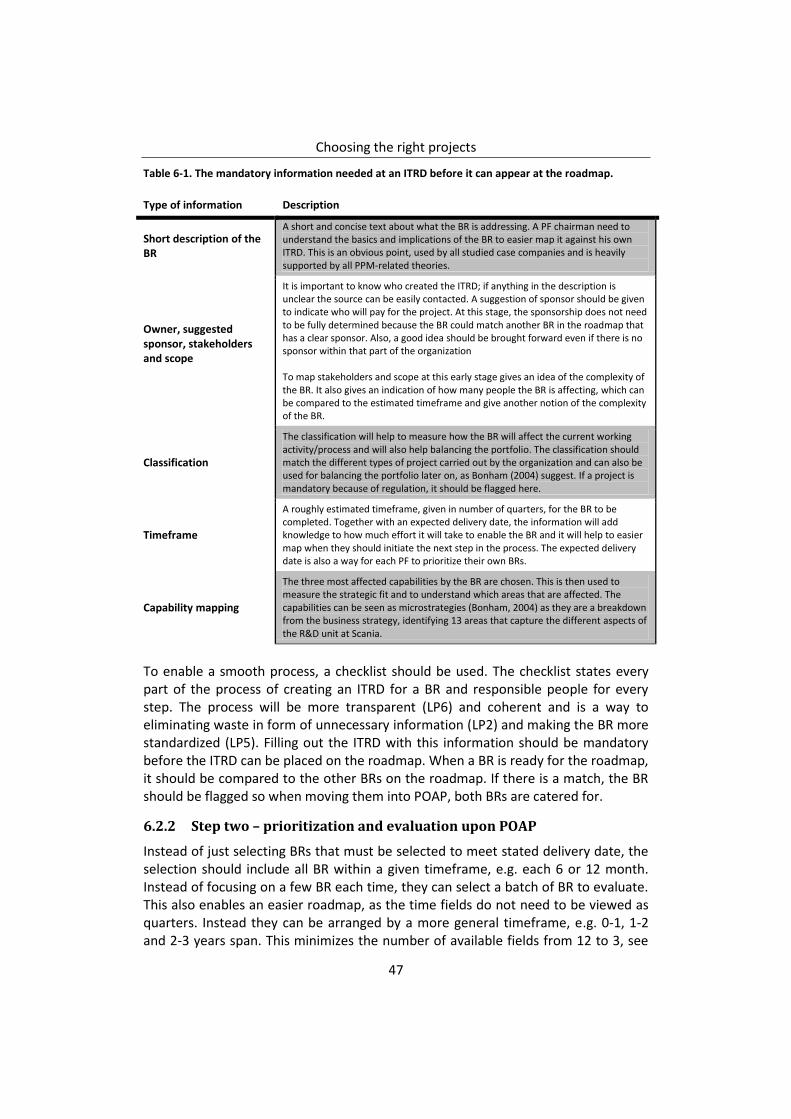
Choosing the right projects
47
Table 6-1. The mandatory information needed at an ITRD before it can appear at the roadmap.
Type of information Description
Short description of the BR
A short and concise text about what the BR is addressing. A PF chairman need to understand the basics and implications of the BR to easier map it against his own ITRD. This is an obvious point, used by all studied case companies and is heavily supported by all PPM-related theories.
Owner, suggested sponsor, stakeholders and scope
It is important to know who created the ITRD; if anything in the description is unclear the source can be easily contacted. A suggestion of sponsor should be given to indicate who will pay for the project. At this stage, the sponsorship does not need to be fully determined because the BR could match another BR in the roadmap that has a clear sponsor. Also, a good idea should be brought forward even if there is no sponsor within that part of the organization To map stakeholders and scope at this early stage gives an idea of the complexity of the BR. It also gives an indication of how many people the BR is affecting, which can be compared to the estimated timeframe and give another notion of the complexity of the BR.
Classification
The classification will help to measure how the BR will affect the current working activity/process and will also help balancing the portfolio. The classification should match the different types of project carried out by the organization and can also be used for balancing the portfolio later on, as Bonham (2004) suggest. If a project is mandatory because of regulation, it should be flagged here.
Timeframe
A roughly estimated timeframe, given in number of quarters, for the BR to be completed. Together with an expected delivery date, the information will add knowledge to how much effort it will take to enable the BR and it will help to easier map when they should initiate the next step in the process. The expected delivery date is also a way for each PF to prioritize their own BRs.
Capability mapping
The three most affected capabilities by the BR are chosen. This is then used to measure the strategic fit and to understand which areas that are affected. The capabilities can be seen as microstrategies (Bonham, 2004) as they are a breakdown from the business strategy, identifying 13 areas that capture the different aspects of the R&D unit at Scania.
To enable a smooth process, a checklist should be used. The checklist states every part of the process of creating an ITRD for a BR and responsible people for every step. The process will be more transparent (LP6) and coherent and is a way to eliminating waste in form of unnecessary information (LP2) and making the BR more standardized (LP5). Filling out the ITRD with this information should be mandatory before the ITRD can be placed on the roadmap. When a BR is ready for the roadmap, it should be compared to the other BRs on the roadmap. If there is a match, the BR should be flagged so when moving them into POAP, both BRs are catered for.
6.2.2 Step two – prioritization and evaluation upon POAP
Instead of just selecting BRs that must be selected to meet stated delivery date, the selection should include all BR within a given timeframe, e.g. each 6 or 12 month. Instead of focusing on a few BR each time, they can select a batch of BR to evaluate. This also enables an easier roadmap, as the time fields do not need to be viewed as quarters. Instead they can be arranged by a more general timeframe, e.g. 0-1, 1-2 and 2-3 years span. This minimizes the number of available fields from 12 to 3, see
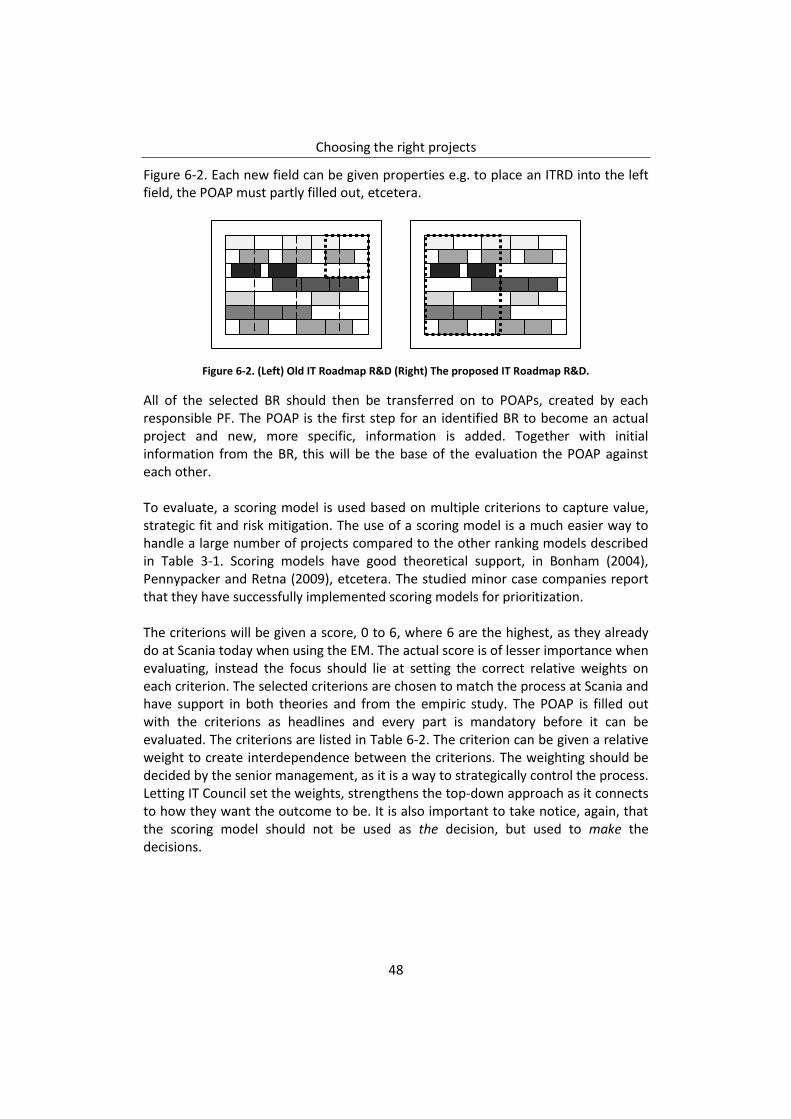
Choosing the right projects
48
Figure 6-2. Each new field can be given properties e.g. to place an ITRD into the left field, the POAP must partly filled out, etcetera.
Figure 6-2. (Left) Old IT Roadmap R&D (Right) The proposed IT Roadmap R&D.
All of the selected BR should then be transferred on to POAPs, created by each responsible PF. The POAP is the first step for an identified BR to become an actual project and new, more specific, information is added. Together with initial information from the BR, this will be the base of the evaluation the POAP against each other. To evaluate, a scoring model is used based on multiple criterions to capture value, strategic fit and risk mitigation. The use of a scoring model is a much easier way to handle a large number of projects compared to the other ranking models described in Table 3-1. Scoring models have good theoretical support, in Bonham (2004), Pennypacker and Retna (2009), etcetera. The studied minor case companies report that they have successfully implemented scoring models for prioritization. The criterions will be given a score, 0 to 6, where 6 are the highest, as they already do at Scania today when using the EM. The actual score is of lesser importance when evaluating, instead the focus should lie at setting the correct relative weights on each criterion. The selected criterions are chosen to match the process at Scania and have support in both theories and from the empiric study. The POAP is filled out with the criterions as headlines and every part is mandatory before it can be evaluated. The criterions are listed in Table 6-2. The criterion can be given a relative weight to create interdependence between the criterions. The weighting should be decided by the senior management, as it is a way to strategically control the process. Letting IT Council set the weights, strengthens the top-down approach as it connects to how they want the outcome to be. It is also important to take notice, again, that the scoring model should not be used as the decision, but used to make the decisions.

Choosing the right projects
49
Table 6-2. The criterions used by the scoring model to give decision support.
Criterion Description
Value
They should both strive to estimate quantifiable measures of added value but since this is in an early stage, estimating can be troublesome. The information on the POAP should focus on short sentences, describing the added value and the impact of the suggested solution. The addressed values can be both tangible and intangible and both for the customer and for the organization. At this stage, the information is still limited, a financial model is not appropriate because of high uncertainty. Instead of mapping against the end customer, e.g. the one buying a truck from Scania, the focus should be on the internal customer. Keeping them in focus while striving to meet their demand will in turn let them focusing on creating the best added value to the end customer.
Strategic fit
The strategic fit is based on the capabilities mapped from the BR. The capabilities should be prioritized by the IT Council as they are at a high level and are capable give the proper directions concerning strategic fit as Pellegrinelli and Bowman (1994) suggest. The top management should on a yearly basis define the prioritized list of capabilities to make sure they follow the current strategy. This enables them to steer the portfolio by targeting the projects that currently best fitted according to strategy. Doing a revision each year enables them to alter the course if needed or if external factors inflicts. ITPMF will then use the prioritized list of capabilities score the POAPs. To map stakeholders and scope at this early stage gives an idea of the complexity of the BR. It gives an indication of how many people the BR is affecting, which can be compared to the estimated timeframe and give a notion of the complexity of the BR.
Risk Mitigation
At this early stage, it is easier to determine the risk of not doing the project than determine the risk connected to the project itself and will be handled later, when creating the initiation report. By describing the consequences of not catering the BR on both short term and long term, ITPMF will be able to assess the necessity of the project. As found at Astra Zeneca, this works well when assessing the right projects early in the process.
By combining the scores of value and strategic fit, the POAPs can be mapped out against Risk Mitigation in a graph, as visualized in Figure 6-3. The projects nearest the top right corner are the most valuable projects. The graph acts as decision support when prioritizing the pipeline. The information regarding the estimated timeframe and expected delivery date from the BR is used to balance the pipeline. When two POAP have earned similar scores, it is better to complete the one with the closest delivery date. When the POAPs have been prioritized and pipeline planned, ITPMF will know the initiation dates for every project idea within the following 6-12 months.
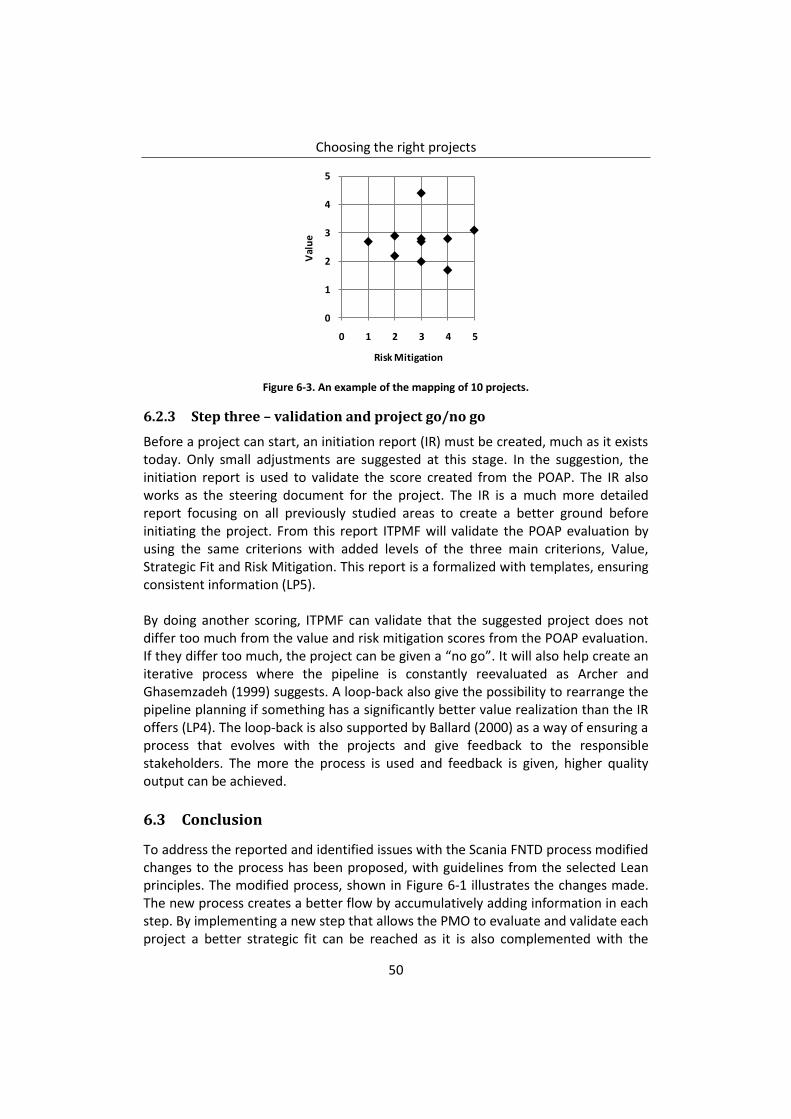
Choosing the right projects
50
Figure 6-3. An example of the mapping of 10 projects.
6.2.3 Step three – validation and project go/no go
Before a project can start, an initiation report (IR) must be created, much as it exists today. Only small adjustments are suggested at this stage. In the suggestion, the initiation report is used to validate the score created from the POAP. The IR also works as the steering document for the project. The IR is a much more detailed report focusing on all previously studied areas to create a better ground before initiating the project. From this report ITPMF will validate the POAP evaluation by using the same criterions with added levels of the three main criterions, Value, Strategic Fit and Risk Mitigation. This report is a formalized with templates, ensuring consistent information (LP5). By doing another scoring, ITPMF can validate that the suggested project does not differ too much from the value and risk mitigation scores from the POAP evaluation. If they differ too much, the project can be given a “no go”. It will also help create an iterative process where the pipeline is constantly reevaluated as Archer and Ghasemzadeh (1999) suggests. A loop-back also give the possibility to rearrange the pipeline planning if something has a significantly better value realization than the IR offers (LP4). The loop-back is also supported by Ballard (2000) as a way of ensuring a process that evolves with the projects and give feedback to the responsible stakeholders. The more the process is used and feedback is given, higher quality output can be achieved.
6.3 Conclusion
To address the reported and identified issues with the Scania FNTD process modified changes to the process has been proposed, with guidelines from the selected Lean principles. The modified process, shown in Figure 6-1 illustrates the changes made. The new process creates a better flow by accumulatively adding information in each step. By implementing a new step that allows the PMO to evaluate and validate each project a better strategic fit can be reached as it is also complemented with the
0
1
2
3
4
5
0 1 2 3 4 5
Val
ue
Risk Mitigation

Choosing the right projects
51
mapping of the given strategic capabilities. Information that flows through the process becomes more standardized and generates a more distinct communication, prioritizing and strategic fit throughout the process.

Choosing the right projects
52
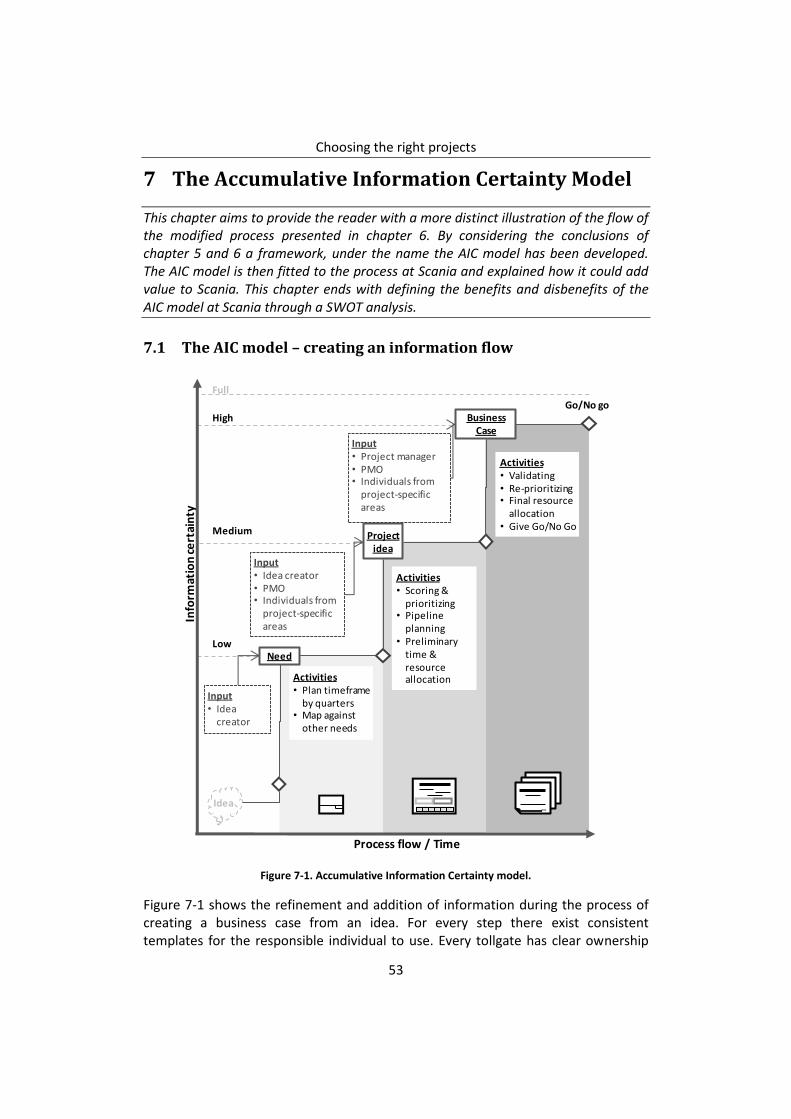
Choosing the right projects
53
7 The Accumulative Information Certainty Model
This chapter aims to provide the reader with a more distinct illustration of the flow of the modified process presented in chapter 6. By considering the conclusions of chapter 5 and 6 a framework, under the name the AIC model has been developed. The AIC model is then fitted to the process at Scania and explained how it could add value to Scania. This chapter ends with defining the benefits and disbenefits of the AIC model at Scania through a SWOT analysis.
7.1 The AIC model – creating an information flow
Figure 7-1. Accumulative Information Certainty model.
Figure 7-1 shows the refinement and addition of information during the process of creating a business case from an idea. For every step there exist consistent templates for the responsible individual to use. Every tollgate has clear ownership
Process flow / Time
Info
rmat
ion
ce
rtai
nty
Business Case
Activities• Plan timeframe
by quarters• Map against
other needs
Need
Input• Idea
creator
Project idea
Input• Idea creator• PMO• Individuals from
project-specific areas
Activities• Scoring &
prioritizing• Pipeline
planning• Preliminary
time & resource allocation
Input• Project manager• PMO• Individuals from
project-specific areas
Activities• Validating• Re-prioritizing• Final resource
allocation• Give Go/No Go
Full
Low
Medium
HighGo/No go
Idea
Choosing the right projects
54
and the input for each step is listed. The model also expresses the differences in certainty in the information at each step and it act as guidance along the process. The business case in the end of the process will act as the steering document for the project. As the process is perceived as time-consuming, not only at Scania but at the other studied firms as well, the AIC model can be used to describe why every step is necessary to the involved parties. The model enables waste elimination in from of unnecessary information and elucidates the ownership of each document along the way to make the process more efficient. Responsible individuals at each level will add their specific information to the case, continuously building the case. As each level demand company-specific criterions for evaluating, the decision base needed is clearer to the organization. This makes sure that no unnecessary information is present for the evaluation and promote that the same type of information is available for every need, project idea or business case. The model will support the bottom up approach better as it will ease the amount of information provided by the person who came up with the idea as the information at an early stage need just to be so precise that it can be understood by the responsible persons at the first decision point. Being able to connect and compare different needs from the organization will allow a grouping of needs at an early stage, enabling a more balanced scope for the catering project. The use of Lean principles for services, assist well in creating a continuous flow in the model. The focus on the value stream (LP1) throughout the AIC model illustrates the positive effects of using Lean in the PPM world. As information today is easily generated, the “right” information can get lost in the process. Having clear templates that covers each step in the model make it easier for the responsible to supply the right information. The model also let a preliminary evaluation be created at an earlier level where the indications of what the project idea could be worth in form of strategic fit and benefit is evaluated. As this preliminary scoring will be reevaluated and validated at the end when the full business case is finished, the organization will have a feedback loop that will enable learning. It will also be easier to reprioritize the pipeline as new project ideas with potential is found at an early stage.

Choosing the right projects
55
7.2 AIC and Scania
Figure 7-2. The AIC model applied to Scania.
Figure 7-2 has been altered to match the IT Area R&D at Scania to visualize how it will work over different decision makers. with the suggested alterations in the FNTD process (see 6.2.1, 6.2.2 and 6.2.3); Scania will get a more unified process. The perceived gap between the roadmap and the pipeline planning will be bridged with an earlier scoring of POAP and the prioritization that comes from the scoring. The roadmap will be easier to use with fewer fields to map on and by having a fixed interval for creating POAPs and score them creates clear deadlines which will give comprehensible routines. The responsibility for each step is clearer defined which will give better governance for each activity and for the whole process. A top-down perspective will be enabled as higher management will be able to select which
Process flow / Time
Info
rmat
ion
ce
rtai
nty
IR
Activities• Place BR in the
right timeframe on the roadmap
• Map BR against other BRs from other ”swim lanes”
ITRD
Input• Idea
creator• PF• BMM
POAP
Input• Idea creator• PF, PQ or other• BMM
Activities• Scoring &
prioritizing• Pipeline
planning• Preliminary
time & resource allocation
Input• PF, PQ or other BU• UTIX or UTI
Activities• Validating• Re-prioritizing• Final resource
allocation• Give Go/No Go
Full
Low
Medium
HighGo/No go
BR
Process Forums
IT Portfolio Management Forum
IT Council
Choosing the right projects
56
capabilities to prioritize and control the weighting of scoring criterions. This addition will create a better balance between top-down and bottom-up contribution and control over the roadmap. The capabilities need to be communicated to the ITPMF of their importance for the strategic fit as well as communicated to the PF. By assuring that they know the meaning of the capabilities, the process of mapping them will be easier to do. As Lean thinking is applied in many business areas at Scania, the use of Lean principles for services, assist well in creating a continuous flow in the updated process. Since Scania are familiar with the concept, presenting these proposed alterations might help them implement the solutions. Also the process is regarded to fit alongside their current form of work method. The concept of Lean works well for processes even if the original thought is for production environment. With an earlier scoring activity, the PQ decisions will be better handled as they can be scored against the POAPs in the pipeline instead of only already running projects. It will also be easier to reorganize the pipeline and resource allocation to better cater the PQ decisions and mitigate the impact. However, PQ decisions are still an issue for ITPMF as they are allowed to sidestep the whole process, an issue that cannot be fully addressed with the altered FNTD process.
7.3 Benefits and disbenefits with the AIC model
By implementing a process with guidelines from the AIC model numerous benefits can be gained, but as Ward & Daniel (2006) express, it is important to consider the disbenefits of the implementations as well. The SWOT-analysis presents the potential benefits and disbenefits of the suggested method. Both primary and secondary benefits have been evaluated as well as the internal and external factors.
Strengths
A more distinct flow between idea and pipeline planning – By using an accumulative method, the flow clarifies to the individuals involved how the information is refined. It details how information provided at an early level is used later in the process.
Long-term planning – With a more active pipeline planning, continuously adapting to the outcome of the evaluation and validation of the potential projects companies get a wider overall view of the status of running projects as well as new ones coming in.
Clearer criterions to evaluate against – Gives a more accurate base for evaluation where the process actors feel more secure in their evaluation of the projects. They know what they are matching the projects against which make the prioritizing more effective.
A stronger strategic fit – Related to the strength above (clearer criterions to evaluate against), a strategic fit is easier to secure when the actors get more distinct criterions to map against.
Choosing the right projects
57
Easy to adjust without major reconstructions – The model is built as a frame where criterions are added based on desired outcome for the company. The process becomes alive and adapts to the surroundings and can be used at all times as long as the criterions and capabilities are up to beat with the outside world and goals for the organization.
Clearer ownership – Each activity will have clear ownership and it will be easier to establish responsibility for creating each document. The use of the templates give standardized material to evaluate from and gives a better decision support to the responsible individuals.
A better feedback loop – Looping the evaluation with the validation gives a better feedback loop back to each responsible individual or group on how well their first estimates were. This will increase the learning over time which will make the process more efficient and the output more accurate.
Improved steering opportunities for senior executives – More control to achieve a top-down steering of the portfolio. Gives a better balance between bottom-up and top-down control over the portfolio.
Decrease political influences – A formalized process can decrease the political influence that can otherwise control the outcome to a certain extent. Using the strict outcome from the evaluation to prioritize. Each BR entering the process is evaluated on the same ground.
Weaknesses
Large implementation phase – The process involves many actors which play important roles for it to become effective and for the strategic fit to become optimal. When introducing a new work method or process, it is important to get everyone to understand the value of it. Also it is central for everyone to understand their role within it.
Demands buy-in from senior executives – The process must have buy-in from senior executives. Otherwise, the intended strategic fit might be compromised.
The process can be exploited if the structure is known – As there are steps in the process that makes the users prioritize by giving a set value to the BR or project, the structure of the prioritizing can be identified and incorrect values can be added due to strategic initiatives of the user. For example, if one know that a certain criteria is more crucial for a need or project to go through than another one could exploit that by placing a high value on that criteria and by doing so the project will go through on incorrect value.
Long lead time – If the value of the process is not communicated in the right manner, throughout the organization, it can get a negative outcome as the actors, as well as, other workers experience long lead time from BR to realized project.
Choosing the right projects
58
Opportunities
More efficient workflow – When the criterions and capabilities are easier to understand and work with, it enables a more efficient workflow. Time that previously was spent on trying to understand what the criterions and strategy really referred to can now be put on other issues in need, all in a Lean production manner.
Long term planning enables a more flexible workflow – By planning and looking ahead it will be easier to steer the projects onwards where the organization aim to be in the future. If that direction changes the prioritizing of projects, this can easily be adjusted to follow the new requirement of the organization.
Threats
Political opinions if implemented wrong – If the process is implemented without getting all actors full understanding of the value, it risk to be antagonized by strong leaders that feel that the old way was better. Especially in organizations where they have a strong PPM history and where not everyone see the need for change.
Stuck in old patters – The capabilities and criterions need to be updated and follow the progress of the organization and the surrounding world. If not, the organization risks to get stuck in old patterns that no longer support desired strategic outcome.
7.4 Conclusion
By illustrating the main outcome of the study, the AIC model, a more distinct description of the framework was give. The model provides many benefits in terms of strengths and opportunities, but there are several disbenefits that need to be considered as well. To avoid disbenefits much focus needs to be placed on the implementation and communication of the process out to the organization, as most of them occur when the benefits and value of working with the process is not explained enough.
Choosing the right projects
59
8 Conclusion
The purpose of this thesis was to investigate how an organization can make sure that the project portfolio is in line with the strategy and that decisions are based on balanced prioritization criterions. This chapter aims to provide the reader with the outcome of the thesis and reflections on how it can be used and elaborated.
To answer the purpose of this thesis the results of the study has shown that by standardizing the process with recurrent feedback loops it decreases the political influence, as project are evaluated and validated against preset criterions and capabilities. The mapping of actual strategic capabilities enables a stronger strategic fit and decreases the risk of allocating resources into the wrong projects. The result of this thesis is presented through the AIC model as a new way of viewing the project portfolio process. PPM theories are combined with the structure of Lean production to bring out the optimal strategic benefits.
8.1 Academic contribution
According to the study, the combination of PPM and Lean production through a strategic angle have not been combined in that extent before. It enable a new way of addressing ideas as a part of the PPM process. Previous studies within the PPM field focus on project evaluation and validation based on heavy business cases while this study argues that the evaluation should come even earlier in the process. As soon as a need or idea has been defined the accumulative process starts, where the information certainty goes from low to high, which enables a distinct flow and motivate each activity. The study presents a new way of addressing needs or project ideas in a organization which help structure and manage the desirable outcome of having both bottom-up and top-down steering, presented by Pennypacker & Retna (2009). The study has not identified any issues regarding the gathering of information to a business case. The issue is how to gather the right information that add the accurate value to the process. By implementing the philosophy behind Lean production each parameters of the process is questioned when it comes to relevance and value for what you are trying to achieve. The flow is standardized and more efficient with the use of standardized templates that details the needed information at each step. The question of not doing things right but doing the right thing right is addressed in a new and innovative way. With this approach, the selection of the right projects, will be made more often and in the long term leading to a more efficient progress of supportive IT solutions.
Choosing the right projects
60
The AIC model motivate the flow of necessary information throughout the process. By applying Lean theories to the standardized PPM process the result is a process with a flow of distinct value in each step. By taking it one step further than Pellegrinelli and Bowman (1994) and adding their ideas about strategy implementation to the PPM process a concrete way of creating a solid flow of the strategic initiatives is addressed. The strategic initiatives do not risk to get caught and transformed in set paradigms nor in political plays.
8.2 Will it work at Scania?
Efforts of testing parts of the new process with the AIC model-mindset have been made at Scania, where POAP has been evaluated in the EM and mapped against projects presently in the pipeline. This to get an overview of what is in the pipe and what is potentially entering soon. The evaluation was performed with present criterions but only a handful of them as it was meant to be done in a rapid pace. The PPM team have tested it and reports have indicated a positive response (Furén, 2011). Still, further testing should be done to achieve the full potential of the altered process.
8.3 Outlook at Scania
At Scania, the outlook for the implementation of the AIC model lies in the hands of the portfolio team, ITPMF and the IT Council, as they need to accept the modified FNTD process. Thereafter, the alteration to the criterions must be done as some of them today must be redefined to match the new process. The buy-in from senior executives, the IT Council, must be made so that the strategic directives can be given in a way that makes the capabilities function the way they are intended. How the prioritization should be done by the IT Council is yet to be decided, and should be developed further. The strategic documents that the strategic fit is based on should be clarified for every participating individual. These documents need to state a clear direction for the IT environment at Scania R&D. If the documents are derivates from corporate strategies and R&D strategies, they need to be combined to match the capabilities so that the prioritization of the capabilities gives the desired outcome. Educational sessions should be held with everyone involved in the process, the maintenance forums, process forums, ITPMF and IT Council, giving them the basic understanding for the whole process as well as concentrating on the specific areas for each level. As the project portfolio at Scania IT Area R&D has a low knowledge in the whole R&D department, the portfolio need to advertise more internally. A suggestion is that members from each maintenance and process forum take responsibility to advertise about the core purpose of the portfolio. Line managers and senior executives also need to educate their peers about the portfolio. By doing so, the raison d’être of the portfolio can be strengthened within the R&D department.
Choosing the right projects
61
When the new process is implemented, a further investigation could be made to assure that each process forum have the proper tools for generating ideas. Today the contribution and maturity of the forums very mixed, and that could be addressed by making sure they have methods to generate new ideas. This could also be connected to the low knowledge within the R&D department. Some ideas might not get into the forums just because their existence is not known. For further development of the AIC model, deeper interviews at the minor cases could be performed to gather more input on the purpose of it. Further establishment of activities along the process could be added to make the whole process more standardized. By using the suggested model, workshops with individuals at different levels could give more feedback on how each step can be developed further. Interviews with the responsible UTI contacts, the business maintenance managers, could give a different angle on the identified issues that their role as facilitators gives them. Together with InfoMate, requirements for developing software could be used to create a smoother connection when receiving orders from a project. The transition into a specific project could aid the process further. It is also interesting to investigate however the AIC model can be added to new or existing portfolio planning software to enable a fully digital system for addressing the portfolio prioritization, selection and evaluation.
8.4 Can the AIC model be applied to other organizations?
The AIC model is to be viewed upon as a decision frame where the criterions are to be added and adjusted to fit the specific organizations using it. Even though it has been developed through a study based on IT related portfolios, the AIC model can be used as a frame to fit most portfolios. Relating back to chapter 5, having different decisions structures can have an impact on the process. When the structure is divided as in Figure 5-1 the information has more steps to go through and demands thereby a distinct definition that everyone, in each step, can understand and relate to. This put a higher workload of using the AIC model, as more definitions of criterions and capabilities need to be made. A stronger effort has to be made making sure that the chosen definitions means the same to everyone. Compared to the structure in Figure 5-2 where the different decisions steps are fewer and more often the same actors, at the same levels that are involved. As these actors are generally top managers, they should already have a more developed idea of what the strategy is and what it demands. Hence, the criterions and capabilities do not need to be defined to as great extent. However, by defining it as much as possible, enables a quick adaption for new actors when entering and other stakeholders can easily gain insight to the process. The framework can be adapted regardless of decision structure, though the selection of criterions and the defining of capabilities need to be considered first.
Choosing the right projects
62
8.5 Methodological Implications
The studied theories regarding portfolio process provided key insights in the possibilities and problems with a structured PPM implementation. The area is well covered with both general project portfolios to more specialized IT portfolios. The literature gave detailed descriptions on how the general process should be designed to cater most types of projects. Published studies, detailed success factors and pitfalls for portfolios way of controlling large number of projects. The initial broad search gave good input when structuring the rest of the study as it gave indications of which authors or researchers that were the most influential in the PPM area. The selection of strategy literature gave good insights in how strategies are created and implemented in large, complex corporations. Many articles described a common issue with the implementation of strategy and as this study focuses on the selecting projects, the theory about how to “implement strategy through projects” served well as a base for the strategic fit analysis. During the time at Scania, Lean was found to be a cornerstone in their way of work. After experiencing their Lean implementation, the idea to embed Lean into the PPM process was created. The selected approach of Lean principles for service processes gave valuable input when designing the model as IT is often regarded as a service function. By studying the literature regarding benefits management, a clearer picture was given to the term “benefit”. As it is benefit that is the primary focus when evaluating a business requirement, the term is of significant importance for the evaluating team. The choice of a flexible case study has been useful since the purpose have drifted slightly during the course of the study. The initial literature study provided a base from where the empiric framework could be analyzed. Since the approach was of abductive nature, findings from the continuous analytical process provided new insights that were allowed to change the direction. The choice of a major case allowed for a deeper study of the identified issues. Being present at Scania gave access to important information that could not have been attained any other way. It is possible that the study could have been colored during this long stay. To minimize that effect, discussions with tutors from the university were held regularly as well as the other minor case studies that were conducted. The interviewees at Scania were chosen because of their different types of connections to the PPM Process. The interview guides were generated from theories alongside tutors from Scania and gave semi-structured interviews where the interviewees were able to talk freely about their experiences from the process. However, given the outcome from the study, senior executives along with more BMM could have been interviewed as well to better strengthen the connections
Choosing the right projects
63
over the whole organization. It would also have been interesting to interview somebody whose idea has gone through the process. This might have given a better understanding for the bottom-up and top-down approach. Since there was no competition between Scania and the minor cases, the interviewees from the minor cases spoke freely as well about their own firms experience from PPM. They showed a genuine interest in the study and they were very attentive to the questions which should make their subjective answers more truthful. What could have validated their input even more would have been to conduct at least one more interview at each company with somebody from the business side, who could have corroborated the initial findings. The qualitative approach worked well for this type of study where a process is being investigated and improved. The amount of data collected from both interviews, secondary and primary observations along with all the given printed material, has given strong foundation to process and analyze. The triangular approach strengthened the empiric framework which has validated an interest in the studied area. Even if portfolio management is something well established, the IT project portfolio management area is still in early development.
8.6 Concluding remark
Looking back at chapter 1, can the AIC model be implemented and helpful for the supervisor and surgeons when juggling their patients? Decision are made at a rapid pace and wrong decisions can be of fatal outcome for the patient. Also the hospital as the reputation risk to be ruined, as well as no one wanting to work there in such chaotic manner. The AIC model could function as a framework for the hospital where they would add their strategic goals and the criterions of what they wish to base their decisions on. By introducing all the surgeons to the strategic areas, as well as the criterions, they become a vital part of the selection process. The pipeline planning would function as the operating room schedule where certain criterions are to be obtained before a surgery ends up there. The criterions could for example be; unconsciousness, fracture etcetera. They are also mapped strategically; e.g. a strategic capability says that children are the main focus. The surgeries that involve children are in that case given an extra prioritizing score and are viewed as more important and might even be marked as so on the pipeline. As the surrounding world and incoming requirements are forever changing, the pipeline has to be evaluated and validated continuously to meet the demands, both from the patients, surgeons and the strategic initiatives of the hospital. By structuring and standardizing the process the supervisor will have an easier job motivating who get time in the surgery room and who will have to wait.

Choosing the right projects
64
Choosing the right projects
65
References
Articles
Abdi, M. (2010 ). Strategic IT Alignment with Business Strategy: Service Oriented Architecture Approach. International Symposium on Information Technology (pp. Vol. 3, 1473-1478). Tronoh: IEEE. Archer, N., & Ghasemzadeh, F. (1999). An integrated frameword for project portfolio selection. International Journal of Project Management , Vol. 4. 207-216. Ballard, G. (2000). Lean Project Delivery System. LCI White Paper - 8 . Brynjolfsson, E., & Hitt, L. (1996). Paradox lost? Firm-level evidence on the returns to information systems spending. Management Science/ Vol 42, No.4, April , 541-558. Campbell, D. T., & Fiske, D. W. (1959). Convergent and discriminant validation by the multitrait-multimethod matrix. Psychological Bulletin, no 56 , 81-105. Chan, Y. E., & Reich, B. H. (2007). IT alignment: what have we learned? Journal of Information Technology , No. 22, 297-315. Cooper, R. G., Edgett, S. J., & Kleinschmidt, E. J. (2001). Portfolio Management for New Product Development. R&D Management , Volume 31, number 4. Dorgan, S., & Dowdy, J. J. (2004). When IT lifts productivity. The McKinsey Quarterly No.4 , 13-15. Frei, F. (2006). Breaking the trade-off between efficiency and service. Harvad Business Review , 92-101.
Holland, A., & Fathi, M. (2007). Quantitative and Qualitative Risk in IT Portfolio Management. IEEE International Conference on Systems, Man and Cybernetics (pp. 3840-3847). Montreal: IEEE. Lindblom, C. E. (1959). The science of muddling through. Public Administration Review . Pellegrinelli, S., & Bowman, C. (1994). Implementing Strategy Through Projects. Long Range Planning Vol 24 , 125-132. Phaal, R., Farrukh, C., & Probert, D. (2001). Technology Roadmapping: linking technology resources to business objectives. University of Cambridge: Centre for Technology Management. Wei, J. C. (2009). Theories and Principles of Designing Lean Service Process. IEEE Xplore , 821-826. Wen, J. (2010). The Strategy-Oriented Project Portfolio Selection and Management. International Conference on E-Product E-Service and E-Entertainment (pp. 1-4). Beijing: IEEE .
Books
Alvesson, M., & Sköldberg, K. (1994). Tolkning och Reflektion. Lund: Studentlitteratur. Archibald, R. D. (1992). Managing High-Technology Programs and Projects. New York: Wiley. Bernard, H. R. (2000). Social Research Methods Qualitative and Quantitative Apporaches. London: Sage Publications.
Choosing the right projects
66
Blaxter, L., Huges, C., & Tight, M. (2006). How to Research. Maidenhead: McGraw- Hill Education. Bonham, S. (2004). IT Project Portfolio Management. Norwood: Artech House. Bradford, & Duncan. (1999). Simplified Strategic Planning: The No-Nonsense Guide for Busy People Who Want Results Fast. Chandler House Press. Cohen, L., Manion, L., & Morrison, K. (2007). Research Methods in Education. Oxon: Routledge. Dan, A., Kalof, L., & Dietz, T. (2008). Essentials of Social Research. Maidenshead: McGraw-Hill Education. Dennis, P. (2007). Lean Production Simplified. New York: Productivity Press. Hill, T. (2005). Operations Management. New York: Palgrave macmillan. Hopp, W., & Spearman, M. (2008). Factory Physics. New York: McGraw-Hill. Höst, M., & Runesson, P. (2008). Guidelines for conducting and reporting case study research in software engineering. Lund: Online. Höst, Regnell, & Runeson. (2006). Att genomföra ett examensarbete. Lund: Studentlitteratur. Kendall, G. I., & Rollins, S. C. (2003). Advanced Project Portfolio Management and the PMO: Multiplying ROI at Warp Speed. Boca Ralton: J. Ross Publishing. Lantz, A. (1993). Intervjumetodik. Lund: Studentlitteratur.
Martino, J. P. (1995). Research and Development Project Selection. New York: John Wiley & Sons. Patterson, J. G. (1995). Benchmarking Basics - Looking for a better way. Course Technology Crisp . Pennypacker, J., & Retna, S. (2009). Project Portfolio Management - A view form the Management Trenches. New Yersey: John Wiley & Sons. Quinn, J. B. (1980). Strategies for Change: Logical Incrementalism. New York: Irwin. Rajegopal, S., McGuin, P., & Waller, J. (2007). Project portfolio management: leading the corporate vision . Basingstoke: Palgrave MacMillan. Saunders, M., Lewis, P., & Thornhill, A. (2007). Research Methods for Business Students. Harlow: Pearson Education Limited. Stellman, A., & Greene, J. (2005). Applied Software Project Management. O'Reilly Media. Wagter, R., van den Berg, M., Luijpers, J., & van Steenbergen, M. (2005). Dynamic Enterprise Architecture. Hoboken: John Wiley & Sons. Ward, & Daniel. (2006). Benefits Management - Delivering value from IS/IT investments. West Sussex UK: Wiley. Willcocks, L., Petherbridge, P., & Olson, N. A. (2002). Making IT count: strategy, delivery, infrastructure . Oxford: Buttersworth-Heinemann.
Choosing the right projects
67
Web pages
Hut, P. (2009, January 8). Building a Project’s Business Case. Retrieved April 28, 2011, from The Project Management Hut: http://www.pmhut.com/building-a-projects-business-case McIlree, R. (2007, August 27). How ‘Percent-Complete’ Is That Task Again? Retrieved May 9, 2011, from The Project Management Hut: http://www.pmhut.com/how-percent-complete-is-that-task-again Merkhofer, L. (2010). The Project Prioritization Challenge. Retrieved 2011 2-February from Lee Merkhofer Consulting: http://www.prioritysystem.com/challenge.html Scania. (2011, march 24). Scania Annual Report 2010. Retrieved March 30, 2011, from Scania: http://scania.com/investor-relations/financial-reports/2010/scania-annual-report-2010.aspx Scania. (2008). Scania in brief. Retrieved 2011-2-February from Scania: http://www.scania.com/scania-group/scania-in-brief/
Interviews
Berg, J. (2011, March 11). Manager, IT Project Portfolio. (H. Ullman, & S. Sandberg, Interviewers)
Berglund, P. (2011, March 16). Senior manager - RTP - Product Specifications . (H. Ullman, & S. Sandberg, Interviewers) Danielsson, J. (2011, March 17). Head of System Architecture and Tools. (H. Ullman, & S. Sandberg, Interviewers) Flodmark, F. (2011, March 1). Business Architect, UTIP. (H. Ullman, & S. Sandberg, Interviewers) Fura, B. (2011, March 8). Senior Manager Performance & Reliability - RTR - Vehicle Acoustics, Performance and Reliability. (H. Ullman, & S. Sandberg, Interviewers) Furén, A. (2011, March 9). Senior Adviser IT Portfolio and Project Mgmnt R&D. (H. Ullman, & S. Sandberg, Interviewers) Furén, A. (2011, May 4). Senior Adviser IT Portfolio and Project Mgmnt R&D. (H. Ullman, & S. Sandberg, Interviewers) Haux, M. (2011, March 10). Head of Group Operations BIO & IT Management. (H. Ullman, & S. Sandberg, Interviewers) Härmestad, O., & Shaake, H. (2011, March 18). (H. Ullman, & S. Sandberg, Interviewers) Lindborg, K. (2011, March 3). IT Strategist. (H. Ullman, & S. Sandberg, Interviewers) Sandstedt, T. (2011, March 18). Head of IT Solutions (P&L/R&D). (H. Ullman, & S. Sandberg, Interviewers) Thel, M. (2011, April 5). Group Manger, UTIP. (S. Sandberg, & H. Ullman, Interviewers)
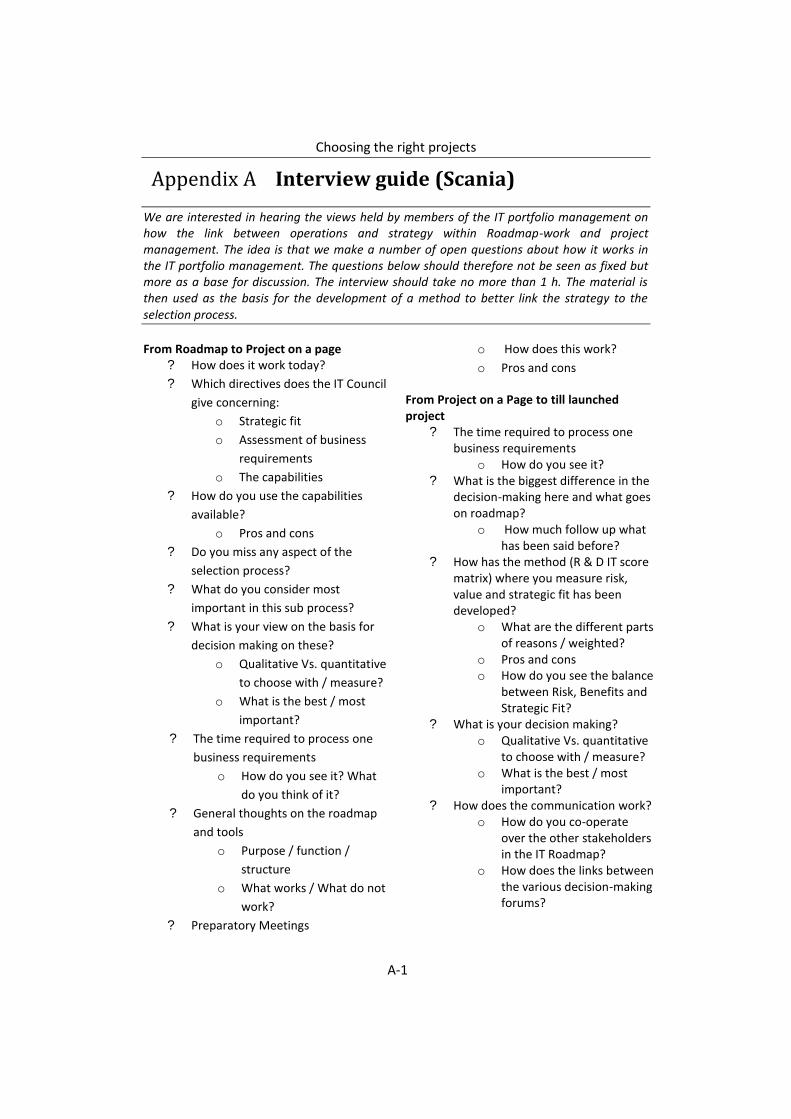
Choosing the right projects
A-1
Appendix A Interview guide (Scania)
We are interested in hearing the views held by members of the IT portfolio management on how the link between operations and strategy within Roadmap-work and project management. The idea is that we make a number of open questions about how it works in the IT portfolio management. The questions below should therefore not be seen as fixed but more as a base for discussion. The interview should take no more than 1 h. The material is then used as the basis for the development of a method to better link the strategy to the selection process.
From Roadmap to Project on a page
? How does it work today?
? Which directives does the IT Council
give concerning:
o Strategic fit
o Assessment of business
requirements
o The capabilities
? How do you use the capabilities
available?
o Pros and cons
? Do you miss any aspect of the
selection process?
? What do you consider most
important in this sub process?
? What is your view on the basis for
decision making on these?
o Qualitative Vs. quantitative
to choose with / measure?
o What is the best / most
important?
? The time required to process one
business requirements
o How do you see it? What
do you think of it?
? General thoughts on the roadmap
and tools
o Purpose / function /
structure
o What works / What do not
work?
? Preparatory Meetings
o How does this work?
o Pros and cons
From Project on a Page to till launched project
? The time required to process one business requirements
o How do you see it? ? What is the biggest difference in the
decision-making here and what goes on roadmap?
o How much follow up what has been said before?
? How has the method (R & D IT score matrix) where you measure risk, value and strategic fit has been developed?
o What are the different parts of reasons / weighted?
o Pros and cons o How do you see the balance
between Risk, Benefits and Strategic Fit?
? What is your decision making? o Qualitative Vs. quantitative
to choose with / measure? o What is the best / most
important? ? How does the communication work?
o How do you co-operate over the other stakeholders in the IT Roadmap?
o How does the links between the various decision-making forums?
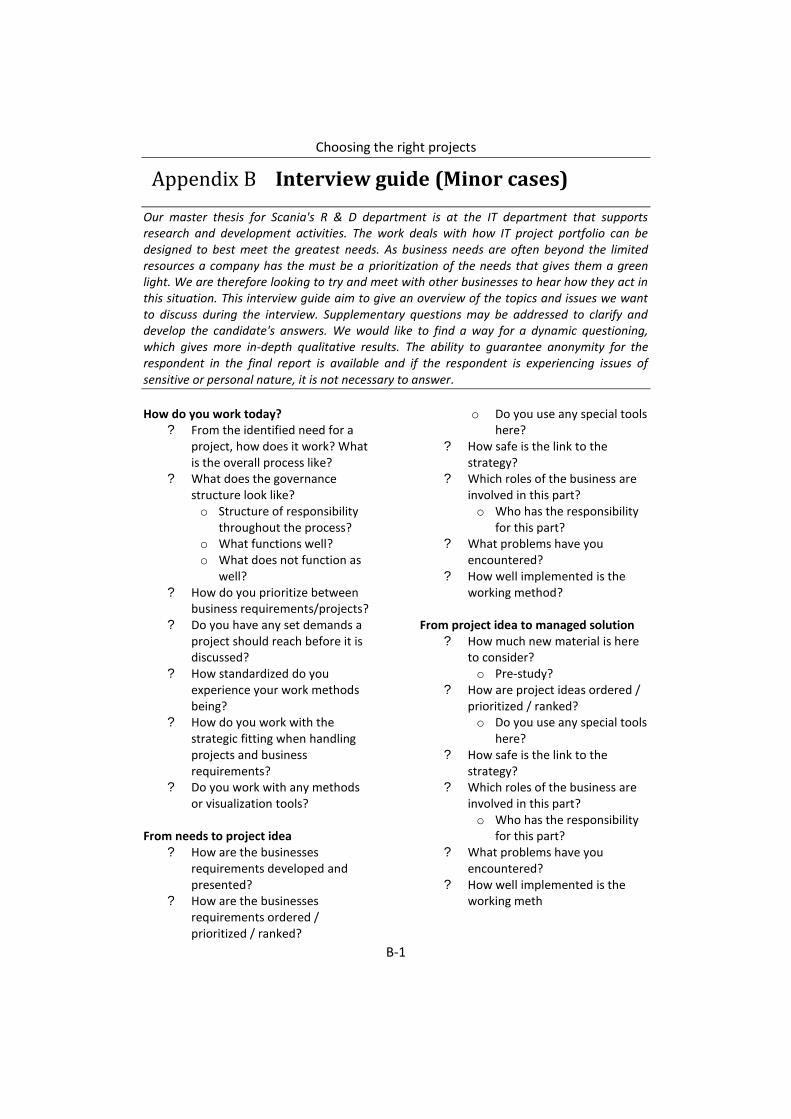
Choosing the right projects
B-1
Appendix B Interview guide (Minor cases)
Our master thesis for Scania's R & D department is at the IT department that supports research and development activities. The work deals with how IT project portfolio can be designed to best meet the greatest needs. As business needs are often beyond the limited resources a company has the must be a prioritization of the needs that gives them a green light. We are therefore looking to try and meet with other businesses to hear how they act in this situation. This interview guide aim to give an overview of the topics and issues we want to discuss during the interview. Supplementary questions may be addressed to clarify and develop the candidate's answers. We would like to find a way for a dynamic questioning, which gives more in-depth qualitative results. The ability to guarantee anonymity for the respondent in the final report is available and if the respondent is experiencing issues of sensitive or personal nature, it is not necessary to answer. How do you work today?
? From the identified need for a project, how does it work? What is the overall process like?
? What does the governance structure look like? o Structure of responsibility
throughout the process? o What functions well? o What does not function as
well? ? How do you prioritize between
business requirements/projects? ? Do you have any set demands a
project should reach before it is discussed?
? How standardized do you experience your work methods being?
? How do you work with the strategic fitting when handling projects and business requirements?
? Do you work with any methods or visualization tools?
From needs to project idea
? How are the businesses requirements developed and presented?
? How are the businesses requirements ordered / prioritized / ranked?
o Do you use any special tools
here? ? How safe is the link to the
strategy? ? Which roles of the business are
involved in this part? o Who has the responsibility
for this part? ? What problems have you
encountered? ? How well implemented is the
working method? From project idea to managed solution
? How much new material is here to consider? o Pre-study?
? How are project ideas ordered / prioritized / ranked? o Do you use any special tools
here? ? How safe is the link to the
strategy? ? Which roles of the business are
involved in this part? o Who has the responsibility
for this part? ? What problems have you
encountered? ? How well implemented is the
working meth
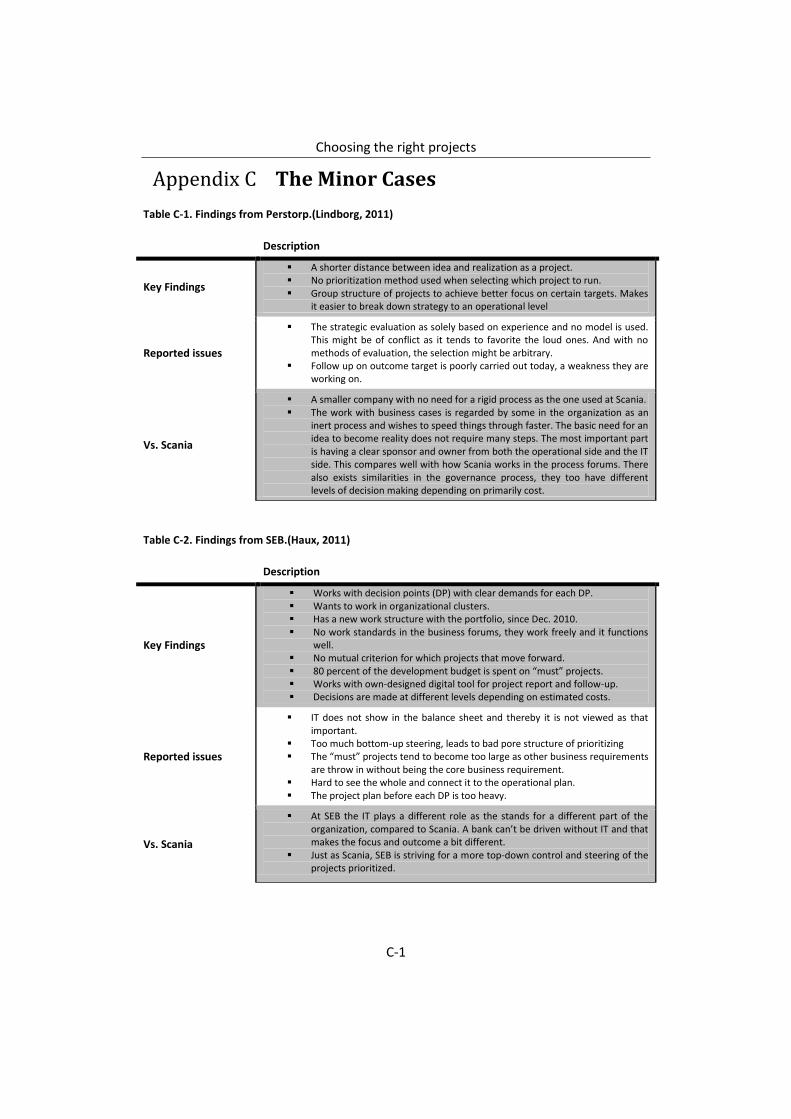
Choosing the right projects
C-1
Appendix C The Minor Cases
Table C-1. Findings from Perstorp.(Lindborg, 2011)
Description
Key Findings
A shorter distance between idea and realization as a project. No prioritization method used when selecting which project to run. Group structure of projects to achieve better focus on certain targets. Makes
it easier to break down strategy to an operational level
Reported issues
The strategic evaluation as solely based on experience and no model is used. This might be of conflict as it tends to favorite the loud ones. And with no methods of evaluation, the selection might be arbitrary.
Follow up on outcome target is poorly carried out today, a weakness they are working on.
Vs. Scania
A smaller company with no need for a rigid process as the one used at Scania. The work with business cases is regarded by some in the organization as an
inert process and wishes to speed things through faster. The basic need for an idea to become reality does not require many steps. The most important part is having a clear sponsor and owner from both the operational side and the IT side. This compares well with how Scania works in the process forums. There also exists similarities in the governance process, they too have different levels of decision making depending on primarily cost.
Table C-2. Findings from SEB.(Haux, 2011)
Description
Key Findings
Works with decision points (DP) with clear demands for each DP. Wants to work in organizational clusters. Has a new work structure with the portfolio, since Dec. 2010. No work standards in the business forums, they work freely and it functions
well. No mutual criterion for which projects that move forward. 80 percent of the development budget is spent on “must” projects. Works with own-designed digital tool for project report and follow-up. Decisions are made at different levels depending on estimated costs.
Reported issues
IT does not show in the balance sheet and thereby it is not viewed as that important.
Too much bottom-up steering, leads to bad pore structure of prioritizing The “must” projects tend to become too large as other business requirements
are throw in without being the core business requirement. Hard to see the whole and connect it to the operational plan. The project plan before each DP is too heavy.
Vs. Scania
At SEB the IT plays a different role as the stands for a different part of the organization, compared to Scania. A bank can’t be driven without IT and that makes the focus and outcome a bit different.
Just as Scania, SEB is striving for a more top-down control and steering of the projects prioritized.
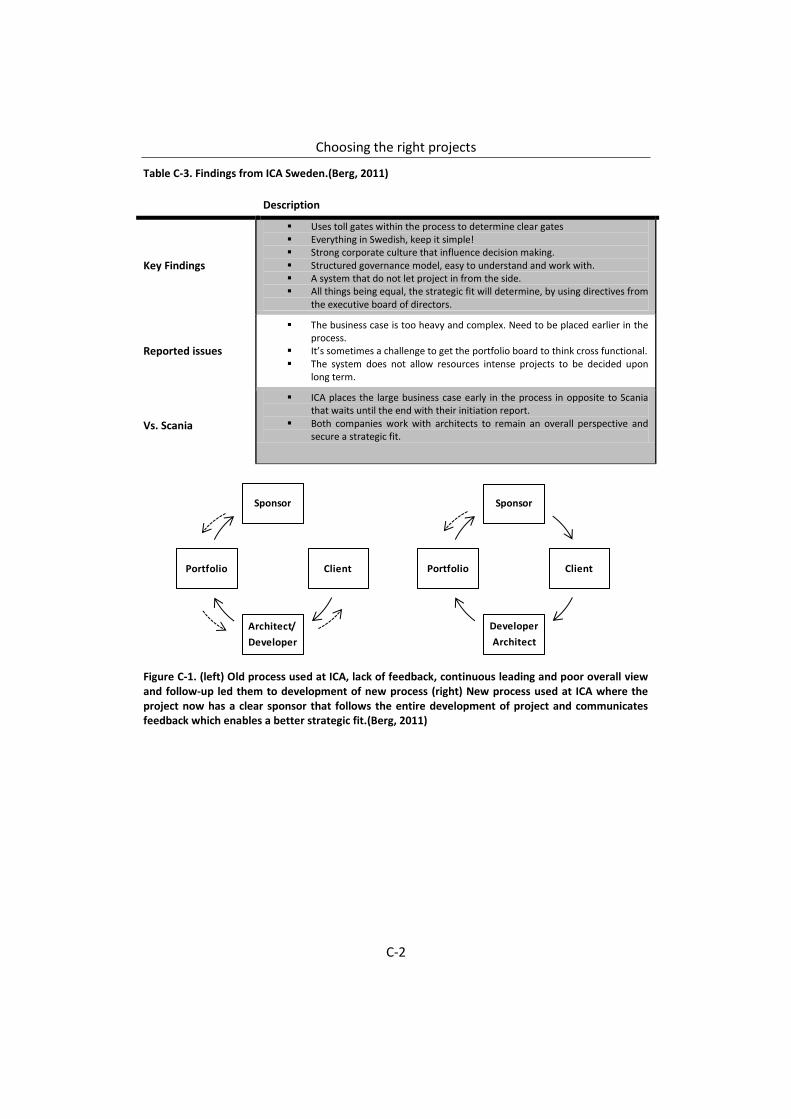
Choosing the right projects
C-2
Table C-3. Findings from ICA Sweden.(Berg, 2011)
Description
Key Findings
Uses toll gates within the process to determine clear gates Everything in Swedish, keep it simple! Strong corporate culture that influence decision making. Structured governance model, easy to understand and work with. A system that do not let project in from the side. All things being equal, the strategic fit will determine, by using directives from
the executive board of directors.
Reported issues
The business case is too heavy and complex. Need to be placed earlier in the process.
It’s sometimes a challenge to get the portfolio board to think cross functional. The system does not allow resources intense projects to be decided upon
long term.
Vs. Scania
ICA places the large business case early in the process in opposite to Scania that waits until the end with their initiation report.
Both companies work with architects to remain an overall perspective and secure a strategic fit.
Figure C-1. (left) Old process used at ICA, lack of feedback, continuous leading and poor overall view and follow-up led them to development of new process (right) New process used at ICA where the project now has a clear sponsor that follows the entire development of project and communicates feedback which enables a better strategic fit.(Berg, 2011)
Sponsor
Client
Architect/
Developer
Portfolio
Sponsor
Client
Developer
Architect
Portfolio

Choosing the right projects
C-3
Table C-4. Findings from Astra Zeneca.(Härmestad & Shaake, 2011)
Description
Key Findings
Works with decision points (DP) that comes with goals for measurements Strong strategy fit through the selection process. Strategy office that makes global prioritization for the project portfolio They aim to always have quantifiable numbers on cost at an early stage in the
prioritization process. Prioritizing based on score from analysis of definition, value, risks and costs.
Reported issues
When being in charge of the total budget global prioritizing is hard as not all projects can be run which results in that some units cannot run their development in their desired pace.
Costs and time is a problem. The operation works quicker than the decision process which creates a frustration among the workers as they do not see what the IS team are doing.
Vs. Scania
The strategy office at AZ is in charge of the IS budget and they make the prioritization for the organization as a whole which gives them a clearer top-down steering and gives an global overview. Scania does not practice this; here decisions are made with representatives from different levels.
Similar to Scania, AZ express their pipeline planning to be a multivariable game and not a standard process of prioritizing, much are decided on time, which project that is next in line.
AZ focuses on the delivery risk at the prioritization stages and goes into project risks at a later stage.
AZ does not work with visualization to the same extent as Scania, only digital tools are used such as excel-sheets created in-house.
Tools Used
They use the Cranfield Grid matrix (see theory chapter) to map the profit and risk impact of the project.
They use the PENG model as a tool for evaluating benefit through pre project process.
Risk mitigation model to select which project to begin with. Large focus on 5-year lifecycle analysis.
Figure C-2. PPM process at Astra Zeneca(Härmestad & Shaake, 2011)
Need Portfolio Pre-study Delivery BAM
list1
list2
list3
list4
Priolist
Priolist
B
u
d
g
e
t
Cost
$
Effect
$
PENGRisk Mitigation
Cranfield Grid
5-year lifecycle analysis
Project Go!
(Works with decision points (DP)
that comes with goals for
measurements.)
Follow-up & Evaluate
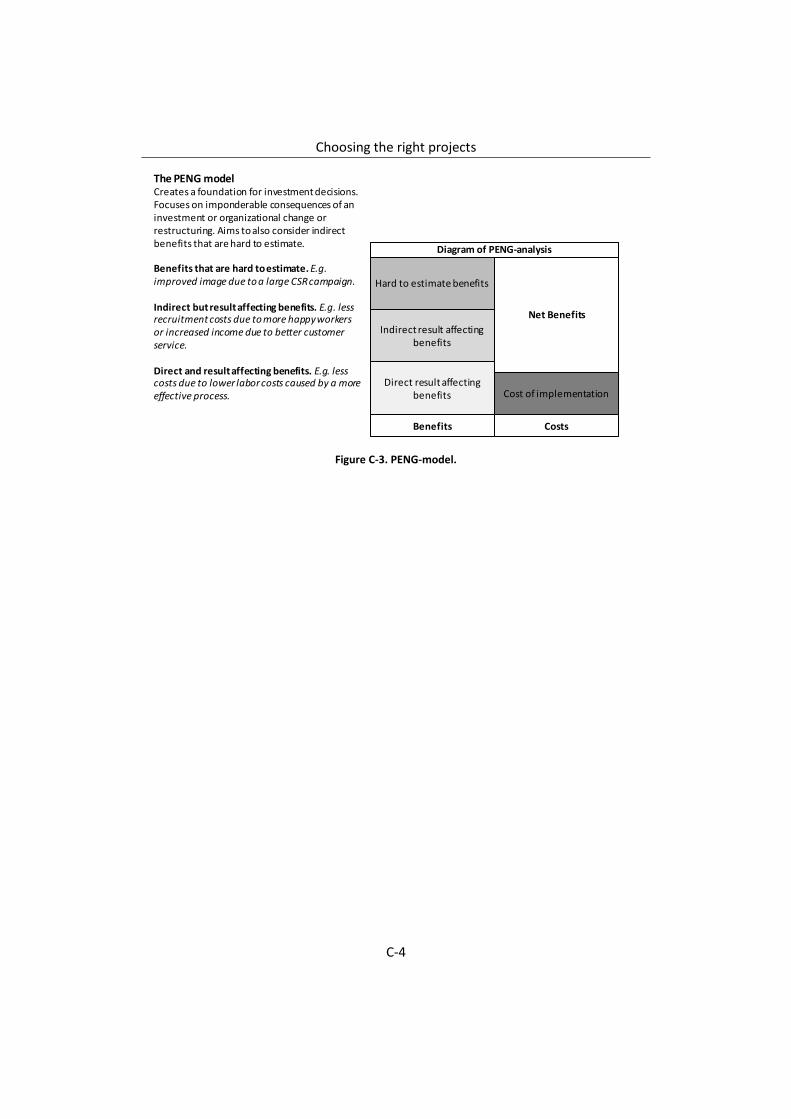
Choosing the right projects
C-4
Figure C-3. PENG-model.
The PENG modelCreates a foundation for investment decisions. Focuses on imponderable consequences of an investment or organizational change or restructuring. Aims to also consider indirect benefits that are hard to estimate.
Benefits that are hard to estimate.E.g. improved image due to a large CSR campaign.
Indirect but result affecting benefits. E.g. less recruitment costs due to more happy workers or increased income due to better customer service.
Direct and result affecting benefits. E.g. less costs due to lower labor costs caused by a more effective process.
Diagram of PENG-analysis
Hard to estimate benefits
Net Benefits
Indirect result affecting benefits
Direct result affecting benefits
Benefits
Cost of implementation
Costs
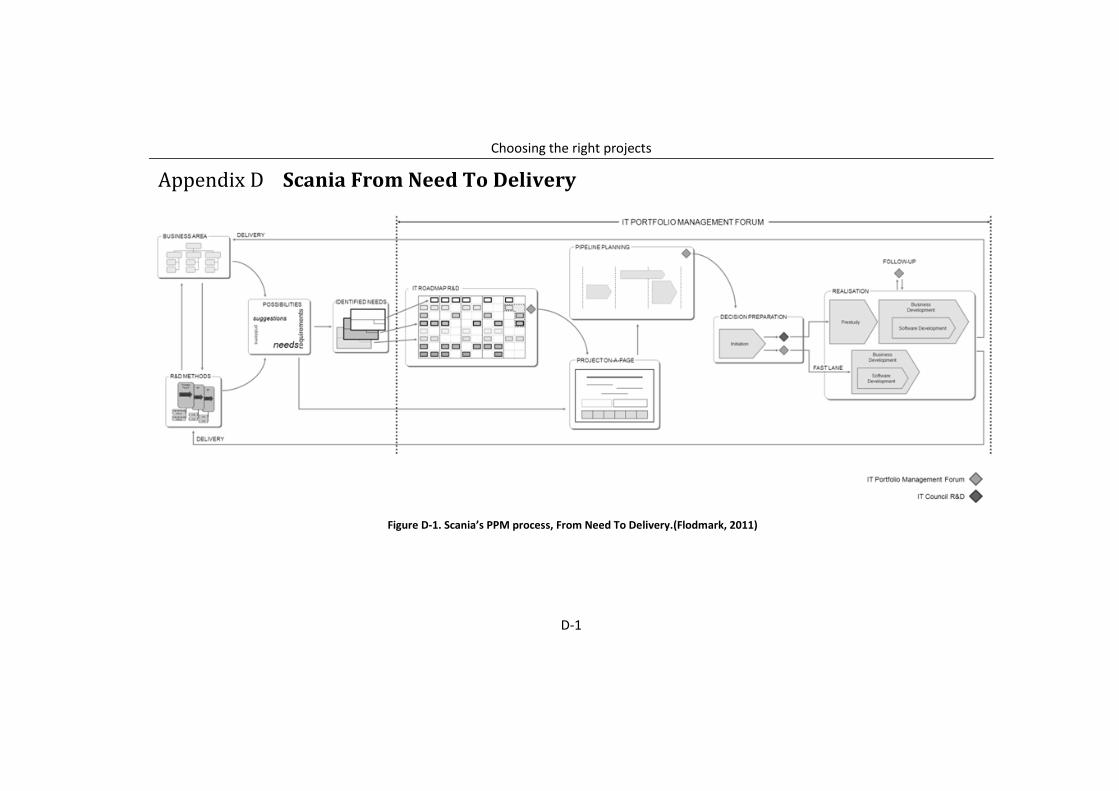
Choosing the right projects
D-1
Appendix D Scania From Need To Delivery
Figure D-1. Scania’s PPM process, From Need To Delivery.(Flodmark, 2011)