choosing and changing financial advisors: an ƒmri … · to make investment choices not through...
TRANSCRIPT
© 2012 Association for Financial Counseling and Planning Education®. All rights of reproduction in any form reserved. 3
IntroductionUnderstanding investor behavior is important for the overall economy and especially for those who work in the financial services industry. With the growth of professional financial planning, it has become common for individuals to make investment choices not through the direct buying and selling of individual stocks and bonds, but by hiring a professional who manages investments on their behalf. Al-though some research has investigated the behavior of in-dividuals when directly investing in markets (e.g., Barber & Odean, 2000; Grinblatt & Keloharju, 2000), relatively little has been done to explore how individuals select fi-nancial professionals to manage funds on their behalf.
The current study presents results from the first neuroim-aging study investigating the subject of investment advisor selection. Gaining a greater understanding of neural acti-vations associated with this process may provide insight at the individual level for practicing financial advisors, and potentially at the macroeconomic level for modeling longer term investment behavior.
Literature ReviewThe following study examined the neural correlates of advisor switching in an advisor-intermediated stock market game. As there appears to be no previous research that
Choosing and Changing Financial Advisors: An ƒMRI Study of Associated Brain Activations
Russell N. James III
Changing financial advisors during an advisor-intermediated stock-market game was more likely during periods of relative underperformance. Immediately prior to changing advisors, brain activation was greater in areas associated with error detection (dorsal anterior cingulate cortex) and number comparisons (inferior parietal and middle frontal gyri). This combination of activations was analogous to those associated with choosing to stop chasing losses in a gambling task. Advisors may consider using heuristics from gambling research and investment practice that re-characterize loss experiences as something other than errors. During non-switching “quiet” periods, subjects were more likely to be focusing on the images of advisors, reflected by activation in face-specific visual regions. These results may support client-retention strategies emphasizing personal connections rather than pure numerical performance.
Key Words: financial planning, fMRI, neuroeconomics
Russell N. James III, J.D., Ph.D., CFP®, Associate Professor, CH Foundation Chair in Personal Financial Planning, Department of Personal Financial Planning, Texas Tech University, Lubbock, TX 79409, (806) 787-593, [email protected].
specifically addresses this particular question, this review examined four related areas: non-neuroscience research in the areas of financial advisor selection and stock market games, neuroscience research in the potentially related task of observing the error of another person (in this case the advisor), and neuroscience research on related gambling behavior (particularly examining the phenomenon of “loss chasing”).
FinancialAdvisorSelectionA variety of popular press books and articles have ad-dressed the topic of financial advisor selection (e.g., Davis, 2007; Drozdeck & Fisher, 2007; Waymire, 2003), although the topic has not been extensively explored in the aca-demic literature. As Brown and Brown (2008) confirmed, “there is little research devoted to the relationship between advisor and investor” (p. 232). However, some facets of the relationship have been researched. Christiansen and DeVaney (1998) explored the importance of communi-cation in the financial planner-client relationship. More narrowly, Joiner, Leveson, and Langfield-Smith (2002) demonstrated the importance of using less technical lan-guage to establish trust in the financial planning relation-ship. Taking a psychological approach, Brown and Brown (2008) explored the relationship between investor attach-ment style and financial advisor loyalty. Bae and Sand-
Journal of Financial Counseling and Planning Volume 23, Issue 2 20124
ager (1997) explored the characteristics that consumers preferred in a financial planner while others have explored the characteristics of people who use financial planners (Chang, 2005; Elmerick, Montalto, & Fox, 2002).
Although not extensively studied, the process of selecting and switching financial advisors is particularly relevant given that, as Brown and Brown (2008) explained, “Cli-ents frequently change advisors, split assets among several different advisors, or fail to develop a complete invest-ment plan and instead shift from one investment theme to another” (p. 232). Indeed, one survey found that investors with $1 to $5 million portfolios averaged three different advisors, and that this number continued to grow at higher levels of wealth (Brown & Brown, 2008).
StockMarketGamesThe current study involves participants playing an advi-sor-intermediated stock market game. Stock market games are used widely in economic education (Mandell & Klein, 2009; Wood, O’Hare, & Andrews, 1992) and in a vari-ety of research, although none appeared to have involved selecting advisor intermediaries. Simple stock market-type games are common where player choices are limited. For example, player choices may only include choosing to stay or leave the market (Tykocinski, Israel, & Pittman, 2006), or predicting if the market will go up or down in the next period (Mattox, Valle-Inclan, & Hackley, 2006). Others have created highly sophisticated games such as Oehler, Heilmann, Läger, and Oberländer (2003) who created a se-ries of sophisticated stock market games allowing complex trading including short selling and borrowing.
Neuroimaging:ChasingLossesOne would naturally expect underperformance in compari-son with the market to be a significant determinant of advi-sor switching. To the extent that continuing to stay with an underperforming market strategy or financial advisor is analogous to continuing to gamble after experiencing losses, the neural activations may be related. Campbell-Meiklejohn, Woolrich, Passingham, and Rogers (2007) explored the neural correlates of both continuing to chase losses and ceasing chasing losses in an fMRI study. In that experiment subjects, after experiencing losses, were given the opportunity to “chase” the loss with a “double or noth-ing” bet. Subjects could continue to chase losses until they chose to stop, their loss limit was reached, or the game ended. The point at which subjects choose to stop chas-ing losses may be particularly relevant for advisor switch-ing. Advisor switching is potentially more likely to take
place after a series of negative outcomes. One’s faith in the advisor or the advisor’s strategy may gradually erode until the point at which optimism evaporates and the advisor is abandoned. This point of abandonment may be similar to the point at which a gambler ceases to chase losses by refusing to take additional gambles.
In the Campbell-Meiklejohn et al. (2007) study, decisions to stop chasing losses were associated with activity in a variety of areas. The regions of greatest activation when contrasting decisions to stop chasing losses with decisions to continue gambling were located in the dorsal ACC, the anterior insula, and left and right inferior parietal gyri. Additional activations above a Z-score of 4 were located in the middle frontal gyrus, cuneus, and precuneus. When contrasting decisions to stop chasing losses with a control task, the clusters with a Z-score of 4 or greater were lo-cated in dorsal ACC, the thalamus, and the inferior parietal gyrus. The two regions activating with a Z-score greater than 4 in both contrasts were in the dorsal ACC and the inferior parietal gyrus.
Neuroimaging:ErrorDetectionAlthough no previous studies have been conducted on the neural correlates of changing financial advisors, signifi-cant research has been conducted on potentially related behaviors. For example, studies involving identifying the errors of another person may be relevant. From a techni-cal perspective underperforming the market at times may be an inevitable consequence resulting from the variance inherent in the market and in any particular market strat-egy. Nevertheless, investors may view returns that under-perform the market as a failure on the part of the advisor. In simple terms, when the market index outperforms the advisor, a client may perceive this as an advisor failure or an advisor “error” in stock selection. Thus, to the extent that dropping a financial advisor may be precipitated by a perceived lack of performance, studies involving identify-ing the errors of another person may engage related proc-esses. In general, the anterior cingulate cortex (ACC) and nearby areas of the medial frontal cortex (MFC) have been implicated in monitoring behavior and detecting errors (Rushworth, Buckley, Behrens, Walton, & Bannerman, 2007). Kang, Hirsh, and Chasteen (2010) found ACC acti-vation when subjects watched another person make errors in the Stroop task, noting that the activation grew stronger when observing friends make errors, rather than strangers. Similarly, Newman-Norlund, Ganesh, van Schie, De Bru-ijn, and Bekkering (2009) found MFC and ACC activation increased in response to observing others make errors in
Journal of Financial Counseling and Planning Volume 23, Issue 2 2012 5
shooting penalty shot goals in soccer. In a separate study, MFC activity increased when subjects observed the er-rors of others in a computer shooting task (De Bruijn, de Lange, von Cramon, & Ullsperger, 2009).
HypothesisThe present study investigated the neural correlates of switching financial advisors in an advisor-intermediated stock-market game. As this study was the first of its kind and thus exploratory in nature, the initial hypotheses were broad. Consequently, no “region of interest” analysis or small-volume corrections were used for neural activations, as this would be justified only by strong prior neural hy-potheses. Behaviorally, advisor switching was anticipated to occur more frequently when advisors were performing poorly relative to the overall market. It was anticipated that decisions to drop one’s advisor in favor of another could also be associated with activation in the ACC, given its previous associations with choosing to stop chasing losses in a gambling task as well as associations with observing errors committed by others.
MethodsParticipantsNineteen healthy adult female volunteers (age range 20-31) participated in this study. All subjects had normal or corrected to normal vision. Subjects provided written informed consent after the details of the study were ex-plained to them. The Institutional Review Board of Texas Tech University approved the experimental processes.
TaskSubjects in the scanner could observe a screen and re-spond with four buttons (two left hand and two right hand). After completing tasks that familiarized subjects with the button functions they received the following in-structions, across several screens, with the slides advanc-ing on their command:
Next you will play a stock market game. The partici-pant who accumulates the most money in this game will be paid $250.00. Instead of picking stocks, you will select among four financial planning firms. These advisors will invest in stocks for you based on one of four strategies. You may change firms at any time, as many times as you like. There is no cost to change firms. The four financial planning firms are (A) The Able Firm, (B) The Baker Firm, (C) The Clark Firm, and (D) The Davis Firm. The Able Firm follows a TRENDS strategy immediately selling stocks that are falling and buying stocks that are rising. The Baker
Firm follows a GROWTH strategy buying stocks in companies that are growing. The Clark Firm fol-lows a VALUE strategy buying “cheap” stocks in companies with a lot of assets but low stock price. All advisors in the Clark firm are Certified Financial Planners. A CFP® must have years of experience, a college degree with investment coursework, must pass a series of rigorous exams and continually com-plete ongoing education in investing. The Davis Firm follows an INCOME strategy buying stocks in com-panies that pay high dividends (income). All advisors in the Davis firm are Certified Financial Planners. After each round you will see your percentage return (gain or loss) for that round and the overall market return for that round. You may change advisors at any point by clicking on the relevant button: left button/left hand for Able; right button/left hand for Baker; left button/right hand for Clark; right button/right hand for Davis.
After choosing their initial advisor, subjects experienced six segments of market conditions reporting increases/de-creases of the overall market and increases/decreases of their investments with each segment lasting four seconds. The top half of each screen read:
This round the market was up [down] x.x%Your investments were up [down] x.x%
After each set of segments, subjects were given an 11 second break during which time the screen read “you may change your advisor at any point by clicking the relevant button. The market will begin again in a moment.” Subjects played six sets of segments, at which point they were intro-duced to a new set of financial planning firms, made their initial selection and played six more sets of segments. In total, subjects experienced 72 segments of reported returns.
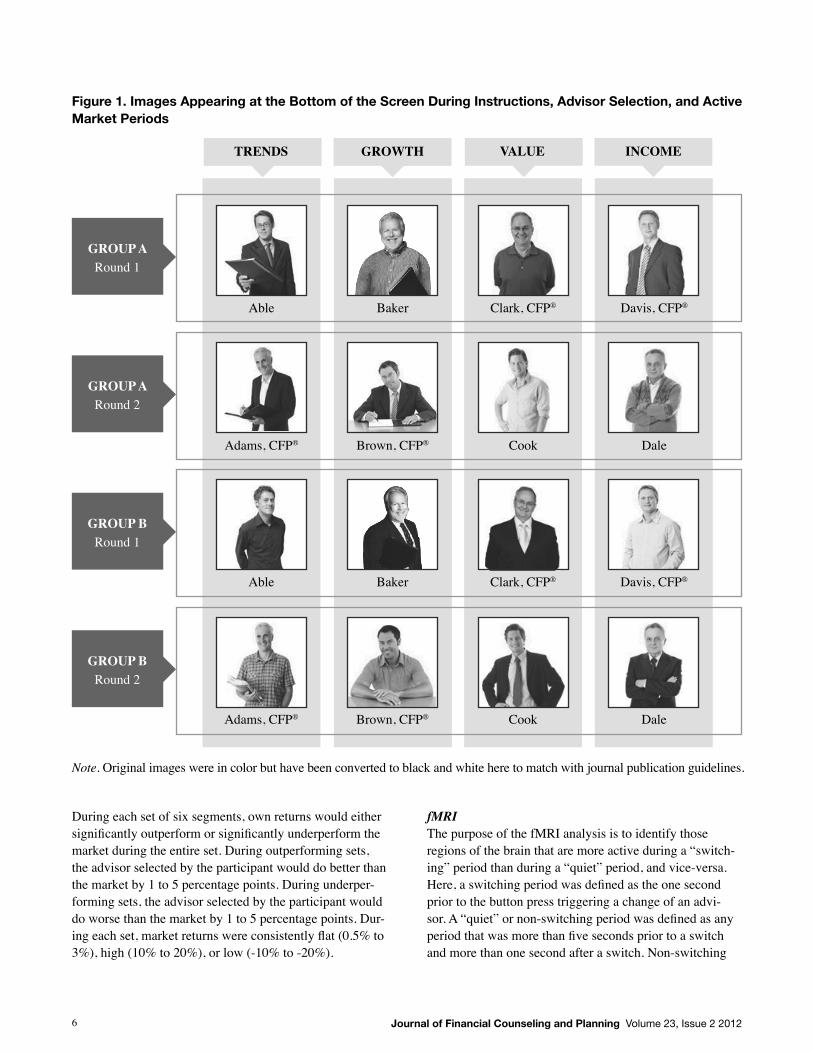
During instructions, breaks, and market periods the four advisors were pictured at the bottom of screen as shown in Figure 1 (The rights to use and publish the photographs were purchased from istockphoto.com). Two groups were created (10 in group A, 9 in group B) in order to reverse more formal and more casual appearances of advisors without any subject seeing any advisor more than once.
Unknown to the subjects, all subjects experienced the same sequence of market and own returns regardless of advisor choices. The winning player was determined by degree of adherence to pre-designated “preferable” market strategies during rising, flat, and falling market periods.
Journal of Financial Counseling and Planning Volume 23, Issue 2 20126
Figure 1. Images Appearing at the Bottom of the Screen During Instructions, Advisor Selection, and Active Market Periods
TRENDS GROWTH VALUE INCOME
GROUP ARound 1
Able Baker Clark, CFP® Davis, CFP®
During each set of six segments, own returns would either significantly outperform or significantly underperform the market during the entire set. During outperforming sets, the advisor selected by the participant would do better than the market by 1 to 5 percentage points. During underper-forming sets, the advisor selected by the participant would do worse than the market by 1 to 5 percentage points. Dur-ing each set, market returns were consistently flat (0.5% to 3%), high (10% to 20%), or low (-10% to -20%).
fMRIThe purpose of the fMRI analysis is to identify those regions of the brain that are more active during a “switch-ing” period than during a “quiet” period, and vice-versa. Here, a switching period was defined as the one second prior to the button press triggering a change of an advi-sor. A “quiet” or non-switching period was defined as any period that was more than five seconds prior to a switch and more than one second after a switch. Non-switching
GROUP ARound 2
Adams, CFP® Brown, CFP® Cook Dale
GROUP BRound 1
Able Baker Clark, CFP® Davis, CFP®
GROUP BRound 2
Adams, CFP® Brown, CFP® Cook Dale
Note. Original images were in color but have been converted to black and white here to match with journal publication guidelines.
Journal of Financial Counseling and Planning Volume 23, Issue 2 2012 7
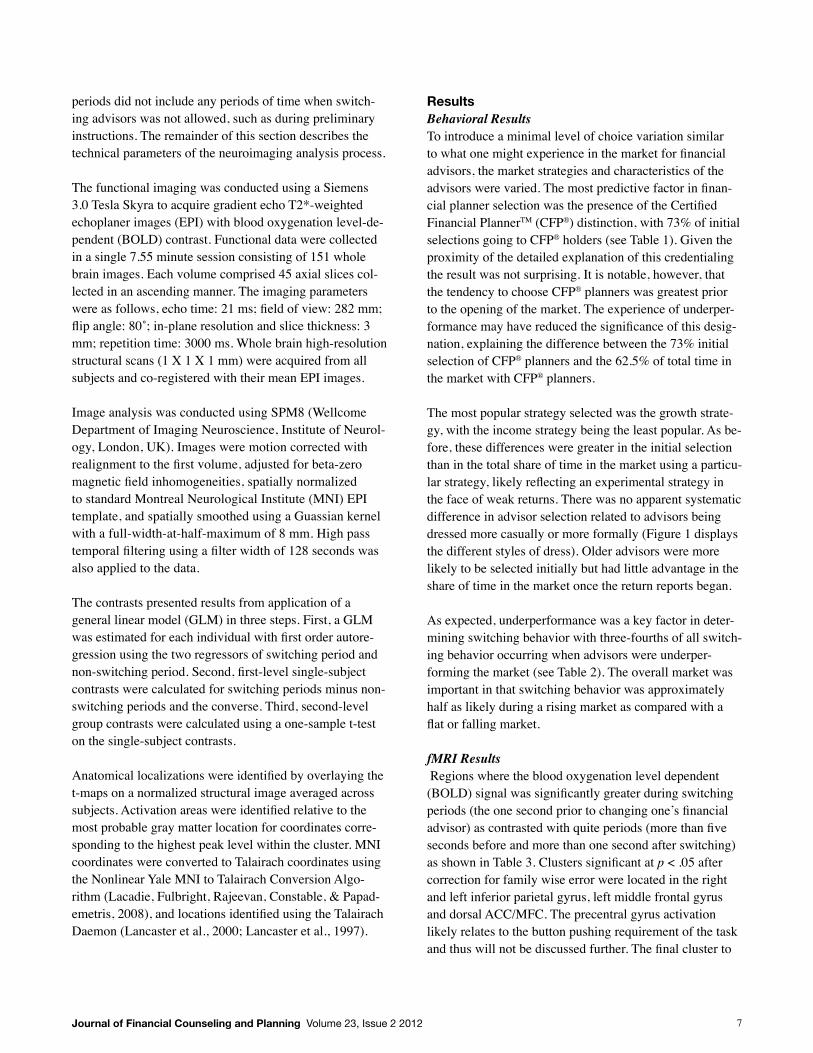
periods did not include any periods of time when switch-ing advisors was not allowed, such as during preliminary instructions. The remainder of this section describes the technical parameters of the neuroimaging analysis process.
The functional imaging was conducted using a Siemens 3.0 Tesla Skyra to acquire gradient echo T2*-weighted echoplaner images (EPI) with blood oxygenation level-de-pendent (BOLD) contrast. Functional data were collected in a single 7.55 minute session consisting of 151 whole brain images. Each volume comprised 45 axial slices col-lected in an ascending manner. The imaging parameters were as follows, echo time: 21 ms; field of view: 282 mm; flip angle: 80˚; in-plane resolution and slice thickness: 3 mm; repetition time: 3000 ms. Whole brain high-resolution structural scans (1 X 1 X 1 mm) were acquired from all subjects and co-registered with their mean EPI images. Image analysis was conducted using SPM8 (Wellcome Department of Imaging Neuroscience, Institute of Neurol-ogy, London, UK). Images were motion corrected with realignment to the first volume, adjusted for beta-zero magnetic field inhomogeneities, spatially normalized to standard Montreal Neurological Institute (MNI) EPI template, and spatially smoothed using a Guassian kernel with a full-width-at-half-maximum of 8 mm. High pass temporal filtering using a filter width of 128 seconds was also applied to the data.
The contrasts presented results from application of a general linear model (GLM) in three steps. First, a GLM was estimated for each individual with first order autore-gression using the two regressors of switching period and non-switching period. Second, first-level single-subject contrasts were calculated for switching periods minus non-switching periods and the converse. Third, second-level group contrasts were calculated using a one-sample t-test on the single-subject contrasts.
Anatomical localizations were identified by overlaying the t-maps on a normalized structural image averaged across subjects. Activation areas were identified relative to the most probable gray matter location for coordinates corre-sponding to the highest peak level within the cluster. MNI coordinates were converted to Talairach coordinates using the Nonlinear Yale MNI to Talairach Conversion Algo-rithm (Lacadie, Fulbright, Rajeevan, Constable, & Papad-emetris, 2008), and locations identified using the Talairach Daemon (Lancaster et al., 2000; Lancaster et al., 1997).
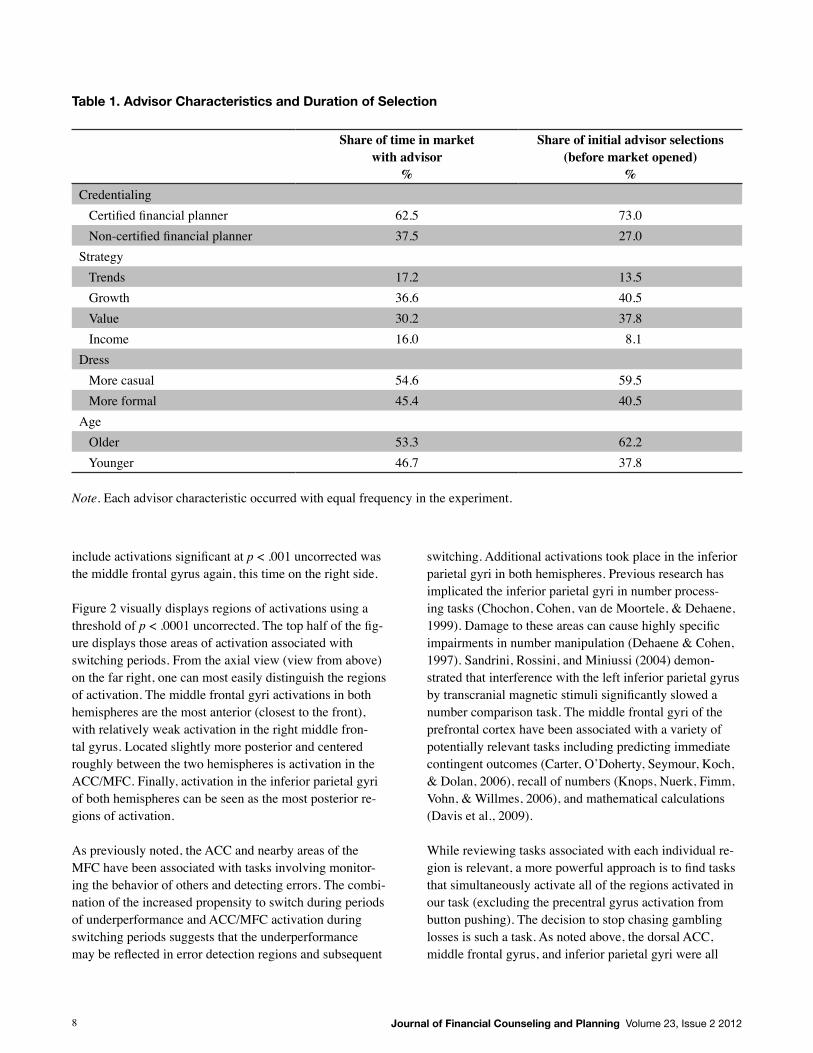
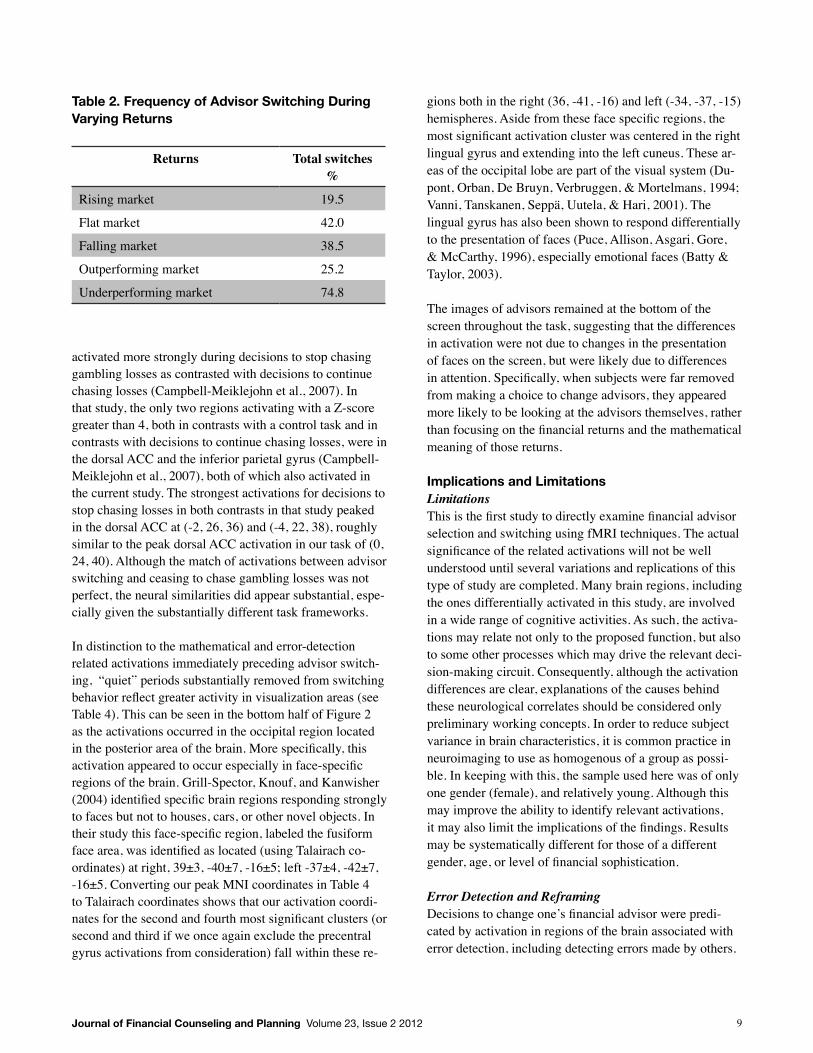
ResultsBehavioralResultsTo introduce a minimal level of choice variation similar to what one might experience in the market for financial advisors, the market strategies and characteristics of the advisors were varied. The most predictive factor in finan-cial planner selection was the presence of the Certified Financial PlannerTM (CFP®) distinction, with 73% of initial selections going to CFP® holders (see Table 1). Given the proximity of the detailed explanation of this credentialing the result was not surprising. It is notable, however, that the tendency to choose CFP® planners was greatest prior to the opening of the market. The experience of underper-formance may have reduced the significance of this desig-nation, explaining the difference between the 73% initial selection of CFP® planners and the 62.5% of total time in the market with CFP® planners. The most popular strategy selected was the growth strate-gy, with the income strategy being the least popular. As be-fore, these differences were greater in the initial selection than in the total share of time in the market using a particu-lar strategy, likely reflecting an experimental strategy in the face of weak returns. There was no apparent systematic difference in advisor selection related to advisors being dressed more casually or more formally (Figure 1 displays the different styles of dress). Older advisors were more likely to be selected initially but had little advantage in the share of time in the market once the return reports began. As expected, underperformance was a key factor in deter-mining switching behavior with three-fourths of all switch-ing behavior occurring when advisors were underper-forming the market (see Table 2). The overall market was important in that switching behavior was approximately half as likely during a rising market as compared with a flat or falling market.
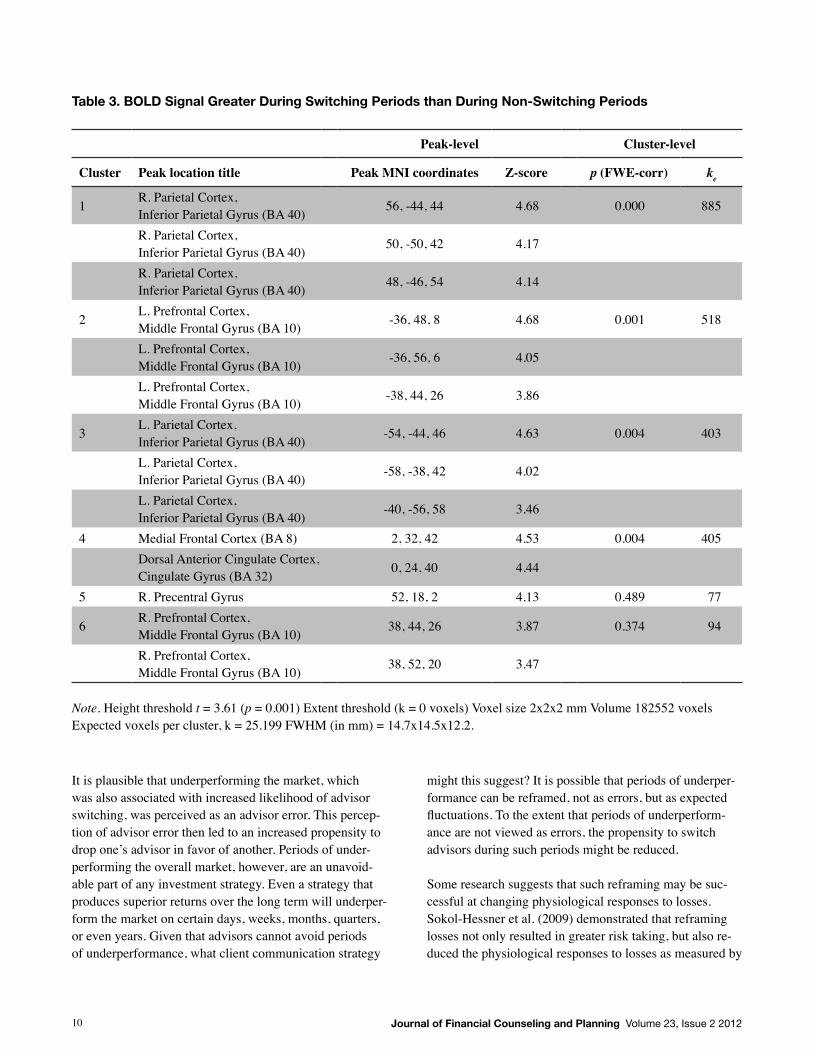
fMRIResults Regions where the blood oxygenation level dependent (BOLD) signal was significantly greater during switching periods (the one second prior to changing one’s financial advisor) as contrasted with quite periods (more than five seconds before and more than one second after switching) as shown in Table 3. Clusters significant at p < .05 after correction for family wise error were located in the right and left inferior parietal gyrus, left middle frontal gyrus and dorsal ACC/MFC. The precentral gyrus activation likely relates to the button pushing requirement of the task and thus will not be discussed further. The final cluster to
Journal of Financial Counseling and Planning Volume 23, Issue 2 20128
include activations significant at p < .001 uncorrected was the middle frontal gyrus again, this time on the right side.
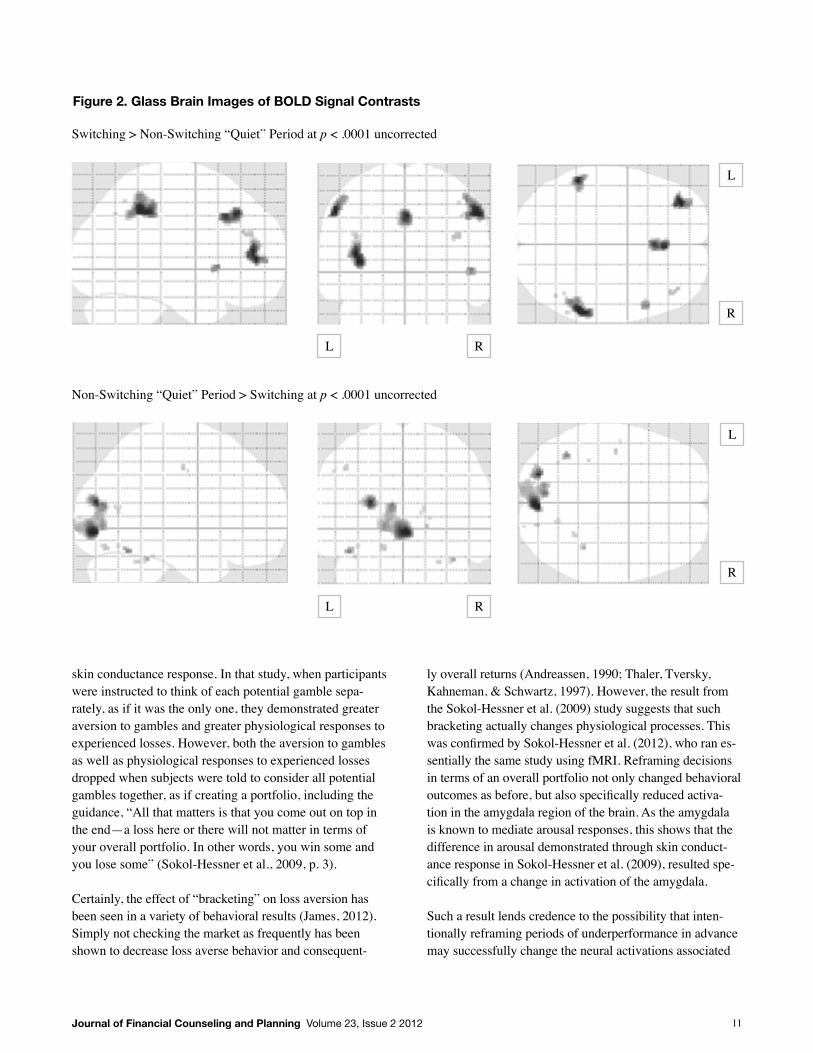
Figure 2 visually displays regions of activations using a threshold of p < .0001 uncorrected. The top half of the fig-ure displays those areas of activation associated withswitching periods. From the axial view (view from above) on the far right, one can most easily distinguish the regions of activation. The middle frontal gyri activations in both hemispheres are the most anterior (closest to the front), with relatively weak activation in the right middle fron-tal gyrus. Located slightly more posterior and centered roughly between the two hemispheres is activation in the ACC/MFC. Finally, activation in the inferior parietal gyri of both hemispheres can be seen as the most posterior re-gions of activation.
As previously noted, the ACC and nearby areas of the MFC have been associated with tasks involving monitor-ing the behavior of others and detecting errors. The combi-nation of the increased propensity to switch during periods of underperformance and ACC/MFC activation during switching periods suggests that the underperformance may be reflected in error detection regions and subsequent
switching. Additional activations took place in the inferior parietal gyri in both hemispheres. Previous research has implicated the inferior parietal gyri in number process-ing tasks (Chochon, Cohen, van de Moortele, & Dehaene, 1999). Damage to these areas can cause highly specific impairments in number manipulation (Dehaene & Cohen, 1997). Sandrini, Rossini, and Miniussi (2004) demon-strated that interference with the left inferior parietal gyrus by transcranial magnetic stimuli significantly slowed a number comparison task. The middle frontal gyri of the prefrontal cortex have been associated with a variety of potentially relevant tasks including predicting immediate contingent outcomes (Carter, O’Doherty, Seymour, Koch, & Dolan, 2006), recall of numbers (Knops, Nuerk, Fimm, Vohn, & Willmes, 2006), and mathematical calculations (Davis et al., 2009).
While reviewing tasks associated with each individual re-gion is relevant, a more powerful approach is to find tasks that simultaneously activate all of the regions activated in our task (excluding the precentral gyrus activation from button pushing). The decision to stop chasing gambling losses is such a task. As noted above, the dorsal ACC, middle frontal gyrus, and inferior parietal gyri were all
Table 1. Advisor Characteristics and Duration of Selection
Share of time in market with advisor
%
Share of initial advisor selections (before market opened)
%Credentialing Certified financial planner 62.5 73.0 Non-certified financial planner 37.5 27.0Strategy Trends 17.2 13.5 Growth 36.6 40.5 Value 30.2 37.8 Income 16.0 8.1Dress More casual 54.6 59.5 More formal 45.4 40.5Age Older 53.3 62.2 Younger 46.7 37.8
Note. Each advisor characteristic occurred with equal frequency in the experiment.
Journal of Financial Counseling and Planning Volume 23, Issue 2 2012 9
activated more strongly during decisions to stop chasing gambling losses as contrasted with decisions to continue chasing losses (Campbell-Meiklejohn et al., 2007). In that study, the only two regions activating with a Z-score greater than 4, both in contrasts with a control task and in contrasts with decisions to continue chasing losses, were in the dorsal ACC and the inferior parietal gyrus (Campbell-Meiklejohn et al., 2007), both of which also activated in the current study. The strongest activations for decisions to stop chasing losses in both contrasts in that study peaked in the dorsal ACC at (-2, 26, 36) and (-4, 22, 38), roughly similar to the peak dorsal ACC activation in our task of (0, 24, 40). Although the match of activations between advisor switching and ceasing to chase gambling losses was not perfect, the neural similarities did appear substantial, espe-cially given the substantially different task frameworks.
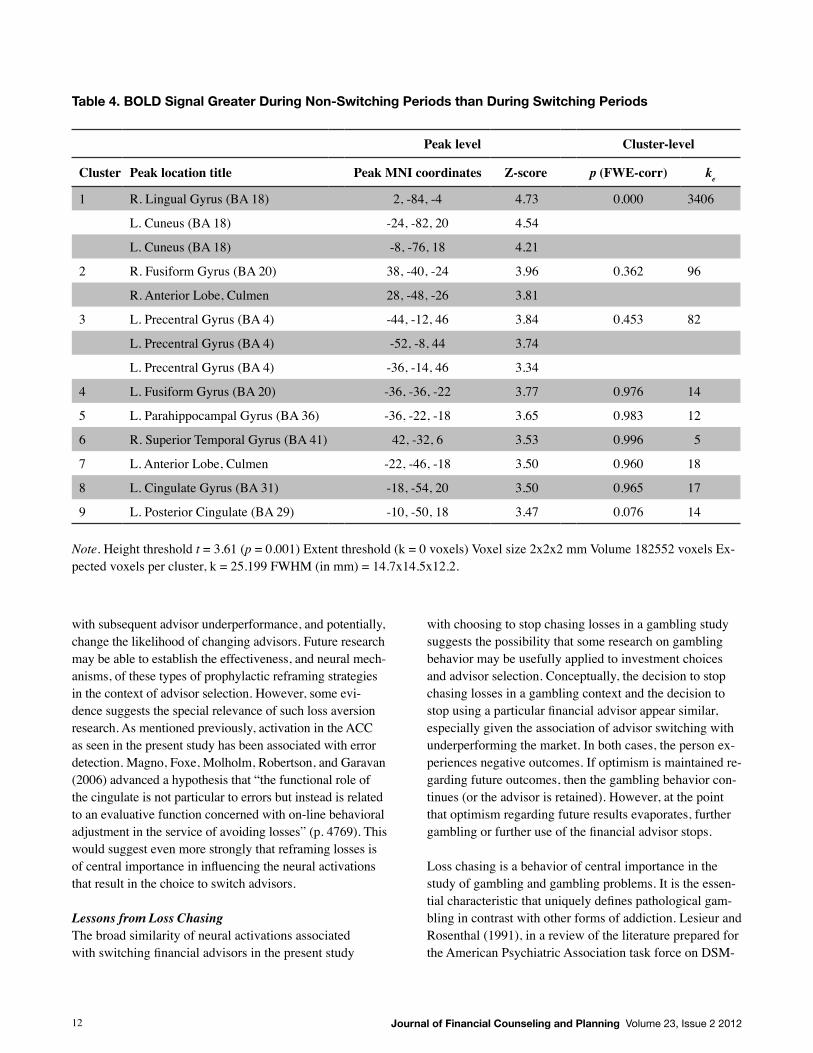
In distinction to the mathematical and error-detection related activations immediately preceding advisor switch-ing, “quiet” periods substantially removed from switching behavior reflect greater activity in visualization areas (see Table 4). This can be seen in the bottom half of Figure 2 as the activations occurred in the occipital region located in the posterior area of the brain. More specifically, this activation appeared to occur especially in face-specific regions of the brain. Grill-Spector, Knouf, and Kanwisher (2004) identified specific brain regions responding strongly to faces but not to houses, cars, or other novel objects. In their study this face-specific region, labeled the fusiform face area, was identified as located (using Talairach co-ordinates) at right, 39±3, -40±7, -16±5; left -37±4, -42±7, -16±5. Converting our peak MNI coordinates in Table 4 to Talairach coordinates shows that our activation coordi-nates for the second and fourth most significant clusters (or second and third if we once again exclude the precentral gyrus activations from consideration) fall within these re-
gions both in the right (36, -41, -16) and left (-34, -37, -15) hemispheres. Aside from these face specific regions, the most significant activation cluster was centered in the right lingual gyrus and extending into the left cuneus. These ar-eas of the occipital lobe are part of the visual system (Du-pont, Orban, De Bruyn, Verbruggen, & Mortelmans, 1994; Vanni, Tanskanen, Seppä, Uutela, & Hari, 2001). The lingual gyrus has also been shown to respond differentially to the presentation of faces (Puce, Allison, Asgari, Gore, & McCarthy, 1996), especially emotional faces (Batty & Taylor, 2003).
The images of advisors remained at the bottom of the screen throughout the task, suggesting that the differences in activation were not due to changes in the presentation of faces on the screen, but were likely due to differences in attention. Specifically, when subjects were far removed from making a choice to change advisors, they appeared more likely to be looking at the advisors themselves, rather than focusing on the financial returns and the mathematical meaning of those returns.
Implications and LimitationsLimitationsThis is the first study to directly examine financial advisor selection and switching using fMRI techniques. The actual significance of the related activations will not be well understood until several variations and replications of this type of study are completed. Many brain regions, including the ones differentially activated in this study, are involved in a wide range of cognitive activities. As such, the activa-tions may relate not only to the proposed function, but also to some other processes which may drive the relevant deci-sion-making circuit. Consequently, although the activation differences are clear, explanations of the causes behind these neurological correlates should be considered only preliminary working concepts. In order to reduce subject variance in brain characteristics, it is common practice in neuroimaging to use as homogenous of a group as possi-ble. In keeping with this, the sample used here was of only one gender (female), and relatively young. Although this may improve the ability to identify relevant activations, it may also limit the implications of the findings. Results may be systematically different for those of a different gender, age, or level of financial sophistication.
ErrorDetectionandReframingDecisions to change one’s financial advisor were predi-cated by activation in regions of the brain associated with error detection, including detecting errors made by others.
Table 2. Frequency of Advisor Switching During Varying Returns
Returns Total switches%
Rising market 19.5
Flat market 42.0
Falling market 38.5
Outperforming market 25.2
Underperforming market 74.8
Journal of Financial Counseling and Planning Volume 23, Issue 2 201210
Table 3. BOLD Signal Greater During Switching Periods than During Non-Switching Periods
Peak-level Cluster-level
Cluster Peak location title Peak MNI coordinates Z-score p (FWE-corr) ke
1 R. Parietal Cortex, Inferior Parietal Gyrus (BA 40) 56, -44, 44 4.68 0.000 885
R. Parietal Cortex, Inferior Parietal Gyrus (BA 40) 50, -50, 42 4.17
R. Parietal Cortex, Inferior Parietal Gyrus (BA 40) 48, -46, 54 4.14
2 L. Prefrontal Cortex, Middle Frontal Gyrus (BA 10) -36, 48, 8 4.68 0.001 518
L. Prefrontal Cortex, Middle Frontal Gyrus (BA 10) -36, 56, 6 4.05
L. Prefrontal Cortex, Middle Frontal Gyrus (BA 10) -38, 44, 26 3.86
3 L. Parietal Cortex, Inferior Parietal Gyrus (BA 40) -54, -44, 46 4.63 0.004 403
L. Parietal Cortex, Inferior Parietal Gyrus (BA 40) -58, -38, 42 4.02
L. Parietal Cortex, Inferior Parietal Gyrus (BA 40) -40, -56, 58 3.46
4 Medial Frontal Cortex (BA 8) 2, 32, 42 4.53 0.004 405Dorsal Anterior Cingulate Cortex, Cingulate Gyrus (BA 32) 0, 24, 40 4.44
5 R. Precentral Gyrus 52, 18, 2 4.13 0.489 77
6 R. Prefrontal Cortex, Middle Frontal Gyrus (BA 10) 38, 44, 26 3.87 0.374 94
R. Prefrontal Cortex, Middle Frontal Gyrus (BA 10) 38, 52, 20 3.47
Note. Height threshold t = 3.61 (p = 0.001) Extent threshold (k = 0 voxels) Voxel size 2x2x2 mm Volume 182552 voxels Expected voxels per cluster, k = 25.199 FWHM (in mm) = 14.7x14.5x12.2.
It is plausible that underperforming the market, which was also associated with increased likelihood of advisor switching, was perceived as an advisor error. This percep-tion of advisor error then led to an increased propensity to drop one’s advisor in favor of another. Periods of under-performing the overall market, however, are an unavoid-able part of any investment strategy. Even a strategy that produces superior returns over the long term will underper-form the market on certain days, weeks, months, quarters, or even years. Given that advisors cannot avoid periods of underperformance, what client communication strategy
might this suggest? It is possible that periods of underper-formance can be reframed, not as errors, but as expected fluctuations. To the extent that periods of underperform-ance are not viewed as errors, the propensity to switch advisors during such periods might be reduced.
Some research suggests that such reframing may be suc-cessful at changing physiological responses to losses. Sokol-Hessner et al. (2009) demonstrated that reframing losses not only resulted in greater risk taking, but also re-duced the physiological responses to losses as measured by
Journal of Financial Counseling and Planning Volume 23, Issue 2 2012 11
skin conductance response. In that study, when participants were instructed to think of each potential gamble sepa-rately, as if it was the only one, they demonstrated greater aversion to gambles and greater physiological responses to experienced losses. However, both the aversion to gambles as well as physiological responses to experienced losses dropped when subjects were told to consider all potential gambles together, as if creating a portfolio, including the guidance, “All that matters is that you come out on top in the end—a loss here or there will not matter in terms of your overall portfolio. In other words, you win some and you lose some” (Sokol-Hessner et al., 2009, p. 3).
Certainly, the effect of “bracketing” on loss aversion has been seen in a variety of behavioral results (James, 2012). Simply not checking the market as frequently has been shown to decrease loss averse behavior and consequent-
ly overall returns (Andreassen, 1990; Thaler, Tversky, Kahneman, & Schwartz, 1997). However, the result from the Sokol-Hessner et al. (2009) study suggests that such bracketing actually changes physiological processes. This was confirmed by Sokol-Hessner et al. (2012), who ran es-sentially the same study using fMRI. Reframing decisions in terms of an overall portfolio not only changed behavioral outcomes as before, but also specifically reduced activa-tion in the amygdala region of the brain. As the amygdala is known to mediate arousal responses, this shows that the difference in arousal demonstrated through skin conduct-ance response in Sokol-Hessner et al. (2009), resulted spe-cifically from a change in activation of the amygdala.
Such a result lends credence to the possibility that inten-tionally reframing periods of underperformance in advance may successfully change the neural activations associated
Figure 2. Glass Brain Images of BOLD Signal Contrasts
Switching > Non-Switching “Quiet” Period at p < .0001 uncorrected
Non-Switching “Quiet” Period > Switching at p < .0001 uncorrected
L R
L R
L
R
L
R
Journal of Financial Counseling and Planning Volume 23, Issue 2 201212
with subsequent advisor underperformance, and potentially, change the likelihood of changing advisors. Future research may be able to establish the effectiveness, and neural mech-anisms, of these types of prophylactic reframing strategies in the context of advisor selection. However, some evi-dence suggests the special relevance of such loss aversion research. As mentioned previously, activation in the ACC as seen in the present study has been associated with error detection. Magno, Foxe, Molholm, Robertson, and Garavan (2006) advanced a hypothesis that “the functional role of the cingulate is not particular to errors but instead is related to an evaluative function concerned with on-line behavioral adjustment in the service of avoiding losses” (p. 4769). This would suggest even more strongly that reframing losses is of central importance in influencing the neural activations that result in the choice to switch advisors.
LessonsfromLossChasingThe broad similarity of neural activations associated with switching financial advisors in the present study
with choosing to stop chasing losses in a gambling study suggests the possibility that some research on gambling behavior may be usefully applied to investment choices and advisor selection. Conceptually, the decision to stop chasing losses in a gambling context and the decision to stop using a particular financial advisor appear similar, especially given the association of advisor switching with underperforming the market. In both cases, the person ex-periences negative outcomes. If optimism is maintained re-garding future outcomes, then the gambling behavior con-tinues (or the advisor is retained). However, at the point that optimism regarding future results evaporates, further gambling or further use of the financial advisor stops. Loss chasing is a behavior of central importance in the study of gambling and gambling problems. It is the essen-tial characteristic that uniquely defines pathological gam-bling in contrast with other forms of addiction. Lesieur and Rosenthal (1991), in a review of the literature prepared for the American Psychiatric Association task force on DSM-
Table 4. BOLD Signal Greater During Non-Switching Periods than During Switching Periods
Peak level Cluster-level
Cluster Peak location title Peak MNI coordinates Z-score p (FWE-corr) ke
1 R. Lingual Gyrus (BA 18) 2, -84, -4 4.73 0.000 3406
L. Cuneus (BA 18) -24, -82, 20 4.54
L. Cuneus (BA 18) -8, -76, 18 4.21
2 R. Fusiform Gyrus (BA 20) 38, -40, -24 3.96 0.362 96
R. Anterior Lobe, Culmen 28, -48, -26 3.81
3 L. Precentral Gyrus (BA 4) -44, -12, 46 3.84 0.453 82
L. Precentral Gyrus (BA 4) -52, -8, 44 3.74
L. Precentral Gyrus (BA 4) -36, -14, 46 3.34
4 L. Fusiform Gyrus (BA 20) -36, -36, -22 3.77 0.976 14
5 L. Parahippocampal Gyrus (BA 36) -36, -22, -18 3.65 0.983 12
6 R. Superior Temporal Gyrus (BA 41) 42, -32, 6 3.53 0.996 5
7 L. Anterior Lobe, Culmen -22, -46, -18 3.50 0.960 18
8 L. Cingulate Gyrus (BA 31) -18, -54, 20 3.50 0.965 17
9 L. Posterior Cingulate (BA 29) -10, -50, 18 3.47 0.076 14
Note. Height threshold t = 3.61 (p = 0.001) Extent threshold (k = 0 voxels) Voxel size 2x2x2 mm Volume 182552 voxels Ex-pected voxels per cluster, k = 25.199 FWHM (in mm) = 14.7x14.5x12.2.
Journal of Financial Counseling and Planning Volume 23, Issue 2 2012 13
IV explain, “These criteria (for “Pathological Gambling”) were specifically modeled after those for psychoactive substance dependence in the DSM-III revision. All the cri-teria, with the exception of criterion five (chasing losses), have their counterpart in the diagnosis of alcohol, heroin, cocaine and other forms of drug dependence” (pp. 7-8). Similarly, Schellinck and Schrans (1998) suggested the loss chasing behavior “will be highly effective in discrimi-nating between problem players and those in the other (diagnostic) segments” (Section: 3-56). A variety of other research in gambling has demonstrated that loss chasing is a core phenomenon in problem gambling (Dickerson & Adcock, 1987; Lesieur, 1984; O’Conner & Dickerson, 2003; Orford, Morison, & Somers, 1996). Clearly, in the gambling context, loss chasing can become a problematic behavior. However, in the investment con-text, continued investment in the face of down markets, or temporary underperformance, is often critical to long term investor success. As the popular saying goes, investor returns are more about “time in” the market than “timing” the market. Such behavior also has important macroeco-nomic consequences. Excessive reactions to negative mar-ket events dramatically exacerbate recessionary trends by contracting available capital. From both an individual-lev-el and macro-level perspective, encouraging continuation of sound investment strategies in the face of losses should produce relatively positive outcomes. Thus, understanding predictors of neurally similar behaviors in gambling may generate insight into strategies that may also be effective in an investment context. Lambos and Delfabbro (2007) established that problem gambling was not associated with reduced numerical ability or with any misunderstanding of gambling odds. Instead, “pathological gamblers are particularly prone to various cognitive biases that may explain why they con-tinue to gamble despite having incurred substantial losses” (p. 157). A variety of studies have confirmed a relationship between measurements of problem gambling and suscepti-bility to cognitive biases related to gambling (e.g., Jeffer-son & Nicki, 2003; Joukhador, Blaszczynski, & MacCal-lum, 2004; Toneatto, Blitz-Miller, Calderwood, Dragonetti, & Tsannos, 1997). A shared characteristic of many such biases is a reinterpre-tation of gambling losses. For example, loss experiences may be interpreted as “near misses.” Griffiths (1999) ex-plained that the problem gambler “is not constantly losing but constantly nearly winning” (p. 442). Near misses are
inevitable in many games. For example, slot machine play-ers interpret “their” machine later paying out to another player as a near miss (O’Connor & Dickerson, 1997). Poker players are unlikely to play for an extended period without experiencing a near-miss, and such near misses are a major reason for chasing losses (Browne, 1989). Given the wide variety of potentially winning combinations in some electronic gaming machines, Delfabbro and Wine-field (1999) suggested, “As a result, it is possible to see almost every outcome as a near-miss” (p. 448).
A related heuristic is to interpret losses as providing infor-mation that will improve future outcomes. For example, interpreting a loss as a near miss can relate to a cognitive distortion of probability, leading to the belief that one is about to be lucky (Griffiths, 1990). Reid (1986) also noted this inclination to believe that success was approaching due to near-miss experiences explaining, “there was a noticeable tendency to think of gaining information from a near-miss even when the outcome could only be a matter of chance” (pp. 32-33). A common example of reinterpret-ing losses as providing information of improving future outcomes is the gambler’s fallacy (a.k.a., representa-tion bias). This heuristic suggests that an event is more probable if it has not occurred for some time (Lambos & Delfabbro, 2007). For example, the fact that a coin flip has produced “tails” for five consecutive flips might suggest an increased likelihood that it will subsequently be “heads.” A variety of other cognitive biases are associated with problem gambling. Summarizing these findings Lambos and Delfabbro (2007) explained, “Dysfunctional gambling of this type is thought to arise because pathological gam-blers frequently fall victim to a variety of well-documented decision-making errors, heuristics or biases …all of which either encourage gamblers to continue playing, or make them overly confident about the potential profitability of gambling” (p. 158). Some heuristics used in investment advice may serve simi-lar roles by reinterpreting losses or market downturns. For example, dollar cost averaging is a strategy of investing fixed sums of money at regular intervals regardless of mar-ket circumstances. It is often explained as a way to pur-chase more shares of a company when they are “cheap,” in that the fixed dollar amount purchases more shares follow-ing a price decline. A variety of research suggests that such a strategy is not optimal (e.g., Knight & Mandell, 1993; Leggio & Lien, 2003). Similar to the gambler’s fallacy, the strategy implies that recent losses in price predict an
Journal of Financial Counseling and Planning Volume 23, Issue 2 201214
increased probability of future gains (i.e., shares follow-ing a drop are “cheap”). And indeed, were this true, that is, if security prices exhibited mean reversion behavior, then such a strategy would be statistically valid (Brennan, Li, & Torous, 2005). However, even if the strategy is not sta-tistically valid, it may produce better investor behavior by reinterpreting losses as buying opportunities. Conversely, disabusing clients of the gambler’s fallacy (i.e., securities are not more likely to increase following a price decline) may result in less time in the market and consequently lower long-term returns.
To the extent that volatility is associated with greater returns over extended periods of time, a rational long-term strategy may be to keep investors in more volatile investments for longer periods of time. Given that the risk of exiting is pronounced following periods of underper-formance or relative loss, heuristics that reinterpret such losses may be critical to sustaining market participation. Gambling research suggests that these heuristics, rather than increasing investors’ general financial and mathemati-cal abilities, may be the key to sustaining market partici-pation. The neurological similarity between switching advisors and ceasing to chase losses in gambling suggests these loss-reinterpretation heuristics may also be critical to avoiding advisor switching during inevitable periods of relative underperformance. Such strategies may also be employed by individual investors who wish to overcome the emotional difficulty of staying with a volatile strategy for a long period of time.
PeopleVersusPerformanceAs discussed previously, immediately preceding advisor switching, subjects appear to have engaged in mathematical comparison and error-detection related activities. Con-versely, during “quiet” periods substantially removed from switching behavior, subjects were more likely to be concen-trating on the images of the advisors themselves, specifical-ly reflected by relatively greater activation in face-specific regions of the occipital cortex. Although this may simply be an artifact of this particular study design, it is also pos-sible that this shifting of attention relates to financial advi-sor switching in the real world. Clients who are intently focused on the financial aspects of advisor performance, for example frequent comparison of returns against vari-ous benchmarks, may be more likely to engage in advi-sor switching. Conversely, clients who are focused on the person of the advisor, (i.e., the relationship with the human being, may be less likely to engage in advisor switching).
Such an emphasis towards people and away from per-formance, at least short-term performance, is common in popular practice-building strategies for financial advi-sors. The emphasis is frequently on building relationships and sharing values, rather than beating the market (e.g., Bachrach, 1996; Mullen, 2009). In a popular guide for building financial planning practices, Katz (1999) suggests completely removing short-term performance benchmarks from reports to clients. Although planners should have the information available to clients who are interested, bring-ing up constant comparisons was not deemed beneficial. Similarly, trying to “beat clients over the head with educa-tion on Modern Portfolio Theory,” was deemed unhelp-ful given that, “Clients only want to know two things: 1) are you competent and 2) do you put their interests first?” (Katz, 1999, p. 205).
ConclusionIn the real world, selecting and changing advisors is a complex, multifaceted and often highly social process. However, neuroimaging results from this simplified ex-perimental example suggests two possible implications. First, following related findings from gambling research, advisors may do well to use loss-reinterpreting heuristics in an effort to keep clients in sound long-term investment strategies during times of negative volatility. Second, em-phasizing personal qualities and relationships may be more effective in retaining clients than consistently drawing at-tention to return-related numerical comparisons.
AcknowledgmentsSpecial thanks go to Dr. Sandra Huston, Dr. Michael O’Boyle, and Benjamin Cummings for their assistance in this project.
ReferencesAndreassen, P. (1990). Judgmental extrapolation and
market overreaction: On the use and disuse of news. Journal of Behavioral Decision Making, 3, 153-174.
Bachrach, B. (1996). Values-based selling: The art of building high-trust relationships for financial advi-sors, insurance agents, and investment reps. San Diego, CA: Aim High Publishing.
Bae, S. C., & Sandager, J. P. (1997). What consumers look for in financial planners. Financial Counseling and Planning, 8(2), 9-16.
Barber, B. M., & Odean, T. (2000). Trading is hazard-ous to your wealth: The common stock investment performance of individual investors. The Journal of Finance, 55(2), 773-806.
Journal of Financial Counseling and Planning Volume 23, Issue 2 2012 15
Batty, M., & Taylor, M. J. (2003). Early processing of the six basic facial emotional expressions, Cognitive Brain Research, 17(3), 613-620.
Brennan, M. J., Li, F., & Torous, W. N. (2005). Dollar cost averaging. Review of Finance, 9(4), 509-535.
Brown, D., & Brown, Z. E. (2008). The relationship be-tween investor attachment style and financial advisor loyalty. Journal of Behavioral Finance, 9(4), 232-239.
Browne, B. R. (1989). Going on tilt: Frequent poker players and control. Journal of Gambling Studies, 5(1), 3-21.
Campbell-Meiklejohn, D. K., Woolrich, M. W., Passing-ham, R. E., & Rogers, R. D. (2007). Knowing when to stop: The brain mechanisms of chasing losses. Biological Psychiatry, 63, 293-300.
Carter, R. M., O’Doherty, J. P., Seymour, B., Koch, C., & Dolan, R. J. (2006). Contingency awareness in hu-man aversive conditioning involves the middle fron-tal gyrus. NeuroImage, 29(3), 1007-1012.
Chang, M. L. (2005). With a little help from my friends (and my financial planner). Social Forces, 83(4), 1469-1497.
Chochon, F., Cohen, L., van de Moortele, P. F., & De-haene, S. (1999). Differential contributions of the left and right inferior parietal lobules to number processing. Journal of Cognitive Neuroscience, 11(6), 617-630.
Christiansen, T., & DeVaney, S. A. (1998). Antecedents of trust and commitment in the financial planner-client relationship. Financial Counseling and Plan-ning, 9(2), 1-10.
Davis, (2007). Who’s sitting on your nest egg? Why you need a financial advisor and ten easy tests for find-ing the best one. New York: Bridgeway Books.
Davis, N., Cannistraci, C. J., Baxter, P. R., Gatenby, J. C., Fuchs, L. S., Anderson, A. W., & Gore, J. C. (2009). Aberrant functional activation in school age children at-risk for mathematical disability: A functional im-aging study of simple arithmetic skill. Neuropsycho-logia, 47(12), 2470-2479.
De Bruijn, E. R. A., de Lange, F. P. D., von Cramon, Y., & Ullsperger, M. (2009). When errors are rewarding. The Journal of Neuroscience, 29(39), 12183-12186.
Dehaene, S., & Cohen, L. (1997). Cerebral pathways for calculation: Double dissociation between rote verbal and quantitative knowledge of arithmetic. Cortex, 33, 210-250.
Delfabbro, P. H., & Winefield, A. H. (1999). The danger of over-explanation in psychological research: A reply to Griffiths. British Journal of Psychology, 90, 447-450.
Dickerson, M. G., & Adcock, S. (1987). Mood, arousal and cognitions in persistent gambling: Preliminary investigations of a theoretical model. Journal of Gambling Behavior, 3(1), 3-15.
Drozdeck, S., & Fisher, L. (2007). The savvy investor’s guide to selecting and evaluating your financial ad-visor. Spokane, WA: Financial Forum Inc.
Dupont, P., Orban, G. A., de Bruyn, B., Verbruggen, A., & Mortelmans, L. (1994). Many areas in the human brain respond to visual motion. Journal of Neuro-physiology, 72(3), 1420-1424.
Elmerick, S. A., Montalto, C. P., & Fox, J. J. (2002). Use of financial planners by U.S. households. Financial Services Review, 11(3), 217-231.
Griffiths, M. D. (1999). The psychology of a near-miss (revisited): A comment on Delfabbro and Winefield. British Journal of Psychology, 90, 441-445.
Grill-Spector, K., Knouf, N., & Kanwisher, N. (2004). The fusiform face area subserves face perception, not ge-neric within-category identification. Nature Neuro-science, 7(5), 555- 562.
Grinblatt, M., & Keloharju, M. (2000). The investment behavior and performance of various investor types: A study of Finland’s unique data set. Journal of Fi-nancial Economics, 55(1), 43-67.
James, R. N., III. (2012). Applying neuroscience to finan-cial planning practice: A framework and review. Journal of Personal Finance, 10(2), 10-65.
Jefferson, S., & Nicki, R. (2003). A new instrument to measure cognitive distortions in video lottery ter-minal users: The Informational Biases Scale (IBS). Journal of Gambling Studies, 19, 387-403.
Joiner, T. A., Leveson, L., & Langfield-Smith, K. (2002). Technical language, advice understandability, and perceptions of expertise and trustworthiness: The case of the financial planner. Australian Journal of Management, 27, 25-43.
Joukhador, J., Blaszczynski, A. P., & MacCallum, F. (2004). Superstitious beliefs in gambling among problem and non-problem gamblers: Preliminary data. Journal of Gambling Studies, 20, 171-180.
Kang, S. K., Hirsh, J. B., & Chasteen, A. L. (2010). Your mistakes are mine: Self-other overlap predicts neural response to observed errors. Journal of Experimental Social Psychology, 46, 229-232.
Katz, D. (1999). On practice management for financial advisers, planners, and wealth managers. Princeton, NJ: Bloomberg Press.

Journal of Financial Counseling and Planning Volume 23, Issue 2 201216
Knight, J. R., & Mandell, L. (1993). Nobody gains from dollar cost averaging analytical, numerical and em-pirical results. Financial Services Review, 2(1), 51-61.
Knops, A., Nuerk, H. C., Fimm, B., Vohn, R., & Willmes, K. (2006). A special role for numbers in working memory? An fMRI study. NeuroImage, 29(1), 1-14.
Lacadie, C. M., Fulbright, R. K., Rajeevan, N., Constable, R. T., & Papademetris, X. (2008). More accurate Ta-lairach coordinates for neuroimaging using non-lin-ear registration. NeuroImage, 42(2), 717-725.
Lambos, C., & Delfabbro, P. (2007). Numerical reasoning ability and irrational beliefs in problem gambling. International Gambling Studies, 7(2), 157-171.
Lancaster, J. L., Rainey, L. H., Summerlin, J. L., Freitas, C. S., Fox, P. T., Evans, … Mazziotta, J. C. (1997). Automated labeling of the human brain: A prelimi-nary report on the development and evaluation of a forward-transform method. Human Brain Mapping, 5, 238-242.
Lancaster, J. L., Woldorff, M. G., Parsons, L. M., Liotti, M., Freitas, C. S., Rainey, L., … Fox, P. T. (2000). Automated Talairach Atlas labels for functional brain mapping. Human Brain Mapping, 10, 120-131.
Leggio, K. B., & Lien, D. (2003). An empirical examina-tion of the effectiveness of dollar-cost averaging us-ing downside risk performance measures. Journal of Economics and Finance, 27(2), 211-223.
Lesieur, H. R. (1984). The chase: Career of the compulsive gambler. Cambridge, MA: Schenkman Publishing.
Lesieur, H. R., & Rosenthal, R. J. (1991). Pathological gambling: A review of the literature (prepared for the American Psychiatric Association task force on DSM-IV committee on disorders of impulse control not elsewhere classified). Journal of Gambling Stud-ies, 7(1), 5-39.
Magno, E., Foxe, J. J., Molholm, S., Robertson, I. H., & Garavan, H. (2006). The anterior cingulate and error avoidance. The Journal of Neuroscience, 26(18), 4769-4773.
Mandell, L., & Klein, L. S. (2009). The impact of financial literacy education on subsequent financial behav-ior. Journal of Financial Counseling and Planning, 20(1), 15-24.
Mattox, S. T., Valle-Inclan, F., & Hackley, S. A. (2006). Psychophysiological evidence for impaired reward anticipation in Parkinson’s disease. Clinical Neuro-physiology, 117, 2144–2153.
Mullen, D. J., Jr. (2009). The million-dollar financial advi-sor: Powerful lessons and proven strategies from top producers. New York: AMACOM.
Newman-Norlund, R. D., Ganesh, S., van Schie, H. T., De Bruijn, E. R. A., & Bekkering, H. (2009). Self-iden-tification and empathy modulate error-related brain activity during the observation of penalty shots be-tween friend and foe. Social Cognitive and Affective Neuroscience, 4, 10-22.
O’Connor, J., & Dickerson, M. (1997). Emotional and cognitive functioning in chasing gambling losses. In G. Coman, B., Evans, & R. Wootton, (Eds.), Re-sponsible gambling: A future winner. Proceedings of the 8th National Association for Gambling Studies Conference (pp. 280-285). Melbourne, Australia: National Association for Gambling Studies.
O’Connor, J., & Dickerson, M. (2003). Definition and measurement of chasing in off-course betting and gaming machine play. Journal of Gambling Studies, 19(4), 359-386.
Oehler, A., Heilmann, K., Läger, V., & Oberländer, M. (2003). Coexistence of disposition investors and mo-mentum traders in stock markets: Experimental evi-dence. Journal of International Financial Markets, Institutions and Money, 13(5), 503-524.
Orford, J., Morison, V., & Somers, M. (1996). Drinking and gambling: A comparison with implications for theo-ries of addiction. Drug and Alcohol Review, 15, 47-56.
Puce, A., Allison, T., Asgari, M., Gore, J. C., & McCa-rthy, G. (1996). Differential sensitivity of human visual cortex to faces, letter strings, and textures: A functional magnetic resonance imaging study. The Journal of Neuroscience, 16(16), 5205-5215.
Reid, R. L. (1986). The psychology of the near miss. Jour-nal of Gambling Behavior, 2(1), 32-39.
Rushworth, M. F. S., Buckley, M. J., Behrens, T. E. J., Walton, M. E., & Bannerman, D. M. (2007). Func-tional organization of the medial frontal cortex. Cur-rent Opinion in Neurobiology, 17, 220-227.
Sandrini, M., Rossini, P. M, & Miniussi, C. (2004). The differential involvement of inferior parietal lobule in number comparison: A rTMS study. Neuropsycholo-gia, 42, 1902-1909.
Schellinck, T., & Schrans, T. (1998). Nova Scotia Video Lottery players’ survey. Halifax, Nova Scotia: Nova Scotia Department of Health.
Sokol-Hessner, P., Camerer, C. F., & Phelps, E. A. (2012). Emotion regulation reduces loss aversion and de-creases amygdala responses to losses. Social Cogni-tive and Affective Neuroscience. Advance online publication. Doi:10.1093/scan/nss002.
Sokol-Hessner, P., Hus, M., Curley, N. G., Delgado, M. R., Camerer, C. F., & Phelps, E. A. (2009). Think-

Journal of Financial Counseling and Planning Volume 23, Issue 2 2012 17
ing like a trader selectively reduces individuals’ loss aversion. PNAS, 106(13), 5035-5040.
Thaler, R. H., Tversky, A., Kahneman, D., & Schwartz, A. (1997). The effect of myopia and loss aversion on risk taking: An experimental test. The Quarterly Journal of Economics, 112(2), 647-661.
Toneatto, T., Blitz-Miller, T., Calderwood, K., Dragon-etti, R., & Tsannos, A. (1997). Cognitive distortions in heavy gambling. Journal of Gambling Studies, 13, 253-266.
Tykocinski, O., Israel, R., & Pittman, T. S. (2004). Inaction inertia in the stock market. Journal of Applied Social Psychology, 34(6), 1559-1816.
Vanni, S., Tanskanen, T., Seppä, M., Uutela, K., & Hari, R. (2001). Coinciding early activation of the human pri-mary visual cortex and anteromedial cuneus. PNAS, 98(5), 2776-2780.
Waymire, J. (2003). Who’s watching your money: The 17 Paladin principles for selecting a financial advisor. Hoboken, NJ: Wiley.
Wood, W. C., O’Hare, S. L., & Andrews, R. L. (1992). The stock market game: Classroom use and strategy. The Journal of Economic Education, 23(3), 236-246.