china's post-economic reform growth: the role of fdi and productivity progress
TRANSCRIPT

China’s post-economic reform growth:The role of FDI and productivity progress
Chyau Tuan a, Linda F.Y. Ng a,*, Bo Zhao b
a Department of Decision Sciences and Managerial Economics, Faculty of Business Administration, The Chinese University of Hong Kong, Hong Kong, Chinab Stephen M. Ross School of Business, University of Michigan, USA
1. Introduction
China has become the top foreign direct investment (FDI) destination among all developing countries and remained hostto the world’s largest share of FDI receipts since its accession to the WTO in 2001. Together with the extremely impressiverecord of FDI influx since China’s economic reform in 1979, China has also experienced remarkable economic growth anddevelopment by achieving a high growth rate of almost 10% per annum, on average, and over 10% during the period afterDeng’s speech in 1992 reaffirming China’s continuous economic opening. Given such a notable economic growthperformance, the quest of China’s sustainable growth continues to stimulate much discussion and vigorous debates amongacademics during recent years. However, in studying China’s growth, special attention has to be paid to the two majorglobalized delta economies (GDEs), Pearl River Delta (PRD) and Yangtze River Delta (YRD), located respectively in the south-and east-coastal China.1
Journal of Asian Economics 20 (2009) 280–293
A R T I C L E I N F O
JEL classification:
F21
O16
Keywords:
FDI
TFP
Growth
Productivity
China
A B S T R A C T
China has become the top FDI destination among all developing countries and remained
host to the world’s largest share of foreign direct investment receipts since its accession to
the WTO in 2001. Given the impressive growth performance and FDI influx into China, the
two globalized delta economies (GDEs), Pearl River Delta (PRD) and Yangtze River Delta
(YRD), have continued to out-perform all other regions in China in terms of FDI absorption
and growth. The role that inward FDI plays in the process of regional development and the
exact channels through which economic growth would be affected are investigated by
panel data estimations of the GDEs at the city level since China’s economic opening and
reform. This research shows consistent results with some recent findings in other
developing countries in that FDI exerted spillover effects and affected productivity (TFP)
growth of the recipients. While TFP was found to be increasing overtime in the GDEs cities
and facilitated economic growth in both PRD/YRD regions, major technology- and
knowledge-related factors including R&D and human capital other than FDI also played
critical roles in TFP enhancement and regional growth. The endogeneity of TFP and the
simultaneous relations of FDI in affecting TFP and output growth are also addressed in this
regard.
� 2009 Elsevier Inc. All rights reserved.
* Corresponding author. Tel.: +852 2609 7812; fax: +852 2603 5104.
E-mail address: [email protected] (Linda F.Y. Ng).1 According to the official definition, the PRD economic region, which comprises of 9 cities/counties in Guangdong Province, has an area of 41.5 thousand
square kilometers. The YRD economic region, which comprises of 16 cities (and officially know as 15 + 1), includes 8 cities in Jiangsu Province, 7 cities in
Zhejiang Province, and a metropolitan city (municipality), Shanghai, has a total area of 109.7 thousand square kilometers. For a visual inspection of the
economic indicators and investment environment of PRD and YRD, please see Tuan, Ng, and Lin (2006, www.jlgis.cuhk.edu.hk/business).
Contents lists available at ScienceDirect
Journal of Asian Economics
1049-0078/$ – see front matter � 2009 Elsevier Inc. All rights reserved.
doi:10.1016/j.asieco.2009.02.010

China’s economic reform and opening policy launched in 1979 successively made PRD and YRD the two most dynamicregions in China.2 These two GDEs represented the two most dominating, fastest growing regions and continued to out-perform all other regions in China in terms of GDP performance and FDI absorption.3 The PRD and YRD, which togetheraccount for only 1.4% of China’s total land area and 7.7% of the total population,4 have contributed (on average) 12.3% and27.4%, respectively to China’s national GDP in recent years; they absorbed 26.2% and 36.1%, respectively, of the total nationalinward FDI during the post-reform period (Table 1). In addition, the GDP growth rates of PRD and YRD reached an average of13.8% and 11.9%, respectively, during the period from 1979 to 2005, a much higher pace than the national average growthrate of 9.7% during the same period. Detailed statistics of the GDP performance and realized FDI of the two delta regionsduring the post-reform period are presented in Table 1, and relevant basic economic indicators comparing the two regionsare further presented in Table 2.
Among the studies of economic growth, Krugman’s (1994) input driven framework has been used in the literature toexamine whether or not China will face the same problems of other Asian countries in terms of excessive capital and laborinput accumulation without rising production efficiency (Collins & Boseworth, 1996). High rates of factor inputaccumulation have been posited as a possible explanation in the case of China’s remarkable growth.
Until recently, inward FDI has been considered a critical factor among the many factors contributing to sustainedeconomic growth in China (Wei, 1995; Borensztein, de Gregorio, & Lee, 1998; Wu, 1999; Wei & Liu, 2001; Graham & Wada,2001; Whalley & Xin, 2006; Tuan & Ng, 2004, 2007; Ng & Tuan, 2006; Yao & Wei, 2007).5 Although inward FDI is believed tohave a positive significant effect on economic growth, the exact mechanism of how FDI has impacted the developmentprocess is far from being well understood (Yao & Wei, 2007; Tuan & Ng, 2007). The fascinating developments in China’sglobalization also provide us with a tempting opportunity to study the role of inward FDI in the country’s economic growth.In this connection, the total factor productivity (TFP) framework may provide us with an effective tool to measure productionefficiency and, in addition, provide some evidence regarding the sources of economic growth in the context of FDI absorption.
The early international economics literature suggests that FDI is a significant source of innovation and technologytransfer (Caves, 1974; Findlay, 1978; Mansfield & Romeo, 1980). It is believed that through either the multinationals’competitive force or a demonstration effect, locally owned firms operating in imperfect markets may be induced to achievehigher levels of technical or X-efficiency (Leibenstein, 1966). FDI not only serves as a capital injection to the domestic marketbut also plays a central role for technological spillover and advancement of managerial skills. FDI is believed to be embeddedwith new technologies and know-how not available in the host countries and could also accelerate the speed of the adoptionof technology as well as improve production efficiency in the host countries.
Table 1
Realized FDI and real GDP growth in the globalized delta economies (1979–2005).
Year China Greater Yangtze River Delta (GYRD)a Greater Pearl River Delta (GPRD)a
Greater YRD Shanghai Jiangsu
Province
Zhejiang
Province
Guangdong
Province
Real GDP (100 million RMB)
1979 3922.2 (100) 711.9 (18.2) 292.3 (7.5) 279.1 (7.1) 140.5 (3.6) 201.6 (5.1)
1992 12812.9 (100) 2639.2 (20.6) 792.3 (6.2) 1190.2 (9.3) 656.7 (5.1) 1125.9 (8.8)
1997 21645.2 (100) 5336.3 (24.7) 1523.1 (7.0) 2407.6 (11.1) 1405.6 (6.5) 2369.8 (10.9)
2003 35836.0 (100) 10094.9 (28.2) 2843.2 (7.9) 4547.2 (12.7) 2704.5 (7.5) 4596.1 (12.8)
2004 39565.0 (100) 11560.8 (29.2) 3246.8 (8.2) 5217.9 (13.2) 3096.1 (7.8) 5275.7 (13.3)
2005 43902.8 (100) 13072.5 (29.8) 3607.2 (8.2) 5973.4 (13.6) 3491.9 (7.9) 6003.9 (13.7)
1979–2005 average 26435.0 (100) 7231.4 (27.4) 2052.0 (7.8) 3267.0 (12.4) 1912.5 (7.2) 3256.6 (12.3)
Realized FDI (US$ 100 million)
1992 110.1 (100) 29.6 (26.9) 12.6 (11.4) 14.0 (12.7) 2.9 (2.6) 35.5 (32.3)
1997 452.6 (100) 121.0 (26.7) 48.1 (10.6) 57.9 (12.8) 15.0 (3.3) 117.1 (25.9)
2003 535.1 (100) 271.0 (50.7) 58.5 (10.9) 158.0 (29.5) 54.5 (10.2) 155.8 (29.1)
2004 606.3 (100) 253.6 (41.8) 65.4 (10.8) 121.4 (20.0) 66.8 (11.0) 100.1 (16.5)
2005 603.3 (100) 277.6 (46.0) 68.5 (11.4) 131.8 (21.8) 77.2 (12.8) 123.6 (20.5)
1983–2005 average 269.9 (100) 86.7 (36.1) 25.9 (9.6) 44.8 (16.6) 16.0 (5.9) 70.6 (26.2)
a Notes: Provincial level data is used as approximation for the measurements of the two globalized delta economies (GDEs), Yangtze River Delta (YRD) and
Pearl River Delta (PRD) and denoted as the ‘‘Greater’’ regions; percentage share of the total in parentheses. Source: Compiled from the Statistical Yearbooks
of China, Guangdong, Jiangsu, Zhejiang and Shanghai, 2006.
2 Following the implementations of preferential FDI policies in PRD, Guangdong was first designed as the showroom for FDI promotion in the early 1980s
and in YRD, including Shanghai and 15 selected cities in Jiangsu and Zhejiang provinces, was further opened up to receive inward FDI in 1992. For the
stepwise economic opening of China to receive FDI and the implementations of FDI preferential policies by stages, please see Ng and Tuan (2001).3 The reconfirmation of China’s commitment to economic opening in 1992 has stimulated a much larger volume of inward FDI of more diversified
sources, including those from Korea, Europe, and U.S.A., other than the original dominating sources from Hong Kong and Taiwan.4 When measured at the provincial level to be denoted as the ‘‘Greater’’ regions as presented in Tables 1 and 2, the two ‘‘Greater’’ regions together
accounted for 4% of China’s total land area and 16.6% of the total population.5 For a review of literatures on FDI and regional growth theories, see Berthelemy and Demurger (2000), Lim (2001), Mullen and Williams (2005), Brock
(2005), and Whalley and Xin (2006).
C. Tuan et al. / Journal of Asian Economics 20 (2009) 280–293 281

From a technical perspective, technological aspects have been considered to relate more to innovation, other than R&D,where firms would draw improvements from technology advancements in sciences and technical progress as sources ofinnovation. FDI is believed to transfer technology and technological know-how to the host countries via channels such asspillovers, demonstration, transfer of management know-how, and competitive effects (Teece, 1977; Aitken & Harrison, 1999;Blomstrom & Kokko, 2001; Keller, 2004; Javorcik, 2004). The presence of multinational subsidiaries in an industry may speed upthe process or lower the cost of the technology transfer. Moreover, the threat of competition may also stimulate domestic firmsto innovate. Both imitation effects and the movement of personnel trained by multinational subsidiaries would enhance thetransfer of technology to local firms (de Mello, 1997). Moreover, the location and spatial agglomerations of the foreign and localfirms and their interactions and synergies would contribute to regional economic growth (Ng & Tuan, 2006).
In this context, the impressive growth phenomena observed in PRD/YRD have given rise to a number of interestingresearch questions. What role does inward FDI play in the process of regional growth and development in these two deltaregions and exactly how or through what channels would FDI affect growth, particularly in a huge country like China? Byfocusing on the regional development in the GDEs at the city level, the aims of this study include: (1) to measure productionefficiency by TFP and make comparisons over time and across the cities in the GDEs; (2) to study the role and effects ofinward FDI on TFP growth; (3) to measure the contributions of other technology-related factors including R&D and humancapital on TFP; and (4) to examine the effects of FDI and TFP on growth. The endogeneity of TFP in facilitating economicgrowth is further addressed. The research findings of this study may provide important implications and direction in thefuture studies of regional development in China.
The rest of this paper is organized as follows. Section 2 reviews the major literature on the relationship between FDI,productivity progress, and economic growth. Section 3 describes the research hypotheses, estimation methods, and the data.Section 4 presents the research findings, and Section 5 provides some concluding remarks.
2. FDI, productivity progress, and growth: literature review
2.1. Evidence on TFP and growth in China
Following the neoclassical framework of economic growth (Solow, 1957) focusing on factor accumulation andproductivity growth, TFP is well-recognized as a possible measurement of factor productivities in the process of economicgrowth. The relationships among technology change, factor productivities, and economic growth have been extensivelydebated and reported in a voluminous literature on growth. According to the well-known ‘‘East Asian Miracle’’ (World Bank,
Table 2
Brief profiles of the globalized delta economies: major economic indicators (1978–2005).
Economic indicators Greater Yangtze-River Delta (GYRD)a Greater Pearl-River Delta (GPRD)a
Shanghai Zhejiang
Province
Jiangsu
Province
Guangdong
Province
Land area and population
Land area (thousand km2) 6.34 101.80 102.60 179.76
Average population (year-end) (10 thousand person) 1263.51 4234.01 6618.39 6428.92
Population density (person/km2) 1992.76 415.91 645.07 357.65
Output performance
Real GDP in 1978 price (100 million RMB) 1193.44 1050.76 1807.13 1754.12
Real GDP per capita in 1978 price (RMB per person) 9196.99 2326.75 2545.04 2232.68
Investments
Investment in fixed assets (100 million RMB) 1014.96 1367.63 1715.84 1749.04
Realized FDI (US$ million) 2385.85 1596.73 4118.99 6031.65
R&D expenses
R&D expenditures (100 million RMB) 80.91 37.83 76.58 95.07
R&D expenditures as percentage of GDP (%) 1.62 0.48 0.75 0.75
Employment
Average employment (10 thousand person) 789.69 2482.51 3849.08 3322.15
Education
Number of student enrollment in
higher education (10 thousand person)
17.96 14.48 29.00 19.65
Student enrollment in higher
education as percentage of population (%)
1.39 0.33 0.42 0.28
Number of student enrollment in secondary
education (10 thousand person)
72.70 211.43 361.94 377.69
Student enrollment in secondary
education percentage of population (%)
5.75 4.96 5.44 5.71
Source: Compiled from the Statistical Yearbooks of China, Guangdong, Jiangsu, Zhejiang and Shanghai, 2006.a Notes: As in Table 1.
C. Tuan et al. / Journal of Asian Economics 20 (2009) 280–293282

1993) study, the rapid economic growth experience of the eight East Asian economies over the previous decade was mainlyattributable to TFP growth. Krugman (1994), however, argued that the secret of the rapid growth in the four Asian NIEs wasinput-driven, which means that economic growth depended heavily on factor inputs but had nothing to do with TFP orproduction efficiency improvements. The issue of accumulation versus assimilation in the growth of East Asian countries hasalso been delineated (Collins & Boseworth, 1996). Although some scholars have pointed out that there may still exist someproblems under the notion and measurement of TFP (Felipe, 1997) 6 and a call for a theory of TFP is considered warranted(Prescott, 1998), studying the growth process in both developed and developing countries is still a major focus.
In China, the study of TFP growth is quite limited and the current available studies are mainly based on some highlyaggregate data at country or provincial level. Regional TFP studies using more disaggregated data at the city/county level areparticularly scarce due to either lack of information or of data. Among the few studies, Zhang, Wu, & Zhang (2004) observedthat China’s TFP using country-level data has begun to improve since her economic reform but the TFP gain in 1979 is rathersmall when compared with that in 1952. Arayama and Miyoshi (2004) computed provincial TFP and concluded that theregional diversity and growth in China could be attributable to the sources of factor inputs, human capital, and TFP growth.
2.2. Evidence on TFP enhancement: FDI and technology-related factors
FDI is believed to transfer technology and technological know-how via channels such as technology spillovers,demonstration effect, transfers of management know-how, and competitive effects. Recent voluminous research papershave discussed how FDI, especially that from developed countries, would facilitate technology flows into the recipients viatechnology advancements, R&D spillover activities, and innovations (Teece, 1977; Coe & Helpman, 1995; Coe, Helpman, &Hoffmaister, 1997; Aitken & Harrison, 1999; de Mello, 1997, 1999; Hejazi & Safarian, 1999; Liu, Siler, Wang, & Wei, 2000; dela Potterie & Lichtenberg, 2001; Campos & Kinoshita, 2002). The impact of FDI on the technological ‘‘catching up’’, especiallymade by developing countries, can become more important than its role as a source of capital (Molero, 1995; Mytelka &Barclay, 2004).
Both direct and indirect (spillover) effects of inward FDI on productivity enhancement should be in evidence. As noted byBalasubramanyam, Salisu, and Sapsford (1996), it is the ability of FDI to transfer not only production knowledge but alsomanagerial skills that distinguishes it from all other forms of investment, including portfolio investment and foreign aid. FDIis further considered an effective way to introduce advanced technology to the host countries (Haskel, Pereira, & Slaughter2002). However, mixed results have been cited. It is argued that a country has to reach a minimum human capital thresholdin order to benefit from FDI (Xu, 2000). Moreover, the results of some other studies demonstrate an inverse relationshipbetween FDI and industrial productivity and an absence of evidence for positive spillover in the host countries (Haddad &Harrison, 1993; Aitken & Harrison, 1999).
In studying the contributions of FDI to developing countries, country evidence shows that FDI is critical in facilitatingtechnology upgrade in the host country via spillovers and interactions of foreign and local firms. In Venezuela, a positivelong-run relation between TFP and FDI is found (de Mello, 1999). The cases of Trinidad/Tobago and Costa Rica further showthat the strategic use of FDI for innovation has proven the significant goals of FDI in the long-term development process. Itsimpacts would benefit more than a single enterprise and further strengthen local innovation capabilities (Mytelka & Barclay,2004). In Argentina, MNCs subsidiaries are found to play an active role in the technology progress (Marin & Bell, 2006). In thecase of Africa, FDI is claimed to be an effective medium for technology transfer through industry technology spillovers suchas in Zambia (Bwalya, 2006) and Morocco (Haddad & Harrison, 1993; Gorg & Strobl, 2001). Based on micro (firm)-level datafrom Lithuania, evidence further suggests the existence of positive productivity spillovers from FDI to the host countrythrough the contacts between foreign affiliates and their local suppliers in the upstream sectors and between shareddomestic and foreign ownership (Javorcik, 2004).
In the case of China, Fang and Parker (2004) computed the TFP of the Chinese electronics industry and confirmed thatwhile the performance under all ownership forms has improved, productivity in state-owned enterprises continues to lagbehind productivity in collectives and joint ventures, including wholly foreign-owned firms. Evidence from the electronicsand textile industries in China further reported that inward FDI enhances the productivity of FDI-receiving firms butdepresses that of domestic firms (Hu & Jefferson, 2002), which is consistent with the ‘‘market-stealing’’ explanation offeredby Aitken and Harrison (1999). Moreover, FDI by ownership and industry type affects both the productivity and the growthof the FDI recipient. Micro (firm)-level evidence from the manufacturing joint ventures in China further show that foreigninvestments equipped with higher technology and innovation capabilities have enabled those joint ventures to achievemuch higher industry technology performance than their local Chinese counterparts (Ng & Tuan, 2005).
Some further exploration of the determinants of TFP is meaningful. Among many possible factors being suggested tocontribute to production efficiency, evidence indicates that technology-related factors do matter in TFP enhancement. Directlinks between human capital and TFP may exist (Islam, 1995; Benhabib & Spiegel, 1994; Liu & Wang, 2003). Related factorsbeing further examined include technology and entrepreneurial background (Wu, 1999); outward orientation and humancapital (Miller & Upadhyay, 2000); firms’ internal environment, such as human capital, and external environment, such as
6 A survey of TFP growth in East Asia can be found in Felipe (1997). An overview of the TFP measurements can be found in Carlaw and Lipsey (2003) where
productivity has been argued as not a measure of technology change.
C. Tuan et al. / Journal of Asian Economics 20 (2009) 280–293 283

FDI (Yao, 2006); R&D intensity (Murakami, 2007); and FDI and licensing (Yasar, Paul, & Morrison, 2007). Based on moredetailed Japanese firm-level data, Todo (2006) confirmed the positive spillover effects of R&D incurred by foreign firms onimproving the productivity of local firms. Cheung and Lin (2004) chose provincial patent applications data in China as ameasure of innovation and found positive spillover effects of FDI on the number of domestic patent applications, whichhighlighted a ‘‘demonstration effect’’ of FDI.
In sum, the above evidence suggests that the critical role of FDI in technological transfer and diffusion and innovativeactivities in the host country should in no way be underestimated. Transnational corporations not only set the pace fortechnological change but also influence the opportunities for learning and innovations. Multinationals constitute a salient actorin providing global generation of innovations in the form of R&D and innovative activities, both at home and abroad, as well as inthe acquisitions of existing R&D laboratories or green-field R&D investment of the recipients (Archibugi & Iammarino, 2002).
3. Research methodology
3.1. Research hypotheses
Five research hypotheses are postulated to examine China’s productivity growth since its economic opening and thefactors that may have produced significant impact on regional productivity and economic growth with specific reference tothe two GDEs, that is, PRD/YRD, in China. TFP and its changes are adopted as a convenient measurement of productivityprogress as well as in the understanding of the sources of productivity changes.
Hypothesis 1. TFP is hypothesized to increase after China’s post-economic reform such that productivity improves alongwith economic opening over time.
Hypothesis 2. TFP is positively affected by factors that might bring along and/or facilitate innovative ideas and technologyprogress that contribute to productivity enhancement. The effects of such factors, which include inward FDI, research anddevelopment activities (R&D), and human capital endowments, are examined in such a way as to test whether: (a) inwardFDI plays a positive key role in enhancing regional productivities; (b) R&D activities have significant positive impacts onproductivity enhancement; and (c) human capital, which refers to the stock of productive skills and technical knowledgeembodied in labor, has a positive impact on productivity growth.
Hypothesis 3. TFP is endogenous to economic growth such that FDI, R&D, and human capital affect growth positivelythrough TFP.
Hypothesis 4. FDI directly and positively affects economic growth.
Hypothesis 5. The human capital endowment directly affects economic growth, such that the quality of human capital and/or types of human capital and their interactions or synergies are significant and positively affect growth.
3.2. The model
Following the traditional Solow residual framework of a production function with neutral technology change andcompetitive factors (Solow, 1957), the Cobb–Douglas production function for each of the two GDEs (r) (where r = 1–2, thetwo regions, are omitted for simplicity) is specified as below:
Yit ¼ AitKait Lb
iteit (1)
where Yit, Kit, and Lit are the production output, capital input, and labor input of city i at time t, respectively; a and b are thecapital and labor elasticities, respectively, where 0 < a < 1 and 0 < b < 1; and eit is the stochastic shocks to production ofcross section i at time t in region r. Hence, Ait measures TFPit, which can be used to pick up the changes of productionefficiency of i cross sections over time t. We allow for the possibility of non-constant return to scales by not restricting (a + b)to equal one. Rewriting Eq. (1) in natural logarithms form yields:
ln Yit ¼ ln Ait þ a ln Kit þ b ln Lit þ ln eit (2)
Eq. (2) is estimated by the methods of pooled OLS and two-way fixed effects panel estimations. The OLS estimation thatpools together all the time series and cross-section data provides us with the baseline estimation results. In the two-wayfixed effects panel data estimation, we define city-specific effects as csi, and time-specific effects as tst, where i and t are thecross-section number and time point, respectively, to capture the fixed effects over different cities and various time periods.These two variables together with the constant term c form the logarithmic index of TFP as presented by Eq. (3) such that
ln Yit ¼ ðc þ csi þ tstÞ þ a ln Kit þ b ln Lit þ g it (3)
Using the estimated elasticities of capital (a) and labor (b) and by rewriting Eq. (2), we can construct the series of city-level logarithmic index of the TFP measurement by i cross-sectional units in t years as:
TFPit ¼ ln Ait ¼ ln Yit � a ln Kit � b ln Lit (4)
C. Tuan et al. / Journal of Asian Economics 20 (2009) 280–293284

In order to examine the sources of growth in the two GDEs regions, the following set of simultaneous Eqs. (5) and (6) areconstructed for r. Eq. (5) explains the effects of FDI together with other technology-, knowledge-related explanatoryvariables on TFP, that is:
TFPit ¼ f ðFDIit;R&Dit ;HCitÞeit (5)
where FDI, R&D, and HC are assumed to be the three major sources affecting technological productivity growth (TFP). Inaddition, TFP (in Eq. (5)) is endogenous to GDP growth (Y) which is also assumed to be affected by both FDI and HC such that:
Yit ¼ f ðTFPit ; FDIit ;HCitÞe0it (6)
Furthermore, when the quality of HC is reflected by distinct types, such as HC1 and HC2, the joint (interaction) effectsmeasuring the synergies between HC types (HC1 � HC2) are used for alternate estimations. Eqs. (5) and (6), therefore,become:
TFPit ¼ f ðFDIit;R&Dit ;HC1it ;HC2it ;HC1it � HC2itÞeit (5a)
Yit ¼ f ðTFPit ; FDIit ;HC1it ;HC2it ;HC1it � HC2itÞe0it (6a)
Eqs. (5) and (6) (Version 1) and Eqs. (5a) and (6a) (Version 2) are the two sets of simultaneous equations to be estimatedby 2SLS in log-linear form. All of the estimated parameters of the simultaneous equations are expected to carry positive (‘+’)signs representing the positive effects of the predictors on TFP and Yit.
3.3. Data and measurement
The panel data used for the estimation of the production function covers the city level data to include 23 GDEs citiesincluding 8 cities in PRD and 15 cities in YRD over the period from 1978 to 2004.7 The distinction between PRD and YRDcities for statistical estimation purposes is important because the impacts of FDI and other technology- and knowledge-related variables may not necessarily show homogeneous effects across these two regions. The data are compiled fromvarious issues of the official statistical yearbooks of relevant cities from 1979 to 2005, Statistical Data and Materials on 55
Years of New China, Statistical Data and Materials on 50 Years of Zhejiang, and Science and Technology Statistical Year Books of
China from 1996 to 2005. The measurements of the variables used to perform the statistical estimations are summarizedbelow.(1) Output Production
The values of output production (Y) is measured by real gross domestic product (GDP) at the city level in the unit of tenthousand RMB (Yuan) and are all converted to 1978 constant price using the GDP deflator. Both real GDP and GDP percapita are used as measurements.
(2) Capital stock
There is no published data on physical capital stock (K) at the city level and only statistics on annual total investmentin fixed assets is available. Therefore, the perpetual inventory method (PIM) is used to estimate city-level capital stock forthe years 1978–2004.8 PIM is defined as Kit = Kit�1(1 � dit) + Iit, where K denotes capital stock, I denotes investment, ddenotes depreciation rate, and i and t denote city and time, respectively.
The amount of physical capital stock of the initial year in 1978 (for the estimation of the production function) isapproached as I0/a, where a is obtained by comparing the provincial investment in fixed assets in 1978 and the estimatedphysical capital stock in 1978. The values of the estimated physical capital stock in Shanghai, Guangdong, Jiangsu, andZhejiang in 1978 are obtained from Zhang et al. (2004). A depreciation rate of 9.6%, as suggested by Zhang et al. (2004), isused for the computation. All investment figures are converted to the 1978 constant values using the price indices ofinvestment in fixed assets by region. With the estimated capital stock in 1978, a depreciation rate of 9%, and fixed assetsinvestment obtained from the secondary data published by the China government, a panel of city-level physical capitalstock in the PRD/YRD cities for the period from 1978 to 2004 is constructed and measured in units of ten thousand RMB.
(3) Labor inputLabor input (L) is measured by the number of workers employed in each of the 23 cities. As reported in thestatistical yearbooks, this measure does not adjust for labor hours or quality of employment.
(4) Foreign direct investmentRealized FDI (FDI) is measured by the total amount of realized inward FDI received by each cityin the unit of 100 million US dollars.
(5) Research and developmentProvincial data for R&D expenditures in units of 100 million RMB are available only since 1995and are used as a proxy because city-level data are not available for most cities in the two regions. City-level R&Dexpenditures are measured by the total R&D expenses and R&D share in GDP (that is, R&D/GDP) by cities.
7 The 9 cities/counties (Shi) of PRD are Guangzhou City, Shenzhen City, Zhuhai City, Foshan City, Jiangmen City, Dongguan City, Zhongshan City, Huizhou
Urban District, and Zhaoqing City. The 16 cities of YRD are Shanghai (municipality) City; Nanjing City, Suzhou City, Wuxi City, Changzhou City, Zhenjiang
City, Nantong City, Yangzhou City, and Taizhou City in Zhejiang Province; and Hangzhou City, Ningbo City, Jiaxing City, Huzhou City, Shaoxing City,
Zhoushan City, and Taizhou City in Jiangsu Province.8 See Arayama and Miyoshi (2004) and Zhang et al. (2004).
C. Tuan et al. / Journal of Asian Economics 20 (2009) 280–293 285

(6) Human capitalThree types of human capital (HC) are examined, namely, higher or tertiary education, secondaryeducation, and the sum of secondary and higher education. Correspondingly, three measurements of HC in terms of theproportion of the three types of enrollments in the total population are constructed at the city level for the purpose ofstatistical estimation. These include: (a) the number of students enrolled in higher education (HC1) to total population(P), that is, HC1/P; (b) the number of students enrolled in secondary education (HC2) to total population, where HC2
includes students in both regular secondary schools and specialized secondary schools, that is, HC2/P; and (c) totalstudent enrollment in both secondary schools and higher education (HC where HC = HC1 + HC2) to total population, thatis, HC/P. The three measurements represent three different quality levels of HC such that: (a) HC with a relatively highquality at the tertiary level; (b) HC with basic quality at the secondary level; and (c) HC of basic (secondary) quality leveland above. Further, the interactions or synergies between the two types of HC, HC1/P and HC2/P (that is, HC1/P � HC2/P),are also assumed to create a join (interaction) effect contributing to TFP and GDP growth.
4. Statistical results
4.1. TFP and TFP growth in YRD/PRD: panel data estimations (1978–2004)
4.1.1. Estimations of Cobb–Douglas production function: panel estimations with fixed effects
The Cobb–Douglas production function as specified by Eq. (1) for the two regions, YRD/PRD, during the post-economicopening period of 1978–2004 is estimated by OLS and panel data estimation assuming a two-way fixed effect model. Thestatistical estimation results presented in Table 3 show that the panel estimations yield higher goodness-of-fit (Adj-R2 > 0.98),as well as statistically significant two-way fixed effects in both YRD/PRD. In terms of the production elasticities, YRD has a lowercapital elasticity than PRD (that is, aK = 0.265 versus aK = 0.41, respectively) but much higher labor elasticity (that is, bL = 0.981versus bL = 0.558, respectively). YRD’s output production is subject to increasing returns to scale since the sum of elasticities issignificantly larger than unity (aK + bL = 1.246 > 1; p < 0.05), whereas PRD is subject to decreasing returns to scale (that is,aK + bL = 0.968< 1; p < 0.05). Moreover, the significant two-way fixed effects estimated by the constant terms for time (tst) andcross-section (csi) effects are used to compute TFP growth (ln Ait) through time and by cities (below).
4.1.2. TFP growth through time: estimated results of panel estimations
Significant time effects can be found in both YRD and PRD (r) as observed from the panel data estimations of the Cobb–Douglas production functions for r (=1–2). TFP over the time period (tst) in r is computed from the estimated time-effects andthe corresponding result is presented in Table 4. TFP growth since the economic opening, indicated by major economicevents in four sub-periods, are computed and illustrated in Table 4. The periods include: (a) sub-period 1 (1978-1987):economic opening of Special Economic Zones (SEZs); (b) sub-period 2 (1988-1992): economic opening of PRD; (c) sub-period3 (1993–2004): economic opening of YRD; and (d) sub-period 4 (1998–2004): Post-Asian Financial Crisis. The resulting TFPgrowth behavior through time in both GDEs can be observed from the statistical results presented in Table 4, which generallyconfirms the positive impact of economic opening in enhancing TFP and TFP growth in both GDEs. Hence, Hypothesis 1 iswell supported by the statistical results from the panel data estimations.
(1) Overall TFP growth (1978–2004)(a) Continuous TFP growth: Both YRD/PRD have achieved high TFP growth overtime. PRD exhibits a slightly higher
average TFP of 4.94 and lower annual growth of 1.21%, versus YRD’s 4.89% and 1.54%, respectively, for the wholeperiod of the study.
Table 3
Estimations of Cobb–Douglas production function in GDEs: results from OLS and panel data estimations (1978–2004).
Dependent = Y Yangtze River Delta (YRD) Pearl River Delta (PRD)
OLS Panel OLS Panel
b0 0.260 (0.262) 5.901*** (1.300) 1.805*** (0.162) 5.747*** (0.612)
Fixed effects
TS(T) – Yesa – Yesa
CS(N) – Yesa – Yesa
K 0.847*** (0.020) 0.265*** (0.050) 0.757*** (0.018) 0.410*** (0.049)
L 0.323*** (0.050) 0.981*** (0.170) 0.297*** (0.037) 0.558*** (0.045)
Length (T, N) – 26, 14 – 26, 7
Adj-R2 0.907 0.985 0.962 0.987
F-Statb 1558.77*** 41.28*** 2535.84*** 12.69***
DF 198 278 198 165
N 321 321 201 201
Notes: All variables in log-linear form; standard errors in parentheses.a Estimated parameters omitted for simplicity; both time and cross-section effects for various time periods and cities/counties were computed from the
estimated coefficients and presented in Tables 4 and 5.b F-Stat for panel estimation represents F-test for absence of fixed effects.*** Represents statistical significance of p < 0.01.
C. Tuan et al. / Journal of Asian Economics 20 (2009) 280–293286

(b) Range of TFP growth: YRD, however, has a wider range of TFP growth of 3.98–5.9, representing a TFP gain of 1.92% or48.3% over the study period, while PRD has a range of 4.02–5.75 representing a gain of 1.73% or 42.9%. Higherfluctuations in TFP growth in YRD can also be observed by the range of annual average TFP growth rates of�1.43% to5.89%, compared with that of PRD’s 0.16–3.42%.
(c) Declining TFP growth rate: TFP average annual growth is further observed to slow down in YRD after its peak in 1993 at4.08% and drop to less than 1% in 2004, and in PRD in 1991 at 3.42% to less than 1% since 2002.
(2) Sub-period TFP growth(a) Sub-period 1 (1978–1987): At the beginning of the economic opening of SEZs, PRD exhibited slightly higher
average TFP but a slower growth rate (=4.41% and 0.95%, respectively), compared with YRD (=4.32% and 1.56%,respectively);
(b) Sub-period 2 (1988–1992): After economic opening, PRD continued to achieve higher average TFP and a much higherannual growth rate (=4.77 and 1.71%, respectively) relative to YRD (=4.61 and 0.92%, respectively).
(c) Sub-period 3 (1993–2004): Since YRD’s economic opening, however, YRD surpassed PRD in 1994 in terms of averageTFP and annual growth, that is, 5.49% and 1.78%, respectively, versus PRD’s 5.44% and 1.21%.
(d) Sub-period 4 (1998–2004): During the post-Asian Financial Crisis period, similar TFP growth behavior as in sub-period3 can be observed. YRD continued to surpass PRD in terms of TFP growth to attain an average TFP of 5.7 and annualgrowth of 1.35% while PRD recorded both lower TFP and annual growth of 5.6% and 1%, respectively.
4.1.3. TFP growth by cross-section: estimated results from panel estimations
Cross-section (city) effects are significant in both YRD and PRD (r) following the results of the panel data estimationsof the Cobb–Douglas production functions for r (=1–2). TFP over cross-sections (csi) in r is computed from the estimatedcross-section effects. The results are presented in Table 5. For easy comparison, the cross-section TFP is converted to aTFP index with the highest TFP in each r set as unity. From the estimated TFP by cross-section, the following TFP growthbehavior in the cities in r can be depicted following the statistical results presented in Table 5. Such observationsgenerally suggest that PRD cities have higher TFP, and the impact of FDI in enhancing TFP growth is significant in bothrecipient regions.
(1) Regional TFP performance: During the study period, PRD attained higher TFP (=5.95), on the average, than YRD (=5.87).When considering provincial TFP, Jiangsu had the highest average TFP (=6.26) and followed by Guangdong (PRD) (=5.95)
Table 4
Estimated TFP and TFP growth in GDEs: results from panel data estimation (1978–2004).
Time period Yangtze River Delta (YRD) (16 cities) Pearl River Delta
(PRD) (9 Cities) Est-TFP Growth (%)a Est-TFP Est-TFP growth (%)a
1978 (Opening of SEZs) 3.980 – 4.203 –
1979 4.052 1.809 4.273 1.665
1987 (Opening of PRD) 4.570 0.572 4.574 1.307
1992 (Opening of YRD) 4.779 3.688 4.977 1.696
1994b 5.118b 2.895 5.108b 1.068
1997 (Asian Financial Crisis) 5.373 1.454 5.360 1.362
2001 5.717 1.329 5.614 1.266
2002 5.780 1.102 5.668 0.962
2003 5.848 1.176 5.715 0.829
2004 5.901 0.906 5.747 0.560
Range: min–max (1978–2004) 3.980–5.901 �1.425–5.890 4.023–5.747 �0.159–3.423
Period average
Overall: 1978–2004 4.893 1.537 4.935 1.214
Sub-period 1: 1978-1987 4.317 1.562 4.413 0.948
Sub-period 2: 1988–1992 4.611 0.918 4.774 1.708
Sub-period 3: 1993–2004 5.490 1.776 5.437 1.207
Sub-period 4: 1998–2004 5.702 1.348 5.603 1.001
Notes: Computed from the estimated time-effects of the Panel data estimations of Cobb–Douglas production functions for YRD and PRD (Table 3); four
periods of averages were computed:
1. Sub-period 1 (1978–1987) represents the period of economic opening of the Special Economic Zones (SEZs) in Guangdong in 1978 to the opening of PRD
in 1987.
2. Sub-period 2 (1988–1992) represents the period of economic opening of PRD till the reconfirmation of China’s economic reform by Deng and the
economic opening of YRD in 1992.
3. Sub-period 3 (1993–2004) represents the confirmation of continuous commitment of China to economic opening in receiving FDI (for details of China’s
economic opening and its liberalization policies by stages, see Ng & Tuan, 2001).
4. Sub-period 4 (1998–2004) represents the period of post-Asian Financial Crisis.a Indicates annual growth rate.b Indicates the year YRD surpassed PRD in its TFP.
C. Tuan et al. / Journal of Asian Economics 20 (2009) 280–293 287

and Zhejiang (=5.87). By sub-regions, both Jiangsu and Guangdong were observed to receive relatively higher FDI flowsthan Zhejiang as illustrated in Table 1.
(2) TFP performance by Cities(a) Inter-regional TFP (YRD versus PRD): When comparing TFP by cities between the two GDEs regions, four cities in
Jiangsu (YRD), namely, Suzhou, Wuxi, Zhenjiang, and Nanjing, had accomplished higher TFP than the top-performedTFP PRD city (namely, Zhuhai); and together with Shanghai and the fifth Jiangsu (YRD) city (namely, Changzhou), atotal of six YRD cities were shown to achieve higher TFP than the eight cities in PRD. Alternatively, the eight PRD citiesout-performed the nine remaining YRD cities.
(b) Intra-regional TFP by Cities: In YRD/PRD, the rankings of TFP by cities are further presented in Table 5. The top-performed TFP cities in YRD and PRD were Suzhou and Zhuhai, respectively, and the least-performed cities wereHangzhou and Huizhou, respectively. The better performed TFP cities were seemingly those receiving heavier flowsof FDI as shown by the realized FDI observed at the city level.
Impacts of TFP and FDI on Output Growth in YRD/PRD: 2SLS estimations (1995–2004)The two sets of simultaneous equations (Eqs. (5) and (6) and Eqs (5a) and (6a)) constructed for each region, YRD/PRD, are
both estimated by 2SLS in log-linear form and the estimation results are presented in Tables 6 and 7, respectively. Thestatistical results show that in general, the hypotheses (Hypotheses 2 and 3) that FDI affect TFP which in turn contributed toeconomic growth are strongly supported regardless of the measurements of growth by GDP or GDP per capita and humancapital by total HC endowment or HC by type. Such research results may well illustrate the critical roles of TFP andparticularly its endogeneity effect in channeling the impacts of FDI to output growth. Specific observations from theestimation results are as follows.
(1) Effects on TFP(a) Impacts of FDI: TFP is positively affected by FDI in both GDEs (Tables 6 and 7, Eqs. (1.1) and (2.1); p < 0.05) with YRD
carrying a slightly higher estimated partial FDI elasticities (est-b = 0.17–0.24; p < 0.01) than that of PRD (est-b = 0.13–0.14; p < 0.01).
(b) Impacts of R&D expenses: TFP is also positively affected by R&D in both GDEs with YRD exhibiting a slightlylower estimated partial R&D elasticities (est-b = 0.18–0.27, p < 0.05) than that of PRD (est-b = 0.28–0.29,p < 0.01).
(c) Impacts of HC endowment: In YRD, total HC endowments (Table 6, Eq. (1.1); p < 0.05) and HC2 (but not HC1) as well astheir synergy effects (HC1 � HC2) have significantly affected TFP (Table 6, Eq. (2.1); p < 0.01). In PRD, however, HCendowments, regardless of total or by type, show no significant impact. The insignificance of the HC effect in PRD maysuggest that human capital, whether higher education or secondary education, is not an important determinant of
Table 5
Estimated TFP in the globalized delta economies by YRD/PRD Cities: results from panel data estimation (1978–2004).
Yangtze River Delta (YRD) (16 Cities) Pearl River Delta (PRD) (9 Cities)
Est-TFP TFP-Indexa Est-TFP TFP-Indexa
Shanghai 6.144 0.887 (5)*
Jiangsu Province Guangdong Province
Suzhou 6.925 1.000 (1) Zhuhai 6.138 0.892 (1)
Wuxi 6.866 0.991 (2) Jiangmen 6.077 0.877 (2)
Zhenjiang 6.833 0.987 (3) Shenzhen 6.041 0.872 (3)
Nanjing 6.594 0.952 (4) Guangzhou 6.021 0.869 (4)
Changzhou 5.901 0.852 (5)* Dongguan 5.959 0.861 (5)
Yangzhou 5.455 0.788 (12) Zhongshan 5.927 0.856 (6)
Nantong 5.240 0.752 (13) Zhaoqing 5.747 0.830 (7)**
Jiangsu Avg 6.259 0.904 Huizhou 5.687 0.821 (7)**
Zhejiang Province
Zhoushan 5.546 0.801 (5)*
Ningbo 5.618 0.811 (8)
Shaoxing 5.615 0.810 (9)
Huzhou 5.598 0.808 (10)
Jiaxing 5.598 0.808 (10)
Taizhou 5.208 0.752 (14)
Hangzhou 4.967 0.717 (15)
Zhejiang Avg 5.450 0.787
YRD Avg 5.874 0.848 PRD Avg 5.950 0.859
Notes: Computed from the estimated cross-section effects of the Panel data estimations of Cobb–Douglas production functions for YRD and PRD (Table 3);
ranking in parentheses.a TFP-Index is constructed by converting the highest estimated-TFP (that is, Suzhou = 6.925) to 1.* The estimated parameters of the respective sets of cities in YRD are statistically indifferent.** The estimated parameters of the respective sets of cities in PRD are statistically indifferent.
C. Tuan et al. / Journal of Asian Economics 20 (2009) 280–293288

TFP. Since the production process in PRD cities were mainly labor-intensive, which means that a large pool of workerswould be needed, rather than HC equipped with good or high quality education. Another possible explanation is thatthe proportion of student enrollments may not serve as a good measure of HC endowment because the largeproportion of HC with good education were educated and migrated into PRD from other regions of China or fromabroad.9
(2) Effects on output growth(a) Impact of TFP: The results from Stage II of 2SLS show that the TFP-hat estimated from Stage I exerts a significant effect
on growth in terms of the two output measurements (GDP and GDP per capita) in both YRD (Table 6, Eqs. (1.2.1–1.2.2)and (2.2.1–2.2.2) and PRD (Table 7, Eq. (1.2.1–1.2.2 and 2.2.1–2.2.2). When comparing the partial effects of TFP ongrowth between the two regions, YRD has much lower TFP elasticities, showing a range from 0.42 to 0.83 (that is,inelastic; p < 0.01), while that of PRD from 0.621 (that is, inelastic; p < 0.1) to 1.67 (that is, highly elastic; p < 0.01),depending on HC or HC by type.
Table 6
Impacts of TFP and FDI on GDP growth in YRD: results of 2SLS regression (1995–2004).
YRD: Version 1 YRD: Version 2
2SLS Stage I Stage II Stage I Stage II
Dependent TFP GDP GDP/P TFP GDP GDP/P
X (1.1) (1.2.1) (1.2.2) (2.1) (2.2.1) (2.2.2)
b0 5.854*** (0.647) 2.838*** (0.743) �1.774 (1.092) 9.615*** (1.682) 2.226 (0.523) �0.890 (0.767)
FDI 0.169*** (0.035) 0.532*** (0.043) 0.162*** (0.033) 0.242*** (0.035) 0.498*** (0.035) 0.149*** (0.020)
TFP-hat 0.417*** (0.142) 0.641*** (0.153) 0.536*** (0.100) 0.828*** (0.066)
R&Da 0.176** (0.071) 0.267*** (0.071)
HC/P 0.442** (0.179) 0.809*** (0.118)
HC1/P 0.700 (0.441) 0.479*** (0.109)
HC2/P 2.311*** (0.606) 1.448*** (0.193)
HC1/P � HC2/P 0.318** (0.153) 0.168*** (0.038)
DF 119 120 119 117 120 117
Adj-R2 0.448 0.884 0.934 0.568 0.886 0.980
F-Stat 34.05*** 467.47*** 576.18*** 33.06*** 473.97*** 1177.48***
RMSE 0.555 0.394 0.210 0.500 0.394 0.123
Notes: All variables in log-linear form; standard errors in parentheses.a The measure of R&D/GDP is statistically insignificant.** Represent statistical significance of p < 0.05.*** Represent statistical significance of p < 0.01.
Table 7
Impacts of TFP and FDI on GDP growth in PRD: results of 2SLS regression (1995–2004).
PRD: Version 1 PRD: Version 2
2SLS Stage I Stage II Stage I Stage II
Dependent TFP GDP GDP/P TFP GDP GDP/P
X (1.1) (1.2.1) (1.2.2) (2.1) (2.2.1) (2.2.2)
b0 5.102*** (0.361) 3.595 (2.714) �9.785*** (1.656) 5.060** (0.403) 2.845 (1.907) �9.877*** (1.651)
FDI 0.128*** (0.040) 0.486*** (0.118) 0.351*** (0.090) 0.135*** (0.038) 0.288*** (0.062) 0.348*** (0.090)
TFP-hat 0.621* (0.363) 1.548*** (0.309) 1.664*** (0.218) 1.565*** (0.308)
R&D/GDP 0.285*** (0.032) 0.284*** (0.034)
HC/P �0.159 (0.116) 1.092*** (0.337)
HC1/P �0.031 (0.020) 1.860*** (0.326)
HC2/P �0.098 (0.132) 1.988*** (0.635)
HC1/P � HC2/P 0.546*** (0.123)
DF 56 56 57 55 54 57
Adj-R2 0.720 0.749 0.575 0.721 0.929 0.576
F-Stat 51.53*** 59.58*** 40.84*** 39.19*** 154.37*** 41.10***
RMSE 0.118 0.381 0.390 0.118 0.200 0.391
Notes: All variables in log-linear form; standard errors in parentheses.* Represent statistical significance of p < 0.10.** Represent statistical significance of p < 0.05.*** Represent statistical significance of p < 0.01.
9 This is particularly true in some big PRD cities, such as in Shenzhen, Dongguan, and Guangzhou. Hence, local school enrollments may not serve as a good
measurement of human capital in these cases.
C. Tuan et al. / Journal of Asian Economics 20 (2009) 280–293 289
(b) Impact of FDI: The above results may well suggest the significant direct impact of FDI on TFP (at Stage I, 2SLS) and alsooutput growth through TFP (Stage II, 2SLS). Such an indirect impact through the estimated-TFP in PRD is muchstronger than that in YRD. Furthermore, FDI is also found to affect directly growth as illustrated by the significantstatistical results of Stage II of 2SLS (Tables 6 and 7, Eqs. (1.2.1–1.2.2) and Eqs. (2.2.1–2.2.2)). Hence, Hypothesis 4 iswell supported by the data. Such direct partial impact of FDI on GDP growth is stronger in YRD when compared withPRD, and the reverse is true for GDP per capita.
(c) Impact of HC endowment: HC endowment and HC by type are both found to affect growth and, therefore, Hypothesis 5is well supported by the research findings. Both HC by type and HC synergies significantly affect directly per capitaGDP growth in YRD and GDP growth in PRD. From Tables 6 and 7, HC endowments (in terms of total and by type)affect both TFP and growth (per capita GDP) in YRD, but only on GDP growth in PRD. Furthermore, HC by type andtheir synergies affect the two regions quite differently. In YRD, education and training of HC and especially by typeand their synergies are important to both TFP and growth in terms of per capita GDP. In particular, the education andtraining of students at the secondary level shows a significant direct (highly elastic) impact that warrants specialattention. In PRD, however, HC by type and their synergies have not affected TFP, but the direct effects of tertiary andsecondary education on GDP growth are both critical (highly elastic).
(d) Impact of R&D expenditures: Interestingly, R&D expenses have no direct effect on output growth but only through TFPenhancement (Tables 6 and 7).
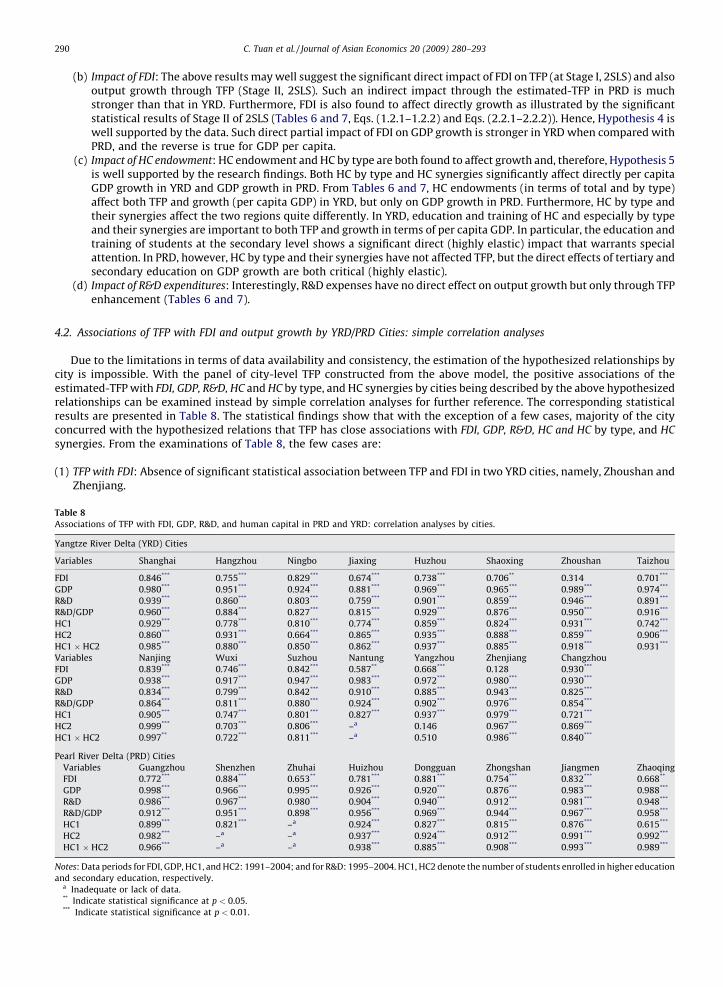
4.2. Associations of TFP with FDI and output growth by YRD/PRD Cities: simple correlation analyses
Due to the limitations in terms of data availability and consistency, the estimation of the hypothesized relationships bycity is impossible. With the panel of city-level TFP constructed from the above model, the positive associations of theestimated-TFP with FDI, GDP, R&D, HC and HC by type, and HC synergies by cities being described by the above hypothesizedrelationships can be examined instead by simple correlation analyses for further reference. The corresponding statisticalresults are presented in Table 8. The statistical findings show that with the exception of a few cases, majority of the cityconcurred with the hypothesized relations that TFP has close associations with FDI, GDP, R&D, HC and HC by type, and HC
synergies. From the examinations of Table 8, the few cases are:
(1) TFP with FDI: Absence of significant statistical association between TFP and FDI in two YRD cities, namely, Zhoushan andZhenjiang.
Table 8
Associations of TFP with FDI, GDP, R&D, and human capital in PRD and YRD: correlation analyses by cities.
Yangtze River Delta (YRD) Cities
Variables Shanghai Hangzhou Ningbo Jiaxing Huzhou Shaoxing Zhoushan Taizhou
FDI 0.846*** 0.755*** 0.829*** 0.674*** 0.738*** 0.706** 0.314 0.701***
GDP 0.980*** 0.951*** 0.924*** 0.881*** 0.969*** 0.965*** 0.989*** 0.974***
R&D 0.939*** 0.860*** 0.803*** 0.759*** 0.901*** 0.859*** 0.946*** 0.891***
R&D/GDP 0.960*** 0.884*** 0.827*** 0.815*** 0.929*** 0.876*** 0.950*** 0.916***
HC1 0.929*** 0.778*** 0.810*** 0.774*** 0.859*** 0.824*** 0.931*** 0.742***
HC2 0.860*** 0.931*** 0.664*** 0.865*** 0.935*** 0.888*** 0.859*** 0.906***
HC1 � HC2 0.985*** 0.880*** 0.850*** 0.862*** 0.937*** 0.885*** 0.918*** 0.931***
Variables Nanjing Wuxi Suzhou Nantung Yangzhou Zhenjiang Changzhou
FDI 0.839*** 0.746*** 0.842*** 0.587** 0.668*** 0.128 0.930***
GDP 0.938*** 0.917*** 0.947*** 0.983*** 0.972*** 0.980*** 0.930***
R&D 0.834*** 0.799*** 0.842*** 0.910*** 0.885*** 0.943*** 0.825***
R&D/GDP 0.864*** 0.811*** 0.880*** 0.924*** 0.902*** 0.976*** 0.854***
HC1 0.905*** 0.747*** 0.801*** 0.827*** 0.937*** 0.979*** 0.721***
HC2 0.999*** 0.703*** 0.806*** –a 0.146 0.967*** 0.869***
HC1 � HC2 0.997** 0.722*** 0.811*** –a 0.510 0.986*** 0.840***
Pearl River Delta (PRD) Cities
Variables Guangzhou Shenzhen Zhuhai Huizhou Dongguan Zhongshan Jiangmen Zhaoqing
FDI 0.772*** 0.884*** 0.653** 0.781*** 0.881*** 0.754*** 0.832*** 0.668**
GDP 0.998*** 0.966*** 0.995*** 0.926*** 0.920*** 0.876*** 0.983*** 0.988***
R&D 0.986*** 0.967*** 0.980*** 0.904*** 0.940*** 0.912*** 0.981*** 0.948***
R&D/GDP 0.912*** 0.951*** 0.898*** 0.956*** 0.969*** 0.944*** 0.967*** 0.958***
HC1 0.899*** 0.821*** –a 0.924*** 0.827*** 0.815*** 0.876*** 0.615***
HC2 0.982*** –a –a 0.937*** 0.924*** 0.912*** 0.991*** 0.992***
HC1 � HC2 0.966*** –a –a 0.938*** 0.885*** 0.908*** 0.993*** 0.989***
Notes: Data periods for FDI, GDP, HC1, and HC2: 1991–2004; and for R&D: 1995–2004. HC1, HC2 denote the number of students enrolled in higher education
and secondary education, respectively.a Inadequate or lack of data.** Indicate statistical significance at p < 0.05.*** Indicate statistical significance at p < 0.01.
C. Tuan et al. / Journal of Asian Economics 20 (2009) 280–293290

(2) TFP with HC endowment: In Yangzhou (in YRD), no statistical association between TFP with HC2 and HC synergies isfound. Due to inadequate data, the associations between TFP with HC by type and HC synergy effects are not tested inNantung (in YRD) and Shenzhen and Zhuhai (in PRD).
5. Conclusion
The research results of this study suggest four major findings regarding the roles of TFP and FDI in the GDEs in China: (1)TFP has progressively increased in response to the influx of FDI since China’s economic opening; (2) the endogeneity of TFPand its significant impact on output growth are confirmed; (3) FDI affects not only output growth and productivity progressdirectly but also indirectly, that is, growth increases through TFP enhancement; and (4) technology- and knowledge-relatedfactors, including R&D expenses and human capital endowment, are significant in enhancing productivity progress andoutput growth. These channels and impacts have been statistically validated. In particular, the research results alsodemonstrate the critical contributive effects of FDI in facilitating productivity progress and output growth and its importantabilities in bringing in innovative ideas, new technology and knowledge, and management know-how via demonstrationeffects.
Several major policy directions can then be derived in order to enhance productivities and hence, sustained growth. Theseinclude: (1) strategic FDI promotion in attracting foreign firms, especially those with spillover effects and productivityenhancement, in order to facilitate growth; (2) continual attraction of FDI regardless of firm size to promote employmentand income growth; (3) increasing investments and expenditures in education and training of to deepen the quality laborand expand the types human capital so as to meet the production needs of foreign firms as well as that of local enterprises;and (4) increasing efforts in R&D activities to facilitate innovations, technology advancements, and industry and technologyupgrade.
It follows that regional policies designed to cater to the specific needs of the regions in terms of more effectiveproductivities and output enhancement should be emphasized.
(1) FDI is found to have been critical to growth in both PRD/YRD. It serves more than just a source of capital by bringing intechnology spillover effects. The direct impact of FDI on productivity enhancement and output growth are each found tobe significant in the two regions. In YRD, FDI has a larger impact (elasticities) on TFP and output (GDP) growth than is thecase in PRD. On the other hand, the FDI direct effect in PRD is higher on output growth in terms of per capita GDP.
(2) The endogeneity of TFP to growth in channeling the FDI impact on output growth is clearly demonstrated in both regions.The TFP impact (elasticities) on output (GDP and per capita GDP) is much higher in PRD (inelastic to highly elastic) thanthat in YRD (inelastic).
(3) Human capital endowments play a critical role but exert different effects in both regions. Human capital, by type throughsynergies, significantly affect directly per capita GDP growth in YRD and GDP growth in PRD. Moreover, in PRD, educationat both the tertiary and secondary levels are important to growth, and in YRD, the secondary level is especially important.
(4) More R&D efforts should be devoted in each region to enhancing productivity. Its direct impact on TFP is higher in PRDthan in YRD.
However, the evolving investment environment, particularly those issues dealing with environmental protection, hasmade China more selective in designing her recent FDI promotion policies catering to further FDI attraction. The existingmajor sources of FDI, that is, mainly labor-intensive production techniques operated by SMEs,10 have encountered severedetrimental production conditions. They include: (1) gradual exhaustion of labor supply flowing from other regions outsideof the GDEs; (2) increasing labor costs due to the relatively rigid and newly established labor laws; and (3) increasingoperating costs resulting from the progressive implementation of environment protection measures, eliminated and/orreduced preferential tax and tax holidays applied to MNCs especially after WTO.
If some other dimensions of the investment environment,11 such as intellectual property rights, cannot be improved intime to meet the expectations of those high-tech or knowledge-intensive MNCs, the next wave of China’s targets of FDIstrategic promotion and mobilization campaign will certainly be retarded. If this is the case, China’s ability to sustaingrowth will have to rely more heavily on those new investments coming from domestic sources. In this regard, the growthof local private enterprises will become another important protagonist in steering China’s future growth. It follows thatspecific government policies in facilitating the growth of local Chinese enterprises, especially SMEs, are of criticalimportance.
In addition, it is worthwhile to note that local private enterprises have rapidly developed in China along with the influx ofFDI especially after the mid-1990s. Flourishing entrepreneurship has been observed in various dimensions and scale in the
10 While China remains as the largest FDI hosting country among all developing nations, the two nearby overseas Asian Chinese economies, Hong Kong
and Taiwan, are the two dominating FDI sources characterized mainly by labor-intensive SMEs. The continuous huge influx of manufacturing FDI during the
past two decades has made PRD in Guangdong distinctively known as the ‘‘World’s largest manufacturing base’’. For the details of the spatial distribution
and diversity pattern of FDI firms in PRD, please see Ng and Tuan (2006). For the major features of the cross-border production activities conducted by the
Hong Kong registered SMEs in PRD, please see Tuan and Ng (2004).11 For the literature measuring the components and determinants of an investment environment, please see Ng and Tuan (2002).
C. Tuan et al. / Journal of Asian Economics 20 (2009) 280–293 291
Chinese economy. Domestic investments would definitely serve as a major source of investment to promote further China’sfuture economic growth.12 In this connection, continual FDI promotion and strategic attraction of selective FDI equippedwith high-tech and innovation and productivity spillover capabilities will be essential and deserve additional attention.
References
Aitken, B., & Harrison, A. (1999). Do domestic firms benefit from foreign direct investment? American Economic Review, 89, 605–618.Arayama, Y., & Miyoshi, K. (2004). Regional diversity and sources of economic growth in China. The World Economy, 27(10), 1583–1607.Archibugi, D., & Iammarino, S. (2002). The globalization and technological innovation: Definition and evidence. Review of International Political Economy, 9(1), 98–
122.Balasubramanyam, V. N., Salisu, M., & Sapsford, D. (1996). Foreign direct investment and growth in EP and IS countries. The Economic Journal, 106(434), 92–105.Benhabib, J., & Spiegel, M. (1994). The role of human capital in economic development: Evidence from aggregate cross-country data. Journal of Monetary
Economics, 34, 143–173.Berthelemy, J. C., & Demurger, S. (2000). Foreign direct investment and economic growth: Theory and applications to China. Review of Development Economics,
4(2), 140–155.Blomstrom, M., & Kokko, A. (2001). Foreign direct investment and Spillovers of technology. International Journal of Technology Management, 22(6), 435–454.Borensztein, E., de Gregorio, J., & Lee, J. W. (1998). How does foreign investment affect economic growth. Journal of International Economics, 45, 115–135.Brock, G. (2005). Regional growth in Russia during the 1990s – What role did FDI play? Post-Communist Economies, 17(3), 319–329.Bwalya, S. M. (2006). Foreign direct investment and technology spillovers: Evidence from panel analysis of manufacturing firms in Zambia. Journal of Development
Economics, 81(2), 514–526.Campos, N. F., & Kinoshita, Y. (2002). Foreign direct investment as technology transferred: Some panel evidence from the transition economies. The Manchester
School, 70(3), 398–419.Carlaw, K. I., & Lipsey, R. G. (2003). Productivity, technology and economic growth: What is the relationship? Journal of Economic Surveys, 17(3), 457–495.Caves, R. E. (1974). Multinational firms and productivity in the host country markets. Econometrica, 41(162), 176–193.Cheung, K., & Lin, P. (2004). Spillover effects of FDI on innovation in China: Evidence from the provincial level data. China Economic Review, 15, 25–44.Coe, D., & Helpman, E. (1995). International R&D spillovers. European Economic Review, 39, 859–887.Coe, D., Helpman, E., & Hoffmaister, A. (1997). North–south R&D spillovers. Economic Journal, 107, 134–149.Collins, S. M., & Boseworth, B. P. (1996). Economic growth in East Asia: Accumulation versus assimilation. Brookings Papers on Economic Activity, 2, 135–192.de la Potterie, B. P., & Lichtenberg, F. (2001). Does foreign direct investment transfer technology across borders? The Review of Economics and Statistics, 83(3), 490–
497.de Mello, L. R., Jr. (1997). Foreign direct investment in developing countries and growth: A selective survey. Journal of Development Studies, 34(1), 1–34.de Mello, L. R. (1999). Foreign direct investment-led growth: Evidence from time series and panel data. Oxford Economic Papers, 51, 133–151.Fang, Y., & Parker, D. (2004). Labor and total factor productivity in the Chinese electronics industry in the 1990s. International Review of Applied Economics, 18(1),
73–91.Felipe, J. (1997). Total factor productivity growth in East Asia: A critical survey economic and development resource center. EDRC report series, no. 65.Findlay, R. (1978). Some aspects of technology transfer and foreign direct investment. American Economic Review, 68, 275–279.Gorg, H., & Strobl, E. (2001). Multinational companies and productivity spillovers: A meta-analysis. Economic Journal, 111, 723–739.Graham, E. M., & Wada, E. (2001). Foreign direct investment in China: Effects on growth and economic performance in achieving high growth: Experience of transitional
economies in East Asia. UK: Oxford University Press.Haddad, M., & Harrison, A. (1993). Are there positive spillovers from direct foreign investment? Evidence from panel data for Morocco. Journal of Development
Economics, 42, 51–74.Haskel, J. E., Pereira, S. C., & Slaughter, M. J. (2002). Does inward foreign direct investment boost the productivity of domestic firms? NBER working paper, no. 8724.Hejazi, & Safarian, (1999). Trade, foreign direct investment, and R&D spillovers. Journal of International Business Studies, 30(3), 491–511.Hu, A. G. Z., & Jefferson, G. H. (2002). FDI impact of spillover: Evidence from China’s electronic and textile industries. The World Economy, 25(8), 1063–1076.Islam, N. (1995). Growth empirics: A panel data approach. Quarterly Journal of Economics, 110, 1127–1170.Javorcik, B. S. (2004). Does foreign direct investment increase the productivity of domestic firms? In search of spillovers through backward linkages. American
Economic Review, 94(3), 605–627.Keller, W. (2004). International technology diffusion. Journal of Economic Literature, XLII(3), 752–782.Krugman, P. (1994). The myth of Asia’s miracle. Foreign Affairs, 62–78 November/December.Leibenstein, H. (1966). Allocative efficiency versus X-efficiency. American Economic Review, 56, 392–415.Lim, E. G. (2001). Determinants of, and the relation between, foreign direct investment and growth: A summary of the recent literature. IMF working paper, WP/01/
175.Liu, X., & Wang, C. (2003). Does foreign direct investment facilitate technological progress? Evidence from Chinese industries. Research Policy, 32, 945–953.Liu, X., Siler, P., Wang, C., & Wei, Y. (2000). Productivity spillovers from foreign direct investment: Evidence from UK industry level panel data. Journal of
International Business, 31(3), 407–425.Mansfield, E., & Romeo, A. (1980). Technology transfer to overseas subsidaries based firms. Quarterly Journal of Economics, 95, 737–750.Marin, A., & Bell, M. (2006). Technology spillovers from foreign direct investment (FDI): The active role of MNC subsidiaries in Argentina in the 1990s. Journal of
Development Studies, 42(4), 678–697.Miller, S. M., & Upadhyay, M. P. (2000). The effects of openness, trade orientation, and human capital on total factor productivity. Journal of Development Economics,
63, 399–423.Molero, J. (1995). Technological innovation multinational corporations and new international competitiveness: The case of intermediate countries. London: Harwood
Academic Publishers.Mullen, J. K., & Williams, M. (2005). Foreign direct investment and regional economic performance. Kyklos, 58(2), 265–282.Murakami, Y. (2007). Technology spillover from foreign-owned firms in Japanese manufacturing industry. Journal of Asian Economics, 18, 284–293.Mytelka, L. K., & Barclay, (2004). Using Foreign investment strategically for innovation. European Journal of Development Research, 16(3), 531–560.Ng, L. F. Y., & Tuan, C. (2001). FDI promotion policy in China: Governance and effectiveness. The World Economy, 24(8), 1051–1074.Ng, L. F. Y., & Tuan, C. (2002). Building a favorable investment environment: evidence for the facilitation of FDI in China. The World Economy, 25(8), 1095–1114.Ng, L. F. Y., & Tuan, C. (2005). Industry technology performance of manufacturing FDI: Micro-level evidence from joint ventures in China. International Journal of
Technology Management, 32(3/4), 246–263.Ng, L. F. Y., & Tuan, C. (2006). Spatial agglomeration, FDI, and regional growth in China: locality of local and foreign manufacturing investments. Journal of Asian
Economics, 17, 691–713.Prescott, E. C. (1998). Needing a theory of total factor productivity. International Economic Review, 39, 525–551.Solow, R. (1957). Technical change and the aggregate production function. Review of Economics and Statistics, 39, 320–321.Teece, D. J. (1977). Technology transfer by multinationals firms: The resource cost of transferring technological know-how. The Economic Journal, 87(6), 242–262.
12 For the discussion of the rise of local private enterprises and entrepreneurship in China, please see Tuan and Ng (2006).
C. Tuan et al. / Journal of Asian Economics 20 (2009) 280–293292

Todo, Y. (2006). Knowledge spillover from foreign direct investment in R&D: Evidence from Japanese firm-level data. Journal of Asian Economics, 17, 996–1013.Tuan, C., & Ng, L. F. Y. (2004). FDI and industrial restructuring in post-WTO Greater PRD: Implications on regional growth in China. The World Economy, 27(10),
1609–1630.Tuan, C., & Ng, L. F. Y. (2006). FDI inflows and growth of private business in China. Journal of Entrepreneurship Research, 1(1), 101–132.Tuan, C., & Ng, L. F. Y. (2007). The Place of FDI in China’s regional economic development: Emergence of the globalized Delta Economies. Journal of Asian Economics,
18, 348–364.Tuan, C., Ng, L. F. Y., & Lin, H. (2006). The Globalized Delta Economies in China (Yangtze-River Delta and Pearl-River Delta): Visualized economic indicators for investment
environment. Institute of Space and Earth Information Science, The Chinese University of Hong Kong (website: http://www.jlgis.cuhk.edu.hk/business).Wei, S. (1995). Foreign direct investment in China: Sources and consequences. In Ito, T., & Krueger, A. O. (Eds.), Financial deregulation and integration in East Asia,
NBER-East Asia seminar on economics (5). USA: University of Chicago Press.Wei, Y., & Liu, X. (2001). Foreign direct investment in China: Determinants and impact. Cheltenham, UK/Northampton, MA, USA: Edward Elgar Publishing Limited.Whalley, J., & Xin, X. (2006). China’s FDI and non-FDI economies and the sustainability of future high Chinese growth. NBER working paper series, #12249, National
Bureau of Economic Research.World Bank. (1993). The East Asian miracle: Economic growth and public policy. Oxford, UK: Oxford University Press.Wu, Y. R. (1999). Foreign direct investment and economic growth in China. Cheltenham, UK/Northampton, MA, USA: Edward Elgar Publishing Limited.Xu, B. (2000). Multinational enterprises, technology diffusion, and host country productivity growth. Journal of Development Economics, 62, 477–493.Yao, S. J. (2006). On economic growth, FDI and exports in China. Applied Economics, 38, 339–351.Yao, S. J., & Wei, K. L. (2007). Economic growth in the presence of FDI: The perspective of newly industrializing economies. Journal of Comparative Economics, 35,
211–234.Yasar, M., Paul, C., & Morrison, J. (2007). International linkages and productivity at the plant level: Foreign direct investment, exports, imports and licensing.
Journal of International Economics, 71, 373–388.Zhang, J., Wu, G., & Zhang, J. (2004). Estimation of provincial capital stock in China: 1952–2000. Economic Research, 10, 35–44 (in Chinese).
C. Tuan et al. / Journal of Asian Economics 20 (2009) 280–293 293