children's reading and mathematics achievement in kindergarten
TRANSCRIPT

Children's Reading and Mathematics Achievement
in Kindergarten and First Grade
Kristin Denton, Education Statistics Services Institute
Jerry West, National Center for Education Statistics

iii
Acknowledgments
The authors wish to recognize the 20,000 children and their parents, and the more than 8,000 kindergarten and first grade teachers who participated during the first 2 years of the study. We would like to thank the administrators of the more than 1,000 schools we visited across the United States for allowing us to work with their children, teachers and parents, and for providing us with information about their schools. We are especially appreciative of the assistance we received from the Chief State School Officers, district superintendents and staff, and private school officials. We would like to thank Elvie Germino Hausken and Jonaki Bose of the National Center for Education Statistics, and Lizabeth Reaney, Naomi Richman, Amy Rathbun, Jill Walston, Thea Kruger, Sarah Kaffenberger, Nikkita Taylor, and DeeAnn Brimhall of the Education Statistics Services Institute for their hard work and dedication in supporting all aspects of the ECLS-K program. We also appreciate the comments we received from program offices within the Department of Education and NCES staff members Sam Peng, Laura Lippman, and Bill Fowler. In addition, we would like to recognize the input we received from Barbara Wasik of Johns Hopkins University, Doug Downey of the Ohio State University, and Susan Fowler of the University of Illinois at Urbana-Champaign. Westat, Incorporated—in affiliation with the Institute for Social Research and the School of Education at the University of Michigan, and the Educational Testing Service, under the direction of the National Center for Education Statistics (NCES)—conducted the base-year and first grade study. We would like to express our appreciation for the efforts of the staff from each of these organizations, and especially to the more than 400 field staff who conducted the child assessments and parent interviews in fall 1998, spring 1999, and spring 2000. We wish to acknowledge the support that we have received from the Head Start Bureau of the Administration on Children, Youth and Families; the Economic Research Service of the U.S. Department of Agriculture; the National Institute for Child Health and Human Development; and the U.S. Department of Education’s Office of Special Education Programs, Office of Bilingual Education and Minority Languages Affairs, and Planning and Evaluation Service. A special thank you to Kendra Chandler Webb, age 9 (1994), for designing the ECLS logo, and to Westat for aiding in the design of the cover.

iv

v
Executive Summary
Children’s experiences with school are almost as varied as children themselves. This report is the third in
a series based on findings about young children’s early experiences with school from the Early Childhood
Longitudinal Study, Kindergarten Class of 1998–99 (ECLS-K). Sponsored by the U.S. Department of
Education, National Center for Education Statistics (NCES), the ECLS-K selected a nationally
representative sample of kindergartners in the fall of 1998 and is following these children through the
spring of fifth grade. The study collects information directly from the children, their families, teachers,
and schools. The full ECLS-K base-year sample is comprised of approximately 22,000 children who
attended about 1,000 kindergarten programs during the 1998–99 school year.
The first two reports, America’s Kindergartners (West, Denton, and Germino Hausken 2000) and The
Kindergarten Year (West, Denton, and Reaney 2001), provided a national picture of the knowledge and
skills of children at kindergarten entry and across the kindergarten year. Both reports revealed that while
first-time kindergartners are similar in many ways, their knowledge and skills differ in relation to their
age at school entry, race/ethnicity, health status, home educational experiences, and child care histories.
This report presents a picture of these children as first-graders.1 The first two reports laid the foundation
for a basic understanding of children’s achievement across the kindergarten year. This report continues
the story by providing information about children’s knowledge and skills in the first-grade year. The
report looks at children's school performance in terms of their reading and mathematical knowledge and
skills. To address the multifaceted nature of children's development, this report relates children's reading
and mathematical knowledge and skills to child, family, and school characteristics. Whereas prior reports
(i.e., The Kindergarten Year) specifically addressed the gains children made in reading and mathematics
across the school year, this report will focus more on the status of children's reading and mathematics
achievement in the spring of kindergarten and the spring of first grade. Taking a broad view of child
development, the report explores how children’s literacy, approaches to learning, and general health status
at kindergarten entry relate to their spring kindergarten and first grade reading and mathematics
knowledge and skills.
1 First-graders refers to first-time kindergartners who were promoted to first grade in the fall of 1999. For further detail, see the Analytic Sample section of this report.
vi
When conceptualizing literacy in young children, since young children's reading and mathematical ability
are highly related, it is important to consider not only their reading skills but also their reading
environment and their mathematical reasoning skills (West, Denton, and Germino Hausken 2000;
National Research Council 1989; National Institutes of Health 2000). Recognizing numbers (i.e., math
skills) and recognizing letters (i.e., reading skills) both represent a child’s ability to understand that
symbols have meaning. Therefore, this report provides information on multiple aspects of children’s early
literacy, such as their ability to recognize letters, the frequency with which they are read to, and their
ability to recognize numbers, shapes, and understand the relative size of objects.
Findings2
This section presents highlights of the findings. The report uses data from the ECLS-K to address the
following questions:
♦ What reading and mathematics knowledge and skills do children demonstrate in the spring of first
grade? Do children’s knowledge and skills differ by certain child, family, and school characteristics?
♦ What is the relationship of children’s early literacy, approaches to learning, and general health status
as they enter kindergarten to their spring kindergarten and first grade reading and mathematics
achievement? In particular, how do the following resources relate to children’s spring kindergarten
and spring first-grade achievement:
− proficiency in recognizing letters,
− being read to at least three times a week,
− proficiency in recognizing numbers and basic shapes,
− proficiency in the mathematical concept of relative size,
− demonstrating a positive approach to learning often or very often, and
− being in very good to excellent general health?
2 In an effort to provide information on the early education experiences of the typical child (i.e., one who spent 1 year in kindergarten and then continued on to first grade), the children included in the analysis entered kindergarten for the first time in fall of 1998 and were promoted on time to first grade in the fall of 1999. Further, since this report provides information on children’s early reading achievement, and the reading assessment was administered in English, the analyses in this report are limited to those children who were administered the English reading assessment. For more information, see the Analytic Sample section of the report. To achieve consistency in the sample across rounds (i.e., fall kindergarten, spring kindergarten and spring first grade), the analyses in this report are limited to those children who were assessed in English in all three rounds of data collection.

vii
What reading and mathematics knowledge and skills do children demonstrate in the spring of first grade?
Do children’s knowledge and skills differ by certain child, family, and
school characteristics?
What Children Know
When children begin kindergarten, 67 percent recognize their letters. By the spring of kindergarten, most
(95 percent) know the letters of the alphabet; and after 2 years of school, essentially all children (100
percent) can recognize the letters of the alphabet. At kindergarten entry, about one-third (31 percent) of
children understand the letter-sound relationship at the beginning of words and about one in six children
(18 percent) understand the letter-sound relationship at the end of words. By the spring of kindergarten,
about three-quarters (74 percent) of children make the letter-sound connection at the beginning of words
and just over half (54 percent) of children make this connection at the ending of words. By the spring of
first grade, almost all children have mastered these reading skills (98 and 94 percent, respectively) (figure
A). By the spring of first grade, about five in six children (83 percent) recognize common words by sight
(sight words), and about one-half (48 percent) of children understand words in context (compared to 14
and 4 percent, respectively, in the spring of kindergarten) (figure A, table 1).

viii
Figure A.—Percentage of children demonstrating specific reading knowledge and skills for fall
kindergarten, spring kindergarten, and spring first grade: 1998–99 and 2000
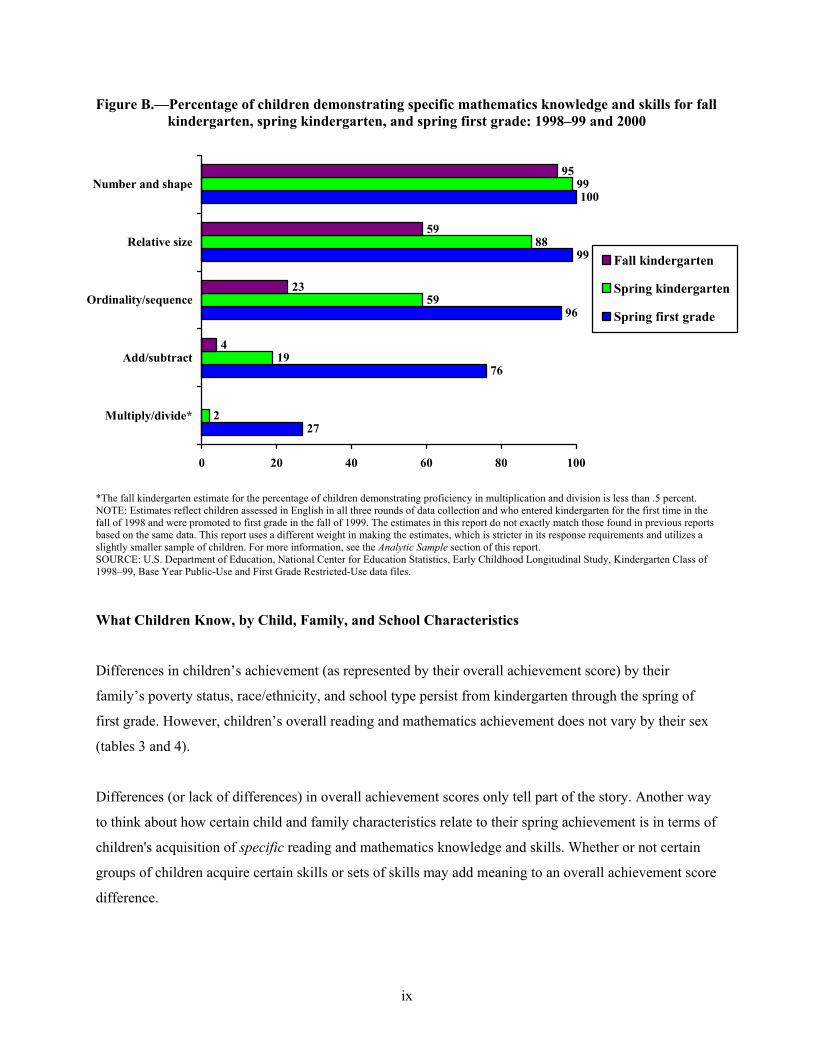
NOTE: Estimates reflect children assessed in English in all three rounds of data collection and who entered kindergarten for the first time in the fall of 1998 and were promoted to first grade in the fall of 1999. The estimates in this report do not exactly match those found in previous reports based on the same data. This report uses a different weight in making the estimates, which is stricter in its response requirements and utilizes a slightly smaller sample of children. For more information, see the Analytic Sample section of this report. SOURCE: U.S. Department of Education, National Center for Education Statistics, Early Childhood Longitudinal Study, Kindergarten Class of 1998–99, Base Year Public-Use and First Grade Restricted-Use data files. By the spring of kindergarten, a large percentage (88 percent) of children understand the concept of
relative size (e.g., can count beyond 10 and understand and can use nonstandard units of length to
compare objects). By the spring of first grade, most children (96 percent) have mastered ordinality and
sequence (the understanding of the relative position of objects); and about three-quarters (76 percent)
demonstrate proficiency in adding and subtracting basic whole units. Moreover, by the spring of first
grade, about one-quarter (27 percent) demonstrate proficiency in multiplying and dividing simple whole
units (figure B, table 2).
48
83
94
98
100
4
14
54
74
95
1
3
18
31
67
0 20 40 60 80 100
Words in context
Sight words
Ending sounds
Beginning sounds
Letter recognition
Fall kindergarten
Spring kindergarten
Spring first grade
ix
Figure B.—Percentage of children demonstrating specific mathematics knowledge and skills for fall kindergarten, spring kindergarten, and spring first grade: 1998–99 and 2000
*The fall kindergarten estimate for the percentage of children demonstrating proficiency in multiplication and division is less than .5 percent. NOTE: Estimates reflect children assessed in English in all three rounds of data collection and who entered kindergarten for the first time in the fall of 1998 and were promoted to first grade in the fall of 1999. The estimates in this report do not exactly match those found in previous reports based on the same data. This report uses a different weight in making the estimates, which is stricter in its response requirements and utilizes a slightly smaller sample of children. For more information, see the Analytic Sample section of this report. SOURCE: U.S. Department of Education, National Center for Education Statistics, Early Childhood Longitudinal Study, Kindergarten Class of 1998–99, Base Year Public-Use and First Grade Restricted-Use data files. What Children Know, by Child, Family, and School Characteristics
Differences in children’s achievement (as represented by their overall achievement score) by their
family’s poverty status, race/ethnicity, and school type persist from kindergarten through the spring of
first grade. However, children’s overall reading and mathematics achievement does not vary by their sex
(tables 3 and 4).
Differences (or lack of differences) in overall achievement scores only tell part of the story. Another way
to think about how certain child and family characteristics relate to their spring achievement is in terms of
children's acquisition of specific reading and mathematics knowledge and skills. Whether or not certain
groups of children acquire certain skills or sets of skills may add meaning to an overall achievement score
difference.
27
76
96
99
100
2
19
59
88
99
4
23
59
95
0 20 40 60 80 100
Multiply/divide*
Add/subtract
Ordinality/sequence
Relative size
Number and shape
Fall kindergarten
Spring kindergarten
Spring first grade

x
In terms of specific first-grade reading and mathematics skills and knowledge, females are more likely to
recognize words by sight and understand words in context than males. Males and females are equally
likely to be adding and subtracting; but, in the spring of first grade, males are more likely than females to
solve problems that require multiplication and division. Simply stated, by the spring of first grade,
females are more likely to be reading and males are more likely to be successful at advanced
mathematical operations (i.e., multiplication and division) (tables 1 and 2).
When considering the poverty status of children’s families from the kindergarten year, first-graders from
nonpoor families are more likely to recognize words by sight than first-graders from poor families. The
same is true for addition and subtraction. Moreover, about twice as many first-graders from nonpoor
families are proficient at understanding words in context and performing multiplication and division as
first-graders from poor families (tables 1 and 2).
There are also differences by children’s race/ethnicity. White children are more likely than Black or
Hispanic children to recognize words by sight, understand words in context, solve addition and
subtraction problems, and solve multiplication and division problems by the spring of first grade. Asian
children are more likely than Black or Hispanic children to recognize words by sight, understand words in
context, and solve multiplication and division problems. In the spring of first grade, Hispanic children are
more likely than Black children to demonstrate proficiency in these particular reading and mathematics
areas (tables 1 and 2).
What is the relationship of children’s early literacy, approaches to learning, and general health status as
they enter kindergarten to their spring kindergarten and first grade
reading and mathematics achievement?
Children who recognize their letters, who are read to at least three times a week, who recognize their
basic numbers and shapes, and who demonstrate an understanding of the mathematical concept of relative
size as they enter kindergarten demonstrate significantly higher overall reading and mathematics
knowledge and skills (in terms of an overall scale score) in the spring of kindergarten and the spring of
first grade than children who do not have these resources. The same pattern is true for children who
frequently demonstrate a positive approach to learning and who are in very good to excellent health as
they enter kindergarten (tables 6 and 7).

xi
An analysis of the specific skills children acquire shows that children who recognize their letters, who are
read to at least three times a week, who recognize their basic numbers and shapes, and who demonstrate
an understanding of the mathematical concept of relative size as they enter kindergarten are more likely to
understand the letter-sound relationship at the beginning and ending of words, read words by sight, and
understand words in context by the spring of first grade (figure C, table 8). In mathematics, children who
recognize their letters, who are read to at least three times a week, who recognize their basic numbers, and
shapes, and who demonstrate an understanding of the mathematical concept of relative size as they enter
kindergarten are more likely to understand the mathematical concept of ordinality and sequence,
successfully solve addition and subtraction problems, and successfully solve multiplication and division
problems. The same pattern is true for children who frequently demonstrate a positive approach to
learning and for those who are in very good to excellent health as they enter kindergarten (tables 8 and 9,
figure D).
Figure C.—Percentage of children demonstrating specific reading knowledge and skills in the
spring of first grade by whether they were proficient in recognizing their letters at kindergarten entry: 2000
NOTE: Estimates reflect children assessed in English in all three rounds of data collection and who entered kindergarten for the first time in the fall of 1998 and were promoted to first grade in the fall of 1999. The estimates in this report do not exactly match those found in previous reports based on the same data. This report uses a different weight in making the estimates, which is stricter in its response requirements and utilizes a slightly smaller sample of children. For more information, see the Analytic Sample section of this report. SOURCE: U.S. Department of Education, National Center for Education Statistics, Early Childhood Longitudinal Study, Kindergarten Class of 1998–99, Base Year Public-Use and First Grade Restricted-Use data files.
99 9892
60
95
87
63
21
0
20
40
60
80
100
Beginning sounds Ending sounds Sight words Words in context
Proficient in letters
Not proficient inletters

xii
Figure D.—Percentage of children demonstrating specific mathematics knowledge and skills in the spring of first grade by their approach to learning at kindergarten entry: 2000
NOTE: Estimates reflect children assessed in English in all three rounds of data collection and who entered kindergarten for the first time in the fall of 1998 and were promoted to first grade in the fall of 1999. The estimates in this report do not exactly match those found in previous reports based on the same data. This report uses a different weight in making the estimates, which is stricter in its response requirements and utilizes a slightly smaller sample of children. For more information, see the Analytic Sample section of this report. SOURCE: U.S. Department of Education, National Center for Education Statistics, Early Childhood Longitudinal Study, Kindergarten Class of 1998–99, Base Year Public-Use and First Grade Restricted-Use data files.
Summary Children begin kindergarten with different sets of knowledge and skills. Children’s reading and
mathematics knowledge and skills that differ by child, family, and school characteristics at the beginning
of kindergarten persist into the spring of kindergarten and the spring of first grade. The findings in this
report also suggest the beginnings of differences in children’s reading and mathematics performance by
their sex. By the spring of first grade, females are more likely to be reading, whereas males are more
likely to be proficient at advanced mathematics (i.e., multiplication and division). The longitudinal nature
of the ECLS-K will enable researchers to track these differences in terms of children’s third and fifth
grade reading and mathematics performance.
Children who begin kindergarten with certain resources seem to be at an advantage. Children who
demonstrate early literacy skills and who come from a positive literacy environment, who possess a
positive approach to learning, and who enjoy very good or excellent general health seem to perform better
98
84
34
92
64
16
0
20
40
60
80
100
Ordinality/sequence Add/subtract Multiply/divide
Often to very oftendemonstrates a positiveapproach to learningSometimes or neverdemonstrates a positiveapproach to learning

xiii
after 1 and even 2 years of formal schooling than children who do not have these resources. Specifically,
these children perform better in spring kindergarten and spring first-grade reading and mathematics.
This third report from the ECLS-K, in conjunction with America’s Kindergartners and The Kindergarten
Year, provides descriptive information on young children’s achievement across kindergarten and first
grade. The ECLS-K will continue to follow these children into third and fifth grades. The study will
provide researchers not only with an understanding of how children’s early literacy, approaches to
learning, and general health status at kindergarten entry shape their later achievement but also of how
these resources need to be maintained and further developed for continued scholastic success. The
valuable information collected through this study will help us better understand the early education and
elementary school experience of our nation’s children.

xiv

xv
Table of Contents
Acknowledgments.......................................................................................................................... iii Executive Summary ........................................................................................................................ v Children’s Reading and Mathematics Achievement in Kindergarten and First Grade .................. 1 Questions......................................................................................................................................... 5 Organization of the Report.............................................................................................................. 5 Measures ......................................................................................................................................... 6 Analytic Sample.............................................................................................................................. 9 Findings......................................................................................................................................... 10 Summary ....................................................................................................................................... 24 Methodology and Technical Notes ............................................................................................... 27 References..................................................................................................................................... 35 Tables............................................................................................................................................ 37 Appendix....................................................................................................................................... 61

xvi

1
Children’s Reading and Mathematics Achievement
in Kindergarten and First Grade
Children’s experiences with school are almost as varied as the children themselves. Children’s early
education sets the tone for their later learning. Therefore, it is important to capture information on
children’s initial interactions with school; that is, their kindergarten and first grade years.
This report is the third in a series based on findings about young children’s early experiences with school
from the Early Childhood Longitudinal Study, Kindergarten Class of 1998–99 (ECLS-K). The ECLS-K is
a multisource, multimethod study that focuses on children’s early education beginning with kindergarten.
The design of the ECLS-K has been guided by a framework of children’s development and schooling that
emphasizes the interaction between the child and family, the child and school, the family and school, and
the family, school, and community. The ECLS-K includes measures of children’s health status, socio-
emotional, and student achievement and their family, school/classroom, and community environments.
Sponsored by the U.S. Department of Education, National Center for Education Statistics (NCES), the
ECLS-K selected a nationally representative sample of kindergartners in the fall of 1998 and is following
these children through the spring of fifth grade. The study collects information directly from the children,
their families, teachers, and schools. The full ECLS-K base-year sample is comprised of approximately
22,000 children who attended about 1,000 kindergarten programs during the 1998–99 school year.
The first report, America’s Kindergartners (West, Denton and Germino Hausken 2000), provided a
national picture of the knowledge and skills of beginning kindergartners. It revealed that while first-time
kindergartners are similar in many ways, differences exist in their knowledge and skills in relation to their
age at school entry, race/ethnicity, health status, home educational experiences, and child care histories.
The differences found at school entry were consistent with the differences in other national studies of
older children (e.g., National Assessment of Educational Progress, National Education Longitudinal
Study of 1998).
The Kindergarten Year (West, Denton, and Reaney 2001), the second report, showed that children
considered at-risk for school failure acquired many of the basic skills in reading and mathematics during
their first year of school that they did not have when they began the kindergarten year. Consequently, by
the spring of kindergarten, the majority of these children knew their letters, numbers, and shapes; about

2
half made the connection between letter and sound at the beginning of words; and almost three-quarters
understood the mathematical concept of relative size (e.g., out of two objects, identify which object is
longer). However, these same children fell behind their more advantaged classmates. Specifically, across
the kindergarten year, the gap between disadvantaged children and other children widened in more
advanced reading (e.g., recognizing words by sight) and mathematics skills (e.g., adding and subtracting).
This report, the third in the series, opens with a picture of these same children as first-graders. The first
two reports laid the foundation for a basic understanding of children’s achievement across the
kindergarten year. Prior reports (i.e., The Kindergarten Year) specifically addressed the gains children
made in reading and mathematics across the school year. This report focuses more on the status of
children's reading and mathematics achievement in the spring of kindergarten and the spring of first
grade.
To address the multifaceted nature of children's development, this report relates children's reading and
mathematical knowledge and skills to child, family, and school characteristics. This report takes a broad
view of child development and describes some of the basic relationships between children’s literacy, their
approaches to learning, and their general health status at kindergarten entry to their later kindergarten and
first-grade reading and mathematics knowledge and skills.
Literacy
Literacy is an important construct that relates to kindergartners’ and first-graders’ early experiences with
school. Literacy not only refers to children’s familiarity with language and the printed word but also to
their awareness of numbers, logic, and mathematical operations (National Research Council 1989). For
example, one of the earliest steps to reading is the ability to understand that print has meaning (National
Reading Panel 2000). This often refers to children’s knowledge and awareness of the alphabet as
represented in print. Most preschoolers are beginning to recognize some printed letters and words
(Committee on the Prevention of Reading Difficulties in Young Children 1998). Frequently, children are
most familiar with the letters in their own names. Children who can recognize some of the letters of the
alphabet as they enter kindergarten are at an advantage (Committee on the Prevention of Reading
Difficulties in Young Children 1998). We know from America’s Kindergartners (West et al. 2000) that
about two-thirds of children can recognize their letters as they enter kindergarten. The question is, does
the ability to recognize letters at kindergarten entry relate to spring kindergarten and first grade
achievement?

3
Reading to children is shown to have a positive effect on children’s literacy outcomes (Denton, Reaney,
and West 2001; Snow, Burns and Griffin 1998). Through experience with books, children gain important
exposure to written language. They begin making connections between the spoken word and the printed
word (Beck and Juel 1999). Policymakers contend that it is important to read to your child (Lyon 1999).
America’s Kindergartners (West et al. 2000) provided important information about the frequency with
which the average parent reads to his/her young child. About 45 percent of parents report reading to their
children every day, whereas 80 percent of parents report reading to their children at least three times a
week. Do children who are read to at least three times a week perform better in kindergarten and first
grade than children who are read to less than three times a week?
In addition to their emergent reading skills (i.e., recognizing letters) and exposure to literacy activities
(i.e., being read to), children who understand their numbers and shapes are on the road to math literacy. It
is important to note that math is not simply about numbers and numerical mathematical operations.
Mathematics knowledge and skills also include the ability to draw inferences, see relationships and reason
logically (National Research Council 1989). Consequently, young children who possess an understanding
of numbers, shapes and a basic ability to conceptualize objects as they enter kindergarten may be at an
advantage in terms of both their reading and mathematics learning. America’s Kindergartners (West et al.
2000) revealed that the majority of children recognized basic numbers and shapes as they entered
kindergarten and about three in five understood the concept of relative size (e.g., comparing nonstandard
units of measure). Consequently, does the ability to recognize basic numbers and shapes and the mastery
of the concept relative size relate to children’s spring reading and mathematics achievement in
kindergarten and first grade?
Approaches to Learning
The development of young children is multidimensional; it needs to be conceptualized in terms of
cognitive aspects such as reading and mathematics, and how they approach learning. Accordingly, when
looking at the process by which children develop as learners, it is important to understand how they
approach learning. Skills such as paying attention and persisting at tasks are important skills in the
learning process (Schunk and Zimmerman 1996). These skills are integral to how children approach
learning, in part, by representing how children regulate their learning experiences. Children who are self-
regulated learners may have an advantage (Schunk and Zimmerman 1996, Paris and Cunningham 1996).
Consequently, children who often or very often demonstrate positive approaches to learning may more

4
rapidly acquire cognitive knowledge and skills. Thus, are there differences in children’s spring
kindergarten and first grade cognitive achievement by whether they often or very often demonstrate a
positive approach to learning as they enter kindergarten?
General Health
Children’s health status is one of the basic foundations in successful learning. Children who have
difficulties with their health in general may be less able to participate in the classroom, may be prone to
more frequent absences, and therefore may be at-risk learners; whereas, children with sound general
health may be at an advantage (Shonkoff 1992). America’s Kindergartners (West et al. 2000) reported
that 51 percent of children are considered by their parents to be in excellent general health as they enter
kindergarten and 32 percent are reported in very good general health as they enter kindergarten. What,
then, is the relationship between children’s health at kindergarten entry and their spring kindergarten and
first grade cognitive achievement?

5
Questions
This report uses data from the ECLS-K to address the following:
♦ What reading and mathematics knowledge and skills do children demonstrate in the spring of first
grade? Do children’s knowledge and skills differ by certain child, family, and school characteristics?
♦ What is the relationship between children’s early literacy, approach to learning, and general health
status as they enter kindergarten and their spring kindergarten and first grade reading and
mathematics achievement? In particular, how do the following relate to children’s spring kindergarten
and spring first grade achievement:
− proficiency in recognizing letters,
− being read to at least three times a week,
− proficiency in recognizing numbers and basic shapes,
− proficiency in the mathematical concept of relative size,
− demonstrating a positive approach to learning often or very often, and
− reported to be in very good to excellent general health?
Organization of the Report
The findings in this report are organized in two sections, which coincide with the two sets of questions
identified above. First, information on children’s reading and mathematics skills and knowledge at the
spring of first grade by child, family, and school characteristics are presented. Next, the report presents
information on the relationship of resources children possess at kindergarten entry to their spring
kindergarten and first grade reading and mathematics achievement. Within each section, children’s
reading and mathematics knowledge and skills are presented in terms of an indicator of overall
achievement (i.e., a t-score; for information on t-scores, see the Measures section of this report) and in
terms of specific skills (i.e., proficiencies).
When information on children’s reading and mathematics knowledge and skills is presented, estimates are
based on children in the sample who entered kindergarten for the first time in the fall of 1998 and who
received the ECLS-K direct cognitive assessment in English in both the fall and the spring of
kindergarten, and the spring of first grade. Comparisons made in the text are tested for statistical
significance to ensure that the differences are larger than might be expected, due to sampling variation.
All differences described are significant at the .05 level.3
3 Not all significant differences are discussed in this report. Due to the large sample size, nearly all differences (no matter how substantively minor) are significant. Therefore, only differences of about one-quarter of a standard deviation are discussed (e.g., 2 or 3 points for a mean t-score difference) (for review, see Cohen 1988).
6
Measures
This report includes information collected through direct one-on-one child assessments, parent interviews,
and teacher questionnaires. These are described in general terms below. For more technical information
(e.g., psychometric properties, or more detailed operational information), see the Methodology and
Technical Notes section of this report or the ECLS-K Base-Year User’s Manual (National Center for
Education Statistics 2001).
Children’s Reading and Mathematics Knowledge and Skills
The ECLS-K reading and mathematics assessment was directly administered to children in a quiet one-on-one setting. Children used pointing or verbal responses to complete the tasks; they were not asked to write anything or to explain their reasoning. The data were collected using computer-assisted interviewing methodology. The assessment included the use of a small easel with pictures, letters of the alphabet, words, short sentences, numbers, or number problems. This report includes information from the assessments administered in the fall and spring of kindergarten, and the spring of first grade.4 In the ECLS-K, the reading assessment,5 specifically designed for the ECLS-K (National Center for Education Statistics 2001), was administered in English, and the mathematics assessment was administered in both English and Spanish. Prior to administering the English reading and mathematics assessment, children’s English language proficiency was evaluated. Children whose home language was other than English (as determined by school records) were administered the Oral Language Development Scale (OLDS) (for more information, see the ECLS-K Base-Year User’s Manual, National Center for Education Statistics 2001). If children demonstrated sufficient proficiency in English for the ECLS-K direct child assessment, they received the English reading and mathematics battery. This report focuses on those children who were assessed in English, at all points in time. The reading assessment included questions designed to measure basic skills (letter recognition, beginning and ending sounds), vocabulary (receptive vocabulary, as in "point to the picture of the cat"), and comprehension (listening comprehension, words in context). Comprehension items were targeted to
4 A subsample of children was also assessed in the fall of first grade. Findings from that assessment will be included in future reports. 5 In deference to time and efficiency, the cognitive assessment was developed as a two-stage assessment. Separately for each domain, all children received the first-stage routing section. A routing section is a set of items of varying difficulty levels, in which all children receive all items. Depending on the number of items children correctly answered in the routing section, they were then "routed" into a second-stage form, which varied by level of difficulty. The two-stage design allowed for the maximum amount of information with efficiency of time. The routing section provided a rough estimate of each child’s achievement level, so that a second-stage form with items of the appropriate difficulty for maximizing measurement accuracy could be selected. Scores for each domain were developed using Item Response Theory (IRT). These scores can be compared regardless of which second-stage form a student was administered. In other words, each child has a score that reflects the entire battery of items.

7
measure skills in initial understanding, developing interpretation, personal reflection, and demonstrating critical stance (evaluative judgments about the text, such as recognizing implausible events). The mathematics assessment items were designed to measure skills in conceptual knowledge, procedural knowledge, and problemsolving. Approximately one-half of the mathematics assessment consisted of questions on number sense and number properties and operations. The remainder of the assessment included questions in measurement; geometry and spatial sense; data analysis, statistics, and probability; and patterns, algebra, and functions. Each of the mathematics assessment forms contained several items for which manipulatives (e.g., blocks) were available for children to use in solving the problems. Paper and pencil were also offered to the children to use for the appropriate parts of the assessment. In this report, information on children’s overall reading and mathematics knowledge and skills are presented as a standardized t-score.6 T-scores provide norm-referenced measurements of achievement— that is, estimates of achievement level relative to the population as a whole. A high t-score mean for a particular subgroup indicates that the group’s performance is high in comparison to other groups. It does not mean that group members have mastered a particular set of skills, only that their performance level is greater than a comparison group. Similarly, a change in t-score means over time reflects a change in the group’s status with respect to other groups. Consequently, t-scores are not ideal for indicating gains in achievement.
In addition to the standardized overall achievement score (i.e., t-score) for reading and mathematics,
specific proficiency scores were calculated.7 These proficiency scores represent a progression of skills.
The reading assessment contained five proficiency levels (from easiest to most difficult): (1) recognizing
letters (identifying upper and lower case letters by sight); (2) understanding the letter-sound relationship
at the beginning of words (identifying the letter that represents the sound at the beginning of a word); (3)
understanding the letter-sound relationship at the end of words (identifying the letter that represents the
sound at the end of a word); (4) recognizing words by sight (reading simple words aloud); and
(5) understanding words in context (listening comprehension and reading simple text passages).
The mathematics assessment also contained five proficiency levels: (1) numbers and shapes refers to a
cluster of items that measures reading numerals, recognizing shapes, and counting to 10; (2) relative size
refers to a cluster of items that measure reading numerals, counting beyond 10, sequencing patterns, and
using nonstandard units of length to compare objects; (3) ordinality refers to items that measure number
sequence, reading two-digit numerals, identifying the ordinal position of an object, and solving a word
problem; (4) addition and subtraction refers to a cluster of items which measure calculating sums up to 10
6 The t-score is a transformation of the Item Response Theory-based (IRT) scale score. 7 For information on reliability of the scores, see the Methodology and Technical Notes section.

8
and relationships of numbers in sequence; and (5) multiplication and division involves items that measure
problemsolving using multiplication and division and number patterns.
Children’s proficiency in specific reading and mathematics skills was calculated in two different ways. First, to estimate the percentage of the total population who can demonstrate specific skills, proficiency probability scores were utilized (i.e., a score that is the probability a child would have passed the proficiency level). These scores refer to IRT-based probabilities, and are continuous (e.g., ranging from 0 to 1). They are estimates based on overall performance rather than counts of actual item responses. Second, to determine a dichotomous (e.g., yes or no) cut-point of whether a specific child is proficient in a specific skill, the specific items in a cluster (i.e., proficiency area) were utilized. For each proficiency level, a score of 1 was assigned to children who correctly answered at least three of the four items in the cluster, and a score of 0 was given if at least two items were incorrect or "don’t know." Both the continuous score and the dichotomous score reference the exact same set of assessment items. Due to the slight computational difference, the estimates produced by these scores do not exactly match (see tables 1 and 2 versus table 5). The continuous proficiency probability scores maximize the amount of information the ECLS-K captured on children’s reading and mathematics knowledge and skills (through an IRT model, information is provided on every item in the assessment battery). Therefore, this report utilizes the proficiency probability scores when presenting information on children’s reading knowledge and skills. The dichotomous proficiency scores, in this report, are only used to determine, in a yes/no fashion, whether a child demonstrated a specific reading and mathematics skill at kindergarten entry (e.g., table 5).
Children’s Approaches to Learning Teachers provided information on how the children approach learning. Teachers were asked to respond to a series of questions, asking about the frequency with which the specific sampled children in their classrooms demonstrated certain behaviors. The approaches to learning scale measures behaviors that affect the ease with which children can benefit from the learning environment. It includes six items that rate the child’s attentiveness, task persistence, eagerness to learn, learning independence, flexibility, and organization. In this report, information about the frequency of such behaviors is presented in terms of often/very often versus sometimes/never.
General Health, Home Educational Activities and Child/Family Characteristics Parents provided information during a computer-assisted telephone interview. The parent interview was conducted primarily in English, but provisions were made to interview parents who spoke other languages. Parents were asked to provide information on how often in a week a family member reads to their child (ranging from never to every day). Parents were also asked to provide information on their

9
children's health. Specifically, parents were asked to rate their child's general health from poor to excellent.8 The following information presented in this report also comes from the parent interview: poverty status of the household, confirmation of the children’s race/ethnicity, how frequently children are read to and children’s general health. More information on how each of these was asked in the parent interview can be found in the Methodology and Technical Notes section.
Analytic Sample
In an effort to provide information on the early education experiences of the typical child (i.e., one who
spent 1 year in kindergarten and who continued on to first grade), the children included in the analysis
entered kindergarten for the first time in fall of 1998 and were promoted to first grade in the fall of 1999.9
In terms of the population distributions for children who repeated kindergarten in the fall of 1999 versus
those who were promoted to first grade in the fall of 1999: repeaters were 67 percent White,10 16 percent
Black, 10 percent Hispanic, 1 percent Asian, 5 percent Other, and 27 percent poor; those promoted to first
grade in the fall of 1999 were 62 percent White, 17 percent Black, 13 percent Hispanic, 2 percent Asian, 5
percent Other, and 18 percent poor.
Further, since this report provides information on children’s early reading achievement, and the reading
assessment was administered in English, the analyses in this report are limited to those children who were
administered the English reading assessment. To achieve consistency in the sample across rounds (i.e.,
fall kindergarten, spring kindergarten and spring first grade), the analyses in this report are limited to
those children who were assessed in English in all three rounds of data collection. In terms of English
assessment status by race/ethnicity, approximately 68 percent of Hispanic children and 78 percent of
Asian children were assessed in English in fall and spring of kindergarten and in the spring of first
grade.11
The analytic sample included in this report, when weighted, produces population distributions as follows:
50 percent male, 50 percent female; 62 percent White, 17 percent Black, 13 percent Hispanic, 3 percent
Asian, and 5 percent Other; 19 percent poor, 81 percent nonpoor; 5 percent public, 15 percent private.
8 This measure of general health has been used extensively in national surveys (e.g., the National Health Interview Survey). Research suggests that children who are rated in fair to poor health are more likely to have restricted activity due to health problems as compared with children in very good to excellent health (Ries and Brown 1991). This indicator of child health is one of the key indicators reported by the Federal Interagency Forum on Child and Family Statistics (2001). 9 Future reports based on the ECLS-K will explore the scholastic experiences of retained children. 10 In this report, White refers to White, non-Hispanic and Black refers to Black, non-Hispanic. 11 Future reports will present information on language minority children's achievement and development across kindergarten and first grade.

10
The estimates in this report do not exactly match those found in America’s Kindergartners or The
Kindergarten Year, previous reports based on ECLS-K data (National Center for Education Statistics
2000; National Center for Education Statistics 2001). This report utilizes both fall and spring kindergarten
and spring first grade child assessment scores; therefore, a different weight was used in making the
estimates. The weight in this report is stricter in its response requirements and utilizes a slightly smaller
sample of children. Further, this report focuses on those children who entered kindergarten for the first
time in the fall of 1998 and were promoted to first grade "on time" in the fall of 1999. Therefore, the
kindergarten year estimates are based on a smaller sample of children (i.e., the approximately 5 percent of
first-time kindergarten children who were eventually retained are not included in these estimates).
Findings
What reading and mathematics knowledge and skills do children demonstrate in the spring of first grade? Do children’s knowledge and skills differ by certain child, family, and school characteristics?
What Children Know
Researchers, policymakers, and practitioners maintain that by the spring of kindergarten children should
be able to recognize the letters of the alphabet “quickly and effortlessly," and understand the letter-sound
relationship at the beginning and ending of words (National Academy Press 1998; Committee on the
Prevention of Reading Difficulties in Young Children 1998). Further, by the spring of first grade, most
children should be recognizing words by sight and comprehending words in the context of simple
sentences (National Academy Press 1998; Committee on the Prevention of Reading Difficulties in Young
Children 1998).
For the most part, this study confirms these expectations. As children enter kindergarten, 67 percent
recognize their letters,12 and indeed by the spring of kindergarten this increases to 95 percent. After 2
years of school, nearly all (100 percent) children can recognize their letters. At kindergarten entry, a little
less than a third (31 percent) of children understand the letter-sound relationship at the beginning of
words and about one in six (18 percent) children understand the letter-sound relationship at the end of
words. By the spring of kindergarten, about three-quarters (74 percent) of children make the letter-sound
12 The estimates in this report do not exactly match those found in America’s Kindergartners or The Kindergarten Year, previous reports based on ECLS-K data (NCES 2000; NCES 2001). This report utilizes both fall and spring kindergarten and spring first grade child assessment scores; therefore, a different weight was used in making the estimates. The weight in this report is stricter in its response requirements and utilizes a slightly smaller sample of children. Further, this report focuses on those children who entered kindergarten for the first time in the fall of 1998 and were promoted to first grade "on-time" in the fall of 1999. Therefore, the kindergarten year estimates are based on a smaller sample of children (i.e., the approximately 5 percent of first-time kindergarten children who were eventually retained are not included in these estimates).

11
connection at the beginning of words and about half (54 percent) of children make this connection at the
end of words. And, by the spring of first grade, almost all children have mastered these reading skills (98
and 94 percent, respectively) (figure 1). About five in six children (83 percent) recognize common words
by sight (sight words); and about one-half (48 percent) of children understand words in context
(compared to 14 and 4 percent, respectively, from the spring of kindergarten) (figure 1, table 1).
Figure 1.—Percentage of children demonstrating specific reading knowledge and skills for fall
kindergarten, spring kindergarten, and spring first grade: 1998–99 and 2000
NOTE: Estimates reflect children assessed in English in all three rounds of data collection and who entered kindergarten for the first time in the fall of 1998 and were promoted to first grade in the fall of 1999. The estimates in this report do not exactly match those found in previous reports based on the same data. This report uses a different weight in making the estimates, which is stricter in its response requirements and utilizes a slightly smaller sample of children. For more information, see the Analytic Sample section of this report. SOURCE: U.S. Department of Education, National Center for Education Statistics, Early Childhood Longitudinal Study, Kindergarten Class of 1998–99, Base Year Public-Use and First Grade Restricted-Use data files. The National Council of Teachers of Mathematics (NCTM) produces a guide of principles and standards
for school mathematics. According to this set of standards, in terms of prekindergarten through second
grade mathematics, children should be learning to connect number words and numerals, count with an
understanding of how many, understand the relative position of objects (i.e., ordinality), and be able to
compute whole numbers with an emphasis on addition and subtraction (NCTM 2000). Analyses of data
from the ECLS-K reveal children are acquiring these skills across the early grades. As children enter
48
83
94
98
100
4
14
54
74
95
1
3
18
31
67
0 20 40 60 80 100
Words in context
Sight words
Ending sounds
Beginning sounds
Letter recognition
Fall kindergarten
Spring kindergarten
Spring first grade

12
kindergarten, the majority (95 percent) already recognize their basic numbers and shapes. By the spring of
kindergarten, a large percentage (88 percent) can count beyond 10 and understand the mathematical
concept of relative size (i.e., using nonstandard units of length to compare objects). By the spring of first
grade, the majority (96 percent) have mastered ordinality (the understanding of the relative position of
objects); and about three-quarters (76 percent) demonstrate proficiency in adding and subtracting basic
whole units. Moreover, by the spring of first grade about one-quarter (27 percent) demonstrate
proficiency in multiplying and dividing simple whole units (figure 2, table 2).
Figure 2.—Percentage of children demonstrating specific mathematics knowledge and skills for fall kindergarten, spring kindergarten and spring first grade: 1998–99 and 2000
*The fall kindergarten estimate for the percentage of children demonstrating proficiency in multiplication and division is less than .5 percent. NOTE: Estimates reflect children assessed in English in all three rounds of data collection and who entered kindergarten for the first time in the fall of 1998 and were promoted to first grade in the fall of 1999. The estimates in this report do not exactly match those found in previous reports based on the same data. This report uses a different weight in making the estimates, which is stricter in its response requirements and utilizes a slightly smaller sample of children. For more information, see the Analytic Sample section of this report. SOURCE: U.S. Department of Education, National Center for Education Statistics, Early Childhood Longitudinal Study, Kindergarten Class of 1998–99, Base Year Public-Use and First Grade Restricted-Use data files. What Children Know, by Child, Family, and School Characteristics
Overall Reading and Mathematics Knowledge and Skills (Scale Scores). One way to analyze differences
in children’s reading and mathematics knowledge and skills by child, family, and school characteristics is
to look at their overall reading and mathematics scale scores. In this report, a standardized representation
of the scale score (i.e., t-score) is used. T-scores provide a norm-referenced measure of performance that
can be used as an indicator of the extent to which a specific group of children (e.g., males versus females)
27
76
96
99
100
2
19
59
88
99
4
23
59
95
0 20 40 60 80 100
Multiply/divide*
Add/subtract
Ordinality/sequence
Relative size
Number and shape
Fall kindergarten
Spring kindergarten
Spring first grade

13
ranks higher or lower than the national average and how this relative ranking changes over time. The
ECLS-K reading and mathematics t-scores are designed to have a mean of 50 and a standard deviation of
10 (when all scores from the complete sample of children are in the analysis). In this report, however, the
spring of kindergarten and the spring of first grade mean t-scores are 51 (tables 3 and 4). This is because
the analyses in this report are limited to children in the ECLS-K who entered kindergarten for the first
time in the fall of 1998, were promoted on time to first grade, and were assessed in English at all three
points in time.
In reading and mathematics, differences in children’s achievement by their family’s poverty status, their
race/ethnicity, and their school type persist from kindergarten through the spring of first grade. However,
children’s reading and mathematics achievement does not vary by their sex (tables 3 and 4).
In both reading and mathematics, children who are poor (i.e., come from families with incomes below the
poverty threshold13) consistently score about a half-standard deviation below the national average (i.e., 5
to 7 points). At all three points in time, their achievement is significantly lower than that of nonpoor
children (tables 3 and 4).
Racial/ethnic differences also exist in children’s kindergarten and first grade reading and mathematics
achievement. In both reading and mathematics, White children typically score near the national average
(i.e., 51). The one exception is in fall kindergarten math. White children enter kindergarten with a mean
score about 3 points above the national average. The picture for Black children is slightly different from
that of White children. In reading, Black children enter kindergarten 3 points below the national average,
and remain 3 points below the national average through the spring of kindergarten and the spring of first
grade. In math, Black children are also significantly below the national average at all three points in time
(i.e., 3 to 4 points) (tables 3 and 4).
Hispanic children’s reading achievement seems to be moving upward toward the mean.14 When Hispanic
children enter kindergarten they score significantly lower than the national average in reading (4 points),
but by the spring of first grade they are on par with the national average (i.e., within 1 point). In terms of
13 Poverty is a function of household income and household size. For more information, see the Methodology and Technical Notes section. 14 The children included in the estimates in this report are children who were assessed in English at all three points in time. To explore how including children who demonstrated sufficient English language proficiency to receive the English battery in the spring of kindergarten and spring of first grade (i.e., screened into the battery) would impact the estimates, an example analysis using the reading t-scores was run. Comparing the mean t-scores presented in table 2 for children assessed in English at all three points to the mean t-scores for all children who were screened into the English assessment over time, did not yield significant differences. Specifically, the estimates are as follows: mean t-score fall kindergarten, spring kindergarten, spring first grade for children assessed in English at all points in time—51, 51, 51, respectively; mean t-score fall kindergarten, spring kindergarten, spring first grade for children who screened in over time—51, 51, 51, respectively. Further, the same nonsignificant finding is true in terms of specific racial/ethnic groups (e.g., the estimates are as follows: mean t-score fall kindergarten, spring kindergarten, spring first grade for Hispanic children assessed in English at all points in time—47, 49, 50, respectively; mean t-score fall kindergarten, spring kindergarten, spring first grade for Hispanic children who screened in over time—47, 48, 49, respectively. For more information (e.g., methods and breakdowns of children not assessed in English), refer to the Methodology and Technical Notes section.

14
mathematics, Hispanic children score near the national average (i.e., within 2-3 points) in the spring of
kindergarten and the spring of first grade. In reading, Asian children consistently are about a half-standard
deviation above the national average (3 to 5 points). In mathematics, Asian children are above the
national average during their kindergarten year; but by the spring of first grade, they are within 2 points of
the national average (tables 3 and 4).
A slightly different way to think about racial/ethnic differences is to compare the groups to one another,
versus comparing the groups to the national average. When the achievement of the different racial/ethnic
groups is compared, White and Asian children score significantly higher than Black children in reading
and mathematics at all three points in time (tables 3 and 4).
Children’s reading and mathematics achievement also differs by school type during their kindergarten
year. Children who attended private schools during the kindergarten year enter kindergarten scoring
significantly higher in reading and mathematics than the national average, and maintain this difference
through the spring of first grade (tables 3 and 4).
Specific Reading and Mathematics Knowledge and Skills. Though differences are evident in all five
proficiency levels in reading and mathematics at any given point in time (i.e., fall kindergarten, spring
kindergarten, spring first grade), this section concentrates on the differences children demonstrate in
recognizing words by sight (sight words), words in context, addition and subtraction, multiplication and
division in the spring of first grade.15 Females are more likely to recognize words by sight and to
understand words in context than males. There is no difference by sex in terms of addition and
subtraction; but in the spring of first grade, males are more likely than females to solve problems that
require multiplication and division. So, while there are no overall differences by sex of the child, in the
spring of first grade females are more likely to have mastered complex reading skills; whereas, males are
more likely to have mastered complex mathematics skills.16
15 For a more detailed analysis of children’s reading and mathematics knowledge and skills at the beginning of kindergarten and across the kindergarten year, refer to America’s Kindergartners (West et al. 2000) and The Kindergarten Year (West et al. 2001). 16 An existing analysis based on the ECLS-K explores the possible sex and age interaction associated with the scholastic performance of young children during kindergarten. The analysis revealed no significant interactions (Reaney, West, and Denton, 2000).

15
When considering the poverty status of children’s families during the kindergarten year, first-graders
from nonpoor families are more likely to recognize words by sight than first-graders from poor families.
The same is true for addition and subtraction. Moreover, about twice as many first-graders from nonpoor
families are proficient at understanding words in context and performing multiplication and division (the
more complex skills) as first-graders from poor families (tables 1 and 2).
Differences by children’s race/ethnicity are also apparent. White children are more likely than Black or
Hispanic children to recognize words by sight, understand words in context, solve addition and
subtraction problems, and solve multiplication and division problems. Asian children are more likely than
Black or Hispanic children to recognize words by sight, understand words in context, and solve
multiplication and division problems. In the spring of first grade, Hispanic children are more likely than
Black children to demonstrate proficiency in these particular reading and mathematics areas17 (tables 1
and 2).
The differences in specific knowledge and skills by school type echo the differences described above in
children’s overall reading and mathematics scores. In the spring of first grade, children who attended
private school during their kindergarten year are more likely than children who attended public school
during their kindergarten year to demonstrate proficiency in sight words, words in context, addition and
subtraction, and multiplication and division. They were also more likely to be proficient in these skills
when they entered kindergarten (tables 1 and 2).
What is the relationship between children’s early literacy, approaches to learning, and general health status as they enter kindergarten and their spring kindergarten and first grade reading and mathematics
achievement?
In order to answer this question, this section of the report examines three sets of relationships: (1) the
relationship of children’s reading and mathematics literacy at kindergarten entry to their spring
kindergarten and first grade achievement; (2) the relationship of children’s approaches to learning at
kindergarten entry to their spring kindergarten and first grade achievement; and (3) the relationship of
17 This finding should be interpreted in context. In order to be fairly assessed, children needed to demonstrate a basic proficiency in English. Thus, some Hispanic children were excluded from the assessment and the estimate does not reflect the entire population of Hispanic children in the sample.

16
children’s general health at kindergarten entry to their spring kindergarten and first grade achievement
(see table 5 for information on children’s literacy, approaches to learning, and general health).
Children’s spring kindergarten and spring first grade reading and mathematics achievement is presented
in two ways. First, children’s spring kindergarten and spring first grade overall reading and mathematics
achievement (i.e., t-scores) is examined by children’s early literacy, approaches to learning, and general
health status as they began kindergarten. In addition to reporting children’s mean t-scores, the percentage
of children scoring in each quartile of the t-score distribution (i.e., lowest 25 percent, 26–50 percent, 51–
75 percent, 76–100 percent) is reported. Oftentimes, the greatest differences are at the tails of the
distribution (e.g., lowest 25 percent, highest 25 percent) (see West et al. 2000). Second, information on
the percentage of children who demonstrated specific reading and mathematics skills in the spring of
kindergarten and the spring of first grade are examined by children’s early literacy, approaches to
learning, and general health status.
Literacy
Children who recognize their letters, who are read to at least three times a week, who recognize their
basic numbers and shapes and demonstrate an understanding of the mathematical concept of relative size
as they enter kindergarten demonstrate significantly higher reading knowledge and skills in the spring of
kindergarten and the spring of first grade than children who do not have these resources (i.e., the former’s
t-scores are as much as a full standard deviation higher) (table 6). Further, children who recognize their
letters at kindergarten entry are significantly more likely than children who cannot recognize their letters
to score in the top 25 percent of children in reading in the spring of kindergarten and the spring of first
grade. In fact, 35 percent of children who could recognize their letters at the start of kindergarten scored
in the top 25 percent in the spring of kindergarten, versus only 2 percent of children who could not
recognize their letters at kindergarten entry. A similar pattern is true in the spring of first grade (34
percent versus 5 percent, respectively) (table 6).
Being read to at least three times a week prior to entering kindergarten and being proficient at recognizing
numbers and relative size at kindergarten entry also relate to children’s spring kindergarten and first grade
reading achievement. Those who are read to at least three times a week are almost twice as likely to score
in the top 25 percent in reading than children read to less than three times a week (for spring kindergarten,
27 percent versus 14 percent; for spring first grade, 27 percent versus 16 percent). Also, children who are
proficient in their numbers and shapes and the mathematical concept of relative size are more likely to
score in the top 25 percent in reading than those who do not possess these skills as they enter kindergarten
(for spring kindergarten proficiency in numbers and shapes, 26 percent versus 1 percent; relative size, 37

17
percent versus 5 percent; for spring first grade proficiency in numbers and shapes, 26 percent versus 2
percent; relative size, 37 percent versus 6 percent) (figure 3, table 6).
Figure 3.—Of first-graders scoring in the top 25 percent in reading, the percentage who, at kindergarten entry, can recognize the letters of the alphabet, who are read to at least three times a week by a family member, who are proficient in numbers and shapes, and who are proficient in relative size: Spring 2000
NOTE: Estimates reflect children assessed in English in all three rounds of data collection and who entered kindergarten for the first time in the fall of 1998 and were promoted to first grade in the fall of 1999. SOURCE: U.S. Department of Education, National Center for Education Statistics, Early Childhood Longitudinal Study, Kindergarten Class of 1998–99, Base Year Public-Use and First Grade Restricted-Use data files. Children’s ability to recognize their letters as they begin kindergarten, the fact that they are read to at least
three times a week as they enter kindergarten, their ability to recognize basic numbers and shapes, and
their understanding of the mathematical concept of relative size all relate to their spring kindergarten and
first grade mathematics achievement. Children who have these resources score significantly higher in
mathematics in the spring of kindergarten and the spring of first grade (i.e., a higher mathematics t-score)
than their peers who do not have these skills. Once again, this difference is as much as one standard
deviation higher than those children who do not have these resources. In terms of the test score
distribution, students with these resources are significantly more likely to score in the top 25 percent in
both the spring of kindergarten and first grade than children without these resources (figure 4, table 7).
3427 26
37
5
16
26
0
20
40
60
80
100
Proficient in letters Read to at least 3times a week
Proficient in numbersand shapes
Proficient in relativesize
YesNo

18
Figure 4.—Of first-graders scoring in the top 25 percent in mathematics, the percentage who, at kindergarten entry, can recognize the letter of the alphabet, who are read to at least three times a week by a family member, who are proficient in numbers and shapes, and proficient in relative size: Spring 2000
NOTE: Estimates reflect children assessed in English in all three rounds of data collection and who entered kindergarten for the first time in the fall of 1998 and were promoted to first grade in the fall of 1999. SOURCE: U.S. Department of Education, National Center for Education Statistics, Early Childhood Longitudinal Study, Kindergarten Class of 1998–99, Base Year Public-Use and First Grade Restricted-Use data files. Another way to think about how certain resources of children relate to their spring achievement is in
terms of their acquisition of specific reading and mathematics knowledge and skills. Whether or not
certain groups of children acquire certain skills or sets of skills may be more easily understood than
differences in standardized test scores. At the spring of the kindergarten year, children who could
recognize their letters at the start of kindergarten are about twice as likely (86 percent and 47 percent,
respectively) to understand the letter-sound relationship at the beginning of words, and are about three
times as likely (67 percent and 26 percent, respectively) to understand the letter-sound relationship at the
ending of words as children who could not recognize their letters when they started kindergarten. In terms
of their first grade skills, children who could recognize their letters when they started kindergarten are
more likely than children who could not recognize words by sight and words in context by the spring of
first grade (92 percent versus 63 percent, 60 percent versus 21 percent; respectively). A similar
relationship is found for spring kindergarten and first grade mathematics skills (e.g., children who could
recognize their letters as they entered kindergarten are more likely than children who could not
demonstrate specific mathematical skills—ordinality/sequence, addition/subtraction, and
multiplication/division—in the spring of kindergarten and the spring of first grade (table 9).
3327 26
37
915
26
0
20
40
60
80
100
Proficient in letters Read to at least 3times a week
Proficient in numbersand shapes
Proficient in relativesize
YesNo

19
Figure 5.—Percentage of children demonstrating specific reading knowledge and skills in the spring of kindergarten by whether they were proficient in recognizing their letters at kindergarten entry: Spring 1999
NOTE: Estimates reflect children assessed in English in all three rounds of data collection and who entered kindergarten for the first time in the fall of 1998 and were promoted to first grade in the fall of 1999. SOURCE: U.S. Department of Education, National Center for Education Statistics, Early Childhood Longitudinal Study, Kindergarten Class of 1998–99, Base Year Public-Use and First Grade Restricted-Use data files. Figure 6.—Percentage of children demonstrating specific reading knowledge and skills in the
spring of first grade by whether they were proficient in recognizing their letters at kindergarten entry: Spring 2000
NOTE: Estimates reflect children assessed in English in all three rounds of data collection and who entered kindergarten for the first time in the fall of 1998 and were promoted to first grade in the fall of 1999. SOURCE: U.S. Department of Education, National Center for Education Statistics, Early Childhood Longitudinal Study, Kindergarten Class of 1998–99, Base Year Public-Use and First Grade Restricted-Use data files.
86
67
20
6
47
26
10
20
40
60
80
100
Beginning sounds Ending sounds Sight words Words in context
Proficient in letters
Not proficient in letters
99 9892
60
9587
63
21
0
20
40
60
80
100
Beginning sounds Ending sounds Sight words Words in context
Proficient in letters
Not proficient in letters

20
Children who were read to at least three times a week as they entered kindergarten are more likely to have
mastered the letter-sound relationship at the beginning and ending of words before they leave
kindergarten than children who are not read to at least three times a week (figure 7). Further, children who
were read to at least three times a week as they entered kindergarten are more likely to understand words
when presented in context in both the spring of kindergarten and the spring of first grade than children
who are not read to at least three times a week (table 8). A similar pattern is found for children’s spring
kindergarten and first grade specific mathematics knowledge and skills (table 9).
Figure 7.—Percentage of children demonstrating specific reading knowledge and skills in the
spring of kindergarten by how often they were read to by a family member at kindergarten entry: Spring 1999
NOTE: Estimates reflect children assessed in English in all three rounds of data collection and who entered kindergarten for the first time in the fall of 1998 and were promoted to first grade in the fall of 1999. SOURCE: U.S. Department of Education, National Center for Education Statistics, Early Childhood Longitudinal Study, Kindergarten Class of 1998–99, Base Year Public-Use and First Grade Restricted-Use data files.
76
57
15
5
64
43
82
0
20
40
60
80
100
Beginning sounds Ending sounds Sight words Words in context
Read to at least 3 timesa weekRead to fewer than 3times a week

21
Children who could recognize their basic numbers and shapes and understood the mathematical concept
of relative size when they entered kindergarten are more likely to acquire more advanced specific reading
and mathematics skills later on. For example, children who recognized their basic numbers and shapes
and understood the mathematical concept of relative size as they entered kindergarten were more likely
than children who had not mastered these skills to understand ordinality/sequence by the spring of
kindergarten and the spring of first grade (figure 8, table 9). By the spring of first grade, children who
recognized their basic numbers and shapes and understood the mathematical concept of relative size as
they entered kindergarten are more than two times as likely to be proficient in addition and subtraction
and multiplication and division (figure 9, table 9). A similar relationship is found for spring kindergarten
and first grade reading skills (table 8).
Figure 8.—Percentage of children demonstrating specific mathematics knowledge and skills in the spring of kindergarten by whether they were proficient in recognizing their numbers and shapes at kindergarten entry: Spring 1999
NOTE: Estimates reflect children assessed in English in all three rounds of data collection and who entered kindergarten for the first time in the fall of 1998 and were promoted to first grade in the fall of 1999. SOURCE: U.S. Department of Education, National Center for Education Statistics, Early Childhood Longitudinal Study, Kindergarten Class of 1998–99, Base Year Public-Use and First Grade Restricted-Use data files.
61
20
2
10
10
20
40
60
80
100
Ordinality/sequence Add/subtract Multiply/divide
Proficient in numbersand shapes
Not proficient innumbers and shapes

22
Figure 9.—Percentage of children demonstrating specific mathematics knowledge and skills in the spring of first grade by whether they were proficient in recognizing their numbers and shapes at kindergarten entry: Spring 2000
NOTE: Estimates reflect children assessed in English in all three rounds of data collection and who entered kindergarten for the first time in the fall of 1998 and were promoted to first grade in the fall of 1999. SOURCE: U.S. Department of Education, National Center for Education Statistics, Early Childhood Longitudinal Study, Kindergarten Class of 1998–99, Base Year Public-Use and First Grade Restricted-Use data files.
Approaches to Learning
As children enter kindergarten for the first time, about three in five (58 percent) often to very often
exhibit behaviors associated with a positive approach to learning (e.g., show eagerness to learn, persist at
tasks), according to their teachers (table 5). A positive approach to learning is part of a successful
learning experience. Children who frequently exhibit a positive approach to learning as they begin
kindergarten do better in spring kindergarten and first grade reading and mathematics than children who
exhibit these behaviors less frequently (i.e., the former have higher mean t-scores). Moreover, children
who frequently exhibit a positive approach to learning are more than twice as likely as other children to
score in the top 25 percent in reading and mathematics at the spring of kindergarten and first grade (tables
7 and 8).
In terms of children’s specific reading skills, children who frequently demonstrate behaviors associated
with a positive approach to learning as they enter kindergarten are more likely than children who less
frequently demonstrate such a positive approach to learning to understand the letter-sound relationship at
the beginning and ending of words as they are completing kindergarten, and are more likely to master
97
78
28
69
30
3
0
20
40
60
80
100
Ordinality/sequence Add/subtract Multiply/divide
Proficient in numbers andshapes
Not proficient in numbersand shapes

23
sight words and words in context as they are completing first grade (table 8). A similar pattern occurs in
mathematics (table 9). Children who frequently demonstrate a positive approach to learning are more
likely to have mastered the set of skills associated with ordinality/sequence by the spring of kindergarten
(70 versus 43 percent, respectively). And by the spring of first grade, these children are more likely than
other children to be proficient in addition and subtraction and multiplication and division (84 versus 64
percent, 34 versus 16 percent; respectively) (table 9).
General Health
Young children learn, in part, through active engagement. Therefore, it is important for them to be
generally healthy. At kindergarten entry, 85 percent of children are rated as being in very good to
excellent health by their parents. Also, these children demonstrate higher reading and mathematics
knowledge and skills in the spring of kindergarten and the spring of first grade than children who are
rated as being in less than very good health (i.e., they have significantly higher t-scores). Children
reported to be in very good to excellent health as they enter kindergarten ("healthier children") are more
likely to score in the top 25 percent in reading and mathematics in the spring of kindergarten and the
spring of first grade than children in less than very good health.
Further, healthier children are more likely than children in less than very good health to understand the
letter-sound relationship at the beginning and ending of words by the spring of kindergarten. Healthier
children are also more likely than children in less than very good health to recognize words by sight and
understand words in context by the spring of first grade (figure 10, table 8).
Children’s general health also relates to their mathematics achievement. Children reported to be in very
good to excellent general health as they enter kindergarten are more likely to demonstrate greater
proficiency in ordinality/sequence and addition/subtraction by the spring of kindergarten than children in
less than very good health. Also, by the spring of first grade, healthier children are more likely to be
proficient in addition and subtraction and multiplication and division than children who are in less than
very good health when they started kindergarten.

24
Figure 10.—Percentage of children demonstrating specific reading knowledge and skills in the spring of first grade by their general health status at kindergarten entry: Spring 2000
NOTE: Estimates reflect children assessed in English in all three rounds of data collection and who entered kindergarten for the first time in the fall of 1998 and were promoted to first grade in the fall of 1999. Children's health status is based on parental report at the time children are entering kindergarten. SOURCE: U.S. Department of Education, National Center for Education Statistics, Early Childhood Longitudinal Study, Kindergarten Class of 1998–99, Base Year Public-Use and First Grade Restricted-Use data files. Effects of Beginning Resources when Controlling for Other Factors
When explored in a simple descriptive manner, significant relationships exist between the resources
children possess at kindergarten entry (i.e., early literacy, approaches to learning, and general health) and
their spring kindergarten and spring first grade reading and mathematics performance. However, it is also
important to recognize the potential influence of factors such as poverty and race/ethnicity on these
relationships. The relationships between the resources children possess at kindergarten entry and their
spring kindergarten and spring mathematics performance are still significant after controlling for the
influence of children's poverty status and their race/ethnicity (see appendix for regression tables).
Summary As children enter kindergarten for the first time, they bring with them different sets of knowledge and
skills. Some children can already recognize the letters of the alphabet and others know their numbers and
shapes. The knowledge and skills they bring with them, together with the development of their reading
98 95
84
49
9691
75
39
0
20
40
60
80
100
Beginning sounds Ending sounds Sight words Words in context
Very good to excellent health
Less than very good health

25
and mathematics knowledge and skills across the early years of school (i.e., kindergarten and first grade),
potentially lays the foundation for their later learning and school experiences.
Some of the differences in children’s reading and mathematics knowledge and skills by child, family, and
school characteristics that are present as they enter kindergarten persist into the spring of kindergarten and
the spring of first grade. For example, poor children consistently score below the national average in both
reading and mathematics across the kindergarten year and into the spring of first grade. These results also
suggest differences that are beginning to emerge by children’s sex. By the spring of first grade, females
are more likely to be reading—that is, understanding words in context; whereas, males are more likely to
be proficient at advanced mathematics—that is, multiplication and division. However, some differences
do seem to wane. For example, in both reading and mathematics, Hispanic children’s scores tend to move
upward toward the national mean over these two school years. The longitudinal nature of the ECLS-K
will enable researchers to track these differences in terms of children’s third and fifth grade reading and
mathematics performance.
Children who bring certain knowledge and skills with them to kindergarten are likely to be at an
advantage in classroom learning compared to their peers who do not possess these resources. The
descriptive analyses in this report show that children who have specific cognitive knowledge and skills,
are read to frequently, possess positive approaches to learning, and enjoy very good or excellent general
health perform better in reading and mathematics than those who do not have these resources. However, it
is also important to appreciate that the relationship of these resources to children's reading and
mathematics achievement across kindergarten and first grade were explored without controlling for other
possible intervening factors, such as the poverty status of the family. Yet, even when the basic
relationship of these resources to children’s reading and mathematics achievement across kindergarten
and first grade were explored while controlling for the family's poverty status and children's
race/ethnicity, significant relationships still existed.
The descriptive analyses included in this report are intended to address certain hypotheses in the research
concerning early childhood development (e.g., children who are read to frequently do better). At the same
time, the analyses are intended to point to the need for more complex models. Such models would explore
the direct and indirect effects of children’s beginning kindergarten knowledge and skills to their later
achievement. Specifically, it is important for researchers and policymakers to understand what works for
which children. Therefore, future analyses will consider the experiences of poor minority children versus
nonpoor minority children, or poor children who are read to frequently versus nonpoor children who are
read to frequently. Finally, a deeper understanding of why some children demonstrate and possess early

26
literacy skills, approaches to learning, and sound general health as they enter kindergarten and others do
not—and the ways in which schools and teachers build upon these resources—is warranted.
This third report from the ECLS-K, in conjunction with America’s Kindergartners and The Kindergarten
Year, provides descriptive information on young children’s achievement across kindergarten and first
grade. The ECLS-K will continue to follow these children into third and fifth grades. The study will
provide researchers not only with an understanding of how children’s early literacy, approaches to
learning, and general health status as they enter kindergarten shape their later achievement but also how
these resources need to be maintained and further developed for continued scholastic success. Moreover,
future reports based on the ECLS-K will explore the potential influences of specific classroom and school
factors (e.g., class size, full-day and part-day kindergarten programs, teacher characteristics, school
environment) and additional home influences (e.g., parenting style, parent involvement) on children's
scholastic success. The valuable information collected through this study will help us better understand
the early education and elementary school experience of our nation’s children.

27
Methodology and Technical Notes
Survey Methodology
The Early Childhood Longitudinal Study, Kindergarten Class of 1998–99 (ECLS-K), is being conducted
by Westat for the U.S. Department of Education, National Center for Education Statistics (NCES). It is
designed to provide detailed information on children’s early school experiences. The study began in the
fall of the 1998–99 school year. The children participating in the ECLS-K are being followed
longitudinally through the fifth grade. Estimates in this report are based on data collected from and about
children who entered kindergarten for the first time in the fall of 1998, who were promoted on time to
first grade in the fall of 1999, and who were assessed in English in the fall and spring of kindergarten and
the spring of first grade.
Sample Design
A nationally representative sample of 22,782 children enrolled in 1,277 kindergarten programs during the
1998–99 school year was selected to participate in the ECLS-K. The children attended both public and
private kindergartens that offered full-day and part-day programs. The sample includes children from
different racial/ethnic and socioeconomic backgrounds, and includes oversamples of Asian children,
private kindergartens, and private kindergartners.
Sampling for the ECLS-K involved a dual-frame, multistage sampling design. The first stage of sampling
involved the selection of 100 primary sampling units (PSU) from a national sample of PSUs. The PSUs
were counties and county groups. Public and private schools were then selected within the PSUs, and
children were sampled from the selected schools. Public schools were selected from the Common Core
of Data, a public school frame, and private schools were selected from a private school frame developed
from the Private School Survey.18 Approximately 23 kindergartners were selected on average in each of
the sampled schools. In the spring of first grade, the sample was freshened to reflect children who did not
attend kindergarten during the 1998–99 school year. While all students still enrolled in their base-year
schools were recontacted, only a 50 percent subsample of base-year students who had transferred from
their kindergarten school was followed. For information on freshening procedures and subsampling of
transfer children (i.e., movers), refer to the ECLS-K First Grade Public-Use Data Files User’s Manual.
Fall kindergarten data were obtained from September to December 1998. Spring kindergarten data were
obtained from March to June 1999. Spring first grade data were obtained from March to July 2000.
18 During the spring of 1998, Westat identified new schools that were not found on either frame. A sample of these schools was included in the ECLS-K school sample.

28
Response Rates
A total of 944 of the 1,277 originally sampled schools participated during the base year of the study. This
translates into a weighted response rate of 74 percent for the base year of the study. The school response
rate during the spring of the base year (74.2 percent) was higher than during the fall (69.4 percent), due to
some of the schools that originally declined to participate deciding to participate in the spring. Nearly all
(99.4 percent) of the schools that participated in the fall of the base year also participated in the spring.
The child base-year completion rate was 92 percent (i.e., 92 percent of the children were assessed at least
once during kindergarten). The parent base-year completion rate was 89 percent (i.e., a parent interview
was completed at least once during kindergarten). Thus, the overall base-year response rate for children
was 68.1 percent (74 percent x 92 percent) and the base-year response rate for the parent interview was
65.9 percent (74 percent x 89 percent). About 95 percent of the children and 94 percent of the parents
who participated in the fall of kindergarten also participated in the spring. About 88 percent of the
children and 85 percent of the parents who were eligible for the spring first grade collection participated.
For information on the nonresponse bias analysis, refer to the ECLS-K Base Year Public-Use Data Files
User’s Manual, the ECLS-K First Grade Public-Use Data Files User’s Manual and/or the ECLS-K
Methodology Report. Findings from these analyses suggest that there is not a bias due to nonresponse.
Data Reliability
Estimates produced using data from the ECLS–K are subject to two types of error, sampling and
nonsampling errors. Nonsampling errors are errors made in the collection and processing of data.
Sampling errors occur because the data are collected from a sample rather than a census of the population.
A detailed discussion of these types of errors can be found in America’s Kindergartners (West et al.
2000).
Standard Errors and Weights
In order to produce national estimates from the ECLS-K data collected during the kindergarten and first
grade year, the sample data were weighted. Weighting the data adjusts for unequal selection probabilities
at the school and child levels and adjusts for school, child, teacher, and parent nonresponse. The first
stage of the weighting process assigns weights to the sampled primary sampling units (PSUs) equal to the

29
inverse of the PSU probability of selection.19 The second stage of the weighting process assigns weights
to the schools sampled within PSUs. The base weight for each sampled school is the PSU weight
multiplied by the inverse of the probability of selecting the school. The base weights for eligible schools
are adjusted for nonresponse. These adjustments are made separately for public and private schools.
The base weight for each child in the sample is the school nonresponse adjusted weight for the school the
child attends, multiplied by a post-stratified within-school student weight (total number of students in the
school, divided by the number of students sampled in the school). The parent panel weight (P124W0),
which is the weight used to produce the estimates found in this report, is the base child weight adjusted
for nonresponse to the parent interview at each round of data collection. Only those cases with completed
parent interviews in both fall and spring of kindergarten and spring of first grade are included in these
weighting procedures. Again, these adjustments are made separately for public and private schools. This
weight sums to the population of all children who attended kindergarten in the fall of 1998.
In addition to properly weighting the responses, special procedures for estimating the statistical
significance of the estimates were employed, because the data were collected using a complex sample
design. Complex sample designs, like that used in the ECLS-K, result in data that violate the assumptions
that are normally required to assess the statistical significance of the results. Frequently, the standard
errors of the estimates are larger than would be expected, if the sample was a simple random sample and
the observations were independent and identically distributed random variables.
Replication methods of variance estimation were used to reflect the actual sample design used in the
ECLS-K. A form of the jackknife replication method (JK2) using 90 replicates was used to compute
approximately unbiased estimates of the standard errors of the estimates in the report, using WesVarPC.
The jackknife methods were used to estimate the precision of the estimates of the reported national
percentages and means.
Statistical Procedures
Comparisons made in the text were tested for statistical significance to ensure that the differences are
larger than might be expected due to sampling variation. When comparing estimates at one point in time
(e.g., fall kindergarten) were made between categorical groups (i.e., gender, race/ethnicity, school type
19 The approach used to develop weights for the ECLS-K is described in the ECLS-K User’s Manual and the ECLS-K Methodology Report.

30
and program type), t statistics were calculated. The formula used to compute the t statistic was:
t = Est1 – Est2 / SQRT[(se1)2 + (se2)2]
Where Est1 and Est2 are the estimates being compared and se1 and se2 are their corresponding standard
errors.
When comparing an estimate for a particular subgroup of children (e.g., poor children) to the mean for all
children, the following formula was used:
(Estsub - Esttot)/ SQRT (se2tot + se2
sub - 2*p*se2sub)
Where Est is the estimate, se is the standard error, sub and tot are subscripts denoting the subgroup and
total, and p is the proportion of the sample that is in the subgroup being compared.
To guard against errors of inference based on multiple comparisons, the Bonferroni procedure was used to
correct significance tests for multiple contrasts. The Bonferroni procedure divides the alpha level for a
single t test (e.g., .05) by the number of critical pairwise comparisons, in order to provide a new alpha that
adjusts for the number of comparisons being made.
Constructs and Variables Used in Analysis
Children’s Cognitive Knowledge and Skills
Reading and Mathematics
The ECLS-K direct child cognitive assessment was administered using a computer-assisted personal
interview (CAPI), administered one-on-one with each child. The assessment included two cognitive
domains (reading and mathematics). The ECLS-K battery used a two-stage assessment approach, in
which the first stage in each domain contained a routing test that determined a child’s approximate skills.
According to the child’s performance on the routing test, the child was administered the appropriate skill
level assessment for that domain (the second stage). The reading and mathematics assessments had three
skill levels. In each round, children were administered the routing stage and the appropriate skill level
stage in the fall of kindergarten, the spring of kindergarten, and the spring of first grade.
To be sensitive to the needs and capabilities of the children in the sample, an English language
proficiency screener, called the Oral Language Development Scale (OLDS), was administered if school
records indicated that the child’s home language was not English. The child had to demonstrate a certain

31
level of English proficiency to be administered the cognitive assessment in English. The cognitive
knowledge and skills estimates in this report are based on those first-time kindergartners who were
assessed in English in both the fall and the spring of kindergarten, and the spring of first grade. For the
analytic sample utilized in this report, in terms of English assessment status by race/ethnicity,
approximately 68 percent of Hispanic children and 78 percent of Asian children were assessed in English
in fall and spring of kindergarten and spring of first grade.
Scale scores. Item Response Theory (IRT) was employed to calculate scores that could be compared
regardless of which second stage form a student completed. The items in the routing test, plus a core set
of items shared among the different second stage forms, made it possible to establish a common scale.
IRT uses the pattern of right, wrong, and omitted responses to the items actually administered in a test,
and the difficulty, discriminating ability, and “guess-ability” of each item, to place each student on a
continuous ability scale. It is then possible to estimate the score the student would have achieved if all of
the items in all of the test forms had been administered. The reliability of the estimates of reading and
mathematics, fall and spring kindergarten and spring first grade scores, are as follows (IRT-based theta):
reading = .9, mathematics = .9. The standardized scores used in this report are transformations of the IRT
theta (ability) estimates, rescaled to a mean of 50 and standard deviation of 10 using cross-sectional
sample weights for fall and spring kindergarten and spring first grade.
Proficiency level probability scores. Proficiency scores provide a means of distinguishing status or gain
in specific skills within a content area from the overall achievement measured by the IRT scale scores.
Clusters of four test questions having similar content and difficulty were included at several points along
the score scale of the reading and mathematics tests. A student was assumed to have mastered a particular
level of proficiency, if at least three of the four items in the cluster were answered correctly, and to have
failed at this level, if two or more items were wrong. Clusters of items provide a more reliable test of
proficiency than do single items, because of the possibility of guessing. It is very unlikely that a student
who has not mastered a particular skill would be able to guess enough answers correctly to pass a four-
item cluster. The nature of the two-stage test is that not all children receive all items. To calculate
proficiency estimates for all children, an IRT model was employed. For the purpose of IRT calibration,
the item clusters were treated as single items. The hierarchical nature of the skill sets justified the use of
the IRT model in this way. Gains in probability of mastery at each proficiency level allow researchers to
study not only the amount of gain in total scale score points but also where along the scale different
children are making their largest gains in achievement during a particular time interval.
In reading, the proficiency levels are named as follows: (1) letter recognition, (2) beginning sounds, (3)
ending sounds, (4) sight words, and (5) words in context. Letter recognition is as it sounds—the ability of

32
children to recognize their letters. Beginning sounds and ending sounds refer to children’s ability to
understand the letter-sound relationship at the beginning and at the ending of words. Sight words refers to
children’s ability to recognize whole words by sight and read them aloud. Words in context refers to
children’s ability to read simple short passages of text with a missing word, and insert the correct missing
word.
In mathematics, the proficiency levels are named as follows (their names reflect the most complex
mathematical construct contained in the proficiency): (1) number and shape, (2) relative size, (3)
ordinality and sequence, (4) add/subtract, and (5) multiply/divide. Number and shape refers to children’s
ability to recognize single-digit numbers and basic shapes. Relative size refers to children’s ability to
count beyond 10, recognize the sequence in basic patterns, and compare the relative size of objects.
Ordinality and sequence means that children can recognize two-digit numbers, identify the next number
in a sequence, and identify the ordinal position of an object. Addition and subtraction means children can
perform simple addition and subtraction problems. Multiplication and division refers to children’s ability
to perform simple multiplication and division operations. The addition, subtraction, multiplication, and
division items are presented in the form of word problems with picture support and in numerical
statements.
Children’s Approaches to Learning
For each ECLS-K sample child they taught the teachers completed a child-specific questionnaire that
collected information on the child’s social knowledge and skills. Teachers reported on the frequency with
which children demonstrated particular behaviors (e.g., approaches to learning). Teachers rated the
frequency of children’s behaviors as never, sometimes, often, or very often. To present the behaviors in
terms of their basic frequency (e.g., frequent versus infrequent), the categories were collapsed into
never/sometimes and often/very often. Teachers completed these ratings in the fall and spring of
kindergarten and the spring of first grade. This report uses information from the fall of kindergarten (split
half reliability coefficient = .9).
Family and Child Characteristics
Reading to Children, Children's General Health, and Family Demographic Characteristics
Parents/guardians were asked to provide key information about their children on subjects such as family
demographics (e.g., age, family members, relation to child, race/ethnicity), family structure (household
members and composition), parent involvement, home educational activities (e.g., reading to the child),
child health, parental education and employment status, and child’s social skills and behaviors.
Specifically, parents were asked how often in a given week a family member reads to the child.

33
Responses ranged from not at all, once or twice a week, 3 to 6 times a week and every day. Parents also
provided information on the general health of their child. Parents rated their children's general health as
poor, fair, good, very good and excellent. Most of the data were collected through a computer-assisted
telephone interview (CATI), although some of the interviews were collected through a computer-assisted
personal interview (CAPI), when respondents did not have a telephone or were reluctant to be interviewed
by telephone. Parents/guardians were interviewed in the fall and spring of kindergarten and the spring of
first grade.
Derived Variables
A number of variables used in this report were derived by combining information from one or more
questions in the ECLS-K parent questionnaire or from other study sources. The derivation of key
variables is described in this section.
Poverty status during the kindergarten year. This variable is a function of household income and family
size. Income was compared to Census poverty thresholds, which vary by household size. Households
whose income fell below the appropriate threshold were classified as poor. The thresholds were based on
1998 Census information, where a household of four with a total household income below $16,655 was
considered to be in poverty. Prior to calculating poverty status, household income was imputed.
Children’s race/ethnicity. The race/ethnicity composite was constructed from two parent-reported
variables: ethnicity and race. New Office of Management and Budget guidelines were followed under
which a respondent could select more than one race. Thus, each respondent had to identify whether the
child was Hispanic, and then select one or more races. The following are the five composite
race/ethnicity categories presented in this report: White non-Hispanic, Black non-Hispanic, Hispanic,
Asian and other (which includes Pacific Islanders, American Indians, Alaska Natives, and multiracial
children). When race/ethnicity differences are presented in this report, White refers to White, non-
Hispanic and Black refers to Black, non-Hispanic.
School type during the kindergarten year. The type of school in which children attended kindergarten
was collapsed into two broad categories: public and private. Private schools include those with both
religious affiliations and nonreligious affiliations. Information from the school administrator
questionnaire, along with school sample frame data, was used to create this variable. If there was no
school administrator questionnaire, then school sample frame data were utilized.
34
First-time kindergartners. In the fall kindergarten parent interview, parents/guardians provided
information on whether children were in kindergarten for the first time during the 1998–99 school year.
Grade level. Children's grade level was determined through information from the Field Management
System (FMS). The FMS reflects information recorded by the field staff prior to the child assessment.

35
References
Beck, I. and Juel, C. (1999). The role of decoding in learning to read. In Reading research anthology: The
why? of reading instruction, consortium on reading excellence (CORE). California: Arena Press.
Burns, S., Griffin, P., and Snow, C. (Eds.). (1988). Starting out right: A guide to promoting children’s
reading success. Committee on the Prevention of Reading Difficulties in Young Children, National
Research Council. Washington, DC: National Academy Press.
Cohen, J. (1988). Statistical power analysis for the behavioral sciences. Hillsdale, NJ: Lawrence Erlbaum
Associates.
Denton, K., Reaney, L., and West, J. (2001). Home educational activities, literacy resources and
kindergartners’ reading knowledge and skills. Presentation at the biennial meeting of the Society for
Research in Child Development, Minneapolis, MN.
Federal Interagency Forum on Child and Family Statistics. (2001). America's children: Key national
indicators of well-being: 2001. Federal Interagency Forum on Child and Family Statistics, Washington,
DC: U.S. Government Printing Office.
Lyon, R. (1999). Overview of reading and literacy initiatives. In Reading research anthology: The why?
of reading instruction, consortium on reading excellence (CORE). California: Arena Press.
National Center for Education Statistics. (2001). Early Childhood Longitudinal Study, Kindergarten
Class of 1998–99: Base year public-use data files user's manual. NCES 2001-029. Washington, DC: U.S.
Government Printing Office.
National Council of Teachers of Mathematics. (2000). Principals and standards for school mathematics.
Reston, VA. Author.
National Institutes of Health. (2000). Teaching children to read: An evidence-based assessment of the
scientific research literature on reading and its implications for reading instruction. Report of the
National Reading Panel, NIH 00-4769. Washington, DC.
National Research Council. (1989). Everybody counts: A report to the nation on the future of mathematics
education. Washington, DC: National Academy Press.

36
Paris, S. G. and Cunningham, A. E. (1996). Children becoming students. In Handbook of Educational
Psychology, Berliner, D. and Calfee, R. (Eds.). New York: MacMillan Publishing Company.
Reaney, L.,West, J. and Denton, K. (2000). Beginning school: U.S. kindergartners developmental
status—Variation by entry age and gender. Presentation at the annual meeting of the American
Educational Research Association, New Orleans, LA.
Ries, P. and Brown, S. (1991). Disability and health: Characteristics of persons by limitation of activity
and assessed health status, United States 1984-1988. National Center for Health Statistics, Advanced
Data from Vital and Health Statistics, 197.
Schunk, D., and Zimmerman, B., (1996). Modeling and self-efficacy influences on children’s
development of self-regulation. In Juvonen, J. and Wentzel, K. (Eds.). Social motivation: Understanding
children’s school adjustment. Cambridge, England: Cambridge University Press.
Shonkoff, J. P. (1992). The conceptualization and measurement of child and family health. Paper
prepared for the National Center for Education Statistics.
Snow, K., Burns, M. S., and Griffin, P., (Eds.). (1998). Preventing reading difficulties in young children.
Washington, DC: National Academy Press.
West, J., Denton, K., and Reaney, L. (2001). The kindergarten year. NCES 2001-023. Washington, DC:
National Center for Education Statistics.
West, J., Denton, K., and Germino Hausken, E. (2000). America’s kindergartners. NCES 2000-070.
Washington, DC: National Center for Education Statistics.

37
Tables
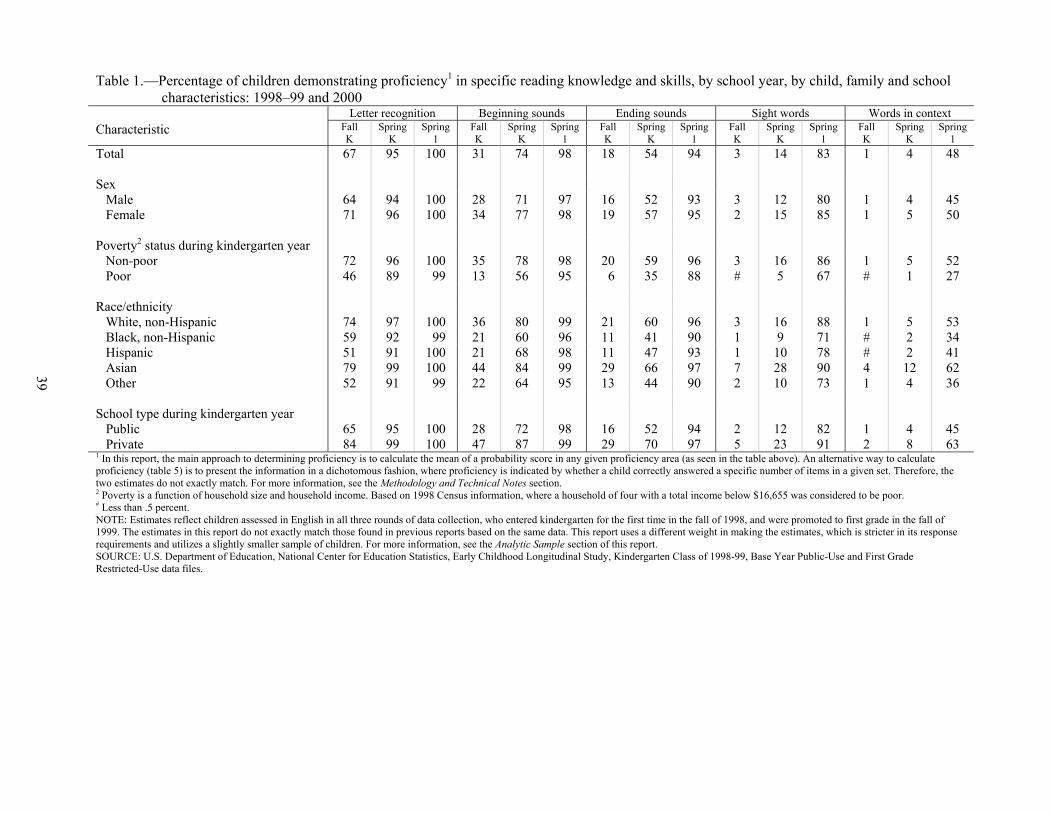
Table 1.—Percentage of children demonstrating proficiency1 in specific reading knowledge and skills, by school year, by child, family and school characteristics: 1998–99 and 2000
Letter recognition Beginning sounds Ending sounds Sight words Words in context Characteristic Fall
K Spring
K Spring
1 Fall K
Spring K
Spring 1
Fall K
Spring K
Spring 1
Fall K
Spring K
Spring 1
Fall K
Spring K
Spring 1
Total 67 95 100 31 74 98 18 54 94 3 14 83 1 4 48 Sex Male 64 94 100 28 71 97 16 52 93 3 12 80 1 4 45 Female 71 96 100 34 77 98 19 57 95 2 15 85 1 5 50 Poverty2 status during kindergarten year Non-poor 72 96 100 35 78 98 20 59 96 3 16 86 1 5 52 Poor 46 89 99 13 56 95 6 35 88 # 5 67 # 1 27 Race/ethnicity White, non-Hispanic 74 97 100 36 80 99 21 60 96 3 16 88 1 5 53 Black, non-Hispanic 59 92 99 21 60 96 11 41 90 1 9 71 # 2 34 Hispanic 51 91 100 21 68 98 11 47 93 1 10 78 # 2 41 Asian 79 99 100 44 84 99 29 66 97 7 28 90 4 12 62 Other 52 91 99 22 64 95 13 44 90 2 10 73 1 4 36 School type during kindergarten year Public 65 95 100 28 72 98 16 52 94 2 12 82 1 4 45 Private 84 99 100 47 87 99 29 70 97 5 23 91 2 8 63 1 In this report, the main approach to determining proficiency is to calculate the mean of a probability score in any given proficiency area (as seen in the table above). An alternative way to calculate proficiency (table 5) is to present the information in a dichotomous fashion, where proficiency is indicated by whether a child correctly answered a specific number of items in a given set. Therefore, the two estimates do not exactly match. For more information, see the Methodology and Technical Notes section. 2 Poverty is a function of household size and household income. Based on 1998 Census information, where a household of four with a total income below $16,655 was considered to be poor. # Less than .5 percent. NOTE: Estimates reflect children assessed in English in all three rounds of data collection, who entered kindergarten for the first time in the fall of 1998, and were promoted to first grade in the fall of 1999. The estimates in this report do not exactly match those found in previous reports based on the same data. This report uses a different weight in making the estimates, which is stricter in its response requirements and utilizes a slightly smaller sample of children. For more information, see the Analytic Sample section of this report. SOURCE: U.S. Department of Education, National Center for Education Statistics, Early Childhood Longitudinal Study, Kindergarten Class of 1998-99, Base Year Public-Use and First Grade Restricted-Use data files.
39

Table 2.—Percentage of children demonstrating proficiency1 in specific mathematics knowledge and skills, by school year, by child, family and school characteristics: 1998–99 and 2000
Numbers and shapes Relative size Ordinality/sequence Add/subtract Multiply/divide Characteristic Fall
K Spring
K Spring
1 Fall K
Spring K
Spring 1
Fall K
Spring K
Spring 1
Fall K
Spring K
Spring 1
Fall K
Spring K
Spring 1
Total 95 99 100 59 88 99 23 59 96 4 19 76 # 2 27 Sex Male 94 99 100 59 88 99 23 59 96 5 20 76 1 3 30 Female 95 99 100 59 89 99 21 58 96 3 18 75 # 2 24 Poverty2 status during kindergarten year Non-poor 96 100 100 64 91 99 25 63 97 5 21 79 # 3 30 Poor 88 98 100 38 77 98 8 37 91 1 8 60 # 1 11 Race/ethnicity White, non-Hispanic 96 100 100 67 92 99 28 67 97 5 23 82 # 3 34 Black, non-Hispanic 91 99 100 43 78 98 9 38 91 1 8 59 # # 10 Hispanic 91 99 100 45 84 99 13 48 95 2 12 72 # 1 19 Asian 97 100 100 69 91 99 33 67 97 9 28 79 1 6 34 Other 89 99 100 49 83 98 15 49 93 2 12 66 # 1 19 School type during kindergarten year Public 94 99 100 56 87 99 20 56 95 3 17 74 # 2 25 Private 98 100 100 74 95 100 35 74 99 8 29 86 1 5 37 1 In this report, the main approach to determining proficiency is to calculate the mean of a probability score in any given proficiency area (as seen in the table above). An alternative way to calculate proficiency (as seen in table 5) is to present the information in a dichotomous fashion, where proficiency is indicated by whether a child correctly answered a specific number of items in a given set. Therefore, the two estimates do not exactly match. For more information, see the Methodology and Technical Notes section. 2 Poverty is a function of household size and household income. Based on 1998 Census information, where a household of 4 people with a total income below $16,655.00 was considered to be poor. # Less than .5 percent. NOTE: Estimates reflect children assessed in English in all three rounds of data collection, who entered kindergarten for the first time in the fall of 1998 and were promoted to first grade in the fall of 1999. The estimates in this report do not exactly match those found in previous reports based on the same data. This report uses a different weight in making the estimates, which is stricter in its response requirements and utilizes a slightly smaller sample of children. For more information, see the Analytic Sample section of this report. SOURCE: U.S. Department of Education, National Center for Education Statistics, Early Childhood Longitudinal Study, Kindergarten Class of 1998-99, Base Year Public-Use and First Grade Restricted-Use data files.
40
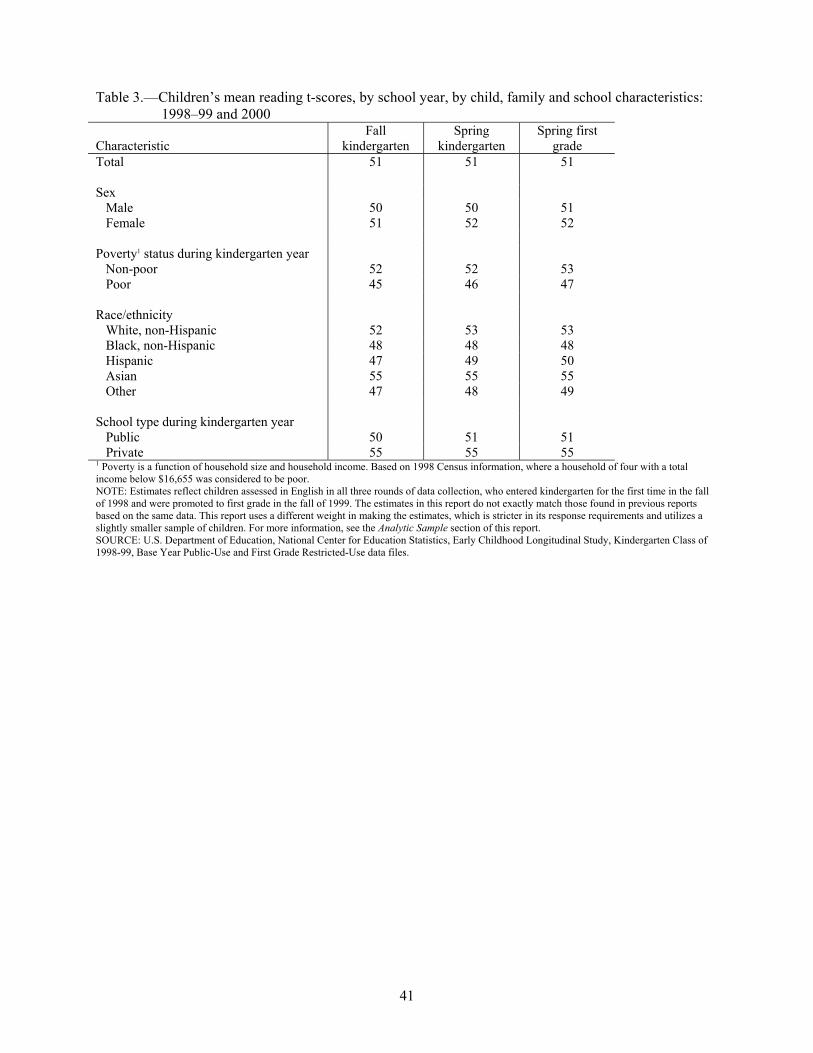
41
Table 3.—Children’s mean reading t-scores, by school year, by child, family and school characteristics:
1998–99 and 2000 Characteristic
Fall kindergarten
Spring kindergarten
Spring first grade
Total 51 51 51 Sex Male 50 50 51 Female 51 52 52 Poverty1 status during kindergarten year Non-poor 52 52 53 Poor 45 46 47 Race/ethnicity White, non-Hispanic 52 53 53 Black, non-Hispanic 48 48 48 Hispanic 47 49 50 Asian 55 55 55 Other 47 48 49 School type during kindergarten year Public 50 51 51 Private 55 55 55 1 Poverty is a function of household size and household income. Based on 1998 Census information, where a household of four with a total income below $16,655 was considered to be poor. NOTE: Estimates reflect children assessed in English in all three rounds of data collection, who entered kindergarten for the first time in the fall of 1998 and were promoted to first grade in the fall of 1999. The estimates in this report do not exactly match those found in previous reports based on the same data. This report uses a different weight in making the estimates, which is stricter in its response requirements and utilizes a slightly smaller sample of children. For more information, see the Analytic Sample section of this report. SOURCE: U.S. Department of Education, National Center for Education Statistics, Early Childhood Longitudinal Study, Kindergarten Class of 1998-99, Base Year Public-Use and First Grade Restricted-Use data files.
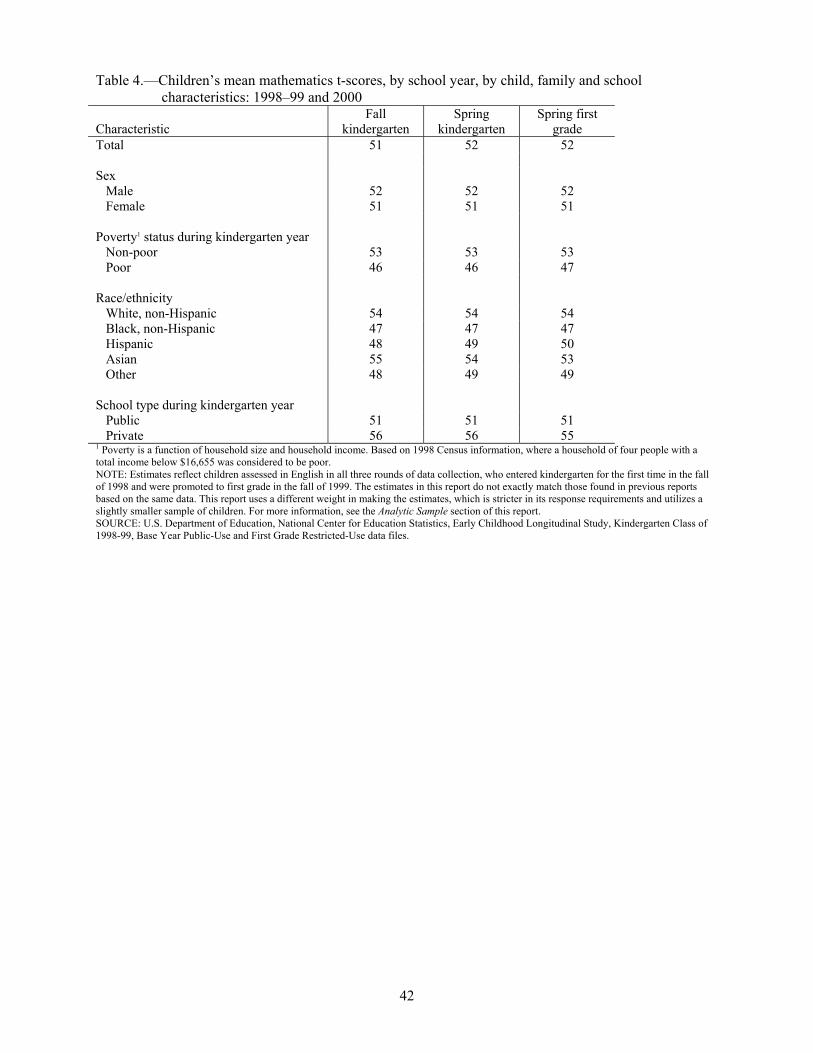
42
Table 4.—Children’s mean mathematics t-scores, by school year, by child, family and school characteristics: 1998–99 and 2000
Characteristic
Fall kindergarten
Spring kindergarten
Spring first grade
Total 51 52 52 Sex Male 52 52 52 Female 51 51 51 Poverty1 status during kindergarten year Non-poor 53 53 53 Poor 46 46 47 Race/ethnicity White, non-Hispanic 54 54 54 Black, non-Hispanic 47 47 47 Hispanic 48 49 50 Asian 55 54 53 Other 48 49 49 School type during kindergarten year Public 51 51 51 Private 56 56 55 1 Poverty is a function of household size and household income. Based on 1998 Census information, where a household of four people with a total income below $16,655 was considered to be poor. NOTE: Estimates reflect children assessed in English in all three rounds of data collection, who entered kindergarten for the first time in the fall of 1998 and were promoted to first grade in the fall of 1999. The estimates in this report do not exactly match those found in previous reports based on the same data. This report uses a different weight in making the estimates, which is stricter in its response requirements and utilizes a slightly smaller sample of children. For more information, see the Analytic Sample section of this report. SOURCE: U.S. Department of Education, National Center for Education Statistics, Early Childhood Longitudinal Study, Kindergarten Class of 1998-99, Base Year Public-Use and First Grade Restricted-Use data files.

43
Table 5.—Percentage distribution of children by the resources they possess as they enter kindergarten: 1998
Resource Has resource Does not have resource Proficient* in recognizing letters at kindergarten
entry 69 31
Read to at least three times a week at kindergarten
entry 82 18
Proficient* in recognizing numbers and shapes at
kindergarten entry 95 5
Proficient* in understanding relative size at
kindergarten entry 63 37
Demonstrates positive approaches to learning
often to very often at kindergarten entry 58 42
In very good or excellent general health at
kindergarten entry 85 15
* In this report, the main approach to determining proficiency is to calculate the mean of a probability score in any given proficiency area (see tables 1 and 2). An alternative way to calculate proficiency (see table 5) is to present the information in a dichotomous fashion, where proficiency is indicated by whether a child correctly answered a specific number of items in a given set (see table above). Therefore, the two estimates do not exactly match. For more information, see the Methodology and Technical Notes section. NOTE: Estimates reflect children assessed in English in all three rounds of data collection, who entered kindergarten for the first time in the fall of 1998 and were promoted to first grade in the fall of 1999. SOURCE: U.S. Department of Education, National Center for Education Statistics, Early Childhood Longitudinal Study, Kindergarten Class of 1998-99, Base Year Public-Use and First Grade Restricted-Use data files.

Table 6.—Children’s mean reading t-scores and t-score quartile distributions, by school year, by the resources children possess at kindergarten entry:
1998–99 and 2000 Spring Kindergarten Spring First Grade
Percent distribution of t-score quartiles Percent distribution of t-score quartiles Resource
Mean t-score 0–25
percent 26–50 percent
51–75 percent
76–100 percent
Mean t-score 0–25
percent 26–50 percent
51–75 percent
76–100 percent
Proficient* in recognizing letters at kindergarten entry
Yes 55 11 23 30 35 55 14 23 29 34 No 44 55 28 14 2 46 50 30 15 5 Read to at least three times a week at kindergarten entry
Yes 52 23 24 26 27 52 23 24 26 27 No 48 36 28 22 14 49 35 28 20 16 Proficient* in recognizing numbers and shapes at kindergarten entry
Yes 52 22 25 26 26 52 22 25 26 26 No 38 78 18 3 1 39 75 16 7 2 Proficient* in understanding relative size at kindergarten entry
Yes 55 11 21 31 37 55 12 22 29 37 No 45 49 31 15 5 46 47 29 18 6 Demonstrates positive approaches to learning often to very often at kindergarten entry
Yes 54 16 23 28 34 54 16 24 28 33 No 48 38 29 20 13 49 38 27 21 14 In very good or excellent general health at kindergarten entry
Yes 52 24 24 26 26 52 24 25 26 26 No 49 33 28 20 19 49 33 26 22 19 * In this report, the main approach to determining proficiency is to calculate the mean of a probability score in any given proficiency area (see tables 1 and 2). An alternative way to calculate proficiency (see table 5) is to present the information in a dichotomous fashion, where proficiency is indicated by whether a child correctly answered a specific number of items in a given set (see table above). Therefore, the two estimates do not exactly match. For more information, see the Methodology and Technical Notes section. NOTE: Estimates reflect children assessed in English in all three rounds of data collection, who entered kindergarten for the first time in the fall of 1998 and were promoted to first grade in the fall of 1999. Due to rounding, percentage distributions of t-score quartiles may not sum to 100. SOURCE: U.S. Department of Education, National Center for Education Statistics, Early Childhood Longitudinal Study, Kindergarten Class of 1998-99, Base Year Public-Use and First Grade Restricted-Use data files.
44

Table 7.—Children’s mean mathematics t-scores and t-score quartile distributions, by school year, by the resources children possess as they enter kindergarten: 1998–99 and 2000
Spring Kindergarten Spring First Grade Percent distribution of t-score quartiles Percent distribution of t-score quartiles
Resource
Mean t-score 0–25
percent 26–50 percent
51–75 percent
76–100 percent
Mean t-score 0–25
percent 26–50 percent
51–75 percent
76–100 percent
Proficient* in recognizing letters at kindergarten entry
Yes 55 13 24 29 34 54 16 23 28 33 No 45 50 28 16 6 47 44 28 19 9 Read to at least three times a week at kindergarten entry
Yes 52 22 25 26 27 52 22 24 26 27 No 48 38 27 21 15 49 37 28 21 15 Proficient* in recognizing numbers and shapes at kindergarten entry
Yes 52 22 26 26 26 52 22 25 26 26 No 37 83 13 3 1 38 78 15 5 2 Proficient* in understanding relative size at kindergarten entry
Yes 56 8 23 32 38 55 11 22 31 37 No 45 53 29 14 4 46 49 29 16 6 Demonstrates positive approaches to learning often to very often at kindergarten entry
Yes 54 15 23 28 34 54 15 24 29 33 No 48 39 28 21 12 48 39 27 20 14 In very good or excellent general health at kindergarten entry
Yes 52 23 25 26 26 52 23 25 26 26 No 49 36 25 21 18 49 34 27 22 17 * In this report, the main approach to determining proficiency is to calculate the mean of a probability score in any given proficiency area (see tables 1 and 2). An alternative way to calculate proficiency (see table 5) is to present the information in a dichotomous fashion, where proficiency is indicated by whether a child correctly answered a specific number of items in a given set (see table above). Therefore, the two estimates do not exactly match. For more information, see the Methodology and Technical Notes section. NOTE: Estimates reflect children assessed in English in all three rounds of data collection, who entered kindergarten for the first time in the fall of 1998 and were promoted to first grade in the fall of 1999. Due to rounding, percentage distributions of t-score quartiles may not sum to 100. SOURCE: U.S. Department of Education, National Center for Education Statistics, Early Childhood Longitudinal Study, Kindergarten Class of 1998-99, Base Year Public-Use and First Grade Restricted-Use data files.
45

Table 8.—Percentage of children demonstrating specific reading knowledge and skills, by school year, the resources children possess as they enter kindergarten: 1998–99 and 2000
Spring Kindergarten Spring First Grade Resource Beginning
sounds Ending sounds
Sight words
Words in context
Beginning sounds
Ending sounds
Sight words
Words in context
Proficient* in recognizing letters at kindergarten entry
Yes 86 67 20 6 99 98 92 60 No 47 26 1 # 95 87 63 21 Read to at least three times a week at kindergarten entry
Yes 76 57 15 5 98 95 85 50 No 64 43 8 2 96 91 75 35 Proficient* in recognizing numbers and shapes at kindergarten entry
Yes 77 56 14 5 99 96 85 50 No 25 12 1 # 83 68 34 9 Proficient* in understanding relative size at kindergarten entry
Yes 87 69 21 7 100 98 93 62 No 52 30 2 # 95 88 66 23 Demonstrates positive approaches to learning often to very often at kindergarten entry
Yes 83 64 19 6 99 97 90 57 No 62 40 6 1 96 90 72 34 In very good or excellent general health at kindergarten entry
Yes 76 56 14 5 98 95 84 49 No 65 45 10 3 96 91 75 39 * In this report, the main approach to determining proficiency is to calculate the mean of a probability score in any given proficiency area (see tables 1 and 2). An alternative way to calculate proficiency (see table 5) is to present the information in a dichotomous fashion, where proficiency is indicated by whether a child correctly answered a specific number of items in a given set (see table above). Therefore, the two estimates do not exactly match. For more information, see the Methodology and Technical Notes section. # Less than .5 percent. NOTE: Estimates reflect children assessed in English in all three rounds of data collection, who entered kindergarten for the first time in the fall of 1998 and were promoted to first grade in the fall of 1999. SOURCE: U.S. Department of Education, National Center for Education Statistics, Early Childhood Longitudinal Study, Kindergarten Class of 1998-99, Base Year Public-Use and First Grade Restricted-Use data files.
46

Table 9.—Percentage of children demonstrating specific mathematics knowledge and skills, by school year, by the resources children possess as they enter kindergarten: 1998–99 and 2000
Spring Kindergarten Spring First Grade Resource Ordinality,
sequence Add/subtract Multiply/divide Ordinality,
sequence Add/subtract Multiply/divide
Proficient* in recognizing letters at kindergarten entry
Yes 71 25 3 98 83 34 No 32 5 # 91 60 12 Read to at least three times a week at kindergarten entry
Yes 61 20 3 96 78 29 No 46 11 1 93 67 17 Proficient* in recognizing numbers and shapes at kindergarten entry
Yes 61 20 2 97 78 28 No 10 1 # 69 30 3 Proficient* in understanding relative size at kindergarten entry
Yes 76 28 4 99 88 38 No 30 4 # 90 57 9 Demonstrates positive approaches to learning often to very often at kindergarten entry
Yes 70 25 4 98 84 34 No 43 10 1 92 64 16 In very good or excellent general health at kindergarten entry
Yes 61 20 2 96 77 28 No 48 14 2 92 68 19 * In this report, the main approach to determining proficiency is to calculate the mean of a probability score in any given proficiency area (see tables 1 and 2). An alternative way to calculate proficiency (see table 5) is to present the information in a dichotomous fashion, where proficiency is indicated by whether a child correctly answered a specific number of items in a given set (see table above). Therefore, the two estimates do not exactly match. For more information, see the Methodology and Technical Notes section. # Less than .5 percent. NOTE: Estimates reflect children assessed in English in all three rounds of data collection, who entered kindergarten for the first time in the fall of 1998 and were promoted to first grade in the fall of 1999. SOURCE: U.S. Department of Education, National Center for Education Statistics, Early Childhood Longitudinal Study, Kindergarten Class of 1998-99, Base Year Public-Use and First Grade Restricted-Use data files.
47

48

49
Standard Error Tables

50

Table 1a.—Standard errors for percentage of children demonstrating proficiency in specific reading knowledge and skills, by school year, by child, family and school characteristics: 1998–99 and 2000
Letter recognition Beginning sounds Ending sounds Sight words Words in context Characteristic Fall
K Spring
K Spring
1 Fall K
Spring K
Spring 1
Fall K
Spring K
Spring 1
Fall K
Spring K
Spring 1
Fall K
Spring K
Spring 1
Total .86 .41 .05 .83 .91 .15 .57 .96 .27 .13 .50 .63 .06 .19 .93 Sex Male .89 .56 .09 .84 .95 .20 .58 .95 .34 .20 .54 .71 .09 .24 .94 Female 1.15 .46 .06 1.05 1.05 .16 .73 1.12 .30 .15 .64 .76 .08 .27 1.15 Poverty status during kindergarten year Non-poor .73 .30 .04 .83 .70 .10 .59 .82 .18 .15 .54 .48 .07 .22 .87 Poor 1.91 1.10 .18 .88 1.93 .43 .53 1.46 .79 # .53 1.46 # .20 1.36 Race/ethnicity White, non-Hispanic .91 .34 .05 .99 .86 .11 .70 .98 .19 .17 .63 .52 .08 .26 .98 Black, non-Hispanic 1.93 .92 .22 1.47 1.87 .47 .94 1.67 .74 .28 .84 1.52 # .30 1.66 Hispanic 2.25 1.27 .04 1.45 2.16 .22 .90 2.08 .47 .29 .93 1.34 # .36 1.59 Asian 2.32 .57 .00 2.73 1.99 .17 2.21 2.50 .54 1.31 2.21 1.81 .84 1.52 3.06 Other 4.92 2.04 .44 3.18 4.27 .97 2.15 3.84 1.89 .71 1.65 4.02 .37 .89 3.43 School type during kindergarten year Public .90 .47 .06 .83 1.03 .16 .56 1.07 .30 .14 .52 .70 .07 .20 1.00 Private 1.38 .24 .01 1.89 1.00 .17 1.44 1.38 .35 .54 1.44 .93 .28 .77 1.67 # Standard error based on an estimate of less than .5 percent. SOURCE: U.S. Department of Education, National Center for Education Statistics, Early Childhood Longitudinal Study, Kindergarten Class of 1998-99, Base Year Public-Use and First Grade Restricted-Use data files.
51

Table 2a.—Standard errors for percentage of children demonstrating proficiency in specific mathematics knowledge and skills, by school year, by child, family and school characteristics: 1998–99 and 2000
Numbers and shapes Relative size Ordinality/sequence Add/subtract Multiply/divide Characteristic Fall
K Spring
K Spring
1 Fall K
Spring K
Spring 1
Fall K
Spring K
Spring 1
Fall K
Spring K
Spring 1
Fall K
Spring K
Spring 1
Total .29 .07 .02 .76 .52 .09 .67 .90 .29 .20 .53 .70 # .14 .76 Sex Male .39 .11 .02 .89 .60 .14 .85 .99 .34 .29 .66 .77 .09 .24 .95 Female .29 .07 .02 .89 .55 .09 .73 1.09 .33 .19 .60 .78 # .12 .80 Poverty status during kindergarten year Non-poor .23 .05 .05 .66 .36 .08 .71 .71 .25 .23 .55 .54 # .16 .76 Poor .84 .19 .11 1.33 1.22 .25 .64 1.70 .71 .13 .62 1.62 # .15 .87 Race/ethnicity White, non-Hispanic .23 .04 .01 .77 .38 .08 .87 .85 .20 .30 .66 .55 # .20 .90 Black, non-Hispanic .71 .29 .08 1.58 1.27 .38 .74 1.55 .95 .12 .58 1.92 # .07 .83 Hispanic .73 .18 .01 1.79 1.27 .14 1.08 2.06 .79 .22 .98 1.28 # .23 1.27 Asian .69 .24 .00 2.54 1.31 .12 2.33 3.06 .76 1.43 1.95 2.86 .28 1.00 2.72 Other 2.35 .39 .02 4.18 2.36 .55 2.54 3.21 1.40 .59 1.54 2.78 # .39 2.30 School type during kindergarten year Public .32 .08 .07 .84 .60 .11 .68 1.02 .34 .19 .58 .79 # .14 .84 Private .32 .07 .02 1.27 .52 .08 1.52 1.34 .28 .67 1.17 .90 .14 .48 1.42 SOURCE: U.S. Department of Education, National Center for Education Statistics, Early Childhood Longitudinal Study, Kindergarten Class of 1998-99, Base Year Public-Use and First Grade Restricted-Use data files.
52
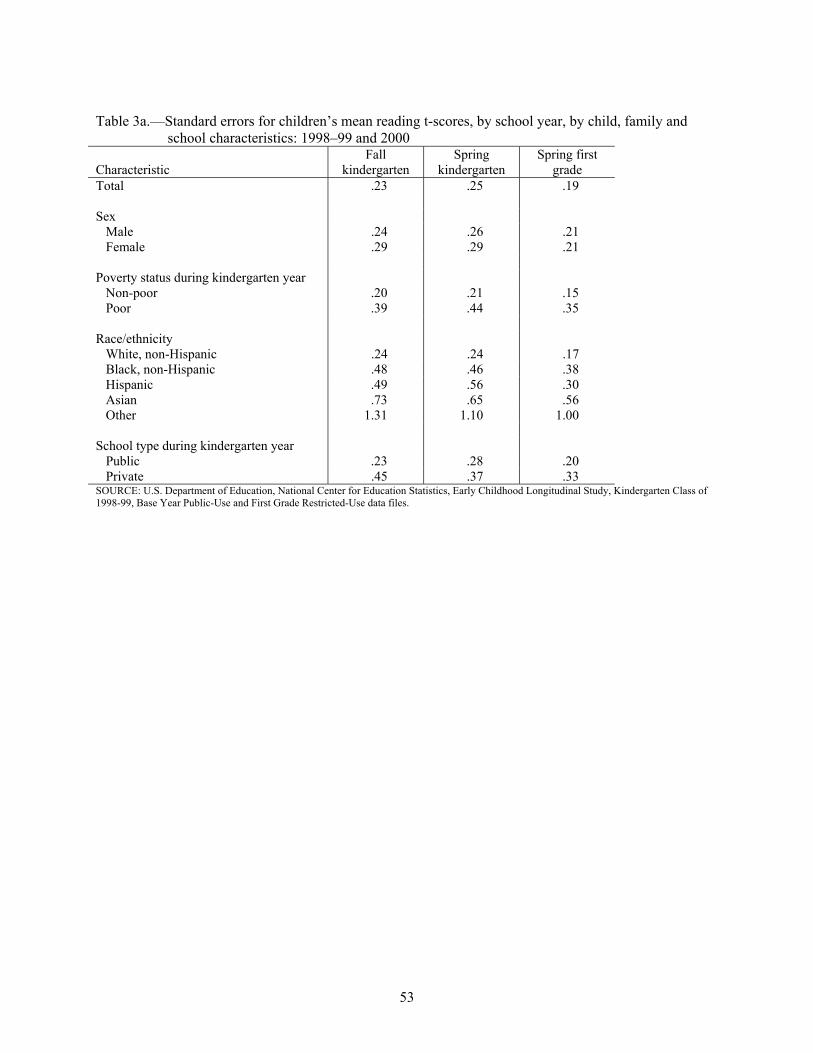
53
Table 3a.—Standard errors for children’s mean reading t-scores, by school year, by child, family and
school characteristics: 1998–99 and 2000 Characteristic
Fall kindergarten
Spring kindergarten
Spring first grade
Total .23 .25 .19 Sex Male .24 .26 .21 Female .29 .29 .21 Poverty status during kindergarten year Non-poor .20 .21 .15 Poor .39 .44 .35 Race/ethnicity White, non-Hispanic .24 .24 .17 Black, non-Hispanic .48 .46 .38 Hispanic .49 .56 .30 Asian .73 .65 .56 Other 1.31 1.10 1.00 School type during kindergarten year Public .23 .28 .20 Private .45 .37 .33 SOURCE: U.S. Department of Education, National Center for Education Statistics, Early Childhood Longitudinal Study, Kindergarten Class of 1998-99, Base Year Public-Use and First Grade Restricted-Use data files.

54
Table 4a.—Standard errors for children’s mean mathematics t-scores, by school year, by child, family and school characteristics: 1998–99 and 2000
Characteristic
Fall kindergarten
Spring kindergarten
Spring first grade
Total .21 .23 .22 Sex Male .26 .26 .26 Female .22 .25 .23 Poverty status during kindergarten year Non-poor .19 .18 .19 Poor .31 .40 .41 Race/ethnicity White, non-Hispanic .22 .21 .20 Black, non-Hispanic .35 .39 .49 Hispanic .44 .49 .38 Asian .67 .70 .74 Other 1.19 .85 .83 School type during kindergarten year Public .23 .26 .25 Private .39 .34 .30 SOURCE: U.S. Department of Education, National Center for Education Statistics, Early Childhood Longitudinal Study, Kindergarten Class of 1998-99, Base Year Public-Use and First Grade Restricted-Use data files.

55
Table 5a.—Standard errors for percentage distribution of children by the resources they possess as they
enter kindergarten: 1998 Resource Has resource Does not have resource Proficient in recognizing letters at kindergarten
entry .86 .86
Read to at least three times a week at kindergarten
entry .72 .72
Proficient in recognizing numbers and shapes at
kindergarten entry .33 .33
Proficient in understanding relative size at
kindergarten entry .81 .81
Demonstrates positive approaches to learning
often to very often at kindergarten entry .71 .71
In very good or excellent general health at
kindergarten entry .48 .48
SOURCE: U.S. Department of Education, National Center for Education Statistics, Early Childhood Longitudinal Study, Kindergarten Class of 1998-99, Base Year Public-Use and First Grade Restricted-Use data files.

Table 6a.—Standard errors for children’s mean reading t-scores and t-score quartile distributions, by school year, by the resources children possess at kindergarten entry: 1998–99 and 2000
Spring Kindergarten Spring First Grade Percent distribution of t-score quartiles Percent distribution of t-score quartiles
Resource
Mean t-score 0–25
percent 26–50 percent
51–75 percent
76–100 percent
Mean t-score 0–25
percent 26–50 percent
51–75 percent
76–100 percent
Proficient in recognizing letters at kindergarten entry
Yes .18 .64 .68 .72 .99 .15 .60 .78 .66 .92 No .33 1.59 1.13 .94 .43 .28 1.42 1.28 .83 .58 Read to at least three times a week at kindergarten entry
Yes .24 .96 .59 .68 .95 .18 .76 .84 .67 .86 No .37 1.79 1.27 1.28 .92 .33 1.58 1.17 1.08 .98 Proficient in recognizing numbers and shapes at kindergarten entry
Yes .23 .93 .54 .63 .88 .74 .70 .77 .62 .83 No .59 2.58 2.39 .82 .53 .16 2.43 1.81 1.41 .73 Proficient in understanding relative size at kindergarten entry
Yes .17 .58 .64 .73 .93 .14 .53 .85 .73 1.03 No .33 1.54 .97 .87 .56 .26 1.29 .99 .89 .51 Demonstrates positive approaches to learning often to very often at kindergarten entry
Yes .23 .90 .76 .71 1.09 .19 .72 .98 .72 1.07 No .33 1.49 .83 .88 .73 .27 1.20 .83 .91 .75 In very good or excellent general health at kindergarten entry
Yes .25 .98 .57 .63 .92 .18 .76 .72 .62 .80 No .41 1.87 1.37 1.45 1.21 .35 1.45 1.64 1.28 1.53 SOURCE: U.S. Department of Education, National Center for Education Statistics, Early Childhood Longitudinal Study, Kindergarten Class of 1998-99, Base Year Public-Use and First Grade Restricted-Use data files.
56

Table 7a.—Standard errors for children’s mean mathematics t-scores and t-score quartile distributions, by school year, by the resources children possess as they enter kindergarten: 1998–99 and 2000
Spring Kindergarten Spring First Grade Percent distribution of t-score quartiles Percent distribution of t-score quartiles
Resource
Mean t-score 0–25
percent 26–50 percent
51–75 percent
76–100 percent
Mean t-score 0–25
percent 26–50 percent
51–75 percent
76–100 percent
Proficient in recognizing letters at kindergarten entry
Yes .18 .73 .59 .63 .86 .19 .77 .63 .59 1.02 No .30 1.83 1.32 .85 .61 .33 1.50 .95 .91 .83 Read to at least three times a week at kindergarten entry
Yes .23 1.00 .61 .62 1.07 .21 .85 .56 .44 .84 No .32 1.64 1.19 1.28 .80 .33 1.56 1.38 1.05 1.25 Proficient in recognizing numbers and shapes at kindergarten entry
Yes .20 .96 .55 .61 .75 .18 .80 .59 .44 .88 No 2.34 2.13 .67 .51 .51 .76 2.34 1.91 1.30 .41 Proficient in understanding relative size at kindergarten entry
Yes .14 .51 .68 .64 .83 .17 .57 .74 .66 1.11 No .26 1.57 1.11 .77 .40 .28 1.36 1.00 .82 .47 Demonstrates positive approaches to learning often to very often at kindergarten entry
Yes .19 .73 .73 .68 .98 .19 .75 .72 .58 1.07 No .30 1.61 .87 .92 .68 .28 1.25 .72 .67 .84 In very good or excellent general health at kindergarten entry
Yes .22 .97 .54 .61 .78 .21 .80 .56 .43 .87 No .41 2.09 1.28 1.17 1.16 .38 1.84 1.27 1.31 1.24 SOURCE: U.S. Department of Education, National Center for Education Statistics, Early Childhood Longitudinal Study, Kindergarten Class of 1998-99, Base Year Public-Use and First Grade Restricted-Use data files.
57

Table 8a.—Standard errors for percentage of children demonstrating specific reading knowledge and skills, by school year, the resources children possess as they enter kindergarten: 1998–99 and 2000
Spring Kindergarten Spring First Grade Resource Beginning
sounds Ending sounds
Sight words
Words in context
Beginning sounds
Ending sounds
Sight words
Words in context
Proficient in recognizing letters at kindergarten entry
Yes .57 .79 .61 .26 .06 .13 .39 .92 No 1.41 1.01 .16 # .41 .67 1.34 .84 Read to at least three times a week at kindergarten entry
Yes .86 .95 .56 .22 .13 .24 .58 .95 No 1.55 1.35 .60 .28 .42 .72 1.39 1.21 Proficient in recognizing numbers and shapes at kindergarten entry
Yes .84 .93 .51 .19 .08 .18 .51 .92 No 2.12 1.18 .44 # 1.69 2.17 2.71 1.32 Proficient in understanding relative size at kindergarten entry
Yes .51 .70 .62 .28 .04 .09 .31 .90 No 1.36 1.06 .23 # .34 .58 1.21 .91 Demonstrates positive approaches to learning often to very often at kindergarten entry
Yes .76 .92 .64 .30 .07 .18 .52 1.08 No 1.37 1.17 .41 .15 .31 .54 1.09 1.07 In very good or excellent general health at kindergarten entry
Yes .90 .97 .52 .21 .13 .24 .59 .94 No 1.58 1.43 .79 .46 .44 .71 1.34 1.48 # Standard error based on an estimate of less than .5 percent. SOURCE: U.S. Department of Education, National Center for Education Statistics, Early Childhood Longitudinal Study, Kindergarten Class of 1998-99, Base Year Public-Use and First Grade Restricted-Use data files.
58

Table 9a.—Standard errors for percentage of children demonstrating specific mathematics knowledge and skills, by school year, by the resources children possess as they enter kindergarten: 1998–99 and 2000
Spring Kindergarten Spring First Grade Characteristic Ordinality,
sequence Add/ subtract Multiply/ divide Ordinality,
sequence Add/ subtract Multiply/ divide
Proficient in recognizing letters at kindergarten entry
Yes .77 .59 .19 .15 .58 .84 No 1.10 .35 # .71 1.16 .70 Read to at least three times a week at kindergarten entry
Yes .91 .58 .17 .28 .64 .74 No 1.30 .66 .21 .63 1.23 1.03 Proficient in recognizing numbers and shapes at kindergarten entry
Yes .84 .52 .15 .19 .59 .74 No 1.21 .36 # 2.59 2.15 .43 Proficient in understanding relative size at kindergarten entry
Yes .55 .57 .20 .08 .43 .88 No .99 .23 # .65 1.05 .46 Demonstrates positive approaches to learning often to very often at kindergarten entry
Yes .77 .66 .21 .17 .54 .89 No 1.22 .44 .09 .56 .99 .69 In very good or excellent general health at kindergarten entry
Yes .87 .55 .15 .27 .64 .75 No 1.65 .81 .31 .75 1.36 1.07 # Standard error based on an estimate of less than .5 percent. SOURCE: U.S. Department of Education, National Center for Education Statistics, Early Childhood Longitudinal Study, Kindergarten Class of 1998-99, Base Year Public-Use and First Grade Restricted-Use data files.
59

60

61
Appendix

62

63
Table A.—Regression coefficients for the relationship between children's resources and skills to their spring kindergarten and spring first grade reading performance
Spring kindergarten reading score
Spring first grade reading score
R2 Β R2 Β Literacy Model I Controls1 .09* --- .09* --- Letter recognition, fall kindergarten .33* 10.22* .27* 8.04* Model II Controls1 .09* --- .09* --- Frequency read to, fall kindergarten .10* 2.42* .10* 2.31* Model III Controls1 .09* --- .09* --- Numbers and shapes, fall kindergarten .16* 11.85* .18* 12.18* Model IV Controls1 .09* --- .09* --- Relative size, fall kindergarten .31* 9.35* .27* 7.81* Approaches to learning Model V Controls1 .09* --- .09* --- Approaches to learning, fall kindergarten .17* 5.48* .17* 4.88* Health Model VI Controls1 .09* --- .09* --- Health, fall kindergarten .10* 2.00*
.10* 1.88** significant at p<.05. 1The control variables are family's poverty status and children's race/ethnicity. NOTE: Each model explores the relationship of a specific resource to children's spring kindergarten and spring first grade reading performance, while controlling for the influence of family poverty and children's race/ethnicity.

64
Table B.—Regression coefficients for the relationship between children's resources and skills to their spring kindergarten and spring first grade mathematics performance
Spring kindergarten mathematics score
Spring first grade mathematics score
R2 Β R2 Β Literacy Model I Controls1 .13* --- .12* --- Letter recognition, fall kindergarten .29* 8.43* .29* 8.43* Model II Controls1 .13* --- .12* --- Frequency read to, fall kindergarten .13* 1.97* .13* 1.97* Model III Controls1 .13* --- .12* --- Numbers and shapes, fall kindergarten .22* 13.38* .22* 13.38* Model IV Controls1 .13* --- .12* --- Relative size, fall kindergarten .39* 10.13* .39* 10.13* Approaches to learning Model V Controls1 .13* --- .12* --- Approaches to learning, fall kindergarten .22* 5.71* .22* 5.71* Health Model VI Controls1 .13* --- .12* --- Health, fall kindergarten .13* 2.03*
.13* 2.03** significant at p<.05. 1The control variables are family's poverty status and children's race/ethnicity. NOTE: Each model explores the relationship of a specific resource to children's spring kindergarten and spring first grade mathematics performance, while controlling for the influence of family poverty and children's race/ethnicity.