children facts motor vehicle occupant protection facts – children, youth, young adults i n 2013,...
TRANSCRIPT

YOUTH
YOUNG ADULTS
CHILDREN
FACTS
M O T O R V E H I C L E O CC U PA N T P R O T E C T I O N

This Fact Book was initially updated by Laura Dunn, MPH, a Public Health Fellow in NHTSA’s Office of Impaired Driving and Occupant Protection from August 2013 to December 2014, and completed by Alexandra Holliday and Maria Vegega in NHTSA’s Occupant Protection Division. Special thanks to the National Center for Statistics and Analysis (NCSA) for updating the data in this Fact Book.
Suggested APA Format Citation:
Dunn, L., Holliday, A., & Vegega, M. (2016, March). Motor vehicle occupant protection facts – Children, youth, young adults (Fact book. Report No. DOT HS 812 251). Washington, DC: National Highway Traffic Safety Administration.

IIINational Highway Traffic Safety Administration
TABLE OF CONTENTS
INTRODUCTION 1 Using This Booklet as a Resource .............................................................................................1Definitions ................................................................................................................................1
THE NATIONAL SCOPE OF MOTOR VEHICLE CRASHES 2The Importance of Occupant Restraints ..................................................................................2Economic Burdens ....................................................................................................................3
THE IMPORTANCE OF OCCUPANT RESTRAINT USE FOR CHILDREN, YOUTH, AND YOUNG ADULTS 4Seat Belt Use Makes a Difference .............................................................................................5 Exhibit 1: Driver and Child Restraint Use in Fatal Crashes Involving Children
From Birth to 15 Years Old .............................................................................6Restraints for All Age Groups Save Lives ..................................................................................6Use of Correct Restraint Types..................................................................................................6Booster Seat Use Saves Lives and Reduces the Risk of Injury ..................................................7Closing the Gaps in Occupant Restraint Laws Can Save Young Lives ...............................................................................................................8 Exhibit 2: Map: Age at Which a Child Must Be in a Child Restraint or a Booster Seat ...8Primary Enforcement Laws Help Protect Children of All Ages .................................................9
FACTS ABOUT CHILDREN AND YOUTH 10Facts About Restraint Use ......................................................................................................10Facts About Motor-Vehicle-Related Deaths and Injuries .......................................................11
FACTS ABOUT YOUNG ADULTS (AGES 16 TO 20) 12
SELF-REPORTED BEHAVIOR, ATTITUDES, AND OPINIONS ON SEAT BELT USE 15Seat Belt Use Behavior ...........................................................................................................15Attitudes Toward Seat Belt Use ..............................................................................................15Opinions About Seat Belt Use Laws .......................................................................................15Teens and Distraction ............................................................................................................15
APPENDICES 16Appendix A: Passenger Vehicle Occupant Fatalities, by State and Age Group, 2013 .............17Appendix B: Passenger Vehicle Occupant Fatalities, by State and Restraint Use, 2013 .........18APPENDIX C: State Restraint Laws..........................................................................................19
FOR ADDITIONAL INFORMATION 20
CHARTS Chart 1: Passenger Vehicle Occupant Fatalities in 2013 ............................................................... 2Chart 2: Occupant Fatality and Injury Rates, 2004-2013 ............................................................. 4Chart 3: Occupant Fatalities in 2013 ............................................................................................. 5Chart 4: Estimated Occupant Injuries in 2013 .............................................................................. 5Chart 5: Percent of Occupant Fatalities in 2013 ............................................................................ 6Chart 6: Passenger Vehicle Occupant Fatalities in 2013 ............................................................. 10Chart 7: Occupants Injured in Passenger Vehicles in 2013 by Age and Injury Severity .............. 11Chart 8: Percentage of All Occupants From Birth to Age 20 Killed or Injured in 2013................ 13Chart 9: Driver Fatality Rates per 100,000 Licensed Drivers in 2013 by Age .............................. 13Chart 10: Driver Fatality Rates per 100,000 Licensed Drivers in 2013 by Age and Gender ........ 14Chart 11: Driver Injury Rates per 100,000 Licensed Drivers in 2013 by Age and Gender ........... 14Chart 12: Driver Fatalities, 16- to 20-Year-Olds, by Restraint Use When Known, 2004-2013 .... 14

1National Highway Traffic Safety Administration
INTRODUCTION
Throughout the United States, many people and organi-zations are working to promote motor vehicle occupant protection for children, youth, and young adults. In spite
of the great strides made in this country, every year, thousands of young people die or experience serious injuries that could have been prevented had they been properly restrained in child safety seats, booster seats, or seat belts.
The National Highway Traffic Safety Administration has pro-duced this booklet since 2002 to explain the need for legislation, enforcement, education, and public awareness campaigns about protecting children, youth, and young adults in motor vehicles. Collectively, this information underscores why protect-ing young people is so important.
The majority of data in this fact book comes from 2013, the most recent year data was available. It has been generated from the Fatality Analysis Reporting System (FARS) and the General Estimates System (GES) produced by the National Center for Statistics and Analysis (NCSA) at NHTSA. Data from NHTSA’s 2013 National Occupant Protection Use Survey (NOPUS) is also included.
Using This Booklet as a ResourceThe facts in this booklet can be used to develop speeches and presentations, public information and education publica-tions, backgrounders, and news releases for the media, and to promote the use of occupant restraints in conjunction with law enforcement officials. States and local communities have vital roles to play in creating a national norm that makes it unaccept-able to ride unrestrained in a motor vehicle. Our national goal must be to make child safety seats and seat belts lifelong habits for everyone.
The discussion refers to young people according to these age groups.
• Children: newborns to age 7
• Youth: 8 to 15 (in some States 15-year-olds are permitted to obtain learner’s permits, so they are sometimes included as “young drivers”)
• Young adults: 16 to 20
The booklet has five main sections.
• The national scope of motor vehicle crashes
• The need for and importance of appropriately sized restraint systems for each age group
• Facts about restraint use for children and youth from birth to 15 years old
• Facts about restraint use for young adults 16 to 20
• Biennial telephone survey findings from NHTSA’s 2007 Motor Vehicle Occupant Safety Survey (MVOSS) on the behavior, attitudes, and opinions about seat belts and seat belt laws, including those of 16- to 20-year-olds.
Three appendices cover State-specific information on fatalities, restraint use, and child restraint laws.
DefinitionsAs you review the information that follows, keep in mind the following definitions:
Fatal Crash: A police-reported crash involving a motor vehicle in which at least one person dies within 30 days of the crash (including the deaths of people who were not in the vehicle, such as pedestrians and pedalcyclists).
Fatal Injury: Any injury that results in death within 30 days of the crash.
Incapacitating Injury: Any nonfatal injury that prevents the person from walking, driving, or normally continuing those activities the person was capable of before the injury. Often defined as “needing help from the scene.”
Injury Crash: A police-reported crash involving a motor vehicle in which no one died but at least one person was reported to have (1) an incapacitating injury, (2) a visible but not incapacitat-ing injury, (3) a possible but not visible injury, or (4) an injury of unknown severity.
Nonincapacitating Injury: Any injury, other than a fatal injury or an incapacitating injury, which is evident to observers at the scene of the crash. Examples: bruises, cuts, bloody nose.
Passenger Vehicles: Includes all cars, SUVs, vans up to 15-pas-senger capacity, and light trucks (under 10,000 lbs. gross vehicle weight rating) including pickups and truck-based station wagons. Motorcycles, buses, and large trucks (more than 10,000 lbs. GVWR) are not included in this category.
Restraint Use: All the restraint use percentages reported in this document are based on known restraint use; that is, the occupants with an unknown restraint status have not been considered when calculating the percentages.

Motor Vehicle Occupant Protection Facts – Children, Youth, Young Adults2
In 2013, nearly 5.7 million police-reported motor vehicle crashes occurred in the United States. In this same year, 21,132 occupants of passenger vehicles were killed in motor vehicle
crashes. Over 15 percent (3,208) of these fatalities were children, youth, and young adults.1
Motor vehicle crash fatalities rank third in terms of years of life lost (the number of remaining years that the person would be expected to live had they not died) behind only cancer and heart disease.2
Motor vehicle traffic crashes were the leading cause of death for children age 4 and the second leading cause of death for children age 3 and every age 5 through 14 in 2013.3 However, motor vehicle crashes were the leading cause of death for 15- to 20-year-olds in 2013.4 In 2013, an average of 3 children 14 and younger were killed and 470 were injured every day in motor vehicle traffic crashes.5
Of the estimated 2,046,000 occupants of passenger vehicles injured in traffic crashes in 2013:
• 45,000 children under 5 were injured;
• 33,000 children 5 to 7 were injured;
• 49,000 youth 8 to 12 were injured;
• 36,000 youth 13 to 15 were injured; and
• 258,000 young adults 16 to 20 were injured.
The Importance of Occupant RestraintsOne of the most effective measures a person can take to prevent injury and death in a crash is to be appropriately restrained in rear- or forward-facing child safety seats, booster seats, or seat belts. NHTSA estimates that lap/shoulder seat belts, when used correctly, reduce the risk of fatal injury to front-seat occupants of passenger cars by 45 percent and the risk of moderate-to-critical injury by 50 percent. For light-truck occupants, seat belts reduce the risk of fatal injury by 60 percent and moderate-to-critical injury by 65 percent. Research on the effectiveness of child safety seats has found them to reduce fatal injury by 71 percent for infants (less than 1 year old) and by 54 percent for toddlers (1 to 4 years old) in passenger cars.6 For infants and toddlers in light trucks, the corresponding reductions are 58 percent and 59 percent, respectively.7
Thousands of lives are saved every year because of child restraints and seat belts. Among passenger vehicle occupants in 2013:
• Child restraints saved an estimated 263 children under 5; if child restraint use had been 100 percent, another 56 lives could have been saved.8
• Seat belts saved an estimated 12,584 lives for those 5 and older.9
• If all passenger vehicle occupants age 5 and older had worn seat belts, 15,384 lives (that is, an additional 2,800) would have been saved in 2013.10
In spite of this evidence, the majority of fatally injured people are not properly restrained. In 2013, 21,132 occupants died in motor vehicle traffic crashes. Of the 21,132 passenger vehicle occupants killed, 9,777 (49%) were known to be restrained. Chart 1 compares the percentage of fatally injured occupants who were restrained to those who were unrestrained in passenger vehicle crashes when restraint use was known.
Chart 1 Passenger Vehicle Occupant Fatalities in 2013By Age and Restraint Use When Known
Perc
ent
Age Group
100
60
40
20
0.0
80
UNRESTRAINEDRESTRAINED
<5 5-7 8-12 13-15 16-20 21-24 25-44 45-64 65-74 75+
THE NATIONAL SCOPE OF MOTOR VEHICLE CRASHES
1 Data 2013, Washington DC: National Highway Traffic Safety Administration 2 Subramanian, R. (2012, May). Motor vehicle traffic crashes as leading cause of death in the United
States, 2008 and 2009. (Report No. DOT HS 811 620). Washington, DC: National Highway Traffic Safety Administration.
3 National Center for Statistics and Analysis. (2015a, June). Children: 2013 data. (Traffic Safety Facts. Report No. DOT HS 812 154). Washington, DC: National Highway Traffic Safety Administration. Available at www-nrd.nhtsa.dot.gov/Pubs/812154.pdf
4 National Center for Statistics and Analysis. (2015b, October). Young drivers: 2013 data. (Traffic Safety Facts. Report No. DOT HS 812 200). Washington, DC: National Highway Traffic Safety Administration. Available at http://www-nrd.nhtsa.dot.gov/Pubs/812200.pdf
5 NCSA, 2015a.6 National Center for Statistics and Analysis. (2015c, May). Occupant protection: 2013 data. (Traffic
Safety Facts DOT HS 812 153). Washington, DC: National Highway Traffic Safety Administration. Available at www-nrd.nhtsa.dot.gov/Pubs/812153.pdf
7 NCSA, 2015a. 8 NCSA, 2015c.9 NCSA, 2015c.10 NCSA, 2015c.

3National Highway Traffic Safety Administration
Economic BurdensThe cost of reported as well as non-reported motor vehicle crashes totaled $242 billion in 2010, the latest year for which this data is available. This translates to an annual average of $784 for every person living in the United States. Included in this figure are $77 billion in lost productivity, $23.4 billion in medical expenses, and $76.1 billion in property damage. The average cost for a critically injured survivor of a motor vehicle crash is estimated at $1 million over a lifetime. Conversely, the use of seat belts saved society $1.2 trillion in medical care, lost produc-tivity, and other injury-related economic costs since 1975.11
In 2010, seat belt nonuse alone caused an estimated $10.43 billion in economic costs to society. When people don’t wear seat belts, the potential costs increase because unbelted crash victims receive worse injuries and more fatalities than belted crash victims.
11 Blincoe, L. J., Miller, T. R., Zaloshnja, E., & Lawrence, B. A. (2015, May). The economic and societal impact of motor vehicle crashes, 2010 (Revised) (Report No. DOT HS 812 013). Washington, DC: National Highway Traffic Safety Administration. Available at http://www-nrd.nhtsa.dot.gov/pubs/812013.pdf
12 NCSA, 2015c.13 NCSA, 2015a. 14 NCSA, 2015c.
CHILDRENRestraint use saved an estimated 263 lives of children under the age of 5 in 2013.12
YOUNG ADULTSIn 2013, 55 percent of the passenger vehicle occupants age 16 to 20 with known restraint use who were killed were not wearing seat belts.14
YOUTHOf the 8- to 14-year-old passenger vehicle occupants with known restraint use killed in fatal crashes in 2013, 53 percent were unrestrained.13

Motor Vehicle Occupant Protection Facts – Children, Youth, Young Adults4
The use of occupant restraints must be reinforced at an early age to reduce the high rates of death and injury that children, youth, and young adults experience in motor
vehicle crashes. But parents should not have to bear the burden by themselves. In communities across the country, health pro-fessionals, law enforcement officers, educators, elected officials and public employees, and every adult must contribute to the social and legal infrastructures necessary to make seat belt use a lifelong habit.
While fatality and injury rates (per 100 million vehicle miles trav-eled, VMT) have declined slightly during the past 10 years (see Chart 2), thousands of children and young adults still continue to be killed and injured in motor vehicle crashes. Among passenger vehicle occupants in 2013, there were 3,208 young people from birth to age 20 killed. An additional 421,000 were injured in passenger vehicle crashes. (See Appendix A for a State-by-State breakdown of fatalities.)
Chart 2 Occupant Fatality and Injury Rates, 2004-2013Per 100 Million VMT, in Passenger Vehicles
Year
2004 2005 2006 2007 2008 2009 2010 2011 2012 2013
Fata
lity
Rate
Per 1
00 M
illio
n Ve
hicl
e M
iles T
rave
led
Inju
ry R
ate
Per 1
00 M
illio
n Ve
hicl
e M
iles T
rave
led
100
75
50
0
25
2.0
1.5
1.0
0.5
0.0
Year
2004 2005 2006 2007 2008 2009 2010 2011 2012 2013
THE IMPORTANCE OF OCCUPANT RESTRAINT USE FOR CHILDREN, YOUTH, AND YOUNG ADULTS15
There is a strong positive correlation between the restraint use of an adult driver and that of young children in the vehicle.
15 Fatal restraint data is based on “known” restraint usage.

5National Highway Traffic Safety Administration
Chart 3 Occupant Fatalities in 2013By Age, in Passenger Vehicles
Num
ber o
f Fat
aliti
es
0
Age Group
1,000
4,000
2,000
3,000
5,000
6,000
7,000
<5 13-155-7 8-12 16-20 21-24 25-44 45-64 65-74 75+
Chart 4 Estimated Occupant Injuries in 2013By Age, in Passenger Vehicles
Num
ber o
f Peo
ple
Inju
red
0
Age Group
100,000
400,000
200,000
300,000
500,000
600,000
700,000
<5 13-155-7 8-12 16-20 21-24 25-44 45-64 65-74 75+
16 Pickrell, T. M., & Liu, C. (2015a, January). Occupant restraint use in 2013: Results from the NOPUS controlled intersection study (Report No. DOT HS 812 080). Washington, DC: National Highway Traffic Safety Administration.
Despite widespread public education campaigns, a significant percentage of children, youth, and young adults who were killed in passenger vehicle crashes in 2013 were unrestrained. There were 278 fatalities among children under the age of 5; of those with known restraint use, 31 percent were unrestrained. Among the 135 fatalities for children 5 to 7 years old with known restraint use, 41 percent were unrestrained.
For children 8 to 12 years old there were 225 fatalities, of which 45 percent were unrestrained. The 13- to 15-year-old age group had one of the highest known percentages of unrestrained occupants, at 61 percent. Among the 246 fatalities where restraint use was known for youth 13 to 15 years old, 134 were known to not be wearing their seat belts.
Seat Belt Use Makes a DifferenceResearch conducted by NHTSA on occupant protection use from 2004 to 2013 shows that in vehicles where adult drivers wear seat belts, children are more likely to be restrained as well.16 Research about fatally injured children and youth from birth to 15 reveals the following:
• When drivers didn’t wear their seat belts, 55 percent of children up to age 4 were also unrestrained. But when drivers were wearing seat belts, 78 percent of the children were properly restrained.
• Among fatally injured children 5 to 7 years old, 71 percent were unrestrained when the drivers were unrestrained. But when the drivers were wearing seat belts, far fewer children (34%) 5 to 7 were unrestrained.
• Among fatally injured children 8 to 12 years old, 83 percent were unrestrained when the drivers were unrestrained. When the drivers were wearing seat belts far fewer children (36%) 8 to 12 were unrestrained.
• Among fatally injured children 13 to 15 years old, 90 percent were unrestrained when the drivers were unrestrained. Con-versely, when the drivers were wearing seat belts far fewer children (48%) 13 to 15 were unrestrained.
Charts 3 and 4 illustrate the motor vehicle fatalities and injuries for our children, youth, and young adults.

Motor Vehicle Occupant Protection Facts – Children, Youth, Young Adults6
Exhibit 1 illustrates the relationship between driver and child restraint use in crashes in which a child was fatally injured.
Exhibit 1 Driver and Child Restraint Use in Passenger Vehicles in Fatal Crashes Involving Children Fatally Injured From Birth to 15, 2004-2013
Percentage of Child Passengers Unrestrained, By Age Group
<5 5-7 8-12 13-15
Driver Unrestrained 55 71 83 90
Driver Restrained 22 34 36 48
This strong association between parental and child restraint use speaks to the importance of maintaining programs and outreach for children, youth, and parents to encourage the use of occupant restraints. NHTSA’s 2007 Motor Vehicle Occupant Safety Survey further illustrates this need. In the 2007 MVOSS, researchers asked people their level of agreement with the statement, “I have a habit of wearing a seat belt because my par-ents insisted I wear them when I was a child.” Among people 16 to 24 years old, 80 percent either strongly agreed or somewhat agreed with this statement.17
Restraints for All Age Groups Save LivesMost of the people who die in motor vehicle crashes are vehicle occupants; almost one-third of fatalities caused by crashes involve pedestrians, pedalcyclists, and motorcyclists. Seat belts and child safety seats have been designed to protect drivers and passengers from death and injury during a crash. But these restraints cannot save lives if they are not used. (See Appendix B—Passenger Vehicle Occupants Killed in Motor Vehicle Crashes, by State and Restraint Use, 2013.)
• In 2013, seat belts saved an estimated 12,584 lives among passenger vehicle occupants 5 and older.
• In 2013, an estimated 263 lives were saved by child restraint use for children under 5.
• Over the period from 1975 to 2013, among children 4 and younger an estimated 10,421 lives were saved by child safety seats or seat belts.18
• Ejection from the vehicle is one of the most injurious events that can happen to a person in a crash. In 2013, 79 percent of
people in fatal crashes who were completely ejected from passenger vehicles were killed. Seat belts are effective in preventing total ejections: Only 1 percent of people wearing seat belts were totally ejected from passenger vehicles, compared with 31 percent of unbelted people.19
• In fatal crashes in 2013, children, youth, and young adults were more likely to be ejected compared to persons of all ages. See Chart 5.
Chart 5 Percent of Occupant Fatalities in 2013By Age and Ejection Status, in Passenger Vehicles
TOTALLY EJECTEDPARTIALLY EJECTED
Perc
ent
30
20
10
0
40
16-2013-158-125-7<5 All Ages(0-75+)
Use of Correct Restraint TypesYoung children who are either placed in the wrong type of car seat/ booster seat or moved prematurely into seat belts meant for larger children and adults continues to be a serious problem.
To increase correct restraint use, NHTSA required a new system to help make child safety seat installation easier. This system, comprised of lower anchors and top tethers, is required on most child safety seats and vehicles manufactured after September 1, 2002.
NHTSA recommends that all infants should ride in the back seat, in rear-facing child safety seats as long as possible up to the height and weight limit of the particular seat. By supporting the entire posterior torso, neck, head and pelvis, a rear-facing car seat distributes crash forces over the entire body rather than focusing them only at the belt contact points.
17 Boyle, J. M., & Lampkin, C. (2008, August). 2007 Motor Vehicle Occupant Safety Survey, Volume 2, Seat belt report. (Report No. DOT HS 810 975). Washington, DC: National Highway Traffic Safety Administration. Available at http://www.nhtsa.gov/Driving+Safety/Research+&+Evaluation/National+Telephone+Surveys
18 NCSA, 2015a.19 NCSA, 2015c.

7National Highway Traffic Safety Administration
When children outgrow these rear-facing child safety seats they should ride in forward- facing seats, in the back seat, until they reach the height or weight limit of the particular seat.
• Despite these recommendations, the 2013 National Survey of the Use of Booster Seats (NSUBS) found that 9 percent of children less than 20 pounds were not restrained in rear-facing car seats in 2013 (7% were prematurely graduated to forward-facing car seats and 2% were unrestrained).20
• NHTSA found that most of the “premature graduation” for these children were to front-facing child safety seats, before the children were ready for them.
In 2011, NHTSA conducted a national child restraint use study which addressed the use and misuse of car seats and booster seats. The data were collected from a national representative sample of 24 randomly selected geographic areas throughout the country. The focus was children from birth to age 8. Results showed that overall car seat and booster seat misuse was 46 percent. However, car seat misuse was 59 percent while booster seat misuse was 20 percent. The most frequently observed misuse was incorrect recline for rear facing seats, loose car seat installation for forward facing seats, and improper lap belt position for booster seats. 21
The reason children should ride in the rear seat is that children in the front seats of cars with air bags can be killed or seriously injured if those air bags deploy. NHTSA recommends that children and youth 12 and younger sit in the rear seat away from the force of deploying air bags. If the vehicle has side-impact air bags, NHTSA recommends that children be properly restrained and in a proper seating position at all times. To minimize injury risks, children should not lean or rest against side-impact air bags that are the chest-only or head/chest combination types.
Booster Seat Use Saves Lives and Reduces the Risk of InjuryThe appropriate restraint system for children 4 to 7 years old is either a front-facing safety seat or a booster seat, depending on the child’s height and weight. Booster seat use substantially reduces the risk of injury for children; however, some children in this age group are currently (and very often incorrectly) restrained only by seat belts designed for adults. The National
Survey of the Use of Booster Seats (NSUBS) survey conducted in 2013 indicated that about 24 percent of children 4 to 7 years old were prematurely graduated to seat belts and 46 percent of children in this age group were riding in booster seats.22
A 2003 study conducted by the Children’s Hospital of Philadel-phia found that the use of belt-positioning booster seats lowers the risk of injury to children in crashes by 59 percent compared with the use of vehicle seat belts. The study also found that none of the 4- to 7-year-olds who were in belt-positioning booster seats had any injuries to the abdomen, neck, spine, or back. Yet, such injuries did occur in children who only used seat belts but who were too small for them.23
Persuading parents to place their children in the appropriate occupant restraint will reduce the number of children killed or seriously injured.
The 2013 National Survey of the Use of Booster Seats (NSUBS),24 a nationwide survey of observed restraint use conducted by NHTSA, found that among 4- to 7-year-old children:
• Booster seat use was 46 percent;
• 24 percent of children were in adult seat belts;
• 9 percent of the children were completely unrestrained; and
• 20 percent of the children were in child safety seats.
These results indicate that as many as 33 percent of children 4 to 7 in the United States were not being properly restrained (24% prematurely in seat belts and 9% unrestrained).
Children who have outgrown child safety seats, but are too small to ride safely in adult seat belts, should be properly restrained in booster seats until the adult belt fits properly, i.e., the lap belt must lie snugly across the upper thighs, not the stomach, and the shoulder belt should lie snug across the shoulder and chest and not cross the neck or face. If placed in an adult seat belt prematurely, a child may suffer serious internal injuries, slip out of the seat belt, or be ejected from the vehicle during a crash.
20 Pickrell, T.M., & Choi, E-H. (2014, June). The 2013 national survey of the use of booster seats (Report No. DOT HS 812 037). Washington, DC: National Highway Traffic Safety Administration. Available at www-nrd.nhtsa.dot.gov/Pubs/812037.pdf
21 Greenwell, N. K. (2015, May). Results of the national child restraint use special study (Report No. DOT HS 812 142). Washington, DC: National Highway Traffic Safety Administration. Available at www-nrd.nhtsa.dot.gov/Pubs/812142.pdf
22 Pickrell & Choi, 2014 23 Durbin, D., Elliott, M., & Winston, F. (2003). Belt-positioning booster seats and reduction in risk of
injury among children in vehicle crashes. Journal of the American Medical Association. 289 (21), pp. 2835-2840.
24 Pickrell & Choi, 2014.

Motor Vehicle Occupant Protection Facts – Children, Youth, Young Adults8
Exhibit 2 Map: Age at Which a Child Must Be in a Child Restraint or a Booster Seat26
4 and younger
5 and younger
6 and younger
7 and younger
8 and youngerHI
VT
NHMA
AK
CTRI
DE
NJMD
ME
OR
CA
MT
ID
NV
AZ
ND
SD
NE
KS
TX
NM
CO
WY
OK
UT
AR
MO
IA
WI
MN
LA
MI
IL IN
MS AL GA
FL
SC
NC
VA
PA
NY
TN
KY
OH
WVDC
WA
Only State WITHOUT a booster seat law – South Dakota; States that mandate booster seat use – all others
25 Winston, F. K., Kallan, M. K., Elliot, M. R., Xie, D., & Durbin, D. R,. (2007, March). Effect of booster seat laws on appropriate restraint use by children 4 to 7 years old involved in crashes. Archives of Pediatric and Adolescent Medicine, 161(3).
26 Insurance Institute for Highway Safety. (2015). Child safety (map taken from web page). Arlington, VA: Author. Available at www.iihs.org/iihs/topics/laws/safetybeltuse/mapchildrestraintagereq-uirements?topicName=child-safety
Closing the Gaps in Occupant Restraint Laws Can Save Young LivesEvery State except New Hampshire has adult seat belt laws, and all States have child restraint laws requiring drivers to restrain children in approved, age-appropriate child restraint devices or seat belts. In some States, though, these laws do not cover all occupants in all seating positions such as in the rear seat.
See Appendix C for information on State Restraint Laws.
A 2007 study published in the Archives of Pediatric and Ado-lescent Medicine revealed that children 4 to 7 in States with booster seat laws are 39 percent more likely to be appropriately restrained in those booster seats or child safety seats than children in States without such laws. In States with booster seat laws, children 4 and 5 years old were 23 percent more likely to
be appropriately restrained while those 6 and 7 years old were twice as likely to be in child restraints, such as booster seats, than they were in States without booster seat laws. For 6- and 7-year-olds, the effect was much stronger when the law includ-ed those age 4 to 7 than when it only included those 4 and 5 years old.25
As of 2015, there were 49 States and the District of Columbia that had enacted provisions in their child restraint laws requiring the use of booster seats or other appropriate restraint devices by children who have outgrown their forward-facing child safety seats, but who are still too small to use an adult seat belt system correctly. The only State lacking this lifesaving provision is South Dakota. See Exhibit 2 for a map of State requirements for child restraint laws.

9National Highway Traffic Safety Administration
Primary Enforcement Laws Help Protect Children of All AgesSeat belt laws have played an integral role in increasing belt use, contributing to an increase from 14 percent in 198327 to 87 percent in 2013. The extent of this effect has been in part related to the type of enforcement allowed by law (primary versus secondary). Child restraint laws are “primary” laws (laws that allow law enforcement officers to stop vehicles and issue citations for unrestrained drivers or passengers). As of July 2015, the seat belt laws in 15 States are “secondary” enforcement laws, and New Hampshire has no adult seat belt law (see Appendix C, State Restraint Laws). Secondary laws mean that police officers cannot stop drivers for the sole purpose of enforcing the use of occupant restraints. Rather, police officers can write tickets for not using occupant restraints only if they stop vehicles for other driving infractions.
Studies have also documented that primary enforcement seat belt laws are more effective in increasing seat belt use. For instance, data from the 2014 NOPUS study showed that the seat belt use rate was 11 percentage points lower in secondary law States compared to primary law States (79% versus 90% respectively).28
As previously mentioned, studies have shown that drivers who use seat belts are more likely to buckle up the children they transport. For this reason, it is hypothesized that primary laws may also indirectly increase child passenger restraint use.29
Primary laws permit a law enforcement officer to stop a vehicle and issue a citation for a seat belt violation, even if this is the only violation the officer notices. A secondary law allows officers to issue seat belt citations to motorists only after they stop the drivers for other violations.
27 Nichols, J., Tippetts, A., Fell, J., Auld-Owens, A., Wiliszowski, C., Haseltine, P., & Eichelberger, A. (2010, November). Strategies to increase seat belt use: an analysis of levels of fines and the type of law (Report No. DOT HS 811 413). Washington, DC: National Highway Traffic Safety Administration. Available at www.nhtsa.gov/staticfiles/nti/occupant_protection/pdf/811413.pdf
28 Pickrell, T. M., & Liu, C. (2015b, February). Seat belt use in 2014 – Overall results. (Traffic Safety Facts Research Note. Report No. DOT HS 812 113). Washington, DC: National Highway Traffic Safety Administration.
29 Durbin, D., Smith, R., Kallan, M., Elliott, M., & Winston, F. (2006). Seat belt use among 13-15-year-olds in primary and secondary enforcement law States. Accident Analysis and Prevention;39, 524-529.
In 2013, seat belts saved an estimated 12,584 lives among passenger vehicle occupants over 4 years old.

Motor Vehicle Occupant Protection Facts – Children, Youth, Young Adults10
On average, 3 children were killed and 470 children were injured every day in traffic crashes in 2013.30
Facts About Restraint UseAs stated earlier, in 2013 the use of child restraints saved the lives of an estimated 263 children under age 5. From 1975 through 2013, an estimated 10,421 lives of children from birth to age 4 were saved by the use of occupant restraints including child safety seats and seat belts.31
During 2013 a total of 884 children and youth from birth to age 15 were killed in passenger vehicle crashes. Forty-four percent of child fatalities with known restraint use were unrestrained. Among occupants with known restraint use, the breakdown by age group is:
• 31 percent of children from birth to 4 were unrestrained;
• 41 percent of children 5 to 7 were unrestrained;
• 45 percent of children 8 to 12 were unrestrained; and
• 61 percent of children 13 to 15 were unrestrained.
Chart 6 shows data on the use and nonuse of occupant restraints among those killed in passenger vehicle crashes in 2013 with known restraint use. Note that most occupants between the ages of 13 and 20 who were killed were not restrained. Unfortunately, being properly restrained cannot prevent all passengers from being fatally injured, especially in some kinds of high-impact crashes. However, a number of occupants in all age groups would not have been killed had they been properly restrained.
As children get older, they are less likely to be properly restrained (when compared to the <5 age group). This decrease illustrates the critical need for public information and education about the importance of restraint use, along with the need for ongoing enforcement of existing laws.
Chart 6 Passenger Vehicle Occupant Fatalities in 2013By Age and Restraint Use (when known)
Age Percent Restrained
Percent Unrestrained
<5 69 31
5–7 59 41
8–12 55 45
13–15 39 61
16–20 45 55
21–24 39 61
25–44 40 60
45–64 54 46
65–74 66 33
75+ 74 26
Total 69 31
When viewing the chart, keep in mind that even with the use of occupant restraints:
• Some crashes are so severe that some occupants do not survive even when properly protected by child safety seats, booster seats, or seat belts.
• There are instances in which the effectiveness of a child restraint or seat belt is compromised by incorrect use, such as improper installation or use of a child safety seat, or plac-ing a child in a seat belt designed for an adult.
• Occupants in the youngest age group, 4 and under, and the oldest age group, 65 and older, are more fragile. Therefore, they are more vulnerable to death or serious injury during a crash.
• In recent years, every State except South Dakota has strengthened its child restraint law to require the use of appropriate child restraint devices (often specifically defined as booster seats) by children who have outgrown their car seats but who do not yet fit properly in adult seat belt systems. In spite of this, according to the 2013 NSUBS report, only 46 percent of 4- to 7-year-old children were restrained in booster seats in 2013. As a result, many children are inap-propriately placed in adult belts, or worse, allowed to ride completely unrestrained.32
FACTS ABOUT CHILDREN AND YOUTH
30 NCSA, 2015a.31 NCSA, 2015c.32 Pickrell & Choi (2014)

11National Highway Traffic Safety Administration
Chart 7 Occupants Injured in Passenger Vehicles in 2013 by Age and Injury Severity
Age Groups
Injury Severity
Injured, Incapacitating Injured, Non-incapacitating Injured, Other* Total
Count Percent Count Percent Count Percent Count
<5 1,000 2% 10,000 22% 34,000 76% 45,000
5-7 1,000 3% 10,000 30% 22,000 67% 33,000
8-12 2,000 4% 12,000 24% 35,000 71% 49,000
13-15 1,000 3% 10,000 28% 25,000 69% 36,000
16-20 15,000 6% 82,000 32% 160,000 62% 258,000
21-24 17,000 7% 68,000 29% 148,000 64% 232,000
25-44 40,000 6% 182,000 27% 459,000 68% 680,000
45-64 28,000 5% 133,000 26% 349,000 68% 510,000
65-74 8,000 7% 31,000 26% 81,000 68% 120,000
75+ 6,000 7% 25,000 30% 52,000 63% 83,000
Total 119,000 6% 563,000 28% 1,365,000 67% 2,046,000
*Injured Other includes possible injuries and severity unknown.
Facts About Motor-Vehicle-Related Deaths and Injuries• Based on the 10-year period between 2004 and 2013 an
average of 1,228 children from birth to age 15 died and approximately 186,000 were injured in passenger vehicle crashes each year.
• Every day in the United States in 2013, an average of 3 chil-dren younger than 15 were killed and an estimated 470 were injured in motor vehicle crashes.
• In 2013 a total of 884 children 15 and younger were killed and an estimated 163,000 were injured in passenger vehicle crashes. Approximately 3 percent of these injured occupants had incapacitating injuries.
• In 2013 there were:
» 278 crash fatalities and an estimated 45,000 injured among children 5 and under;
» 135 crash fatalities and an estimated 33,000 occupants injured among children 5 to 7;
» 225 crash fatalities and an estimated 49,000 occupants injured among children 8 to 12; and
» 246 crash fatalities and an estimated 36,000 occupants injured among children 13 to 15.
Chart 7 further highlights facts about injury severity.

Motor Vehicle Occupant Protection Facts – Children, Youth, Young Adults12
In 2013, young drivers 16 to 20 made up 5.76 percent (12.2 million) of the 212 million licensed drivers in the United States. This age group is generally just getting their licenses and
many are under a graduated drivers licensing program as they learn driving skills.33 Each year at least 2 million people—mostly teenagers—begin driving. At the same time, motor vehicle crashes kill more young adults than any other cause.34
A significant percentage of young drivers are involved in traffic crashes, and they are twice as likely as adult drivers to be in fatal crashes. Sixteen-year-old drivers have crash rates that are three times greater than 17-year-olds, five times greater than 18-year-olds, and twice the rate of 85-year-old drivers. The factors contributing to these higher crash rates include a lack of driving experience and inadequate driving skills; excessive driving during night-time; risk-taking behavior; poor driving judgment and decision making skills; drinking and driving; and distractions from teenage passengers.35
In addition to the disproportionate harm teen drivers experience from motor vehicle crashes, consider the following:
• Motor vehicle crashes are the leading cause of death for young adults 16 to 20.
• More young adults 16 to 20 are killed or injured in motor vehicle crashes than children 15 and under. In 2013, of the 3,208 young people from birth to age 20 killed in traffic crashes, 72 percent were 16 to 20 years old. Of the estimat-ed 421,000 young people who were injured in crashes, 61 percent were 16 to 20 years old. (See Chart 8.)
• Driver fatalities for 16- to 20-year-olds decreased by 57 per-cent between 2004 and 2013, dropping from 3,176 in 2004 to 1,373 in 2013.
• During 2013 almost half of the young passenger vehicle occupants (16 to 20) died in weekend (6 p.m. Friday to 5:59 a.m. Monday) traffic crashes.
• In 2013 a total of 742 young people 16 to 20 years old died when they were totally or partially ejected from passenger vehicles.
FACTS ABOUT YOUNG ADULTS (AGES 16 TO 20)
33 NCSA, 2015b.34 Opiela, K. S., Sant,B.M., & Childers, J. A. (2006, September/October). Turning young drivers into
survivors. In Public Roads, Vol. 70, No. 2, pp. 12-17. (Web Page, Publication No. FHWA-HRT-2006-006). Washington, DC: Federal Highway Administration. Available at www.fhwa.dot.gov/publications/publicroads/06sep/03.cfm
35 National Highway Traffic Safety Administration. (2008, January). Graduated Drivers Licensing System. (Traffic Safety Facts: Laws. Report No. DOT HS 810 888W). Washington, DC: Author.

13National Highway Traffic Safety Administration
• Although young drivers make up about 6 percent of the total licensed driving population, 10 percent (3,537) of all drivers involved in fatal crashes were young drivers 16 to 20 years old, and 12 percent (169,000) of all drivers involved in injury crashes were young drivers.
• In 2013, 16-to 20-year-old drivers had some of the highest fatality rates per 100,000 licensed drivers. In fact, the fatality rate for young drivers (11.24) was significantly higher than the rate for drivers of all ages (7.27). (See Chart 9.)
Chart 8 Percentage of All Occupants From Birth to Age 20 Killed or Injured in 2013By Age, in Passenger Vehicles
11%
8%
12%
9%
61%
INJURED
9%
4%
7%
8%
72%
KILLED
<5
5-7
8-12
13-15
16-20
Age Group
Chart 9 Driver Fatality Rates per 100,000 Licensed Drivers in 2013By Age, in Passenger Vehicles
10
5
0
15
Driv
er F
atal
ity R
ate
Per 1
00,0
00 L
icen
sed
Driv
ers
All ages16-20
• In 2013 an estimated 15,000 people 16 to 20 years old experienced incapacitating injuries. This number represents nearly 13 percent (119,000) of all incapacitating injuries from traffic crashes.
• In 2013 an estimated 125,000 young adults experienced non-incapacitating injuries. This number represents about 22 percent (563,000) of all people with non-incapacitating injuries from traffic crashes.
• Male and female drivers 16 to 20 have some of the highest involvement rates for fatalities and injuries (per 100,000 licensed drivers) in passenger vehicle crashes. (See Charts 10 and 11.)

Motor Vehicle Occupant Protection Facts – Children, Youth, Young Adults14
Chart 10 Driver Fatality Rates per 100,000 Licensed Drivers in 2013By Age and Gender, in Passenger Vehicles
16-20
Age Group
21-24 25-44 45-64 65-74 75+
Driv
er F
atal
ity R
ate
Per 1
00,0
00 L
icen
sed
Driv
ers
20
15
10
5
0
FEMALEMALE
Chart 11 Driver Injury Rates per 100,000 Licensed Drivers in 2013By Age and Gender, in Passenger Vehicles
16-20
Age Group
21-24 25-44 45-64 65-74 75+
Driv
er In
jury
Rat
ePe
r 100
,000
Lic
ense
d D
river
s
2,000
1,500
1,000
500
0
FEMALEMALE
Young Adults and Seat Belt Use• Fifty-five percent of the passenger vehicle occupants age 16
to 20 who were killed in 2013 were not wearing seat belts.
• Despite an improvement in seat belt use for 16- to 20-year-old drivers, the percentage of driver fatalities in which the drivers were not wearing seat belts has averaged over 55 percent for the past 10 years. (See Chart 12.)
• Drivers are less likely to use restraints when they have been drinking. In 2013, about 46 percent of the young drivers of passenger vehicles involved in fatal crashes who had been drinking were unrestrained. Of the young drivers (16 to 20) who had been drinking and were killed in crashes, 65 percent were unrestrained.36
Chart 12 Driver Fatalities, 16- to 20-Year-Olds, by Restraint Use When Known, 2004-2013
Year
Perc
ent
40
60
80
100
20
02004 2005 2006 2007 2008 2009 2010 2011 2012 2013
UNRESTRAINEDRESTRAINED
36 Data 2013, Washington DC: National Highway Traffic Safety Administration

15National Highway Traffic Safety Administration
SELF-REPORTED BEHAVIOR, ATTITUDES, AND OPINIONS ON SEAT BELT USE
The following information was reported in the 2007 Motor Vehicle Occupant Safety Survey (MVOSS report).37 This telephone survey was administered to a randomly select-
ed national sample of 6,000 people 16 and older (with younger ages over-sampled).
Seat Belt Use Behavior• Eighty-two percent of 16- to 20-year-olds reported they wear
their seat belts all the time. About 11 percent reported that they wear their seat belts most of the time.
• Most drivers (89%) reported that when they were riding as passengers, they usually rode in the front seat. However, only 58 percent said they always wore seat belts when riding in the back seat, while 11 percent said they never wore their seat belts when riding in the back seat.
Attitudes Toward Seat Belt Use• Among people 16 to 24, 62 percent strongly agreed and 18
percent somewhat agreed (80 percent when combined) with the statement, “I have a habit of wearing a seat belt because my parents insisted I wear them when I was a child.”
• The number dropped to 59 percent among people 25 to 34 and to 33 percent among people 35 to 44, reflecting the lower usage rates during their childhood years.
• The vast majority of 16- to 20-year-olds (94%) either strongly agreed or somewhat agreed with the statement, “If I were in an accident, I would want to have my seat belt on.” However, about one-half (44%) of 16- to 20-year-olds also agreed with the statement, “Seat belts are just as likely to harm you as help you.”
• Twenty-seven percent of 16- to 20-year-olds agreed with the statement, “I would feel self-conscious around my friends if I wore a seat belt and they did not.”
• Avoiding serious injury was the most frequent reason given for wearing a seat belt.
• The most common reasons given by drivers in the 16-to-20 age group for not wearing seat belts were that they forgot (68%) or were driving a short distance (61%).
• Twenty-eight percent of 16- to 20-year-olds agreed with the statement that a crash close to home was usually not as serious, and 26 percent agreed that putting on a seat belt makes them worry more about being in a crash.
Opinions About Seat Belt Use Laws• When asked how they felt about laws that require drivers
and front-seat passengers to wear seat belts, 80 percent of 16- to 20 year-olds said they favor them.
• Many (68%) 16- to 20-year-olds answered “yes” when asked whether police should be allowed to stop vehicles if they observe seat belt violations when no other traffic laws are being broken.
• Many (70%) 16- to 20-year-olds favored fines for drivers who do not wear seat belts.
• About 41 percent of 16- to 20-year-olds favored points against a license as a penalty for seat belt violations.
Teens and Distraction • Ten percent of all drivers 15 to 19 years old involved in fatal
crashes were reported as distracted at the time of the crash. This age group has the largest proportion of drivers who were distracted at the time of the crashes. 38
• There were 244 teens 15 to 19 years old killed in distrac-tion-affected crashes in 2013.39
• The risk of a crash or near-crash among novice drivers increases with the performance of many secondary tasks, including texting and dialing cell phones.40
• Compared to their parents, teens 16 to 18 reported signifi-cantly more frequent involvement in reading or sending a text message, using an electronic device for music, checking the internet or social media, and looking for something in the vehicle.41
• Twenty percent of teens admit that they have extended multi-message text conversations while driving.42
• About 20 percent of young drivers 18 to 20 years old thought sending text messages or e-mails made no difference on their driving, compared to 27-29 percent for drivers 21 to 34.43
37 Boyle & Lampkin (2008) 38 National Center for Statistics and Analysis. (2015d, April). Distracted Driving 2013. (Traffic Safety Facts
Research Note, DOT HS 812 132)., Washington, DC: National Highway Traffic Safety Administration. Available at www.distraction.gov/downloads/pdfs/Distracted_Driving_2013_Research_note.pdf
39 NCSA, 2015d.40 Klauer, S. G., Guo, F., Simons-Morton, B.G., Ouimet, M. C., Lee, S. E., & Dingus, T. A. (2014). Distracted
driving and risk of road crashes among novice and experienced drivers. New England Journal of Medicine; 370:pp. 54-59
41 Bingham, C. R., Zakrajsek, J. S., Almani, F., Shope, J. T. & Sayer, T. B. (2015). Do as I say, not as I do: Distracted driving behavior of teens and their parents. Journal of Safety Research; 55 pp. 21-29.
42 Toyota Motor Sales, USA (2012, November 27). Teen Driver Distraction Study Release. (Web page press release from Toyota Collaborative Safety Research Center about an UMTRI report). Retrieved from the Toyota website at www.toyota.com/csrc/teen-driver-distraction-study-release.html
43 National Highway Traffic Safety Administration. (2012, April). Young drivers report the highest level of phone involvement in crash or near-crash incidences. (Traffic Safety Facts Research Note,. Report No. DOT HS 811 611). Washington, DC: Author. Available at http://www.distraction.gov/downloads/pdfs/traffic-safety-facts-04-2012.pdf

Motor Vehicle Occupant Protection Facts – Children, Youth, Young Adults16
APPENDICES
Appendix APeople Killed in Passenger Vehicle Crashes, by State and Age Group, 2013
Appendix BPeople Killed in Passenger Vehicle Crashes, by State and Restraint Use, 2013
Appendix CState Restraint Laws
The most common reasons given by drivers in the 16-to-20 age group for not wearing seat belts were that they forgot or were driving a short distance.

17National Highway Traffic Safety Administration
APPENDIX A
Passenger Vehicle Occupant Fatalities, by State and Age Group, 2013
State Age Group Total<5 5-7 8-12 13-15 16-20 21-24 25-44 45-64 65-74 75+ Unknown
Alabama 16 6 10 10 68 73 237 157 38 49 1 665Alaska 0 0 0 0 4 3 11 6 2 1 0 27Arizona 9 4 10 8 43 39 124 115 48 50 1 451Arkansas 6 4 8 3 36 27 112 78 30 36 0 340California 14 14 21 15 191 244 510 351 113 137 1 1,611Colorado 8 3 3 4 44 31 92 81 24 27 0 317Connecticut 3 1 1 2 26 23 65 31 11 18 1 182Delaware 1 1 0 0 3 4 15 15 3 8 0 50Dist of Columbia 0 0 0 0 0 1 4 0 0 1 0 6Florida 8 8 18 7 111 146 361 292 105 160 2 1,218Georgia 14 5 8 12 96 75 245 204 75 76 1 811Hawaii 2 0 1 1 6 6 12 9 2 3 0 42Idaho 2 1 4 1 23 21 39 42 15 11 0 159Illinois 8 2 7 7 76 65 190 165 52 78 0 650Indiana 10 3 6 6 69 64 166 123 34 63 0 544Iowa 2 1 1 3 25 36 58 56 21 34 0 237Kansas 4 2 2 5 31 31 74 49 23 44 0 265Kentucky 2 2 5 4 38 37 134 139 51 53 0 465Louisiana 6 3 4 6 46 50 168 124 36 32 1 476Maine 1 0 0 1 15 10 25 29 15 16 0 112Maryland 6 4 1 5 32 31 73 80 24 22 1 279Massachusetts 3 0 0 0 25 34 52 36 22 34 0 206Michigan 7 1 6 10 69 57 153 143 62 93 0 601Minnesota 3 4 1 5 25 25 73 57 27 39 0 259Mississippi 6 3 6 1 54 40 149 156 33 41 0 489Missouri 3 3 11 10 85 61 165 112 44 65 0 559Montana 1 3 0 2 17 24 50 31 16 17 0 161Nebraska 1 0 3 8 25 24 50 41 8 9 0 169Nevada 2 0 1 3 9 14 42 30 12 10 0 123New Hampshire 0 0 0 0 8 12 26 21 12 12 0 91New Jersey 5 1 3 3 23 36 97 65 39 57 0 329New Mexico 6 2 1 4 29 22 54 47 9 14 0 188New York 10 3 1 2 82 71 158 130 59 95 3 614North Carolina 15 5 9 10 79 100 258 219 91 85 0 871North Dakota 2 0 0 1 11 15 45 30 6 2 0 112Ohio 6 3 8 9 70 68 208 190 56 81 0 699Oklahoma 10 5 8 11 43 44 147 121 39 46 0 474Oregon 0 0 3 2 23 18 68 56 23 23 0 216Pennsylvania 10 6 5 4 81 100 210 202 61 119 1 799Rhode Island 0 0 0 0 5 7 6 4 3 12 0 37South Carolina 4 1 3 3 53 59 163 124 39 39 0 488South Dakota 0 0 0 2 8 10 34 22 12 12 0 100Tennessee 7 4 9 5 64 75 234 168 78 75 0 719Texas 40 18 21 33 268 290 714 496 154 168 3 2,205Utah 3 0 1 0 14 12 38 37 16 19 0 140Vermont 0 0 0 0 6 8 8 15 3 11 0 51Virginia 2 2 5 2 54 63 174 128 62 57 0 549Washington 2 1 3 7 46 36 75 66 18 33 0 287West Virginia 3 3 3 4 26 23 69 72 22 22 0 247Wisconsin 2 3 3 1 29 45 129 82 33 49 0 376Wyoming 3 0 1 4 10 5 26 12 1 4 0 66National 278 135 225 246 2,324 2,415 6,390 5,059 1,782 2,262 16 21,132Puerto Rico 1 0 0 3 22 21 57 46 15 19 6 190
Note: Passenger vehicles include passenger cars, SUVs, pickup trucks, vans, and other light trucks
Motor Vehicle Occupant Protection Facts – Children, Youth, Young Adults18
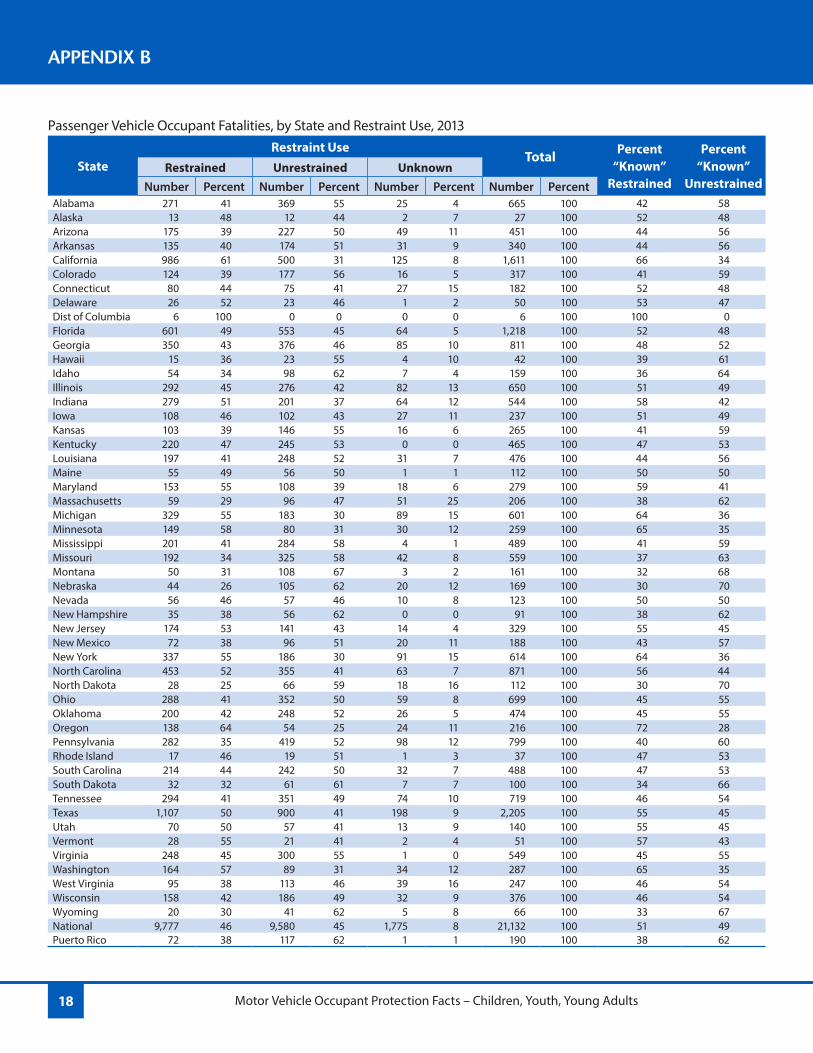
APPENDIX B
Passenger Vehicle Occupant Fatalities, by State and Restraint Use, 2013
StateRestraint Use
Total Percent “Known”
Restrained
Percent “Known”
UnrestrainedRestrained Unrestrained Unknown
Number Percent Number Percent Number Percent Number PercentAlabama 271 41 369 55 25 4 665 100 42 58Alaska 13 48 12 44 2 7 27 100 52 48Arizona 175 39 227 50 49 11 451 100 44 56Arkansas 135 40 174 51 31 9 340 100 44 56California 986 61 500 31 125 8 1,611 100 66 34Colorado 124 39 177 56 16 5 317 100 41 59Connecticut 80 44 75 41 27 15 182 100 52 48Delaware 26 52 23 46 1 2 50 100 53 47Dist of Columbia 6 100 0 0 0 0 6 100 100 0Florida 601 49 553 45 64 5 1,218 100 52 48Georgia 350 43 376 46 85 10 811 100 48 52Hawaii 15 36 23 55 4 10 42 100 39 61Idaho 54 34 98 62 7 4 159 100 36 64Illinois 292 45 276 42 82 13 650 100 51 49Indiana 279 51 201 37 64 12 544 100 58 42Iowa 108 46 102 43 27 11 237 100 51 49Kansas 103 39 146 55 16 6 265 100 41 59Kentucky 220 47 245 53 0 0 465 100 47 53Louisiana 197 41 248 52 31 7 476 100 44 56Maine 55 49 56 50 1 1 112 100 50 50Maryland 153 55 108 39 18 6 279 100 59 41Massachusetts 59 29 96 47 51 25 206 100 38 62Michigan 329 55 183 30 89 15 601 100 64 36Minnesota 149 58 80 31 30 12 259 100 65 35Mississippi 201 41 284 58 4 1 489 100 41 59Missouri 192 34 325 58 42 8 559 100 37 63Montana 50 31 108 67 3 2 161 100 32 68Nebraska 44 26 105 62 20 12 169 100 30 70Nevada 56 46 57 46 10 8 123 100 50 50New Hampshire 35 38 56 62 0 0 91 100 38 62New Jersey 174 53 141 43 14 4 329 100 55 45New Mexico 72 38 96 51 20 11 188 100 43 57New York 337 55 186 30 91 15 614 100 64 36North Carolina 453 52 355 41 63 7 871 100 56 44North Dakota 28 25 66 59 18 16 112 100 30 70Ohio 288 41 352 50 59 8 699 100 45 55Oklahoma 200 42 248 52 26 5 474 100 45 55Oregon 138 64 54 25 24 11 216 100 72 28Pennsylvania 282 35 419 52 98 12 799 100 40 60Rhode Island 17 46 19 51 1 3 37 100 47 53South Carolina 214 44 242 50 32 7 488 100 47 53South Dakota 32 32 61 61 7 7 100 100 34 66Tennessee 294 41 351 49 74 10 719 100 46 54Texas 1,107 50 900 41 198 9 2,205 100 55 45Utah 70 50 57 41 13 9 140 100 55 45Vermont 28 55 21 41 2 4 51 100 57 43Virginia 248 45 300 55 1 0 549 100 45 55Washington 164 57 89 31 34 12 287 100 65 35West Virginia 95 38 113 46 39 16 247 100 46 54Wisconsin 158 42 186 49 32 9 376 100 46 54Wyoming 20 30 41 62 5 8 66 100 33 67National 9,777 46 9,580 45 1,775 8 21,132 100 51 49Puerto Rico 72 38 117 62 1 1 190 100 38 62

19National Highway Traffic Safety Administration
APPENDIX C
State Restraint LawsThe first mandatory child restraint use law was implemented in Tennessee in 1978. Since 1985, all 50 States and the District of Columbia have had child restraint use laws in effect. However, these laws differ in terms of the ages of children covered, as well as in other important ways, including height and weight lim-its, seating position requirements and the presence of varying exemptions and exceptions.
The first mandatory belt use law was enacted in New York in 1984. Adult belt use laws are now in effect in 49 States, the District of Columbia, and Puerto Rico. The laws differ from State to State, according to the type and age of the vehicle, occupant age and seating position, etc. The goal of these laws is to pro-mote belt use and thereby reduce deaths and injuries in motor vehicle crashes.
As of July 2015, there were 34 States, the District of Columbia and Puerto Rico that have primary seat belt laws, enabling law enforcement officers to stop vehicles and write citations when they observe violations of the seat belt law. In 15 States, the law specifies secondary enforcement, meaning that police officers are permitted to write a citation only after a vehicle is stopped for some other traffic infraction. New Hampshire is the only State without a seat belt law for adults, although it does have a primary child passenger safety law that covers all drivers and passengers under 18.
The most current information on seat belt laws and child pas-senger safety laws is available at the Governors’ Highway Safety Association’s website.
For seat belt laws www.ghsa.org/html/stateinfo/laws/seatbelt_laws.html
For child passenger safety laws www.ghsa.org/html/stateinfo/laws/childsafety_laws.html

Motor Vehicle Occupant Protection Facts – Children, Youth, Young Adults20
National Highway Traffic Safety Administration1200 New Jersey Avenue SE. Washington, DC 20590888-327-4236Hearing Impaired TTY: 800-424-9153www.nhtsa.gov
National Transportation Safety Board490 L’Enfant Plaza SW Washington, DC 20594202-314-6000www.ntsb.gov
Governors Highway Safety Association444 N. Capitol St. NW., Suite 722Washington, DC 20001202-789-0942Fax: 202-789-0946www.ghsa.org
National Safety Council1121 Spring Lake DriveItasca, IL 60143-3201630-285-1121www.nsc.org
AAA Foundation for Traffic Safety607 14th Street NW, Suite 201Washington, DC 20005202-638-5944www.aaafoundation.org/home
Insurance Institute for Highway Safety1005 North Glebe Road, Suite 800 Arlington, Virginia 22201703-247-1500Fax: 703-247-1588www.iihs.org
Safe Kids Worldwide1301 Pennsylvania Avenue NW., Suite 1000Washington, DC 20004-1707202-662-0600www.safekids.org
Advocates for Highway and Auto Safety750 First Street NESuite 1130Washington, DC 20002202-408-1711Fax: 202-408-1699www.saferoads.org
Children’s Hospital of Philadelphia – Research InstituteCenter for Injury Research and Prevention 34th Street and Civic Center Blvd. Philadelphia, PA 19104215-590-1000http://injury.research.chop.edu/
Automotive Safety Program at Indiana University School of Medicine Affiliated with Riley Hospital for Children 1130 West Michigan Fesler Hall Room 207 Indianapolis, IN 46202Local tel: 317-274-2977Tel: 1-800-543-6227Fax: 317-274-6710www.preventinjury.org
FOR ADDITIONAL INFORMATION
This page lists organizations and agencies that have additional information on occupant restraint use and other occupant protection issues.


Motor Vehicle Occupant Protection Facts – Children, Youth, Young Adults22
Page intentionally left blank.


DOT HS 812 251March 2016
11313-030116-v6