child nutrition (rationale for raising school meal prices) cambrian school district
TRANSCRIPT
CHILD NUTRITION(RATIONALE FOR RAISING SCHOOL MEAL PRICES) CAMBRIAN SCHOOL DISTRICT
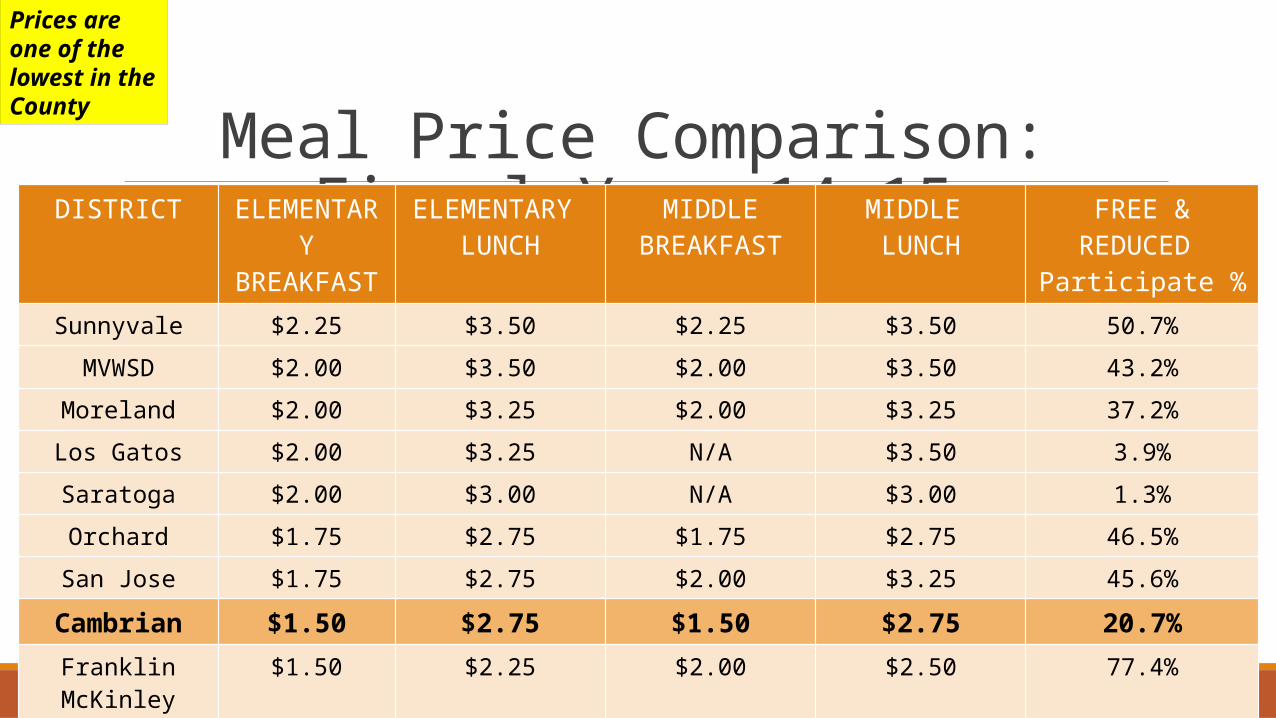
Meal Price Comparison: Fiscal Year 14-15DISTRICT ELEMENTARY
BREAKFASTELEMENTARY
LUNCHMIDDLE
BREAKFASTMIDDLE LUNCH
FREE &REDUCED
Participate %Sunnyvale $2.25 $3.50 $2.25 $3.50 50.7%
MVWSD $2.00 $3.50 $2.00 $3.50 43.2%
Moreland $2.00 $3.25 $2.00 $3.25 37.2%
Los Gatos $2.00 $3.25 N/A $3.50 3.9%
Saratoga $2.00 $3.00 N/A $3.00 1.3%
Orchard $1.75 $2.75 $1.75 $2.75 46.5%
San Jose $1.75 $2.75 $2.00 $3.25 45.6%
Cambrian $1.50 $2.75 $1.50 $2.75 20.7%Franklin McKinley $1.50 $2.25 $2.00 $2.50 77.4%
Gilroy $1.25 $2.40 $1.50 $2.65 64.1%
Prices are one of the lowest in the County
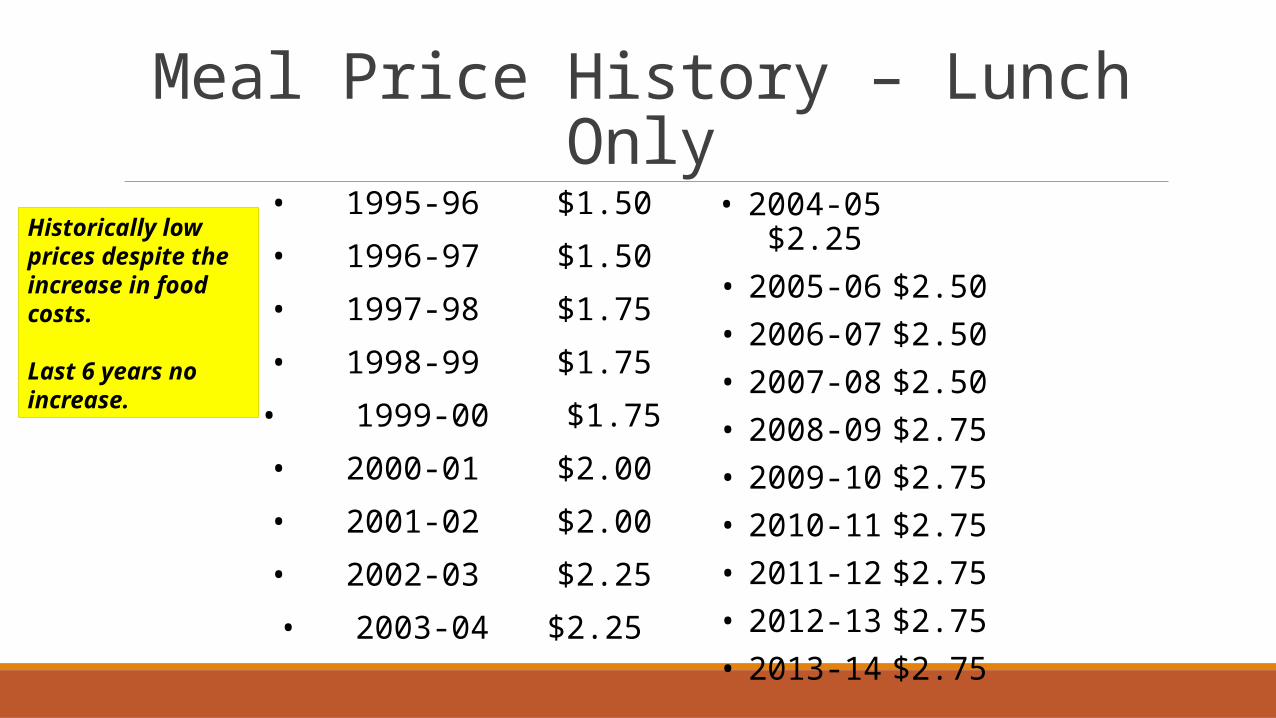
Meal Price History – Lunch Only• 1995-96 $1.50
• 1996-97 $1.50
• 1997-98 $1.75
• 1998-99 $1.75
• 1999-00 $1.75
• 2000-01 $2.00
• 2001-02 $2.00
• 2002-03 $2.25
• 2003-04 $2.25
• 2004-05 $2.25
• 2005-06 $2.50• 2006-07 $2.50• 2007-08 $2.50• 2008-09 $2.75• 2009-10 $2.75• 2010-11 $2.75• 2011-12 $2.75• 2012-13 $2.75• 2013-14 $2.75
Historically low prices despite the increase in food costs.
Last 6 years no increase.
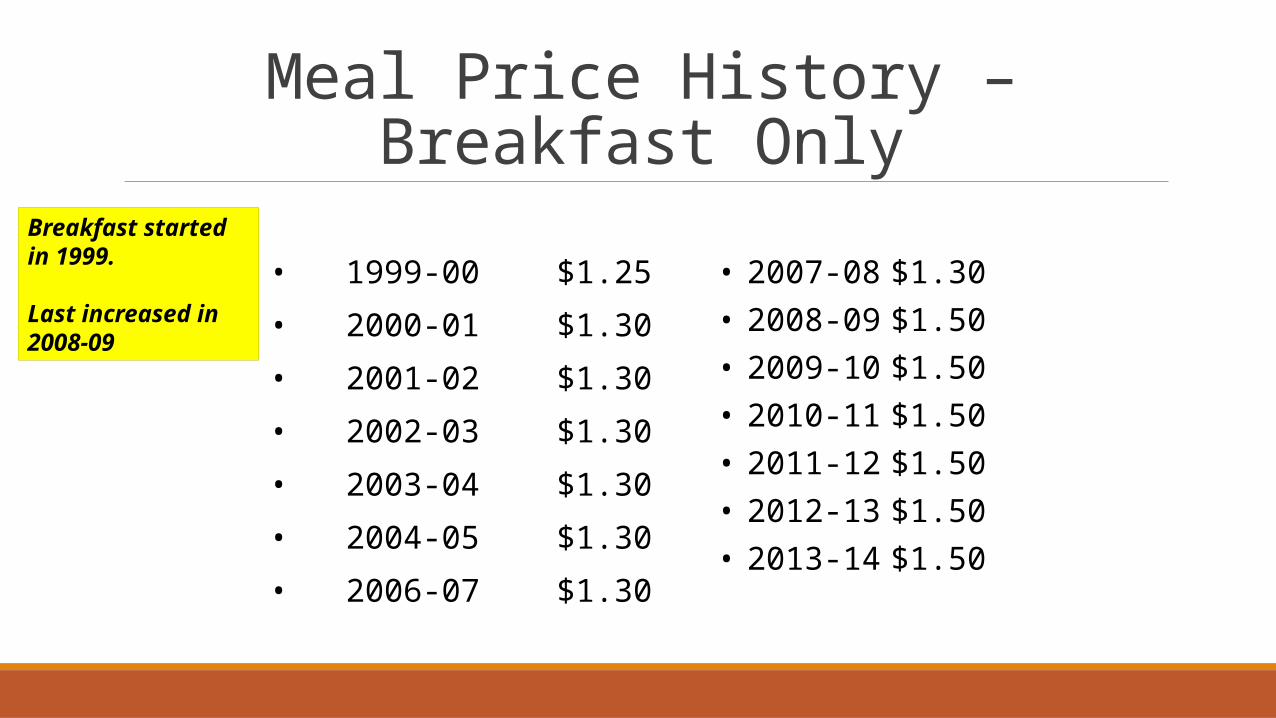
Meal Price History – Breakfast Only
• 1999-00 $1.25
• 2000-01 $1.30
• 2001-02 $1.30
• 2002-03 $1.30
• 2003-04 $1.30
• 2004-05 $1.30
• 2006-07 $1.30
• 2007-08 $1.30• 2008-09 $1.50• 2009-10 $1.50• 2010-11 $1.50• 2011-12 $1.50• 2012-13 $1.50• 2013-14 $1.50
Breakfast started in 1999.
Last increased in 2008-09
Previous Steps to Increase Revenues
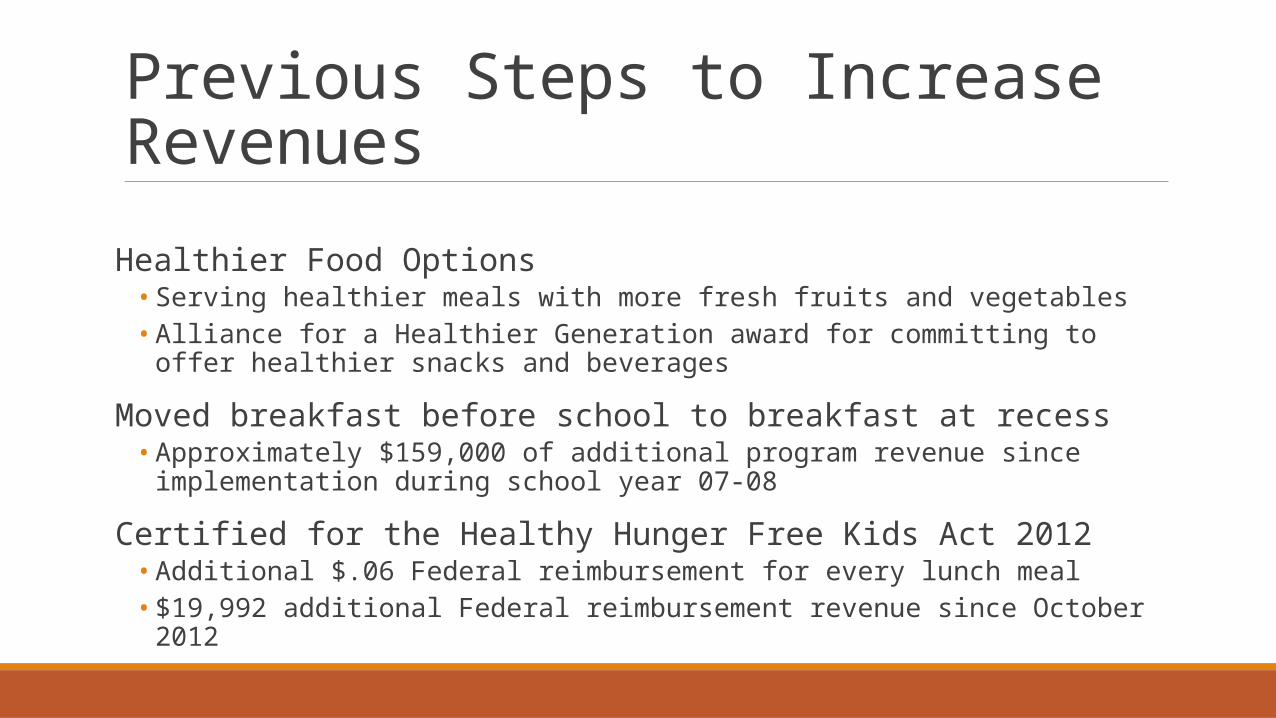
Healthier Food Options• Serving healthier meals with more fresh fruits and vegetables• Alliance for a Healthier Generation award for committing to offer healthier snacks and
beverages
Moved breakfast before school to breakfast at recess• Approximately $159,000 of additional program revenue since implementation during school
year 07-08
Certified for the Healthy Hunger Free Kids Act 2012• Additional $.06 Federal reimbursement for every lunch meal• $19,992 additional Federal reimbursement revenue since October 2012
Previous Steps to Increase Revenues
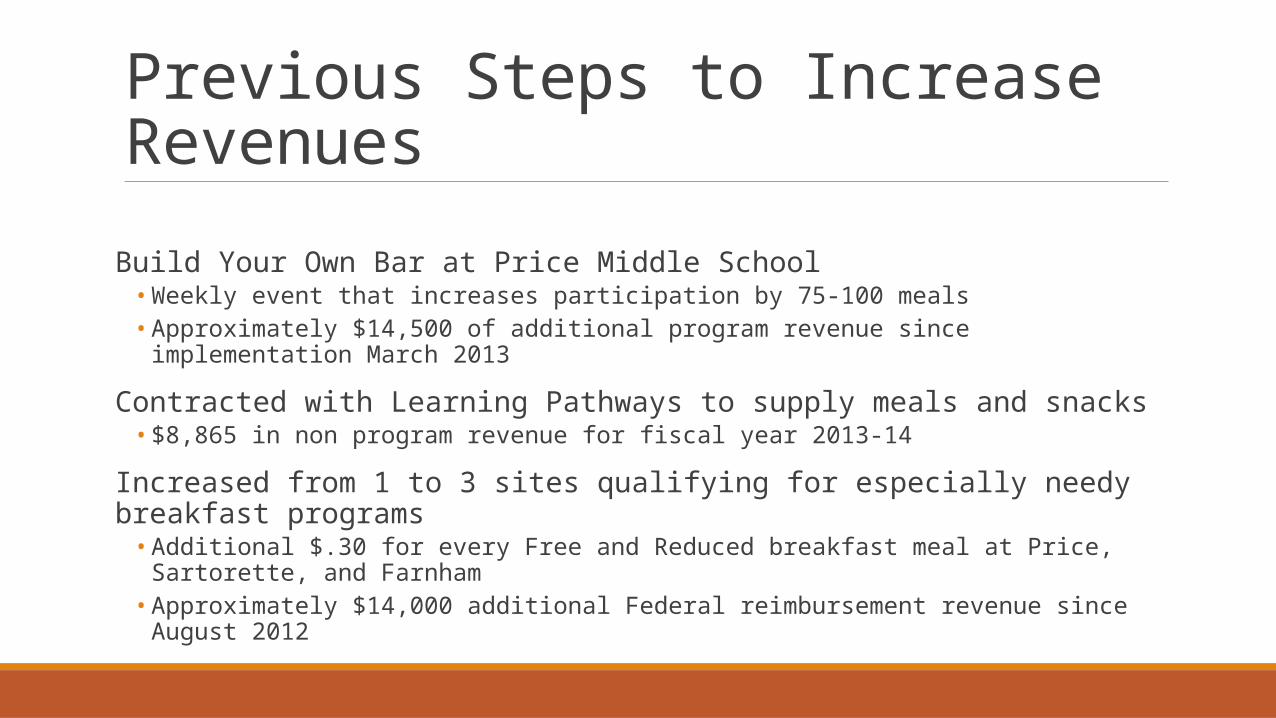
Build Your Own Bar at Price Middle School• Weekly event that increases participation by 75-100 meals• Approximately $14,500 of additional program revenue since implementation March 2013
Contracted with Learning Pathways to supply meals and snacks• $8,865 in non program revenue for fiscal year 2013-14
Increased from 1 to 3 sites qualifying for especially needy breakfast programs• Additional $.30 for every Free and Reduced breakfast meal at Price, Sartorette, and Farnham• Approximately $14,000 additional Federal reimbursement revenue since August 2012
Cost Saving Measures Over the Years
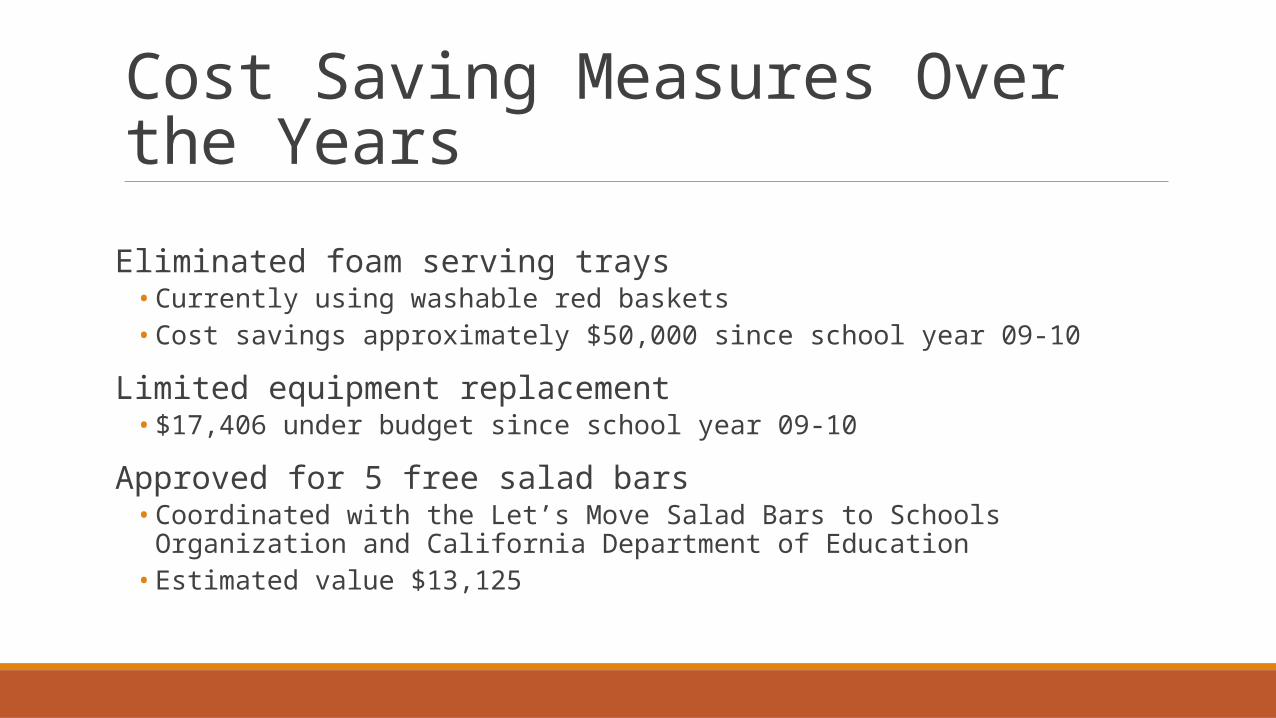
Eliminated foam serving trays • Currently using washable red baskets• Cost savings approximately $50,000 since school year 09-10
Limited equipment replacement• $17,406 under budget since school year 09-10
Approved for 5 free salad bars• Coordinated with the Let’s Move Salad Bars to Schools Organization and California
Department of Education• Estimated value $13,125
Cost Saving Measures Over the Years
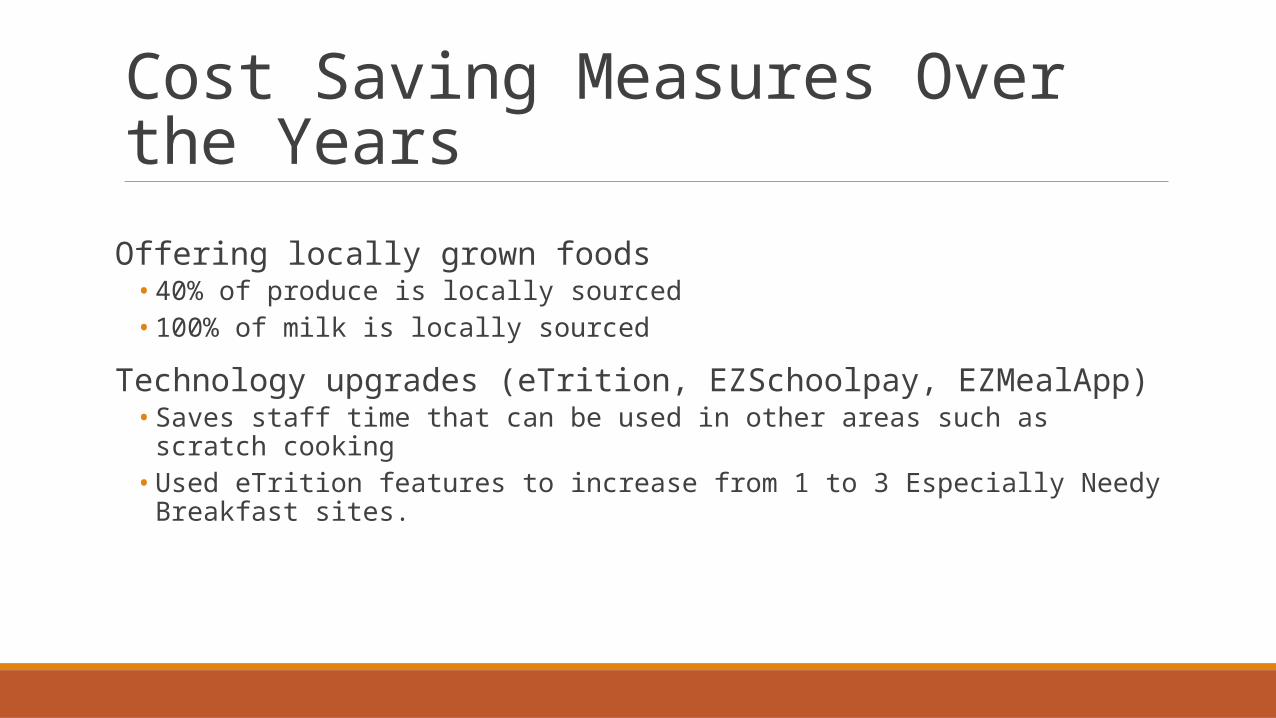
Offering locally grown foods• 40% of produce is locally sourced• 100% of milk is locally sourced
Technology upgrades (eTrition, EZSchoolpay, EZMealApp)• Saves staff time that can be used in other areas such as scratch cooking• Used eTrition features to increase from 1 to 3 Especially Needy Breakfast sites.
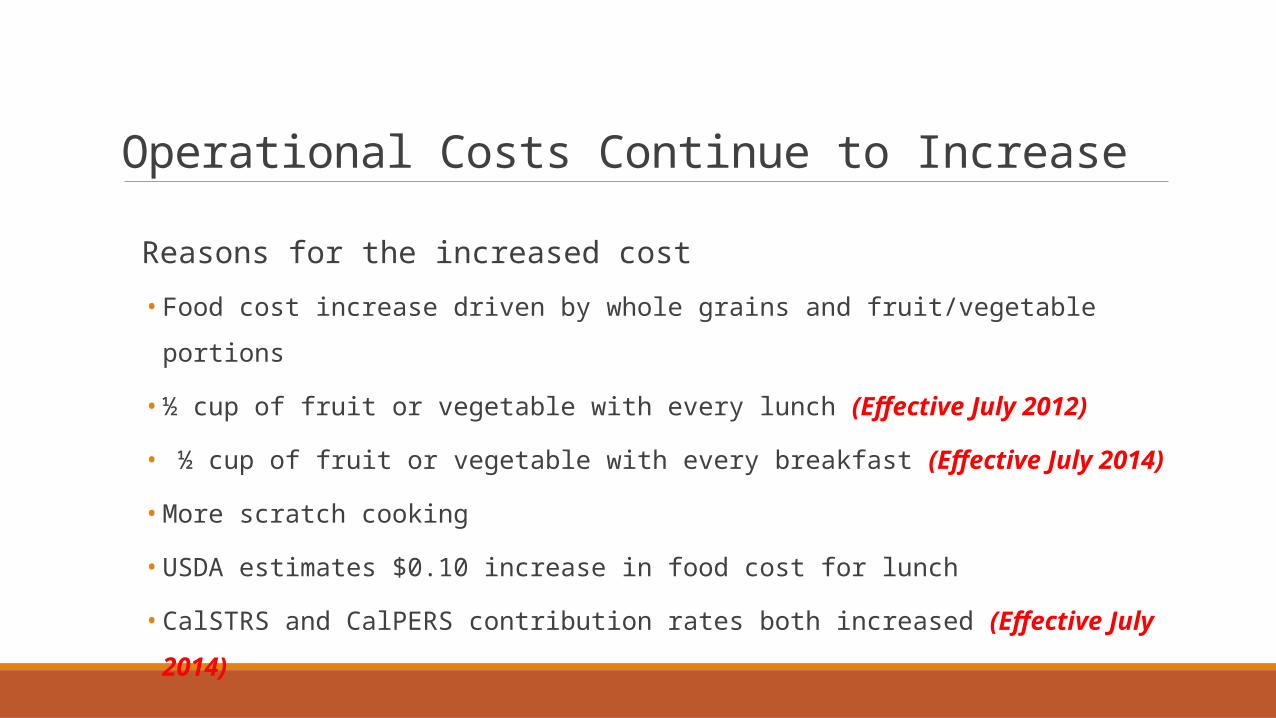
Operational Costs Continue to Increase
Reasons for the increased cost
• Food cost increase driven by whole grains and fruit/vegetable portions
• ½ cup of fruit or vegetable with every lunch (Effective July 2012)
• ½ cup of fruit or vegetable with every breakfast (Effective July 2014)
• More scratch cooking
• USDA estimates $0.10 increase in food cost for lunch
• CalSTRS and CalPERS contribution rates both increased (Effective July 2014)
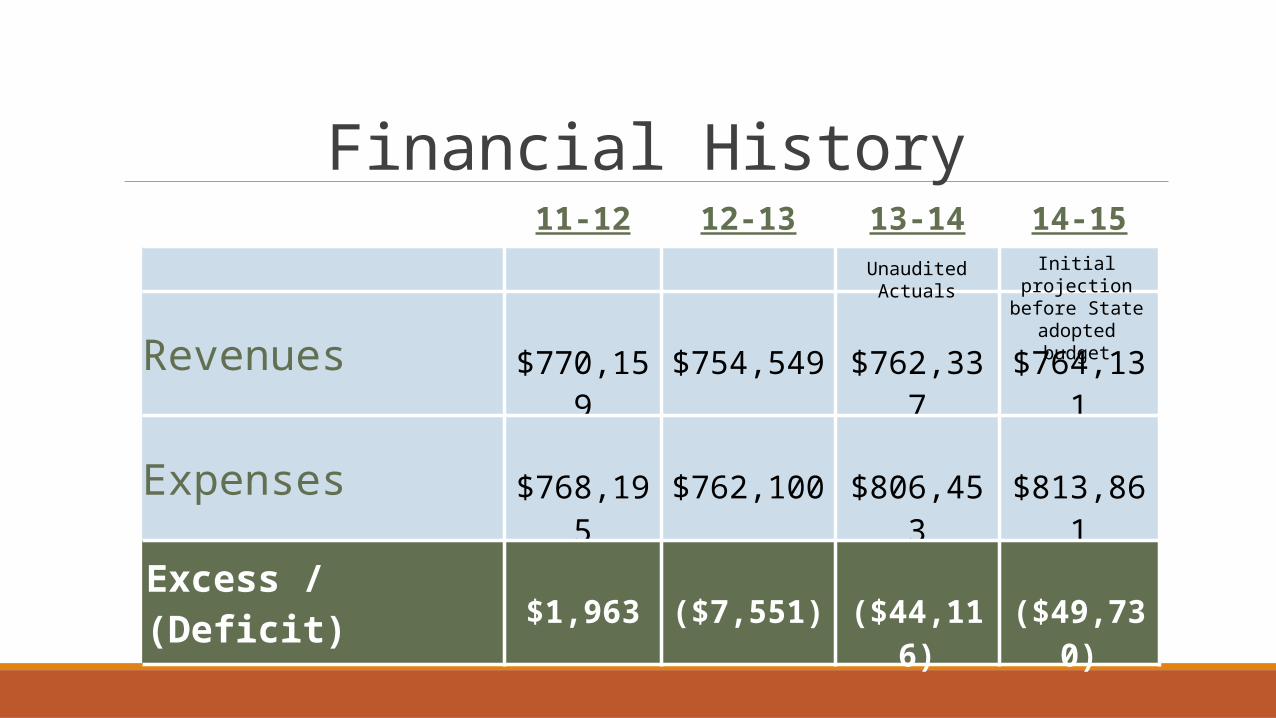
11-12 12-13 13-14 14-15
Revenues $770,159 $754,549 $762,337 $764,131
Expenses $768,195 $762,100 $806,453 $813,861
Excess / (Deficit) $1,963 ($7,551) ($44,116) ($49,730)
Initial projection before State
adopted budget
UnauditedActuals
Financial History
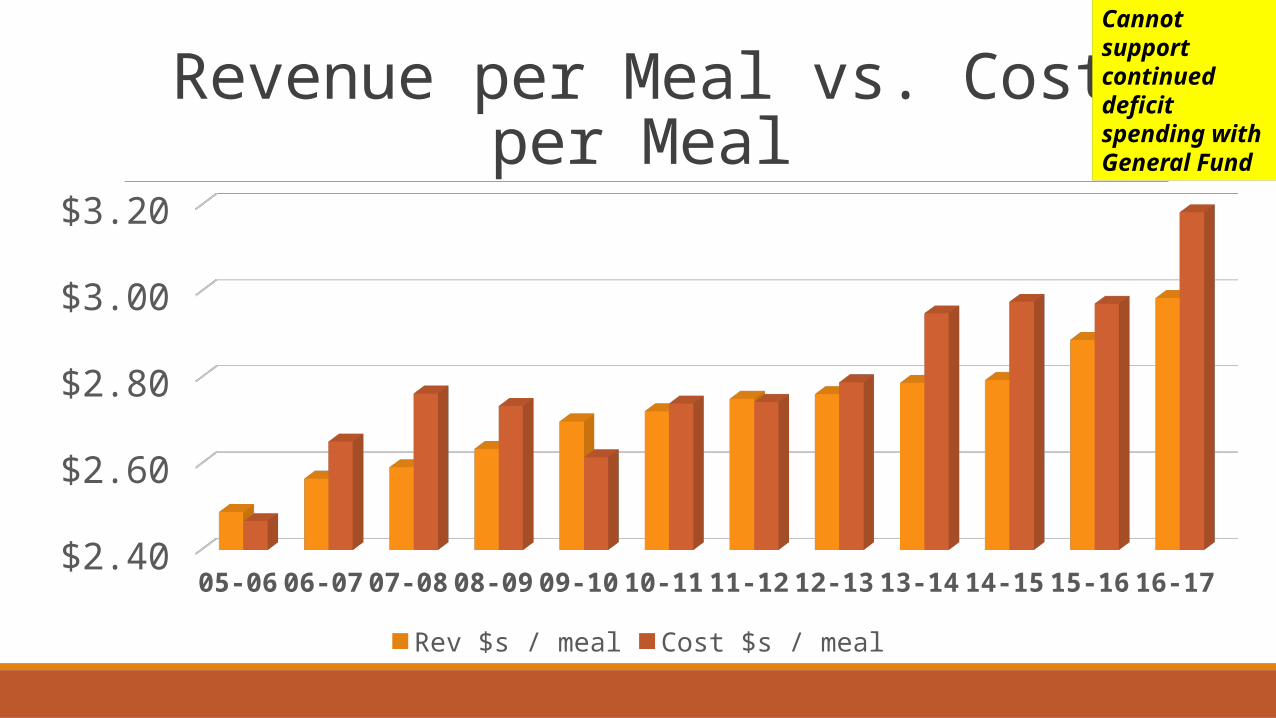
Revenue per Meal vs. Cost per Meal
05-06 06-07 07-08 08-09 09-10 10-11 11-12 12-13 13-14 14-15 15-16 16-17 $2.40 $2.50 $2.60 $2.70 $2.80 $2.90 $3.00 $3.10 $3.20
Rev $s / meal Cost $s / meal
Cannot support continued deficit spending with General Fund
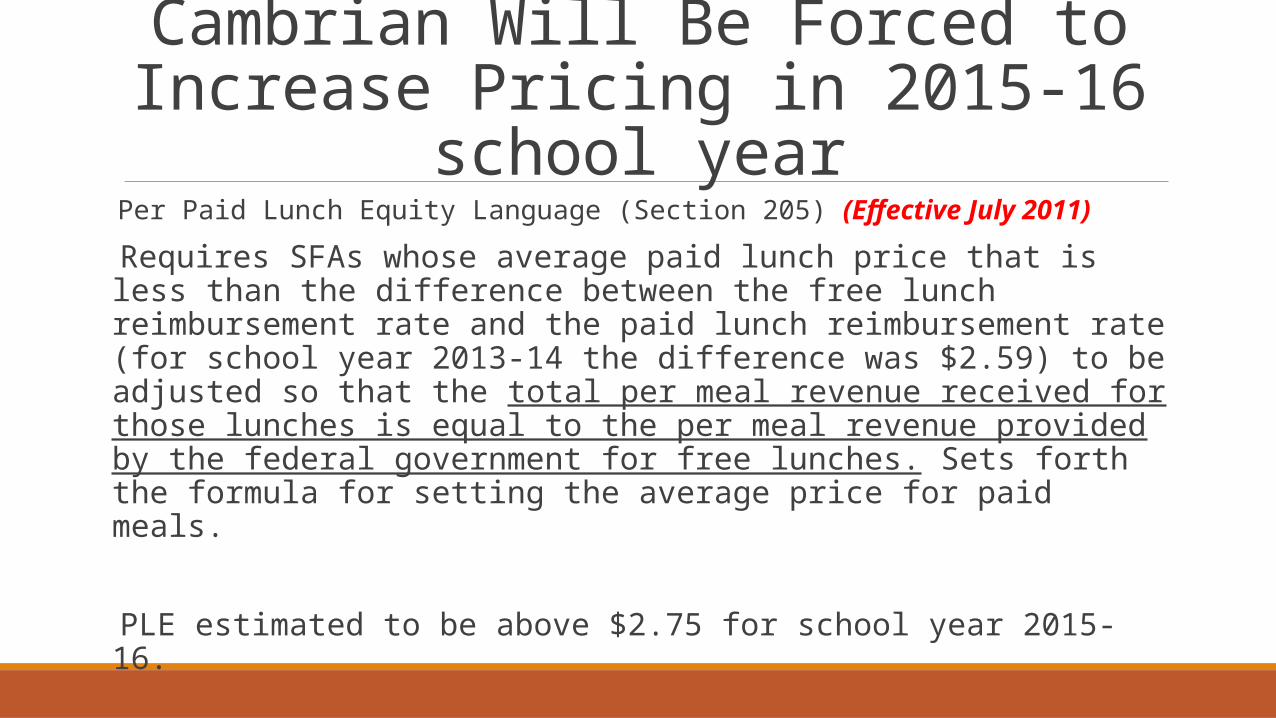
Cambrian Will Be Forced to Increase Pricing in 2015-16
school year Per Paid Lunch Equity Language (Section 205) (Effective July 2011)
Requires SFAs whose average paid lunch price that is less than the difference between the free lunch reimbursement rate and the paid lunch reimbursement rate (for school year 2013-14 the difference was $2.59) to be adjusted so that the total per meal revenue received for those lunches is equal to the per meal revenue provided by the federal government for free lunches. Sets forth the formula for setting the average price for paid meals.
PLE estimated to be above $2.75 for school year 2015-16.
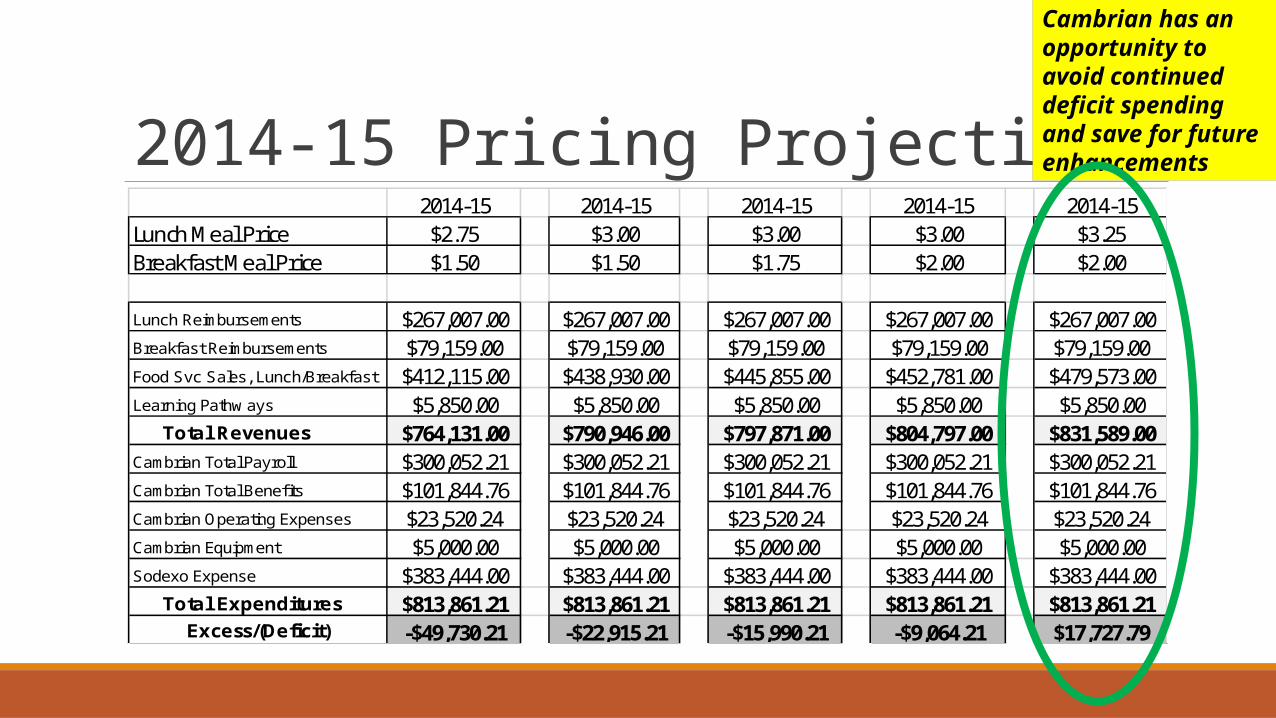
2014-15 Pricing Projections2014-15 2014-15 2014-15 2014-15 2014-15
Lunch Meal Price $2.75 $3.00 $3.00 $3.00 $3.25Breakfast Meal Price $1.50 $1.50 $1.75 $2.00 $2.00
Lunch Reimbursements $267,007.00 $267,007.00 $267,007.00 $267,007.00 $267,007.00Breakfast Reimbursements $79,159.00 $79,159.00 $79,159.00 $79,159.00 $79,159.00Food Svc Sales, Lunch/Breakfast $412,115.00 $438,930.00 $445,855.00 $452,781.00 $479,573.00Learning Pathw ays $5,850.00 $5,850.00 $5,850.00 $5,850.00 $5,850.00 Total Revenues $764,131.00 $790,946.00 $797,871.00 $804,797.00 $831,589.00Cambrian Total Payroll $300,052.21 $300,052.21 $300,052.21 $300,052.21 $300,052.21Cambrian Total Benefits $101,844.76 $101,844.76 $101,844.76 $101,844.76 $101,844.76Cambrian Operating Expenses $23,520.24 $23,520.24 $23,520.24 $23,520.24 $23,520.24Cambrian Equipment $5,000.00 $5,000.00 $5,000.00 $5,000.00 $5,000.00Sodexo Expense $383,444.00 $383,444.00 $383,444.00 $383,444.00 $383,444.00 Total Expenditures $813,861.21 $813,861.21 $813,861.21 $813,861.21 $813,861.21 Excess/(Deficit) -$49,730.21 -$22,915.21 -$15,990.21 -$9,064.21 $17,727.79
Cambrian has an opportunity to avoid continued deficit spending and save for future enhancements
Staff Recommended Price Increase
Increase breakfast meal prices from $1.50 to $2.00
Increase lunch meal prices from $2.75 to $3.25