chemoselective reduction of nitroarenes using...
TRANSCRIPT
Chemoselective Reduction of Nitroarenes using Hydrogen
Sulphide under Phase Transfer Catalysis
Dissertation submitted to the
National Institute of Technology Rourkela
In partial fulfillment of the requirements of the degree of
PhD
in
Chemical Engineering
by
Ujjal Mondal
(Roll Number: 512CH1008)
under the supervision of
Prof. Sujit Sen
Department of Chemical Engineering
National Institute of Technology Rourkela
ii
Department of Chemical Engineering
National Institute of Technology Rourkela
January 26, 2017
Certificate of Examination
Roll Number: 512CH1008
Name: Ujjal Mondal
Title of Dissertation: Chemoselective reduction of Nitroarenes using Hydrogen Sulphide
and Phase Transfer Catalysis
We, the below signed, after checking the dissertation mentioned above and the official
record book (s) of the student, hereby state our approval of the dissertation submitted in
partial fulfillment of the requirements for the degree of Doctor of Philosophy in Chemical
Engineering at National Institute of Technology Rourkela. We are satisfied with the
volume, quality, correctness, and originality of the work.
Sujit Sen Raghubansh Kumar Singh
Supervisor Chairman (DSC)
Basudeb Munshi Abanti Sahoo
Member (DSC) Member (DSC)
Sourav Chatterjee Vaibhav V. Goud
Member (DSC) Examiner
iii
Department of Chemical Engineering
National Institute of Technology Rourkela
Dr. Sujit Sen
Assistant Professor January 26, 2017
Supervisor's Certificate
This is to certify that the work presented in this dissertation entitled “Chemoselective
reduction of Nitroarenes using Hydrogen Sulphide under Phase Transfer Catalysis”
by ''Ujjal Mondal '', Roll Number 512CH1008, is a record of original research carried out
by him under my supervision and guidance in partial fulfillment of the requirements for
the degree of Doctor of Philosophy in Chemical Engineering. Neither this dissertation nor
any part of it has been submitted for any degree or diploma to any institute or university
in India or abroad.
Sujit Sen

iv
Dedicated to My Family
v
Declaration of Originality
I, Ujjal Mondal, Roll Number 512CH1008 hereby declare that this dissertation entitled
“Chemoselective reduction of Nitroarenes using Hydrogen Sulphide under Phase Transfer
Catalysis '' represents my original work carried out as a doctoral student of NIT Rourkela
and, to the best of my knowledge, it contains no material previously published or written
by another person, nor any material presented for the award of any other degree or
diploma of NIT Rourkela or any other institution. Any contribution made to this research
by others, with whom I have worked at NIT Rourkela or elsewhere, is explicitly
acknowledged in the dissertation. Works of other authors cited in this dissertation have
been duly acknowledged under the section ''Bibliography''. I have also submitted my
original research records to the scrutiny committee for evaluation of my dissertation.
I am fully aware that in the case of any non-compliance detected in future, the Senate of
NIT Rourkela may withdraw the degree awarded to me on the basis of the present
dissertation.
January 26, 2017 Ujjal Mondal
NIT Rourkela
vi
Acknowledgement
I wish to thank and express my heartfelt gratitude to my supervisors Dr. Sujit Sen,
Assistant Professor, Department of Chemical Engineering, National Institute of
Technology Rourkela guiding me to this interesting research work. I thank him for being
for constantly motivating me through his valuable counsel as well as his excellent tips to
build my research and writing skills.
I would also like to thank my Doctoral Scrutiny Committee members Prof. Saurav
Chatterjee (Associate Professor, Department of Chemistry) Prof. Raghubansh Kumar
Singh (Professor, Department of Chemical engineering), Prof. Basudeb Munshi
(Associate Professor, Department of Chemical Engineering) and Prof. Abanti Sahoo
(Associate Professor, Department of Chemical Engineering) for their helpful suggestions
and discussions in developing my thesis.
I wish to convey my sincere gratitude to the Director, NIT- Rourkela for providing
me the opportunity to pursue my research in this Institute.
I am also thankful to all lab mates, Preeti Jha, Gaurav Singh, Sivamani,
Devipriya Gogoi, Saroj Kumari, Pratik Mishra, Gajendra Kumar and Tatinaidu Kella for
their time-to-time help, encouragement and creating an excellence atmosphere both
inside and outside the department.
I am obliged to all my friends NVS Praneeth, Suresh Kumar, Selva Kumar Irshad
Mattan, Dani Varghese, Asheley Thomas, Balmiki Kumar, Harjeet Nath, Sourav
Mukharjee, Bhaskar Das, Gajendra Kumar, Aslam Puthankot, Priya Nakade and Kasturi
Ganguly for their friendships and encouragements. I cannot be what I am, without the
blessings of my father Uttam Mondal and support of my mother Mrs. Sumita Mondal, my
sister Mrs Laboni Mondal to whom I shall give all the credit for my existence and the
position I’m in now.
Lastly, I wish to thank my loving grandfather Late Upendra Nath Mondal, whose
blessings always give me strength to overcome all obstacles and difficulties in my life.
Ujjal Mondal
vii
Abstract
Hydrogen Sulphide gas (H2S) is the major source of sulphur as an impurity in gasification
process of fossil fuels, biogas plant, syngas production plant, petrochemical and various
industrial gases. H2S gas is highly corrosive, toxic and odorous in nature. It is very
necessary to remove H2S from gas streams as it can damage mechanical and electrical
components of any control system, corrode energy generation and heat recovery units. In
the present work, our main aim is utilise this toxic unwanted H2S and synthesise value
added fine chemicals such as aromatic amines. In order to achieve our aims two
industrially used alkanolamines such as mono ethanolamine (MEA) and n-
methyldiethanolamine (MDEA) have been used to absorb H2S and this H2S-laden
aqueous alkanolamine solution is used as a reducing agent. Mono nitro, dinitro, polynitro,
heterocyclic nitro compound have been reduced selectively to their corresponding
aromatic amines in the liquid-liquid or liquid-liquid-solid phase transfer catalysis mode of
reaction in the presence of phase transfer catalysis. In this current work insoluble PT
catalyst have been used such as Amberlite IR400 (Cl) and a number of soluble PT catalyst
have been used such as Tetrabutylammonium bromide (TBAB), Tetrabutylphosphonium
bromide (TBPB), Tetramethylammonium bromide (TMAB), Tetrabutylammonium iodide
(TBAI) and Ethyltriphenylphosphonium bromide (ETPPB), Tetrapropylammonium
bromide (TPAB). The main objectives of this work are to maximise conversion of the
organic substrate, maximise selectivity of the desired product and to deveolop a suitable
mechanism to explain the whole reduction process. Six different system have been
studied and in those five system chloronitrobenzene (CNB) reduction have been studied
in L-L and L-L-S PTC mode of reaction and 1-nitronapthalene (1-NN), nitroacetophenone
(NAP), dinitrotoluenes (DNT) have been studied in the biphasic mode of reaction. In last
system total sixteen nitroaromatic compounds have been reduced under an identical set of
parameters. For all the system parametric study, mechanistic investigation was performed
and kinetic and statistical model have been established. The studied parameters are
stirring speed, catalyst concentration, temperature, reactant concentration, sulphide
concentration, MDEA loading, elemental sulphur loading. The developed model have
been validated with the experimental data and the model predicts the conversion well.
Keywords: Hydrogen sulphide, Zinin reduction, Phase transfer catalysis, selectivity,
alkanolamines, mathematical modelling.
viii
Contents
Title page i
Certificate of Examination
ii
Supervisor‟s Certificate
iii
Dedication
iv
Declaration of Originality
v
Acknowledgement
vi
Abstract
vii
List of Figures
xv
List of Tables
xix
Nomenclature
xx
Abbreviation xxii
Chapter 1 Motivation 1-19
1.1 Motivation 1
1.2 Thesis aims and objectives 2
1.3 Main contributions 4
1.4 Industrial application 4
1.5 Thesis organization 5
References 7
Chapter 2 Introduction 9-26
2.1 Sources of Hydrogen sulphide 9
2.2 Physical and toxicological property/ Characteristic of H2S 10
2.3 H2S emission controlling methods 11
2.3.1 Amine absorption unit 11
2.3.2 Claus process 12
2.3.3 Chemical oxidants 13
2.3.4 Adsorption 15
2.3.5 Hydrogen sulphide Scavengers 15
ix
2.3.6 Liquid phase oxidation systems 15
2.3.7 Physical solvents 16
2.3.8 Membrane process 16
2.3.9 Biological methods 17
2.4 Phase Transfer Catalyst 17
2.4.1 Classification of PTC reactions 19
2.4.2 Mechanism of Liquid-Liquid PTC (L-L PTC) 19
2.4.2.1 Starks extraction mechanism 19
2.4.2.2 Makosza interfecial mechanism 21
2.4.3 Solid-Liquid PTC (S-L PTC) 21
2.4.4 Gas-Liquid PTC (G-L PTC) 21
2.4.5 Liquid-solid-Liquid PTC (L-S-L PTC) 22
2.4.6 Liquid-Liquid-Liquid PTC (L-L-L PTC) 23
2.5 Optimization methods 24
2.5.1 One variable at a time approach (OVAT) 24
2.5.2 Design of experiment (DoE) 24
References 25
Chapter 3 Literature review 27-40
3.1 H2S removal form gaseous stream 27
3.2 Nitroarenes reduction 29
3.2.1 Catalytic reduction 30
3.2.1.1 Reduction with iron 30
3.2.1.2 Reduction with other metal 30
3.2.1.3 Reduction with sulphide, hydrogen
sulphide and sodium dioxide
30
3.2.1.4 Electrochemical reduction 31
3.2.2 Catalytic Hydrogenation 31
3.2.2.1 Hydrazine as a reducing agent 31
3.2.2.2 Hydrogen as a reducing agent 31
3.2.2.2.1 Vapour phase hydrogenation 31
3.2.2.2.2 Liquid phase hydrogenation 31
x
3.3 Preparation of aromatic amines with Zinin reducing agent 32
3.3.1 Sodium sulphide/disulphide as reducing agent 32
3.3.2 Ammonium sulphide as a reducing agent 33
3.3.3 H2S rich Alkanolamines as reducing agent 33
3.4 Phase transfer catalysis 33
References 36
Chapter 4 Experimental 41-46
4.1 Materials 41
4.2 Absorption of H2S in methyldiethanolamine 41
4.3 Measurement of sulfide concentration (Iodometric Titration) 41
4.4 Experimental Setup 44
4.5 Experimental Procedure 44
4.6 Analysis of collected samples 44
4.6.1 Qualitative analysis using GC-MS 45
4.6.2 Quantitative analysis using GC-FID 46
References 46
Chapter 5 Kinetics and mechanism of liquid-liquid-solid phase transfer
catalysed Zinin reduction of nitrochlorobenzene by -laden
monoethanolamine
47-68
5.1 Introduction 47
5.2 Result and Discussion 47
5.2.1 Proposed mechanism of reduction of nitro-aromatic
compound under L-L-S PTC
47
5.2.2 Kinetic modelling 50
5.2.3 Parametric studies 54
5.2.3.1 Effect of stirring speed 54
5.2.3.2 Effect of temperature 55
5.2.3.3 Effect of Catalyst loading 56
5.2.3.4 Effect of m-chloronitrobenzene
concentration
57
5.2.3.5 Effect of initial sulphide concentration 60
5.2.3.6 Effect of MEA concentration 62
xi
5.2.3.7 Reusability of the catalyst 63
5.2.3.8 Validation of kinetic model 64
5.3 Conclusions 66
References 67
Chapter 6 Experimental Optimization and Kinetic Modeling of Liquid-
Liquid Phase Transfer Catalysed Reduction of Nitroarenes by
-Laden Aqueous Methyldiethanolamine
69-90
6.1 Introduction 69
6.2 Result and Discussion 69
6.2.1 Proposed mechanism of reduction of nitro-aromatic
compound under L-L PTC
69
6.2.2 Kinetic modelling 72
6.2.3 Sensitivity analysis 76
6.2.3.1 Effect of stirring speed 76
6.2.3.2 Reactivity of different isomers of CNBs 77
6.2.3.3 Effect of different phase transfer catalyst 78
6.2.3.4 Effect of temperature 80
6.2.3.5 Effect of Catalyst (TBPB) loading 81
6.2.3.6 Effect of m-chloronitrobenzene
concentration
82
6.2.3.7 Effect of initial sulphide concentration 83
6.2.3.8 Effect of MDEA concentration 84
6.2.3.9 Effect of elemental sulphur loading 86
6.2.3.10 Validation of kinetic model 86
6.3 Conclusions 88
References 89
Chapter 7 Phase Transfer Catalysed Selective Reduction of
Nitronaphthalene
91-113
7.1 Introduction 91
7.2 Result and Discussion 91
7.2.1 Proposed mechanism of reduction of aromatic nitro
compounds under L-L PTC
91
xii
7.2.2 Kinetic modelling 94
7.2.3 Parametric studies 99
7.2.3.1 Effect of stirring speed 99
7.2.3.2 Effect of temperature 100
7.2.3.3 Effect of Catalyst (TBPB) loading 101
7.2.3.4 Effect of 1-nitronapthalene concentration 103
7.2.3.5 Effect of initial sulphide concentration 105
7.2.3.6 Effect of MDEA concentration 107
7.2.3.7 Effect of elemental sulphur loading 108
7.2.3.8 Validation of kinetic model 109
7.3 Conclusions 111
References 112
Chapter 8 Multivariate Analysis in Selective Nitroacetophenone
Conversion by Toxic Hydrogen Sulfide under Phase Transfer
Catalysis
114-127
8.1 Introduction 114
8.2 Result and Discussion 114
8.2.1 Overall reaction 114
8.2.2 Mechanism of the reaction 115
8.2.3 Screening of parameters 116
8.2.4 Development of Regression Model Equation 117
8.2.5 Model Selection and Fitting 118
8.2.6 Model Analysis 122
8.2.7 Response surface analysis 122
8.2.8 Optimization of influencing factors 124
8.3 Model verification and confirmation 125
8.4 Conclusion 126
References 127
Chapter 9 Highly Selective Room Temperature Mono-reduction of dinitro-
arenes by Hydrogen Sulfide under Liquid-Liquid Bi-phasic
catalysis
128-156
xiii
9.1 Introduction 128
9.2 Result and Discussion 128
9.2.1 Proposed mechanism of reduction of 2,4-DNT under
L-L PTC
129
9.2.1.1 Aqueous Phase Equilibrium 130
9.2.1.2 Phase Transfer Catalysis in biphasic
liquid-liquid system
130
9.2.2 Parametric studies 132
9.2.2.1 Effect of agitation intensity 132
9.2.2.2 Comparison of conversion between
different dinitrotoluenes
132
9.2.2.3 Effect of different phase transfers catalyst 133
9.2.2.4 Effect of other organic solvents 134
9.2.2.5 Effect of temperature of the reaction 135
9.2.2.6 Effect of Catalyst Concentration 138
9.2.2.7 Effect of 2,4-Dinitrotoluene concentration 141
9.2.2.8 Effect of concentration of sulphide ion in
the aqueous phase
144
9.2.2.9 Effect of MDEA concentration 146
9.2.2.10 Effect of elemental sulphur loading 149
9.2.3 Kinetic modeling of L-L PTC 150
9.2.4 Kinetic model validation 152
9.3 Conclusions 153
References 155
Chapter 10 Hydrogen sulphide as an efficient reducing agent for selective
reduction mono/dinitro arenes under Liquid-Liquid Phase
transfer catalysis
157-175
10.1 introduction 157
10.2 Experimental setup and procedure 159
10.3 Result and discussion 160
10.4 Mechanism of L-L PTC 161
10.5 Reaction scope 163
10.5 Conclusion 166
xiv
References 173
Chapter 11 Conclusion and future recomendation 176-181
11.1 Introduction 176
11.2 Conclusions 177
11. 2.1 The salient achievements and major conclusions
of chapter 5
177
11.2. 2 The salient achievements and major conclusions
of chapter 6
177
11.2. 3 The salient achievements and major conclusions
of chapter 7
178
11.2. 4 The salient achievements and major conclusions
of chapter 8
178
11.2. 5 The salient achievements and major conclusions
of chapter 9
179
11.2. 6 The salient achievements and major conclusions
of chapter 10
179
11. 3 Future recommendations 180
Dissemination 182
Resume
184
xv
List of Figures
Figure No. Figure Caption Page No.
Fig. 1.1 Schematic diagram of proposed work 3
Fig. 1.2 Schematic diagram of the Organisation of the thesis 7
Fig. 2.1 Amine Treating Unit 12
Fig. 2.2 Sulphur recovery utilising Claus Unit 13
Fig. 2.3 Caustic Scrubber Unit 14
Fig. 2.4 Different types of PT catalyst used 18
Fig. 2.5 Classifications of PTC 19
Fig. 2.6 Normal Liquid-Liqid PTC mechanism by Stark‟s 20
Fig. 2.7 Inverse liquid phase PTC mechanism 20
Fig. 2.8 Reverse Liquid-Liquid PTC mechanism 21
Fig. 2.9 Makosza interfecial mechanism 21
Fig. 2.10 Liquid-solid-Liquid PTC mechanism 23
Fig. 2.11 Liquid-Liquid-Liquid PTC mechanism 23
Fig. 4.1 H2S generation and absorption assembly 42
Fig. 4.2 The Experimental Assembly 44
Fig. 5.1 Schematic diagram for catalyst regeneration 51
Fig. 5.2 Effect of stirring speed on the conversion of m-CNB. 54
Fig. 5.3 Effect of temperature on the conversion of m-CNB. 55
Fig. 5.4 Arrhenius Plot of ln (initial rate) vs. 1/T 56
Fig. 5.5
Fig. 5.6
Fig. 5.7
Effect of Catalyst (Amberlite IR-400) loading on the conversion of
m-CNB
Plot of ln (initial rate) vs ln (catalyst concentration).
Effect of Reactant concentration on % conversion of m-CNB.
57
58
59
Fig 5.8 Plot of ln (initial rate) vs. ln (reactant concentration). 60
Fig. 5.9 Effect of Sulphide Concentration on % conversion of m-CNB. 61
Fig. 5.10 Plot of ln (conc. of sulphide) vs. ln (initial rate). 62
Fig. 5.11 Effect of MEA Concentration Operating Conditions. 63
Fig. 5.12 Conversion of m-CNB with the cycle number.
64
Fig. 5.13 Validation of the kinetic model with experimental data at different
temperature.
65
xvi
Fig. 5.14 Comparison of calculated and experimental m-CNB conversions
at 480 min different temperatures
66
Fig. 5.15 MS spectra of m-CNB 67
Fig. 6.1 Effect of agitation intencity on the reaction rate of m-CNB. 76
Fig. 6.2 Reactivity of different CNBs 77
Fig. 6.3 Effect of different catalyst on the conversion of m-CNB 78
Fig. 6.4 Effect of temperature on the conversion of m-CNB. 80
Fig. 6.5 Plot of ln (initial rate) vs. 1/T 81
Fig. 6.6 Effect of Catalyst loading (TBPB) on the conversion of m-CNB. 82
Fig. 6.7 Effect of Reactant concentration on the conversion of m-CNB. 83
Fig. 6.8 Effect of Sulphide Concentration on % conversion of m-CNB. 84
Fig. 6.9 Effect of MDEA Concentration on the conversion of m-CNB. 85
Fig. 6.10 Effect of elemental Sulphur loading on the conversion of m-CNB. 86
Fig. 6.11 Validation of the kinetic model with experimental data at different
temperature.
87
Fig. 6.12 Comparison between calculated and experimental m-CNB
conversions at 480min at different temperatures
88
Fig. 6.13 MS spectra of m-CNB 89
Fig. 7.1 Effect of stirring speed on the conversion of 1-NN. 99
Fig. 7.2 Effect of temperature on the conversion of 1-NN. 100
Fig. 7.3 Arrhenius Plot (Plot of ln (initial rate) vs. 1/T) 101
Fig. 7.4 Effect of catalyst concentration on the conversion of 1-NN. 102
Fig. 7.5 Plot of ln (initial rate) vs. ln (catalyst concentration). 103
Fig. 7.6 Effect of reactant concentration on the conversion of 1-NN. 104
Fig. 7.7 Plot of ln (initial rate) vs. ln (reactant concentration). 105
Fig. 7.8 Effect of sulphide concentration on the conversion of 1-NN. 106
Fig. 7.9 Plot of ln (initial rate) vs. ln (sulphide concentration). 106
Fig. 7.10 Effect of MDEA concentration on the conversion of 1-NN. 108
Fig. 7.11 Effect of Elemental sulphur on the conversion of 1-NN. 109
Fig. 7.12 Validation of the kinetic model with experimental data at different
catalyst concentrations.
110
Fig. 7.13 Comparison of calculated and experimental 1-NN conversions at
60 min at different temperatures
111
Fig. 7.14 Mass spectra of product 1-napthylamine 114
Fig. 8.1 The main effect plot of control factors 117
Fig. 8.2 Plot of predicted values versus actual values for p-NAP
conversion
121
Fig. 8.3 Normal plot of residuals for p-NAP conversion 118
xvii
Fig. 8.4 Contour and 3D surface plot of the effect of different
parameters on the conversion of p-NAP (A) contour plot of
the interaction of Temperature and Catalyst concentration.
(B) 3D surface plot of the interaction of Temperature and
Catalyst concentration. (C) Contour plot of the interaction of
Temperature and MDEA concentration. (D) 3D surface plot
of the interaction of Temperature and MDEA concentration.
123
Fig. 8.5 Contour and 3D surface plot of the effect of different parameters
on the conversion of p-NAP (A) Contour plot of the interaction of
Catalyst concentration and MDEA concentration. (B) 3D surface
plot of the interaction of Catalyst concentration and MDEA
concentration. (C) Contour plot of the interaction of Catalyst
concentration and p-NAP: sulfide concentration ration. (D) 3D
surface plot of the interaction of Catalyst concentration and p-
NAP: sulfide concentration ration.
124
Fig. 8.6 Desirability ramp for numerical optimization 125
Fig. 8.7 MS Spectra of the product 3-aminoacetophenone 127
Fig. 9.1 Effect of Stirring speed on the reaction rate. 132
Fig. 9.2 Conversion-time plot obtained (a) experimentally of two isomers
of dinitrotoluenes.
133
Fig. 9.3 Effect of different catalysts on the conversion of 2,4-DNT. 134
Fig. 9.4 Effect of different solvents on the conversion of 2,4-DNT. 135
Fig. 9.5 Effect of temperature on (a) the conversion of 2,4-DNT and (b)
selectivity of 4A2NT & 2A4NT with respect to temperature and
(c) selectivity of 4A2NT with respect to reaction time.
137
Fig. 9.6 Arrhenius plot of ln (Initial Reaction Rate) vs. 1/T. 137
Fig. 9.7 Effect of TBPB concentration on (a) the conversion of 2,4-DNT
and (b) selectivity of 4A2NT & 2A4NT with respect to catalyst
loading and (c) selectivity of 4A2NT with respect to reaction time.
140
Fig. 9.8 ln (Initial Reaction Rate) vs. ln (Catalyst concentration). 140
Fig. 9.9 Effect of 2,4-DNT concentration on (a) the conversion of 2,4-DNT
and (b) selectivity of 4A2NT & 2A4NT with respect to reactant
concentration and (c) selectivity of 4A2NT with respect to
reaction time.
143
Fig. 9.10 Plot of ln (initial rate) vs. ln (reactant concentration) 143
Fig. 9.11 Effect of Sulphide concentration on (a) the conversion of 2,4-DNT
and (b) selectivity of 4A2NT & 2A4NT with respect to sulphide
concentration and (c) selectivity of 4A2NT with respect to
reaction time.
145
xviii
Fig. 9.12 Plot of ln (initial rate) vs. ln (sulphide concentration) 146
Fig. 9.13 Effect of MDEA concentration on (a) the conversion of 2,4-DNT
(b) selectivity of 4A2NT & 2A4NT with respect to MDEA
concentration and (c) selectivity of 4A2NT with respect to
reaction time.
148
Fig. 9.14 Effect of elemental Sulphur addition on the conversion of 2,4-
DNT. 149
Fig. 9.15 Arrhenius plot of (a) ln (rate constant, k1) vs. 1/T and (b) ln (rate
constant, k2) vs. 1/T.
152
Fig. 9.16 Comparison between calculated conversion and experimental
conversion of 2,4-DNT at different temperatures after 60 min of
reaction.
153
Fig. 9.17 MS spectra of 2,6-diaminotoluene 154
Fig. 9.18 MS spectra of 4-amino-2-nitrotoluene (4A2NT) 154
Fig. 9.19 MS spectra of 2-amino-4-nitrotoluene (2A4NT) 155
Fig. 10.1 Mass spectra of product 4-chloro-3-aminotoluene (2a) 167
Fig. 10.2 Mass spectra of product 4-chloro-2-aminotoluene (2b) 167
Fig. 10.3 Mass spectra of product 3-chloroaniline (2c) 167
Fig. 10.4 Mass spectra of product 4-chloroaniline (2d) 168
Fig. 10.5 Mass spectra of product 2-chloroaniline (2e) 168
Fig. 10.6 Mass spectra of product Iodo-2-aniline (2f) 168
Fig. 10.7 Mass spectra of product 3-aminoacetophenone (2g) 169
Fig. 10.8 Mass spectra of product 4-aminoacetophenone (2h) 169
Fig. 10.9 Mass spectra of product 4-aminoanisole (2i) 170
Fig. 10.10 Mass spectra of product 2-aminoanisole (2j) 170
Fig. 10.11 Mass spectra of product 1-aminonapthalene (2k) 170
Fig. 10.12 Mass spectra of product 8-aminoquinoline (2l) 171
Fig. 10.13 Mass spectra of product 2-aminon-6-nitrotoluene (2m) 171
Fig. 10.14 Mass spectra of product 2-aminon-4-nitrotoluene (2n1) 171
Fig. 10.15 Mass spectra of product 4-aminon-2-nitrotoluene (2n2) 172
Fig. 10.16 Mass spectra of product 1-(2-aminophenoxy) benzene (2o) 172
Fig. 10.17 Mass spectra of product 1-(4-aminophenoxy) benzene (2p) 172
xix
List of Tables
Table no. Table Caption Page No.
Table 2.1 Effect of different levels H2S exposure on human physiology 10
Table 2.2
Table 4.1
Table 4.2
Table 5.1
Table 5.2
Table 6.1
Table 6.2
Table 7.1
Table 7.2
Table 8.1
Chemical and physical properties of H2S
Temperature Programme for MS
Temperature Programme for FID
Effect of catalyst loading on Initial reaction ratea
Apparent rate (kapp) constants at different temperaturesb
Effect of the PTC on Initial reaction ratea
Apparent rate (kapp) constants at different temperaturesb
Effect of catalyst loading on Initial reaction ratea
Apparent rate (kapp) constants at different temperaturesb
Coded levels and range of independent variables for
experimental design
11
45
46
57
65
79
82
102
110
117
Table 8.2
Experimental design matrix and results - A 24 full factorial CCD with
six replicates of the Centre point
118
Table 8.3 ANOVA for response surface quadratic model for p-NAP
conversiona
120
Table 8.4
Optimization of the individual Responses (di) to find the Overall
Desirability Response (D)
125
Table 9.1 Effect of catalyst concentration on Initial reaction ratea 141
Table 9.2 Rate constants of the model of the different temperaturesb 152
Table 10.1
Table 10.1
Screening of different catalyst and yield achieved
substrate scope of selective reduction of substituted
nitroaromatic compounds under L-L PTC
161
164
xx
Nomenclature
Concentration of QX in the organic phase (kmol/m3)
Concentration of QX in the aqueous phase (kmol/m3)
Concentration of QHS (also ) in the aqueous phase (kmol/m3)
Concentration of QHS in the aqueous phase (kmol/m3)
Concentration of QSQ in the organic phase (kmol/m3)
Concentration of QSQ in the aqueous phase (kmol/m3)
Concentration of QS2Q in the organic phase (kmol/m3)
Concentration of QS2Q in the aqueous phase (kmol/m3)
Concentration of QSHO3 (also Q+SHO3
-) in the aqueous phase (kmol/m
3)
Concentration of QSHO3 in the aqueous phase (kmol/m3)
Concentration of
3 in the aqueous phase (kmol/m
3)
Concentration of [S
2-]
2 in the aqueous phase (kmol/m
3)
Concentration of ArNO2 in the organic phase (kmol/m3)
Concentration of catalyst QX initially fed to the aqueous phase (kmol/m3)
Concentration of total catalyst Q in the organic phase (kmol/m3)
Concentration of total reagent (ArNO2) added in the organic phase (kmol/m
3)
Kapp Apparent first order reaction rate constant [m3/(mol of catalyst .min)]
Forward reaction rate constant [m3/(mol of catalyst .min)] aqueous phase
Backward reaction rate constant [m
3/(mol of catalyst .min)] aqueous phase
Reaction rate constant [m3/(mol of catalyst .min)] organic phase
Reaction rate constant [m3/(mol of catalyst .min)] organic phase
Reaction rate constant [m3/(mol of catalyst .min)] organic phase

xxi
Volume of organic phase (m3)
volume of aqueous phase (m3)
X fractional conversion
t time (min.)
xxii
Abbreviation
ATU Amine treating unit
CNB Chloronitrobenzenes
m-CNB m-Chloronitrobenzenes
p-CNB p-Chloronitrobenzenes
o-CNB o-Chloronitrobenzenes
m-CA m-Chloroaniline
MDEA N-Methyldiethanolamine
MEA Monoethanolamine
TEA Triethanolamine
DEA Diethanolamine
DIPA Diisopropanolamine
1-NN 1-Nitronapthalene
1-NA 1-Napthylamine
2,4-DNT 2,4-dinitrotoluene
4A2NT 4-amino-4-nitrotoluene
2A4NT 2-amino-4-nitrotoluene
p-NAP p-Nitroacetophenone
p-AAP p-Aminoacetophenone
3CA 3-chloroaniline
4CA 4-chloroaniline
2CA 2-chloroaniline
TBAB Tetrabutylammonium bromide
TBAC Tetrabutylammonium chloride
TBPB Tetrabutylphosphonium bromide
TMAB Tetramethylammonium bromide
CTMAB Cetyltrimethylammonium bromide
ETPPB Ethyltriphenylphosphonium bromide
Thesis Overview
This chapter provides an outline of the research work presented in the thesis. This
chapter describes the motivation behind the proposed work. Also, it provides an overview
of the research approach taken, industrial application and as well as of the results
obtained. Finally, it introduces the structure of the thesis.
1.1 Motivation
Hydrogen sulphide (H2S) is a poisonous, odiferous and corrosive gas. H2S normally come
into the atmosphere as the major impurity via fossil fuel processing plant, biogas plant,
syngas production plant and pharmaceutical industries along with some natural sources
like a volcanic eruption, sulphur spring, bacterial activity.
It is essential to process H2S gas before releasing it to the environment with other gaseous
waste. The presence of H2S gas can equally harm mechanical and electrical unit of any
plant. There are copious technologies available for the removal of H2S gas. Chemical
scrubbing and absorption in different media are most practiced methods in industry and
research labs. In petroleum refineries, H2S gas is removed from by-product gas stream in
Amine treating unit and then regenerated H2S is treated in Claus unit.
Some approaches have already been undertaken for utilizing H2S gas in a more
productive manner. Production of hydrogen and sulphur by treating H2S gas in thermal 1,
photochemical 2, electrochemical
3–5 or thermochemical processes
6. When a significant
amount of H2S gas is mixed with CO2, it is called acid gas. Acid gas can be pyrolyzed to
produce Syngas (H2, CO) which is used in fuel gas engines. All of the investigated
processes mentioned above are having some limitations which include, (i) difficult and
expensive mode of operation (ii) strict environmental regulations (iii) limited scope of
utilization of sulphur, produced as an end product. The main focus of our work is,
therefore, to search for an alternative process to utilize H2S for producing valuable fine
chemicals.
In our current work, H2S has been used for the selective reduction of nitroaromatic
compounds to aromatic amines, a type of value-added chemicals. Selective reduction of a
nitro group attached to an aromatic ring is tough to achieve. H2S laden alkanolamine
solution has been used as a reducing agent. Various kinds of absorbents have been used
for research and commercial purpose, among which some are NaCl, copper sulphate,
hollow fibre membrane contractors, activated carbon, iron-based sorbents, FeOOH,
1
Fe2O3, aqueous ammonia and alkanolamine solution. For our current study, we have used
alkanolamines like monoethanolamine (MEA) and methyldiethanolamine (MDEA) and
the main reasons for choosing alkanolamines over other absorbing agents are a wide
range of operating conditions, easily recyclable, not harming the main reaction, solvent
loss due vaporization is minimum.
Aromatic amines are useful intermediate for the preparation of photographic chemicals,
pesticides, rubber and extensively used in dye, food and pharmaceutical industries.
Selective reduction is challenging work, and it was done with many approaches which
include Bechamp reduction 7, catalytic hydrogenation
8 and Zinin reduction
9. The
reduction reaction of nitroaromatic compounds by negative divalent sulphur in the form
of sulphide, hydrosulphide and polysulphide is called Zinin reduction. The presence of
sulphide and hydrosulphide ions made aqueous H2S-laden aqueous alkanolamine solution
a potential reducing agent. The reaction between reducing agent present in the aqueous
phase and nitroarenes which remain in the organic phase is very slow. One of the most
efficient ways of enhancing reaction rate and product selectivity in a multiphase reaction
is to employ Phase Transfer Catalyst (PTC) that intensifies the reaction rate by
transporting inorganic nucleophiles (anions) to the organic phase from the aqueous phase
and vice versa 10
. PTC is a very well-practiced technique, and the main advantages
include reaction milder and safer environment through high reactivity, higher yield as
selectivity is more, utilization of reusable raw materials and catalyst makes the whole
process cheaper, product separation is easy. Phase transfer catalysis systems can be
classified into different types, based on the number and properties of the phases. In the
present work liquid- liquid (L-L), and liquid-liquid-solid (L-L-S) PTCs have been
employed to achieve the goal.
Very little research is available in the area of Zinin reduction with the utilization of PTC
in the literature. Kinetic modeling based on the proposed mechanism and parametric
study have also rarely been developed. Parameters which are the most influencing for the
reduction reaction has to be optimized for achieving highest output while keeping the
whole process economical.
1.2 Work Methodology and Objectives
Among the processes of removing H2S gas from the different industrial gaseous by-
product, Claus process is the mostly practiced approach. Elemental sulphur is the only
end product produced during this process. Due to increased number of concern has
against this process, such as strict environmental emission rule for H2S emission,
2
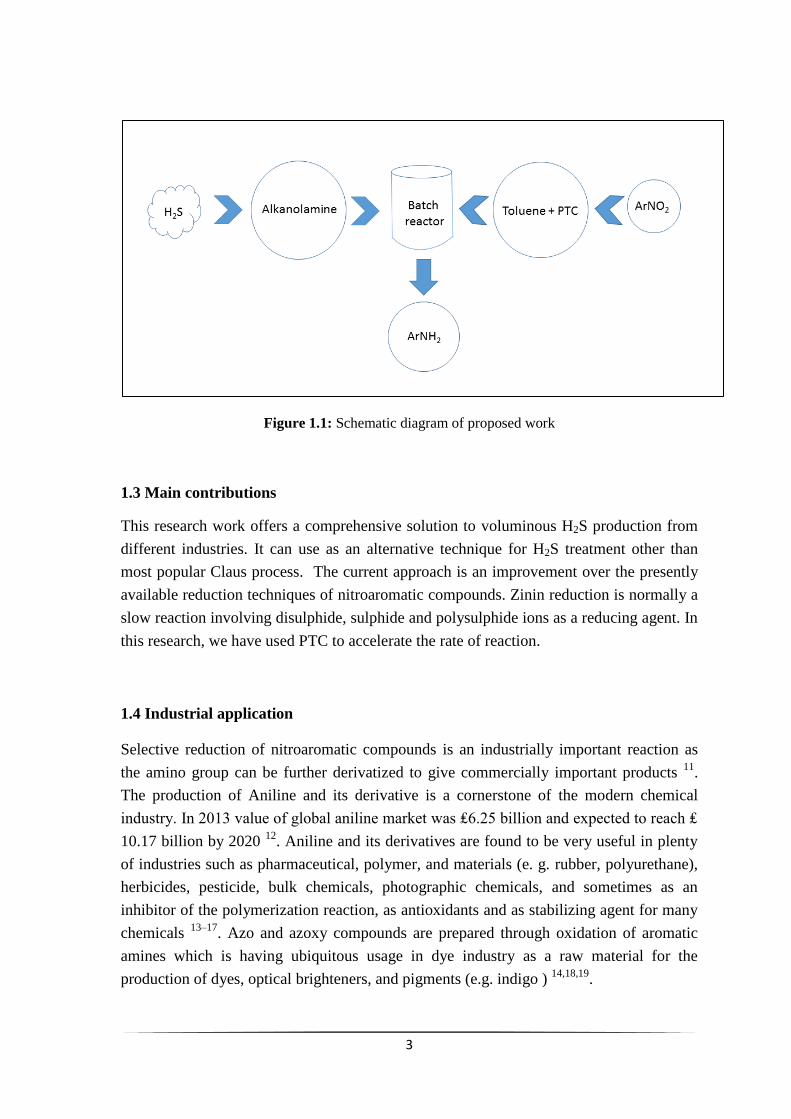
environmental hazards possessed by the huge amount of unutilised elemental sulphur
deposition. The current process has been engineered to employ H2S gas to yield fine
value-added chemicals such as anilines and substituted anilines in a cost-effective and
environment-friendly way. The methodology is outlined in Fig. 1.1.
The aim of this research is to establish a process for better utilization of H2S gas.
To this end, the main objectives of this research are:
1. To develop a process for selective reduction of various aromatic nitro compounds with
the use of H2S gas absorbed in alkanolamines as a reducing agent under L-L and L-L-S
mode of reaction.
2. Different types of PTC have to utilize in the current reaction to identify the best
catalyst for our system, and recyclability of solid catalyst have to be analyzed.
3. Study the effect of different process parameters (stirring speed, catalyst concentration,
reactant concentration, temperature, sulphide concentration, alkanolamine (MEA/MDEA)
concentration, elemental sulphur loading) on the conversion of reactant and selectivity of
desired product.
4. Establishment of a suitable reaction mechanism of PTC catalyzed reduction reaction
for L-L and L-L-S mode of PTC reaction.
5. To identify most influencing operating parameters and to optimize operating
parameters after statistical modeling to achieve the highest conversion and selectivity of
desired product.
6. To develop a mathematical model of L-L and L-L-S PTC based on the mechanism
proposed which can predict the conversion of the reactant.
3
Figure 1.1: Schematic diagram of proposed work
1.3 Main contributions
This research work offers a comprehensive solution to voluminous H2S production from
different industries. It can use as an alternative technique for H2S treatment other than
most popular Claus process. The current approach is an improvement over the presently
available reduction techniques of nitroaromatic compounds. Zinin reduction is normally a
slow reaction involving disulphide, sulphide and polysulphide ions as a reducing agent. In
this research, we have used PTC to accelerate the rate of reaction.
1.4 Industrial application
Selective reduction of nitroaromatic compounds is an industrially important reaction as
the amino group can be further derivatized to give commercially important products 11
.
The production of Aniline and its derivative is a cornerstone of the modern chemical
industry. In 2013 value of global aniline market was ₤6.25 billion and expected to reach ₤
10.17 billion by 2020 12
. Aniline and its derivatives are found to be very useful in plenty
of industries such as pharmaceutical, polymer, and materials (e. g. rubber, polyurethane),
herbicides, pesticide, bulk chemicals, photographic chemicals, and sometimes as an
inhibitor of the polymerization reaction, as antioxidants and as stabilizing agent for many
chemicals 13–17
. Azo and azoxy compounds are prepared through oxidation of aromatic
amines which is having ubiquitous usage in dye industry as a raw material for the
production of dyes, optical brighteners, and pigments (e.g. indigo ) 14,18,19
.
4
Anilines can be used as a corrosion inhibitor in mild steel in the picking process. p-
nitrotoluene is the largest produced aniline as 6200 t was produced in the United States in
1983 and it is used for the production of dyes, pharmaceuticals, and antioxidants. But the
main share (67%) of Aniline production is utilized to manufacture isocyanates, mainly for
4,4′-methylenebis (phenylisocyanate), to prepare polyurethanes. 20-27% of total aniline
production is utilized in rubber industry for the preparation of antioxidants, vulcanization
accelerators (2-mercaptobenzothiazoles). Many herbicides, insecticides, fungicides and
animal repellent are made from aniline or its derivative. Some important pharmaceuticals
which are produced from aromatic amines are sulphonamides and analgesics.
4-aminoacetophenone (4-AAP) is used for the preparation of novel phenyl azochalcone
derivatives that are having antitubercular, anti-inflammatory and antioxidant activity.20
4-
AAP is one of the reactants used for the synthesis of 1,3,4-oxadiazole-based chalcone
derivatives as novel bio-active antimicrobial agents against multidrug-resistant bacteria
and fungi.21
It is employed in the synthesis of HIV-1 growth inhibitors and for the
synthesis of aryl semicarbazone of 4-AAP for their anti-HIV activity.(Vibha Mishraa,
S.N. Pandeyab, E. DeClercqc, Christophe Pannecouquec 1998) Reduction of 2, 4-
dinitrotoluene lead to the formation of 2-amino-4-nitrotoluene, 2-nitro-4-aminotoluene
and 2, 4-diaminotoluene. These products are industrially used as an intermediate for the
production of dyes, artificial pigments 23,24
. Some other examples of usage of aromatic
amines are as follows o-anisidine is an important intermediate in pigment and azo dye
industry, chloroanilines is mainly used for manufacturing agricultural products, 1-
aminoactophenone is used as a precursor for the Victoria blue dyes, 8-Aminoquinoline is
used to produce the drug tenoxicam.
1.5 Thesis organization
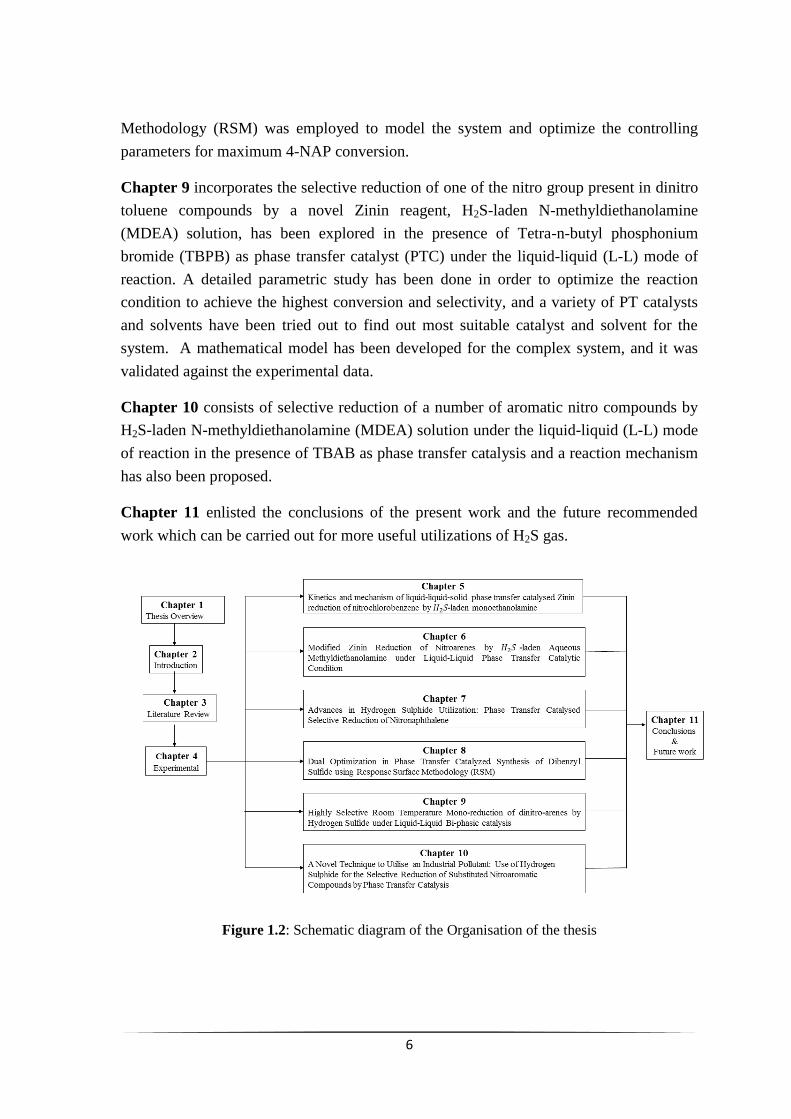
The structure of the thesis is illustrated in the Figure1.2. In more detail Chapter 2
provides an introduction in the area of different H2S capture and utilization methods, a
comprehensive study on the different phase transfer catalyst and mechanism of all existed
PTC systems and detailed research background on different nitroaromatic compound
reduction techniques has been discussed along with a brief discussion about Zinin
reduction, which is main operating method been followed in the in this study and a
comprehensive discussion of past approached of Zinin reduction have been included. At
the end of Chapter 2, a brief description about optimization of a chemical reaction by
changing one variable at a time (OVAT) method and statistical methods such as response
surface methodology have been included. Optimization of a chemical process is all
needed to be done before its industrial implementation and practice, which includes
5
understanding and finding variables responsible for a good outcome (yield, conversion).
Furthermore, Chapter 3 elaborates on the available techniques of absorption of H2S in
different media and utilization of H2S gas in the industry or at the laboratory scale. A
detailed discussion on the different reducing agent used for the reduction of nitroaromatic
compounds and the use of different phase transfer catalyst for the reduction of nitroarenes
have been included.
To this end Chapter 4 provides an insight about the chemicals has been utilised during
the reactions, preparation process of the stock solution of H2S laden Alkanolamines
(MEA, MDEA) and a detailed experimental process for L-L-S PTC and L-L PTC systems
have been shown followed by analysis procedure of collected samples from organic phase
in GC and GC-MS, and aqueous phase samples by iodometric titration method are
included.
Chapter 5 encompasses the use of solid catalyst Amberlite IR400 (Cl-) for the reduction
of Chloronitrobenzene under Liquid-Solid-Liquid (L-S-L) mode of reaction by -laden
N-methyldiethanolamine (MDEA). A detailed parametric study has been done and based
on the proposed mechanism a mathematical modeling has been established. Catalyst
recyclability has been optimized, and model has been validated against the experimental
data.
Chapter 6 deals with the reduction of chloronitrobenzene under Liquid-Liquid (L-L)
mode of reaction by -laden Monoethanolamine by using tetra-n-butyl phosphonium
bromide (TBAB) as phase transfer catalyst. A detailed parametric study has been done in
order to optimize operating conditions, a verity of PTC and organic solvents have been
examined for getting the highest conversion and selectivity. A reaction mechanism has
been proposed and based on the reaction mechanism a mathematical modeling has been
proposed, and the model has been validated against the experimental data.
Chapter 7 presents a reduction of 1-nitronaptalene by H2S-laden MDEA under the
Liquid-Liquid (L-L) mode of reaction in the presence of TBAB as phase transfer catalyst.
A detailed parametric study has been done in order to optimize operating conditions, and
a reaction mechanism has been proposed and based on the reaction mechanism a
mathematical modeling has been proposed. The model has been validated against the
experimental data.
Chapter 8 deals with the improved Zinin reduction of 4-Nitroacetophenone (4-NAP) was
studied with refinery generated toxic H2S dissolved in aqueous N-methyldiethanolamine
(MDEA) solution under Liquid-Liquid (L-L) phase transfer catalysis. Response Surface
6
Methodology (RSM) was employed to model the system and optimize the controlling
parameters for maximum 4-NAP conversion.
Chapter 9 incorporates the selective reduction of one of the nitro group present in dinitro
toluene compounds by a novel Zinin reagent, H2S-laden N-methyldiethanolamine
(MDEA) solution, has been explored in the presence of Tetra-n-butyl phosphonium
bromide (TBPB) as phase transfer catalyst (PTC) under the liquid-liquid (L-L) mode of
reaction. A detailed parametric study has been done in order to optimize the reaction
condition to achieve the highest conversion and selectivity, and a variety of PT catalysts
and solvents have been tried out to find out most suitable catalyst and solvent for the
system. A mathematical model has been developed for the complex system, and it was
validated against the experimental data.
Chapter 10 consists of selective reduction of a number of aromatic nitro compounds by
H2S-laden N-methyldiethanolamine (MDEA) solution under the liquid-liquid (L-L) mode
of reaction in the presence of TBAB as phase transfer catalysis and a reaction mechanism
has also been proposed.
Chapter 11 enlisted the conclusions of the present work and the future recommended
work which can be carried out for more useful utilizations of H2S gas.
Figure 1.2: Schematic diagram of the Organisation of the thesis
7
References
1 F. Faraji, Int. J. Hydrogen Energy, 1998, 23, 451–456.
2 S. Cervera-March, L. Borrell, J. Giménez, R. Simarro, Int. J. Hydrogen Energy,
1992, 17, 683–688.
3 H. Huang, Y. Yu and K. H. Chung, Energy & Fuels, 2009, 23, 4420–4425.
4 K. Petrov and S. Srinivasan, Int. J. Hydrogen Energy, 1996, 21, 163–169.
5 S. Srinivasan. and A. J. A. Z. Mao, A. Anani, R. E. White, J. Electrochem. Soc.,
1991, 138, 1299–1303.
6 J. O. N. E. Noringt and E. A. Fletchers, Energy, 1982, 7, 651–666.
7 Y. Zheng, K. Ma, H. Wang, X. Sun, J. Jiang, C. Wang, R. Li and J. Ma, Catal.
Letters, 2008, 124, 268–276.
8 P. G. Jessop, T. Ikariya and R. Noyori, Nature, 1994, 368, 231–233.
9 H. K. Porter, Org. React., 2011, 20, 455–481.
10 C. M. Starks, Am. Chem. Soc, 1987, 1–7.
11 M. Kumarraja and K. Pitchumani, Appl. Catal. A Gen., 2004, 265, 135–139.
12 K. Zhu, M. P. Shaver and S. P. Thomas, Chem. Sci., 2016, 7, 3031–3035.
13 M. H. Lin, B. Zhao and Y. W. Chen, Ind. Eng. Chem. Res., 2009, 48, 7037–7043.
14 F. E. Catino SC, Concise Encyclopaedia of Chemical Technology, John Wiley &
Sons, New York, 1985.
15 S. Sakaue, T. Tsubakino, Y. Nishiyama and Y. Ishii, J. Org. Chem., 1993, 58,
3633–3638.
16 A. P. A. Shabbir, H. Gheewala, Water Sci. Technol., 1997, 36, 53–63.
17 N. Boon, L. De Gelder, H. Lievens, S. D. Siciliano, E. M. Top and W. Verstraete,
Environ. Sci. Technol., 2002, 36, 4698–4704.
8
18 R. S. Downing, P. J. Kunkeler and H. vanBekkum, Catal. Today, 1997, 37, 121–
136.
19 H. G. Abdessamad Grirrane, Avelino Corma, Science, 2008, 322, 1661–1664.
20 R. M. Rohini, K. Devi and S. Devi, Der pharma Chem., 2015, 7, 77–83.
21 D. Joshi and K. S. Parikh, Med. Chem. Res., 2014, 23, 1855–1864.
22 M. W. Vibha Mishraa, S.N. Pandeyab, , E. DeClercqc, Christophe Pannecouquec,
Pharm. Acta Helv., 1998, 73, 215–218.
23 X.-L. Chen, Jin-Fang; Jia, Tao; Huang, Yingyong Huaxue, 2000, 17, 672–674.
24 A. Z. Manieh, A. A.; Sayed, Al-Azhar Bull. Sci., 1995, 6, 35–48.
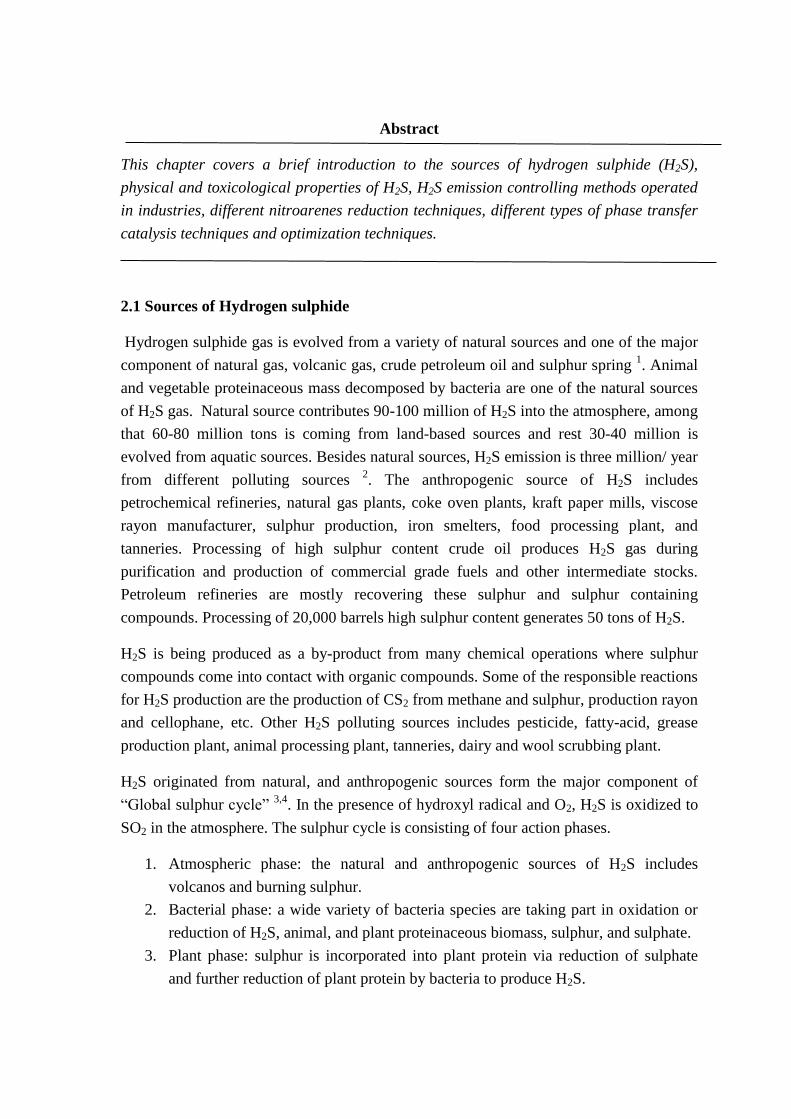
Abstract
This chapter covers a brief introduction to the sources of hydrogen sulphide (H2S),
physical and toxicological properties of H2S, H2S emission controlling methods operated
in industries, different nitroarenes reduction techniques, different types of phase transfer
catalysis techniques and optimization techniques.
2.1 Sources of Hydrogen sulphide
Hydrogen sulphide gas is evolved from a variety of natural sources and one of the major
component of natural gas, volcanic gas, crude petroleum oil and sulphur spring 1. Animal
and vegetable proteinaceous mass decomposed by bacteria are one of the natural sources
of H2S gas. Natural source contributes 90-100 million of H2S into the atmosphere, among
that 60-80 million tons is coming from land-based sources and rest 30-40 million is
evolved from aquatic sources. Besides natural sources, H2S emission is three million/ year
from different polluting sources 2. The anthropogenic source of H2S includes
petrochemical refineries, natural gas plants, coke oven plants, kraft paper mills, viscose
rayon manufacturer, sulphur production, iron smelters, food processing plant, and
tanneries. Processing of high sulphur content crude oil produces H2S gas during
purification and production of commercial grade fuels and other intermediate stocks.
Petroleum refineries are mostly recovering these sulphur and sulphur containing
compounds. Processing of 20,000 barrels high sulphur content generates 50 tons of H2S.
H2S is being produced as a by-product from many chemical operations where sulphur
compounds come into contact with organic compounds. Some of the responsible reactions
for H2S production are the production of CS2 from methane and sulphur, production rayon
and cellophane, etc. Other H2S polluting sources includes pesticide, fatty-acid, grease
production plant, animal processing plant, tanneries, dairy and wool scrubbing plant.
H2S originated from natural, and anthropogenic sources form the major component of
“Global sulphur cycle” 3,4
. In the presence of hydroxyl radical and O2, H2S is oxidized to
SO2 in the atmosphere. The sulphur cycle is consisting of four action phases.
1. Atmospheric phase: the natural and anthropogenic sources of H2S includes
volcanos and burning sulphur.
2. Bacterial phase: a wide variety of bacteria species are taking part in oxidation or
reduction of H2S, animal, and plant proteinaceous biomass, sulphur, and sulphate.
3. Plant phase: sulphur is incorporated into plant protein via reduction of sulphate
and further reduction of plant protein by bacteria to produce H2S.
9
4. Animal phase: animal protein is produced from plant protein and then reduced by
bacteria to generated H2S.
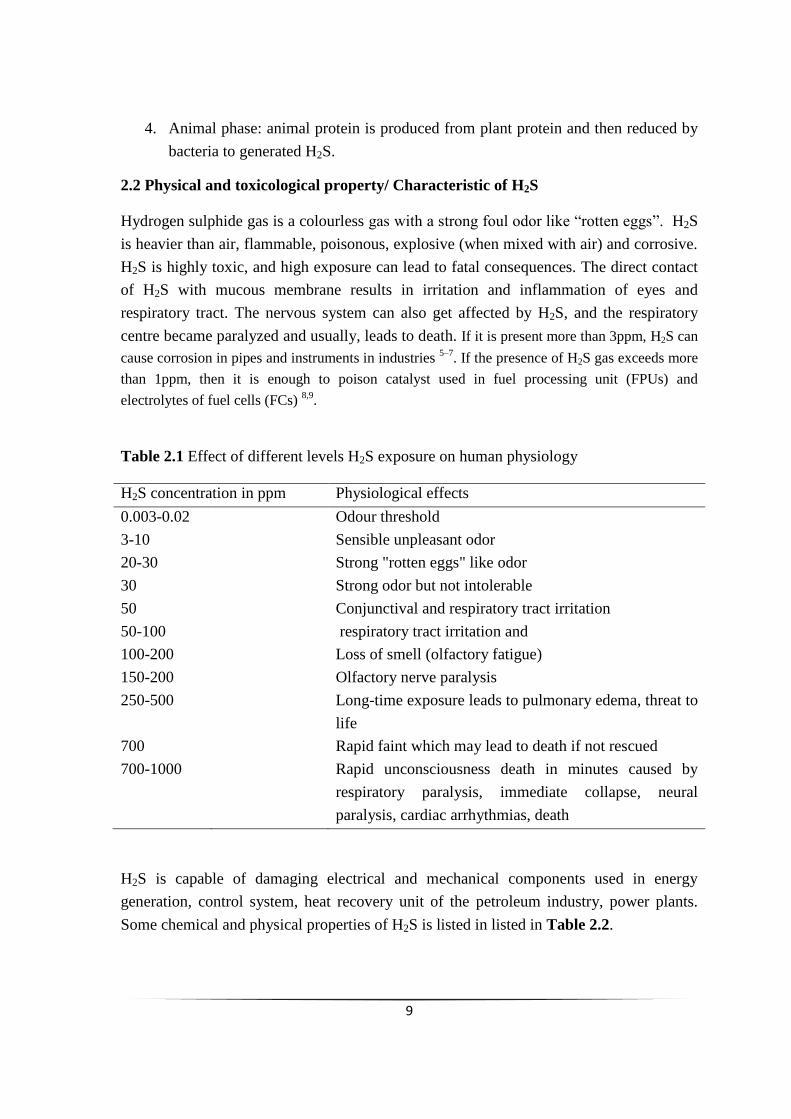
2.2 Physical and toxicological property/ Characteristic of H2S
Hydrogen sulphide gas is a colourless gas with a strong foul odor like “rotten eggs”. H2S
is heavier than air, flammable, poisonous, explosive (when mixed with air) and corrosive.
H2S is highly toxic, and high exposure can lead to fatal consequences. The direct contact
of H2S with mucous membrane results in irritation and inflammation of eyes and
respiratory tract. The nervous system can also get affected by H2S, and the respiratory
centre became paralyzed and usually, leads to death. If it is present more than 3ppm, H2S can
cause corrosion in pipes and instruments in industries 5–7
. If the presence of H2S gas exceeds more
than 1ppm, then it is enough to poison catalyst used in fuel processing unit (FPUs) and
electrolytes of fuel cells (FCs) 8,9
.
Table 2.1 Effect of different levels H2S exposure on human physiology
H2S concentration in ppm Physiological effects
0.003-0.02 Odour threshold
3-10 Sensible unpleasant odor
20-30 Strong "rotten eggs" like odor
30 Strong odor but not intolerable
50 Conjunctival and respiratory tract irritation
50-100 respiratory tract irritation and
100-200 Loss of smell (olfactory fatigue)
150-200 Olfactory nerve paralysis
250-500 Long-time exposure leads to pulmonary edema, threat to
life
700 Rapid faint which may lead to death if not rescued
700-1000 Rapid unconsciousness death in minutes caused by
respiratory paralysis, immediate collapse, neural
paralysis, cardiac arrhythmias, death
H2S is capable of damaging electrical and mechanical components used in energy
generation, control system, heat recovery unit of the petroleum industry, power plants.
Some chemical and physical properties of H2S is listed in listed in Table 2.2.
10
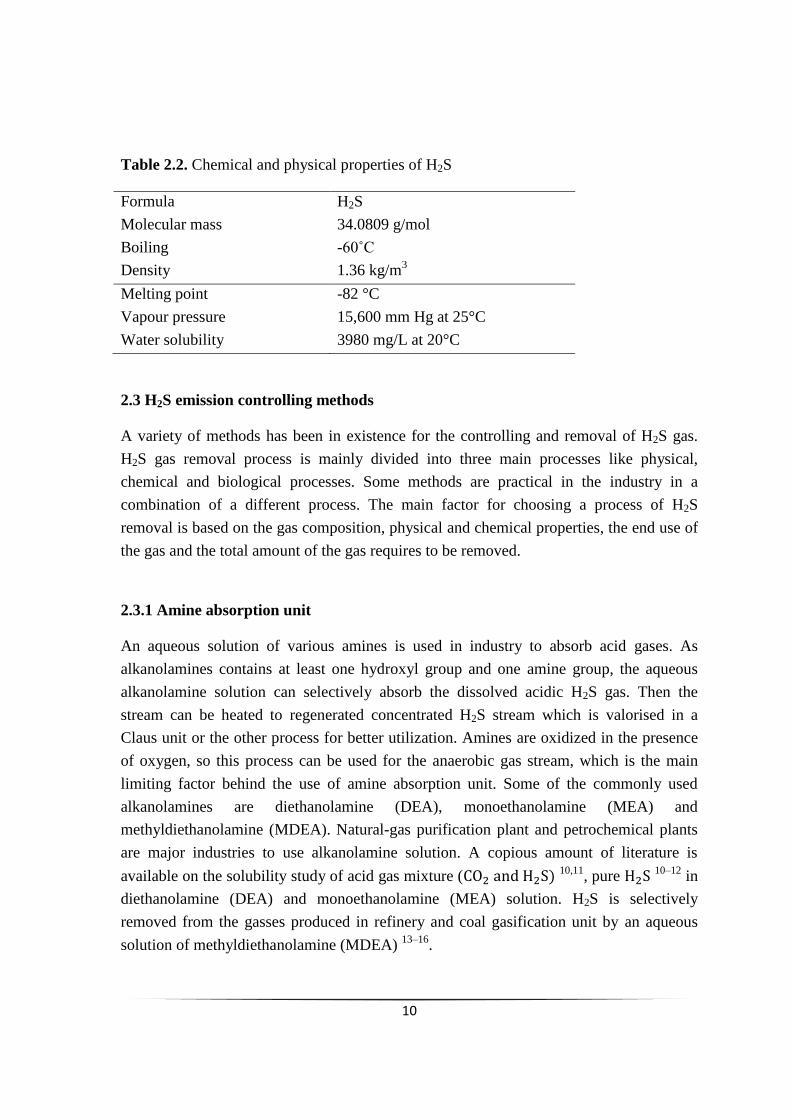
Table 2.2. Chemical and physical properties of H2S
Formula H2S
Molecular mass 34.0809 g/mol
Boiling -60˚C
Density 1.36 kg/m3
Melting point -82 °C
Vapour pressure 15,600 mm Hg at 25°C
Water solubility 3980 mg/L at 20°C
2.3 H2S emission controlling methods
A variety of methods has been in existence for the controlling and removal of H2S gas.
H2S gas removal process is mainly divided into three main processes like physical,
chemical and biological processes. Some methods are practical in the industry in a
combination of a different process. The main factor for choosing a process of H2S
removal is based on the gas composition, physical and chemical properties, the end use of
the gas and the total amount of the gas requires to be removed.
2.3.1 Amine absorption unit
An aqueous solution of various amines is used in industry to absorb acid gases. As
alkanolamines contains at least one hydroxyl group and one amine group, the aqueous
alkanolamine solution can selectively absorb the dissolved acidic H2S gas. Then the
stream can be heated to regenerated concentrated H2S stream which is valorised in a
Claus unit or the other process for better utilization. Amines are oxidized in the presence
of oxygen, so this process can be used for the anaerobic gas stream, which is the main
limiting factor behind the use of amine absorption unit. Some of the commonly used
alkanolamines are diethanolamine (DEA), monoethanolamine (MEA) and
methyldiethanolamine (MDEA). Natural-gas purification plant and petrochemical plants
are major industries to use alkanolamine solution. A copious amount of literature is
available on the solubility study of acid gas mixture ( 10,11
, pure 10–12
in
diethanolamine (DEA) and monoethanolamine (MEA) solution. H2S is selectively
removed from the gasses produced in refinery and coal gasification unit by an aqueous
solution of methyldiethanolamine (MDEA) 13–16
.
11
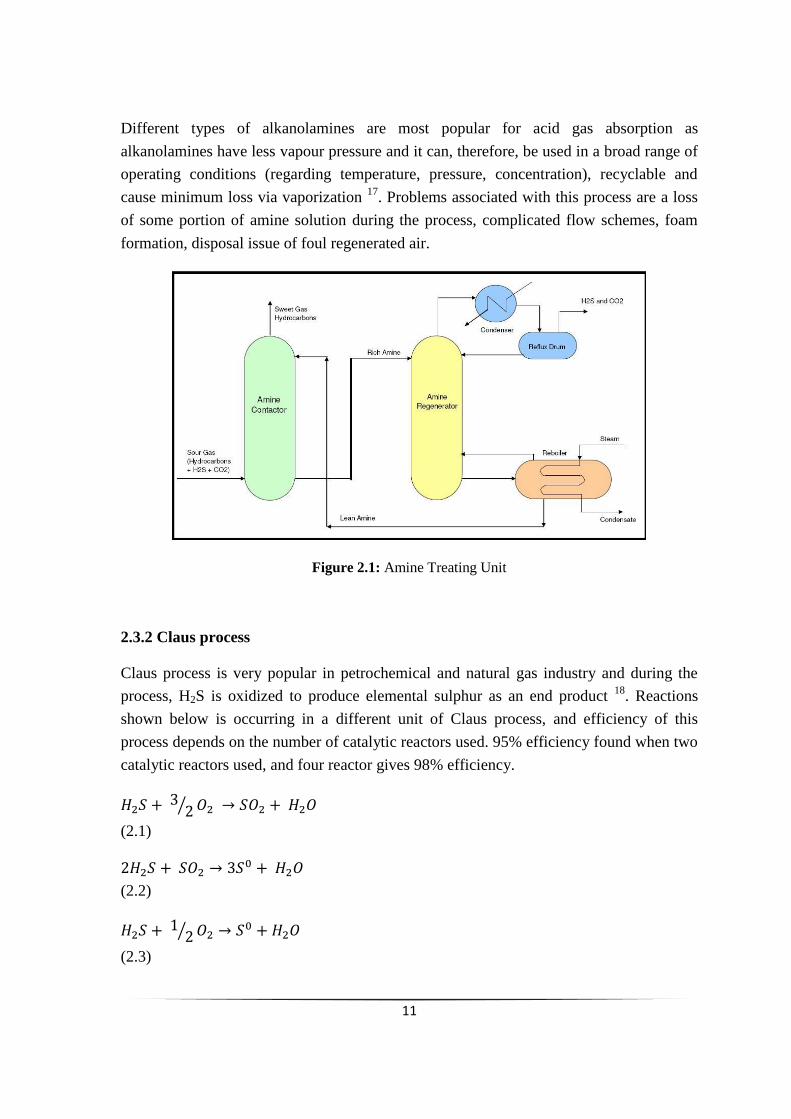
Different types of alkanolamines are most popular for acid gas absorption as
alkanolamines have less vapour pressure and it can, therefore, be used in a broad range of
operating conditions (regarding temperature, pressure, concentration), recyclable and
cause minimum loss via vaporization 17
. Problems associated with this process are a loss
of some portion of amine solution during the process, complicated flow schemes, foam
formation, disposal issue of foul regenerated air.
Figure 2.1: Amine Treating Unit
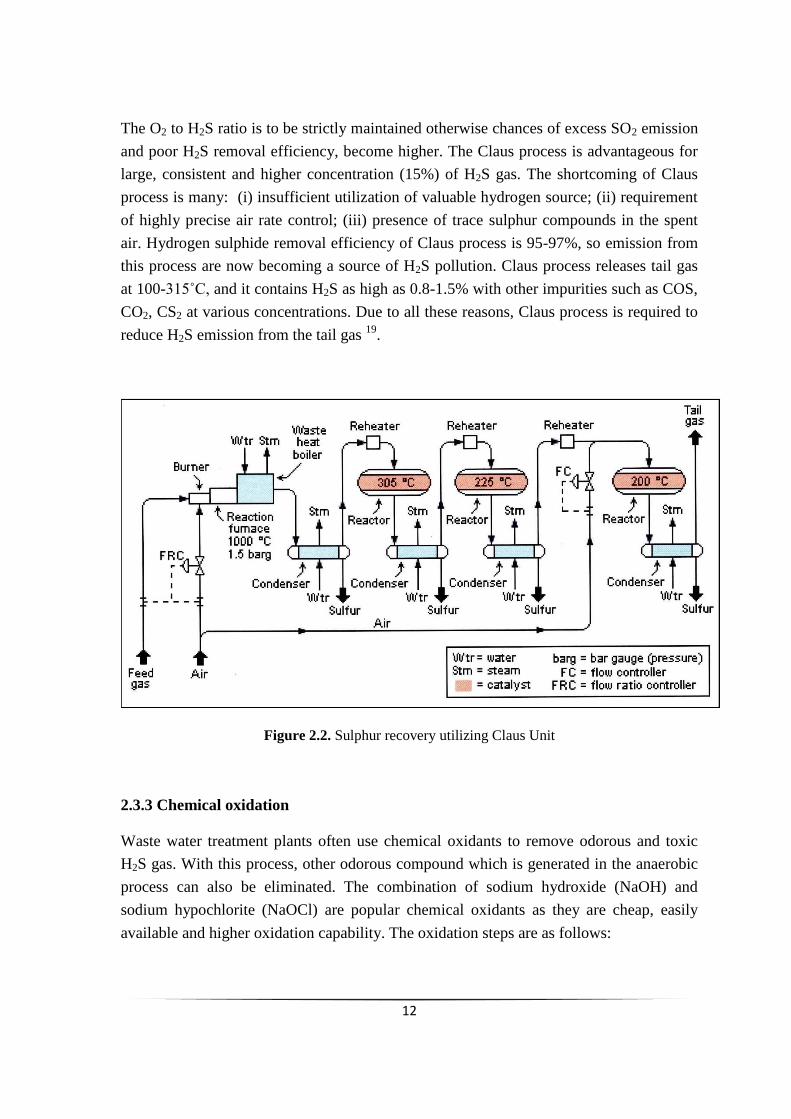
2.3.2 Claus process
Claus process is very popular in petrochemical and natural gas industry and during the
process, H2S is oxidized to produce elemental sulphur as an end product 18
. Reactions
shown below is occurring in a different unit of Claus process, and efficiency of this
process depends on the number of catalytic reactors used. 95% efficiency found when two
catalytic reactors used, and four reactor gives 98% efficiency.
⁄
(2.1)
(2.2)
⁄
(2.3)
12
The O2 to H2S ratio is to be strictly maintained otherwise chances of excess SO2 emission
and poor H2S removal efficiency, become higher. The Claus process is advantageous for
large, consistent and higher concentration (15%) of H2S gas. The shortcoming of Claus
process is many: (i) insufficient utilization of valuable hydrogen source; (ii) requirement
of highly precise air rate control; (iii) presence of trace sulphur compounds in the spent
air. Hydrogen sulphide removal efficiency of Claus process is 95-97%, so emission from
this process are now becoming a source of H2S pollution. Claus process releases tail gas
at 100-315˚C, and it contains H2S as high as 0.8-1.5% with other impurities such as COS,
CO2, CS2 at various concentrations. Due to all these reasons, Claus process is required to
reduce H2S emission from the tail gas 19
.
Figure 2.2. Sulphur recovery utilizing Claus Unit
2.3.3 Chemical oxidation
Waste water treatment plants often use chemical oxidants to remove odorous and toxic
H2S gas. With this process, other odorous compound which is generated in the anaerobic
process can also be eliminated. The combination of sodium hydroxide (NaOH) and
sodium hypochlorite (NaOCl) are popular chemical oxidants as they are cheap, easily
available and higher oxidation capability. The oxidation steps are as follows:
13
(2.4)
(2.5
In this process, the requirement of oxidants is proportional to the amount of H2S to be
treated, and so continuous supply of oxidants is necessary. In this process, the only low
concentration of H2S gas stream can be treated in an economical manner. The gas phase is
required to be converted into liquid phase as a reaction are occurring in the aqueous phase
in the scrubber. Counter current packed columns are preferred type of scrubbing process,
but other types of scrubbing processes are also used such as mist scrubber, spray scrubber,
and ventures. For avoiding salt precipitations, the scrubbing solution is periodically or
frequently removed and fresh solution is being added.
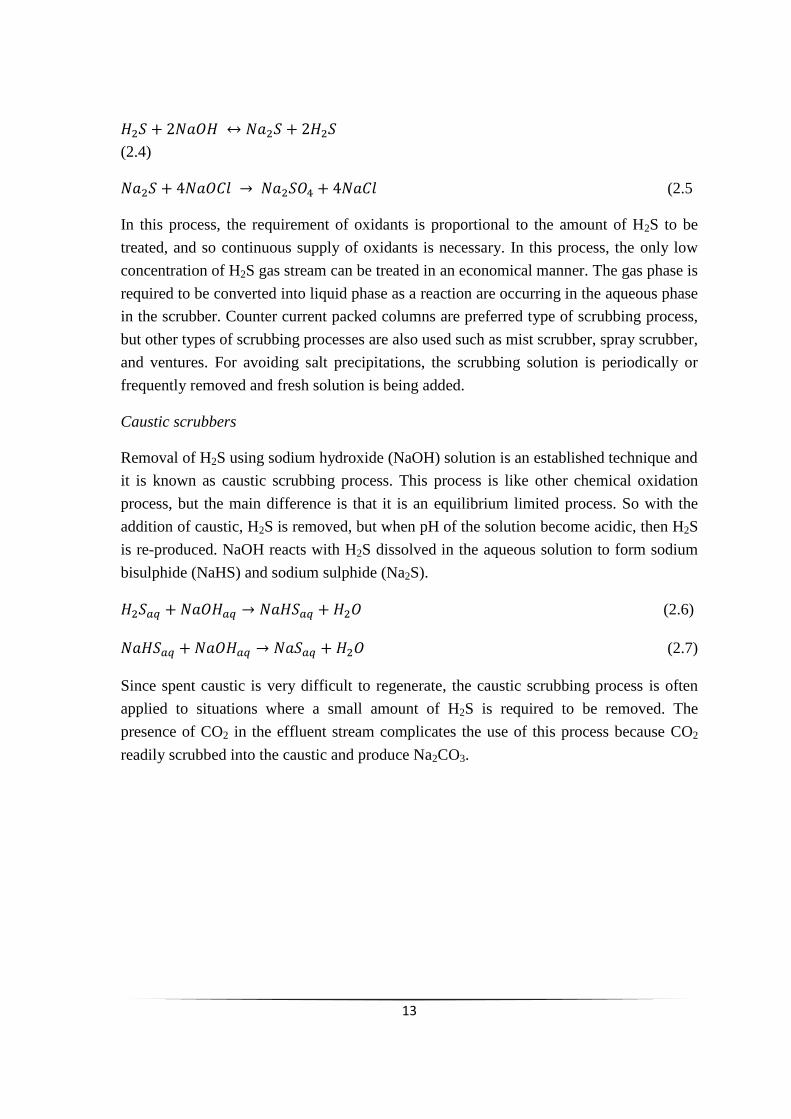
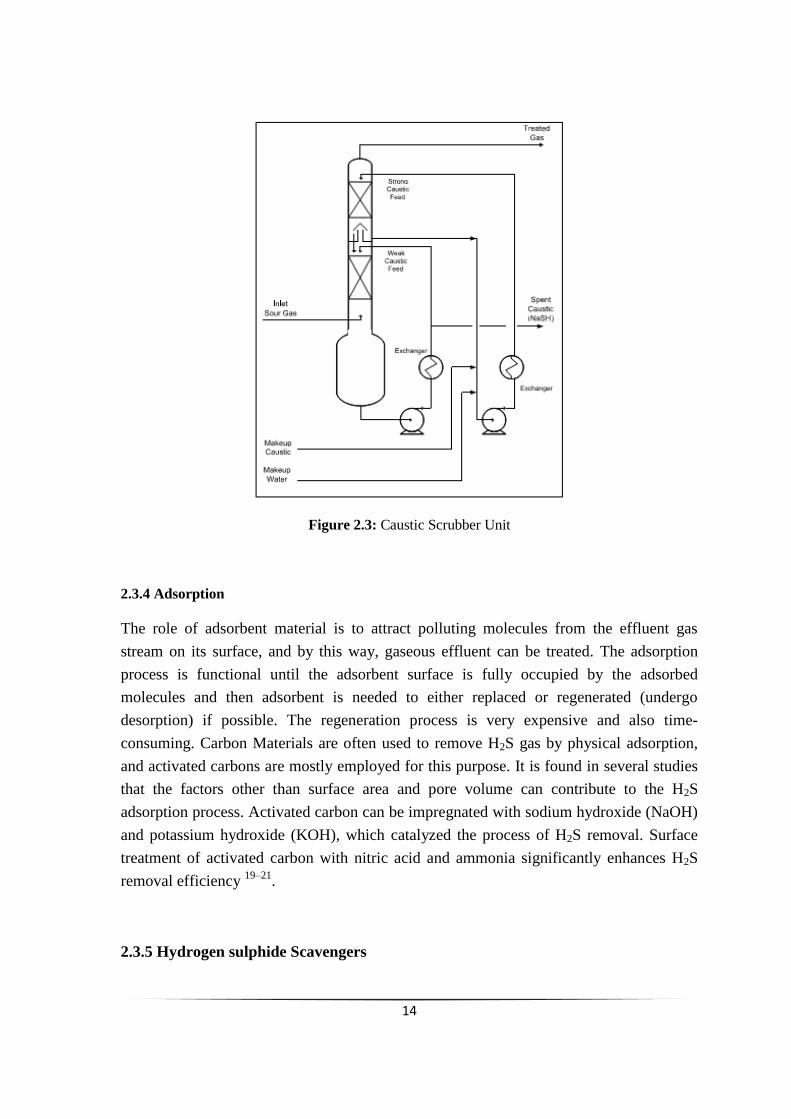
Caustic scrubbers
Removal of H2S using sodium hydroxide (NaOH) solution is an established technique and
it is known as caustic scrubbing process. This process is like other chemical oxidation
process, but the main difference is that it is an equilibrium limited process. So with the
addition of caustic, H2S is removed, but when pH of the solution become acidic, then H2S
is re-produced. NaOH reacts with H2S dissolved in the aqueous solution to form sodium
bisulphide (NaHS) and sodium sulphide (Na2S).
(2.6)
(2.7)
Since spent caustic is very difficult to regenerate, the caustic scrubbing process is often
applied to situations where a small amount of H2S is required to be removed. The
presence of CO2 in the effluent stream complicates the use of this process because CO2
readily scrubbed into the caustic and produce Na2CO3.
14
Figure 2.3: Caustic Scrubber Unit
2.3.4 Adsorption
The role of adsorbent material is to attract polluting molecules from the effluent gas
stream on its surface, and by this way, gaseous effluent can be treated. The adsorption
process is functional until the adsorbent surface is fully occupied by the adsorbed
molecules and then adsorbent is needed to either replaced or regenerated (undergo
desorption) if possible. The regeneration process is very expensive and also time-
consuming. Carbon Materials are often used to remove H2S gas by physical adsorption,
and activated carbons are mostly employed for this purpose. It is found in several studies
that the factors other than surface area and pore volume can contribute to the H2S
adsorption process. Activated carbon can be impregnated with sodium hydroxide (NaOH)
and potassium hydroxide (KOH), which catalyzed the process of H2S removal. Surface
treatment of activated carbon with nitric acid and ammonia significantly enhances H2S
removal efficiency 19–21
.
2.3.5 Hydrogen sulphide Scavengers
15
Sulphide scavengers refer to such chemicals (usually additives) that can react with single
or multiple sulphide species and convert them to a nonreactive inert form. This
scavenging process is more effective when the reaction is irreversible and complete
reaction takes place between sulphides and scavengers. Most scavengers remove the
sulphide species either through surface adsorption manner or by ionic precipitation. If the
surface adsorption technique is adopted, then the mud must be in constant flow for the
required interaction (collision) between the additive and the sulphides for the complete
reaction. For this purpose, turbulent flow regarded as best flow scheme as the molecules
are randomly colliding with each other which leads to higher reaction rate. Detailed
properties of scavengers have to be understood which follows ionic precipitation process
to assure that the properties like pH, salinity are favourable to the usage of the scrubbers 22
.
Few examples of scavengers are caustic and sodium nitrate solution, amines, iron-based
adsorbents, zinc-containing chemicals. Depending on the chemicals used the end product
will be different. These systems are supplied under trademarks by different companies.
LO-CAT®
(US Filter/Merichem) process is an example commercially available of H2S
scavenging system which utilizing chelated iron. This process removes 200 kg of S/day,
and this process is ideal for land filling gas 23
.
2.3.6 Liquid phase oxidation systems
Liquid phase oxidation systems convert hydrogen sulphide into elemental sulphur through
redox reaction by electron transfer from sources such as vanadium or iron. The first
liquid-phase oxidation system is known as the Stretford process. During this process, H2S
is initially absorbed into an aqueous alkali solution and then it is reacted with vanadium.
During this process, vanadium is reduced, and H2S is oxidized to produce elemental
sulphur. But this process is very slow, and it requires packed columns or venturies. As the
vanadium is toxic, this unit must be designed in such a way that both the solution and
„sulphur cake‟ can be cleaned easily. Due to these disadvantages now iron-based reagents
are utilized instead of Stradford process. By air oxidation, ferrous iron ( ) can be
regenerated and the reaction is faster than Stretford process. LO-CAT by US
Filter/Merichem, is a H2S removal system that utilises chelated iron solution. The basic
reaction are shown below in equation 2.8 and 2.9 below.
(2.8)
⁄ (2.9)
16
2.3.7 Physical solvents
Physical solvents are also used in practice to remove acid gases, such as H2S. During the
process, H2S is dissolved in a liquid and later H2S is recovered by reducing the pressure
of the system. For higher H2S removal efficiency, selection of liquid is important. Water
is widely available and free. Water is used in physical solvent- utilizing the process for
H2S removal. As water can also absorb CO2, this process is not economical for selective
removal H2S.
There are a number of other solvents are available like propylene carbonate, methanol,
and ethers of polyethylene glycol. The main criteria for selecting solvents are high
absorption capacity, very low reactivity with process instruments and gas constituents and
low viscosity. Loss of product is usually happening during this process. Losses as high as
10% is observed during this process.
2.3.8 Membrane process
This process is popular in biogas industry which utilizes a membrane to purify gas from
impurities. Permeation through the membrane is controlled by the partial pressure on
either side of the membrane. This membrane system is not mainly for selective removal
of H2S, but it is used to upgrade biogas to natural gas standards. Membrane process is
mainly two types (i) high pressure with gas phase on both sides of the membrane, (ii) low
pressure with a liquid adsorbent on one side. Biogas produced in anaerobic digesters is
upgraded by passing through cellulose acetate membrane.
2.3.9 Biological methods
Biogas can be treated with microorganisms to remove H2S. Microorganisms can use CO2
present in biogas as a carbon source (extra nutrient input can be neglected) and can
degrade H2S to produce elemental sulphur. Elemental sulphur build up in this process can
be removed easily without affecting the biomass and biomass clogging problem can be
avoided and thus this process can be operated under a wide range of process parameters
(O2/H2S ratio, temperature, moisture). Among many species of bacteria especially
Chemothrophic bacteria, particularly from the Thiobacillus genus shows the highest
efficiency in removing H2S. Chemotrophic thiobacteria can be operated in both aerobic
and anaerobic conditions. This bacteria can utilize CO2 a carbon source and acquired
chemical energy from the reduction reaction of H2S present in the medium. In both
reaction, H2S first dissociates shown in Eq. 2.10.
17
(2.10)
Elemental sulphur is produced under limited oxygen condition as shown in Eq. 2.11
(2.11)
Under excess O2 conditions, sulphate is produced, which leads to acidification as shown
in Eq. 2.12
(2.13)
Thiobacillus ferroxidans is a bacteria which can remove H2S by oxidizing to
. The resulting solution can be utilised to dissolve H2S and H2S can be further
oxidised to produce elemental sulphur. Biofilter and bioscrubber can be utilised to remove
H2S by biological removal processes. Thiopaq® is a commercially available H2S removal
system which utilises chemotrophic bacteria in alkaline environment to oxidise sulphide
to elemental sulphur. H2SPLUS SYSTEM® is another commercially available system
which operates on chemical and biological methods to remove H2S. In this system a filter
consisting an iron sponge inoculated with bacteria is used and this system is having
capacity of treating 225 kg H2S/day.
2.4 Phase transfer catalyst
Chemists always find difficulty to bring together two reagents which are mutually
insoluble in sufficient amount to attain required reaction rate. The useful solution for this
problem is to use a solvent which can dissolve both reagents. Use of a solvent is not
always an ultimate solution, and industrially it is not always viable to use solvents. The
technique of phase transfer catalysis is an alternative process that can be used efficiently
instead of solvents 24–26
.
In 1965 Mieczyslaw Makosza published a series of papers on the two-phase reaction
which he called “extractive alkylation” 27
. At the same time, Charles M. Starks filled
patents on “Catalysis of heterogeneous reactions”. Arne Brandstrom has worked with
reactions of quaternary ammonium salts in nonpolar media, and he mentioned non-
catalytic part as “ion pair extraction” 28
. Although Starks was the first person termed this
process as “phase transfer catalysis” and thereafter this is widely accepted 24,25,28
.
Currently, phase transfer catalyst has been utilized in total 600 industrial processes in a variety of
field such as dyestuff, perfumes, pharmaceuticals, flavors, polymers, etc. and the total cost of
phase transfer industry is as high as US $12 29,30
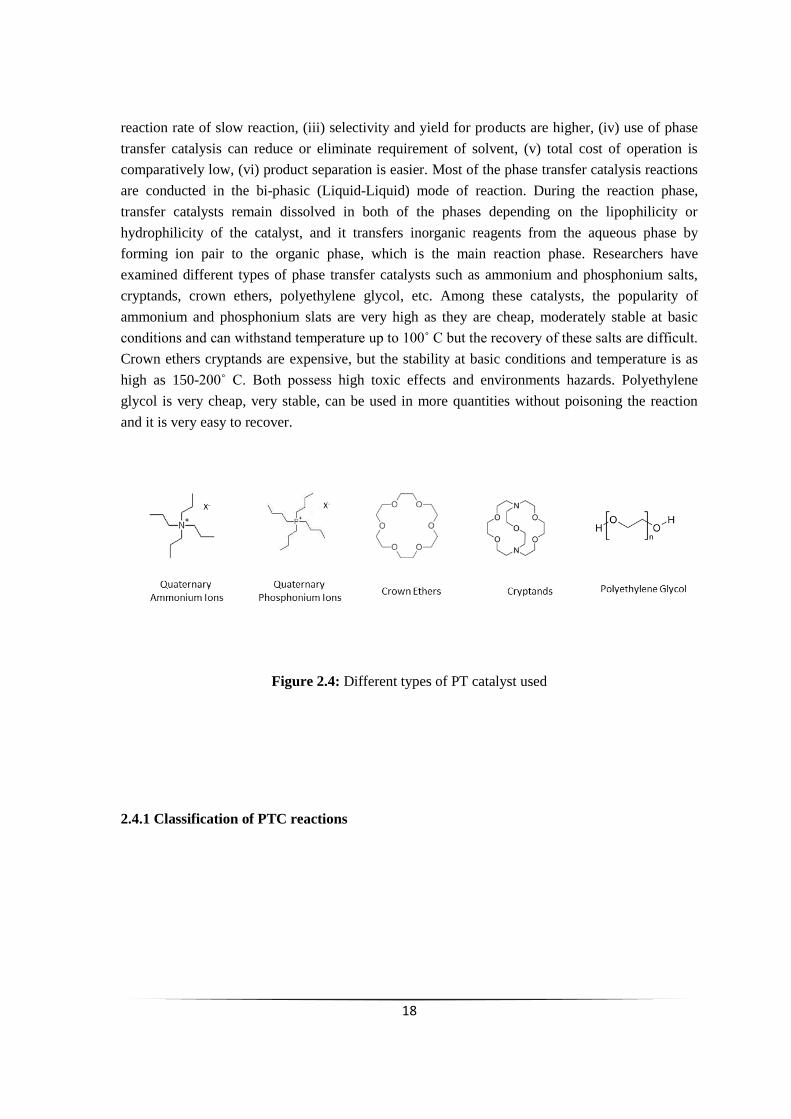
. Phase transfer catalyst are very popular due to
these advantages, (i) reaction medium and condition is milder and safer, (ii) it can easily enhance
18
reaction rate of slow reaction, (iii) selectivity and yield for products are higher, (iv) use of phase
transfer catalysis can reduce or eliminate requirement of solvent, (v) total cost of operation is
comparatively low, (vi) product separation is easier. Most of the phase transfer catalysis reactions
are conducted in the bi-phasic (Liquid-Liquid) mode of reaction. During the reaction phase,
transfer catalysts remain dissolved in both of the phases depending on the lipophilicity or
hydrophilicity of the catalyst, and it transfers inorganic reagents from the aqueous phase by
forming ion pair to the organic phase, which is the main reaction phase. Researchers have
examined different types of phase transfer catalysts such as ammonium and phosphonium salts,
cryptands, crown ethers, polyethylene glycol, etc. Among these catalysts, the popularity of
ammonium and phosphonium slats are very high as they are cheap, moderately stable at basic
conditions and can withstand temperature up to 100˚ C but the recovery of these salts are difficult.
Crown ethers cryptands are expensive, but the stability at basic conditions and temperature is as
high as 150-200˚ C. Both possess high toxic effects and environments hazards. Polyethylene
glycol is very cheap, very stable, can be used in more quantities without poisoning the reaction
and it is very easy to recover.
Figure 2.4: Different types of PT catalyst used
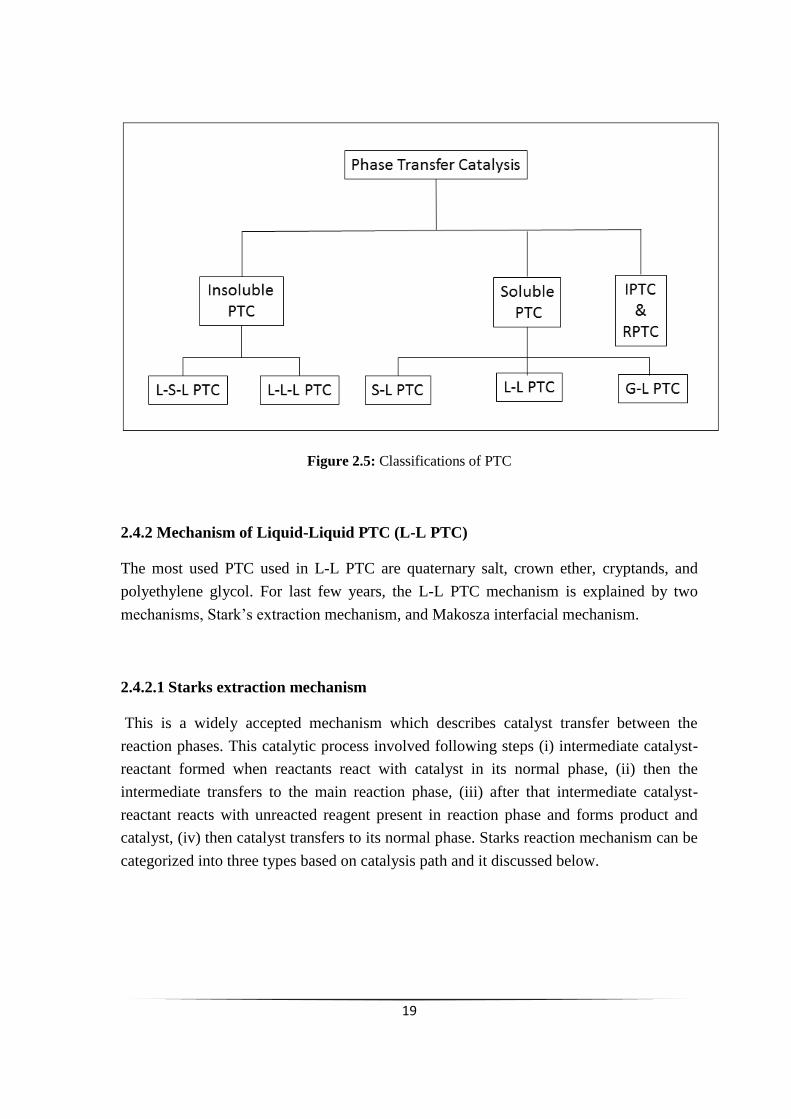
2.4.1 Classification of PTC reactions
19
Figure 2.5: Classifications of PTC
2.4.2 Mechanism of Liquid-Liquid PTC (L-L PTC)
The most used PTC used in L-L PTC are quaternary salt, crown ether, cryptands, and
polyethylene glycol. For last few years, the L-L PTC mechanism is explained by two
mechanisms, Stark‟s extraction mechanism, and Makosza interfacial mechanism.
2.4.2.1 Starks extraction mechanism
This is a widely accepted mechanism which describes catalyst transfer between the
reaction phases. This catalytic process involved following steps (i) intermediate catalyst-
reactant formed when reactants react with catalyst in its normal phase, (ii) then the
intermediate transfers to the main reaction phase, (iii) after that intermediate catalyst-
reactant reacts with unreacted reagent present in reaction phase and forms product and
catalyst, (iv) then catalyst transfers to its normal phase. Starks reaction mechanism can be
categorized into three types based on catalysis path and it discussed below.
20
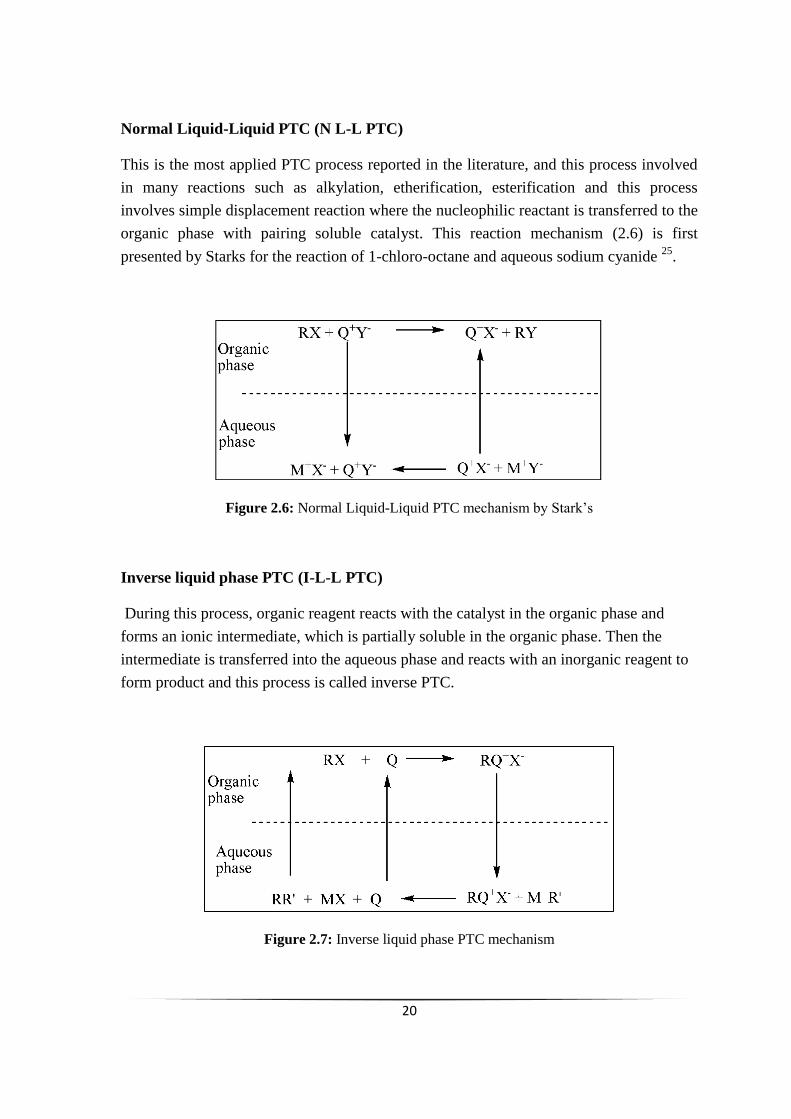
Normal Liquid-Liquid PTC (N L-L PTC)
This is the most applied PTC process reported in the literature, and this process involved
in many reactions such as alkylation, etherification, esterification and this process
involves simple displacement reaction where the nucleophilic reactant is transferred to the
organic phase with pairing soluble catalyst. This reaction mechanism (2.6) is first
presented by Starks for the reaction of 1-chloro-octane and aqueous sodium cyanide 25
.
Figure 2.6: Normal Liquid-Liquid PTC mechanism by Stark‟s
Inverse liquid phase PTC (I-L-L PTC)
During this process, organic reagent reacts with the catalyst in the organic phase and
forms an ionic intermediate, which is partially soluble in the organic phase. Then the
intermediate is transferred into the aqueous phase and reacts with an inorganic reagent to
form product and this process is called inverse PTC.
Figure 2.7: Inverse liquid phase PTC mechanism
21
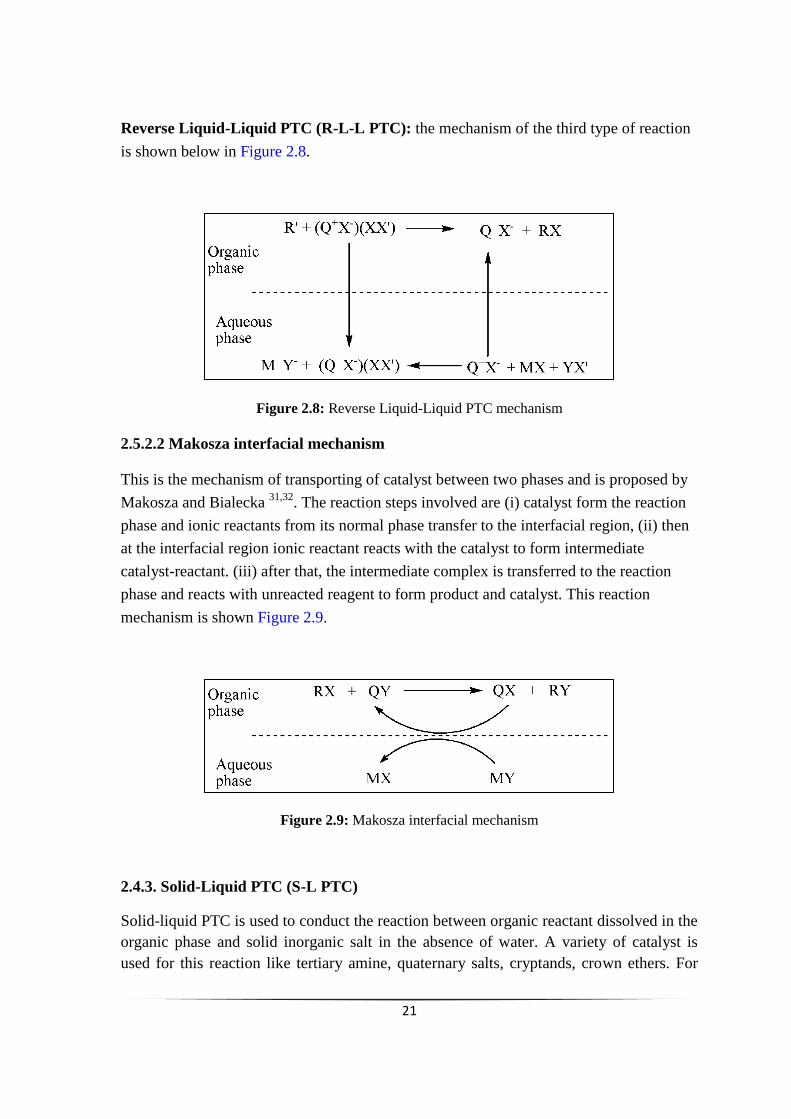
Reverse Liquid-Liquid PTC (R-L-L PTC): the mechanism of the third type of reaction
is shown below in Figure 2.8.
Figure 2.8: Reverse Liquid-Liquid PTC mechanism
2.5.2.2 Makosza interfacial mechanism
This is the mechanism of transporting of catalyst between two phases and is proposed by
Makosza and Bialecka 31,32
. The reaction steps involved are (i) catalyst form the reaction
phase and ionic reactants from its normal phase transfer to the interfacial region, (ii) then
at the interfacial region ionic reactant reacts with the catalyst to form intermediate
catalyst-reactant. (iii) after that, the intermediate complex is transferred to the reaction
phase and reacts with unreacted reagent to form product and catalyst. This reaction
mechanism is shown Figure 2.9.
Figure 2.9: Makosza interfacial mechanism
2.4.3. Solid-Liquid PTC (S-L PTC)
Solid-liquid PTC is used to conduct the reaction between organic reactant dissolved in the
organic phase and solid inorganic salt in the absence of water. A variety of catalyst is
used for this reaction like tertiary amine, quaternary salts, cryptands, crown ethers. For
22
the normal bi-phasic system, the nucleophile present in the aqueous phase is insoluble or
slightly soluble in the organic phase. In the absence of water, the inorganic salt should
produce anion nucleophile, such that unwanted side reaction can be avoided. Other than
this SL PTC can promote the weak nucleophiles and it enhances the reactivity by
minimizing hydrolysis effect.
The advantages of this process include (i) easy separation of products from reactants, (ii)
easy selection of organic solvents, (iii) easy recovery of catalyst, (iv) elimination of a side
reaction, (v) high potential for commercial application.
2.4.4 Gas-Liquid PTC (G-L PTC)
In this process, the organic reagent present in gaseous form passes over the solid
inorganic reactant which is coated with PTC in a semi-liquid form. It is advantageous
over L-L PTC as a continuous flow of organic gaseous reactant over the solid surface of
inorganic reactant, which gives higher reaction rate. Recovery of the catalyst is easy as it
is directly loaded on inorganic phase and easy to avoid unwanted side reaction due to the
absence of hydrolysis. For GL PTC operation, PTC should be thermally stable as high
energy is required to carry out the process in gaseous form.
2.4.5 Liquid-Solid-Liquid PTC (L-S-L PTC)
L-L PTC mode of reaction allows reaction between two immiscible phases. However, this
bi-phasic system always encounters the problem of purifying the product from the
mixture and recycling of catalyst. Regen was the first person to use solid catalyst, which
was a polymer-supported catalyst, in which a tertiary amine was immobilized on the
polymer support. For the industrial use, this catalyst is most suitable to use as it can be
separated very easily by filtration or centrifugation. Plug flow reactor and continuous
stirred tank reactor can be used effectively to carry out this L-S-L PTC system. Thus this
process is having a high potential for industrial application.
The steps involve the reaction of triphase catalysis are as follows (i) reactants from both
the phases will transfer to the surface of the catalyst pellet, (ii) diffusion of reactants
through the pores of the catalyst to reach out the active site of catalyst (the sites where
quaternary salts are impregnated on polymer support), (iii) intrinsic reaction between the
reagent present at the active site of the catalyst with the unreacted reagent present in the
bulk phase. Diffusion of both the phases within the solid support is important, and a
number of the mechanism is proposed for a variety of reactions. The reaction mechanism
is shown in the Figure 2.10.
23
Figure 2.10: Liquid-solid-Liquid PTC mechanism
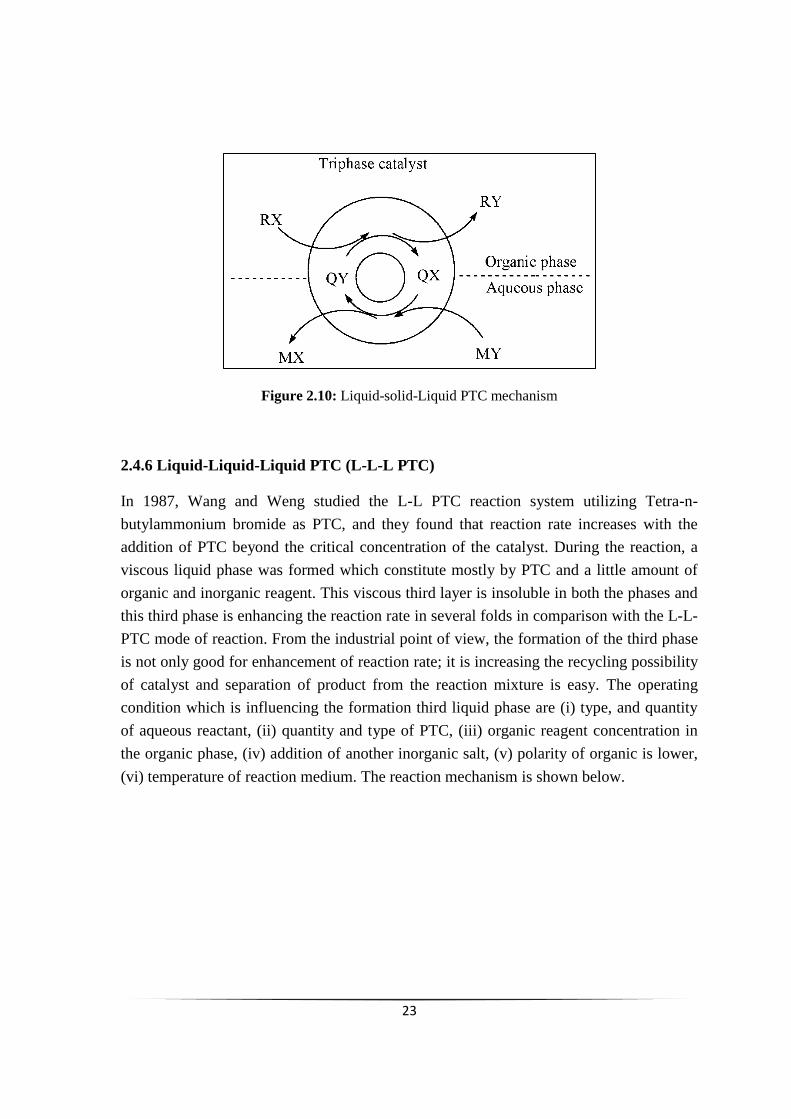
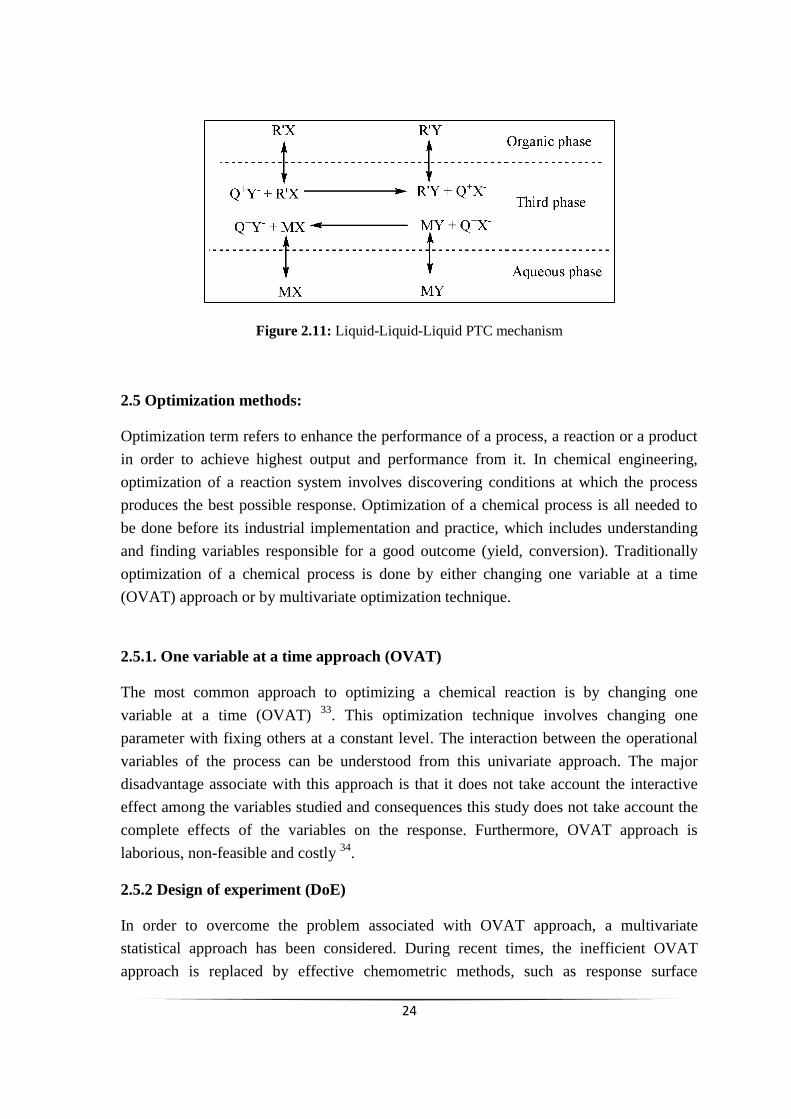
2.4.6 Liquid-Liquid-Liquid PTC (L-L-L PTC)
In 1987, Wang and Weng studied the L-L PTC reaction system utilizing Tetra-n-
butylammonium bromide as PTC, and they found that reaction rate increases with the
addition of PTC beyond the critical concentration of the catalyst. During the reaction, a
viscous liquid phase was formed which constitute mostly by PTC and a little amount of
organic and inorganic reagent. This viscous third layer is insoluble in both the phases and
this third phase is enhancing the reaction rate in several folds in comparison with the L-L-
PTC mode of reaction. From the industrial point of view, the formation of the third phase
is not only good for enhancement of reaction rate; it is increasing the recycling possibility
of catalyst and separation of product from the reaction mixture is easy. The operating
condition which is influencing the formation third liquid phase are (i) type, and quantity
of aqueous reactant, (ii) quantity and type of PTC, (iii) organic reagent concentration in
the organic phase, (iv) addition of another inorganic salt, (v) polarity of organic is lower,
(vi) temperature of reaction medium. The reaction mechanism is shown below.
24
Figure 2.11: Liquid-Liquid-Liquid PTC mechanism
2.5 Optimization methods:
Optimization term refers to enhance the performance of a process, a reaction or a product
in order to achieve highest output and performance from it. In chemical engineering,
optimization of a reaction system involves discovering conditions at which the process
produces the best possible response. Optimization of a chemical process is all needed to
be done before its industrial implementation and practice, which includes understanding
and finding variables responsible for a good outcome (yield, conversion). Traditionally
optimization of a chemical process is done by either changing one variable at a time
(OVAT) approach or by multivariate optimization technique.
2.5.1. One variable at a time approach (OVAT)
The most common approach to optimizing a chemical reaction is by changing one
variable at a time (OVAT) 33
. This optimization technique involves changing one
parameter with fixing others at a constant level. The interaction between the operational
variables of the process can be understood from this univariate approach. The major
disadvantage associate with this approach is that it does not take account the interactive
effect among the variables studied and consequences this study does not take account the
complete effects of the variables on the response. Furthermore, OVAT approach is
laborious, non-feasible and costly 34
.
2.5.2 Design of experiment (DoE)
In order to overcome the problem associated with OVAT approach, a multivariate
statistical approach has been considered. During recent times, the inefficient OVAT
approach is replaced by effective chemometric methods, such as response surface
25
methodology (RSM), based on statistical approach as the design of experiments (DoE) 35
.
RSM is used for modeling engineering problems, and its main approach of solving is a
combination of statistical and mathematical methods 36
. This statistical method can be
applied to study the relationship between independent variables and response for
multivariable systems 37,38
. Moreover, maximum response is achieved through
determination of the optimal factorial combination of variables. RSM is a combination of
mathematical and statistical techniques based on the fit of a polynomial equation to the
experimental data, which must trace the behavior of the experimental data set in order to
make statistical previsions.
An experimental design should be adopted which will specify the number of experiments
to be carried out in the experimental region, before applying RSM methodology. Some
experimental matrixes are available for this purpose. When the experimental data does not
represent curvature, experimental designs for first order design can be adopted. In order to
approximate a response function based upon experimental data set is unable to describe
by linear functions, for those quadratic response surface should be used, such as Box-
Behnken, three-level factorial, Doehlert and central composite design.
References
1 D. F. Adams, S. O. Farwell, M. R. Pack and W. L. Bamesberger, J. Air Pollut. Control
Assoc., 1979, 29, 380–383.
2 P. Urone, Air Pollution, Vol 1, Academic Press, New York, 3rd edn., 1976, p. 23.
3 J. P. Friend, in Chemistry of the Lower Atmosphere, ed. S. I. Rasool, Springer US, Boston,
MA, 1973, pp. 177–201.
4 P. J. Maroulis, A. R. Bandy, Science., 1977, 196, 647–648.
5 S. K. Maity, N. C. Pradhan and A. V. Patwardhan, Appl. Catal. B Environ., 2008, 77, 418–
426.
6 K. Polychronopoulou, J. L. G. Fierro and A. M. Efstathiou, Appl. Catal. B Environ., 2005,
57, 125–137.
7 S. Rezaei, A. Tavana, J. A. Sawada, L. Wu, A. S. M. Junaid and S. M. Kuznicki, Ind. Eng.
Chem. Res., 2012, 51, 12430–12434.
8 P. Dhage, A. Samokhvalov, D. Repala, E. C. Duin and B. J. Tatarchuk, Phys. Chem.
Chem. Phys., 2011, 13, 2179–2187.
9 L. Li and D. L. King, Catal. Today, 2006, 116, 537–541.
10 J. D. Lawson and A. W. Garst, J. Chem. Eng. Data, 1976, 21, 20–30.
26
11 E. E. Isaacs, D. Otto and E. Alan, Engineering, 1980, 118–120.
12 J. I. I. Lee, F. D. Otto and A. E. Mather, J. Chem. Eng. Data, 1976, 21, 207–208.
13 A. B. G. Astarita, D. W. Savage, Gas Treating with Chemical Solvents, John Wiley &
Sons, 1983.
14 S. K. Maity, N. C. Pradhan and A. V. Patwardhan, Appl. Catal. A Gen., 2006, 301, 251–
258.
15 B. P. Mandal, A. K. Biswas and S. S. Bandyopadhyay, Sep. Purif. Technol., 2004, 35,
191–202.
16 H. Xu, C. Zhang and Z. Zheng, Simulation, 2002, 2953–2956.
17 A. Kohl and R. Nielsen, Gas purification, Gulf Publishing Company, Houston,TX, 1997.
18 M. Plummer, US Pat.,US5334363 A, 1994.
19 W. Feng, S. Kwon, E. Borguet and R. Vidic, Environ. Sci. Technol., 2005, 39, 9744–9749.
20 T. J. Bandosz, Catal. Today, 1999, 37, 483–491.
21 T. J. Bandosz, J. Colloid Interface Sci., 2002, 246, 1–20.
22 G. Nagl, Chem. Eng., 1997, 104, 125–131.
23 N. Abatzoglou and S. Boivin, Biofuels, Bioprod. Biorefining, 2009, 3, 42–71.
24 C. M. Starks and R. M. Owens, J. Am. Chem. Soc., 1973, 95, 3613–3617.
25 C. M. Starks, J. Am. Chem. Soc., 1971, 93, 195.
26 S. S. Dehmlow, E. V.; Dehmlow, Phase Transfer Catalysis, Verlag Chemie Weinheim,
2nd edn., 1983.
27 M. Makosza, Tetrahedron Lett., 1966, 38, 4621–4624.
28 W. Weber and G. W. Gokel, Phase transfer catalysis in organic synthesis, Springer
Science & Business Media, 2012, vol. 4.
29 G. D. Yadav, Top. Catal., 2004, 29, 145–161.
30 M. E. H. Charles M. Starks, Charles L. Liotta, Phase-Transfer Catalysts, Chapman and
Hall Publications, New York, 1994.
31 E. Makosza, M.; Bialecka, Tetrahedron Lett., 1977, 2, 183–186.
32 M. Makosza, Pure Appl. Chem., 1975, 43, 439–462.
33 M. A. Schwindt, T. Lejon and L. S. Hegedus, Organometallics, 1990, 9, 2814–2819.
34 O. W. Gooding, Curr. Opin. Chem. Biol., 2004, 8, 297–304.
35 M. S. Tanyildizi, D. Özer and M. Elibol, Process Biochem., 2005, 40, 2291–2296.
27
36 P. Elavarasan, K. Kondamudi and S. Upadhyayula, Chem. Eng. J., 2009, 155, 355–360.
37 D.C. Montgomery, Design and Analysis of Experiments, John Wiley and Sons, New York,
fifth., 2001.
38 A.I. Khuri, J.A. Cornell, Response Surfaces: Design and Analyses, Dekker, New York,
1987.
Abstract
This chapter contains all the literature that have been utilised in order to carry out this
investigation.
3.1 H2S removal form gaseous stream
H2S is an acidic gas and its separation from natural gas, and gaseous by-product stream is
one of the major challenges faced by the industry. H2S is a hazardous gas when is
oxidised to SO2; it can cause acid rain. The removal process of H2S gas is very critical as
H2S is very malodorous and toxic. Among the available techniques H2S removal process
falls into the following categories, (i) absorption in a solution which is either aqueous and
caustic solution, (ii) absorption on solid materials such as activated carbon or impregnated
activated carbon, (iii) sulphur oxidizing microorganism can convert sulphur compounds
to elemental sulphur1. During the investigation of different techniques of removal of H2S,
different types of solid adsorbents have been found like metal oxides, activated carbon
and zeolites. Activated carbon is used to absorb H2S from a gas stream as a virgin or
impregnated activated carbon. Impregnated activated carbon with alkaline or oxide solids
yield enhanced the efficiency of removing H2S in comparison with virgin activated
carbon 2,3
. The most common disadvantages of activated carbon are its mechanical
stability which causes tortuosity and presence of a large number of micropores lead to the
formation of fines 4. A variety of metal oxides (Cu, Zn, Co, Ce, Fe, Mo, Sn, Mn, W and
Ni) have been used to remove H2S. Among these metals, desulfurization abilities of
tungsten and molybdenum are highest but their application in limited in a narrow
temperature range due to carbide formation 5. Zn-based sorbents have also found
widespread use in H2S removal, and it can be used at the higher reaction temperature 6–8
.
28
At the temperature range of 400-500 °C, zinc oxide can be used to capture pure H2S gas
but at a reduced temperature of 200-300 °C, ZnO losses the efficiency of sulfidation.
Doping ZnO with Cu helps to accelerate the sulfidation reaction 9. During adsorption of
H2S by Copper oxide, it reduces to metallic copper by the H2 and CO present in the gas,
and it reduces the efficiency. Similar studies also show that metal oxides are not proper
adsorbent to remove H2S gas due to their thermodynamic equilibrium. Zeolites are very
effective in removal of H2S, and it is certainly known as molecular sieves 10
. Natural
zeolites have been investigated for the adsorption of H2S at different temperatures
between 100 °C to 600 °C 11
. Graphene is achieving popularity as an adsorbent for H2S,
and it can selectively adsorb H2S gas. Thus it can be used as H2S sensor 12
. H2S adsorbing
capacity of graphene can be enhanced by doping it with metal/ non-metal or relevant
functional groups 13,14
. A novel process has been developed for removing H2S gas using
cupric chloride solution. It removes H2S by reaction with it and produces CuS deposition,
and it is followed by the oxidation in the presence of an excessive cupric ion in another
reactor 15
. Triamine-grafted pore-expanded mesoporous silica (TRI-PE-MCM-41) can
adsorb H2S and CO2 selectively. However the adsorption of both gases is diffusion
limited but the optimum temperature of CO2 adsorption was 348 K, and for H2S it is
298K 16
. Hollow fibre membrane contractors equipped with expanded
polytetrafluoroethylene (ePTFE) hollow fibres was used to remove H2S gas at high
pressure. In this module, a mixture of distilled water, sodium hydroxide and amine
solutions has been used as a chemical solvent 17,18
.
Room temperature ionic liquids (ILs) are metal salts that remain in liquid form over a
wide array of temperature. In the past few years, a number of research have been done on
the solubility of H2S in ILs and solubility data of the absorption of H2S in different ionic
liquids such as 1-butyl-3-methylimidazolium-based ILs with different anions,
bis(trifluoromethyl) sulfonylimide based ILs with different cations 13
, [bmin] [PF6],
[bmim] [BF4], [bmim] [Tf2N] have been documented. Caprolactam tetrabutyl ammonium
bromide has also been tried out 19–22
. H2S is selectively removed from the gaseous
mixture by methanol when the various contactor is employed such as a tray, spray or
packed tower in which the gas mixture is released upwardly in counter current to the
liquid flow 23
. Stretford process uses an aqueous solution of sodium carbonate, sodium
bicarbonate and anthraquinone disulfonic acid to dissolve oxygen in the aqueous solution
in the order to oxidise the H2S to sulphur. But the reaction is slow and for enhancing the
reaction rate, alkali vanadates are added. Vanadats are toxic, and the main disadvantages
of this process are a high amount of sulphur cake formation and release of discharge
solution 24
. Alkaline hypochlorite, hydrogen peroxide, sodium hydroxide has been
traditionally used as an economical absorbent. Sodium hydroxide solution is very
29
effective, but it is non-generable absorbent for H2S. Thus the use of caustic soda is limited
for absorption these impurities 25
.
Ammonium hydroxide has been popularly used to remove and recover H2S gas from
different gas streams. A continuous process of H2S removal has been proposed where gas
streams are contacted with a solution of ammonium hydroxide to produce ammonium
sulphide. Then the ammonium sulphide is fed to the heating zone and with the supply of
oxygen, it got oxidised to elemental sulphur 26
. Ammonium sulphide recovered from the
contacting zone can also convert to ammonium polysulphide in an electrolytic cell at
ambient pressure and temperature. Then it is oxidised in the heating zone to produce
elemental sulphur 27
. Rumpf et al. (1999) have studied the solubility of ammonia and H2S
in a simultaneous manner at a temperature range of 313 K to 393 K at a total pressure of
0.7 MPa.
Among the green sulphur bacteria, the phototropic bacteria are one of the species such as
Cholorobium limicola which is capable of oxidising H2S to elemental sulphur under
anaerobic condition. The bacteria requires CO2 and inorganic nutrients for growth 27,28
.
The most common bioreactor which has been used for H2S removal involving phototropic
bacteria are gas-fed batch reactor, continuous flow reactor, photo tube reactor.
Chemotrops are species of bacteria such as Thiobacillus, Thermothrix, Beggiato has been
studied for the oxidation of sulphide compounds (hydrogen sulphide, thiosulphate)28
. The
gas-fed batch reactor, scrubbers, biofilters, biotrickling filters are the reactors that use
chemotropic bacteria 29
.
Alkanolamine based solvents are one of the most commonly used solvents for the
removal of acid gases. H2S gas will react with an alkanolamine solution via a reversible,
exothermic reaction in a gas/liquid contactor. The absorption step is followed by the
regeneration of acid gas. The most commonly used industrially important alkanolamines
are monoethanolamine (MEA), diethanolamine (DEA), di-isopropanol amine (DIPA), N-
methydiethnolamine (MDEA) 30
. Alkanolamine based separation process are more
popular as it is having more advantageous over ammonia-based processes due to its
unique property like less vapour pressure that allows flexible process operation (regarding
concentration, temperature, pressure), minimum vapourisation loss, easily recyclable 31
.
Study on equilibrium solubility and mathematical model of pure 32–34
, a mixture of
and C in diethanolamine (DEA) and monoethanolamine (MEA) solution have
been established based on the experimental solubility data. An aqueous solution of
methyldiethanolamine (MDEA) can absorb H2S gas selectively from natural gas, refinery
exhaust gases and produce from the coal gasification unit 35–38
. MDEA is advantageous
over other alkanolamines as it possesses some qualities like minimum corrosion effect,
30
reduced solvent loss due to less vapour pressure, chemically stable and economically
beneficial. H2S selectivity can further be enhanced with the use of a non-aqueous solvent
such as ethylene glycol, N-methyl pyrrolidone, etc.38,39
As our main aim is to utilise
harmful H2S gas from the gas stream containing both CO2 and H2S gases, so selective
absorption of H2S is one of the main criteria for choosing MDEA among other
alkanolamines.
3.2 Nitroarenes reduction
Nitroaromatic compounds with nitrogen oxidation number ≥-2 can be reduced to aromatic
amines. Reduction of nitroaromatic compounds is an industrially important reaction
because aromatic amines can be used as a starting material for a number of products.
3.2.1 Catalytic reduction
In this process of reduction of aromatic nitro compounds, hydrogen is being taken up
from the solvent, sometimes from water or the acid present. The most important
reductants are iron, tin and Zinc, although phosphorus, sulphur dioxide, sulphide and
sulphites also used as reducing agent. Bechamp reduction is a process of reducing nitro
compounds with a stoichiometric amount of Fe metal (but also Zn, Al, Sn) or a metal
sulphide such as Na2S in the presence of acid. During this process, reducing agent may
result in the formation of useless by-products, which are very difficult to dispose of in the
environmentally safe way 40
.
3.2.1.1 Reduction with iron
Iron is the most important reducing agent which can easily reduce almost every
nitroaromatic compounds with water and acid 41
. Side products are often produced when
molecules are attached with other easily reducible substitutes (nitroso, sulfoxide,
hydrazine and other nitro group) or can be saponified. Mobay (United States) and Bayer
(Germany) both have used this process and produced iron oxide with the generation of
anilines as a by-product 42
.
3.2.1.2 Reduction with other metal
A number of other metals (Zinc, Tin and Aluminium) and their salts are used to reduce
aromatic nitro compounds in neutral, acidic or alkaline medium 43
. This process operates
in a mild operating conditions and during the reaction, other functional groups (-OH, -
31
COOH, -OR, halogen or -CN) attached to the aromatic ring is not getting affected by this
process. This process is practised mostly in laboratory scale 44
.
3.2.1.3 Reduction with sulphide, hydrogen sulphide and sodium dioxide
A stoichiometric amount of sulphide can selectively reduce multi-nitro aromatic
compounds to nitro aromatic amines. The reduction reaction of aromatic nitro compounds
by negative divalent sulphur in the form of hydrosulphide, sulphide, disulphide and
polysulphide is called Zinin reduction 45
. There are several kinds of literature available for
the reduction of aromatic nitro compounds with sodium sulphide and ammonium
sulphide. Ammonium hydrogen sulphide is also used as reducing agent, and it can be used
in an excess amount in the presence of ammonia 42,46
. The reduction of aromatic nitro,
nitroso, or azo compounds with sulfite or hydrogensulfite to the corresponding aromatic
amines is known as the Piria reaction (PIRIA, 1851). Nitro and nitroso group can be
reduced quantitatively by sodium dithionite.
3.2.1.4 Electrochemical reduction
This is a special technique in chemical reduction. During this process, an inorganic
compound is used to reduce an oxidised chemical compound at the cathode and can react
again. The cathode can be made up of Cu, Pb, Sn, Ni and 15-20% of the hydrochloric acid
is used as the electrolyte at cathode side separated by a membrane from the anode. On the
anode side, 30% of the sulphuric acid is used. This process has existed for several decades
but commercially it is not established. Nowadays some products are produced
electrochemically like p-aminobenzoic acid, p-aminophenol 47,48
.
3.2.2 Catalytic hydrogenation
3.2.2.1 Hydrazine as a reducing agent
Hydrazine is also used as a source of hydrogen for the reduction of aromatic nitro
compounds in the presence of a catalyst. The decomposition mechanism of hydrazine on
the metal catalyst is different at various pH level - at the higher pH level, the amount of
hydrogen liberated is also higher. Without the presence of catalyst also hydrogenation can
be done, but the hydrogenation is done in the presence of a catalyst such as Pd/carbon,
Pd/CaCO3, and Raney nickel 49,50
. Hydrazine hydrate can be used as a source of hydrogen
in the presence of heterogeneous catalyst Faujasite Zeolites 51
, activated Zn-Cu, Zn-C,
iron oxide and hydroxide 52
, Metallic nanoparticles Rh3Ni1 53
, Ni/ Co 54
.
32
3.2.2.2 Hydrogen as a reducing agent
Poly nitro aromatic compound is reduced to their corresponding primary aromatic mono
or polyamines by the catalytic hydrogenation reaction, either in the liquid or vapour
phase, in the presence or absence of a solvent. This is an exothermic reaction. If this
excess heat is not dissipated properly, then explosion can happen. In order to reduce these
hazards the partial pressure of hydrogen, concentration of the nitro compound, the activity
of the catalyst and temperature are controlled 40
.
3.2.2.3 Vapour phase hydrogenation
Utilisation of this process is limited to the boiling point and the thermal stability of the
nitro compound 55,56
. Copper-silica catalyst is used for the production of aniline in the
United States 40
.
3.2.2.5 Liquid phase hydrogenation
Most of the reduction reaction nitro aromatic compounds have been done in the liquid
phase. During this process temperature and pressure can be changed independently. The
nature of this reaction is exothermic, and thus a number safety precautions have to be
taken, especially for hydrogenation reaction of the aromatic poly-nitro compound in the
liquid phase without solvent 57–59
.
3.3 Preparation of aromatic amines with Zinin reducing agent
3.3.1 Sodium sulphide/disulphide as reducing agent:
Hojo is the first person to study the reduction of a nitro aromatic compound such as
nitrobenzene by aqueous sodium monosulphide and disulphide under a different mode of
reaction (Solid-Liquid, Liquid-Liquid)60
. He found that the reaction rate is proportional to
the square root of the sodium disulphide concentration. Bhave and Sharma studied the
reduction of p-nitroaniline, m-choronitrobenzene, m-dinitrobenzene by sodium mono
sulphide and sodium disulphide under biphasic reaction condition. The reaction was
found to be first order with respect to the nitro compounds and sulphide 61
. In 1992
Pradhan and Sharma carried out the reduction of chloronitrobenzene with sodium
sulphide in the presence or absence of PTC. Without catalyst usage in the S-L mode of
reaction with solid sodium sulphide as reducing agent, the o-chloroaniline and p-
chloroanile were the only product formed from their respective nitro compound and the
other experiment with utilising catalyst results 100% nitro aromatic compound conversion
to dinitrodiphenyl sulphide. Meta isomer of chloronitrobenzene is the only compound
which gave 100% chloroaniline in the presence or absence of PT catalyst62
. But in the L-L
33
mode of reaction, all isomers have produced chloroanilines in the presence and absence of
a catalyst. Reduction of p-nitrochlorobenzene has been carried out in the presence of
sodium sulphide in S-L, L-L, L-L-S mode of reaction with utilising PT catalyst 63
.
Nitrotoluenes in the form of o,p,m isomers have been reduced to the corresponding
toluidines with sodium sulphide as reducing agent in the S-L and L-L mode of reaction
and tetrabutyl phosphonium bromide (TBAB) as phase transfer catalyst. When L-L mode
of the reaction was applied, then all isomers have shown kinetically controlled reaction
but in the S-L mode ortho and para isomers have shown kinetically controlled reaction
and the meta isomer was found to be mass transfer controlled 64
.
A detailed kinetic study of the reduction reaction of p-nitroanisole to the corresponding
amine by sodium sulphide under the L-L mode of reaction in investigated by Yadav. The
rate of the reaction was found to be proportional to the catalyst, organic reactant and
sodium sulphide concentration 63
.
In 2007, Yadav and Lande used sodium sulphide as a reducing agent for the reduction of
4-nitro-oxylene in the Liquid-Liquid-Liquid mode of reaction. The reduction reaction
results in 100% selectivity of the product 3,4-dimethyl aniline.
3.3.2 Ammonium sulphide as a reducing agent:
Besides sodium sulphide, ammonium sulphide can also be used as a reducing agent.
Different types of ammonium sulphide have been used to reduce nitro aromatic
compounds such as (i) aqueous ammonium sulphide 65
, (ii) alcoholic ammonium sulphide 66
, (iii) ammonium sulphide prepared by mixing ammonium chloride and sodium sulphide
dissolved in ammonium hydroxide or alcohol67
.
Nitrochlorobenzene has been reduced with the ammonium sulphide in the Liquid-Liquid
mode of reaction in the presence of PTC, and 100% selectivity was observed for the only
product chloroaniline, and the rate of the reaction was found to be proportional to the
cube of sulphide concentration 68
.
The reduction of nitro toluene (o-, m- and p-) using ammonium sulphide has been
conducted under the biphasic or triphasic mode of reaction with utilising TBAB/ anion
exchange resin (AER) as phase transfer catalyst. Both modes of the reaction have shown
toluidine as the only product, and the rate of the reaction was proportional to the square of
the sulphide concentration 36,69
.
3.3.3 H2S rich Alkanolamines as reducing agent
34
Aqueous alkanolamines are used as an absorbent of H2S gas in amine treating units
(ATU). Thus the H2S rich alkanolamines can be acquired from the ATU units and
subsequently used a reducing agent for Zinin reduction. In 2006 Maity et al. have
investigated the use of H2S-rich ethanolamine as a reducing agent for the reduction of
nitrotoluenes under the Liquid-Liquid mode of reaction in the presence of phase transfer
catalyst (TBAB). It was found that the rate of the reaction was proportional to the square
of the concentration of sulphide and cube of the concentration of nitrotoluenes 70
.
The role of H2S-rich diethanolamine as a reducing agent has also been examined by Maity
for the reduction of o-anisidine (ONA) in an organic solvent under the biphasic mode of
reaction. The rate of the reaction of ONA was found to be proportional to the 1.63 power
of the sulphide concentration, to the cube concentration of ONA 71
.
3.4 Phase transfer catalysis
Phase transfer catalysis process involves a number of sequential steps and good
knowledge of the parameters which influence every step, is very much desirable for full
application of the technique. There is two important feature that a PTC must possess such
as it should have the ability to transfer one reagent from its normal phase to the other
phase where the second reactant is present and as soon as the first reagent reached to the
second phase, it must be in highly active form.
For a successful anion transfer reaction the main criterions are:
(i) A cationic catalyst must have large organic structure so it can be subsequently
partitioned in the organic phase.
(ii) The cation-anon complex bonding must be “loose” enough to allow high anon
reactivity.
In 1971, mechanism of phase transfer catalysis was first developed by Starks and later on
the name was given as “phase transfer catalysis”. Afterwards, Napis and Starks patented
their research on heterogeneous catalysis using quaternary salt 72
. The commonly used PT
catalyst are onium salts (ammonium and phosphonium salts), aza-macrobicyclic ethers
(cryptands), macrocyclic polyethers (crown ethers) and open chain polyethers
(polyethylene glycols and their dimethyl ethers) 73
.
The group, VA elements (nitrogen, phosphorus, arsenic etc.) of the periodic table of
elements, are very stable and forms strong bases which are highly ionised in the aqueous
phase, forms a stable cation containing pentavalent element covalently bonded to
hydrocarbon substituents. These quaternary salts are more effective than sodium and
35
potassium salts. Ammonium and phosphonium quaternary salts are most popular in the
industry. Different ammonium quaternary salts have been utilised extensively such as
tetrahexylammonium bromide (THAB), tetrabutylammonium bromide (TBAB),
tetraethylammonium bromide (TEAB), benzyltetrabutylammonium bromide (BTEAB)
for the reaction between n-bromobutane and sodium sulphide in a biphasic reaction
condition. The result shows THAB gave highest reaction rate and the reason may be the
higher carbon number in the alkyl group of the ammonium slats 74
. Phase transfer
catalysed the reaction of dibromo-o-xylene and 1-butanol have been investigated in the
presence of a number of quaternary cations such as tetrabutylammonium iodide (TBAI),
tetrabutylammonium bromide (TBAB), tetrabutylammonium hydrogensulfate (TBAHS).
After comparing, the obtained results the reactivity order of the anions attached to the
quaternary cation is 75. Similar results were obtained by Yadav et al.
when he compared same group of catalyst while synthesizing p-chlorophenyl acetonitrile
under liquid-liquid phase transfer catalysis reaction 76
. Reactivity of ammonium salts such
as TBAB, TBAHS and phosphonium salts such as ethyl triphenylphosphonuium bromide
(ETPB), tetrabutylphosphonium bromide (TBPB) has been compared in the synthesis of
3-methyl-4ʹ-nitro-diphenyl ether by reacting sodium salt of m-cresol and p-
chloronitrobenzene under biphasic mode of reaction. The order of activity was as follows
TBAB> TBPB> TBAHS> ETPB 77
. Liquid-Liquid phase transfer catalysed synthesis of
2,4-dichlorophenoxyacetic acid by using 2,4-dichlorophenol and chloroacetic acid has
been investigated in the presence of different quaternary cations which are as follows
tetrabutylammonium bromide (TBAB), tetramethylammonium chloride (TMACl) and
tetraethylammonium bromide (TEAB). Results obtained reveals that TBAB is the least
performing catalyst and TEAB gave best results 78
.
Ming-Ling Wang has been investigated L-L PT catalysed the reaction of dibromo-o-
xylene and 1-butanol 79
, n-bromobutane and sodium sulphide 80
by using TBAB as PT
catalyst. He carried out reaction between bisphenol A and allyl bromide in the presence of
a variety of conventional phase transfer catalyst such as benzyltriethylammonium chloride
(BTEAC), diallyldimethylammonium chloride (DADMAC), poly(ethylene glycol) 400,
tetrabutylammonium iodide (TBAI), tetrabutylammonium hydroxide (TBAOH) and
tetraheptylammonum chloride (THAC)81
.
O-alkylation reaction of p-tert-butylphenol with benzyl chloride have been carried out
under microwave irradiated liquid-liquid phase catalysis (MILL-PTC) with using TBAB
as phase transfer catalyst. The reaction was greatly accelerated by the use of microwave
irradiation 82
. TBAB have been utilised as an efficient PTC for a variety of reactions
which includes oxidation 83,84
, alkylation 85
, aromatic ether preparation86
, O-alkylation 87
,
36
selective etherification 88
. Yadav et al have investigated phase transfer catalysed the
reduction of nitroarenes by sodium sulphide under liquid-liquid (L-L) PTC mode of
reaction such as p-nitrochlorobenzene 89
, p-nitroanisole 63
and reaction under liquid-
liquid-liquid PTC system by utilising TBAB as phase transfer catalysis 90,91
.
Tetrabutylammonium hydrogen sulfate (TBAHS) is used as an effective PTC for the
reduction of nitroaromatic compounds by sodium dithionite in solid phase synthesis 92
.
NC Pradhan has done a reduction of nitrochlorobenzene and nitrotoluene by sodium
sulphide in the presence of TBAB as phase transfer catalysis in biphasic reaction
conditions 64,93
. L-L mode of reaction system has been investigated for the reduction of
nitrochlorobenzene 68
, nitrotoluene 36,70
, nitroanisole 71
by TBAB as phase transfer
catalysis by Maity et al.
Soluble PTCs are very difficult to recover and not reusable. Thus the biphasic liquid-
liquid PTC process is cost expensive and also minimizes the purity of the product and
possess environmental hazards when it gets disposed of into water bodies 94
. Liquid-
Solid-liquid phase transfer catalysis is having lots of advantages over liquid-liquid phase
transfer catalysis 95
. Catalyst recovery and then reuse made tri-liquid phase transfer
catalysis more advantageous with little spare in conversion. Impregnating catalysts on
solid micro porous or macro porous supports solve this recovery problem, and it is called
Triphase catalyst 96
. Triphase catalysts are not commercially popular because they are less
catalytically active than soluble catalyst and production cost of Triphase catalyst is also
high 97
. The comparison of different polymer supported PTC for industrial synthesis of
bisphenol –A from phenol and acetone has been documented 98
. The mechanism and
kinetics of the selective synthesis of benzaldehyde from benzyl chloride using polymer
supported chromium salt as a PTC have been studied 99
. Researchers have studied
catalytic activity of different Ion-Exchange resigns as a phase transfer catalyst, such as
esterification 100
, aldol condensation 101
and reduction of p-nitrotoluene 69
.
References
1 S. Pipatmanomai, S. Kaewluan and T. Vitidsant, Appl. Energy, 2009, 86, 669–674.
2 T. J. B. Andrey Bagreev, Carbon N. Y., 2001, 2303–2311.
3 L. Wang and R. T. Yang, Front. Chem. Sci. Eng., 2014, 8, 8–19.
4 J. M. Nhut, R. Vieira, L. Pesant, J. P. Tessonnier, N. Keller, G. Ehret, C. Pham-
Huu and M. J. Ledoux, Catal. Today, 2002, 76, 11–32.
37
5 W. F. Elseviers and H. Verelst, Fuel, 1999, 78, 601–612.
6 S. H. Kang, J. W. Bae, H. T. Kim, K. W. Jin, S. Y. Jeong, K. V. R. Chary, Y. S.
Yoon and M. J. Kim, Energy and Fuels, 2007, 21, 3537–3540.
7 D. Jiang, L. Su, L. Ma, N. Yao, X. Xu, H. Tang and X. Li, Appl. Surf. Sci., 2010,
256, 3216–3223.
8 J. W. Bae, S. H. Kang, G. Murali Dhar and K. W. Jun, Int. J. Hydrogen Energy,
2009, 34, 8733–8740.
9 S. Cheah, D. L. Carpenter and K. A. Magrini-Bair, Energy and Fuels, 2009, 23,
5291–5307.
10 M. Ozekmekci, G. Salkic and M. F. Fellah, Fuel Process. Technol., 2015, 139, 49–
60.
11 S. Yaşyerli, I. Ar, G. Doǧu and T. Doǧu, Chem. Eng. Process., 2002, 41, 785–792.
12 O. Faye, A. Raj, V. Mittal and A. C. Beye, Comput. Mater. Sci., 2016, 117, 110–
119.
13 Y. Chen, X. Yang, Y. Liu, J. Zhao, Q. Cai and X. Wang, J. Mol. Graph. Model.,
2013, 39, 126–132.
14 E. Ashori, F. Nazari and F. Illas, Int. J. Hydrogen Energy, 2014, 39, 6610–6619.
15 J. Zhang and Z. TONG, Chinese J. Chem. Eng., 2006, 14, 810–813.
16 Y. Belmabkhout, G. De Weireld and A. Sayari, Langmuir, 2009, 25, 13275–13278.
17 S. A. M. Marzouk, M. H. Al-Marzouqi, N. Abdullatif and Z. M. Ismail, J. Memb.
Sci., 2010, 360, 436–441.
18 R. Faiz, K. Li and M. Al-Marzouqi, Chem. Eng. Process. Process Intensif., 2014,
83, 33–42.
19 A. H. Jalili, M. Rahmati-Rostami, C. Ghotbi, M. Hosseini-Jenab and A. N.
Ahmadi, J. Chem. \& Eng. Data, 2009, 54, 1844–1849.
20 F. P. Bernardo and P. M. Saraiva, Am. Inst. Chem. Eng. J., 2014, 61, 1–15.
21 B. Guo, E. Duan, Y. Zhong, L. Gao, X. Zhang and D. Zhao, Energy & Fuels, 2011,
25, 159–161.
22 E. M. Broderick, A. Bhattacharyya and B. J. Mezza, US Pat., US20150093313 A1
2015.
23 J. W. Tierney, US Pat., US2813126 A, 1957.
24 F. Kohl, A. Riesenfeld, in Gas Purification, Gulf publishing, Houston, Houston,
TX, 4th edn., 1985.
38
25 E. Üresin, H. İ. Saraç, A. Sarıoğlan, Ş. Ay and F. Akgün, Process Saf. Environ.
Prot., 2015, 94, 196–202.
26 D. Chang and M. C. McGaugh, US Pat., US 4765873 A, 1988.
27 D. Chang and M. C. Mcgaugh, US Pat., US4765969 A, 1987.
28 H. Larsen, J. Bacteriol., 1952, 64, 187–196.
29 M. Syed, G. Soreanu, P. Falletta and M. Beland, Can. Biosyst. Eng., 2006, 48, 2.1-
2.14.
30 A. H. Zare and S. Mirzaei, World Acad. Sci. Eng. Technol., 2009, 37, 194–203.
31 A. Kohl and R. Nielsen, Gas purification, Gulf Publishing Company, Houston,TX,
1997.
32 J. D. Lawson and A. W. Garst, J. Chem. Eng. Data, 1976, 21, 20–30.
33 E. E. Isaacs, D. Otto and E. Alan, Engineering, 1980, 118–120.
34 J. I. I. Lee, F. D. Otto and A. E. Mather, J. Chem. Eng. Data, 1976, 21, 207–208.
35 A. B. G. Astarita, D. W. Savage, Gas Treating with Chemical Solvents, John Wiley
& Sons, 1983.
36 S. K. Maity, N. C. Pradhan and A. V. Patwardhan, Appl. Catal. A Gen., 2006, 301,
251–258.
37 B. P. Mandal, A. K. Biswas and S. S. Bandyopadhyay, Sep. Purif. Technol., 2004,
35, 191–202.
38 H. Xu, C. Zhang and Z. Zheng, Simulation, 2002, 2953–2956.
39 H. Xu, C. Zhang and Z. Zheng, Society, 2002, 6175–6180.
40 P. F. Vogt and J. J. Gerulis, in Ullmann’s Encyclopedia of Industrial Chemistry,
Wiley-VCH Verlag GmbH & Co. KGaA, 2000.
41 A. Agrawal and P. G. Tratnyek, Environ. Sci. Technol., 1996, 30, 153–160.
42 M. J. Potter, U.S. Geol. Surv. Miner. Yearb., 2002, 1983.
43 D. Gowda, B. Mahesh and S. Gowda, Indian J. Chem., 2001, 408, 75–77.
44 F. A. Khan, J. Dash, C. Sudheer and R. K. Gupta, Tetrahedron Lett., 2003, 44,
7783–7787.
45 W. G. Dauben, Organic reactions, John Wiley & Sons, Inc., New York, 1973.
46 A. McKenzie and G. W. Clough , J. Chem. Soc. Trans., 1910, 97, 1016–1023.
47 J. L. Sadler and A. J. Bard, J. Am. Chem. Soc., 1968, 90, 1979–1989.
39
48 D. Meenakshisundaram, M. Mehta, S. Pehkonen and S. W. Maloney,
Electrochemical Reduction of Nitro-Aromatic Compounds Product Studies and
Mathematical Modeling, 1999.
49 S. Gowda and D. C. Gowda, Tetrahedron, 2002, 58, 2211–2213.
50 D. Balcom and A. Furst, J. Am. Chem. Soc., 1953, 75, 4334.
51 M. Kumarraja and K. Pitchumani, Appl. Catal. A Gen., 2004, 265, 135–139.
52 M. Benz and R. Prins, Appl. Catal. A Gen., 1999, 183, 325–333.
53 S. Cai, H. Duan, H. Rong, D. Wang, L. Li, W. He and Y. Li, ACS Catal., 2013, 3,
608–612.
54 R. K. Rai, A. Mahata, S. Mukhopadhyay, S. Gupta, P. Z. Li, K. T. Nguyen, Y.
Zhao, B. Pathak and S. K. Singh, Inorg. Chem., 2014, 53, 2904–2909.
55 R. Langer, H-J. Buysch, U. Pentling, P. Wagner, US Pat., 5,877,350A, 2000.
56 S. K. Mohapatra, S. U. Sonavane, R. V Jayaram and P. Selvam, Org. Lett., 2002, 4,
4297–4300.
57 Y. Huang and W. M. H. Sachtler, Appl. Catal. A Gen., 1999, 182, 365–378.
58 A. S. Kulkarni and R. V. Jayaram, Appl. Catal. A Gen., 2003, 252, 225–230.
59 D. F. S and H. Greenfield, US Pat., US3350450 A, 1967.
60 Y. O. M. Hojo, Y. Takagi, J. Am. Chem. Soc., 1960, 82, 2459–2462.
61 R. R. Bhave and M. M. Sharma, J. Chem. Technol. Biotechnol., 1981, 31, 93–102.
62 N. C. Pradhan and M. M. Sharma, Ind. Eng. Chem. Res., 1992, 31, 1606–1609.
63 G. D. Yadav, Y. B. Jadhav and S. Sengupta, Chem. Eng. Sci., 2003, 58, 2681–
2689.
64 N. C. Pradhan, Indian J. Chem. Technol., 2000, 7, 276–279.
65 H. Gilman, Wiley, New York, 1941, p. 52.
66 N. F. Lucas, H J, Scudder, J. Am. Chem. Soc., 1928, 50, 244–249.
67 D. E. W. M. J. Murray, J. Am. Chem. Soc., 1938, 60, 2818–2819.
68 S. K. Maity, N. C. Pradhan and A. V. Patwardhan, Appl. Catal. B Environ., 2008,
77, 418–426.
69 S. K. Maity, N. C. Pradhan and A. V. Patwardhan, Chem. Eng. J., 2008, 141, 187–
193.
70 S. K. Maity, N. C. Pradhan and A. V Patwardhan, Ind. Eng. Chem. Res., 2006, 46,
40
7767–7774.
71 S. K. Maity, N. C. Pradhan and A. V. Patwardhan, Chem. Eng. Sci., 2007, 62, 805–
813.
72 D. R. Napier and C. M. Starks, US Pat., 3992432, 1976.
73 S. D. Naik and L. K. Doraiswamy, AIChE J., 1998, 44, 612–646.
74 M.-L. Wang and Y.-H. Tseng, J. Mol. Catal. A Chem., 2003, 203, 79–93.
75 M.-L. Wang and Y.-H. Tseng, J. Mol. Catal. A Chem., 2002, 179, 17–26.
76 G. D. Yadav and Y. B. Jadhav, J. Mol. Catal. A Chem., 2003, 192, 41–52.
77 G. D. Yadav and S. A. Purandare, J. Mol. Catal. A Chem., 2005, 237, 60–66.
78 G. D. Yadav and Y. B. Jadhav, J. Mol. Catal. A Chem., 2002, 184, 151–160.
79 M. Wang and Y. Tseng, 2002, J. Mol. Catal. A Chem., 179, 17–26.
80 M. L. Wang and Y. H. Tseng, J. Mol. Catal. A Chem., 2003, 203, 79–93.
81 M. L. Wang and Z. F. Lee, Ind. Eng. Chem. Res., 2006, 45, 4918–4926.
82 G. D. Yadav and P. M. Bisht, J. Mol. Catal. A Chem., 2005, 236, 54–64.
83 G. D. Yadav and B. V Haldavanekar, J. Phys. Chem., 1997, 5639, 36–48.
84 G. D. Yadav and J. L. Ceasar, Org. Process Res. Dev., 2008, 12, 740–747.
85 G. D. Yadav and N. M. Desai, Org. Process Res. Dev., 2005, 9, 749–756.
86 G. D. Yadav and P. M. Bisht, J. Mol. Catal. A Chem., 2004, 223, 93–100.
87 G. D. Yadav and O. V. Badure, J. Mol. Catal. A Chem., 2008, 288, 33–41.
88 G. D. Yadav and S. V. Lande, J. Mol. Catal. A Chem., 2006, 244, 271–277.
89 G. D. Yadav, Y. B. Jadhav and S. Sengupta, J. Mol. Catal. A Chem., 2003, 200,
117–129.
90 G. D. Yadav and S. V. Lande, Ind. Eng. Chem. Res., 2007, 46, 2951–2961.
91 G. D. Yadav and S. V. Lande, Adv. Synth. Catal., 2005, 347, 1235–1241.
92 R. Kaplánek and V. Krchňák, Tetrahedron Lett., 2013, 54, 2600–2603.
93 N. C. Pradhan and M. M. Sharma, Evaluation, 1990, 1103–1108.
94 G. D. Yadav, Top. Catal., 2004, 29, 145–161.
95 S. Desikan and L. K. Doraiswamy, Ind. Eng. Chem. Res., 1995, 34, 3524–3537.
41
96 J. A. B. Satrio, H. J. Glatzer and L. K. Doraiswamy, Chem. Eng. Sci., 2000, 55,
5013–5033.
97 S. L. Regen, J. Am. Chem. Soc., 1975, 20, 5956–5957.
98 G. D. Yadav and N. Kirthivasan, Appl. Catal. A Gen., 1997, 154, 29–53.
99 G. D. Yadav and B. V Haldavanekar, React. Funct. Polym., 1997, 32, 187–194.
100 Y. S. OU Zhize, XU Mancai, Lizi Jiaohuan Yu Xifu, 2000, 162–166.
101 D. W. P. S. W. Park, H.B. Cho, J. Ind. Eng. Chem. Seoul, Repub. Korea, 2003,
464–472.
4. Material and Methods
4.1 Materials
Toluene (>99%), Monoethanolamine (MEA) (≥99%), Ferrous sulphide sticks and
N-Methyldiethanolamine (MDEA) (≥99%) of analytical grade obtained from Merck
(India) Pvt., Ltd., Mumbai, India. o,m,p-chloronitrobenzene (m-CNB) (>99%), 1-
nitronapthalene (1-NN), 4-chloro-3nitrotoluene, 4chloro-2nitro toluene, p-
iodonitrobenzene, 3-nitroacetophenone, 4-nitroacetophenone, o,p-nitroanisole, 8-
aminoquinolene, 2,6-dinitrotoluene, 2,4-dinitrotoluene, 4-amino-4-nitrotoluene, 2-amino-
4-nitrotoluene, 1-(2-nitrophenoxy)benzene, 1-(4-nitrophenoxy)benzene all of the
analytical reagent grade, were procured from Sigma-Aldrich, Mumbai, India. Catalysts
taken for the comparison studies are Tetrabutylammonium bromide (TBAB),
Tetrabutylphosphonium bromide (TBPB), Tetramethylammonium bromide (TMAB),
Tetrabutylammonium iodide (TBAI) and Ethyltriphenylphosphonium bromide (ETPPB),
Tetrapropylammonium bromide (TPAB). The catalyst tributylmethylphosphonium
chloride polymer-bound was purchased from Sigma-Aldrich, Mumbai, India. The FeS
sticks used for H2S production has been bought from Rankem, India. Amberlite IR-400
has been procured from Ranken. Potassium iodide (KI), Sodium hydroxide (NaOH),
potassium iodate (KIO3), starch powder, sodium thiosulfate (Na2S2O3) and 98% pure
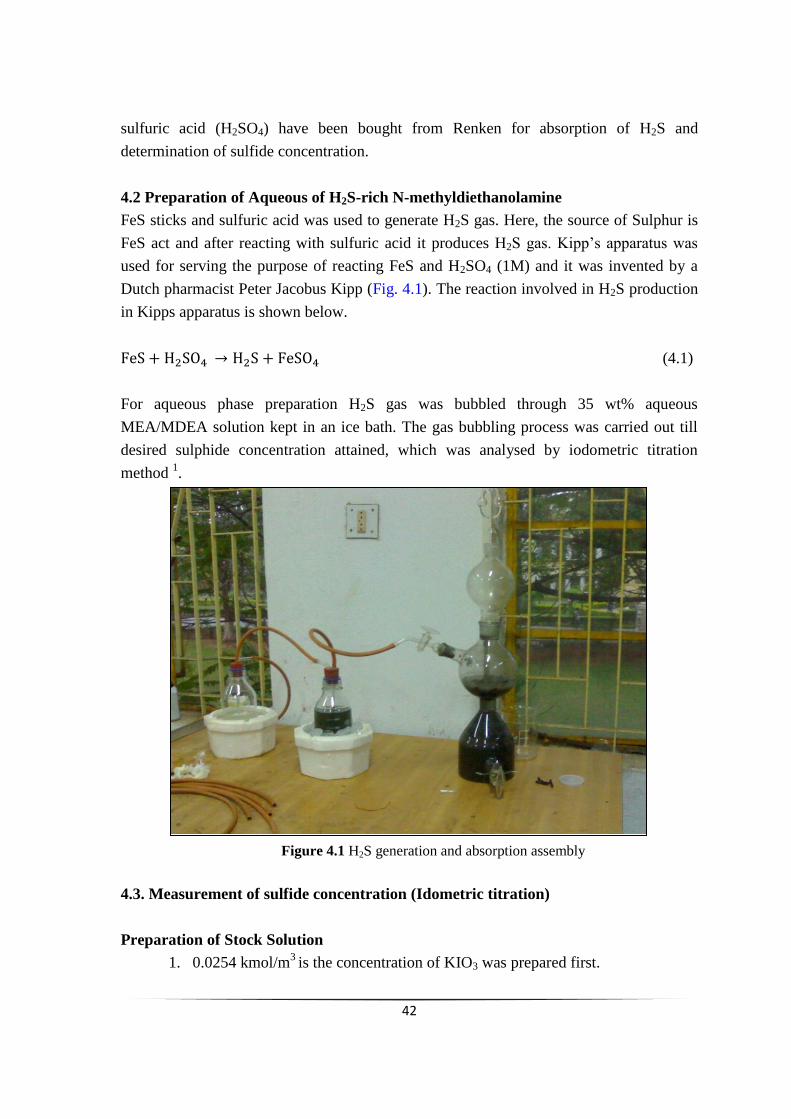
42
sulfuric acid (H2SO4) have been bought from Renken for absorption of H2S and
determination of sulfide concentration.
4.2 Preparation of Aqueous of H2S-rich N-methyldiethanolamine
FeS sticks and sulfuric acid was used to generate H2S gas. Here, the source of Sulphur is
FeS act and after reacting with sulfuric acid it produces H2S gas. Kipp‟s apparatus was
used for serving the purpose of reacting FeS and H2SO4 (1M) and it was invented by a
Dutch pharmacist Peter Jacobus Kipp (Fig. 4.1). The reaction involved in H2S production
in Kipps apparatus is shown below.
(4.1)
For aqueous phase preparation H2S gas was bubbled through 35 wt% aqueous
MEA/MDEA solution kept in an ice bath. The gas bubbling process was carried out till
desired sulphide concentration attained, which was analysed by iodometric titration
method 1.
Figure 4.1 H2S generation and absorption assembly
4.3. Measurement of sulfide concentration (Idometric titration)
Preparation of Stock Solution
1. 0.0254 kmol/m3 is the concentration of KIO3 was prepared first.
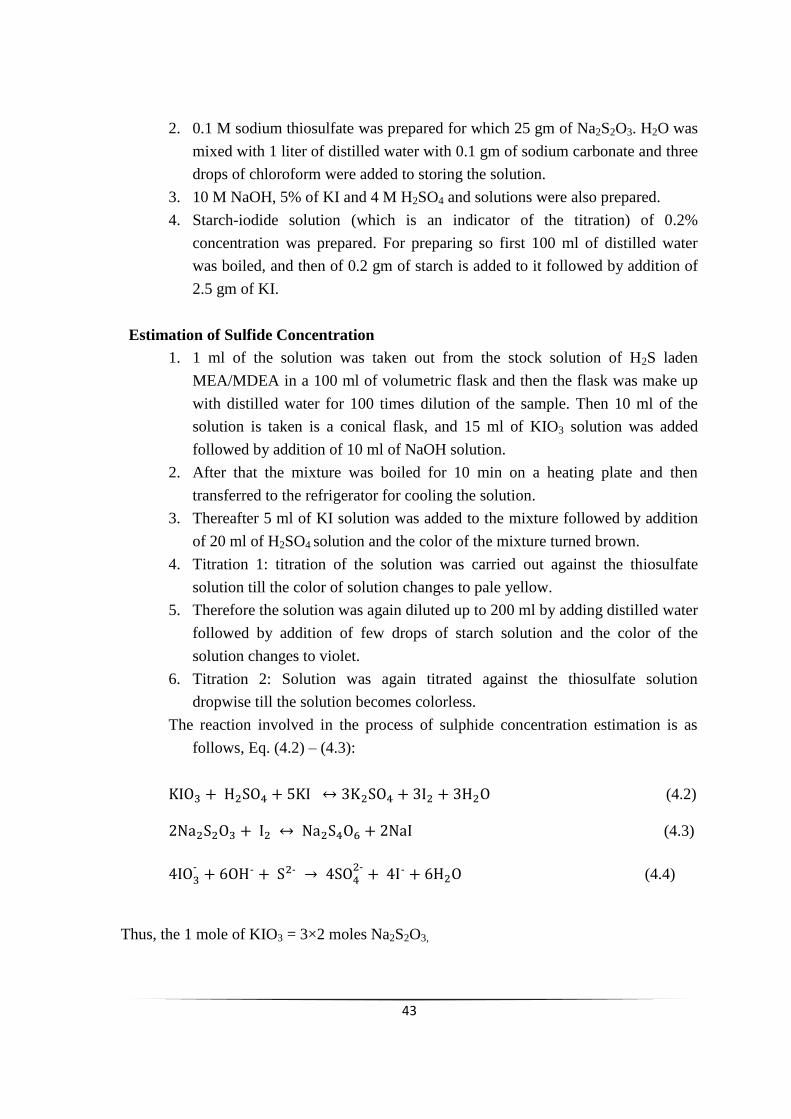
43
2. 0.1 M sodium thiosulfate was prepared for which 25 gm of Na2S2O3. H2O was
mixed with 1 liter of distilled water with 0.1 gm of sodium carbonate and three
drops of chloroform were added to storing the solution.
3. 10 M NaOH, 5% of KI and 4 M H2SO4 and solutions were also prepared.
4. Starch-iodide solution (which is an indicator of the titration) of 0.2%
concentration was prepared. For preparing so first 100 ml of distilled water
was boiled, and then of 0.2 gm of starch is added to it followed by addition of
2.5 gm of KI.
Estimation of Sulfide Concentration
1. 1 ml of the solution was taken out from the stock solution of H2S laden
MEA/MDEA in a 100 ml of volumetric flask and then the flask was make up
with distilled water for 100 times dilution of the sample. Then 10 ml of the
solution is taken is a conical flask, and 15 ml of KIO3 solution was added
followed by addition of 10 ml of NaOH solution.
2. After that the mixture was boiled for 10 min on a heating plate and then
transferred to the refrigerator for cooling the solution.
3. Thereafter 5 ml of KI solution was added to the mixture followed by addition
of 20 ml of H2SO4 solution and the color of the mixture turned brown.
4. Titration 1: titration of the solution was carried out against the thiosulfate
solution till the color of solution changes to pale yellow.
5. Therefore the solution was again diluted up to 200 ml by adding distilled water
followed by addition of few drops of starch solution and the color of the
solution changes to violet.
6. Titration 2: Solution was again titrated against the thiosulfate solution
dropwise till the solution becomes colorless.
The reaction involved in the process of sulphide concentration estimation is as
follows, Eq. (4.2) – (4.3):
(4.2)
(4.3)
- - -
- - (4.4)
Thus, the 1 mole of KIO3 = 3×2 moles Na2S2O3,
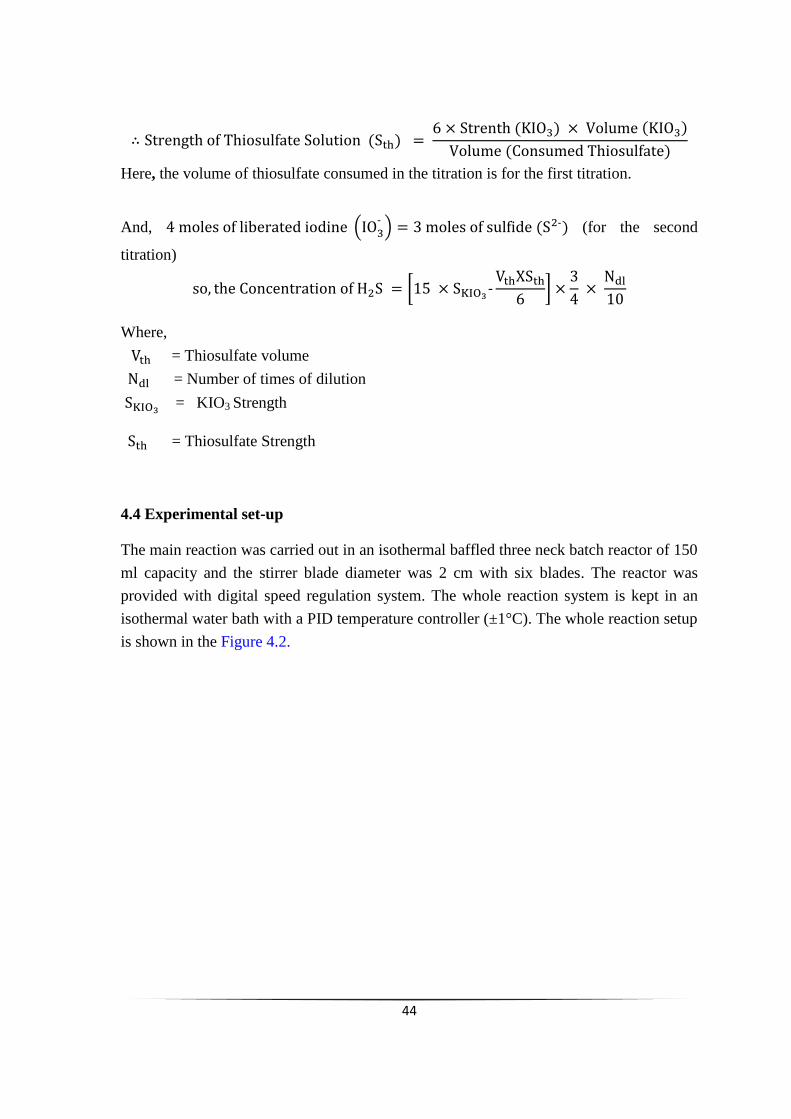
44
Here, the volume of thiosulfate consumed in the titration is for the first titration.
And, ( -) - (for the second
titration)
[
]
Where,
= Thiosulfate volume
= Number of times of dilution
= KIO3 Strength
= Thiosulfate Strength
4.4 Experimental set-up
The main reaction was carried out in an isothermal baffled three neck batch reactor of 150
ml capacity and the stirrer blade diameter was 2 cm with six blades. The reactor was
provided with digital speed regulation system. The whole reaction system is kept in an
isothermal water bath with a PID temperature controller (±1°C). The whole reaction setup
is shown in the Figure 4.2.
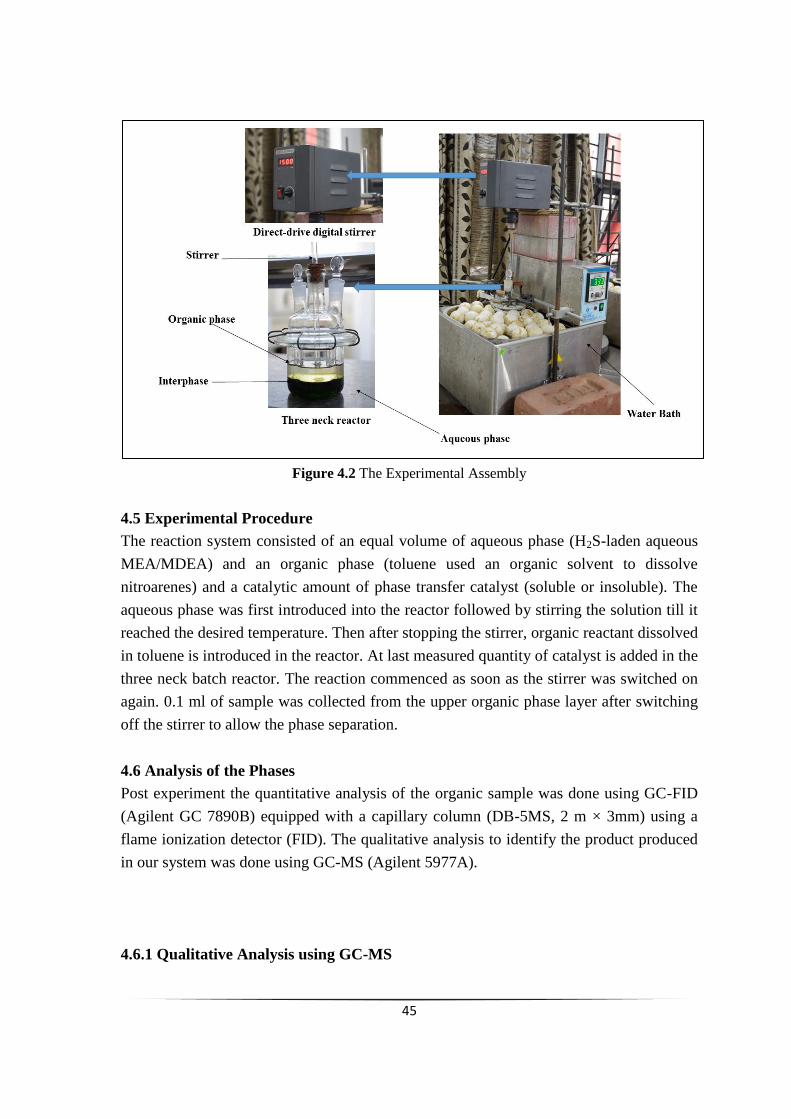
45
Figure 4.2 The Experimental Assembly
4.5 Experimental Procedure
The reaction system consisted of an equal volume of aqueous phase (H2S-laden aqueous
MEA/MDEA) and an organic phase (toluene used an organic solvent to dissolve
nitroarenes) and a catalytic amount of phase transfer catalyst (soluble or insoluble). The
aqueous phase was first introduced into the reactor followed by stirring the solution till it
reached the desired temperature. Then after stopping the stirrer, organic reactant dissolved
in toluene is introduced in the reactor. At last measured quantity of catalyst is added in the
three neck batch reactor. The reaction commenced as soon as the stirrer was switched on
again. 0.1 ml of sample was collected from the upper organic phase layer after switching
off the stirrer to allow the phase separation.
4.6 Analysis of the Phases
Post experiment the quantitative analysis of the organic sample was done using GC-FID
(Agilent GC 7890B) equipped with a capillary column (DB-5MS, 2 m × 3mm) using a
flame ionization detector (FID). The qualitative analysis to identify the product produced
in our system was done using GC-MS (Agilent 5977A).
4.6.1 Qualitative Analysis using GC-MS
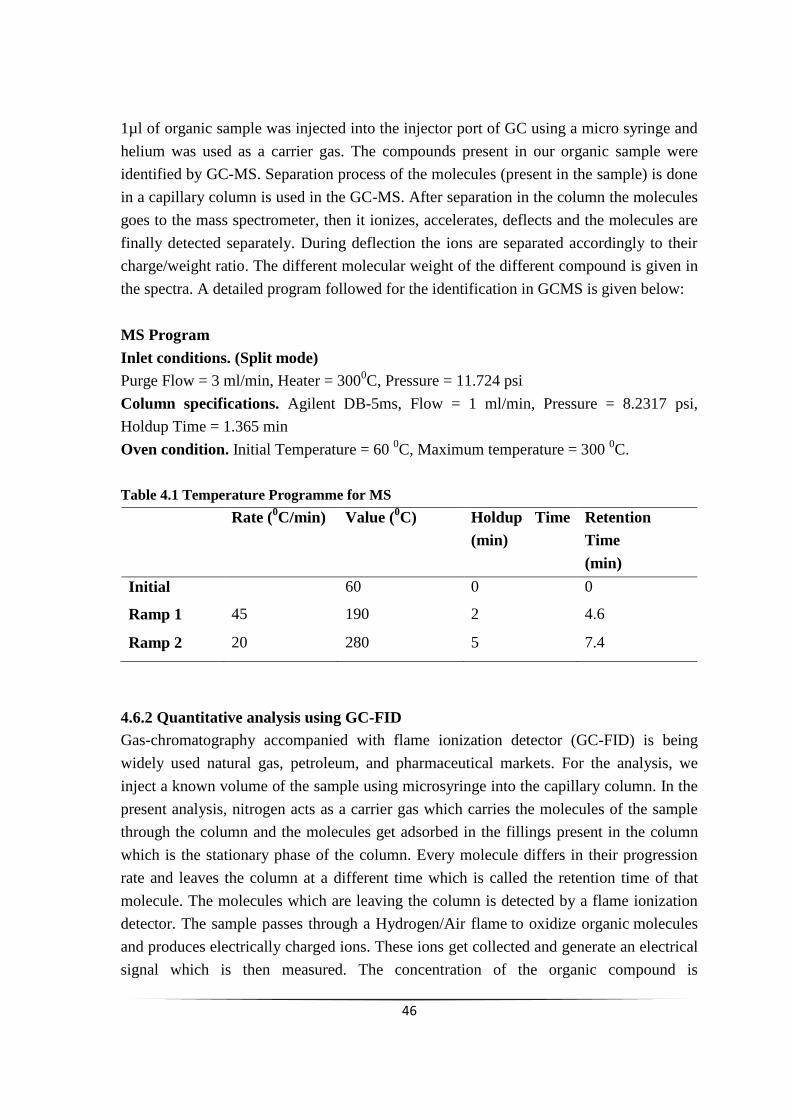
46
1µl of organic sample was injected into the injector port of GC using a micro syringe and
helium was used as a carrier gas. The compounds present in our organic sample were
identified by GC-MS. Separation process of the molecules (present in the sample) is done
in a capillary column is used in the GC-MS. After separation in the column the molecules
goes to the mass spectrometer, then it ionizes, accelerates, deflects and the molecules are
finally detected separately. During deflection the ions are separated accordingly to their
charge/weight ratio. The different molecular weight of the different compound is given in
the spectra. A detailed program followed for the identification in GCMS is given below:
MS Program
Inlet conditions. (Split mode)
Purge Flow = 3 ml/min, Heater = 3000C, Pressure = 11.724 psi
Column specifications. Agilent DB-5ms, Flow = 1 ml/min, Pressure = 8.2317 psi,
Holdup Time = 1.365 min
Oven condition. Initial Temperature = 60 0C, Maximum temperature = 300
0C.
Table 4.1 Temperature Programme for MS
Rate (0C/min) Value (
0C) Holdup Time
(min)
Retention
Time
(min)
Initial 60 0 0
Ramp 1 45 190 2 4.6
Ramp 2 20 280 5 7.4
4.6.2 Quantitative analysis using GC-FID
Gas-chromatography accompanied with flame ionization detector (GC-FID) is being
widely used natural gas, petroleum, and pharmaceutical markets. For the analysis, we
inject a known volume of the sample using microsyringe into the capillary column. In the
present analysis, nitrogen acts as a carrier gas which carries the molecules of the sample
through the column and the molecules get adsorbed in the fillings present in the column
which is the stationary phase of the column. Every molecule differs in their progression
rate and leaves the column at a different time which is called the retention time of that
molecule. The molecules which are leaving the column is detected by a flame ionization
detector. The sample passes through a Hydrogen/Air flame to oxidize organic molecules
and produces electrically charged ions. These ions get collected and generate an electrical
signal which is then measured. The concentration of the organic compound is
47
proportional to the number of ions formed, and this theory was used quantification of the
organic phase. The detailed program followed for the quantification using GC-FID is
mentioned below:
FID Program
Inlet Condition. Heater = 200 0C, Purge Flow = 3ml/min, Pressure = 15.345 psi
Column Condition. Agilent DB-5ms, Flow = 1.5 ml/min, Holdup Time = 1.427 min,
Pressure = 15.345 psi.
Oven Condition. Initial temperature = 60 0C, Maximum temperature = 300
0C.
Detector. Heater = 300 0C, Column Flow (N2) = 15 ml/min, Make up Flow (N2) = 25
ml/min, H2 Flow = 30 ml/min, Air Flow = 400 ml/min.
Table 4.2 Temperature Programme for FID
Rate
(0C/min)
Value (0C) Holdup Time
(min)
Retention Time
(min)
Initial 60 0.0 0.0
Ramp 1 45 190 0.0 2.8
Ramp 2 20 300 0.0 8.4
References
1 Scott WW, Standard Methods of Chemical Analysis, Van Nostrand, New York, 6th
Editio., 1966.
Abstract
Parametric studies were performed to find out the kinetics of the Zinin reduction and to
optimize the influence of process parameters like stirring speed, concentration of m-CNB,
concentration of aqueous sulphide, catalyst concentration etc. on reaction rate and conversion of
m-CNB. The reusability of catalyst was investigated and catalytic activity of used catalyst was
found to change a little even after three recycle run in comparison to fresh catalyst. Also waste
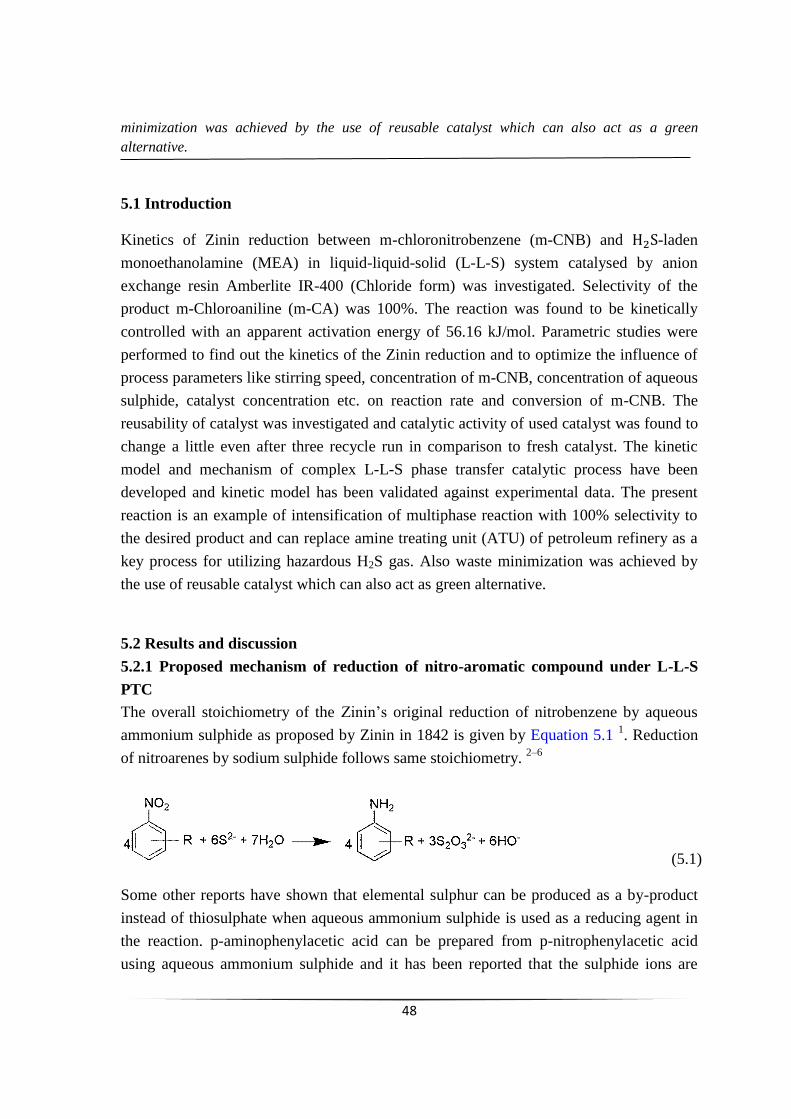
48
minimization was achieved by the use of reusable catalyst which can also act as a green
alternative.
5.1 Introduction
Kinetics of Zinin reduction between m-chloronitrobenzene (m-CNB) and -laden
monoethanolamine (MEA) in liquid-liquid-solid (L-L-S) system catalysed by anion
exchange resin Amberlite IR-400 (Chloride form) was investigated. Selectivity of the
product m-Chloroaniline (m-CA) was 100%. The reaction was found to be kinetically
controlled with an apparent activation energy of 56.16 kJ/mol. Parametric studies were
performed to find out the kinetics of the Zinin reduction and to optimize the influence of
process parameters like stirring speed, concentration of m-CNB, concentration of aqueous
sulphide, catalyst concentration etc. on reaction rate and conversion of m-CNB. The
reusability of catalyst was investigated and catalytic activity of used catalyst was found to
change a little even after three recycle run in comparison to fresh catalyst. The kinetic
model and mechanism of complex L-L-S phase transfer catalytic process have been
developed and kinetic model has been validated against experimental data. The present
reaction is an example of intensification of multiphase reaction with 100% selectivity to
the desired product and can replace amine treating unit (ATU) of petroleum refinery as a
key process for utilizing hazardous H2S gas. Also waste minimization was achieved by
the use of reusable catalyst which can also act as green alternative.
5.2 Results and discussion
5.2.1 Proposed mechanism of reduction of nitro-aromatic compound under L-L-S
PTC
The overall stoichiometry of the Zinin‟s original reduction of nitrobenzene by aqueous
ammonium sulphide as proposed by Zinin in 1842 is given by Equation 5.1 1. Reduction
of nitroarenes by sodium sulphide follows same stoichiometry. 2–6
(5.1)
Some other reports have shown that elemental sulphur can be produced as a by-product
instead of thiosulphate when aqueous ammonium sulphide is used as a reducing agent in
the reaction. p-aminophenylacetic acid can be prepared from p-nitrophenylacetic acid
using aqueous ammonium sulphide and it has been reported that the sulphide ions are
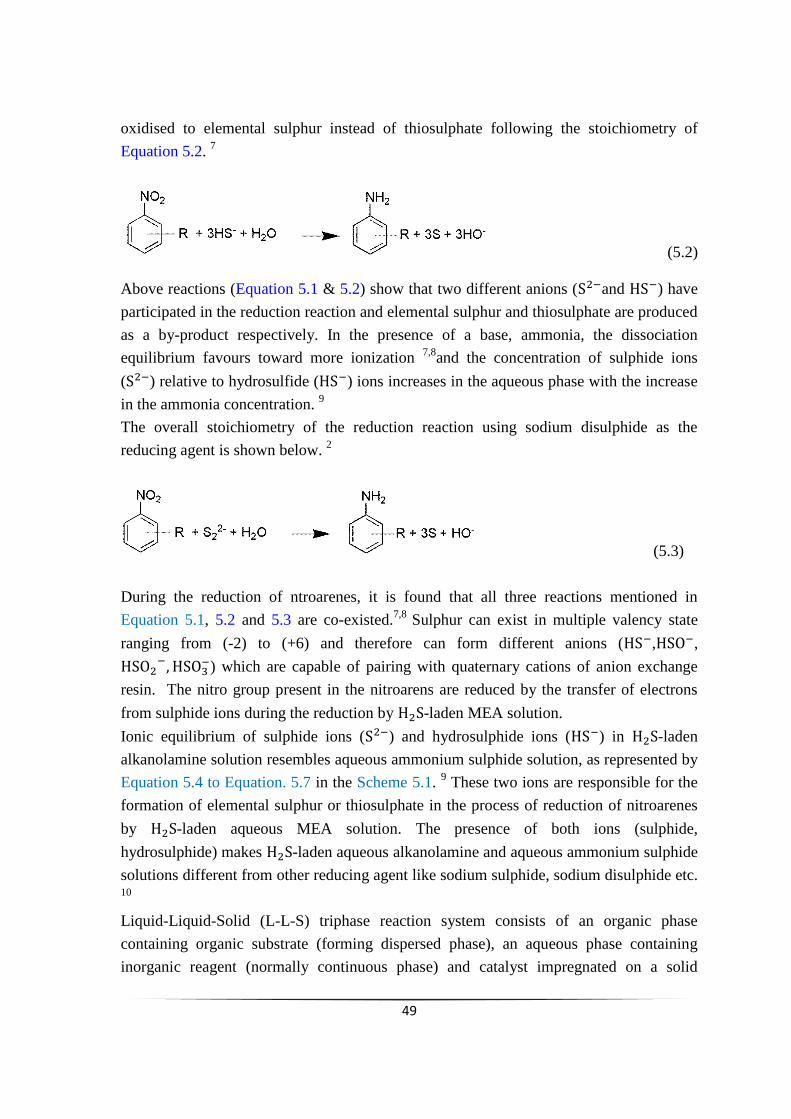
49
oxidised to elemental sulphur instead of thiosulphate following the stoichiometry of
Equation 5.2. 7
(5.2)
Above reactions (Equation 5.1 & 5.2) show that two different anions ( and ) have
participated in the reduction reaction and elemental sulphur and thiosulphate are produced
as a by-product respectively. In the presence of a base, ammonia, the dissociation
equilibrium favours toward more ionization 7,8
and the concentration of sulphide ions
( ) relative to hydrosulfide ( ) ions increases in the aqueous phase with the increase
in the ammonia concentration. 9
The overall stoichiometry of the reduction reaction using sodium disulphide as the
reducing agent is shown below. 2
(5.3)
During the reduction of ntroarenes, it is found that all three reactions mentioned in
Equation 5.1, 5.2 and 5.3 are co-existed.7,8
Sulphur can exist in multiple valency state
ranging from (-2) to (+6) and therefore can form different anions ( , ,
) which are capable of pairing with quaternary cations of anion exchange
resin. The nitro group present in the nitroarens are reduced by the transfer of electrons
from sulphide ions during the reduction by -laden MEA solution.
Ionic equilibrium of sulphide ions ( ) and hydrosulphide ions ( ) in -laden
alkanolamine solution resembles aqueous ammonium sulphide solution, as represented by
Equation 5.4 to Equation. 5.7 in the Scheme 5.1. 9 These two ions are responsible for the
formation of elemental sulphur or thiosulphate in the process of reduction of nitroarenes
by -laden aqueous MEA solution. The presence of both ions (sulphide,
hydrosulphide) makes -laden aqueous alkanolamine and aqueous ammonium sulphide
solutions different from other reducing agent like sodium sulphide, sodium disulphide etc. 10
Liquid-Liquid-Solid (L-L-S) triphase reaction system consists of an organic phase
containing organic substrate (forming dispersed phase), an aqueous phase containing
inorganic reagent (normally continuous phase) and catalyst impregnated on a solid
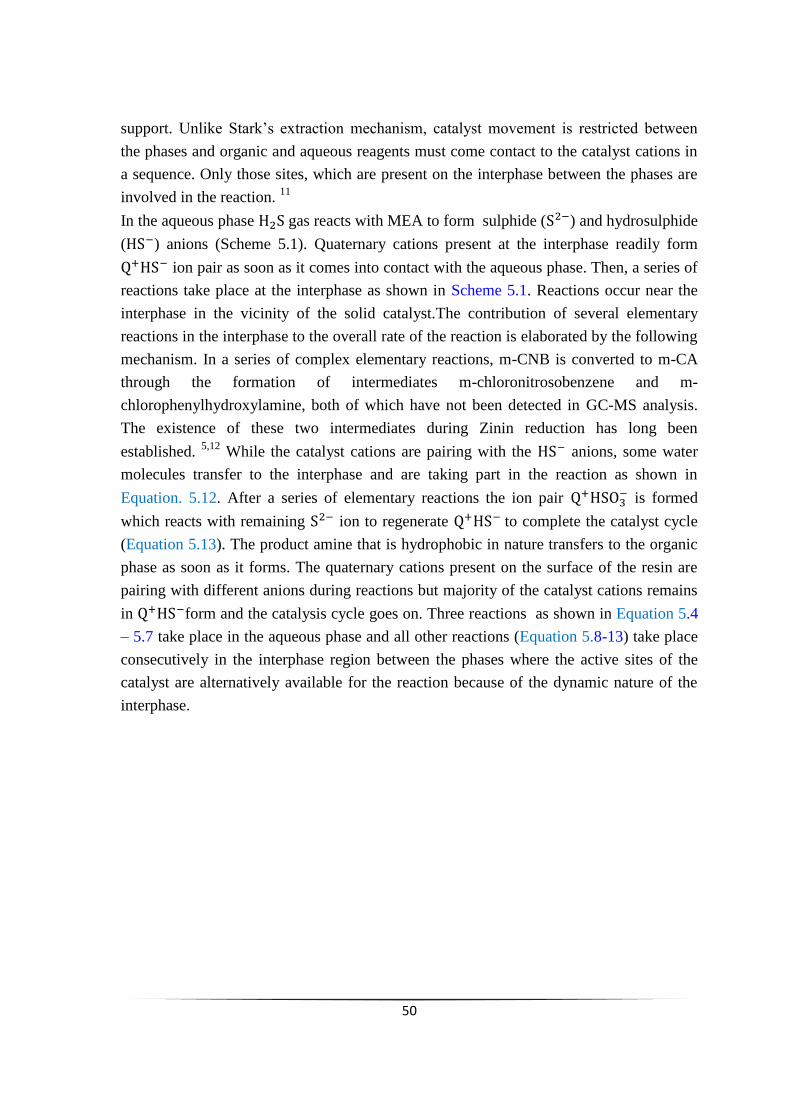
50
support. Unlike Stark‟s extraction mechanism, catalyst movement is restricted between
the phases and organic and aqueous reagents must come contact to the catalyst cations in
a sequence. Only those sites, which are present on the interphase between the phases are
involved in the reaction. 11
In the aqueous phase gas reacts with MEA to form sulphide ( ) and hydrosulphide
( ) anions (Scheme 5.1). Quaternary cations present at the interphase readily form
ion pair as soon as it comes into contact with the aqueous phase. Then, a series of
reactions take place at the interphase as shown in Scheme 5.1. Reactions occur near the
interphase in the vicinity of the solid catalyst.The contribution of several elementary
reactions in the interphase to the overall rate of the reaction is elaborated by the following
mechanism. In a series of complex elementary reactions, m-CNB is converted to m-CA
through the formation of intermediates m-chloronitrosobenzene and m-
chlorophenylhydroxylamine, both of which have not been detected in GC-MS analysis.
The existence of these two intermediates during Zinin reduction has long been
established. 5,12
While the catalyst cations are pairing with the anions, some water
molecules transfer to the interphase and are taking part in the reaction as shown in
Equation. 5.12. After a series of elementary reactions the ion pair is formed
which reacts with remaining ion to regenerate to complete the catalyst cycle
(Equation 5.13). The product amine that is hydrophobic in nature transfers to the organic
phase as soon as it forms. The quaternary cations present on the surface of the resin are
pairing with different anions during reactions but majority of the catalyst cations remains
in form and the catalysis cycle goes on. Three reactions as shown in Equation 5.4
– 5.7 take place in the aqueous phase and all other reactions (Equation 5.8-13) take place
consecutively in the interphase region between the phases where the active sites of the
catalyst are alternatively available for the reaction because of the dynamic nature of the
interphase.
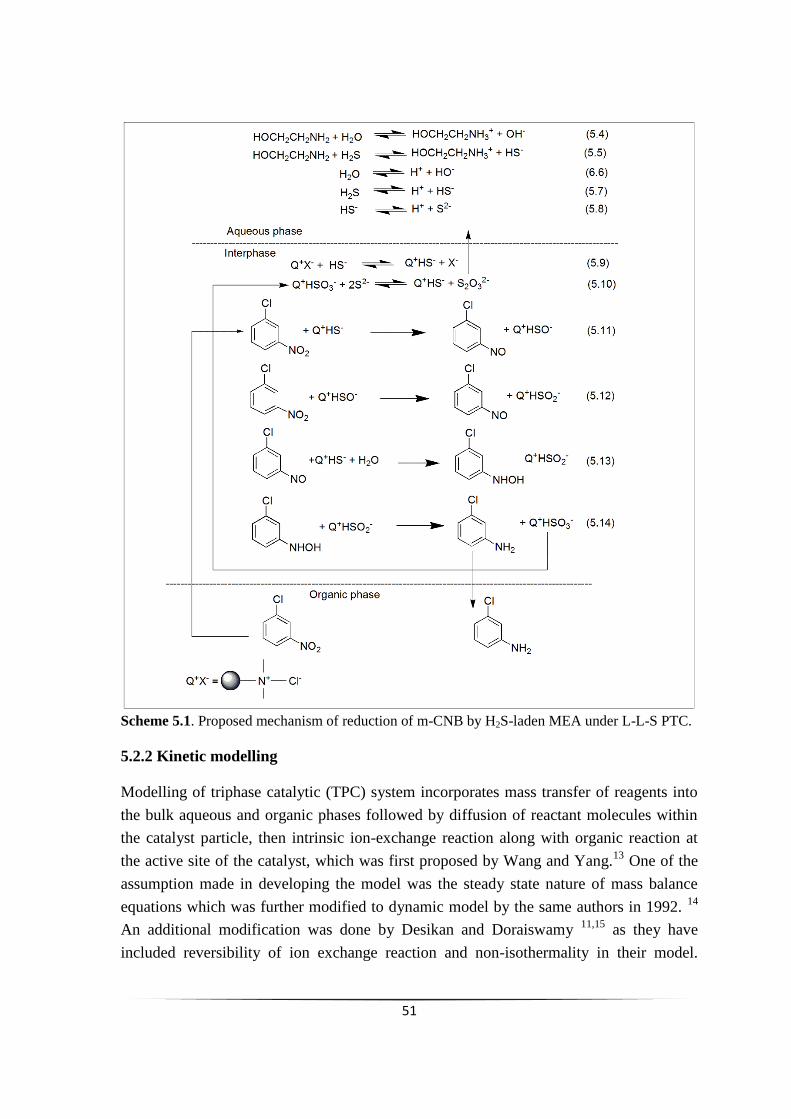
51
Scheme 5.1. Proposed mechanism of reduction of m-CNB by H2S-laden MEA under L-L-S PTC.
5.2.2 Kinetic modelling
Modelling of triphase catalytic (TPC) system incorporates mass transfer of reagents into
the bulk aqueous and organic phases followed by diffusion of reactant molecules within
the catalyst particle, then intrinsic ion-exchange reaction along with organic reaction at
the active site of the catalyst, which was first proposed by Wang and Yang.13
One of the
assumption made in developing the model was the steady state nature of mass balance
equations which was further modified to dynamic model by the same authors in 1992. 14
An additional modification was done by Desikan and Doraiswamy 11,15
as they have
included reversibility of ion exchange reaction and non-isothermality in their model.
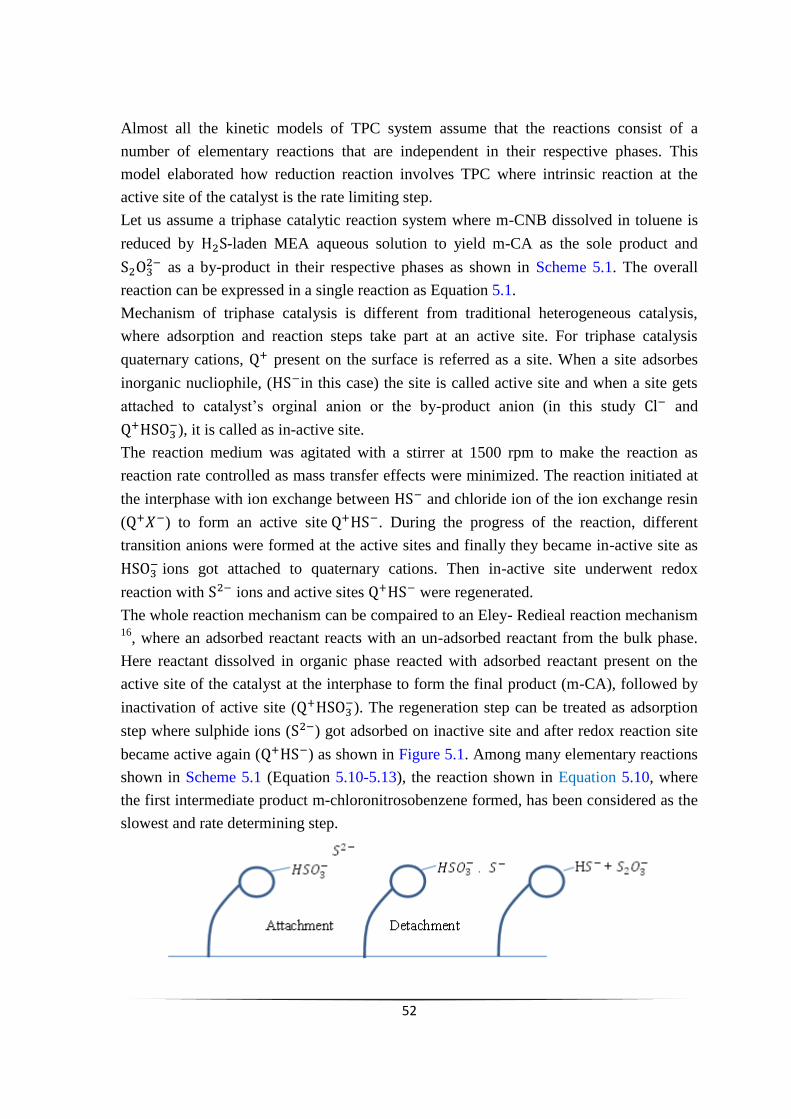
52
Almost all the kinetic models of TPC system assume that the reactions consist of a
number of elementary reactions that are independent in their respective phases. This
model elaborated how reduction reaction involves TPC where intrinsic reaction at the
active site of the catalyst is the rate limiting step.
Let us assume a triphase catalytic reaction system where m-CNB dissolved in toluene is
reduced by -laden MEA aqueous solution to yield m-CA as the sole product and
as a by-product in their respective phases as shown in Scheme 5.1. The overall
reaction can be expressed in a single reaction as Equation 5.1.
Mechanism of triphase catalysis is different from traditional heterogeneous catalysis,
where adsorption and reaction steps take part at an active site. For triphase catalysis
quaternary cations, present on the surface is referred as a site. When a site adsorbes
inorganic nucliophile, ( in this case) the site is called active site and when a site gets
attached to catalyst‟s orginal anion or the by-product anion (in this study and
), it is called as in-active site.
The reaction medium was agitated with a stirrer at 1500 rpm to make the reaction as
reaction rate controlled as mass transfer effects were minimized. The reaction initiated at
the interphase with ion exchange between and chloride ion of the ion exchange resin
( ) to form an active site . During the progress of the reaction, different
transition anions were formed at the active sites and finally they became in-active site as
ions got attached to quaternary cations. Then in-active site underwent redox
reaction with ions and active sites were regenerated.
The whole reaction mechanism can be compaired to an Eley- Redieal reaction mechanism 16
, where an adsorbed reactant reacts with an un-adsorbed reactant from the bulk phase.
Here reactant dissolved in organic phase reacted with adsorbed reactant present on the
active site of the catalyst at the interphase to form the final product (m-CA), followed by
inactivation of active site ( ). The regeneration step can be treated as adsorption
step where sulphide ions ( ) got adsorbed on inactive site and after redox reaction site
became active again ( ) as shown in Figure 5.1. Among many elementary reactions
shown in Scheme 5.1 (Equation 5.10-5.13), the reaction shown in Equation 5.10, where
the first intermediate product m-chloronitrosobenzene formed, has been considered as the
slowest and rate determining step.
53
Figure 5.1. Schematic diagram for catalyst regeneration.
The reversible regeneration reaction may be compared to the Langmuir-Hinshelwood
adsorption/desorption mechanism as shown in Figure 5.1.
(5.14)
A transitional site ( -
) was assumed to be formed between forward and
backwards reaction steps during regeneration reaction of active site, i.e.
(5.15)
This reaction can be thought to be consisting of two distinct attachment/detachment steps.
In the forward reaction step, sulphide ions ( ) gets attached to the inactive site
, which can be assumed as “attachment/detachment” step of sulphide ions ( ),
i.e.,
(5.16)
The backward reaction can be assumed as “attachment/detachment” of thiosulphate ion
(S2O32-
) at the active site, i.e.
(5.17)
Considering each of the attachment and the detachment steps are in equilibrium, Equation
5.18 and Equation 5.19 can be obtained from reaction Equation 5.16 and Equation. 5.17
respectively, as
(
)
(5.18)
(
) (5.19)
Here and are the equilibrium attachment/detachment constants for and
nucleophiles, respectively; and
are the concentrations of and
anions in the aqueous phase, respectively; and
, , are
fractions of the total number of triphase cations occupied by , ,
anions, respectively.
54
It can be postulated that the transition site formed at the catalyst cations
instantaneously converted to an active site or in-active site , so Equation
5.18 and Equation 5.19 can be rewritten as shown below.
( ) (5.20)
(
) (5.21)
Now combining Equation 5.20 and Equation 5.21 would yield a hyperbolic functions for
the fraction of active sites as,
(5.22)
And in the terms of catalyst concentration:
(5.23)
Since (because of irreversible removal of
from interphase to bulk
aqueous phase after the detachment of from the
), Equation 5.23
becomes,
Where and are the total concentration catalyst and active sites
respectively.
According to the overall reaction (Equation 5.1) the conversion can be calculated as
Conversion (X)
(5.24)
Where and are the total initial concentration of m-CNB and
concentration at any time of m-CNB in the organic phase.
So,
As it is mentioned before, the reaction (Equation 5.11) presented in Scheme 5.1 is rate
limiting step at the interphase, the rate ( ) of the reaction can be written as,
(5.25)
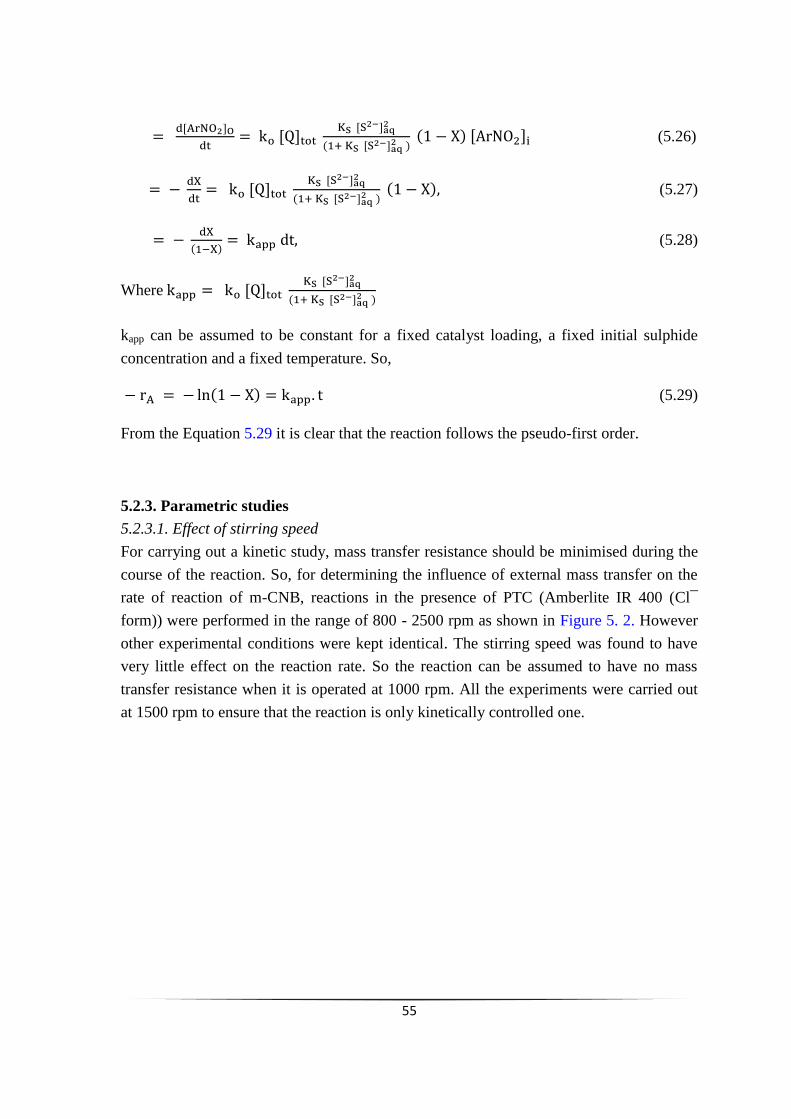
55
(5.26)
(5.27)
(5.28)
Where
kapp can be assumed to be constant for a fixed catalyst loading, a fixed initial sulphide
concentration and a fixed temperature. So,
(5.29)
From the Equation 5.29 it is clear that the reaction follows the pseudo-first order.
5.2.3. Parametric studies
5.2.3.1. Effect of stirring speed
For carrying out a kinetic study, mass transfer resistance should be minimised during the
course of the reaction. So, for determining the influence of external mass transfer on the
rate of reaction of m-CNB, reactions in the presence of PTC (Amberlite IR 400 (Cl¯
form)) were performed in the range of 800 - 2500 rpm as shown in Figure 5. 2. However
other experimental conditions were kept identical. The stirring speed was found to have
very little effect on the reaction rate. So the reaction can be assumed to have no mass
transfer resistance when it is operated at 1000 rpm. All the experiments were carried out
at 1500 rpm to ensure that the reaction is only kinetically controlled one.
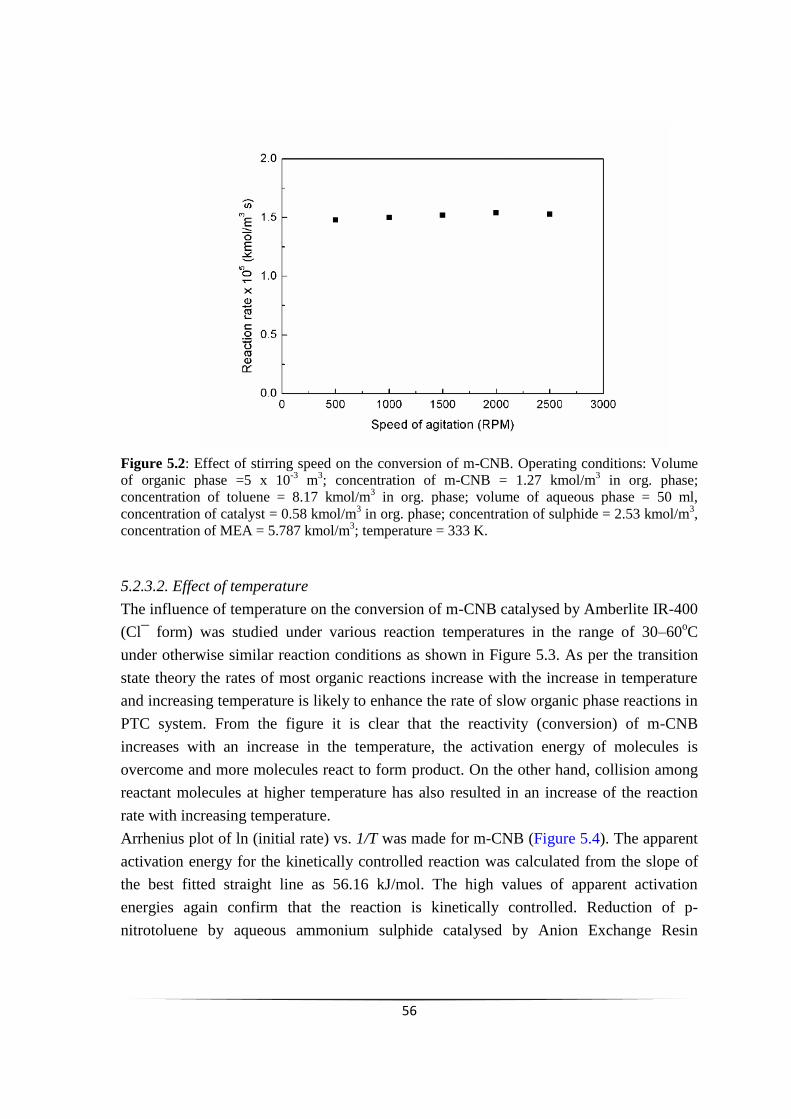
56
Figure 5.2: Effect of stirring speed on the conversion of m-CNB. Operating conditions: Volume
of organic phase =5 x 10⁻³
m3; concentration of m-CNB = 1.27 kmol/m
3 in org. phase;
concentration of toluene = 8.17 kmol/m3 in org. phase; volume of aqueous phase = 50 ml,
concentration of catalyst = 0.58 kmol/m3 in org. phase; concentration of sulphide = 2.53 kmol/m
3,
concentration of MEA = 5.787 kmol/m3; temperature = 333 K.
5.2.3.2. Effect of temperature
The influence of temperature on the conversion of m-CNB catalysed by Amberlite IR-400
(Cl¯ form) was studied under various reaction temperatures in the range of 30–60oC
under otherwise similar reaction conditions as shown in Figure 5.3. As per the transition
state theory the rates of most organic reactions increase with the increase in temperature
and increasing temperature is likely to enhance the rate of slow organic phase reactions in
PTC system. From the figure it is clear that the reactivity (conversion) of m-CNB
increases with an increase in the temperature, the activation energy of molecules is
overcome and more molecules react to form product. On the other hand, collision among
reactant molecules at higher temperature has also resulted in an increase of the reaction
rate with increasing temperature.
Arrhenius plot of ln (initial rate) vs. 1/T was made for m-CNB (Figure 5.4). The apparent
activation energy for the kinetically controlled reaction was calculated from the slope of
the best fitted straight line as 56.16 kJ/mol. The high values of apparent activation
energies again confirm that the reaction is kinetically controlled. Reduction of p-
nitrotoluene by aqueous ammonium sulphide catalysed by Anion Exchange Resin
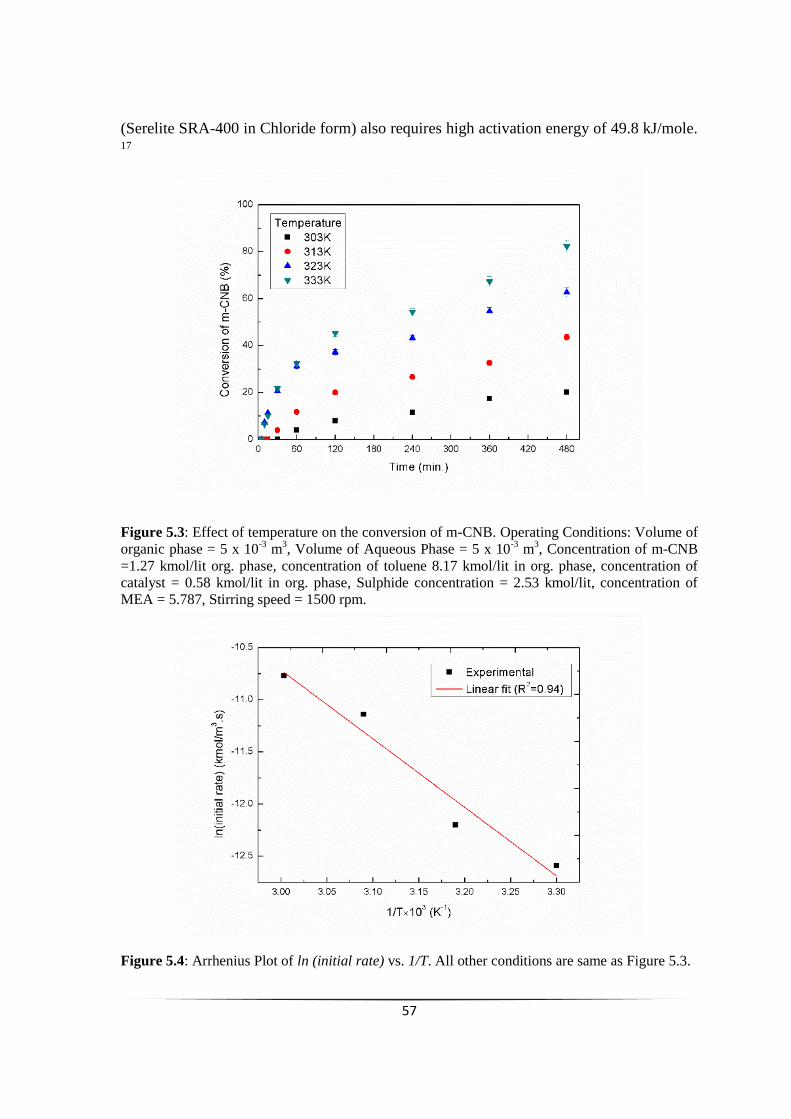
57
(Serelite SRA-400 in Chloride form) also requires high activation energy of 49.8 kJ/mole. 17
Figure 5.3: Effect of temperature on the conversion of m-CNB. Operating Conditions: Volume of
organic phase = 5 x 10⁻³
m3, Volume of Aqueous Phase = 5 x 10
-3 m
3, Concentration of m-CNB
=1.27 kmol/lit org. phase, concentration of toluene 8.17 kmol/lit in org. phase, concentration of
catalyst = 0.58 kmol/lit in org. phase, Sulphide concentration = 2.53 kmol/lit, concentration of
MEA = 5.787, Stirring speed = 1500 rpm.
Figure 5.4: Arrhenius Plot of ln (initial rate) vs. 1/T. All other conditions are same as Figure 5.3.
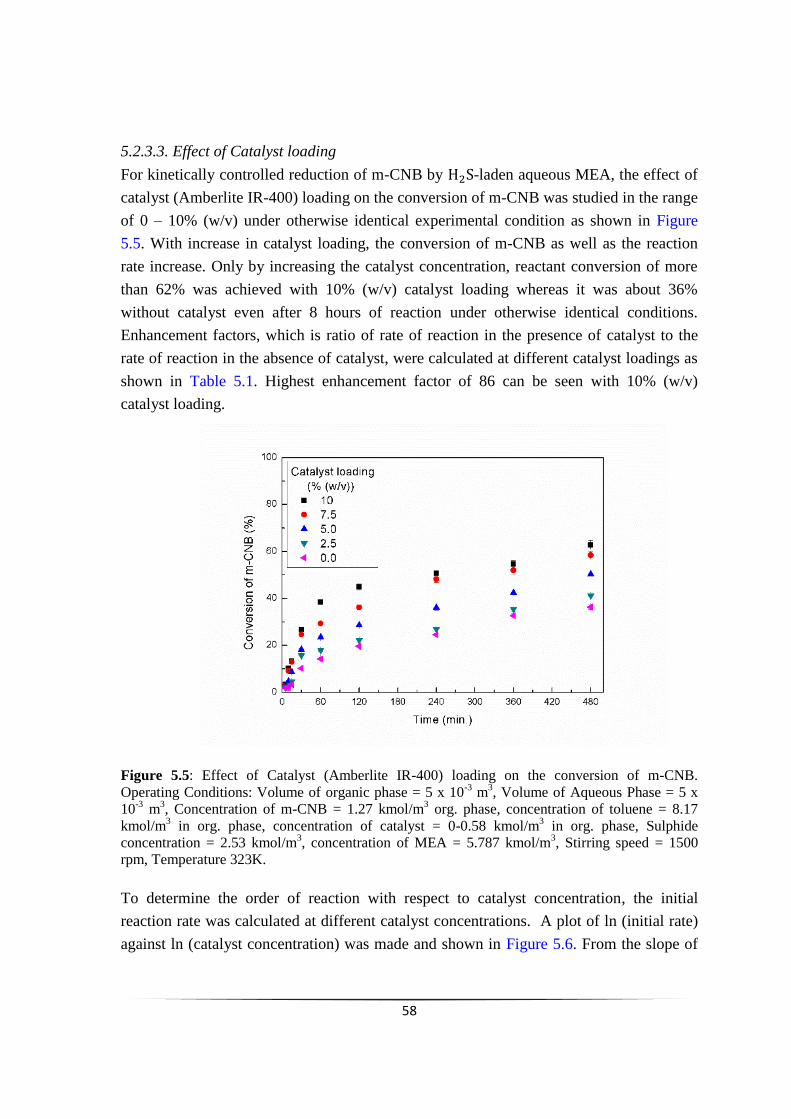
58
5.2.3.3. Effect of Catalyst loading
For kinetically controlled reduction of m-CNB by -laden aqueous MEA, the effect of
catalyst (Amberlite IR-400) loading on the conversion of m-CNB was studied in the range
of 0 – 10% (w/v) under otherwise identical experimental condition as shown in Figure
5.5. With increase in catalyst loading, the conversion of m-CNB as well as the reaction
rate increase. Only by increasing the catalyst concentration, reactant conversion of more
than 62% was achieved with 10% (w/v) catalyst loading whereas it was about 36%
without catalyst even after 8 hours of reaction under otherwise identical conditions.
Enhancement factors, which is ratio of rate of reaction in the presence of catalyst to the
rate of reaction in the absence of catalyst, were calculated at different catalyst loadings as
shown in Table 5.1. Highest enhancement factor of 86 can be seen with 10% (w/v)
catalyst loading.
Figure 5.5: Effect of Catalyst (Amberlite IR-400) loading on the conversion of m-CNB.
Operating Conditions: Volume of organic phase = 5 x 10⁻³
m3, Volume of Aqueous Phase = 5 x
10-3
m3, Concentration of m-CNB = 1.27 kmol/m
3 org. phase, concentration of toluene = 8.17
kmol/m3 in org. phase, concentration of catalyst = 0-0.58 kmol/m
3 in org. phase, Sulphide
concentration = 2.53 kmol/m3, concentration of MEA = 5.787 kmol/m
3, Stirring speed = 1500
rpm, Temperature 323K.
To determine the order of reaction with respect to catalyst concentration, the initial
reaction rate was calculated at different catalyst concentrations. A plot of ln (initial rate)
against ln (catalyst concentration) was made and shown in Figure 5.6. From the slope of
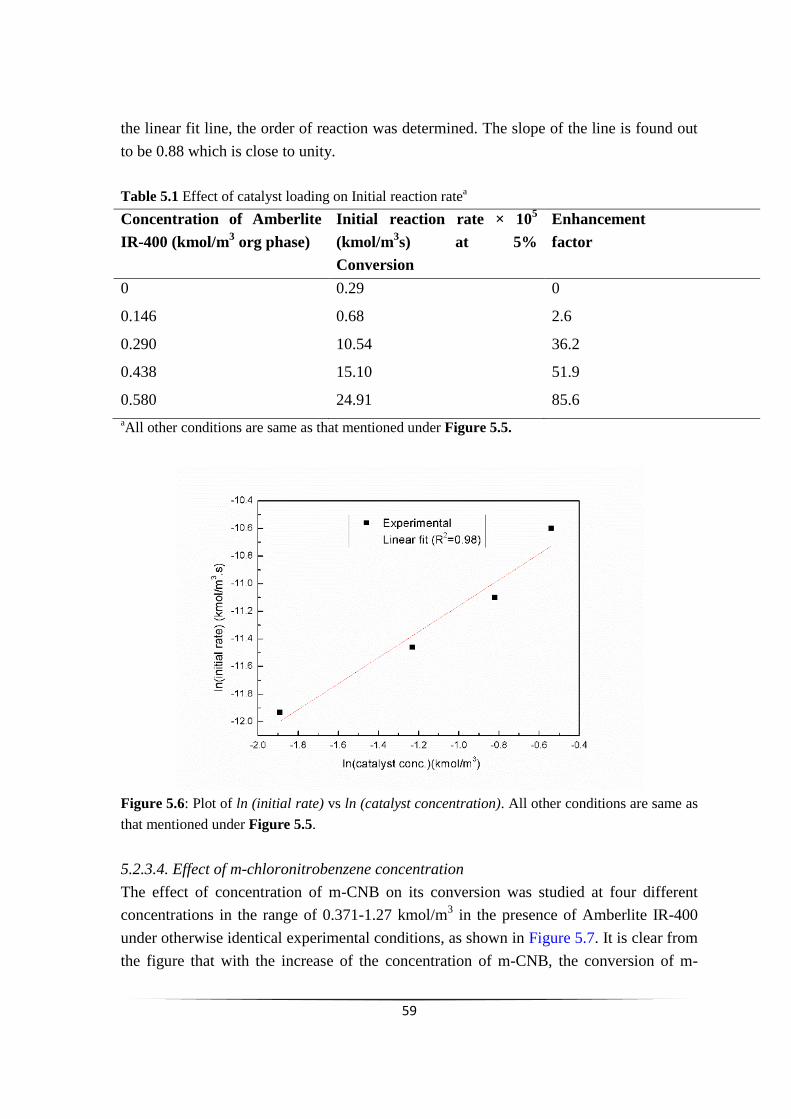
59
the linear fit line, the order of reaction was determined. The slope of the line is found out
to be 0.88 which is close to unity.
Table 5.1 Effect of catalyst loading on Initial reaction ratea
Concentration of Amberlite
IR-400 (kmol/m3 org phase)
Initial reaction rate × 105
(kmol/m3s) at 5%
Conversion
Enhancement
factor
0 0.29 0
0.146 0.68 2.6
0.290 10.54 36.2
0.438 15.10 51.9
0.580 24.91 85.6
aAll other conditions are same as that mentioned under Figure 5.5.
Figure 5.6: Plot of ln (initial rate) vs ln (catalyst concentration). All other conditions are same as
that mentioned under Figure 5.5.
5.2.3.4. Effect of m-chloronitrobenzene concentration
The effect of concentration of m-CNB on its conversion was studied at four different
concentrations in the range of 0.371-1.27 kmol/m3 in the presence of Amberlite IR-400
under otherwise identical experimental conditions, as shown in Figure 5.7. It is clear from
the figure that with the increase of the concentration of m-CNB, the conversion of m-
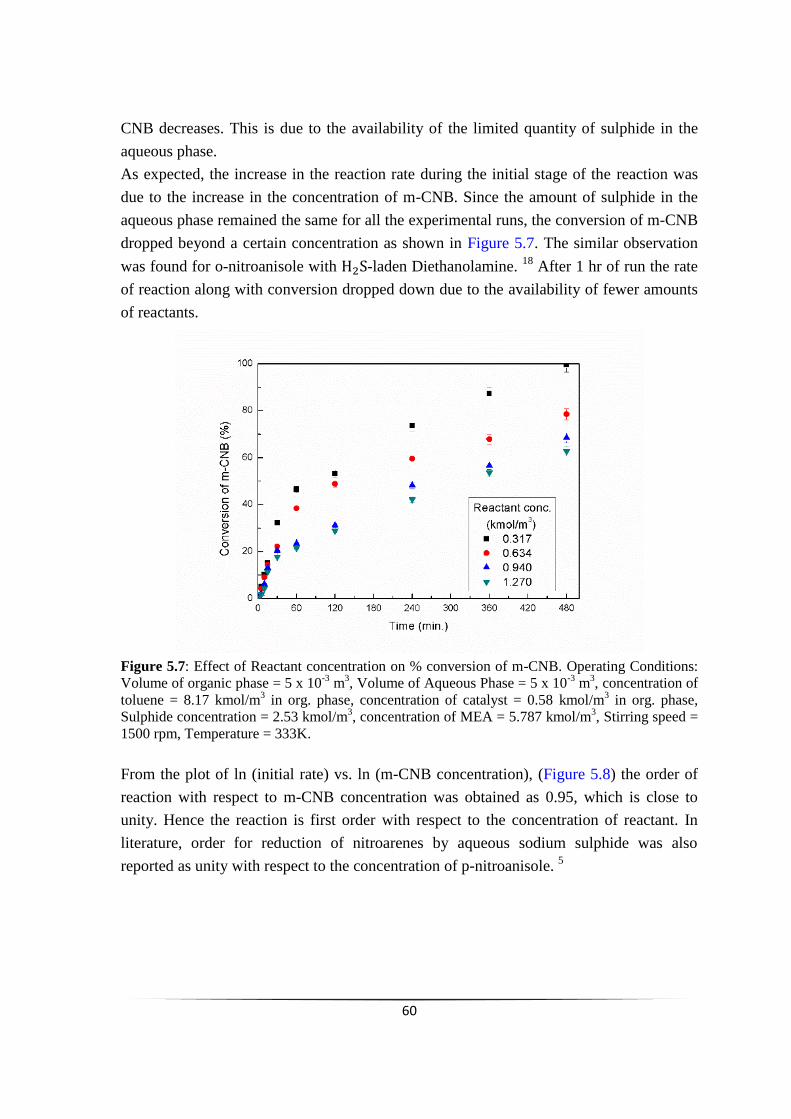
60
CNB decreases. This is due to the availability of the limited quantity of sulphide in the
aqueous phase.
As expected, the increase in the reaction rate during the initial stage of the reaction was
due to the increase in the concentration of m-CNB. Since the amount of sulphide in the
aqueous phase remained the same for all the experimental runs, the conversion of m-CNB
dropped beyond a certain concentration as shown in Figure 5.7. The similar observation
was found for o-nitroanisole with -laden Diethanolamine. 18
After 1 hr of run the rate
of reaction along with conversion dropped down due to the availability of fewer amounts
of reactants.
Figure 5.7: Effect of Reactant concentration on % conversion of m-CNB. Operating Conditions:
Volume of organic phase = 5 x 10⁻³
m3, Volume of Aqueous Phase = 5 x 10
-3 m
3, concentration of
toluene = 8.17 kmol/m3 in org. phase, concentration of catalyst = 0.58 kmol/m
3 in org. phase,
Sulphide concentration = 2.53 kmol/m3, concentration of MEA = 5.787 kmol/m
3, Stirring speed =
1500 rpm, Temperature = 333K.
From the plot of ln (initial rate) vs. ln (m-CNB concentration), (Figure 5.8) the order of
reaction with respect to m-CNB concentration was obtained as 0.95, which is close to
unity. Hence the reaction is first order with respect to the concentration of reactant. In
literature, order for reduction of nitroarenes by aqueous sodium sulphide was also
reported as unity with respect to the concentration of p-nitroanisole. 5
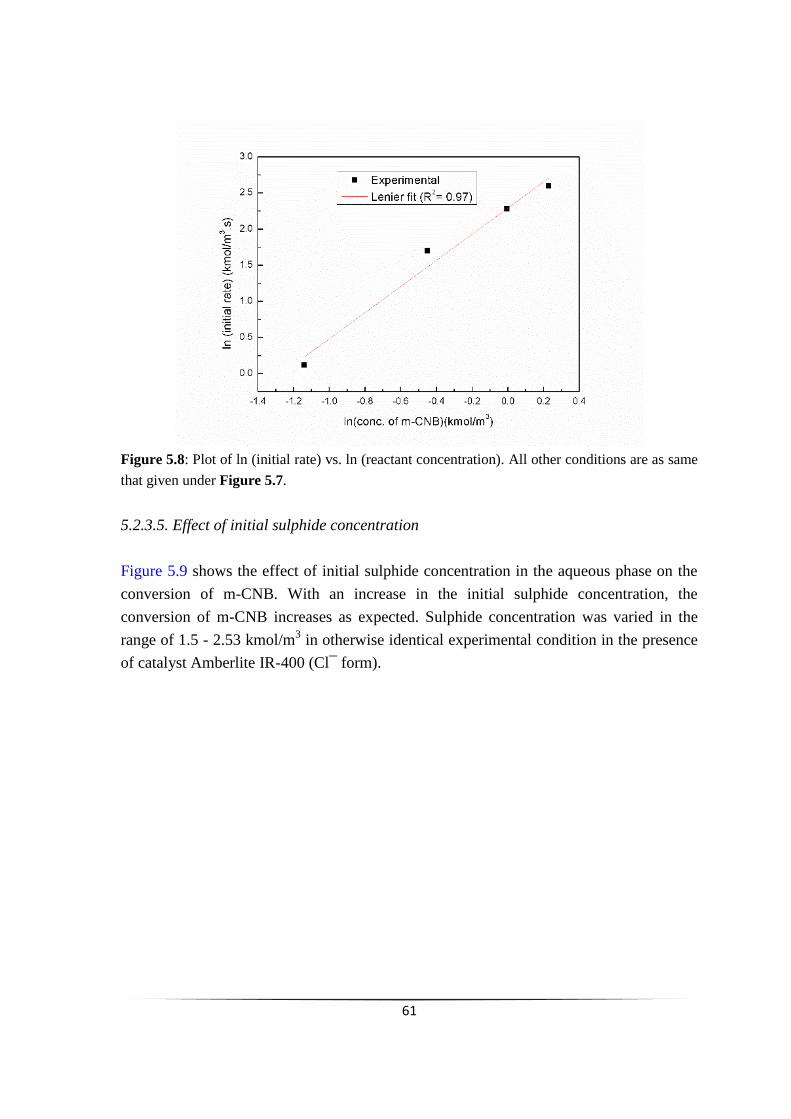
61
Figure 5.8: Plot of ln (initial rate) vs. ln (reactant concentration). All other conditions are as same
that given under Figure 5.7.
5.2.3.5. Effect of initial sulphide concentration
Figure 5.9 shows the effect of initial sulphide concentration in the aqueous phase on the
conversion of m-CNB. With an increase in the initial sulphide concentration, the
conversion of m-CNB increases as expected. Sulphide concentration was varied in the
range of 1.5 - 2.53 kmol/m3 in otherwise identical experimental condition in the presence
of catalyst Amberlite IR-400 (Cl¯ form).
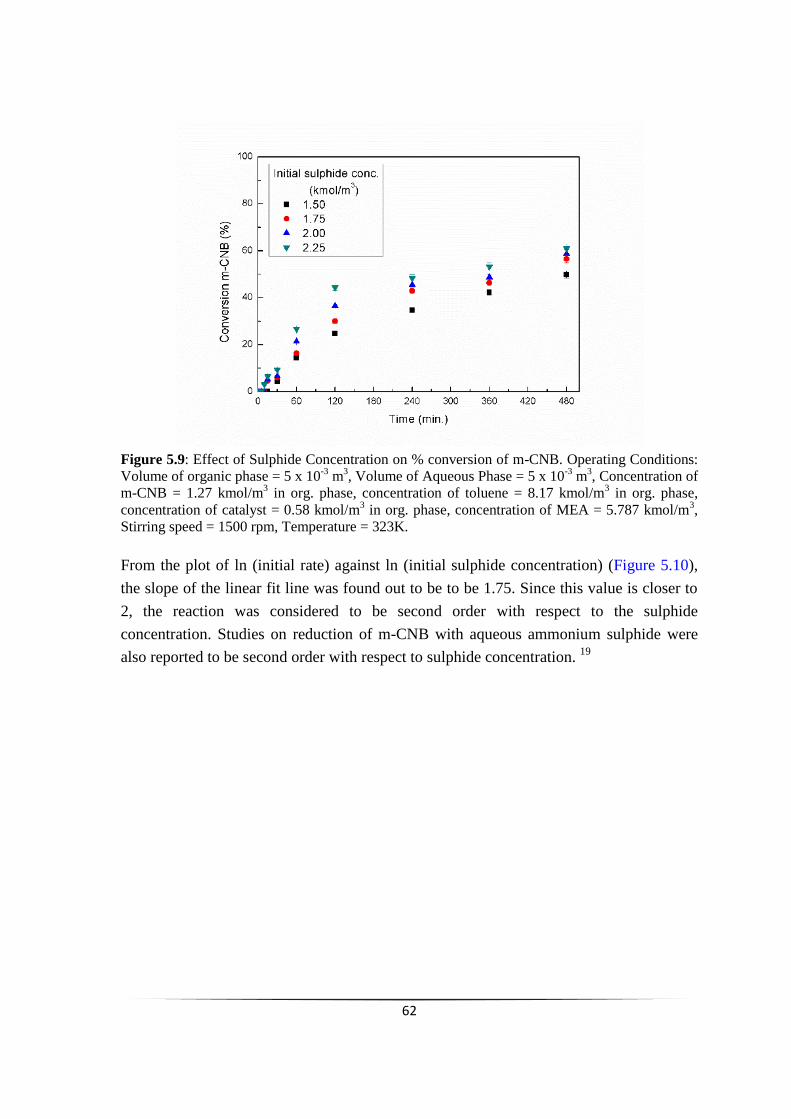
62
Figure 5.9: Effect of Sulphide Concentration on % conversion of m-CNB. Operating Conditions:
Volume of organic phase = 5 x 10⁻³
m3, Volume of Aqueous Phase = 5 x 10
-3 m
3, Concentration of
m-CNB = 1.27 kmol/m3 in org. phase, concentration of toluene = 8.17 kmol/m
3 in org. phase,
concentration of catalyst = 0.58 kmol/m3 in org. phase, concentration of MEA = 5.787 kmol/m
3,
Stirring speed = 1500 rpm, Temperature = 323K.
From the plot of ln (initial rate) against ln (initial sulphide concentration) (Figure 5.10),
the slope of the linear fit line was found out to be to be 1.75. Since this value is closer to
2, the reaction was considered to be second order with respect to the sulphide
concentration. Studies on reduction of m-CNB with aqueous ammonium sulphide were
also reported to be second order with respect to sulphide concentration. 19
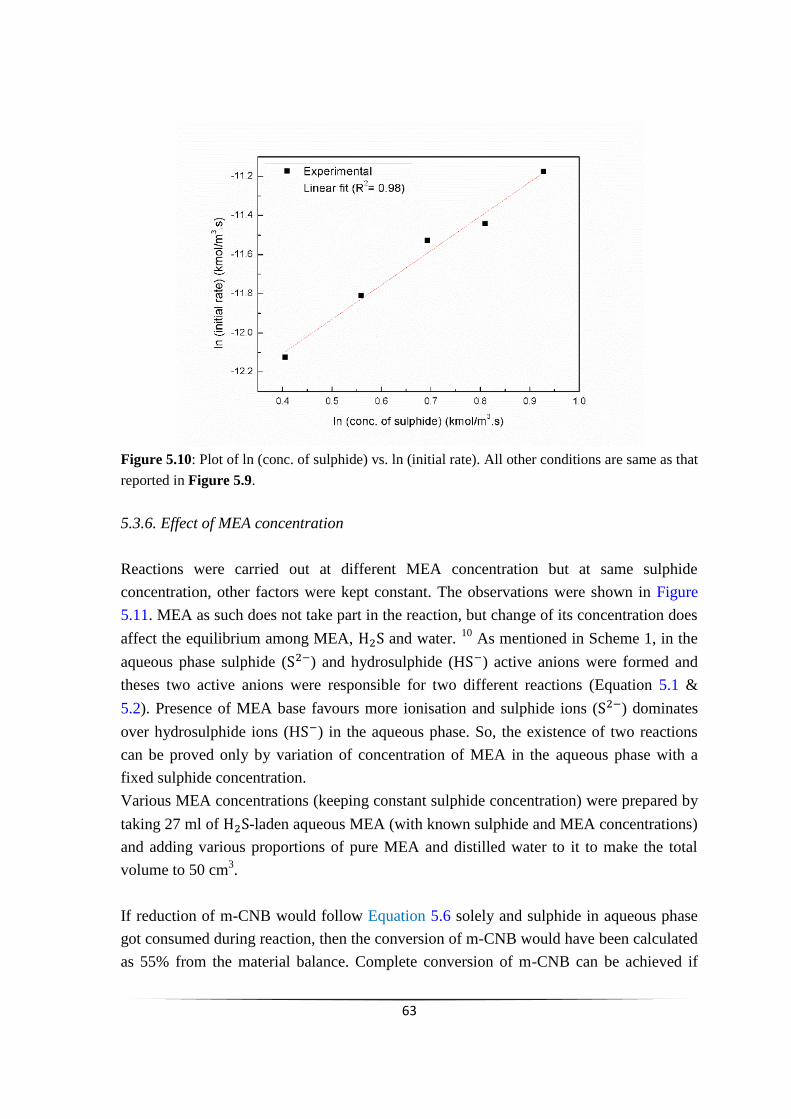
63
Figure 5.10: Plot of ln (conc. of sulphide) vs. ln (initial rate). All other conditions are same as that
reported in Figure 5.9.
5.3.6. Effect of MEA concentration
Reactions were carried out at different MEA concentration but at same sulphide
concentration, other factors were kept constant. The observations were shown in Figure
5.11. MEA as such does not take part in the reaction, but change of its concentration does
affect the equilibrium among MEA, and water. 10
As mentioned in Scheme 1, in the
aqueous phase sulphide ( ) and hydrosulphide (H ) active anions were formed and
theses two active anions were responsible for two different reactions (Equation 5.1 &
5.2). Presence of MEA base favours more ionisation and sulphide ions ( ) dominates
over hydrosulphide ions (H ) in the aqueous phase. So, the existence of two reactions
can be proved only by variation of concentration of MEA in the aqueous phase with a
fixed sulphide concentration.
Various MEA concentrations (keeping constant sulphide concentration) were prepared by
taking 27 ml of -laden aqueous MEA (with known sulphide and MEA concentrations)
and adding various proportions of pure MEA and distilled water to it to make the total
volume to 50 cm3.
If reduction of m-CNB would follow Equation 5.6 solely and sulphide in aqueous phase
got consumed during reaction, then the conversion of m-CNB would have been calculated
as 55% from the material balance. Complete conversion of m-CNB can be achieved if
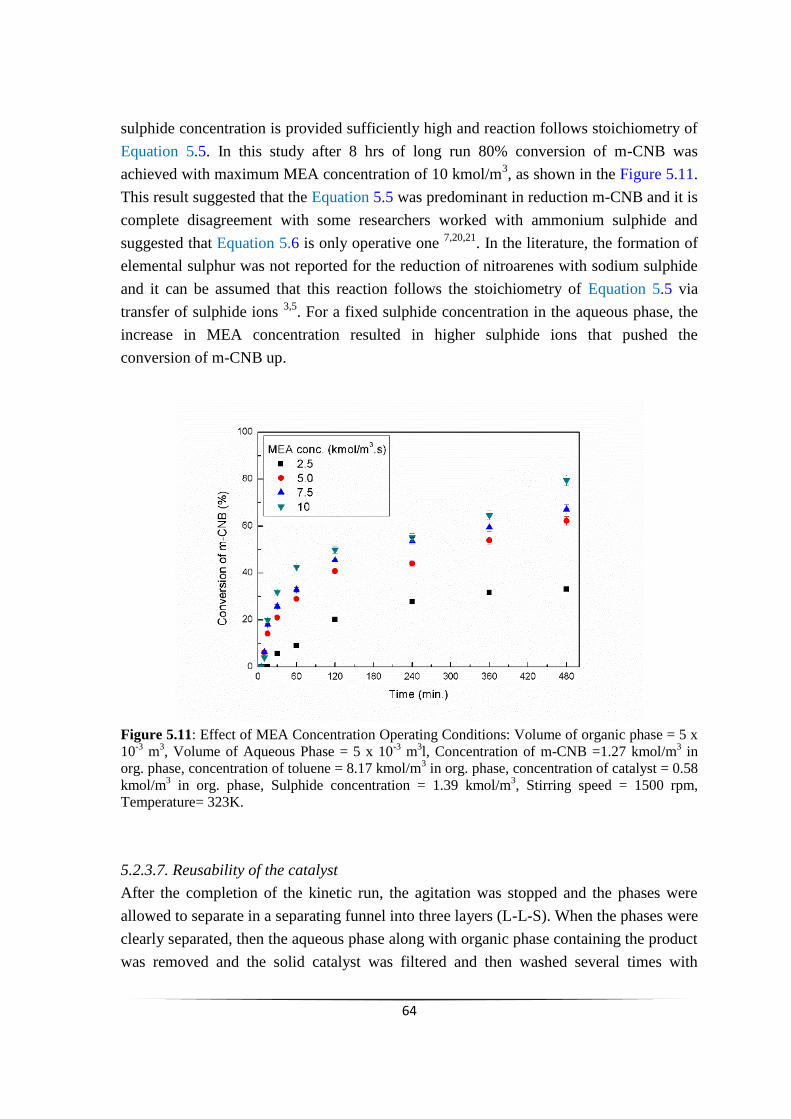
64
sulphide concentration is provided sufficiently high and reaction follows stoichiometry of
Equation 5.5. In this study after 8 hrs of long run 80% conversion of m-CNB was
achieved with maximum MEA concentration of 10 kmol/m3, as shown in the Figure 5.11.
This result suggested that the Equation 5.5 was predominant in reduction m-CNB and it is
complete disagreement with some researchers worked with ammonium sulphide and
suggested that Equation 5.6 is only operative one 7,20,21
. In the literature, the formation of
elemental sulphur was not reported for the reduction of nitroarenes with sodium sulphide
and it can be assumed that this reaction follows the stoichiometry of Equation 5.5 via
transfer of sulphide ions 3,5
. For a fixed sulphide concentration in the aqueous phase, the
increase in MEA concentration resulted in higher sulphide ions that pushed the
conversion of m-CNB up.
Figure 5.11: Effect of MEA Concentration Operating Conditions: Volume of organic phase = 5 x
10-3
m3, Volume of Aqueous Phase = 5 x 10
-3 m
3l, Concentration of m-CNB =1.27 kmol/m
3 in
org. phase, concentration of toluene = 8.17 kmol/m3 in org. phase, concentration of catalyst = 0.58
kmol/m3 in org. phase, Sulphide concentration = 1.39 kmol/m
3, Stirring speed = 1500 rpm,
Temperature= 323K.
5.2.3.7. Reusability of the catalyst
After the completion of the kinetic run, the agitation was stopped and the phases were
allowed to separate in a separating funnel into three layers (L-L-S). When the phases were
clearly separated, then the aqueous phase along with organic phase containing the product
was removed and the solid catalyst was filtered and then washed several times with
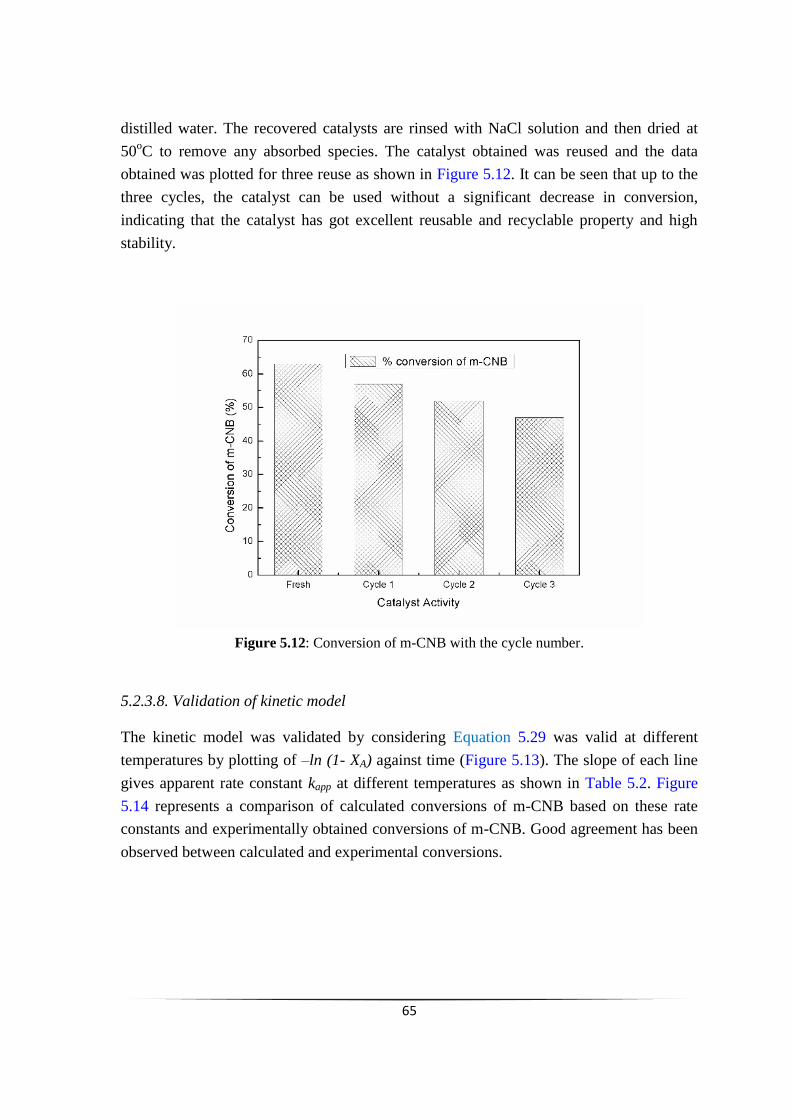
65
distilled water. The recovered catalysts are rinsed with NaCl solution and then dried at
50oC to remove any absorbed species. The catalyst obtained was reused and the data
obtained was plotted for three reuse as shown in Figure 5.12. It can be seen that up to the
three cycles, the catalyst can be used without a significant decrease in conversion,
indicating that the catalyst has got excellent reusable and recyclable property and high
stability.
Figure 5.12: Conversion of m-CNB with the cycle number.
5.2.3.8. Validation of kinetic model
The kinetic model was validated by considering Equation 5.29 was valid at different
temperatures by plotting of –ln (1- XA) against time (Figure 5.13). The slope of each line
gives apparent rate constant kapp at different temperatures as shown in Table 5.2. Figure
5.14 represents a comparison of calculated conversions of m-CNB based on these rate
constants and experimentally obtained conversions of m-CNB. Good agreement has been
observed between calculated and experimental conversions.
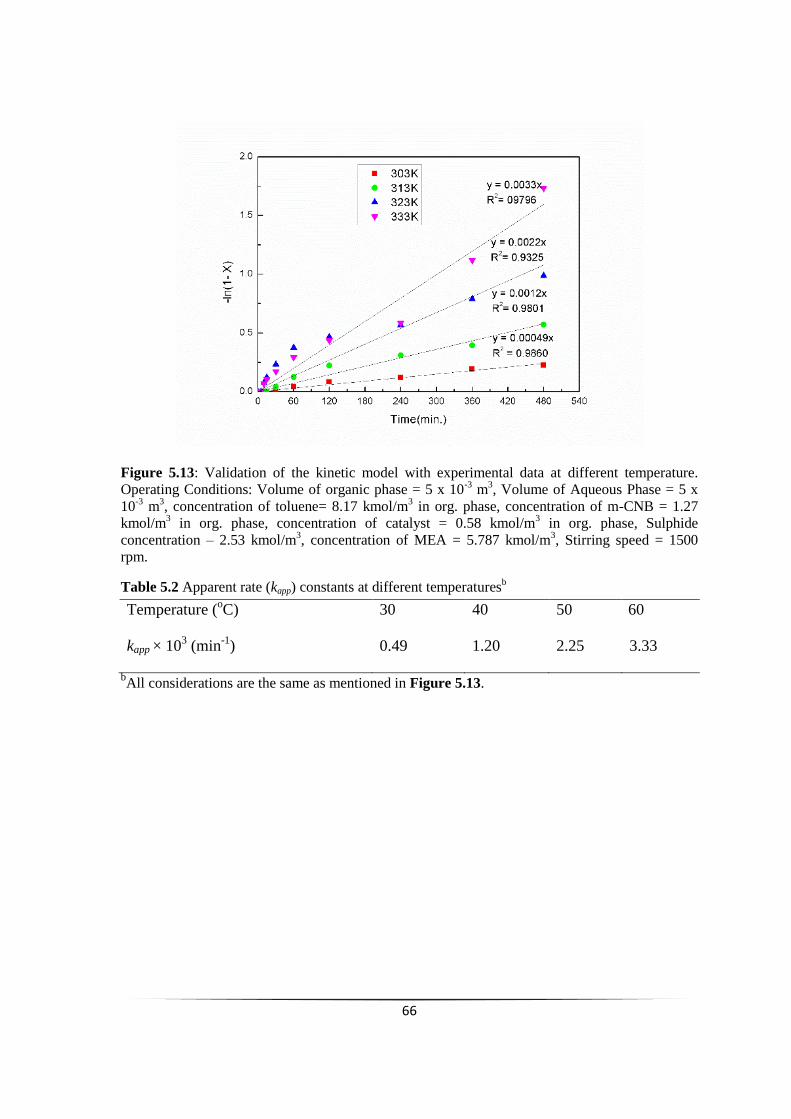
66
Figure 5.13: Validation of the kinetic model with experimental data at different temperature.
Operating Conditions: Volume of organic phase = 5 x 10⁻³
m3, Volume of Aqueous Phase = 5 x
10-3
m3, concentration of toluene= 8.17 kmol/m
3 in org. phase, concentration of m-CNB = 1.27
kmol/m3 in org. phase, concentration of catalyst = 0.58 kmol/m
3 in org. phase, Sulphide
concentration – 2.53 kmol/m3, concentration of MEA = 5.787 kmol/m
3, Stirring speed = 1500
rpm.
Table 5.2 Apparent rate (kapp) constants at different temperaturesb
Temperature (oC) 30 40 50 60
kapp × 103 (min
-1) 0.49 1.20 2.25 3.33
bAll considerations are the same as mentioned in Figure 5.13.
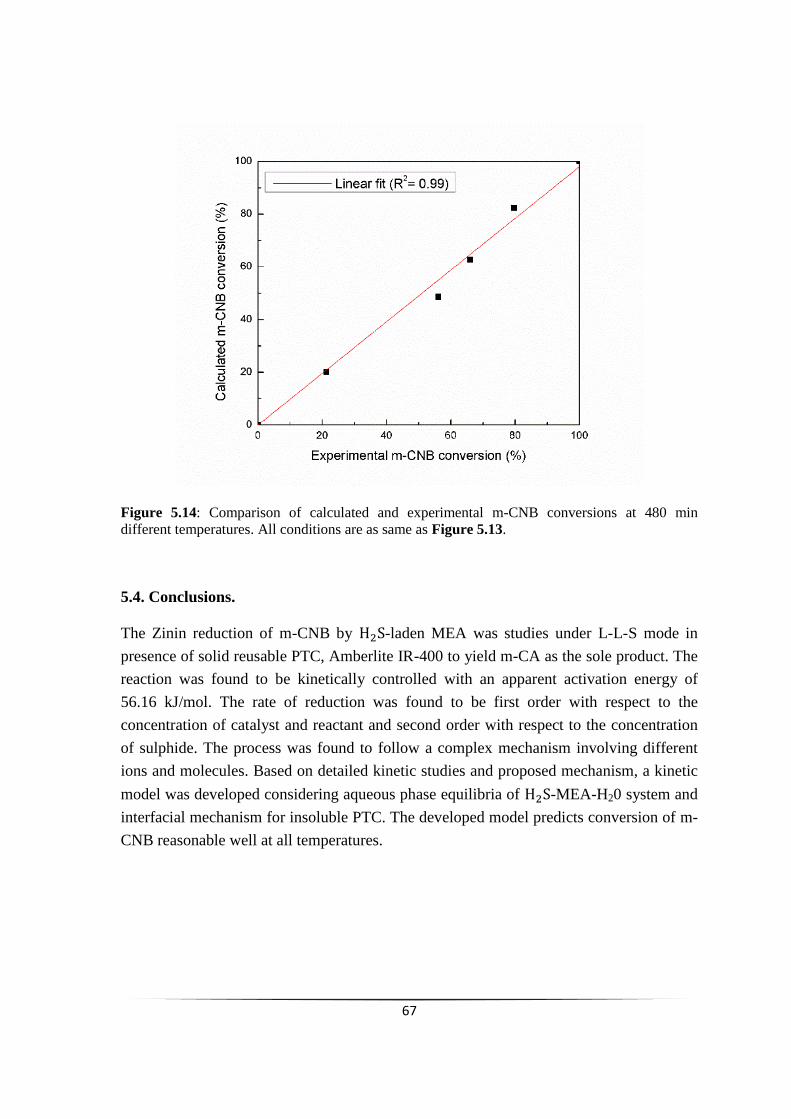
67
Figure 5.14: Comparison of calculated and experimental m-CNB conversions at 480 min
different temperatures. All conditions are as same as Figure 5.13.
5.4. Conclusions.
The Zinin reduction of m-CNB by -laden MEA was studies under L-L-S mode in
presence of solid reusable PTC, Amberlite IR-400 to yield m-CA as the sole product. The
reaction was found to be kinetically controlled with an apparent activation energy of
56.16 kJ/mol. The rate of reduction was found to be first order with respect to the
concentration of catalyst and reactant and second order with respect to the concentration
of sulphide. The process was found to follow a complex mechanism involving different
ions and molecules. Based on detailed kinetic studies and proposed mechanism, a kinetic
model was developed considering aqueous phase equilibria of -MEA-H20 system and
interfacial mechanism for insoluble PTC. The developed model predicts conversion of m-
CNB reasonable well at all temperatures.
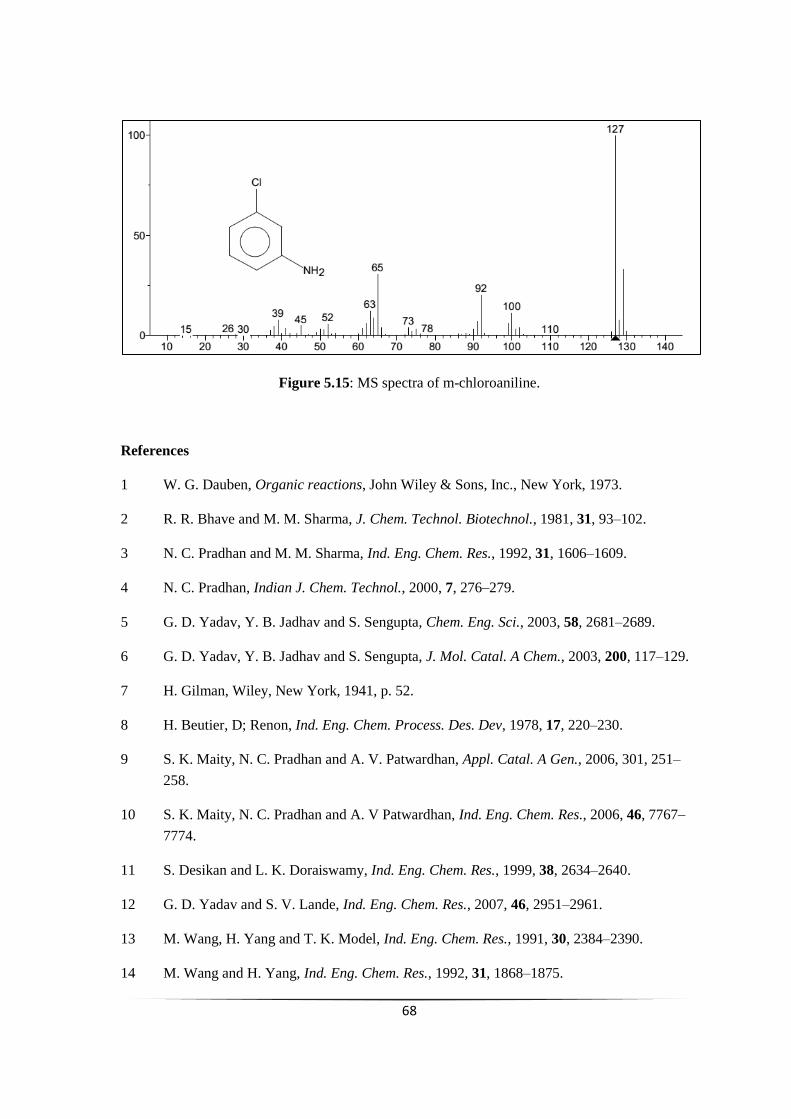
68
Figure 5.15: MS spectra of m-chloroaniline.
References
1 W. G. Dauben, Organic reactions, John Wiley & Sons, Inc., New York, 1973.
2 R. R. Bhave and M. M. Sharma, J. Chem. Technol. Biotechnol., 1981, 31, 93–102.
3 N. C. Pradhan and M. M. Sharma, Ind. Eng. Chem. Res., 1992, 31, 1606–1609.
4 N. C. Pradhan, Indian J. Chem. Technol., 2000, 7, 276–279.
5 G. D. Yadav, Y. B. Jadhav and S. Sengupta, Chem. Eng. Sci., 2003, 58, 2681–2689.
6 G. D. Yadav, Y. B. Jadhav and S. Sengupta, J. Mol. Catal. A Chem., 2003, 200, 117–129.
7 H. Gilman, Wiley, New York, 1941, p. 52.
8 H. Beutier, D; Renon, Ind. Eng. Chem. Process. Des. Dev, 1978, 17, 220–230.
9 S. K. Maity, N. C. Pradhan and A. V. Patwardhan, Appl. Catal. A Gen., 2006, 301, 251–
258.
10 S. K. Maity, N. C. Pradhan and A. V Patwardhan, Ind. Eng. Chem. Res., 2006, 46, 7767–
7774.
11 S. Desikan and L. K. Doraiswamy, Ind. Eng. Chem. Res., 1999, 38, 2634–2640.
12 G. D. Yadav and S. V. Lande, Ind. Eng. Chem. Res., 2007, 46, 2951–2961.
13 M. Wang, H. Yang and T. K. Model, Ind. Eng. Chem. Res., 1991, 30, 2384–2390.
14 M. Wang and H. Yang, Ind. Eng. Chem. Res., 1992, 31, 1868–1875.
69
15 S. Desikan and L. K. Doraiswamy, Ind. Eng. Chem. Res., 1995, 34, 3524–3537.
16 J. A. B. Satrio, H. J. Glatzer and L. K. Doraiswamy, Chem. Eng. Sci., 2000, 55, 5013–
5033.
17 S. K. Maity, N. C. Pradhan and A. V. Patwardhan, Chem. Eng. J., 2008, 141, 187–193.
18 S. K. Maity, N. C. Pradhan and A. V. Patwardhan, Chem. Eng. Sci., 2007, 62, 805–813.
19 S. K. Maity, N. C. Pradhan and A. V. Patwardhan, Appl. Catal. B Environ., 2008, 77, 418–
426.
20 G. R. W. R. Meindl, E. V. Angerer, H. Schonenberger, J. Med. Chem., 27, 1111–1118.
21 N. F. Lucas, H J, Scudder, J. Am. Chem. Soc., 1928, 50, 244–249.
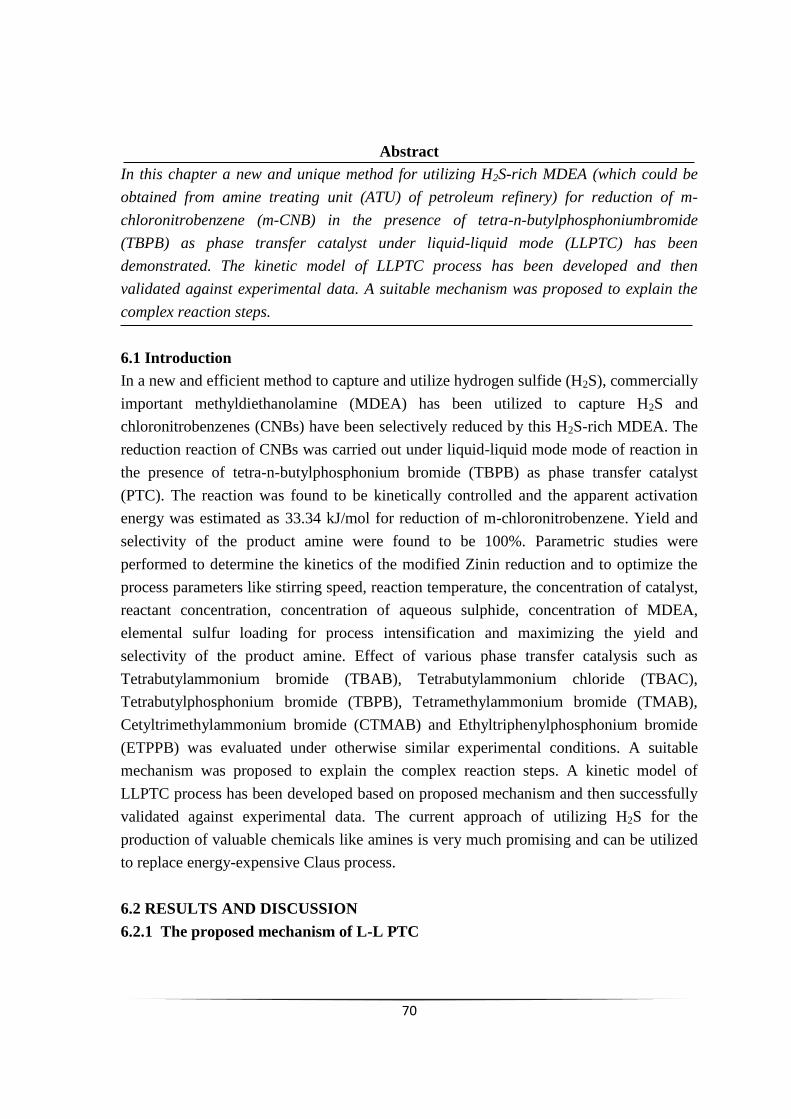
70
Abstract
In this chapter a new and unique method for utilizing H2S-rich MDEA (which could be
obtained from amine treating unit (ATU) of petroleum refinery) for reduction of m-
chloronitrobenzene (m-CNB) in the presence of tetra-n-butylphosphoniumbromide
(TBPB) as phase transfer catalyst under liquid-liquid mode (LLPTC) has been
demonstrated. The kinetic model of LLPTC process has been developed and then
validated against experimental data. A suitable mechanism was proposed to explain the
complex reaction steps.
6.1 Introduction
In a new and efficient method to capture and utilize hydrogen sulfide (H2S), commercially
important methyldiethanolamine (MDEA) has been utilized to capture H2S and
chloronitrobenzenes (CNBs) have been selectively reduced by this H2S-rich MDEA. The
reduction reaction of CNBs was carried out under liquid-liquid mode mode of reaction in
the presence of tetra-n-butylphosphonium bromide (TBPB) as phase transfer catalyst
(PTC). The reaction was found to be kinetically controlled and the apparent activation
energy was estimated as 33.34 kJ/mol for reduction of m-chloronitrobenzene. Yield and
selectivity of the product amine were found to be 100%. Parametric studies were
performed to determine the kinetics of the modified Zinin reduction and to optimize the
process parameters like stirring speed, reaction temperature, the concentration of catalyst,
reactant concentration, concentration of aqueous sulphide, concentration of MDEA,
elemental sulfur loading for process intensification and maximizing the yield and
selectivity of the product amine. Effect of various phase transfer catalysis such as
Tetrabutylammonium bromide (TBAB), Tetrabutylammonium chloride (TBAC),
Tetrabutylphosphonium bromide (TBPB), Tetramethylammonium bromide (TMAB),
Cetyltrimethylammonium bromide (CTMAB) and Ethyltriphenylphosphonium bromide
(ETPPB) was evaluated under otherwise similar experimental conditions. A suitable
mechanism was proposed to explain the complex reaction steps. A kinetic model of
LLPTC process has been developed based on proposed mechanism and then successfully
validated against experimental data. The current approach of utilizing H2S for the
production of valuable chemicals like amines is very much promising and can be utilized
to replace energy-expensive Claus process.
6.2 RESULTS AND DISCUSSION
6.2.1 The proposed mechanism of L-L PTC
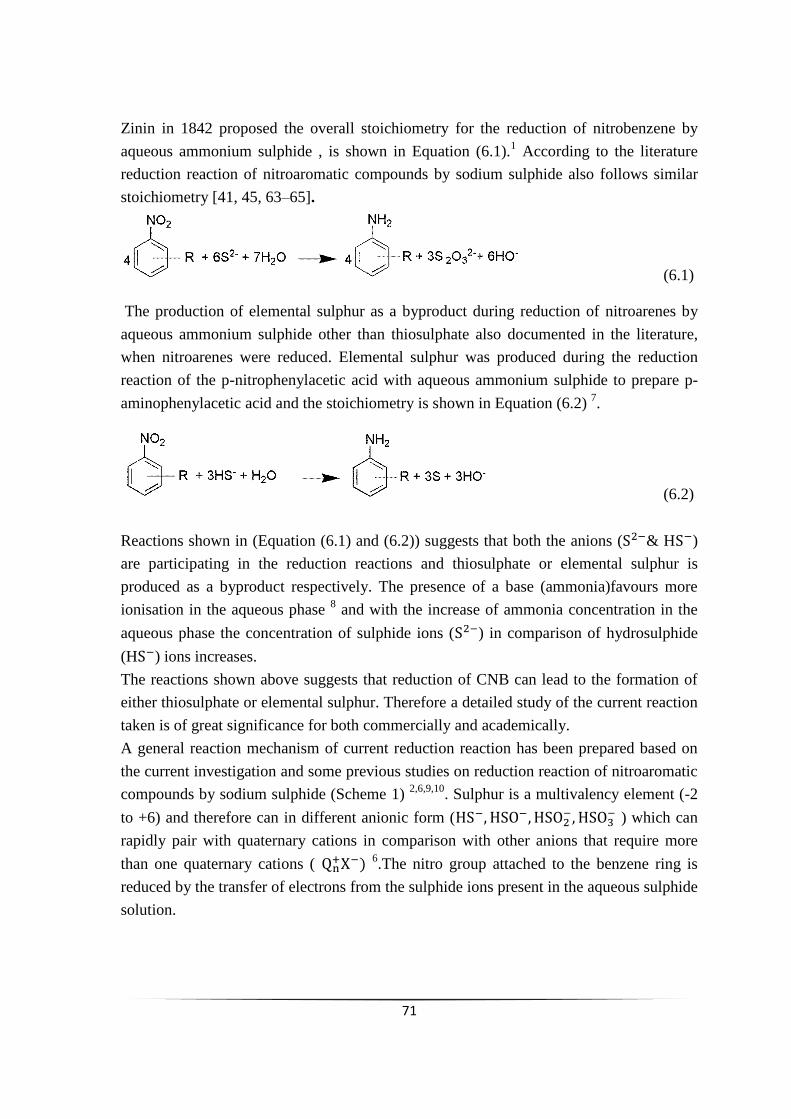
71
Zinin in 1842 proposed the overall stoichiometry for the reduction of nitrobenzene by
aqueous ammonium sulphide , is shown in Equation (6.1).1 According to the literature
reduction reaction of nitroaromatic compounds by sodium sulphide also follows similar
stoichiometry [41, 45, 63–65].
(6.1)
The production of elemental sulphur as a byproduct during reduction of nitroarenes by
aqueous ammonium sulphide other than thiosulphate also documented in the literature,
when nitroarenes were reduced. Elemental sulphur was produced during the reduction
reaction of the p-nitrophenylacetic acid with aqueous ammonium sulphide to prepare p-
aminophenylacetic acid and the stoichiometry is shown in Equation (6.2) 7.
(6.2)
Reactions shown in (Equation (6.1) and (6.2)) suggests that both the anions ( & H )
are participating in the reduction reactions and thiosulphate or elemental sulphur is
produced as a byproduct respectively. The presence of a base (ammonia)favours more
ionisation in the aqueous phase 8 and with the increase of ammonia concentration in the
aqueous phase the concentration of sulphide ions ( ) in comparison of hydrosulphide
(H ) ions increases.
The reactions shown above suggests that reduction of CNB can lead to the formation of
either thiosulphate or elemental sulphur. Therefore a detailed study of the current reaction
taken is of great significance for both commercially and academically.
A general reaction mechanism of current reduction reaction has been prepared based on
the current investigation and some previous studies on reduction reaction of nitroaromatic
compounds by sodium sulphide (Scheme 1) 2,6,9,10
. Sulphur is a multivalency element (-2
to +6) and therefore can in different anionic form (
) which can
rapidly pair with quaternary cations in comparison with other anions that require more
than one quaternary cations (
6.The nitro group attached to the benzene ring is
reduced by the transfer of electrons from the sulphide ions present in the aqueous sulphide
solution.
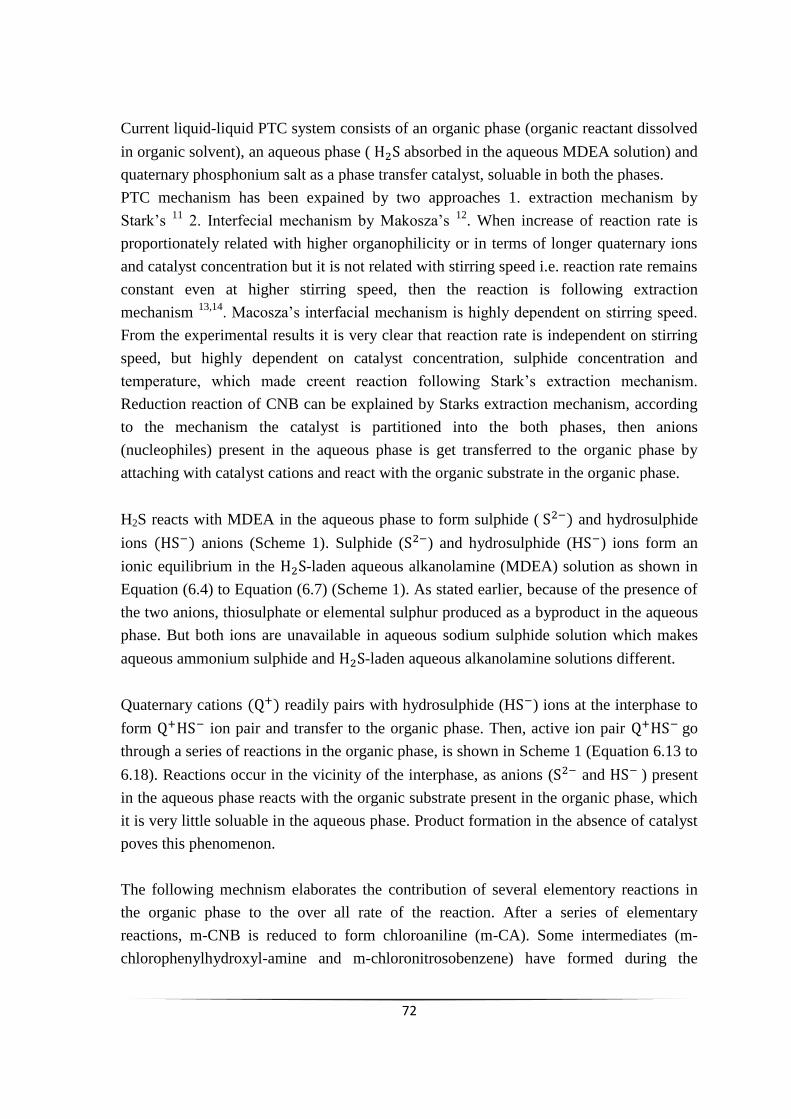
72
Current liquid-liquid PTC system consists of an organic phase (organic reactant dissolved
in organic solvent), an aqueous phase ( absorbed in the aqueous MDEA solution) and
quaternary phosphonium salt as a phase transfer catalyst, soluable in both the phases.
PTC mechanism has been expained by two approaches 1. extraction mechanism by
Stark‟s 11
2. Interfecial mechanism by Makosza‟s 12
. When increase of reaction rate is
proportionately related with higher organophilicity or in terms of longer quaternary ions
and catalyst concentration but it is not related with stirring speed i.e. reaction rate remains
constant even at higher stirring speed, then the reaction is following extraction
mechanism 13,14
. Macosza‟s interfacial mechanism is highly dependent on stirring speed.
From the experimental results it is very clear that reaction rate is independent on stirring
speed, but highly dependent on catalyst concentration, sulphide concentration and
temperature, which made creent reaction following Stark‟s extraction mechanism.
Reduction reaction of CNB can be explained by Starks extraction mechanism, according
to the mechanism the catalyst is partitioned into the both phases, then anions
(nucleophiles) present in the aqueous phase is get transferred to the organic phase by
attaching with catalyst cations and react with the organic substrate in the organic phase.
H2S reacts with MDEA in the aqueous phase to form sulphide ( and hydrosulphide
ions anions (Scheme 1). Sulphide ( ) and hydrosulphide (H ) ions form an
ionic equilibrium in the -laden aqueous alkanolamine (MDEA) solution as shown in
Equation (6.4) to Equation (6.7) (Scheme 1). As stated earlier, because of the presence of
the two anions, thiosulphate or elemental sulphur produced as a byproduct in the aqueous
phase. But both ions are unavailable in aqueous sodium sulphide solution which makes
aqueous ammonium sulphide and -laden aqueous alkanolamine solutions different.
Quaternary cations readily pairs with hydrosulphide (H ) ions at the interphase to
form ion pair and transfer to the organic phase. Then, active ion pair go
through a series of reactions in the organic phase, is shown in Scheme 1 (Equation 6.13 to
6.18). Reactions occur in the vicinity of the interphase, as anions ( and ) present
in the aqueous phase reacts with the organic substrate present in the organic phase, which
it is very little soluable in the aqueous phase. Product formation in the absence of catalyst
poves this phenomenon.
The following mechnism elaborates the contribution of several elementory reactions in
the organic phase to the over all rate of the reaction. After a series of elementary
reactions, m-CNB is reduced to form chloroaniline (m-CA). Some intermediates (m-
chlorophenylhydroxyl-amine and m-chloronitrosobenzene) have formed during the
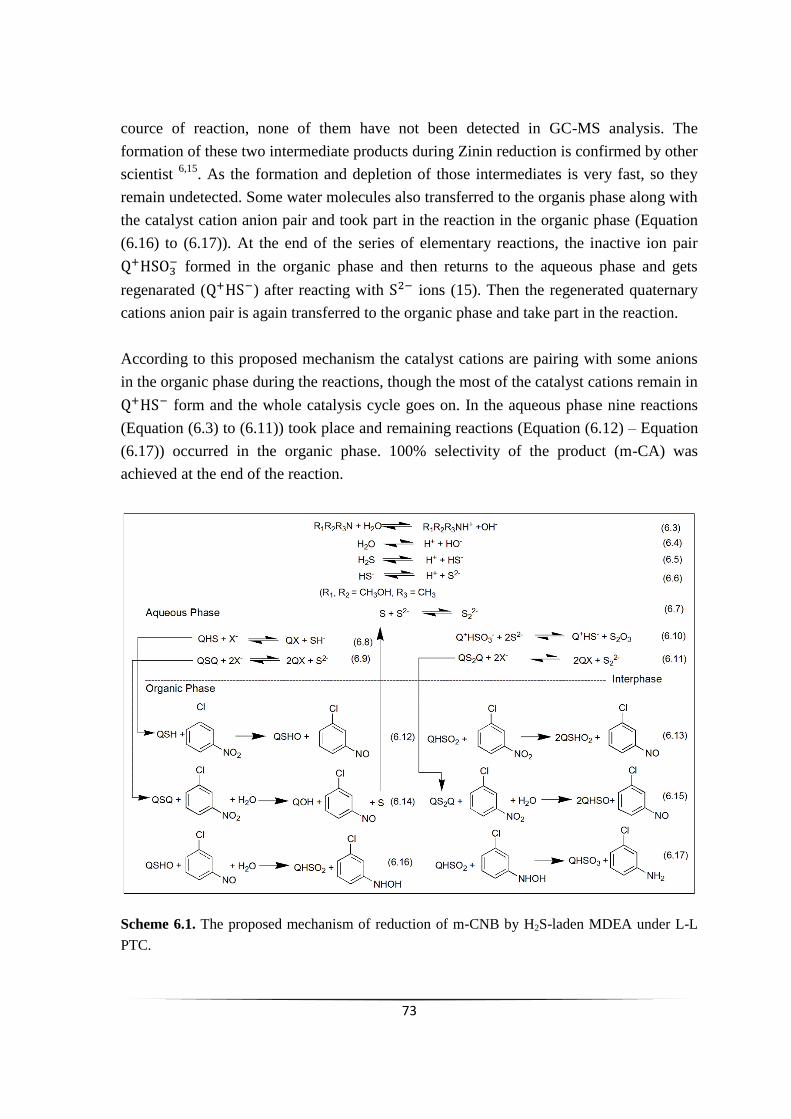
73
cource of reaction, none of them have not been detected in GC-MS analysis. The
formation of these two intermediate products during Zinin reduction is confirmed by other
scientist 6,15
. As the formation and depletion of those intermediates is very fast, so they
remain undetected. Some water molecules also transferred to the organis phase along with
the catalyst cation anion pair and took part in the reaction in the organic phase (Equation
(6.16) to (6.17)). At the end of the series of elementary reactions, the inactive ion pair
formed in the organic phase and then returns to the aqueous phase and gets
regenarated ( ) after reacting with ions (15). Then the regenerated quaternary
cations anion pair is again transferred to the organic phase and take part in the reaction.
According to this proposed mechanism the catalyst cations are pairing with some anions
in the organic phase during the reactions, though the most of the catalyst cations remain in
form and the whole catalysis cycle goes on. In the aqueous phase nine reactions
(Equation (6.3) to (6.11)) took place and remaining reactions (Equation (6.12) – Equation
(6.17)) occurred in the organic phase. 100% selectivity of the product (m-CA) was
achieved at the end of the reaction.
Scheme 6.1. The proposed mechanism of reduction of m-CNB by H2S-laden MDEA under L-L
PTC.
74
6.2.2 Kinetic modelling
According to the proposed mechanism Scheme 1, the population of active ion
pair is higher in comparison with other anions. A kinetic model has been prepared based
on the following assumptions, (1) aqueous phase reactions reach equilibrium almost
instantaneousely, (2) the model of the whole PTC reaction is developed accordingly to the
proposed mechanism and (3) the interphasic reactions are very slow and not included in
modeling as the aqueous phase and organic phase reactions are more significant.
The current study of reduction of m-CNB by H2S-laden MDEA solution is a liquid-liquid
PTC system, where toluene was used as an organic solvent and m-CA was the main
product in the organic phase along with as a by-product in the aqueous phase. The
overall reaction is as shown in the Equation (6.1).
Current L-L PTC system is provided with mechanical stirring at 1500 rpm for
eliminating mass transfer effect. In the aqueous phase, reaction between (
) and was the first ion exchange reaction and forms an active ion pair ( ).
A number of transition anions were produced during the reduction reaction and finally an
inactive ion pair formed in the organic phase. Then the inactive ion pair was
transferred to the aqueous phase and got regenerated ( ) after reacting with
ions via redox reaction.
Reaction steps involved according to Scheme 1 are:
1. In-active ion pair, being lipophobic in nature, got transferred to the aqueous phase from
the organic phase. For the step of reaction equilibrium constant, say , is given by
(6.18)
2. Reaction (11) is the catalyst regeneration step of the reaction mechanism, which can be
written as the following equation (6.20),
(6.19)
3. Initially added catalyst migrated from organic phase to aqueous phase. Other active
catalysts , and , which are formed in the aqueous, diffused to organic
phase and equilibrium constants for each diffusion step are K3, K4, K5, K6,
(6.20)
(6.21)
75
(6.22)
(6.23)
4. The rate of the reaction is determined by the reactions occurred in organic phase.
Among all the organic phase reactions (Equation (6.12) to Equation (6.17)), The slowest
reaction is Equation (6.12) and hence it determines the overall rate, in which ArNO is
formed 6. Elemental sulphur production in the system as a by-product has made the
Equation (6.14) as a contributor to the overall rate of the reduction reaction. Some water
molecules also get transferred to the oragnic phase along with other ion pairs.
is the limiting reactant and thus it is taken as the basis of the reaction. So the rate
of reaction of can be expressed by following Equation (6.24), where k2-k4 are the
reaction rate constants for the reactions of Equation 6.12, 6.14, and 6.15 shown in Scheme 6.1.
(6.24)
The total number of molecules along with other anions transferred to the organic
phase is very little in contrast to that of active ion pairs ), so it can be ignored
from Equation (6.24) and the reaction in Equation (6.12) is assumed to be the main rate
determining step. The reactions shown in Equation (6.14) and Equation (6.15) can be
ignored and the Equation (6.24) can be rewritten as
(6.25)
The mole balance of catalyst cations is given by,
{
}
{
}
(6.26)
The initial concentration of catalyst is denoted by , the volume of aqueous phase
and organic phase is denoted by respectively. Therefore,
{
}
{
}
(6.27)
Substituting Equation (6.18), (6.20), (6.21), (6.22) and (6.23) in the equation (6.27), we
get
76
{
}
{
}
(6.28)
The total concentration of catalyst cations present in the organic phase is given by,
(6.29)
(6.30)
If we consider,
After substituting in the Equation (6.31) we get,
(6.31)
The following expressionof total added catalyst concentration can be obtained from
Equation (6.28) and Equation (6.29) as
{
}
(6.32)
Combining Equation (6.31) and Equation (6.32) yields,
{
}
(6.33)
Simplifying we get,
{
}
(6.34)
According to the Equation (6.1) which represents the conversion can be written as,
Conversion(X)
(6.35)
[Where is the total amount of added reagent in organic phase]
So,
(6.36)
As it is mentioned previously that the elementary reaction (Equation (6.12)) shown in
Scheme 1 is the rate-limiting step and if we combine Equation 6.25 and 6.36 together, we
get,
(6.37)
77
Now putting in the place of
in the Equation (6.37), we get
(6.38)
(6.39)
Substituting Equation (6.34) in the Equation (6.39), the following equation is obtained.
{
}
(6.40)
(6.41)
Where
{
}
, since all the terms of
are constants and their values can be calculated obtained experimentally.
(6.42)
So, it can be concluded from the final expression (Equation (6.42)) that the order of the
current reaction is pseudo first order.
6.2.3 Sensitivity analysis
6.2.3.1. Effect of agitation intensity
The stirring speed was varied in the range of 500-2500 rev/min to study the influence of
mass transfer resistance on the reaction kinetics and TBPB was used as phase transfer
catalyst is shown in Figure 6.1. It is very clear from the figure that, there is no
considerable increase in the reaction rate and conversion while the stirring speed
increased more than of 500 rev/min. So the stirring speed was maintained at 1500 rev/min
during further studies to eliminate mass transfer resistance.
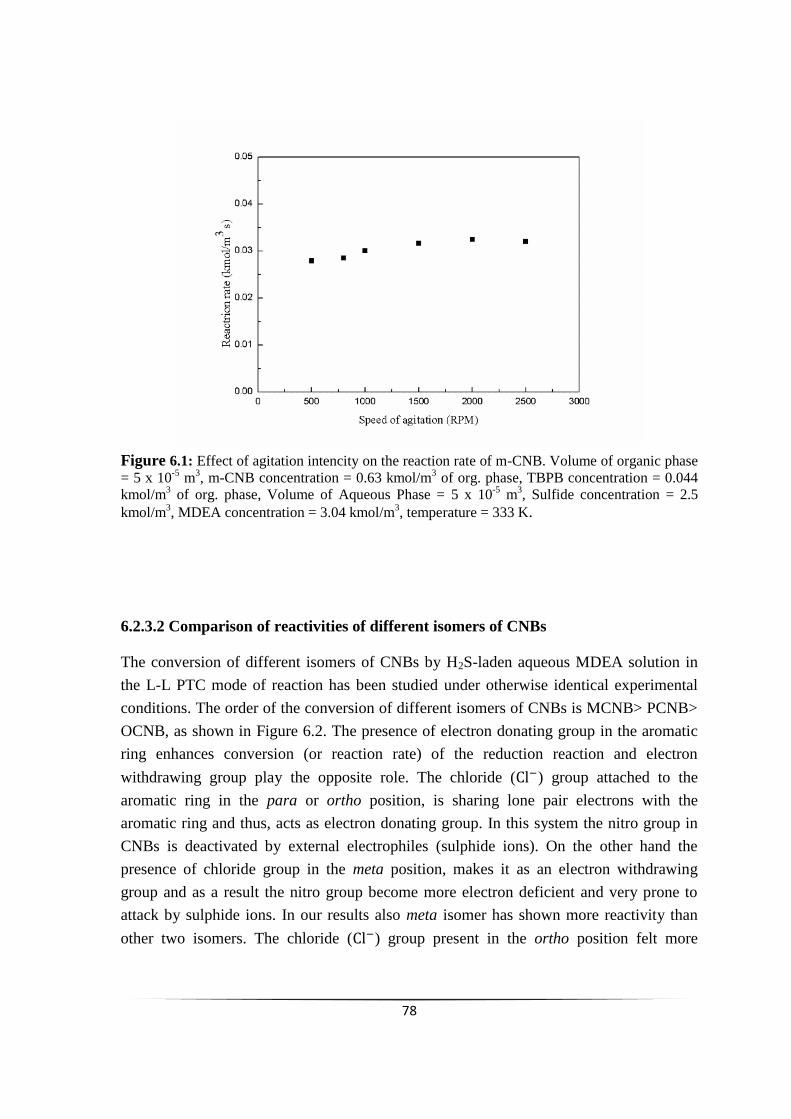
78
Figure 6.1: Effect of agitation intencity on the reaction rate of m-CNB. Volume of organic phase
= 5 x 10⁻⁵
m3, m-CNB concentration = 0.63 kmol/m
3 of org. phase, TBPB concentration = 0.044
kmol/m3 of org. phase, Volume of Aqueous Phase = 5 x 10
-5 m
3, Sulfide concentration = 2.5
kmol/m3, MDEA concentration = 3.04 kmol/m
3, temperature = 333 K.
6.2.3.2 Comparison of reactivities of different isomers of CNBs
The conversion of different isomers of CNBs by H2S-laden aqueous MDEA solution in
the L-L PTC mode of reaction has been studied under otherwise identical experimental
conditions. The order of the conversion of different isomers of CNBs is MCNB> PCNB>
OCNB, as shown in Figure 6.2. The presence of electron donating group in the aromatic
ring enhances conversion (or reaction rate) of the reduction reaction and electron
withdrawing group play the opposite role. The chloride ( ) group attached to the
aromatic ring in the para or ortho position, is sharing lone pair electrons with the
aromatic ring and thus, acts as electron donating group. In this system the nitro group in
CNBs is deactivated by external electrophiles (sulphide ions). On the other hand the
presence of chloride group in the meta position, makes it as an electron withdrawing
group and as a result the nitro group become more electron deficient and very prone to
attack by sulphide ions. In our results also meta isomer has shown more reactivity than
other two isomers. The chloride ( ) group present in the ortho position felt more
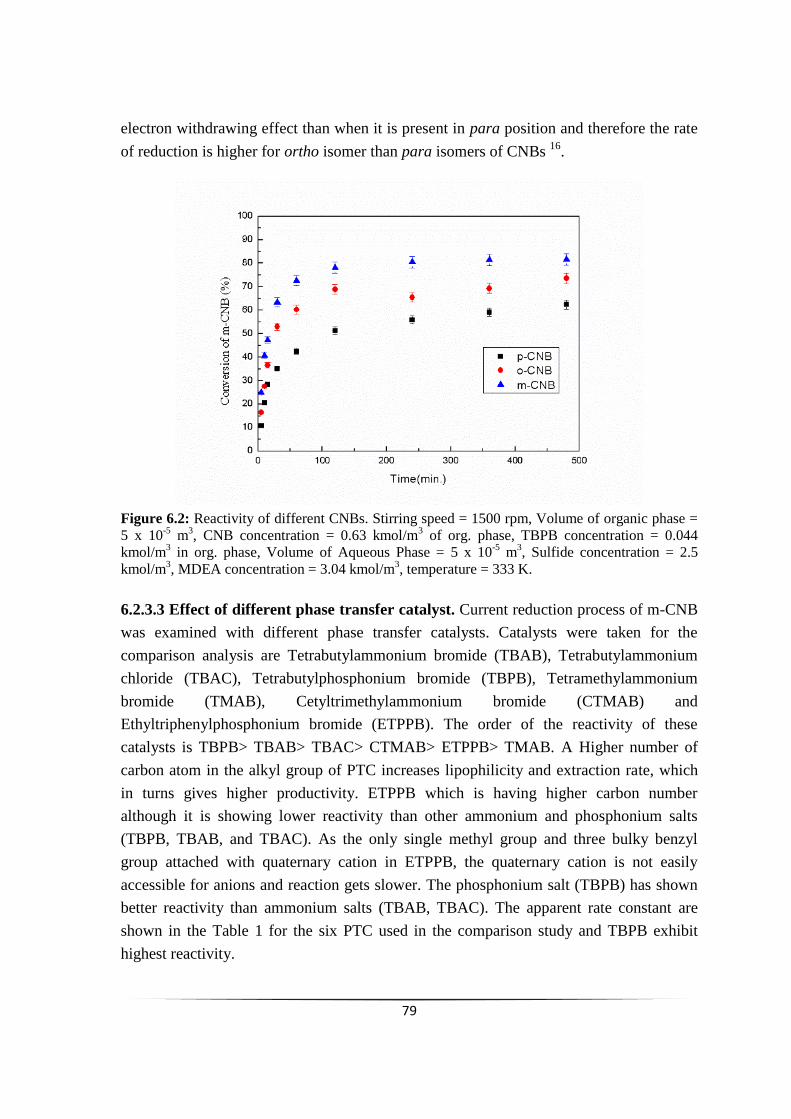
79
electron withdrawing effect than when it is present in para position and therefore the rate
of reduction is higher for ortho isomer than para isomers of CNBs 16
.
Figure 6.2: Reactivity of different CNBs. Stirring speed = 1500 rpm, Volume of organic phase =
5 x 10⁻⁵
m3, CNB concentration = 0.63 kmol/m
3 of org. phase, TBPB concentration = 0.044
kmol/m3 in org. phase, Volume of Aqueous Phase = 5 x 10
-5 m
3, Sulfide concentration = 2.5
kmol/m3, MDEA concentration = 3.04 kmol/m
3, temperature = 333 K.
6.2.3.3 Effect of different phase transfer catalyst. Current reduction process of m-CNB
was examined with different phase transfer catalysts. Catalysts were taken for the
comparison analysis are Tetrabutylammonium bromide (TBAB), Tetrabutylammonium
chloride (TBAC), Tetrabutylphosphonium bromide (TBPB), Tetramethylammonium
bromide (TMAB), Cetyltrimethylammonium bromide (CTMAB) and
Ethyltriphenylphosphonium bromide (ETPPB). The order of the reactivity of these
catalysts is TBPB> TBAB> TBAC> CTMAB> ETPPB> TMAB. A Higher number of
carbon atom in the alkyl group of PTC increases lipophilicity and extraction rate, which
in turns gives higher productivity. ETPPB which is having higher carbon number
although it is showing lower reactivity than other ammonium and phosphonium salts
(TBPB, TBAB, and TBAC). As the only single methyl group and three bulky benzyl
group attached with quaternary cation in ETPPB, the quaternary cation is not easily
accessible for anions and reaction gets slower. The phosphonium salt (TBPB) has shown
better reactivity than ammonium salts (TBAB, TBAC). The apparent rate constant are
shown in the Table 1 for the six PTC used in the comparison study and TBPB exhibit
highest reactivity.
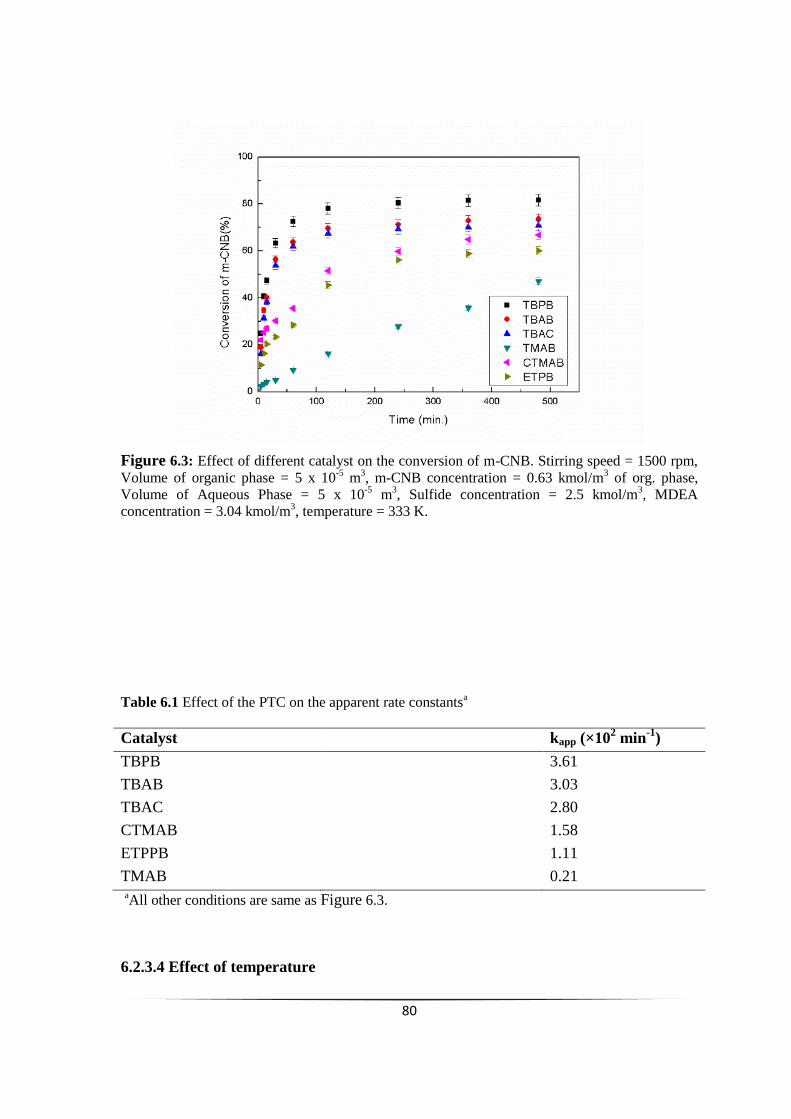
80
Figure 6.3: Effect of different catalyst on the conversion of m-CNB. Stirring speed = 1500 rpm,
Volume of organic phase = 5 x 10⁻⁵
m3, m-CNB concentration = 0.63 kmol/m
3 of org. phase,
Volume of Aqueous Phase = 5 x 10⁻⁵
m3, Sulfide concentration = 2.5 kmol/m
3, MDEA
concentration = 3.04 kmol/m3, temperature = 333 K.
Table 6.1 Effect of the PTC on the apparent rate constantsa
Catalyst kapp (×102 min
-1)
TBPB 3.61
TBAB 3.03
TBAC 2.80
CTMAB 1.58
ETPPB 1.11
TMAB 0.21
aAll other conditions are same as Figure 6.3.
6.2.3.4 Effect of temperature
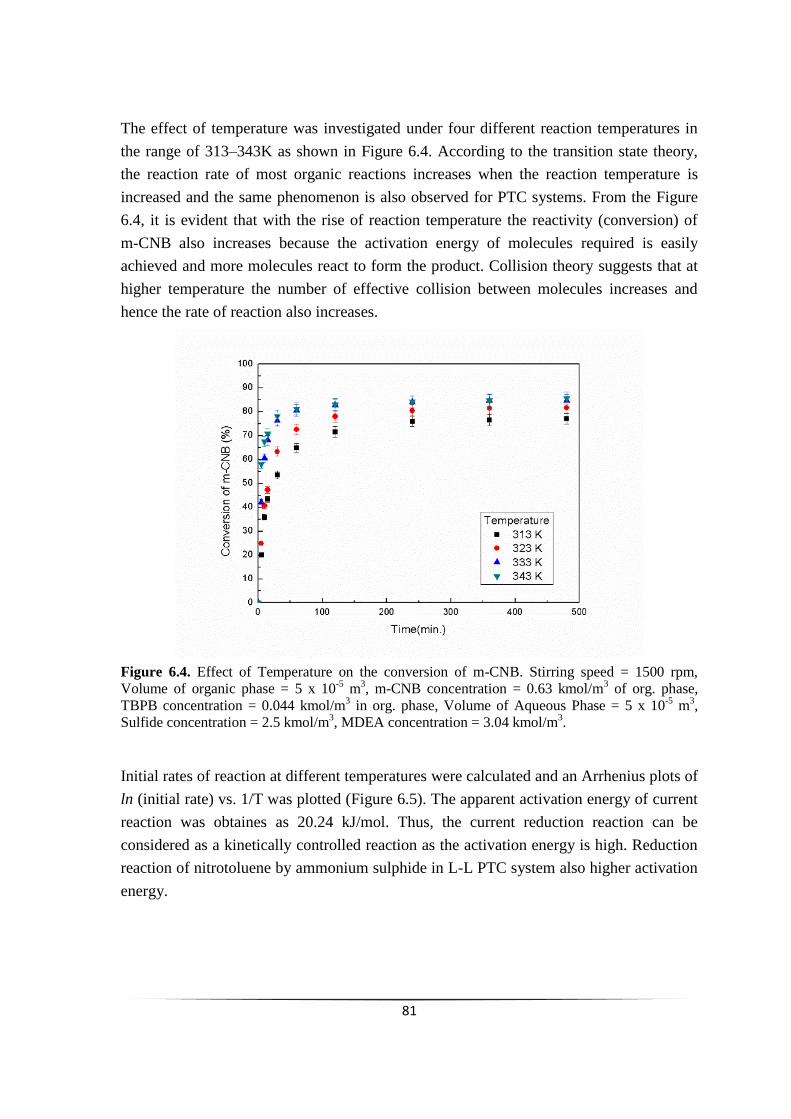
81
The effect of temperature was investigated under four different reaction temperatures in
the range of 313–343K as shown in Figure 6.4. According to the transition state theory,
the reaction rate of most organic reactions increases when the reaction temperature is
increased and the same phenomenon is also observed for PTC systems. From the Figure
6.4, it is evident that with the rise of reaction temperature the reactivity (conversion) of
m-CNB also increases because the activation energy of molecules required is easily
achieved and more molecules react to form the product. Collision theory suggests that at
higher temperature the number of effective collision between molecules increases and
hence the rate of reaction also increases.
Figure 6.4. Effect of Temperature on the conversion of m-CNB. Stirring speed = 1500 rpm,
Volume of organic phase = 5 x 10⁻⁵
m3, m-CNB concentration = 0.63 kmol/m
3 of org. phase,
TBPB concentration = 0.044 kmol/m3 in org. phase, Volume of Aqueous Phase = 5 x 10
-5 m
3,
Sulfide concentration = 2.5 kmol/m3, MDEA concentration = 3.04 kmol/m
3.
Initial rates of reaction at different temperatures were calculated and an Arrhenius plots of
ln (initial rate) vs. 1/T was plotted (Figure 6.5). The apparent activation energy of current
reaction was obtaines as 20.24 kJ/mol. Thus, the current reduction reaction can be
considered as a kinetically controlled reaction as the activation energy is high. Reduction
reaction of nitrotoluene by ammonium sulphide in L-L PTC system also higher activation
energy.
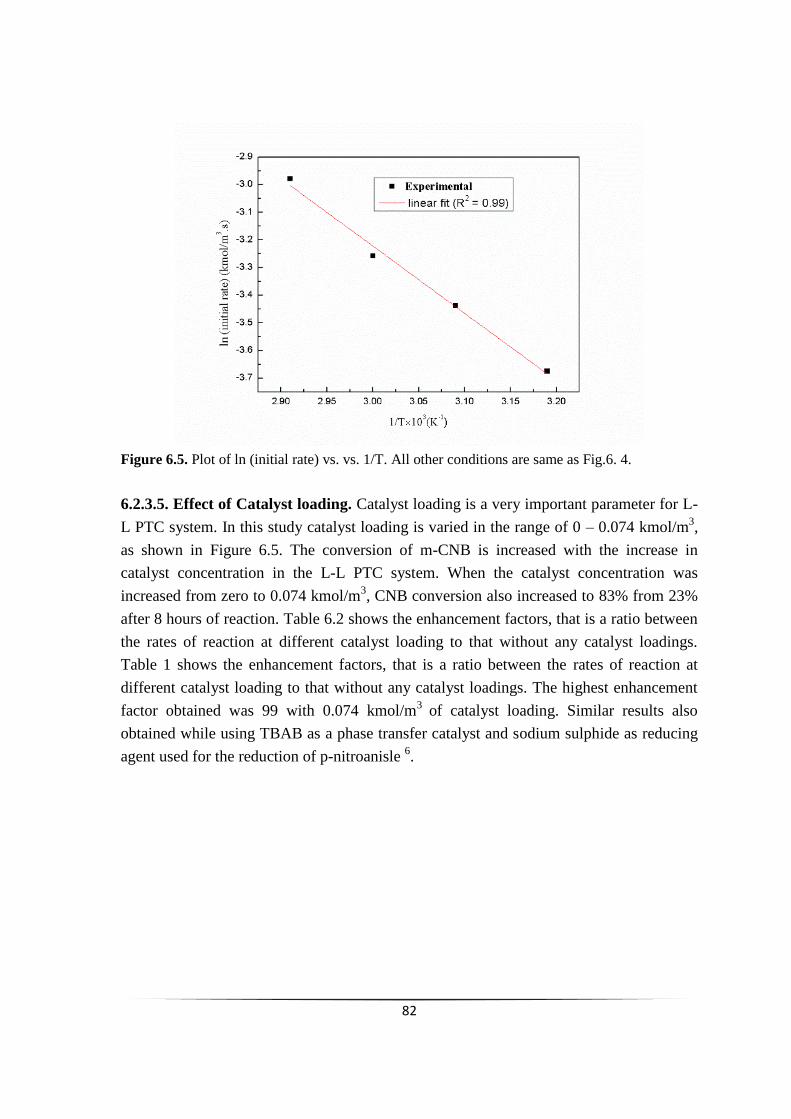
82
Figure 6.5. Plot of ln (initial rate) vs. vs. 1/T. All other conditions are same as Fig.6. 4.
6.2.3.5. Effect of Catalyst loading. Catalyst loading is a very important parameter for L-
L PTC system. In this study catalyst loading is varied in the range of 0 – 0.074 kmol/m3,
as shown in Figure 6.5. The conversion of m-CNB is increased with the increase in
catalyst concentration in the L-L PTC system. When the catalyst concentration was
increased from zero to 0.074 kmol/m3, CNB conversion also increased to 83% from 23%
after 8 hours of reaction. Table 6.2 shows the enhancement factors, that is a ratio between
the rates of reaction at different catalyst loading to that without any catalyst loadings.
Table 1 shows the enhancement factors, that is a ratio between the rates of reaction at
different catalyst loading to that without any catalyst loadings. The highest enhancement
factor obtained was 99 with 0.074 kmol/m3
of catalyst loading. Similar results also
obtained while using TBAB as a phase transfer catalyst and sodium sulphide as reducing
agent used for the reduction of p-nitroanisle 6.
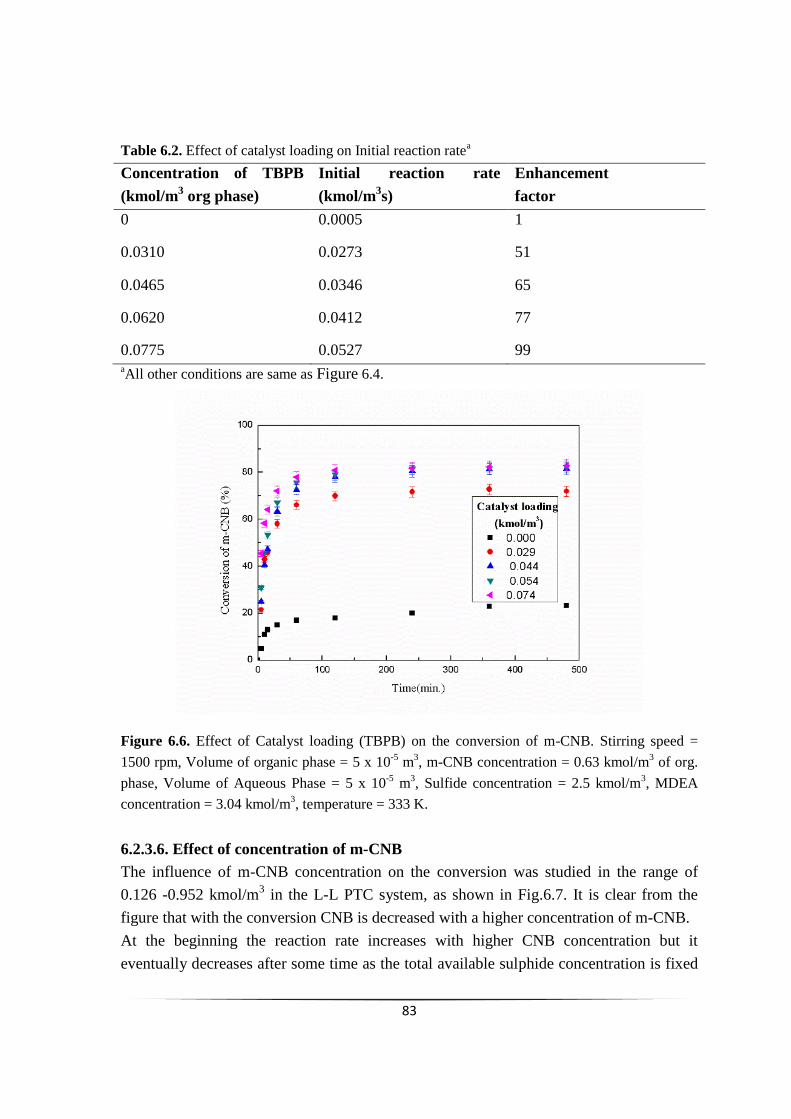
83
Table 6.2. Effect of catalyst loading on Initial reaction ratea
Concentration of TBPB
(kmol/m3 org phase)
Initial reaction rate
(kmol/m3s)
Enhancement
factor
0 0.0005 1
0.0310 0.0273 51
0.0465 0.0346 65
0.0620 0.0412 77
0.0775 0.0527 99 aAll other conditions are same as Figure 6.4.
Figure 6.6. Effect of Catalyst loading (TBPB) on the conversion of m-CNB. Stirring speed =
1500 rpm, Volume of organic phase = 5 x 10⁻⁵
m3, m-CNB concentration = 0.63 kmol/m
3 of org.
phase, Volume of Aqueous Phase = 5 x 10⁻⁵
m3, Sulfide concentration = 2.5 kmol/m
3, MDEA
concentration = 3.04 kmol/m3, temperature = 333 K.
6.2.3.6. Effect of concentration of m-CNB
The influence of m-CNB concentration on the conversion was studied in the range of
0.126 -0.952 kmol/m3 in the L-L PTC system, as shown in Fig.6.7. It is clear from the
figure that with the conversion CNB is decreased with a higher concentration of m-CNB.
At the beginning the reaction rate increases with higher CNB concentration but it
eventually decreases after some time as the total available sulphide concentration is fixed

84
in the system. A similar phenomenon was observed in the reduction reaction of
nitroarenes by aqueous sodium sulphide 6.
Figure 6.7. Effect of Reactant concentration on the conversion of m-CNB. Stirring speed = 1500
rpm, Volume of organic phase = 5 x 10⁻⁵
m3, TBPB concentration = 0.044 kmol/m
3 in org. phase,
Volume of Aqueous Phase = 5 x 10⁻⁵
m3, Sulfide concentration = 2.5 kmol/m
3, MDEA
concentration = 3.04 kmol/m3, temperature = 333 K.
6.2.3.7. Effect of sulphide concentration
Figure 6.8 shows the effect of aqueous phase sulphide concentration on the conversion of
m-CNB at four sulphide concentration in the range of 1 to 2.5 kmol/m3, keeping other
parameters values unchanged, as shown in Figure 6.8. The conversion of m-CNB and the
reaction rate enhances with the increase in aqueous phase sulphide concentration.
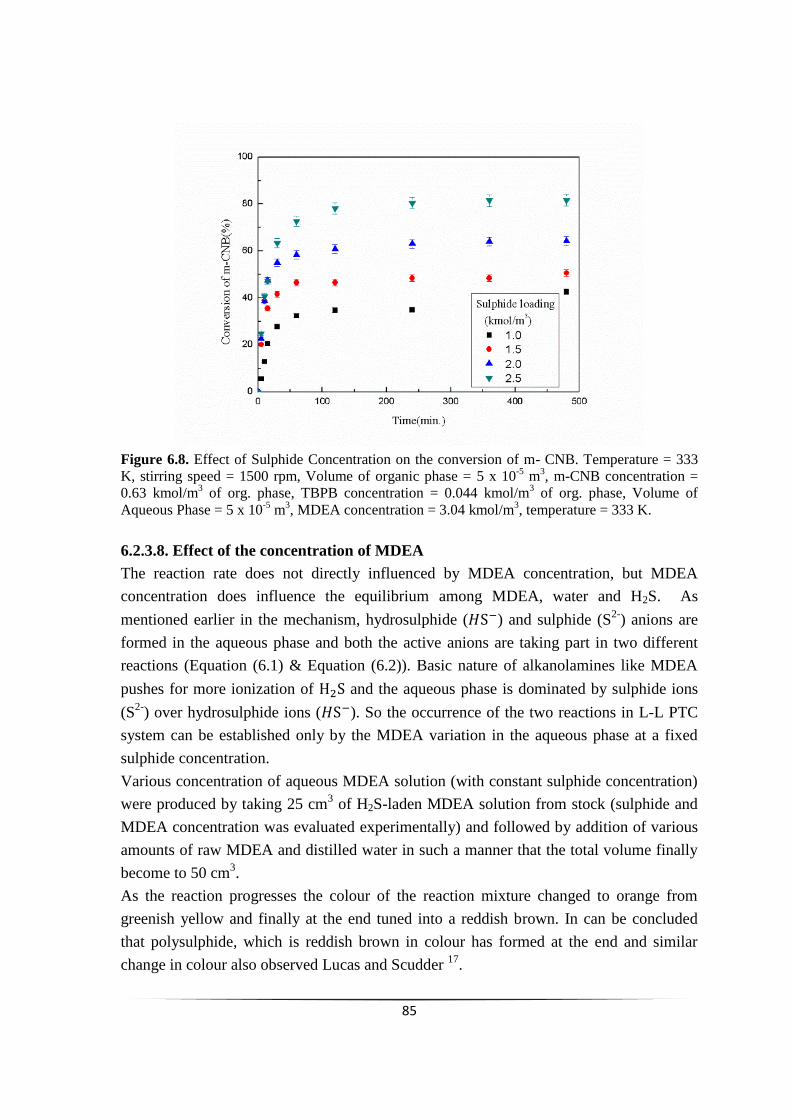
85
Figure 6.8. Effect of Sulphide Concentration on the conversion of m- CNB. Temperature = 333
K, stirring speed = 1500 rpm, Volume of organic phase = 5 x 10⁻⁵
m3, m-CNB concentration =
0.63 kmol/m3 of org. phase, TBPB concentration = 0.044 kmol/m
3 of org. phase, Volume of
Aqueous Phase = 5 x 10⁻⁵
m3, MDEA concentration = 3.04 kmol/m
3, temperature = 333 K.
6.2.3.8. Effect of the concentration of MDEA
The reaction rate does not directly influenced by MDEA concentration, but MDEA
concentration does influence the equilibrium among MDEA, water and H2S. As
mentioned earlier in the mechanism, hydrosulphide ( ) and sulphide (S2-
) anions are
formed in the aqueous phase and both the active anions are taking part in two different
reactions (Equation (6.1) & Equation (6.2)). Basic nature of alkanolamines like MDEA
pushes for more ionization of and the aqueous phase is dominated by sulphide ions
(S2-
) over hydrosulphide ions ( ). So the occurrence of the two reactions in L-L PTC
system can be established only by the MDEA variation in the aqueous phase at a fixed
sulphide concentration.
Various concentration of aqueous MDEA solution (with constant sulphide concentration)
were produced by taking 25 cm3 of H2S-laden MDEA solution from stock (sulphide and
MDEA concentration was evaluated experimentally) and followed by addition of various
amounts of raw MDEA and distilled water in such a manner that the total volume finally
become to 50 cm3.
As the reaction progresses the colour of the reaction mixture changed to orange from
greenish yellow and finally at the end tuned into a reddish brown. In can be concluded
that polysulphide, which is reddish brown in colour has formed at the end and similar
change in colour also observed Lucas and Scudder 17
.
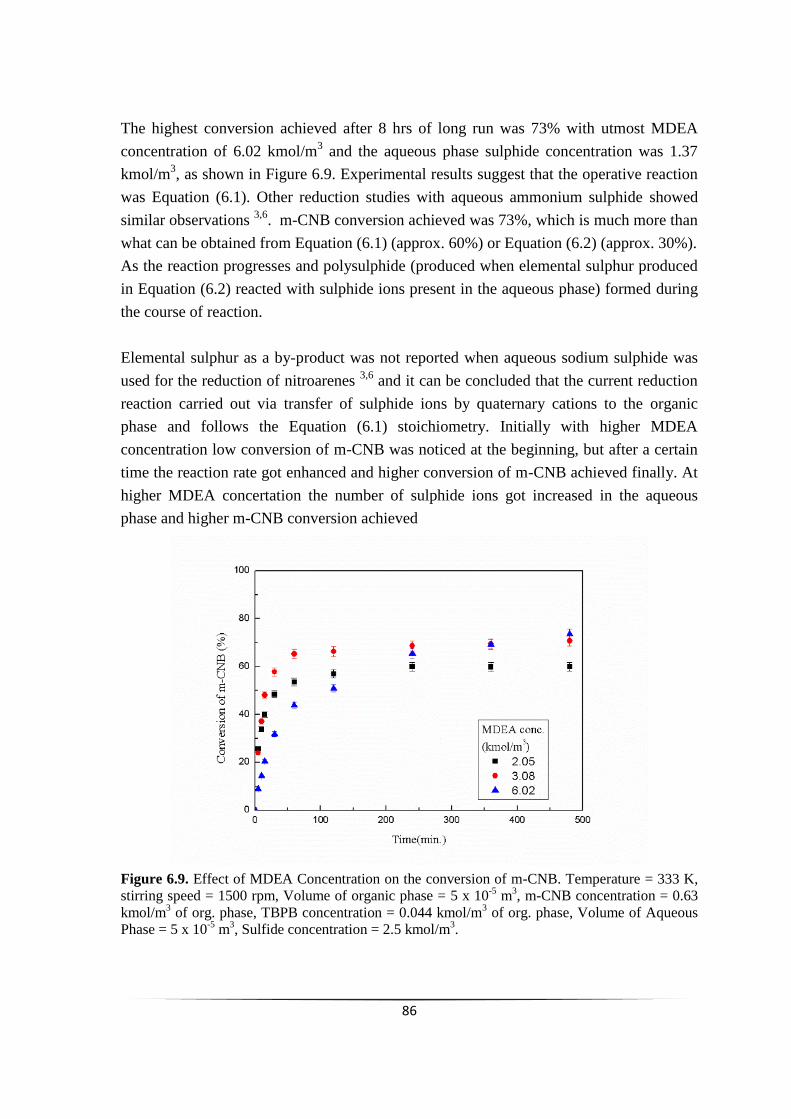
86
The highest conversion achieved after 8 hrs of long run was 73% with utmost MDEA
concentration of 6.02 kmol/m3 and the aqueous phase sulphide concentration was 1.37
kmol/m3, as shown in Figure 6.9. Experimental results suggest that the operative reaction
was Equation (6.1). Other reduction studies with aqueous ammonium sulphide showed
similar observations 3,6
. m-CNB conversion achieved was 73%, which is much more than
what can be obtained from Equation (6.1) (approx. 60%) or Equation (6.2) (approx. 30%).
As the reaction progresses and polysulphide (produced when elemental sulphur produced
in Equation (6.2) reacted with sulphide ions present in the aqueous phase) formed during
the course of reaction.
Elemental sulphur as a by-product was not reported when aqueous sodium sulphide was
used for the reduction of nitroarenes 3,6
and it can be concluded that the current reduction
reaction carried out via transfer of sulphide ions by quaternary cations to the organic
phase and follows the Equation (6.1) stoichiometry. Initially with higher MDEA
concentration low conversion of m-CNB was noticed at the beginning, but after a certain
time the reaction rate got enhanced and higher conversion of m-CNB achieved finally. At
higher MDEA concertation the number of sulphide ions got increased in the aqueous
phase and higher m-CNB conversion achieved
Figure 6.9. Effect of MDEA Concentration on the conversion of m-CNB. Temperature = 333 K,
stirring speed = 1500 rpm, Volume of organic phase = 5 x 10⁻⁵
m3, m-CNB concentration = 0.63
kmol/m3 of org. phase, TBPB concentration = 0.044 kmol/m
3 of org. phase, Volume of Aqueous
Phase = 5 x 10⁻⁵
m3, Sulfide concentration = 2.5 kmol/m
3.
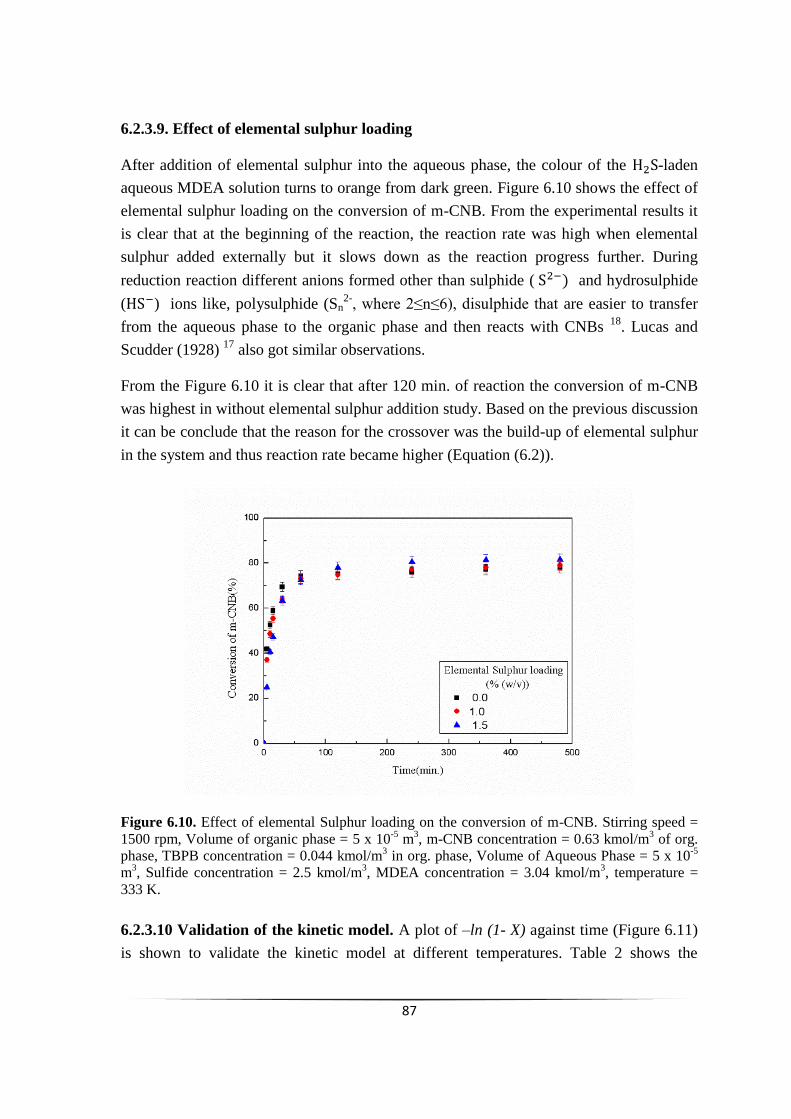
87
6.2.3.9. Effect of elemental sulphur loading
After addition of elemental sulphur into the aqueous phase, the colour of the -laden
aqueous MDEA solution turns to orange from dark green. Figure 6.10 shows the effect of
elemental sulphur loading on the conversion of m-CNB. From the experimental results it
is clear that at the beginning of the reaction, the reaction rate was high when elemental
sulphur added externally but it slows down as the reaction progress further. During
reduction reaction different anions formed other than sulphide ( and hydrosulphide
( ) ions like, polysulphide (Sn2-
, where 2≤n≤6), disulphide that are easier to transfer
from the aqueous phase to the organic phase and then reacts with CNBs 18
. Lucas and
Scudder (1928) 17
also got similar observations.
From the Figure 6.10 it is clear that after 120 min. of reaction the conversion of m-CNB
was highest in without elemental sulphur addition study. Based on the previous discussion
it can be conclude that the reason for the crossover was the build-up of elemental sulphur
in the system and thus reaction rate became higher (Equation (6.2)).
Figure 6.10. Effect of elemental Sulphur loading on the conversion of m-CNB. Stirring speed =
1500 rpm, Volume of organic phase = 5 x 10⁻⁵
m3, m-CNB concentration = 0.63 kmol/m
3 of org.
phase, TBPB concentration = 0.044 kmol/m3 in org. phase, Volume of Aqueous Phase = 5 x 10
-5
m3, Sulfide concentration = 2.5 kmol/m
3, MDEA concentration = 3.04 kmol/m
3, temperature =
333 K.
6.2.3.10 Validation of the kinetic model. A plot of –ln (1- X) against time (Figure 6.11)
is shown to validate the kinetic model at different temperatures. Table 2 shows the
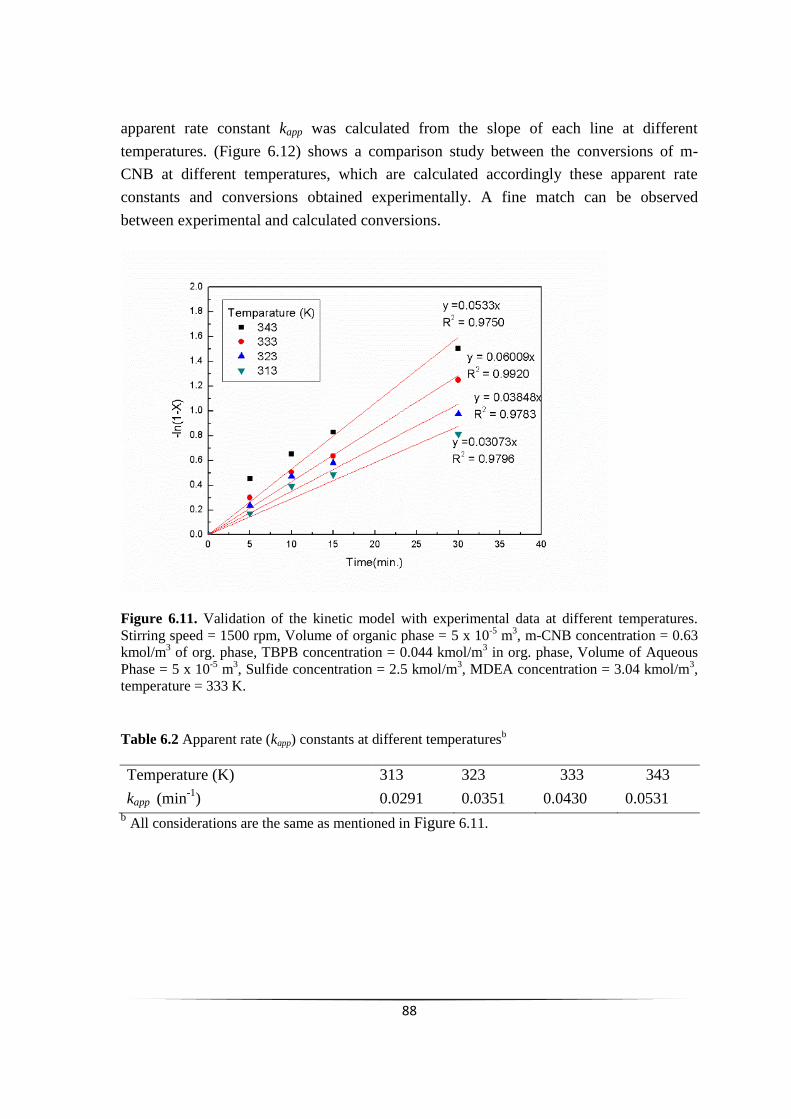
88
apparent rate constant kapp was calculated from the slope of each line at different
temperatures. (Figure 6.12) shows a comparison study between the conversions of m-
CNB at different temperatures, which are calculated accordingly these apparent rate
constants and conversions obtained experimentally. A fine match can be observed
between experimental and calculated conversions.
Figure 6.11. Validation of the kinetic model with experimental data at different temperatures.
Stirring speed = 1500 rpm, Volume of organic phase = 5 x 10⁻⁵
m3, m-CNB concentration = 0.63
kmol/m3 of org. phase, TBPB concentration = 0.044 kmol/m
3 in org. phase, Volume of Aqueous
Phase = 5 x 10⁻⁵
m3, Sulfide concentration = 2.5 kmol/m
3, MDEA concentration = 3.04 kmol/m
3,
temperature = 333 K.
Table 6.2 Apparent rate (kapp) constants at different temperaturesb
Temperature (K) 313 323 333 343
kapp (min-1
) 0.0291 0.0351 0.0430 0.0531 b All considerations are the same as mentioned in Figure 6.11.
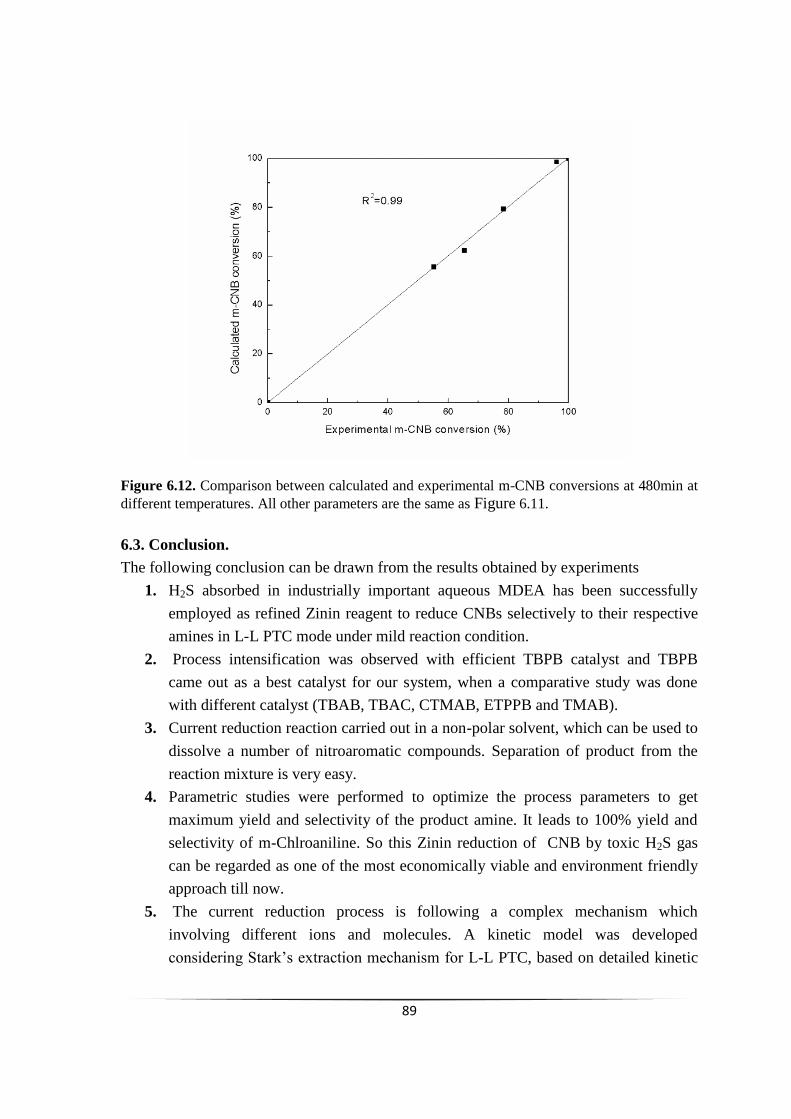
89
Figure 6.12. Comparison between calculated and experimental m-CNB conversions at 480min at
different temperatures. All other parameters are the same as Figure 6.11.
6.3. Conclusion.
The following conclusion can be drawn from the results obtained by experiments
1. H2S absorbed in industrially important aqueous MDEA has been successfully
employed as refined Zinin reagent to reduce CNBs selectively to their respective
amines in L-L PTC mode under mild reaction condition.
2. Process intensification was observed with efficient TBPB catalyst and TBPB
came out as a best catalyst for our system, when a comparative study was done
with different catalyst (TBAB, TBAC, CTMAB, ETPPB and TMAB).
3. Current reduction reaction carried out in a non-polar solvent, which can be used to
dissolve a number of nitroaromatic compounds. Separation of product from the
reaction mixture is very easy.
4. Parametric studies were performed to optimize the process parameters to get
maximum yield and selectivity of the product amine. It leads to 100% yield and
selectivity of m-Chlroaniline. So this Zinin reduction of CNB by toxic H2S gas
can be regarded as one of the most economically viable and environment friendly
approach till now.
5. The current reduction process is following a complex mechanism which
involving different ions and molecules. A kinetic model was developed
considering Stark‟s extraction mechanism for L-L PTC, based on detailed kinetic
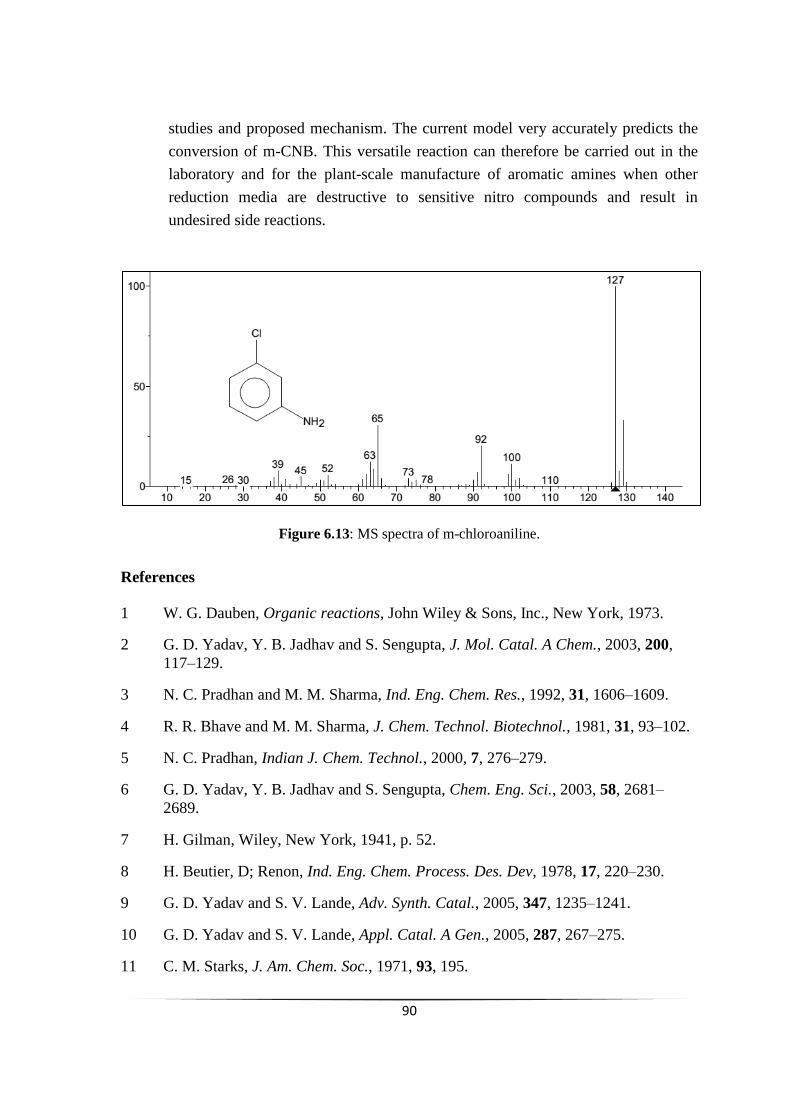
90
studies and proposed mechanism. The current model very accurately predicts the
conversion of m-CNB. This versatile reaction can therefore be carried out in the
laboratory and for the plant-scale manufacture of aromatic amines when other
reduction media are destructive to sensitive nitro compounds and result in
undesired side reactions.
Figure 6.13: MS spectra of m-chloroaniline.
References
1 W. G. Dauben, Organic reactions, John Wiley & Sons, Inc., New York, 1973.
2 G. D. Yadav, Y. B. Jadhav and S. Sengupta, J. Mol. Catal. A Chem., 2003, 200,
117–129.
3 N. C. Pradhan and M. M. Sharma, Ind. Eng. Chem. Res., 1992, 31, 1606–1609.
4 R. R. Bhave and M. M. Sharma, J. Chem. Technol. Biotechnol., 1981, 31, 93–102.
5 N. C. Pradhan, Indian J. Chem. Technol., 2000, 7, 276–279.
6 G. D. Yadav, Y. B. Jadhav and S. Sengupta, Chem. Eng. Sci., 2003, 58, 2681–
2689.
7 H. Gilman, Wiley, New York, 1941, p. 52.
8 H. Beutier, D; Renon, Ind. Eng. Chem. Process. Des. Dev, 1978, 17, 220–230.
9 G. D. Yadav and S. V. Lande, Adv. Synth. Catal., 2005, 347, 1235–1241.
10 G. D. Yadav and S. V. Lande, Appl. Catal. A Gen., 2005, 287, 267–275.
11 C. M. Starks, J. Am. Chem. Soc., 1971, 93, 195.
91
12 A. Makosza, M ; Jonczyk, Org. Synth., 1976, 55, 91.
13 P. A. Vivekanand and T. Balakrishnan, Catal. Commun., 2009, 10, 1962–1966.
14 E. Murugan and A. Siva, J. Mol. Catal. A Chem., 2005, 235, 220–229.
15 G. D. Yadav and S. V. Lande, Ind. Eng. Chem. Res., 2007, 46, 2951–2961.
16 J. P. Ldoux and Wendell Plain, J. Chem. Educ., 1972, 49, 133.
17 N. F. Lucas, H J, Scudder, J. Am. Chem. Soc., 1928, 50, 244–249.
18 Y. O. M. Hojo, Y. Takagi, J. Am. Chem. Soc., 1960, 82, 2459–2462.
Abstract
The current study demonstrated the selective reduction of 1-Nitronapthalene (1-NN) by
Hydrogen Sulphide (H2S) absorbed in aqueous N-Methyldiethanolamine (MDEA), which
is a commonly encountered process in Amine treating unit (ATU) of petroleum refinery.
The modified Zinin reduction has been carried out using Tetra-n-butylphosphonium
Bromide (TBPB) as Phase Transfer Catalyst under Liquid-Liquid (L-L) biphasic mode.
The kinetic model and mechanism of complex L-L phase transfer catalytic process have
been developed and then the same has been validated against the experimental data.
7.1 INTRODUCTION
The current study demonstrated the selective reduction of 1-Nitronapthalene (1-NN) by
Hydrogen Sulphide (H2S) absorbed in aqueous N-Methyldiethanolamine (MDEA), which
is a commonly encountered process in Amine treating unit (ATU) of petroleum refinery.
The modified Zinin reduction has been carried out using Tetra-n-butylphosphonium
Bromide (TBPB) as Phase Transfer Catalyst under Liquid-Liquid (L-L) biphasic mode.
The selectivity of product 1-aminonapthalene was found to be 100% and the reaction was
kinetically controlled with the activation energy of 20.77 kJ/mol. The influence of the
process parameters like stirring speed, concentration of 1-NN, concentration of aqueous
sulphide, concentration of catalyst, MDEA concentration, elemental sulphur loading at
different reaction time on the reactant conversion and the reaction rate of 1-NN were
studied for establishment of the reaction mechanism. The kinetic model and mechanism
of complex L-L phase transfer catalytic process has been developed and then the same has
been validated against the experimental data. This approach of reducing 1-NN by H2S –
rich MDEA can substitute the energy-expensive Claus process, which gives no other
product than sulphur.
7.2 RESULTS AND DISCUSSION
7.2.1 Proposed mechanism of reduction of aromatic nitro compounds under L-
L PTC.
The overall stoichiometry of the Zinin‟s original reduction of nitrobenzene by
aqueous ammonium sulphide, as proposed by Zinin in 1842, is given by Equation
(7.1).1 Reduction of nitroarenes by sodium sulphide follows same
stoichiometry.22,23,34,39–8
(7.1)
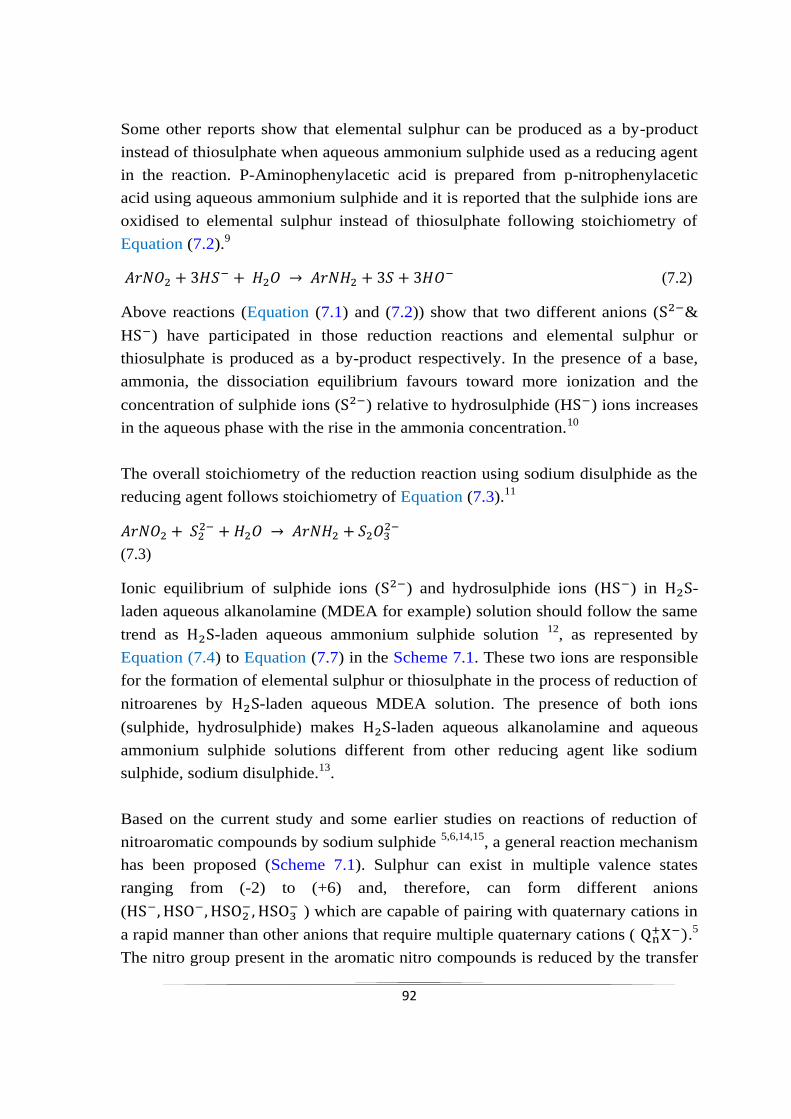
92
Some other reports show that elemental sulphur can be produced as a by-product
instead of thiosulphate when aqueous ammonium sulphide used as a reducing agent
in the reaction. P-Aminophenylacetic acid is prepared from p-nitrophenylacetic
acid using aqueous ammonium sulphide and it is reported that the sulphide ions are
oxidised to elemental sulphur instead of thiosulphate following stoichiometry of
Equation (7.2).9
(7.2)
Above reactions (Equation (7.1) and (7.2)) show that two different anions ( &
H ) have participated in those reduction reactions and elemental sulphur or
thiosulphate is produced as a by-product respectively. In the presence of a base,
ammonia, the dissociation equilibrium favours toward more ionization and the
concentration of sulphide ions ( ) relative to hydrosulphide (H ) ions increases
in the aqueous phase with the rise in the ammonia concentration.10
The overall stoichiometry of the reduction reaction using sodium disulphide as the
reducing agent follows stoichiometry of Equation (7.3).11
(7.3)
Ionic equilibrium of sulphide ions ( ) and hydrosulphide ions ( ) in -
laden aqueous alkanolamine (MDEA for example) solution should follow the same
trend as -laden aqueous ammonium sulphide solution 12
, as represented by
Equation (7.4) to Equation (7.7) in the Scheme 7.1. These two ions are responsible
for the formation of elemental sulphur or thiosulphate in the process of reduction of
nitroarenes by -laden aqueous MDEA solution. The presence of both ions
(sulphide, hydrosulphide) makes -laden aqueous alkanolamine and aqueous
ammonium sulphide solutions different from other reducing agent like sodium
sulphide, sodium disulphide.13
.
Based on the current study and some earlier studies on reactions of reduction of
nitroaromatic compounds by sodium sulphide 5,6,14,15
, a general reaction mechanism
has been proposed (Scheme 7.1). Sulphur can exist in multiple valence states
ranging from (-2) to (+6) and, therefore, can form different anions
(
) which are capable of pairing with quaternary cations in
a rapid manner than other anions that require multiple quaternary cations ( .
5
The nitro group present in the aromatic nitro compounds is reduced by the transfer
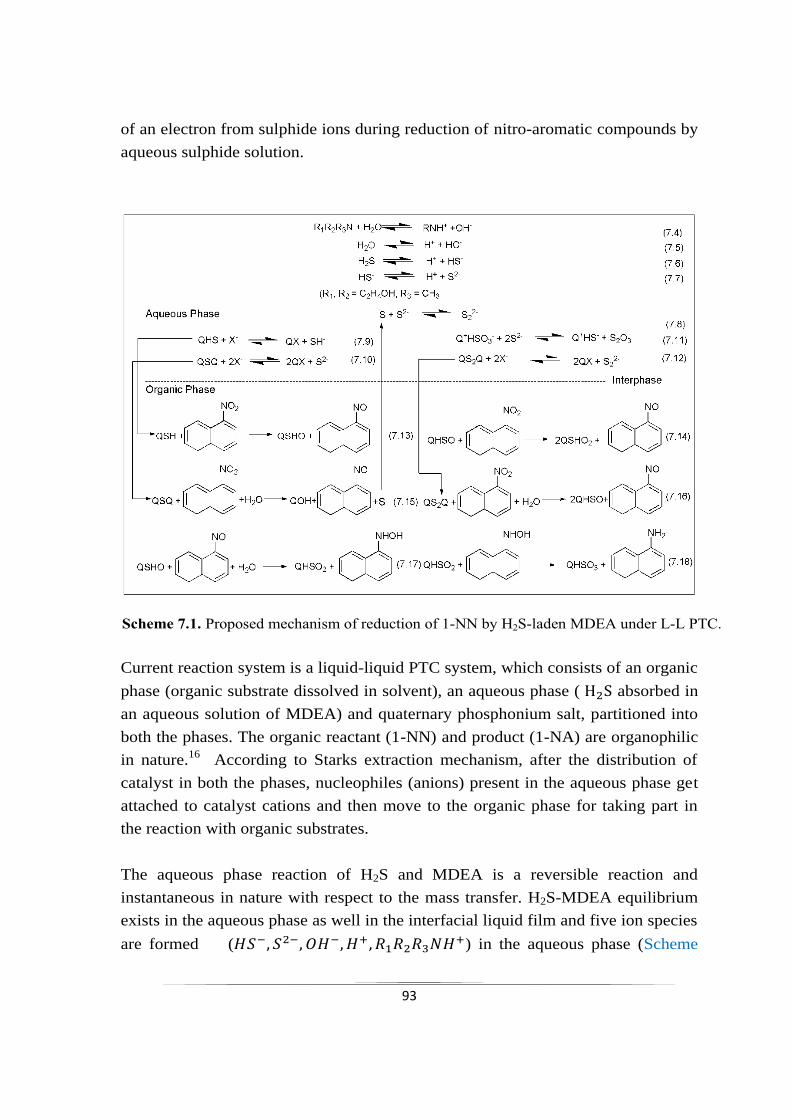
93
of an electron from sulphide ions during reduction of nitro-aromatic compounds by
aqueous sulphide solution.
Current reaction system is a liquid-liquid PTC system, which consists of an organic
phase (organic substrate dissolved in solvent), an aqueous phase ( absorbed in
an aqueous solution of MDEA) and quaternary phosphonium salt, partitioned into
both the phases. The organic reactant (1-NN) and product (1-NA) are organophilic
in nature.16
According to Starks extraction mechanism, after the distribution of
catalyst in both the phases, nucleophiles (anions) present in the aqueous phase get
attached to catalyst cations and then move to the organic phase for taking part in
the reaction with organic substrates.
The aqueous phase reaction of H2S and MDEA is a reversible reaction and
instantaneous in nature with respect to the mass transfer. H2S-MDEA equilibrium
exists in the aqueous phase as well in the interfacial liquid film and five ion species
are formed ( ) in the aqueous phase (Scheme
94
7.1)17–21
. Quaternary cations present at the interphase readily form
ion pair as soon as it comes into contact with the aqueous phase. Then, a series of
reactions take place in the organic phase as shown in Scheme 7.1. Reactions also
occur near the interphase between anions present in the aqueous phase and organic
substrate on the organic phase side as the substrate has limited solubility in the
aqueous phase. It is confirmed by the fact that products form even in the absence of
the catalyst.
The contribution of several elementary reactions in the organic phase to the overall
rate of the reaction is elaborated by the following mechanism. In a series of
complex elementary reactions, 1-NN is converted to 1-napthylamine (1-NA)
through the formation of intermediates (1-nitrosonapthalene and 1-
hydroxyaminonaphthalene), both of which have not been detected by GC-MS
analysis. The existence of these two intermediates during Zinin reduction has long
been established.5,15
Those intermediates remain undetected which may be due to
the faster disappearance of the intermediates in the organic phase. While the
catalyst cations are pairing with the anions, some water molecules transfer to
the interphase and taking part in the reaction (Equation (7.16) to Equation (7.17)).
After a series of elementary reaction the ion pair formed in the organic
phase transfers to the aqueous phase and reacts with to regenerate
Equation (7.8). The regenerated quaternary cations transferred to the organic phase
again for the reduction reaction and that completes a typical catalytic cycle.
According to this mechanism, the quaternary cations are pairing with different
anions during the reactions but the majority of the catalyst cations remains in
form and the catalysis cycle goes on. Nine reactions (Equation (7.4) –
Equation (7.12)) took place in the aqueous phase and rest of the reactions
(Equation (7.13)–Equation (7.18)) occurred consecutively in the organic phase.
During the reaction, 100% selectivity of 1-NA was obtained at the end of the
reaction.
7.2.2 Kinetic modelling
From the mechanism shown in Scheme 7.1, it can be said that active ion
pair forms in large excess although other anions are also present. A few
assumptions are made as follows- (7.1) all the aqueous phase reactions have
reached equilibrium fast, (7.2) modelling of the whole PTC reaction have done, is
based on the mechanism proposed above and (7.3) the reactions occur in the
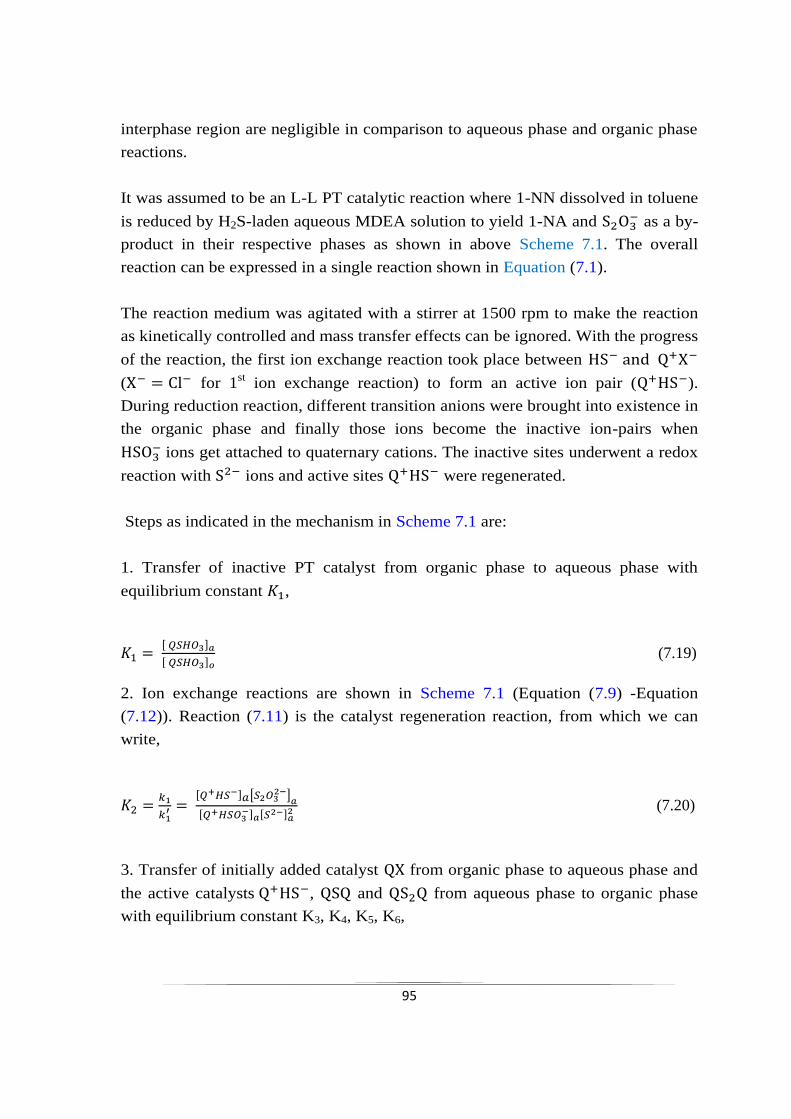
95
interphase region are negligible in comparison to aqueous phase and organic phase
reactions.
It was assumed to be an L-L PT catalytic reaction where 1-NN dissolved in toluene
is reduced by H2S-laden aqueous MDEA solution to yield 1-NA and as a by-
product in their respective phases as shown in above Scheme 7.1. The overall
reaction can be expressed in a single reaction shown in Equation (7.1).
The reaction medium was agitated with a stirrer at 1500 rpm to make the reaction
as kinetically controlled and mass transfer effects can be ignored. With the progress
of the reaction, the first ion exchange reaction took place between
( for 1st ion exchange reaction) to form an active ion pair ( ).
During reduction reaction, different transition anions were brought into existence in
the organic phase and finally those ions become the inactive ion-pairs when
ions get attached to quaternary cations. The inactive sites underwent a redox
reaction with ions and active sites were regenerated.
Steps as indicated in the mechanism in Scheme 7.1 are:
1. Transfer of inactive PT catalyst from organic phase to aqueous phase with
equilibrium constant ,
(7.19)
2. Ion exchange reactions are shown in Scheme 7.1 (Equation (7.9) -Equation
(7.12)). Reaction (7.11) is the catalyst regeneration reaction, from which we can
write,
[ ]
(7.20)
3. Transfer of initially added catalyst from organic phase to aqueous phase and
the active catalysts , and from aqueous phase to organic phase
with equilibrium constant K3, K4, K5, K6,
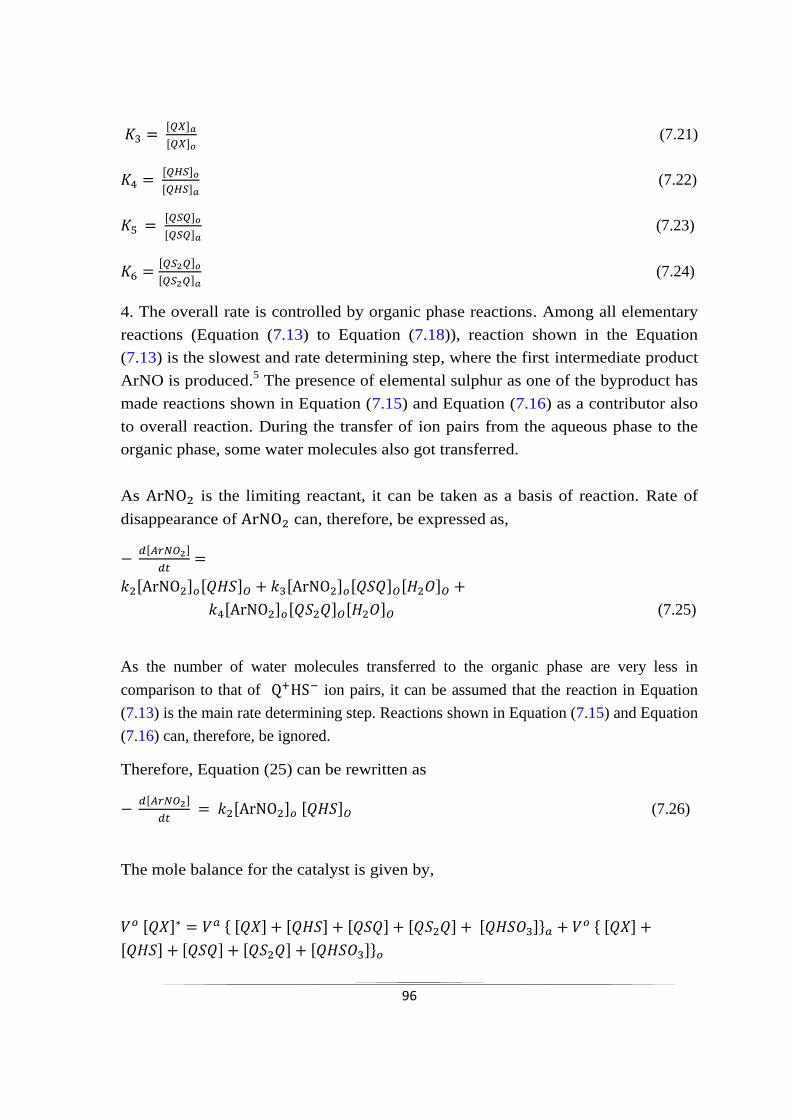
96
(7.21)
(7.22)
(7.23)
(7.24)
4. The overall rate is controlled by organic phase reactions. Among all elementary
reactions (Equation (7.13) to Equation (7.18)), reaction shown in the Equation
(7.13) is the slowest and rate determining step, where the first intermediate product
ArNO is produced.5 The presence of elemental sulphur as one of the byproduct has
made reactions shown in Equation (7.15) and Equation (7.16) as a contributor also
to overall reaction. During the transfer of ion pairs from the aqueous phase to the
organic phase, some water molecules also got transferred.
As is the limiting reactant, it can be taken as a basis of reaction. Rate of
disappearance of can, therefore, be expressed as,
(7.25)
As the number of water molecules transferred to the organic phase are very less in
comparison to that of ion pairs, it can be assumed that the reaction in Equation
(7.13) is the main rate determining step. Reactions shown in Equation (7.15) and Equation
(7.16) can, therefore, be ignored.
Therefore, Equation (25) can be rewritten as
(7.26)
The mole balance for the catalyst is given by,
{ } {
}
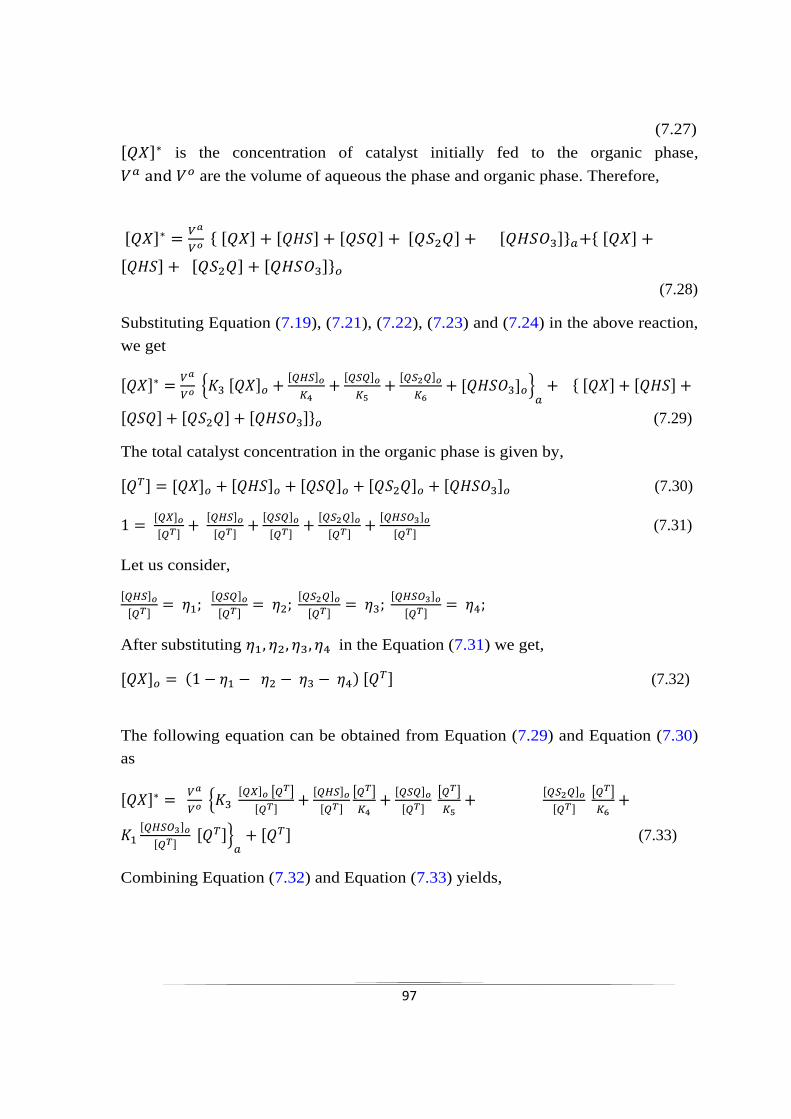
97
(7.27)
is the concentration of catalyst initially fed to the organic phase,
are the volume of aqueous the phase and organic phase. Therefore,
{ } {
}
(7.28)
Substituting Equation (7.19), (7.21), (7.22), (7.23) and (7.24) in the above reaction,
we get
{
}
{
} (7.29)
The total catalyst concentration in the organic phase is given by,
(7.30)
(7.31)
Let us consider,
After substituting in the Equation (7.31) we get,
(7.32)
The following equation can be obtained from Equation (7.29) and Equation (7.30)
as
{ [ ]
[ ]
[ ]
[ ]
}
(7.33)
Combining Equation (7.32) and Equation (7.33) yields,
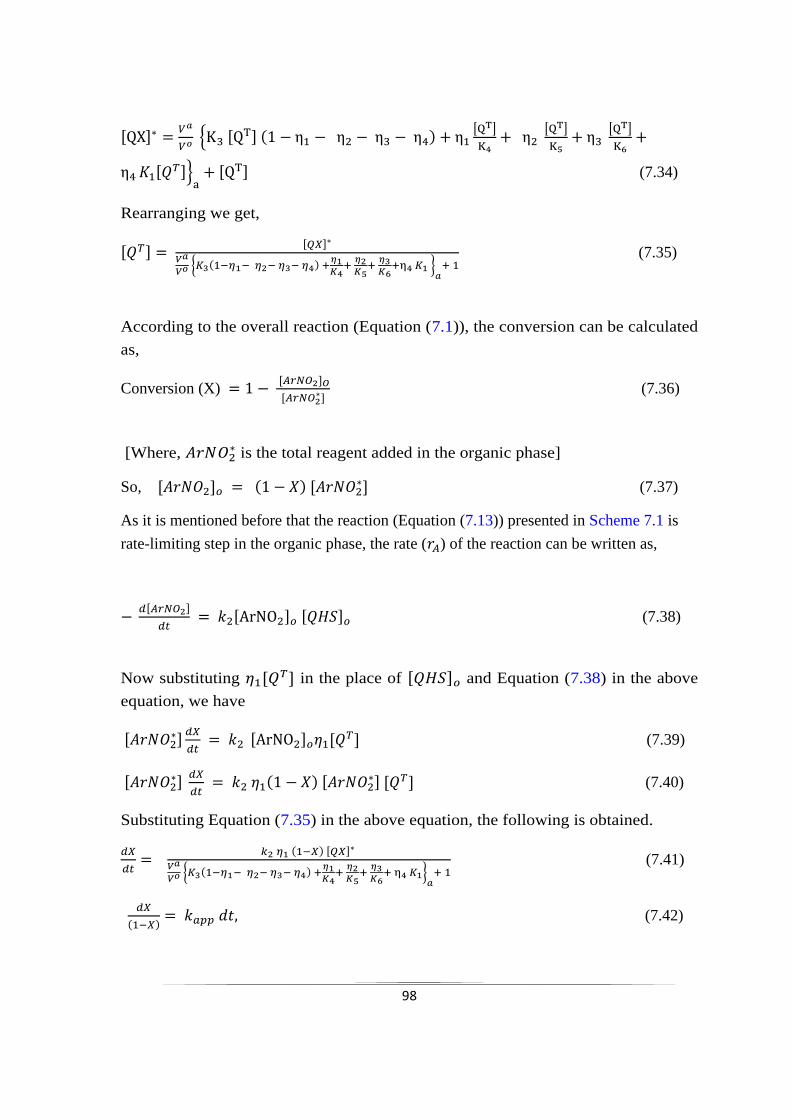
98
{
[ ]
[ ]
[ ]
}
(7.34)
Rearranging we get,
{
}
(7.35)
According to the overall reaction (Equation (7.1)), the conversion can be calculated
as,
Conversion (X)
(7.36)
[Where, is the total reagent added in the organic phase]
So, (7.37)
As it is mentioned before that the reaction (Equation (7.13)) presented in Scheme 7.1 is
rate-limiting step in the organic phase, the rate ( ) of the reaction can be written as,
(7.38)
Now substituting in the place of and Equation (7.38) in the above
equation, we have
(7.39)
(7.40)
Substituting Equation (7.35) in the above equation, the following is obtained.
{
}
(7.41)
(7.42)
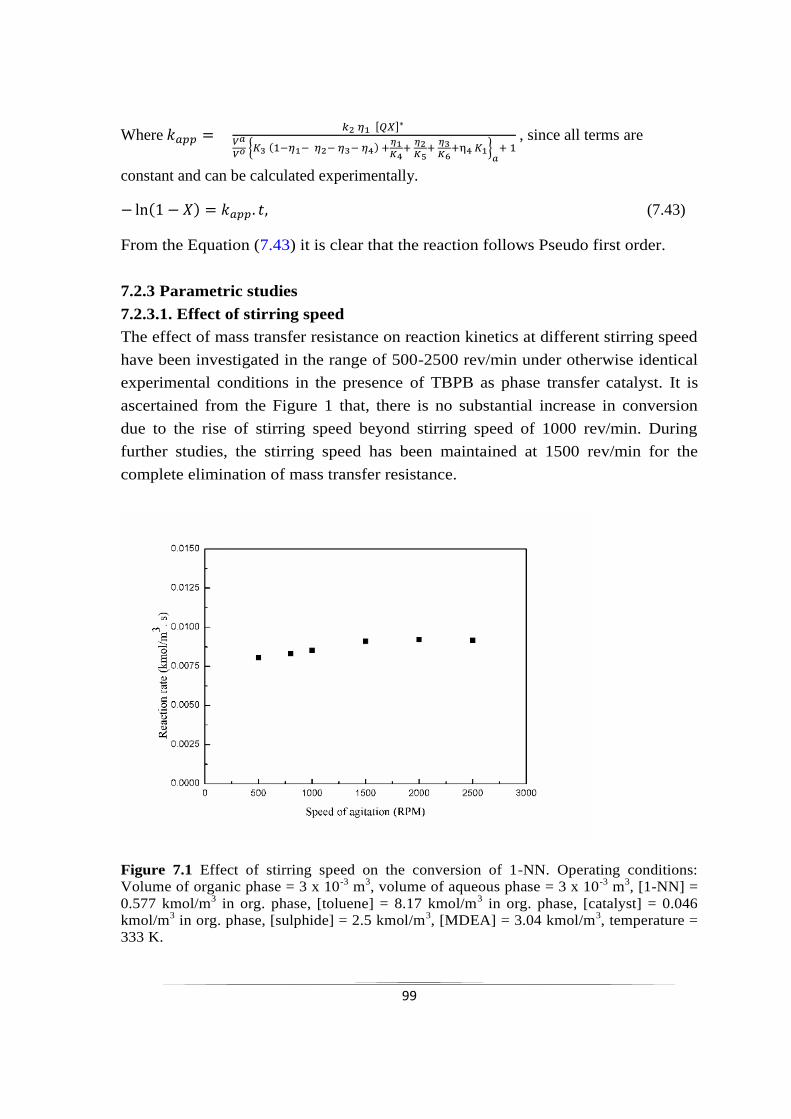
99
Where
{
}
, since all terms are
constant and can be calculated experimentally.
(7.43)
From the Equation (7.43) it is clear that the reaction follows Pseudo first order.
7.2.3 Parametric studies
7.2.3.1. Effect of stirring speed
The effect of mass transfer resistance on reaction kinetics at different stirring speed
have been investigated in the range of 500-2500 rev/min under otherwise identical
experimental conditions in the presence of TBPB as phase transfer catalyst. It is
ascertained from the Figure 1 that, there is no substantial increase in conversion
due to the rise of stirring speed beyond stirring speed of 1000 rev/min. During
further studies, the stirring speed has been maintained at 1500 rev/min for the
complete elimination of mass transfer resistance.
Figure 7.1 Effect of stirring speed on the conversion of 1-NN. Operating conditions:
Volume of organic phase = 3 x 10⁻³
m3, volume of aqueous phase = 3 x 10
-3 m
3, [1-NN] =
0.577 kmol/m3 in org. phase, [toluene] = 8.17 kmol/m
3 in org. phase, [catalyst] = 0.046
kmol/m3 in org. phase, [sulphide] = 2.5 kmol/m
3, [MDEA] = 3.04 kmol/m
3, temperature =
333 K.
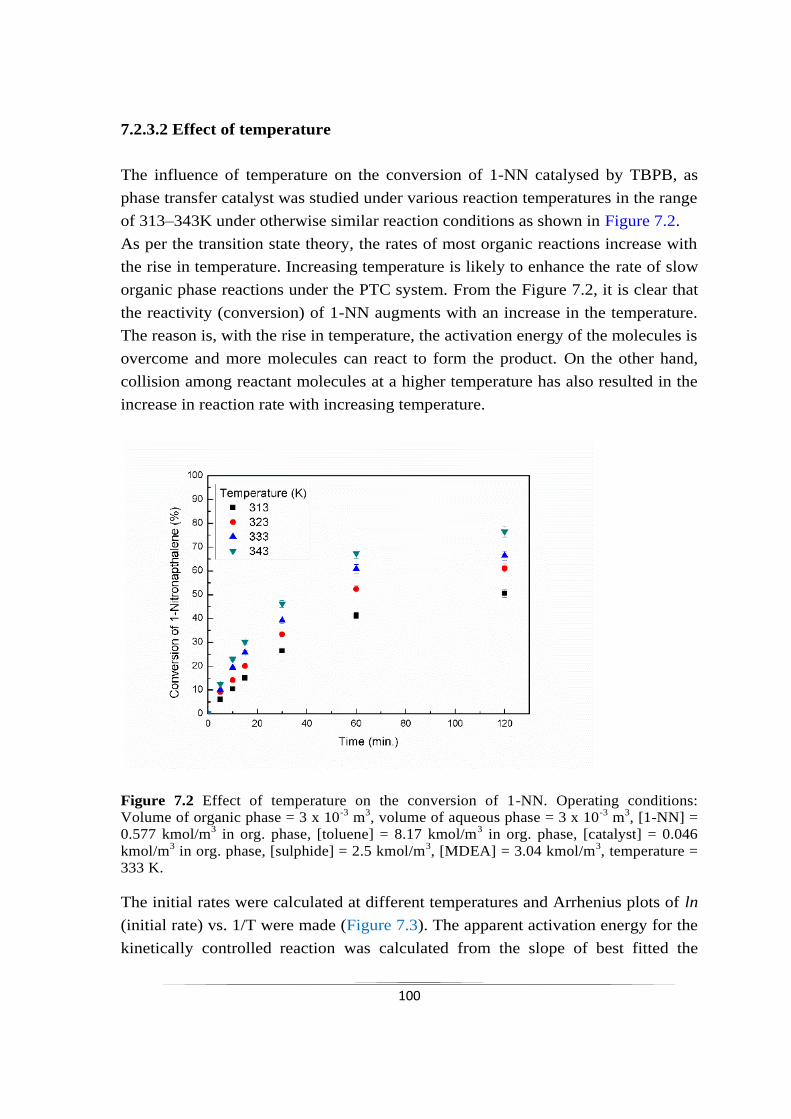
100
7.2.3.2 Effect of temperature
The influence of temperature on the conversion of 1-NN catalysed by TBPB, as
phase transfer catalyst was studied under various reaction temperatures in the range
of 313–343K under otherwise similar reaction conditions as shown in Figure 7.2.
As per the transition state theory, the rates of most organic reactions increase with
the rise in temperature. Increasing temperature is likely to enhance the rate of slow
organic phase reactions under the PTC system. From the Figure 7.2, it is clear that
the reactivity (conversion) of 1-NN augments with an increase in the temperature.
The reason is, with the rise in temperature, the activation energy of the molecules is
overcome and more molecules can react to form the product. On the other hand,
collision among reactant molecules at a higher temperature has also resulted in the
increase in reaction rate with increasing temperature.
Figure 7.2 Effect of temperature on the conversion of 1-NN. Operating conditions:
Volume of organic phase = 3 x 10⁻³
m3, volume of aqueous phase = 3 x 10
-3 m
3, [1-NN] =
0.577 kmol/m3 in org. phase, [toluene] = 8.17 kmol/m
3 in org. phase, [catalyst] = 0.046
kmol/m3 in org. phase, [sulphide] = 2.5 kmol/m
3, [MDEA] = 3.04 kmol/m
3, temperature =
333 K.
The initial rates were calculated at different temperatures and Arrhenius plots of ln
(initial rate) vs. 1/T were made (Figure 7.3). The apparent activation energy for the
kinetically controlled reaction was calculated from the slope of best fitted the
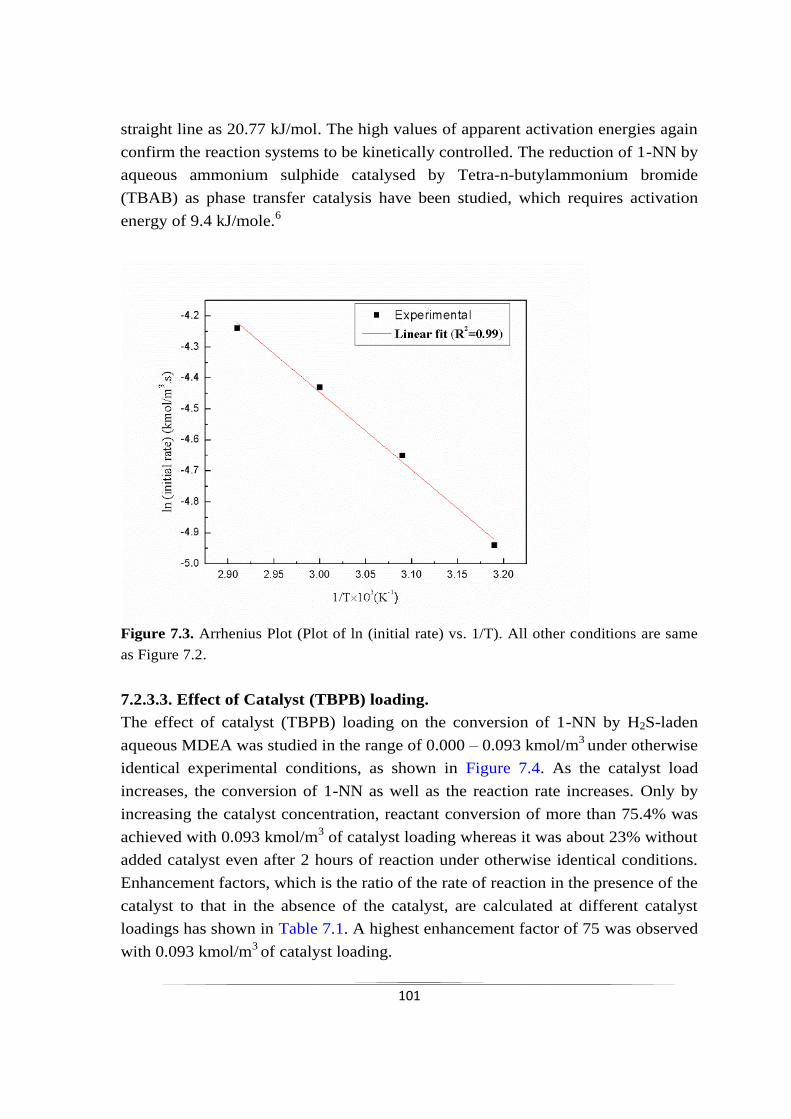
101
straight line as 20.77 kJ/mol. The high values of apparent activation energies again
confirm the reaction systems to be kinetically controlled. The reduction of 1-NN by
aqueous ammonium sulphide catalysed by Tetra-n-butylammonium bromide
(TBAB) as phase transfer catalysis have been studied, which requires activation
energy of 9.4 kJ/mole.6
Figure 7.3. Arrhenius Plot (Plot of ln (initial rate) vs. 1/T). All other conditions are same
as Figure 7.2.
7.2.3.3. Effect of Catalyst (TBPB) loading.
The effect of catalyst (TBPB) loading on the conversion of 1-NN by H2S-laden
aqueous MDEA was studied in the range of 0.000 – 0.093 kmol/m3
under otherwise
identical experimental conditions, as shown in Figure 7.4. As the catalyst load
increases, the conversion of 1-NN as well as the reaction rate increases. Only by
increasing the catalyst concentration, reactant conversion of more than 75.4% was
achieved with 0.093 kmol/m3 of catalyst loading whereas it was about 23% without
added catalyst even after 2 hours of reaction under otherwise identical conditions.
Enhancement factors, which is the ratio of the rate of reaction in the presence of the
catalyst to that in the absence of the catalyst, are calculated at different catalyst
loadings has shown in Table 7.1. A highest enhancement factor of 75 was observed
with 0.093 kmol/m3
of catalyst loading.
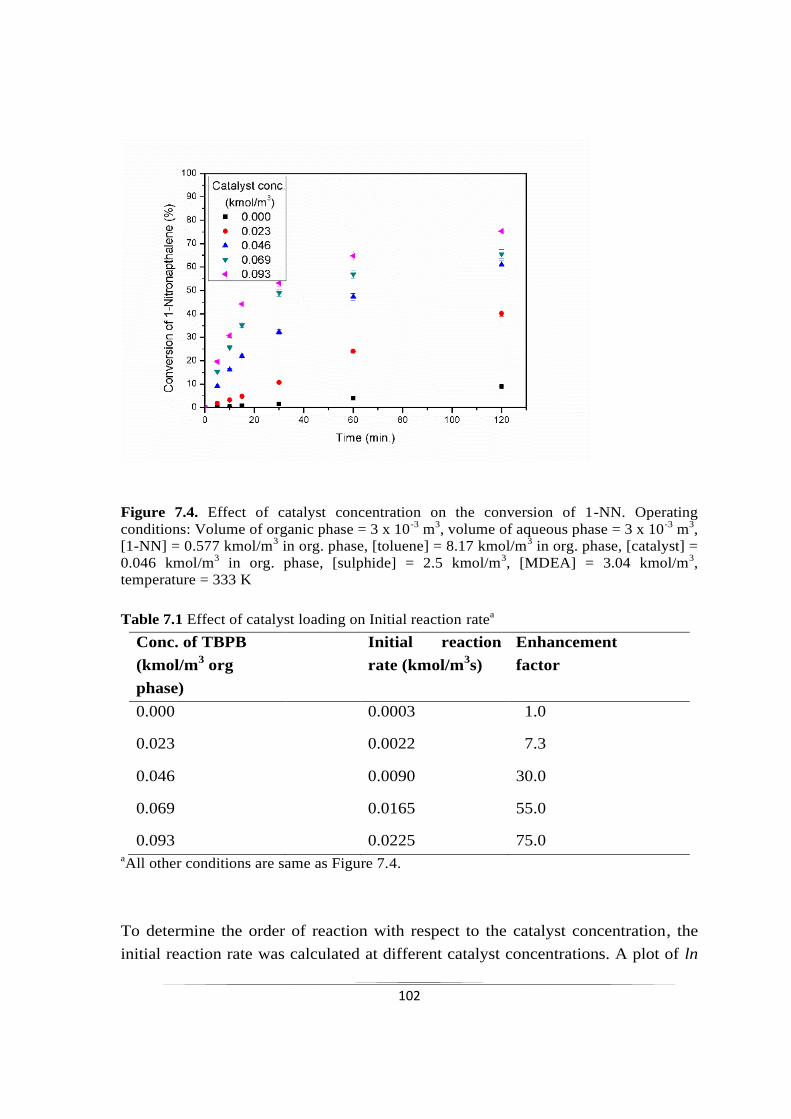
102
Figure 7.4. Effect of catalyst concentration on the conversion of 1-NN. Operating
conditions: Volume of organic phase = 3 x 10⁻³
m3, volume of aqueous phase = 3 x 10
-3 m
3,
[1-NN] = 0.577 kmol/m3 in org. phase, [toluene] = 8.17 kmol/m
3 in org. phase, [catalyst] =
0.046 kmol/m3 in org. phase, [sulphide] = 2.5 kmol/m
3, [MDEA] = 3.04 kmol/m
3,
temperature = 333 K
Table 7.1 Effect of catalyst loading on Initial reaction ratea
Conc. of TBPB
(kmol/m3 org
phase)
Initial reaction
rate (kmol/m3s)
Enhancement
factor
0.000 0.0003 1.0
0.023 0.0022 7.3
0.046 0.0090 30.0
0.069 0.0165 55.0
0.093 0.0225 75.0 aAll other conditions are same as Figure 7.4.
To determine the order of reaction with respect to the catalyst concentration, the
initial reaction rate was calculated at different catalyst concentrations. A plot of ln
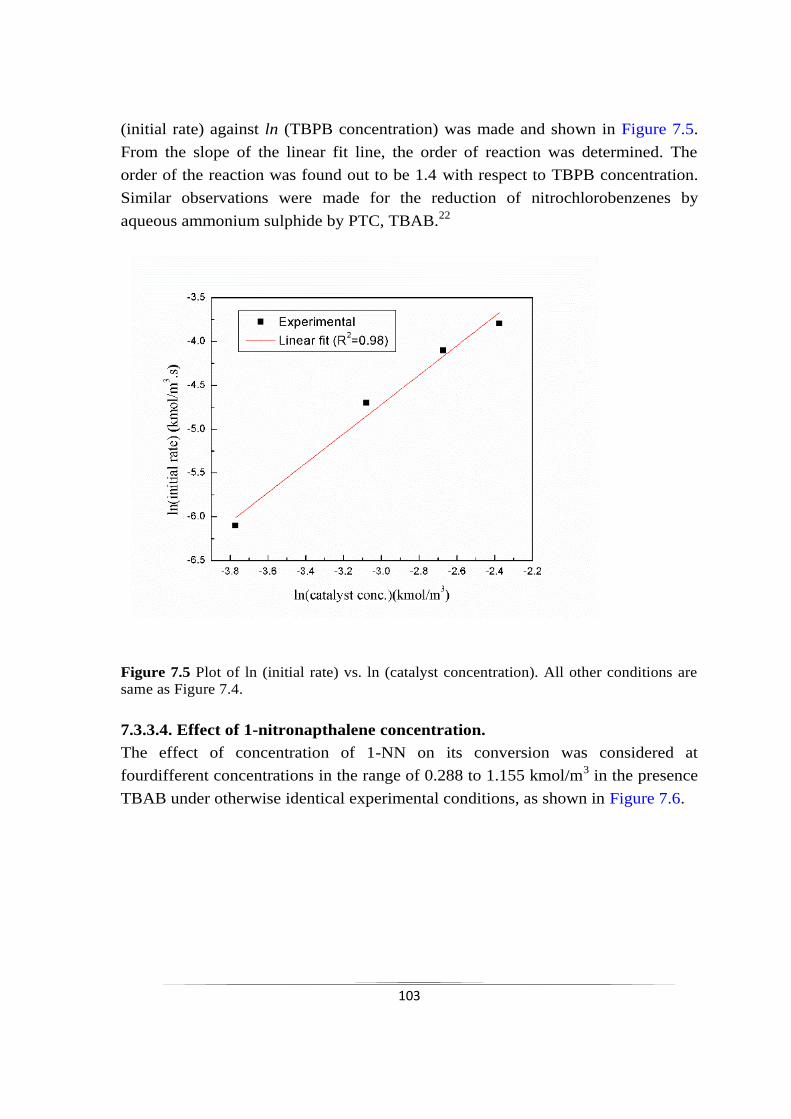
103
(initial rate) against ln (TBPB concentration) was made and shown in Figure 7.5.
From the slope of the linear fit line, the order of reaction was determined. The
order of the reaction was found out to be 1.4 with respect to TBPB concentration.
Similar observations were made for the reduction of nitrochlorobenzenes by
aqueous ammonium sulphide by PTC, TBAB.22
Figure 7.5 Plot of ln (initial rate) vs. ln (catalyst concentration). All other conditions are
same as Figure 7.4.
7.3.3.4. Effect of 1-nitronapthalene concentration.
The effect of concentration of 1-NN on its conversion was considered at
fourdifferent concentrations in the range of 0.288 to 1.155 kmol/m3 in the presence
TBAB under otherwise identical experimental conditions, as shown in Figure 7.6.
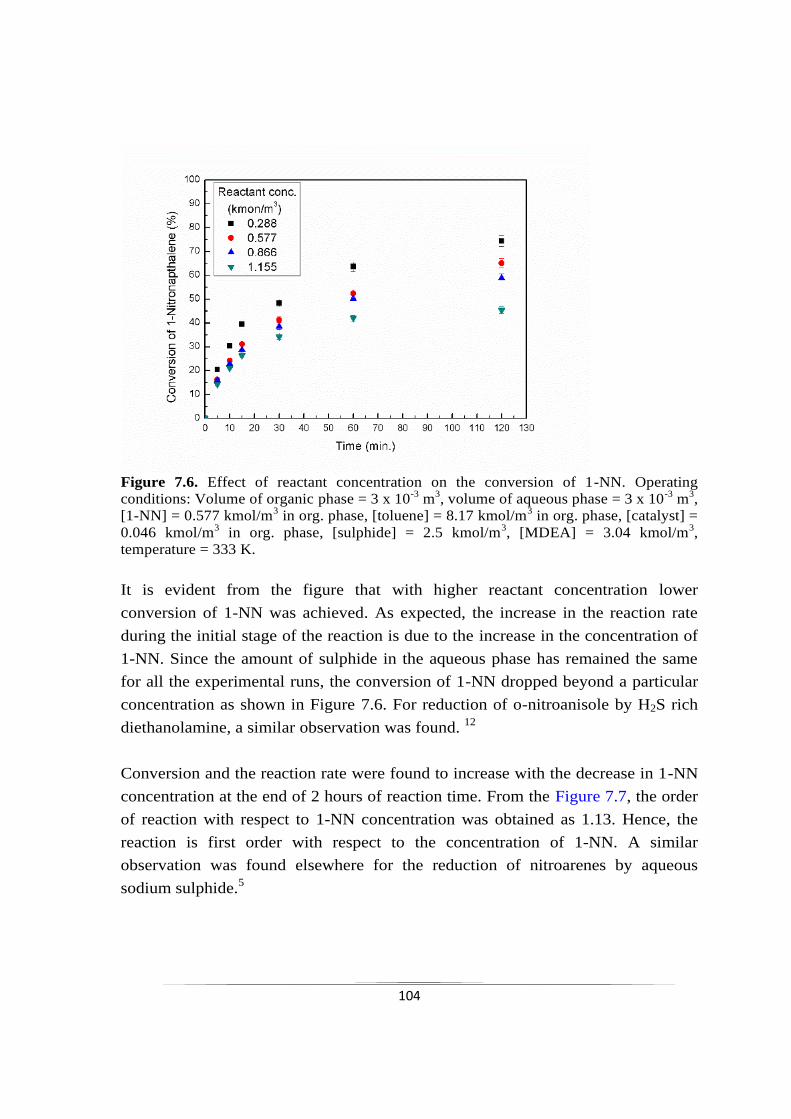
104
Figure 7.6. Effect of reactant concentration on the conversion of 1-NN. Operating
conditions: Volume of organic phase = 3 x 10⁻³
m3, volume of aqueous phase = 3 x 10
-3 m
3,
[1-NN] = 0.577 kmol/m3 in org. phase, [toluene] = 8.17 kmol/m
3 in org. phase, [catalyst] =
0.046 kmol/m3 in org. phase, [sulphide] = 2.5 kmol/m
3, [MDEA] = 3.04 kmol/m
3,
temperature = 333 K.
It is evident from the figure that with higher reactant concentration lower
conversion of 1-NN was achieved. As expected, the increase in the reaction rate
during the initial stage of the reaction is due to the increase in the concentration of
1-NN. Since the amount of sulphide in the aqueous phase has remained the same
for all the experimental runs, the conversion of 1-NN dropped beyond a particular
concentration as shown in Figure 7.6. For reduction of o-nitroanisole by H2S rich
diethanolamine, a similar observation was found. 12
Conversion and the reaction rate were found to increase with the decrease in 1-NN
concentration at the end of 2 hours of reaction time. From the Figure 7.7, the order
of reaction with respect to 1-NN concentration was obtained as 1.13. Hence, the
reaction is first order with respect to the concentration of 1-NN. A similar
observation was found elsewhere for the reduction of nitroarenes by aqueous
sodium sulphide.5
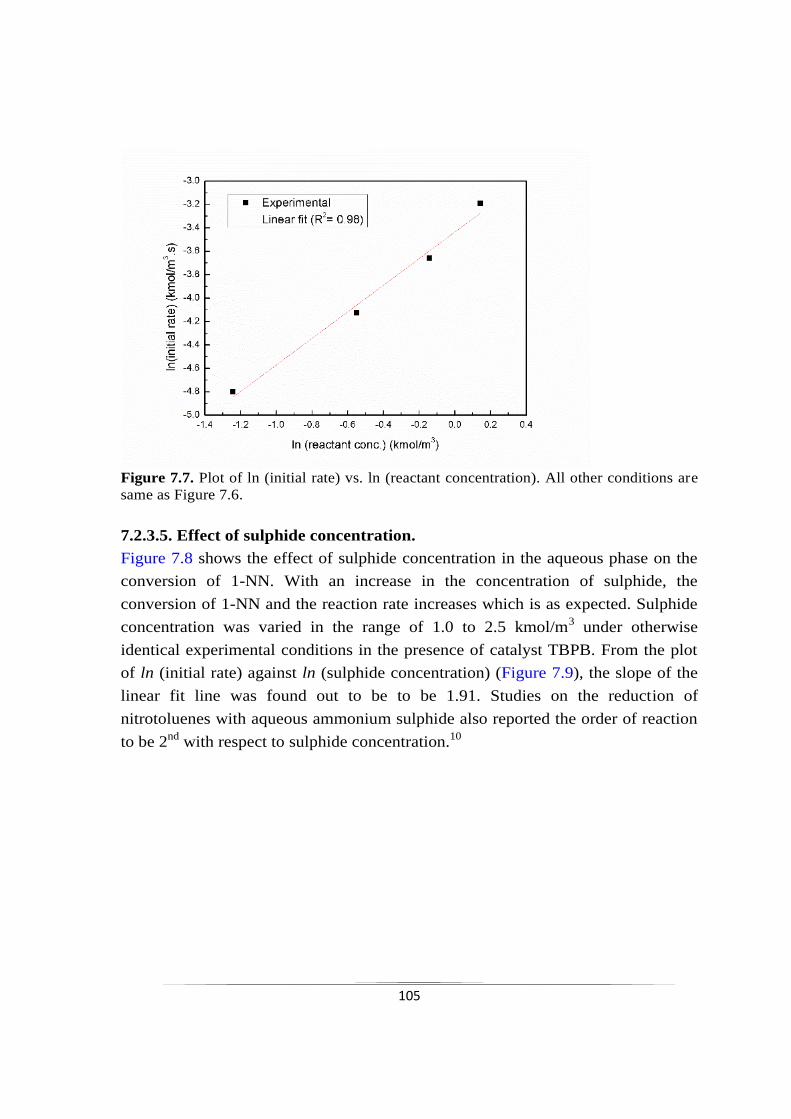
105
Figure 7.7. Plot of ln (initial rate) vs. ln (reactant concentration). All other conditions are
same as Figure 7.6.
7.2.3.5. Effect of sulphide concentration.
Figure 7.8 shows the effect of sulphide concentration in the aqueous phase on the
conversion of 1-NN. With an increase in the concentration of sulphide, the
conversion of 1-NN and the reaction rate increases which is as expected. Sulphide
concentration was varied in the range of 1.0 to 2.5 kmol/m3 under otherwise
identical experimental conditions in the presence of catalyst TBPB. From the plot
of ln (initial rate) against ln (sulphide concentration) (Figure 7.9), the slope of the
linear fit line was found out to be to be 1.91. Studies on the reduction of
nitrotoluenes with aqueous ammonium sulphide also reported the order of reaction
to be 2nd
with respect to sulphide concentration.10
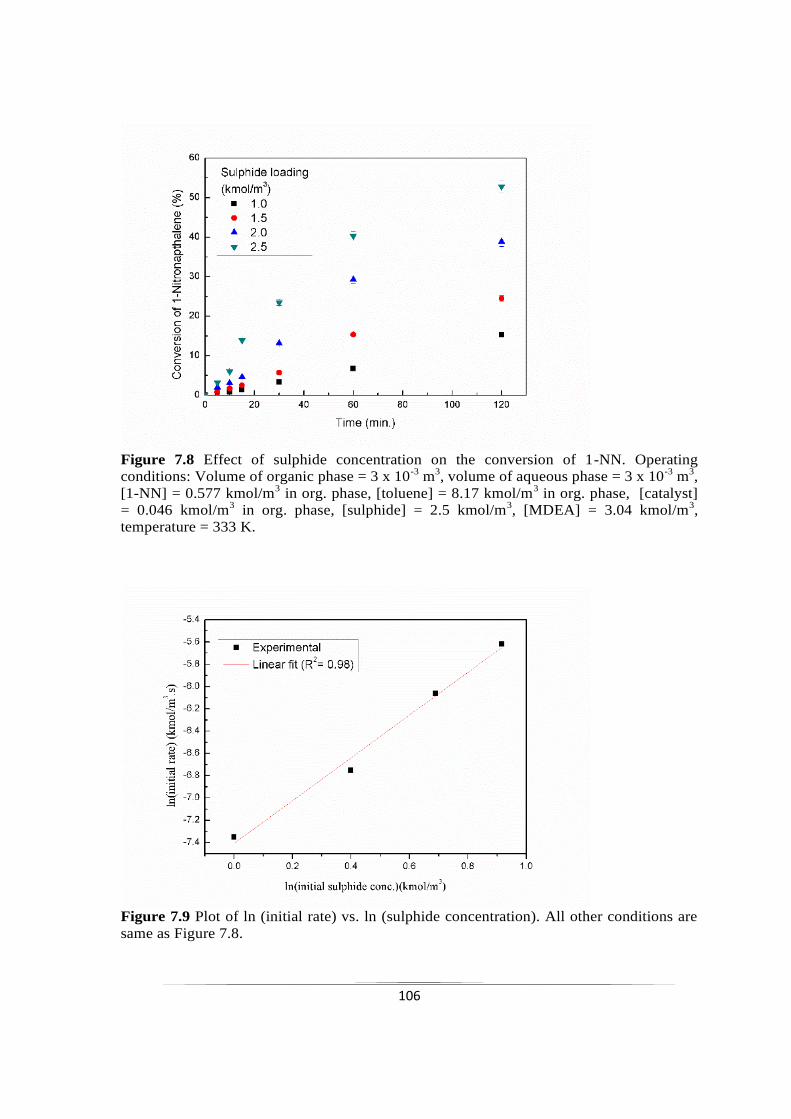
106
Figure 7.8 Effect of sulphide concentration on the conversion of 1-NN. Operating
conditions: Volume of organic phase = 3 x 10⁻³
m3, volume of aqueous phase = 3 x 10
-3 m
3,
[1-NN] = 0.577 kmol/m3 in org. phase, [toluene] = 8.17 kmol/m
3 in org. phase, [catalyst]
= 0.046 kmol/m3 in org. phase, [sulphide] = 2.5 kmol/m
3, [MDEA] = 3.04 kmol/m
3,
temperature = 333 K.
Figure 7.9 Plot of ln (initial rate) vs. ln (sulphide concentration). All other conditions are
same as Figure 7.8.
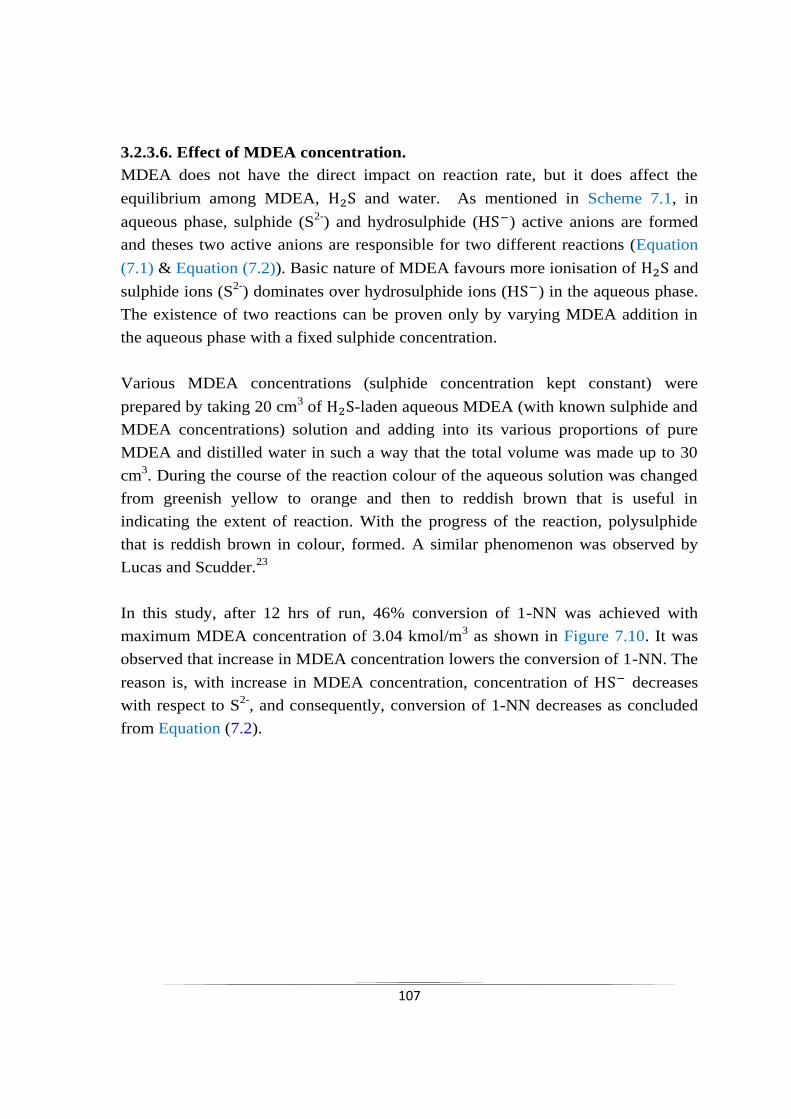
107
3.2.3.6. Effect of MDEA concentration.
MDEA does not have the direct impact on reaction rate, but it does affect the
equilibrium among MDEA, and water. As mentioned in Scheme 7.1, in
aqueous phase, sulphide (S2-
) and hydrosulphide (H ) active anions are formed
and theses two active anions are responsible for two different reactions (Equation
(7.1) & Equation (7.2)). Basic nature of MDEA favours more ionisation of and
sulphide ions (S2-
) dominates over hydrosulphide ions (H ) in the aqueous phase.
The existence of two reactions can be proven only by varying MDEA addition in
the aqueous phase with a fixed sulphide concentration.
Various MDEA concentrations (sulphide concentration kept constant) were
prepared by taking 20 cm3 of -laden aqueous MDEA (with known sulphide and
MDEA concentrations) solution and adding into its various proportions of pure
MDEA and distilled water in such a way that the total volume was made up to 30
cm3. During the course of the reaction colour of the aqueous solution was changed
from greenish yellow to orange and then to reddish brown that is useful in
indicating the extent of reaction. With the progress of the reaction, polysulphide
that is reddish brown in colour, formed. A similar phenomenon was observed by
Lucas and Scudder.23
In this study, after 12 hrs of run, 46% conversion of 1-NN was achieved with
maximum MDEA concentration of 3.04 kmol/m3 as shown in Figure 7.10. It was
observed that increase in MDEA concentration lowers the conversion of 1-NN. The
reason is, with increase in MDEA concentration, concentration of H decreases
with respect to S2-
, and consequently, conversion of 1-NN decreases as concluded
from Equation (7.2).
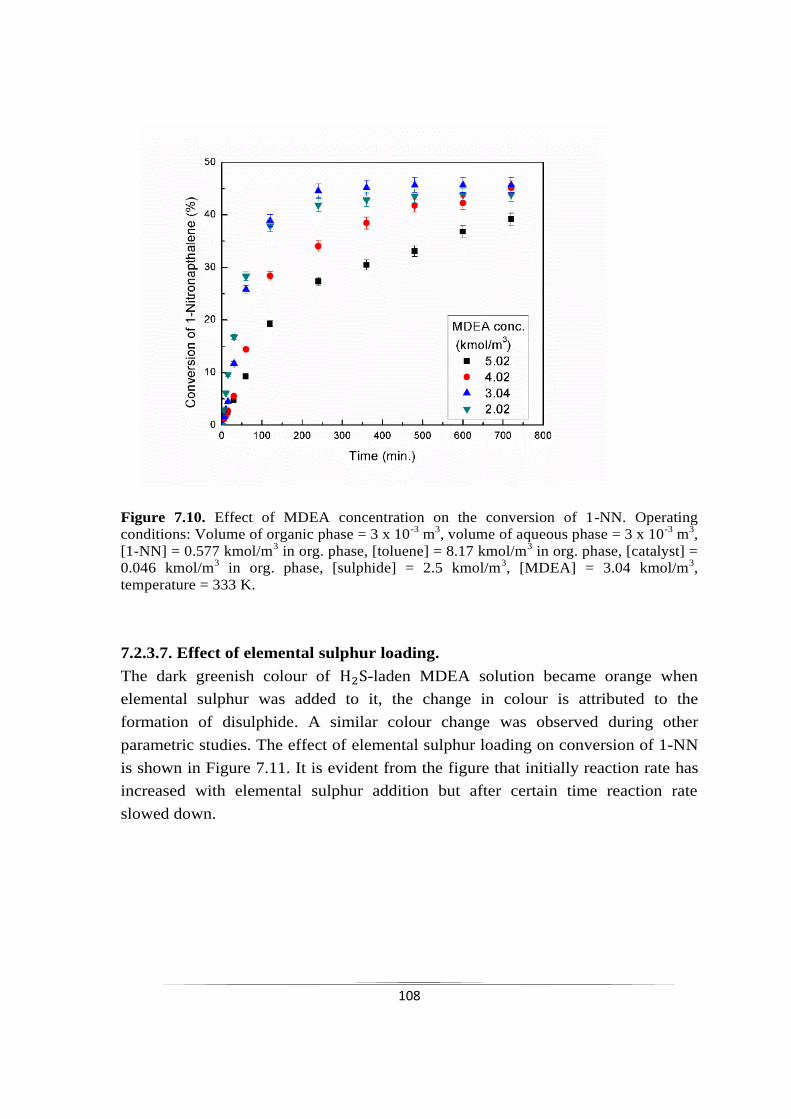
108
Figure 7.10. Effect of MDEA concentration on the conversion of 1-NN. Operating
conditions: Volume of organic phase = 3 x 10⁻³
m3, volume of aqueous phase = 3 x 10
-3 m
3,
[1-NN] = 0.577 kmol/m3 in org. phase, [toluene] = 8.17 kmol/m
3 in org. phase, [catalyst] =
0.046 kmol/m3 in org. phase, [sulphide] = 2.5 kmol/m
3, [MDEA] = 3.04 kmol/m
3,
temperature = 333 K.
7.2.3.7. Effect of elemental sulphur loading.
The dark greenish colour of -laden MDEA solution became orange when
elemental sulphur was added to it, the change in colour is attributed to the
formation of disulphide. A similar colour change was observed during other
parametric studies. The effect of elemental sulphur loading on conversion of 1-NN
is shown in Figure 7.11. It is evident from the figure that initially reaction rate has
increased with elemental sulphur addition but after certain time reaction rate
slowed down.
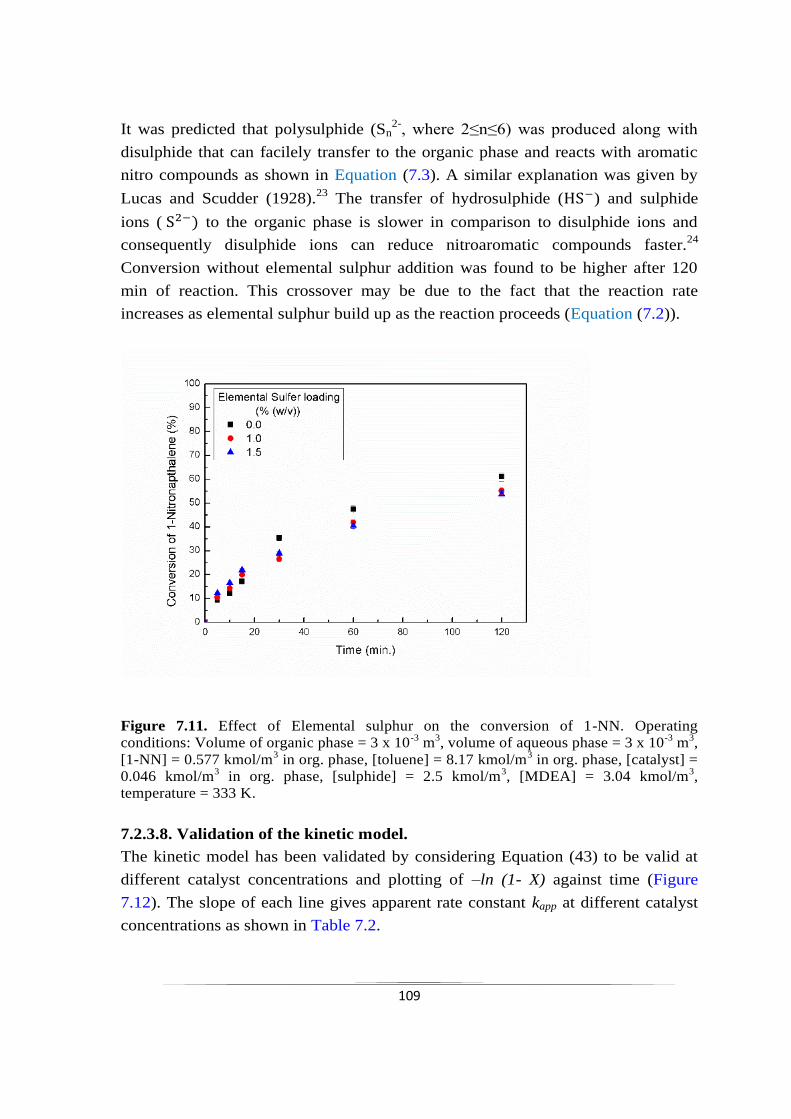
109
It was predicted that polysulphide (Sn2-
, where 2≤n≤6) was produced along with
disulphide that can facilely transfer to the organic phase and reacts with aromatic
nitro compounds as shown in Equation (7.3). A similar explanation was given by
Lucas and Scudder (1928).23
The transfer of hydrosulphide ( ) and sulphide
ions ( to the organic phase is slower in comparison to disulphide ions and
consequently disulphide ions can reduce nitroaromatic compounds faster.24
Conversion without elemental sulphur addition was found to be higher after 120
min of reaction. This crossover may be due to the fact that the reaction rate
increases as elemental sulphur build up as the reaction proceeds (Equation (7.2)).
Figure 7.11. Effect of Elemental sulphur on the conversion of 1-NN. Operating
conditions: Volume of organic phase = 3 x 10⁻³
m3, volume of aqueous phase = 3 x 10
-3 m
3,
[1-NN] = 0.577 kmol/m3 in org. phase, [toluene] = 8.17 kmol/m
3 in org. phase, [catalyst] =
0.046 kmol/m3 in org. phase, [sulphide] = 2.5 kmol/m
3, [MDEA] = 3.04 kmol/m
3,
temperature = 333 K.
7.2.3.8. Validation of the kinetic model.
The kinetic model has been validated by considering Equation (43) to be valid at
different catalyst concentrations and plotting of –ln (1- X) against time (Figure
7.12). The slope of each line gives apparent rate constant kapp at different catalyst
concentrations as shown in Table 7.2.
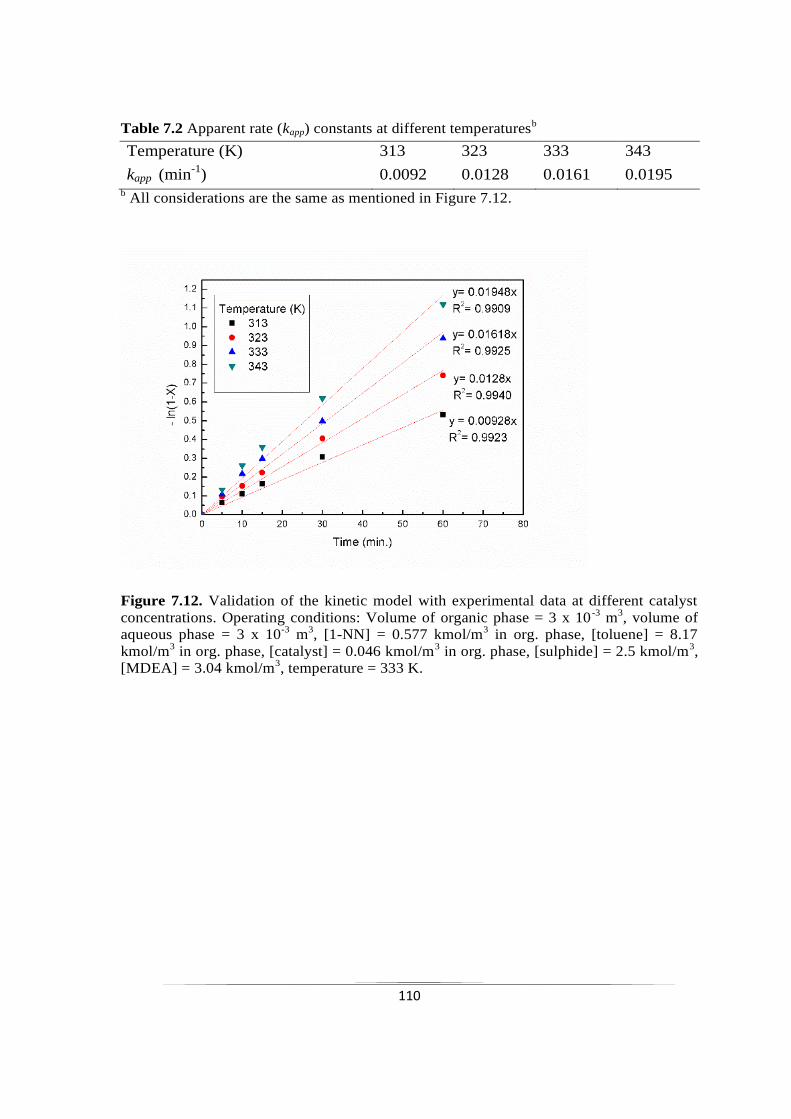
110
Table 7.2 Apparent rate (kapp) constants at different temperaturesb
Temperature (K) 313 323 333 343
kapp (min-1
) 0.0092 0.0128 0.0161 0.0195 b All considerations are the same as mentioned in Figure 7.12.
Figure 7.12. Validation of the kinetic model with experimental data at different catalyst
concentrations. Operating conditions: Volume of organic phase = 3 x 10⁻³
m3, volume of
aqueous phase = 3 x 10⁻³
m3, [1-NN] = 0.577 kmol/m
3 in org. phase, [toluene] = 8.17
kmol/m3 in org. phase, [catalyst] = 0.046 kmol/m
3 in org. phase, [sulphide] = 2.5 kmol/m
3,
[MDEA] = 3.04 kmol/m3, temperature = 333 K.
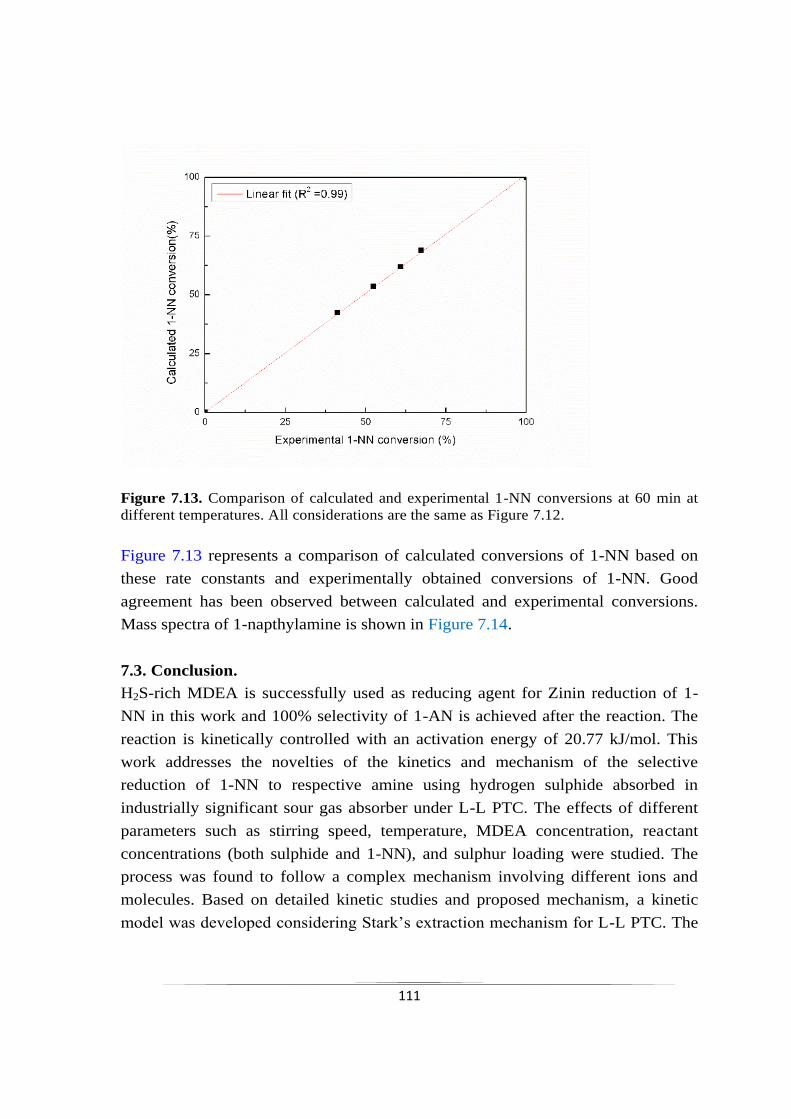
111
Figure 7.13. Comparison of calculated and experimental 1-NN conversions at 60 min at
different temperatures. All considerations are the same as Figure 7.12.
Figure 7.13 represents a comparison of calculated conversions of 1-NN based on
these rate constants and experimentally obtained conversions of 1-NN. Good
agreement has been observed between calculated and experimental conversions.
Mass spectra of 1-napthylamine is shown in Figure 7.14.
7.3. Conclusion.
H2S-rich MDEA is successfully used as reducing agent for Zinin reduction of 1-
NN in this work and 100% selectivity of 1-AN is achieved after the reaction. The
reaction is kinetically controlled with an activation energy of 20.77 kJ/mol. This
work addresses the novelties of the kinetics and mechanism of the selective
reduction of 1-NN to respective amine using hydrogen sulphide absorbed in
industrially significant sour gas absorber under L-L PTC. The effects of different
parameters such as stirring speed, temperature, MDEA concentration, reactant
concentrations (both sulphide and 1-NN), and sulphur loading were studied. The
process was found to follow a complex mechanism involving different ions and
molecules. Based on detailed kinetic studies and proposed mechanism, a kinetic
model was developed considering Stark‟s extraction mechanism for L-L PTC. The
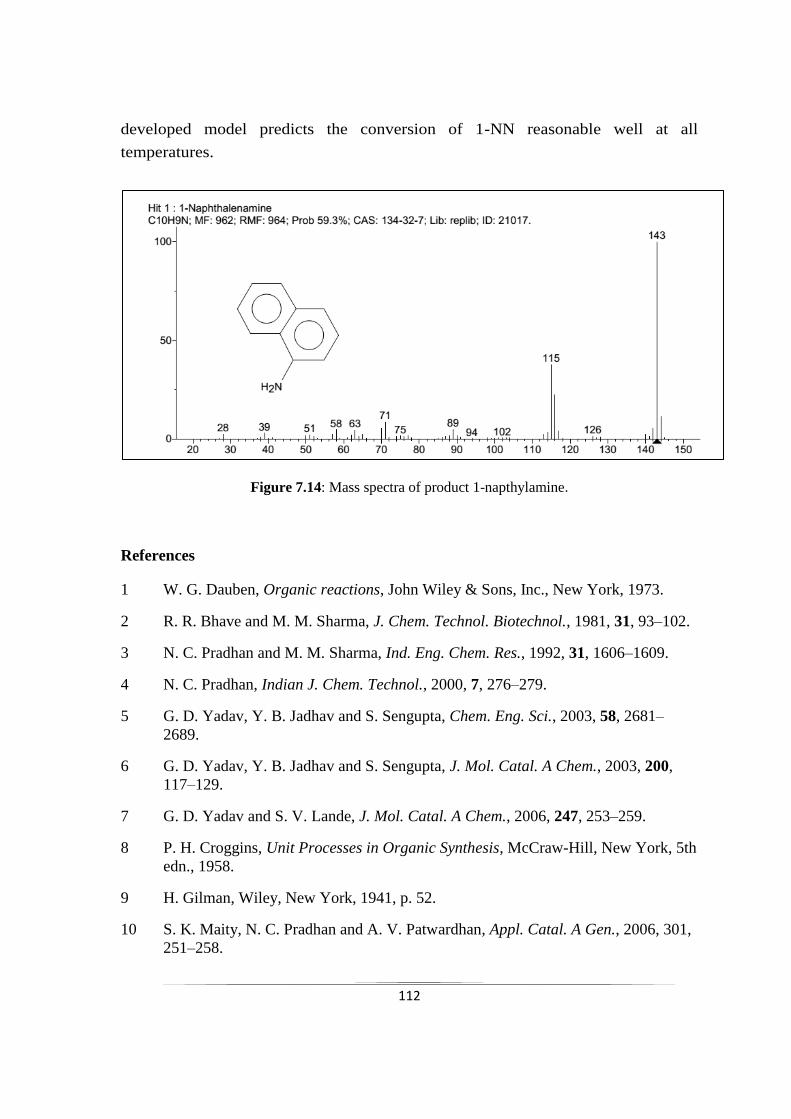
112
developed model predicts the conversion of 1-NN reasonable well at all
temperatures.
Figure 7.14: Mass spectra of product 1-napthylamine.
References
1 W. G. Dauben, Organic reactions, John Wiley & Sons, Inc., New York, 1973.
2 R. R. Bhave and M. M. Sharma, J. Chem. Technol. Biotechnol., 1981, 31, 93–102.
3 N. C. Pradhan and M. M. Sharma, Ind. Eng. Chem. Res., 1992, 31, 1606–1609.
4 N. C. Pradhan, Indian J. Chem. Technol., 2000, 7, 276–279.
5 G. D. Yadav, Y. B. Jadhav and S. Sengupta, Chem. Eng. Sci., 2003, 58, 2681–
2689.
6 G. D. Yadav, Y. B. Jadhav and S. Sengupta, J. Mol. Catal. A Chem., 2003, 200,
117–129.
7 G. D. Yadav and S. V. Lande, J. Mol. Catal. A Chem., 2006, 247, 253–259.
8 P. H. Croggins, Unit Processes in Organic Synthesis, McCraw-Hill, New York, 5th
edn., 1958.
9 H. Gilman, Wiley, New York, 1941, p. 52.
10 S. K. Maity, N. C. Pradhan and A. V. Patwardhan, Appl. Catal. A Gen., 2006, 301,
251–258.
113
11 L. Kaewsichan, O. Al-Bofersen, V. F. Yesavage and M. S. Selim, Fluid Phase
Equilib., 2001, 183–184, 159–171.
12 S. K. Maity, N. C. Pradhan and A. V. Patwardhan, Chem. Eng. Sci., 2007, 62, 805–
813.
13 S. K. Maity, N. C. Pradhan and A. V Patwardhan, Ind. Eng. Chem. Res., 2006, 46,
7767–7774.
14 G. D. Yadav and S. V. Lande, Appl. Catal. A Gen., 2005, 287, 267–275.
15 G. D. Yadav and S. V. Lande, Ind. Eng. Chem. Res., 2007, 46, 2951–2961.
16 K. R. Hoover, W. E. Acree Jr. and M. H. Abraham, J. Solution Chem., 2005, 34,
1121–1133.
17 F. Jou, A. E. Mather and F. D. Otto, Ind. Eng. Chem. Process Des. Dev., 1982, 21,
539–544.
18 J. G. Lu, Y. F. Zheng and D. L. He, Sep. Purif. Technol., 2006, 52, 209–217.
19 Z. Qian, L. Xu, Z. Li, H. Li and K. Guo, Ind. Eng. Chem. Res., 2010, 6196–6203.
20 R. H. Weiland, T. Chakravarty and A. E. Mather, Ind. Eng. Chem. Res., 1993, 32,
1419–1430.
21 Y. Wang, F. Wang, F. Jin and Z. Jing, Ind. Eng. Chem. Res., 2013, 52, 5616–5625.
22 S. K. Maity, N. C. Pradhan and A. V. Patwardhan, Appl. Catal. B Environ., 2008,
77, 418–426.
23 N. F. Lucas, H J, Scudder, J. Am. Chem. Soc., 1928, 50, 244–249.
24 Y. Hojo, M. Takagi, Y. Ogata, J. Am. Chem. Soc., 1960, 82, 2459–2462.

Abstract
A novel way of utilizing harmful H2S gas to produce value-added chemicals has been
explored. The improved Zinin reduction of 4-Nitroacetophenone (4-NAP) was studied
with refinery generated toxic H2S dissolved in aqueous N-methyldiethanolamine (MDEA)
solution under liquid-liquid phase transfer catalysis. Response Surface Methodology
(RSM) was employed to model the system and optimise the controlling parameters for
maximum p-NAP conversion.
8.1 Introduction
Response Surface Methodology (RSM) was employed to model and optimize an
improved Zinin reduction of a nitroarene, p-Nitroacetophenone (p-NAP), by hydrogen
sulphide (H2S) under bi-liquid phase transfer catalysis. A novel Zinin reagent, H2S laden
aqueous N-methyldiethanolamine (MDEA) solution was prepared and used for this
purpose. A quadratic regression model was tested with a multivariate experimental design
based on the relationship between p-NAP conversion (Response) and four independent
variables - temperature, catalyst concentration, p-NAP: sulfide mole ratio and MDEA
concentration. The optimum values of the independent variables were found as:
temperature 339.45 K, catalyst concentration of 0.082 kmol/m3, p-NAP/sulfide mole ratio
of 0.452, MDEA concentration of 2.20 kmol/m3 and maximum p-NAP conversion of
96.31% has been attained. The analysis of variance (ANOVA) has been used to evaluate
the goodness of the fit of the model and the desirability function has been used to find the
value of the optimized parameters to maximize the p-NAP conversion.
8.2 Result and Discussion
8.2.1 Overall reaction
Reduction of p- Nitroacetophenone (1) by H2S-laden MDEA in the presence of TBPB as
phase transfer catalysis to produce p-Aminoacetophenone (2) as a sole product with 100%
selectivity is following Zinin reduction pathway is shown below.
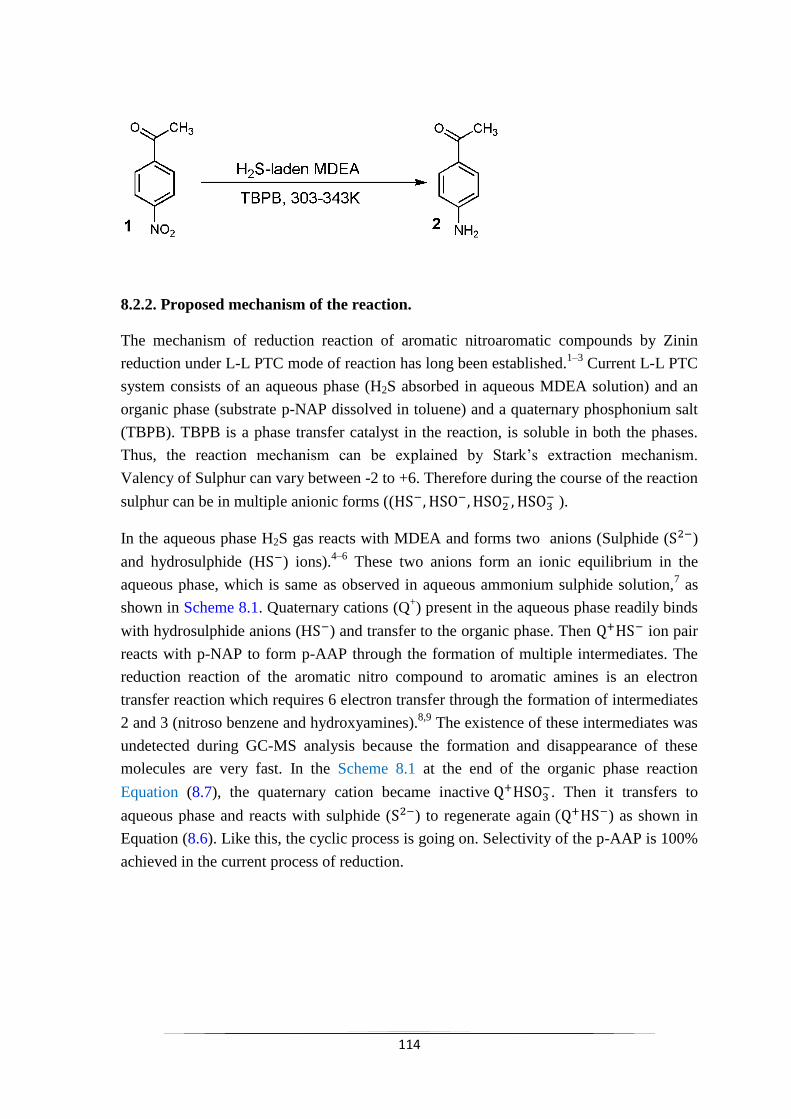
114
8.2.2. Proposed mechanism of the reaction.
The mechanism of reduction reaction of aromatic nitroaromatic compounds by Zinin
reduction under L-L PTC mode of reaction has long been established.1–3
Current L-L PTC
system consists of an aqueous phase (H2S absorbed in aqueous MDEA solution) and an
organic phase (substrate p-NAP dissolved in toluene) and a quaternary phosphonium salt
(TBPB). TBPB is a phase transfer catalyst in the reaction, is soluble in both the phases.
Thus, the reaction mechanism can be explained by Stark‟s extraction mechanism.
Valency of Sulphur can vary between -2 to +6. Therefore during the course of the reaction
sulphur can be in multiple anionic forms ((
).
In the aqueous phase H2S gas reacts with MDEA and forms two anions (Sulphide ( )
and hydrosulphide (H ) ions).4–6
These two anions form an ionic equilibrium in the
aqueous phase, which is same as observed in aqueous ammonium sulphide solution,7 as
shown in Scheme 8.1. Quaternary cations (Q+) present in the aqueous phase readily binds
with hydrosulphide anions (H ) and transfer to the organic phase. Then ion pair
reacts with p-NAP to form p-AAP through the formation of multiple intermediates. The
reduction reaction of the aromatic nitro compound to aromatic amines is an electron
transfer reaction which requires 6 electron transfer through the formation of intermediates
2 and 3 (nitroso benzene and hydroxyamines).8,9
The existence of these intermediates was
undetected during GC-MS analysis because the formation and disappearance of these
molecules are very fast. In the Scheme 8.1 at the end of the organic phase reaction
Equation (8.7), the quaternary cation became inactive . Then it transfers to
aqueous phase and reacts with sulphide ( ) to regenerate again ) as shown in
Equation (8.6). Like this, the cyclic process is going on. Selectivity of the p-AAP is 100%
achieved in the current process of reduction.
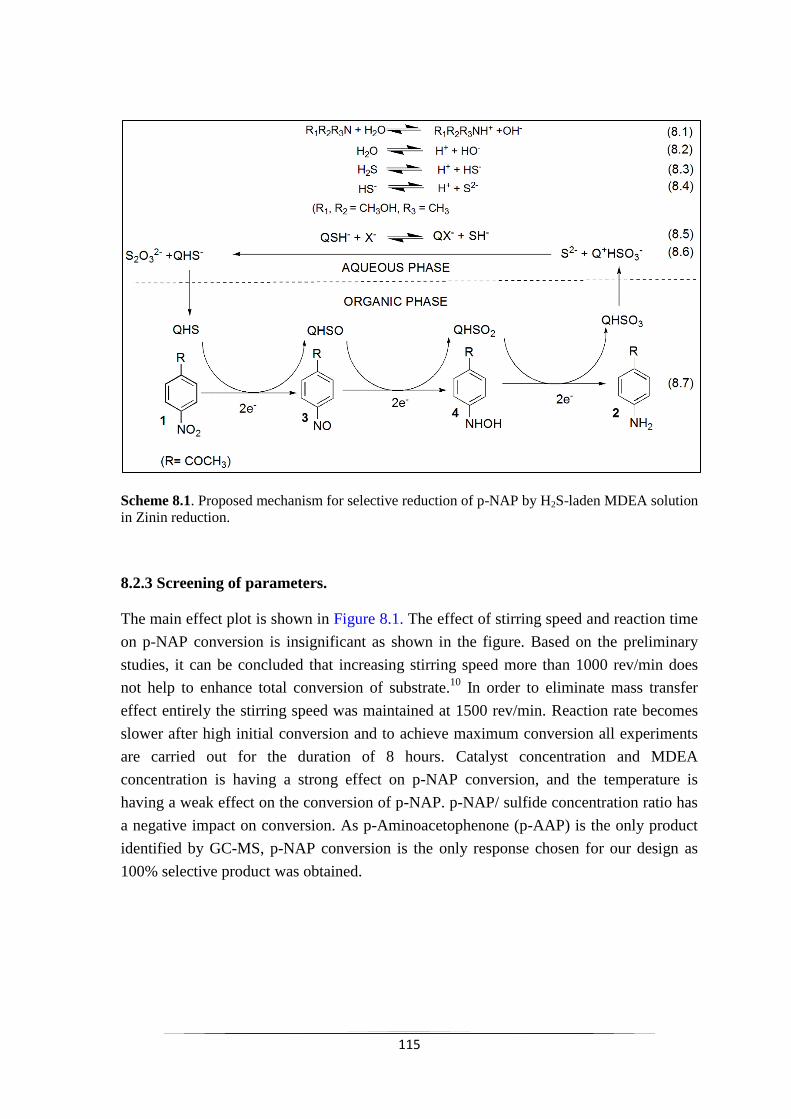
115
Scheme 8.1. Proposed mechanism for selective reduction of p-NAP by H2S-laden MDEA solution
in Zinin reduction.
8.2.3 Screening of parameters.
The main effect plot is shown in Figure 8.1. The effect of stirring speed and reaction time
on p-NAP conversion is insignificant as shown in the figure. Based on the preliminary
studies, it can be concluded that increasing stirring speed more than 1000 rev/min does
not help to enhance total conversion of substrate.10
In order to eliminate mass transfer
effect entirely the stirring speed was maintained at 1500 rev/min. Reaction rate becomes
slower after high initial conversion and to achieve maximum conversion all experiments
are carried out for the duration of 8 hours. Catalyst concentration and MDEA
concentration is having a strong effect on p-NAP conversion, and the temperature is
having a weak effect on the conversion of p-NAP. p-NAP/ sulfide concentration ratio has
a negative impact on conversion. As p-Aminoacetophenone (p-AAP) is the only product
identified by GC-MS, p-NAP conversion is the only response chosen for our design as
100% selective product was obtained.
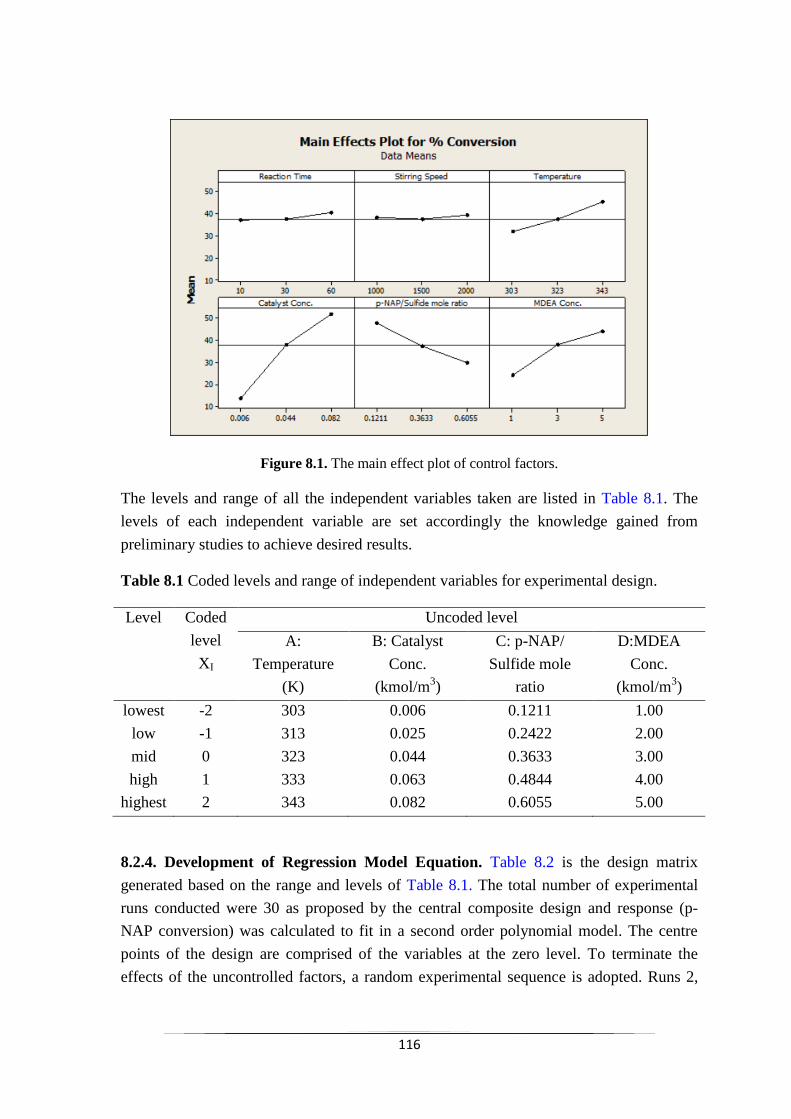
116
Figure 8.1. The main effect plot of control factors.
The levels and range of all the independent variables taken are listed in Table 8.1. The
levels of each independent variable are set accordingly the knowledge gained from
preliminary studies to achieve desired results.
Table 8.1 Coded levels and range of independent variables for experimental design.
Level Coded
level
XI
Uncoded level
A:
Temperature
(K)
B: Catalyst
Conc.
(kmol/m3)
C: p-NAP/
Sulfide mole
ratio
D:MDEA
Conc.
(kmol/m3)
lowest -2 303 0.006 0.1211 1.00
low -1 313 0.025 0.2422 2.00
mid 0 323 0.044 0.3633 3.00
high 1 333 0.063 0.4844 4.00
highest 2 343 0.082 0.6055 5.00
8.2.4. Development of Regression Model Equation. Table 8.2 is the design matrix
generated based on the range and levels of Table 8.1. The total number of experimental
runs conducted were 30 as proposed by the central composite design and response (p-
NAP conversion) was calculated to fit in a second order polynomial model. The centre
points of the design are comprised of the variables at the zero level. To terminate the
effects of the uncontrolled factors, a random experimental sequence is adopted. Runs 2,
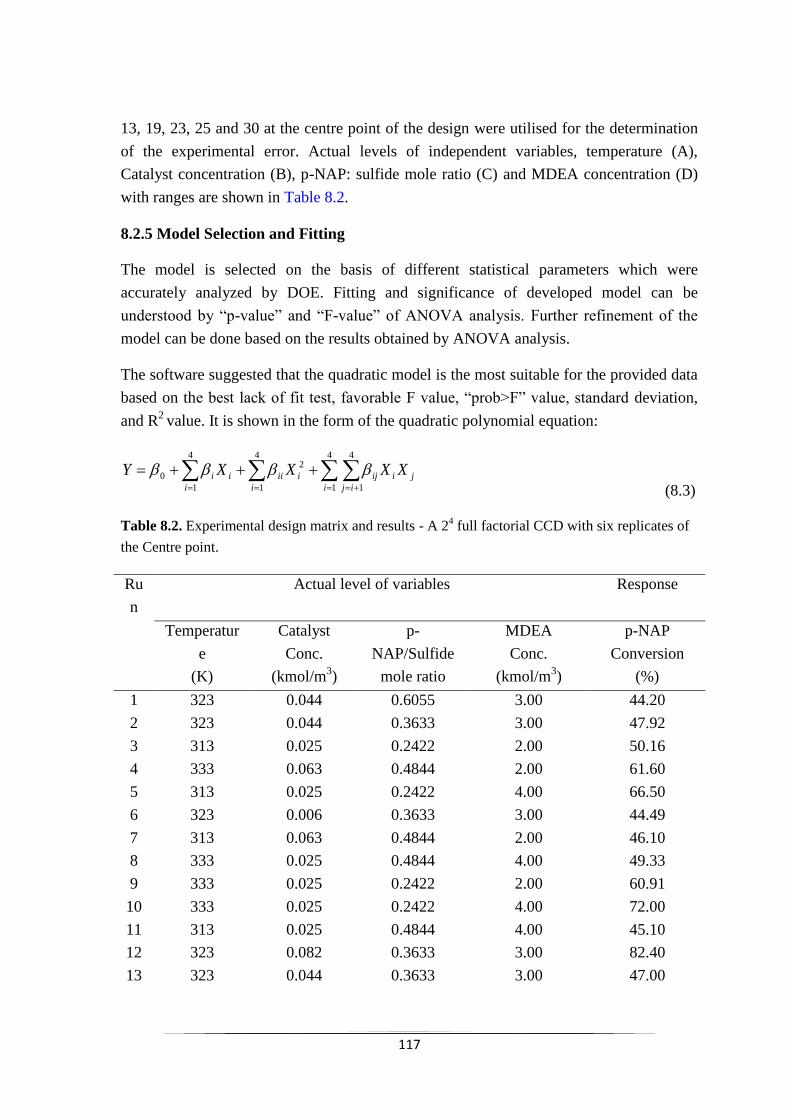
117
13, 19, 23, 25 and 30 at the centre point of the design were utilised for the determination
of the experimental error. Actual levels of independent variables, temperature (A),
Catalyst concentration (B), p-NAP: sulfide mole ratio (C) and MDEA concentration (D)
with ranges are shown in Table 8.2.
8.2.5 Model Selection and Fitting
The model is selected on the basis of different statistical parameters which were
accurately analyzed by DOE. Fitting and significance of developed model can be
understood by “p-value” and “F-value” of ANOVA analysis. Further refinement of the
model can be done based on the results obtained by ANOVA analysis.
The software suggested that the quadratic model is the most suitable for the provided data
based on the best lack of fit test, favorable F value, “prob>F” value, standard deviation,
and R2
value. It is shown in the form of the quadratic polynomial equation:
ji
i ij
iji
i
iii
i
i XXXXY
4
1
4
1
24
1
4
1
0
(8.3)
Table 8.2. Experimental design matrix and results - A 24 full factorial CCD with six replicates of
the Centre point.
Ru
n
Actual level of variables Response
Temperatur
e
(K)
Catalyst
Conc.
(kmol/m3)
p-
NAP/Sulfide
mole ratio
MDEA
Conc.
(kmol/m3)
p-NAP
Conversion
(%)
1 323 0.044 0.6055 3.00 44.20
2 323 0.044 0.3633 3.00 47.92
3 313 0.025 0.2422 2.00 50.16
4 333 0.063 0.4844 2.00 61.60
5 313 0.025 0.2422 4.00 66.50
6 323 0.006 0.3633 3.00 44.49
7 313 0.063 0.4844 2.00 46.10
8 333 0.025 0.4844 4.00 49.33
9 333 0.025 0.2422 2.00 60.91
10 333 0.025 0.2422 4.00 72.00
11 313 0.025 0.4844 4.00 45.10
12 323 0.082 0.3633 3.00 82.40
13 323 0.044 0.3633 3.00 47.00
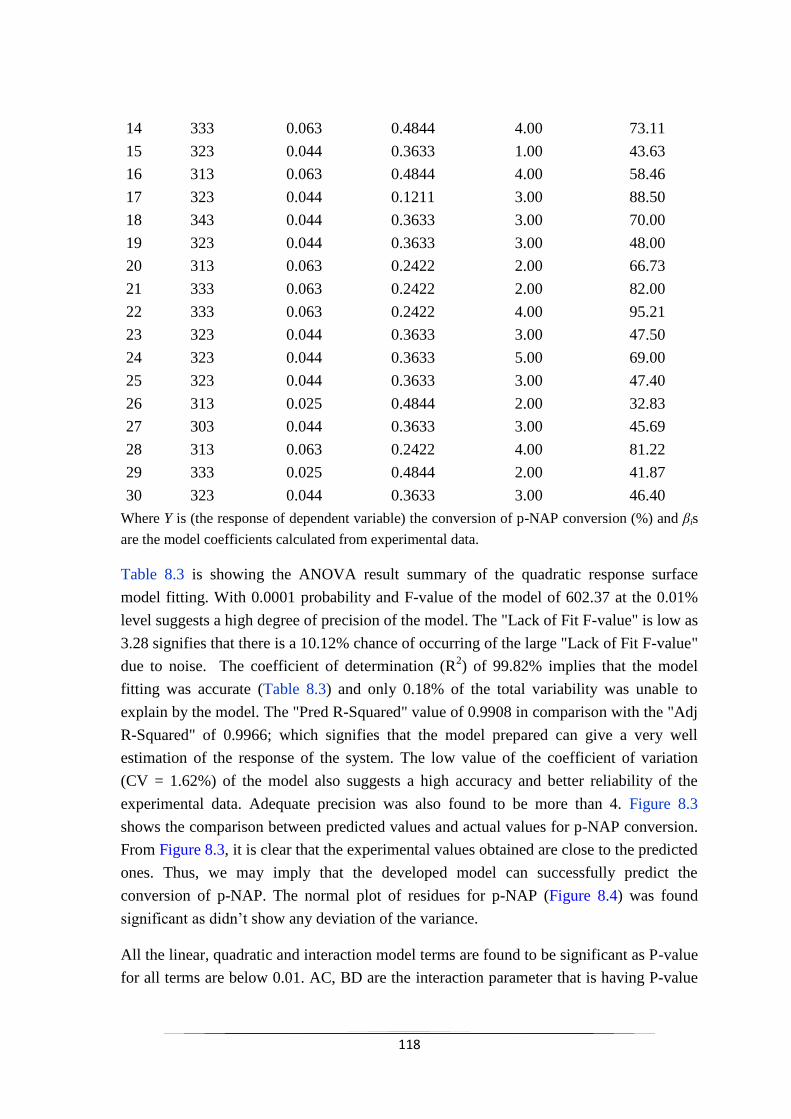
118
Where Y is (the response of dependent variable) the conversion of p-NAP conversion (%) and βis
are the model coefficients calculated from experimental data.
Table 8.3 is showing the ANOVA result summary of the quadratic response surface
model fitting. With 0.0001 probability and F-value of the model of 602.37 at the 0.01%
level suggests a high degree of precision of the model. The "Lack of Fit F-value" is low as
3.28 signifies that there is a 10.12% chance of occurring of the large "Lack of Fit F-value"
due to noise. The coefficient of determination (R2) of 99.82% implies that the model
fitting was accurate (Table 8.3) and only 0.18% of the total variability was unable to
explain by the model. The "Pred R-Squared" value of 0.9908 in comparison with the "Adj
R-Squared" of 0.9966; which signifies that the model prepared can give a very well
estimation of the response of the system. The low value of the coefficient of variation
(CV = 1.62%) of the model also suggests a high accuracy and better reliability of the
experimental data. Adequate precision was also found to be more than 4. Figure 8.3
shows the comparison between predicted values and actual values for p-NAP conversion.
From Figure 8.3, it is clear that the experimental values obtained are close to the predicted
ones. Thus, we may imply that the developed model can successfully predict the
conversion of p-NAP. The normal plot of residues for p-NAP (Figure 8.4) was found
significant as didn‟t show any deviation of the variance.
All the linear, quadratic and interaction model terms are found to be significant as P-value
for all terms are below 0.01. AC, BD are the interaction parameter that is having P-value
14 333 0.063 0.4844 4.00 73.11
15 323 0.044 0.3633 1.00 43.63
16 313 0.063 0.4844 4.00 58.46
17 323 0.044 0.1211 3.00 88.50
18 343 0.044 0.3633 3.00 70.00
19 323 0.044 0.3633 3.00 48.00
20 313 0.063 0.2422 2.00 66.73
21 333 0.063 0.2422 2.00 82.00
22 333 0.063 0.2422 4.00 95.21
23 323 0.044 0.3633 3.00 47.50
24 323 0.044 0.3633 5.00 69.00
25 323 0.044 0.3633 3.00 47.40
26 313 0.025 0.4844 2.00 32.83
27 303 0.044 0.3633 3.00 45.69
28 313 0.063 0.2422 4.00 81.22
29 333 0.025 0.4844 2.00 41.87
30 323 0.044 0.3633 3.00 46.40
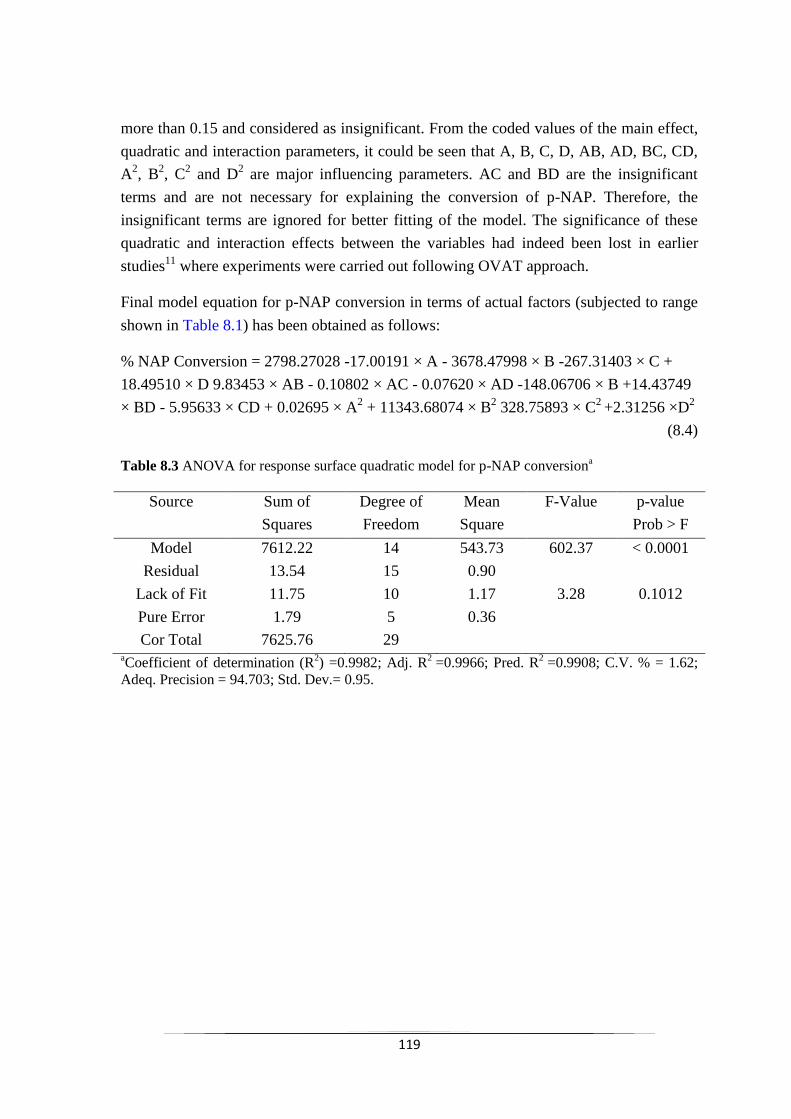
119
more than 0.15 and considered as insignificant. From the coded values of the main effect,
quadratic and interaction parameters, it could be seen that A, B, C, D, AB, AD, BC, CD,
A2, B
2, C
2 and D
2 are major influencing parameters. AC and BD are the insignificant
terms and are not necessary for explaining the conversion of p-NAP. Therefore, the
insignificant terms are ignored for better fitting of the model. The significance of these
quadratic and interaction effects between the variables had indeed been lost in earlier
studies11
where experiments were carried out following OVAT approach.
Final model equation for p-NAP conversion in terms of actual factors (subjected to range
shown in Table 8.1) has been obtained as follows:
% NAP Conversion = 2798.27028 -17.00191 × A - 3678.47998 × B -267.31403 × C +
18.49510 × D 9.83453 × AB - 0.10802 × AC - 0.07620 × AD -148.06706 × B +14.43749
× BD - 5.95633 × CD + 0.02695 × A2 + 11343.68074 × B
2 328.75893 × C
2 +2.31256 ×D
2
(8.4)
Table 8.3 ANOVA for response surface quadratic model for p-NAP conversiona
Source Sum of
Squares
Degree of
Freedom
Mean
Square
F-Value p-value
Prob > F
Model 7612.22 14 543.73 602.37 < 0.0001
Residual 13.54 15 0.90
Lack of Fit 11.75 10 1.17 3.28 0.1012
Pure Error 1.79 5 0.36
Cor Total 7625.76 29 aCoefficient of determination (R
2) =0.9982; Adj. R
2 =0.9966; Pred. R
2 =0.9908; C.V. % = 1.62;
Adeq. Precision = 94.703; Std. Dev.= 0.95.
120
Figure 8.2 Plot of predicted values versus actual values for p-NAP conversion.
Figure 8.3 Normal plot of residuals for p-NAP conversion.
8.2.6. Model Analysis.
121
The regression analysis suggests that the p-NAP conversion was affected by Temperature
(A), Catalyst conc. (B), p-NAP: Sulfide mole ratio (C), MDEA Conc. (D) and their
respective higher order terms (A2, B
2, C
2, D
2). The interaction between Temperatures –
catalyst conc. (AB) is most significant. Moderate significant terms are temperature –
MDEA conc. (AD), p-NAP: sulfide mole ratio – MDEA conc. (CD) and least significant
interaction term is catalyst – p-NAP: sulfide mole ratio (BC). So, the value of each
coefficient in the equation (8.4) symbolizes the extent of the influence made by the
specific variable and sign signifies whether the effect is positive or negative. Earlier
studies on a similar type of system3 showed only the variation of responses with each
parameter without giving any clue to the comparative influence of each main effect on
each response.
8.2.7. Response surface analysis.
3D surface and contour plots are the graphical representation of the regression equations
implemented to achieve or predict the optimum influence of variables and to gain a better
understanding of combined interaction variables the range provided.12,13
3D surface plots
show not only the combined but also the sole impact of the variables on the response.
While the circular or elliptical nature of the contour (2D) helps to identify the major
interactions between the process variables.
Figure 8.4A & 8.4B shows the interaction effect of catalyst concentration and temperature
on the conversion of p-NAP. Conversion increased with the increase of catalyst
concentration and temperature, either individually or combined. The catalyst
concentration is having pronounced effect on conversion. Highest conversion of 71%
achieved with 0.063 kmol/m3 catalyst concentration and at 333K temperature. As the
catalyst loading increased the number of active catalyst increase in the reaction mixture
and so the conversion. The transition state theory explains that the rates of most organic
reactions can be enhanced by the increase of reaction temperature, and the collision
theory suggests that at higher temperature the number of effective collision between
molecules increases and hence the rate of reaction also increases. Reaction under PTC
mode also shows similar observations. It is evident from the Figure (8.4A & 8.4B) that
the conversion of p-NAP amplifies with an increase in the temperature.
The Figure 8.4C & 8.4D shows the interaction between MDEA concentration ratio and
temperature on p-NAP conversion. The effect of MDEA concentration has a positive
influence on p-NAP conversion and the effect of temperature if very feeble. MDEA does
not react with p-NAP but it is affecting equilibrium among MDEA-H2S-water and which
is dominated by sulfide and hydrosulfide anions. With more MDEA concentration the
equilibrium between active anions shift towards more concentration of sulfide anions and
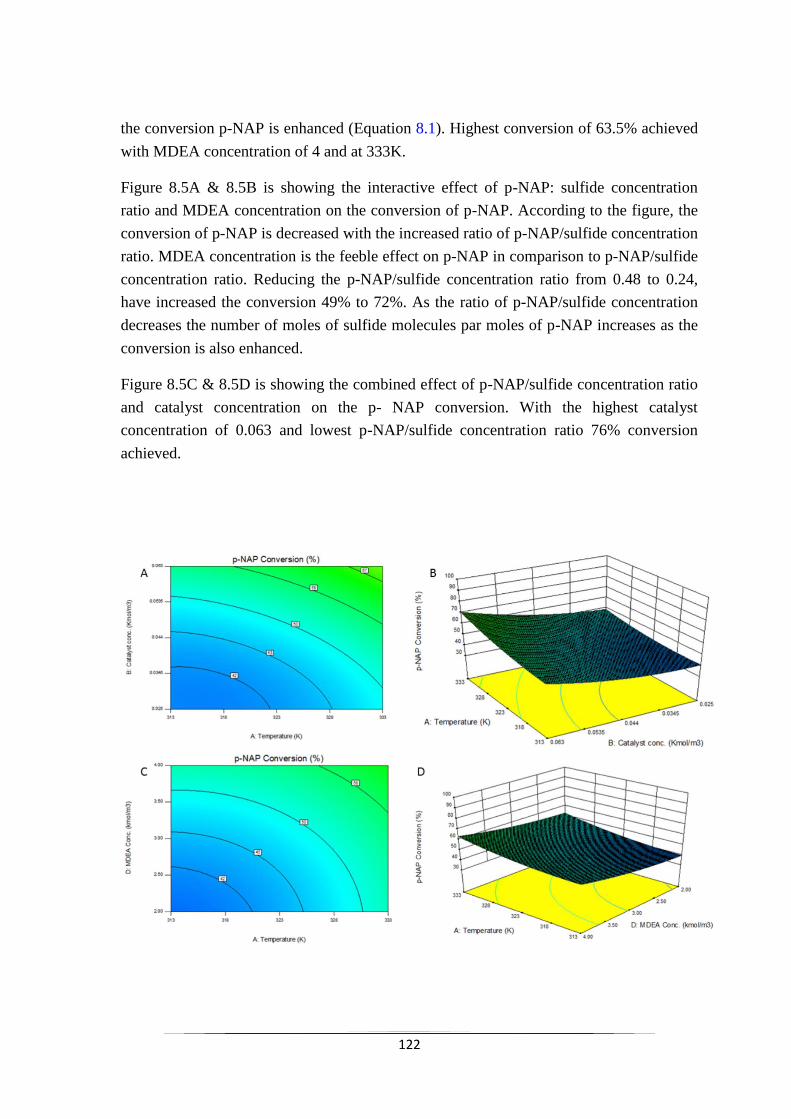
122
the conversion p-NAP is enhanced (Equation 8.1). Highest conversion of 63.5% achieved
with MDEA concentration of 4 and at 333K.
Figure 8.5A & 8.5B is showing the interactive effect of p-NAP: sulfide concentration
ratio and MDEA concentration on the conversion of p-NAP. According to the figure, the
conversion of p-NAP is decreased with the increased ratio of p-NAP/sulfide concentration
ratio. MDEA concentration is the feeble effect on p-NAP in comparison to p-NAP/sulfide
concentration ratio. Reducing the p-NAP/sulfide concentration ratio from 0.48 to 0.24,
have increased the conversion 49% to 72%. As the ratio of p-NAP/sulfide concentration
decreases the number of moles of sulfide molecules par moles of p-NAP increases as the
conversion is also enhanced.
Figure 8.5C & 8.5D is showing the combined effect of p-NAP/sulfide concentration ratio
and catalyst concentration on the p- NAP conversion. With the highest catalyst
concentration of 0.063 and lowest p-NAP/sulfide concentration ratio 76% conversion
achieved.
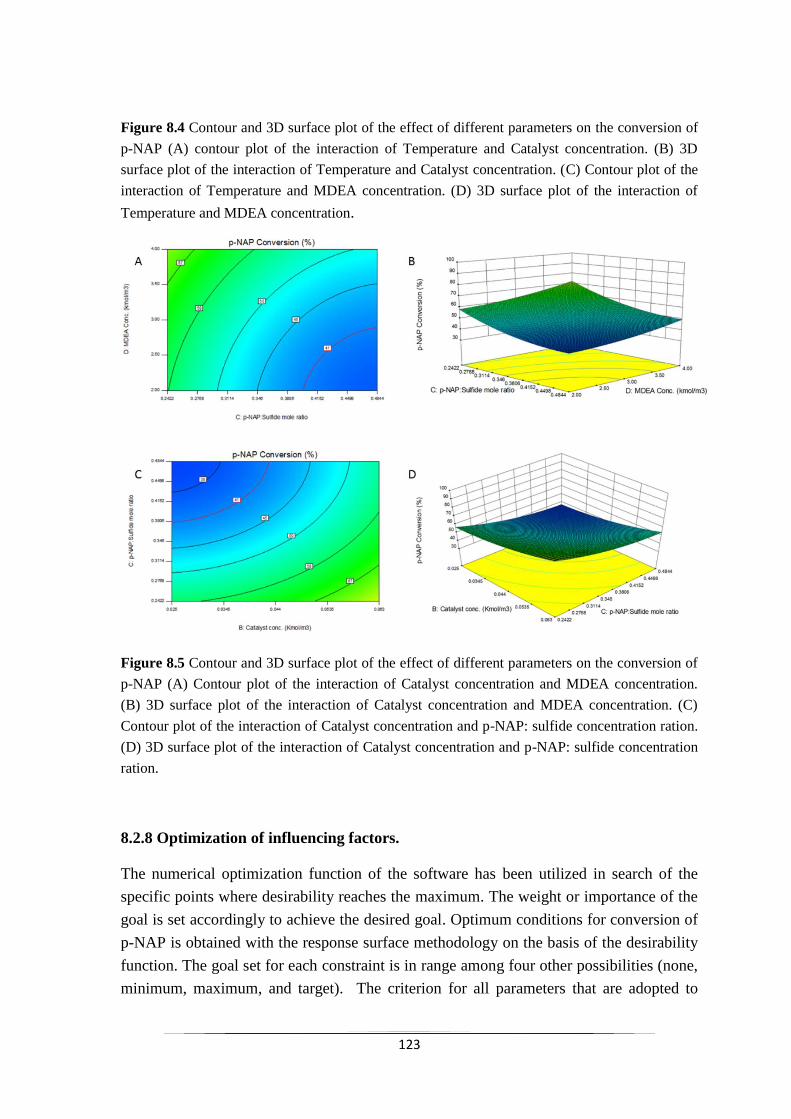
123
Figure 8.4 Contour and 3D surface plot of the effect of different parameters on the conversion of
p-NAP (A) contour plot of the interaction of Temperature and Catalyst concentration. (B) 3D
surface plot of the interaction of Temperature and Catalyst concentration. (C) Contour plot of the
interaction of Temperature and MDEA concentration. (D) 3D surface plot of the interaction of
Temperature and MDEA concentration.
Figure 8.5 Contour and 3D surface plot of the effect of different parameters on the conversion of
p-NAP (A) Contour plot of the interaction of Catalyst concentration and MDEA concentration.
(B) 3D surface plot of the interaction of Catalyst concentration and MDEA concentration. (C)
Contour plot of the interaction of Catalyst concentration and p-NAP: sulfide concentration ration.
(D) 3D surface plot of the interaction of Catalyst concentration and p-NAP: sulfide concentration
ration.
8.2.8 Optimization of influencing factors.
The numerical optimization function of the software has been utilized in search of the
specific points where desirability reaches the maximum. The weight or importance of the
goal is set accordingly to achieve the desired goal. Optimum conditions for conversion of
p-NAP is obtained with the response surface methodology on the basis of the desirability
function. The goal set for each constraint is in range among four other possibilities (none,
minimum, maximum, and target). The criterion for all parameters that are adopted to
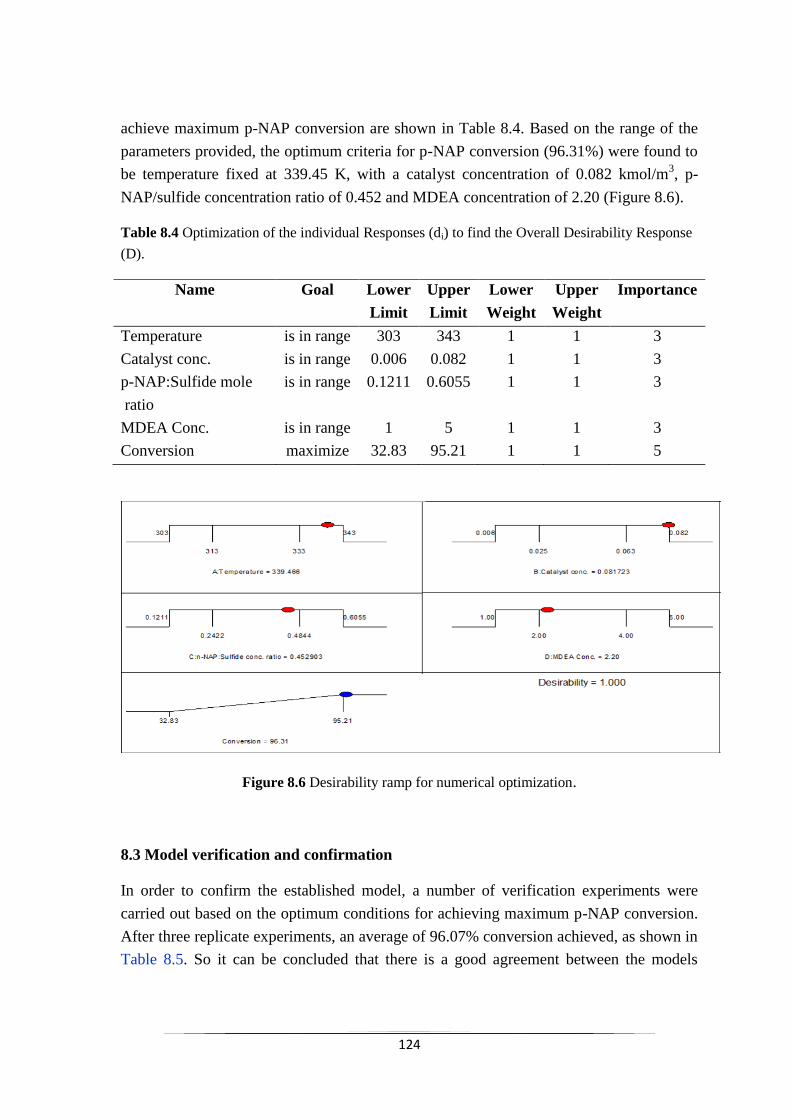
124
achieve maximum p-NAP conversion are shown in Table 8.4. Based on the range of the
parameters provided, the optimum criteria for p-NAP conversion (96.31%) were found to
be temperature fixed at 339.45 K, with a catalyst concentration of 0.082 kmol/m3, p-
NAP/sulfide concentration ratio of 0.452 and MDEA concentration of 2.20 (Figure 8.6).
Table 8.4 Optimization of the individual Responses (di) to find the Overall Desirability Response
(D).
Name Goal Lower
Limit
Upper
Limit
Lower
Weight
Upper
Weight
Importance
Temperature is in range 303 343 1 1 3
Catalyst conc. is in range 0.006 0.082 1 1 3
p-NAP:Sulfide mole
ratio
is in range 0.1211 0.6055 1 1 3
MDEA Conc. is in range 1 5 1 1 3
Conversion maximize 32.83 95.21 1 1 5
Figure 8.6 Desirability ramp for numerical optimization.
8.3 Model verification and confirmation
In order to confirm the established model, a number of verification experiments were
carried out based on the optimum conditions for achieving maximum p-NAP conversion.
After three replicate experiments, an average of 96.07% conversion achieved, as shown in
Table 8.5. So it can be concluded that there is a good agreement between the models
125
predicted value and experimental value and thus the validity of the model simulated for p-
NAP is confirm.
Table 8.5. Results of validation experimentsa.
Run No. Conversion% Selectivity%
1 96.0 100.0
2 96.12 100.0
3 96.09 100.0
Average 96.07 100.0
Predicted by Eq. (5) 96.07 - a
Experiments conducted at conditions: Temperature = 339.5K; Catalyst conc. =0.082 kmol/m3; p-
NAP: Sulfide mole ratio=0.452; MDEA Conc. = 2.20 kmol/m3.
8.4 Conclusion
Based on experimental design methodology a statistical model of single response surface
optimization was carried out on the liquid-liquid phase transfer catalyzed the reaction of
p-NAP with H2S-ladden MDEA. A quadratic model developed based on the relationship
between p-NAP conversion and four independent variables (temperature, catalyst conc.,
p-NAP/sulfide mole ratio and MDEA conc.). The contour plots, 3D surface plots and the
value of different regression coefficients have clearly explained the single parameter
effect and interaction effects of dual parameters on the p-NAP conversion. The model fits
well and is verified with optimum conditions for highest p-NAP conversion. R2 value of
the regression analysis confirms a good agreement between the experimental data and
predicted response. From the response surface analysis it is very clear that temperature
and catalyst loading in the reaction system amplifies the reaction rate and product yield.
The concentration of MDEA and concentration sulphide ions increase in the reaction
system enhances the reaction rate and reactant conversion also. Figure 8.7 shows the MS
Spectra of the product 3-aminoacetophenone.
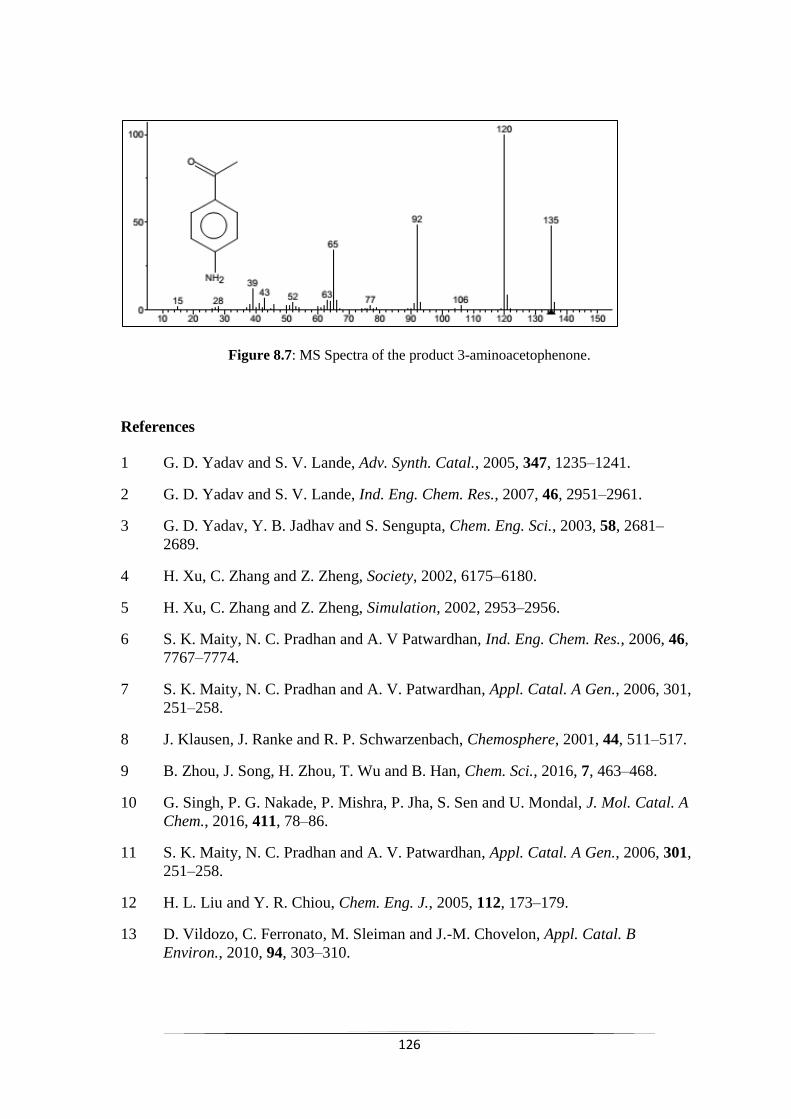
126
Figure 8.7: MS Spectra of the product 3-aminoacetophenone.
References
1 G. D. Yadav and S. V. Lande, Adv. Synth. Catal., 2005, 347, 1235–1241.
2 G. D. Yadav and S. V. Lande, Ind. Eng. Chem. Res., 2007, 46, 2951–2961.
3 G. D. Yadav, Y. B. Jadhav and S. Sengupta, Chem. Eng. Sci., 2003, 58, 2681–
2689.
4 H. Xu, C. Zhang and Z. Zheng, Society, 2002, 6175–6180.
5 H. Xu, C. Zhang and Z. Zheng, Simulation, 2002, 2953–2956.
6 S. K. Maity, N. C. Pradhan and A. V Patwardhan, Ind. Eng. Chem. Res., 2006, 46,
7767–7774.
7 S. K. Maity, N. C. Pradhan and A. V. Patwardhan, Appl. Catal. A Gen., 2006, 301,
251–258.
8 J. Klausen, J. Ranke and R. P. Schwarzenbach, Chemosphere, 2001, 44, 511–517.
9 B. Zhou, J. Song, H. Zhou, T. Wu and B. Han, Chem. Sci., 2016, 7, 463–468.
10 G. Singh, P. G. Nakade, P. Mishra, P. Jha, S. Sen and U. Mondal, J. Mol. Catal. A
Chem., 2016, 411, 78–86.
11 S. K. Maity, N. C. Pradhan and A. V. Patwardhan, Appl. Catal. A Gen., 2006, 301,
251–258.
12 H. L. Liu and Y. R. Chiou, Chem. Eng. J., 2005, 112, 173–179.
13 D. Vildozo, C. Ferronato, M. Sleiman and J.-M. Chovelon, Appl. Catal. B
Environ., 2010, 94, 303–310.
127
Abstract
Selective reduction of one of the nitro group present in dinitro aromatic compounds by a
novel Zinin reagent, H2S-laden N-methyldiethanolamine (MDEA) solution, has been
explored in the presence of Tetra-n-butyl phosphonium bromide (TBPB) as phase transfer
catalyst (PTC) under the liquid-liquid (L-L) mode of reaction. Under the present
condition, reduction 2,4-dinitrotoluene (2,4-DNT) with H2S-laden MDEA leads to the
selective reduction of one nitro group present either at the fourth position to obtain 4-
amino-2-nitrotoluene (4A2NT) or at the second position to get 2-amino-4-nitrotoluene
(2A4NT).
9.1 Introduction
Selective reduction of one of the nitro group present in dinitro aromatic compounds by a
novel Zinin reagent, H2S-laden N-methyldiethanolamine (MDEA) solution, has been
explored in the presence of Tetra-n-butyl phosphonium bromide (TBPB) as phase transfer
catalyst (PTC) under the liquid-liquid (L-L) mode of reaction. Under the present
condition, reduction 2,4-dinitrotoluene (2,4-DNT) with H2S-laden MDEA leads to the
selective reduction of one nitro group present either at the fourth position to obtain 4-
amino-2-nitrotoluene (4A2NT) or at the second position to get 2-amino-4-nitrotoluene
(2A4NT). The reaction was very fast to achieve 100% conversion, and the selectivity of
4A2NT is much higher than the 2A4NT. A detailed parametric study was performed to
analyse the effect of parameters on 2,4-DNT conversion and selectivity of both the
isomers. The apparent activation energy was found to be as high as 46.25 kJ/mol, which
indicates that the reaction was kinetically controlled. A mathematical model has been
developed for the complex system, and it was validated against the experimental data.
The present system dealt with an industrial problem in dealing with H2S, present in by-
product gaseous streams of many petroleum and natural gas industries. Novelties in the
selective mono-reduction lie in that fact that the reaction was done at room temperature
(303 K), with a novel reagent, H2S-laden MDEA solution. Therefore waste-minimization
was effected to yield a value-added fine chemicals, i.e., amines.
9.2 Results and Discussion
Two products namely 4-amino-2-nitrotoluene (4A2NT) and 2-amino-4-nitrotoluene
(2A4NT) were identified by GC-MS (Agilent 5977A model). No diamines or other
products like nitroso or hydroxylamine were found out. So, the overall reaction can be
written as follows:
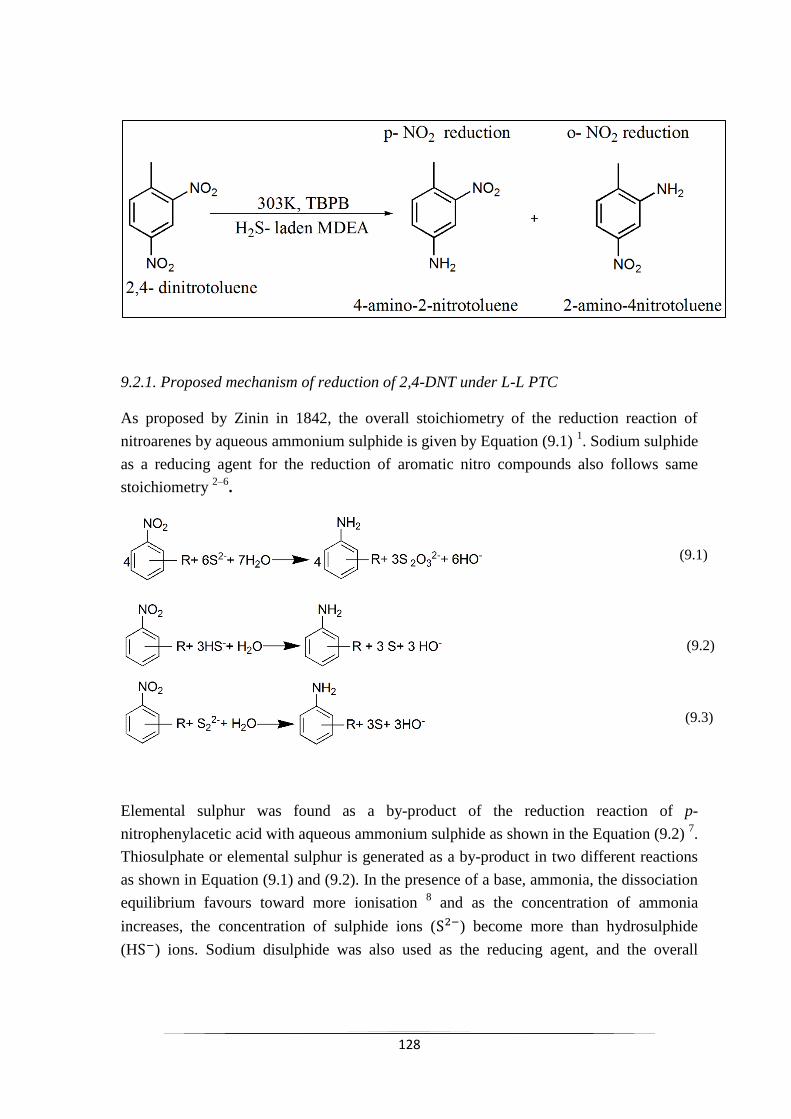
128
9.2.1. Proposed mechanism of reduction of 2,4-DNT under L-L PTC
As proposed by Zinin in 1842, the overall stoichiometry of the reduction reaction of
nitroarenes by aqueous ammonium sulphide is given by Equation (9.1) 1. Sodium sulphide
as a reducing agent for the reduction of aromatic nitro compounds also follows same
stoichiometry 2–6
.
Elemental sulphur was found as a by-product of the reduction reaction of p-
nitrophenylacetic acid with aqueous ammonium sulphide as shown in the Equation (9.2) 7.
Thiosulphate or elemental sulphur is generated as a by-product in two different reactions
as shown in Equation (9.1) and (9.2). In the presence of a base, ammonia, the dissociation
equilibrium favours toward more ionisation 8 and as the concentration of ammonia
increases, the concentration of sulphide ions ( ) become more than hydrosulphide
(H ) ions. Sodium disulphide was also used as the reducing agent, and the overall
(9.1)
(9.2)
(9.3)
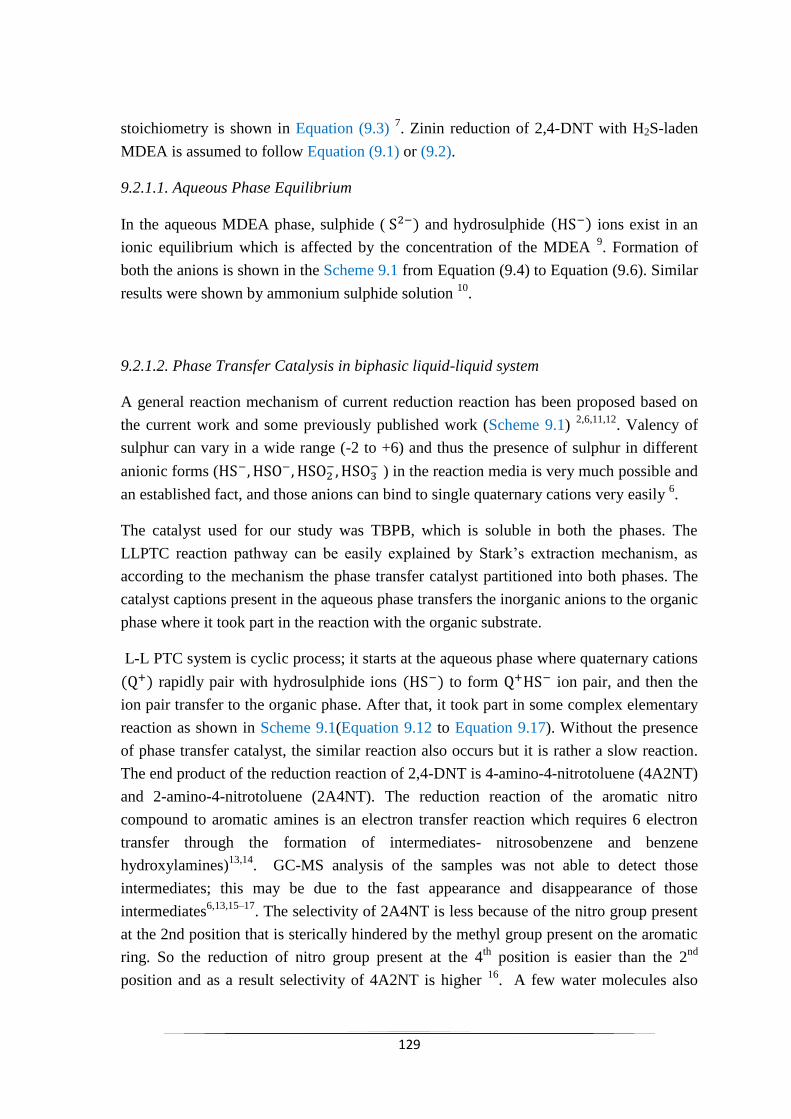
129
stoichiometry is shown in Equation (9.3) 7. Zinin reduction of 2,4-DNT with H2S-laden
MDEA is assumed to follow Equation (9.1) or (9.2).
9.2.1.1. Aqueous Phase Equilibrium
In the aqueous MDEA phase, sulphide ( and hydrosulphide ions exist in an
ionic equilibrium which is affected by the concentration of the MDEA 9. Formation of
both the anions is shown in the Scheme 9.1 from Equation (9.4) to Equation (9.6). Similar
results were shown by ammonium sulphide solution 10
.
9.2.1.2. Phase Transfer Catalysis in biphasic liquid-liquid system
A general reaction mechanism of current reduction reaction has been proposed based on
the current work and some previously published work (Scheme 9.1) 2,6,11,12
. Valency of
sulphur can vary in a wide range (-2 to +6) and thus the presence of sulphur in different
anionic forms (
) in the reaction media is very much possible and
an established fact, and those anions can bind to single quaternary cations very easily 6.
The catalyst used for our study was TBPB, which is soluble in both the phases. The
LLPTC reaction pathway can be easily explained by Stark‟s extraction mechanism, as
according to the mechanism the phase transfer catalyst partitioned into both phases. The
catalyst captions present in the aqueous phase transfers the inorganic anions to the organic
phase where it took part in the reaction with the organic substrate.
L-L PTC system is cyclic process; it starts at the aqueous phase where quaternary cations
rapidly pair with hydrosulphide ions to form ion pair, and then the
ion pair transfer to the organic phase. After that, it took part in some complex elementary
reaction as shown in Scheme 9.1(Equation 9.12 to Equation 9.17). Without the presence
of phase transfer catalyst, the similar reaction also occurs but it is rather a slow reaction.
The end product of the reduction reaction of 2,4-DNT is 4-amino-4-nitrotoluene (4A2NT)
and 2-amino-4-nitrotoluene (2A4NT). The reduction reaction of the aromatic nitro
compound to aromatic amines is an electron transfer reaction which requires 6 electron
transfer through the formation of intermediates- nitrosobenzene and benzene
hydroxylamines)13,14
. GC-MS analysis of the samples was not able to detect those
intermediates; this may be due to the fast appearance and disappearance of those
intermediates6,13,15–17
. The selectivity of 2A4NT is less because of the nitro group present
at the 2nd position that is sterically hindered by the methyl group present on the aromatic
ring. So the reduction of nitro group present at the 4th
position is easier than the 2nd
position and as a result selectivity of 4A2NT is higher 16
. A few water molecules also
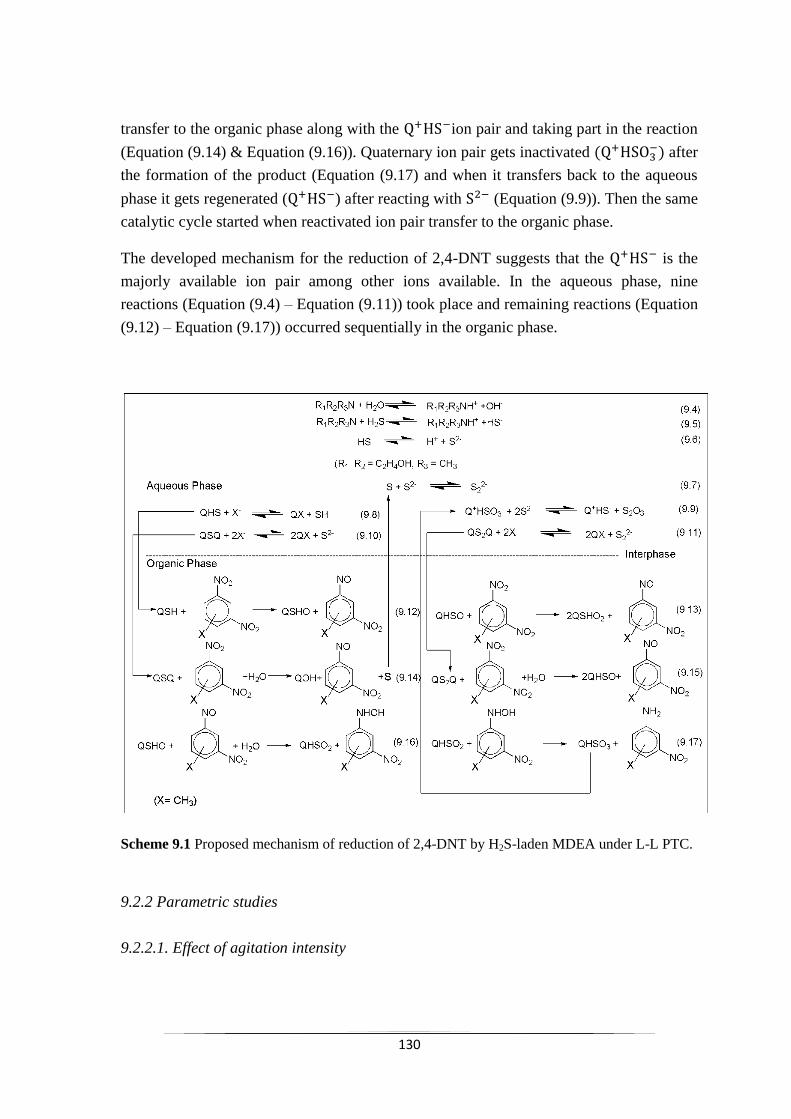
130
transfer to the organic phase along with the ion pair and taking part in the reaction
(Equation (9.14) & Equation (9.16)). Quaternary ion pair gets inactivated after
the formation of the product (Equation (9.17) and when it transfers back to the aqueous
phase it gets regenerated ( ) after reacting with (Equation (9.9)). Then the same
catalytic cycle started when reactivated ion pair transfer to the organic phase.
The developed mechanism for the reduction of 2,4-DNT suggests that the is the
majorly available ion pair among other ions available. In the aqueous phase, nine
reactions (Equation (9.4) – Equation (9.11)) took place and remaining reactions (Equation
(9.12) – Equation (9.17)) occurred sequentially in the organic phase.
Scheme 9.1 Proposed mechanism of reduction of 2,4-DNT by H2S-laden MDEA under L-L PTC.
9.2.2 Parametric studies
9.2.2.1. Effect of agitation intensity
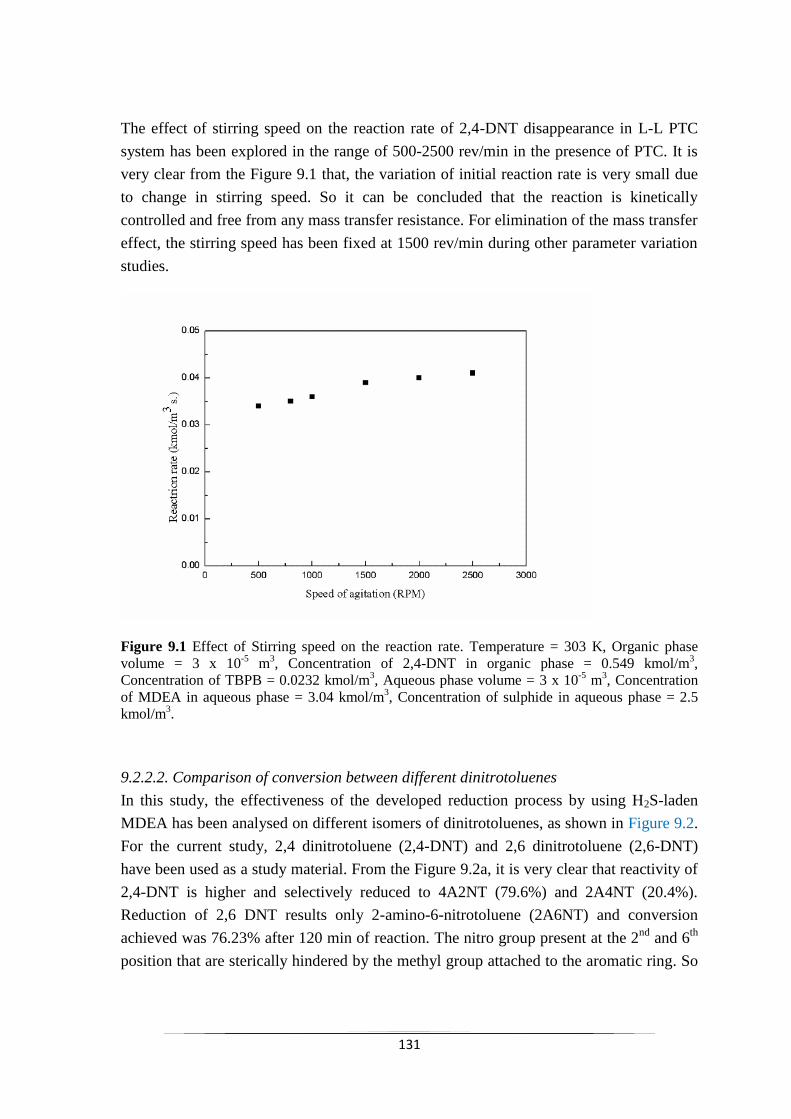
131
The effect of stirring speed on the reaction rate of 2,4-DNT disappearance in L-L PTC
system has been explored in the range of 500-2500 rev/min in the presence of PTC. It is
very clear from the Figure 9.1 that, the variation of initial reaction rate is very small due
to change in stirring speed. So it can be concluded that the reaction is kinetically
controlled and free from any mass transfer resistance. For elimination of the mass transfer
effect, the stirring speed has been fixed at 1500 rev/min during other parameter variation
studies.
Figure 9.1 Effect of Stirring speed on the reaction rate. Temperature = 303 K, Organic phase
volume = 3 x 10⁻⁵
m3, Concentration of 2,4-DNT in organic phase = 0.549 kmol/m
3,
Concentration of TBPB = 0.0232 kmol/m3, Aqueous phase volume = 3 x 10
-5 m
3, Concentration
of MDEA in aqueous phase = 3.04 kmol/m3, Concentration of sulphide in aqueous phase = 2.5
kmol/m3.
9.2.2.2. Comparison of conversion between different dinitrotoluenes
In this study, the effectiveness of the developed reduction process by using H2S-laden
MDEA has been analysed on different isomers of dinitrotoluenes, as shown in Figure 9.2.
For the current study, 2,4 dinitrotoluene (2,4-DNT) and 2,6 dinitrotoluene (2,6-DNT)
have been used as a study material. From the Figure 9.2a, it is very clear that reactivity of
2,4-DNT is higher and selectively reduced to 4A2NT (79.6%) and 2A4NT (20.4%).
Reduction of 2,6 DNT results only 2-amino-6-nitrotoluene (2A6NT) and conversion
achieved was 76.23% after 120 min of reaction. The nitro group present at the 2nd
and 6th
position that are sterically hindered by the methyl group attached to the aromatic ring. So
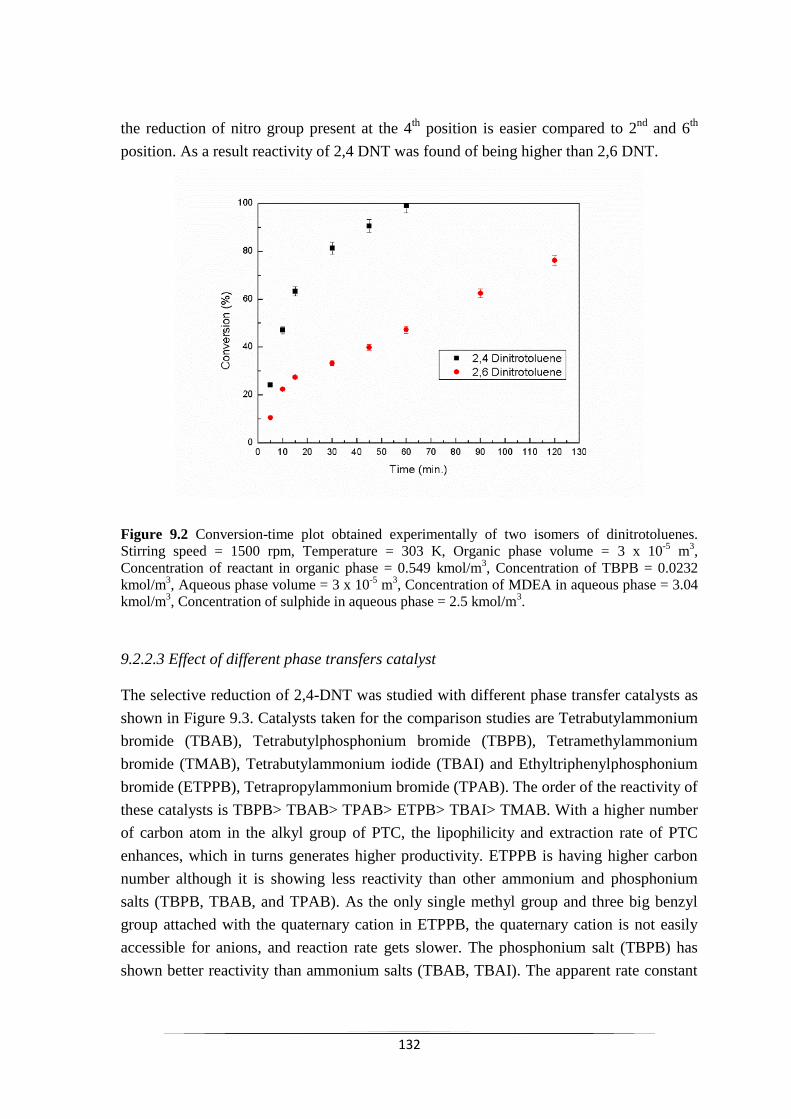
132
the reduction of nitro group present at the 4th
position is easier compared to 2nd
and 6th
position. As a result reactivity of 2,4 DNT was found of being higher than 2,6 DNT.
Figure 9.2 Conversion-time plot obtained experimentally of two isomers of dinitrotoluenes.
Stirring speed = 1500 rpm, Temperature = 303 K, Organic phase volume = 3 x 10⁻⁵
m3,
Concentration of reactant in organic phase = 0.549 kmol/m3, Concentration of TBPB = 0.0232
kmol/m3, Aqueous phase volume = 3 x 10
-5 m
3, Concentration of MDEA in aqueous phase = 3.04
kmol/m3, Concentration of sulphide in aqueous phase = 2.5 kmol/m
3.
9.2.2.3 Effect of different phase transfers catalyst
The selective reduction of 2,4-DNT was studied with different phase transfer catalysts as
shown in Figure 9.3. Catalysts taken for the comparison studies are Tetrabutylammonium
bromide (TBAB), Tetrabutylphosphonium bromide (TBPB), Tetramethylammonium
bromide (TMAB), Tetrabutylammonium iodide (TBAI) and Ethyltriphenylphosphonium
bromide (ETPPB), Tetrapropylammonium bromide (TPAB). The order of the reactivity of
these catalysts is TBPB> TBAB> TPAB> ETPB> TBAI> TMAB. With a higher number
of carbon atom in the alkyl group of PTC, the lipophilicity and extraction rate of PTC
enhances, which in turns generates higher productivity. ETPPB is having higher carbon
number although it is showing less reactivity than other ammonium and phosphonium
salts (TBPB, TBAB, and TPAB). As the only single methyl group and three big benzyl
group attached with the quaternary cation in ETPPB, the quaternary cation is not easily
accessible for anions, and reaction rate gets slower. The phosphonium salt (TBPB) has
shown better reactivity than ammonium salts (TBAB, TBAI). The apparent rate constant
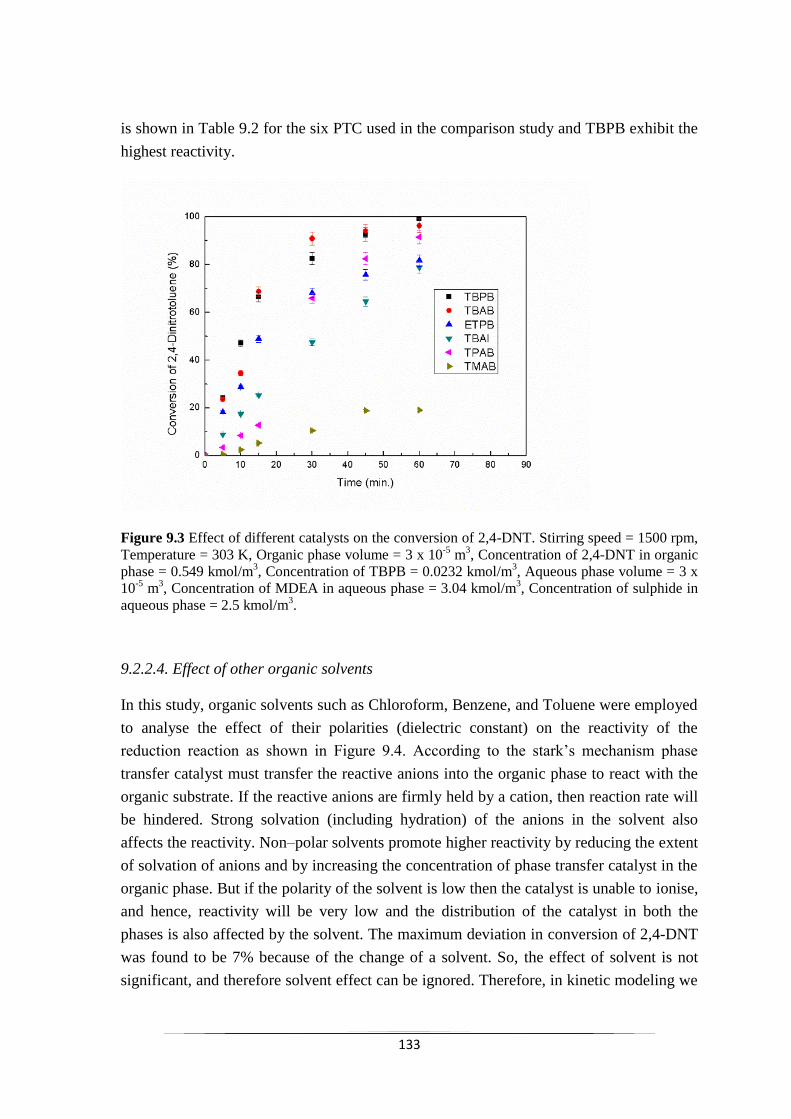
133
is shown in Table 9.2 for the six PTC used in the comparison study and TBPB exhibit the
highest reactivity.
Figure 9.3 Effect of different catalysts on the conversion of 2,4-DNT. Stirring speed = 1500 rpm,
Temperature = 303 K, Organic phase volume = 3 x 10⁻⁵
m3, Concentration of 2,4-DNT in organic
phase = 0.549 kmol/m3, Concentration of TBPB = 0.0232 kmol/m
3, Aqueous phase volume = 3 x
10-5
m3, Concentration of MDEA in aqueous phase = 3.04 kmol/m
3, Concentration of sulphide in
aqueous phase = 2.5 kmol/m3.
9.2.2.4. Effect of other organic solvents
In this study, organic solvents such as Chloroform, Benzene, and Toluene were employed
to analyse the effect of their polarities (dielectric constant) on the reactivity of the
reduction reaction as shown in Figure 9.4. According to the stark‟s mechanism phase
transfer catalyst must transfer the reactive anions into the organic phase to react with the
organic substrate. If the reactive anions are firmly held by a cation, then reaction rate will
be hindered. Strong solvation (including hydration) of the anions in the solvent also
affects the reactivity. Non–polar solvents promote higher reactivity by reducing the extent
of solvation of anions and by increasing the concentration of phase transfer catalyst in the
organic phase. But if the polarity of the solvent is low then the catalyst is unable to ionise,
and hence, reactivity will be very low and the distribution of the catalyst in both the
phases is also affected by the solvent. The maximum deviation in conversion of 2,4-DNT
was found to be 7% because of the change of a solvent. So, the effect of solvent is not
significant, and therefore solvent effect can be ignored. Therefore, in kinetic modeling we
134
didn‟t consider the solvent effect.The dielectric constant of the solvents used is in order of
Chloroform> Benzene> Toluene. And the conversion (and reactivity) of 2,4-DNT in the
solvents follows in the order Benzene> Toluene> Chloroform. Thus, in the current
reaction system, toluene has been used as an effective solvent. . Like in our present case,
toluene was found to be a better solvent in other biphasic phase transfer catalytic reaction
systems 19
Figure 9.4. Effect of different solvents on the conversion of 2,4-DNT. Stirring speed = 1500 rpm,
Temperature = 303 K, Organic phase volume = 3 x 10⁻⁵
m3, Concentration of 2,4-DNT in organic
phase = 0.549 kmol/m3, Concentration of TBPB = 0.0232 kmol/m
3, Aqueous phase volume = 3 x
10-5
m3, Concentration of MDEA in aqueous phase = 3.04 kmol/m
3, Concentration of sulphide in
aqueous phase = 2.5 kmol/m3.
9.2.3.5. Effect of temperature of the reaction
To study the effect of temperature on the conversion of 2,4-DNT in L-L PTC system the
temperature of the reaction is varied in the range of 313–343K and rest of all reaction
conditions were kept same (Figure 9.5a). From the theory of transition state, the rate of a
reaction increases with the rise in temperature because increasing temperature provides
the energy required to overcome the reaction barrier. It is evident from the figure that the
temperature variation has a great impact on reactivity (conversion) of 2,4-DNT. With
increasing temperature, the collision between reactant molecules are becoming more
frequent, and thus reaction rate gets enhanced.
135
(a)
(b)
136
(c)
Figure 9.5. Effect of temperature on (a) the conversion of 2,4-DNT and (b) selectivity of 4A2NT
& 2A4NT with respect to temperature and (c) selectivity of 4A2NT with respect to reaction time.
Stirring speed = 1500 rpm, Organic phase volume = 3 x 10⁻⁵
m3, Concentration of 2,4-DNT in
organic phase = 0.549 kmol/m3, Concentration of TBPB = 0.0232 kmol/m
3, Aqueous phase
volume = 3 x 10⁻⁵
m3, Concentration of MDEA in aqueous phase = 3.04 kmol/m
3, Concentration
of sulphide in aqueous phase = 2.5 kmol/m3.
Figure 9.6. Arrhenius plot of ln (Initial Reaction Rate) vs. 1/T. All other conditions are
same as Figure 9.5.
137
The initial rates at different temperatures were determined, and Arrhenius plot of ln
(initial rate) vs. 1/T was made (Figure 9.6). The slope of the best fitted straight line gives
us apparent activation energy as 46.25 kJ/mol. As the value of the apparent activation
energy is high, the reaction is kinetically controlled. The activation energy of the same
order of magnitude has been obtained in selective reduction of other nitro-compounds and
there also, it was proposed to be kinetically controlled one 6,10
. As the conversion reached
100% after 60 min. of reaction for each temperature study, selectivity plot (Figure 9.5b) is
drawn based on the data of 30 min. of reaction. The selectivity of the two isomers of
aminonitrotoluene follows different trends with increasing temperature although there
was an enhancement of the overall conversion of 2,4-DNT. From the plot Figure 9.5c it is
clear that with increasing temperature, selectivity of 4A2NT has decreased.
9.2.2.6. Effect of Catalyst Concentration
To study the effect of catalyst concentration, at five different catalyst concentrations (0 –
0.093 kmol/m3), the conversion of 2,4-DNT was determined and is shown in Figure 9.7a,
keeping all the other reaction conditions same as shown in Figure 9.5. The conversion of
2,4-DNT, as well as the reaction rate, enhances when catalyst concentration increases.
Reactant conversion was found to be 100% with 0.0232 kmol/m3 of catalyst loading
whereas it was about 70% without catalyst after 60 minutes of reaction. The highest
enhancement factor of 5.2 was achieved with the catalyst concentration of 0.093
Kmol/m3, as shown in Table 9.1. The influence of catalyst loading on the selectivity of
4A2NT and 2A4NT is shown in Figure 9.7b after 30 min. of reaction. From the Figure
9.7c, it is evident that with the catalyst concentration of 0.0465 Kmol/m3 highest
selectivity of 4A2NT was achieved and with further catalyst loading the selectivity of
4A2NT has been decreasing gradually.
To determine the order of reaction with respect to the catalyst concentration, the initial
reaction rate was calculated at different catalyst concentrations. A plot of ln (initial rate)
against ln (Catalyst concentration) was made and shown in Figure 9.8. From the slope of
the linear fit line, the order of reaction was determined. The order of the reaction was
found out to be 0.64 with respect to TBPB concentration.
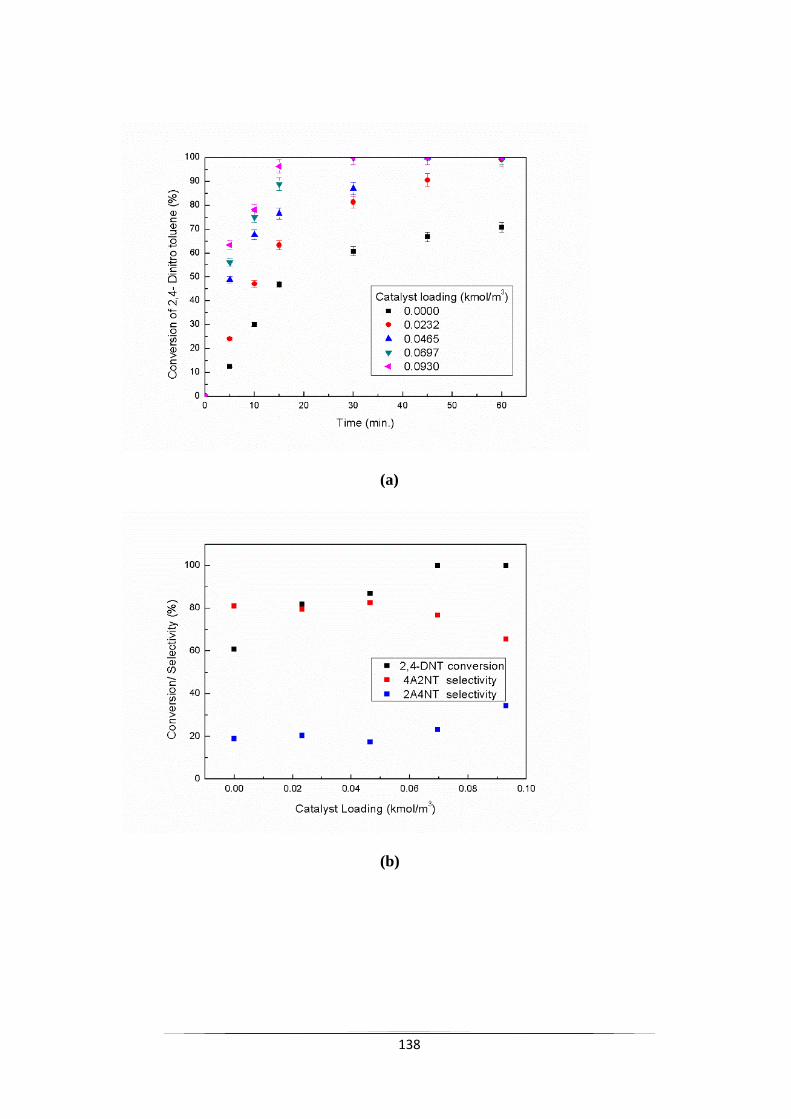
138
(a)
(b)
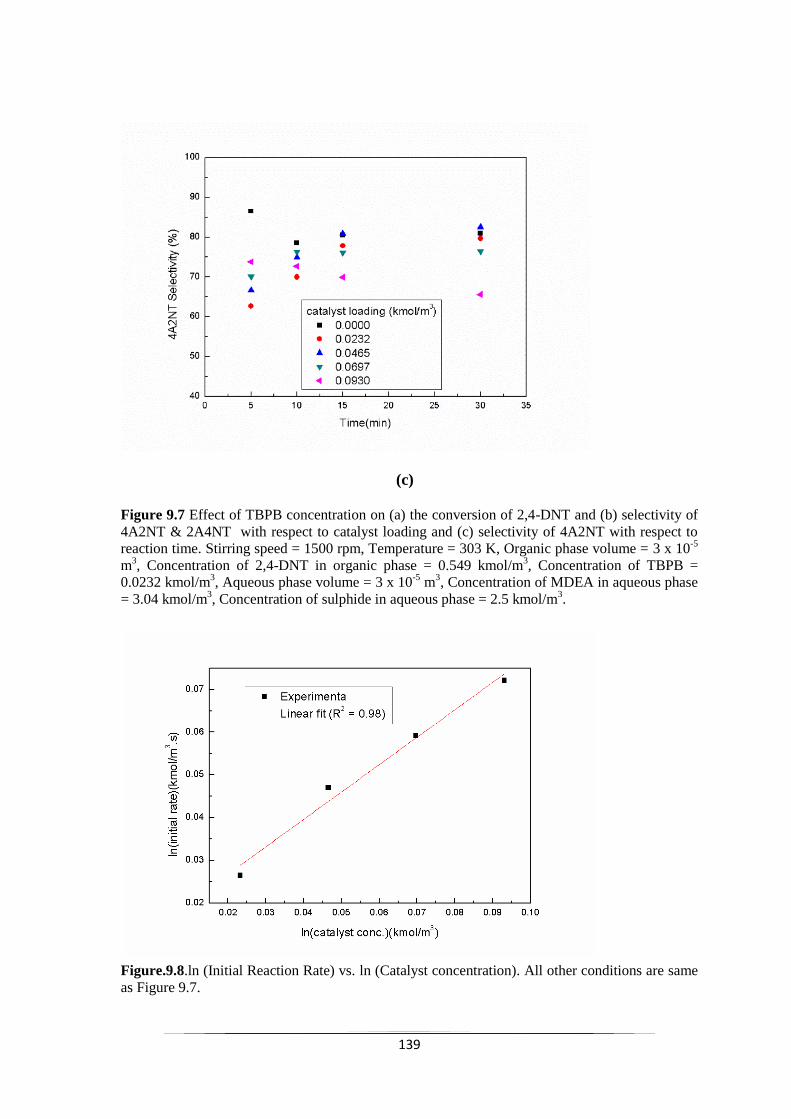
139
(c)
Figure 9.7 Effect of TBPB concentration on (a) the conversion of 2,4-DNT and (b) selectivity of
4A2NT & 2A4NT with respect to catalyst loading and (c) selectivity of 4A2NT with respect to
reaction time. Stirring speed = 1500 rpm, Temperature = 303 K, Organic phase volume = 3 x 10⁻⁵
m3, Concentration of 2,4-DNT in organic phase = 0.549 kmol/m
3, Concentration of TBPB =
0.0232 kmol/m3, Aqueous phase volume = 3 x 10
-5 m
3, Concentration of MDEA in aqueous phase
= 3.04 kmol/m3, Concentration of sulphide in aqueous phase = 2.5 kmol/m
3.
Figure.9.8.ln (Initial Reaction Rate) vs. ln (Catalyst concentration). All other conditions are same
as Figure 9.7.
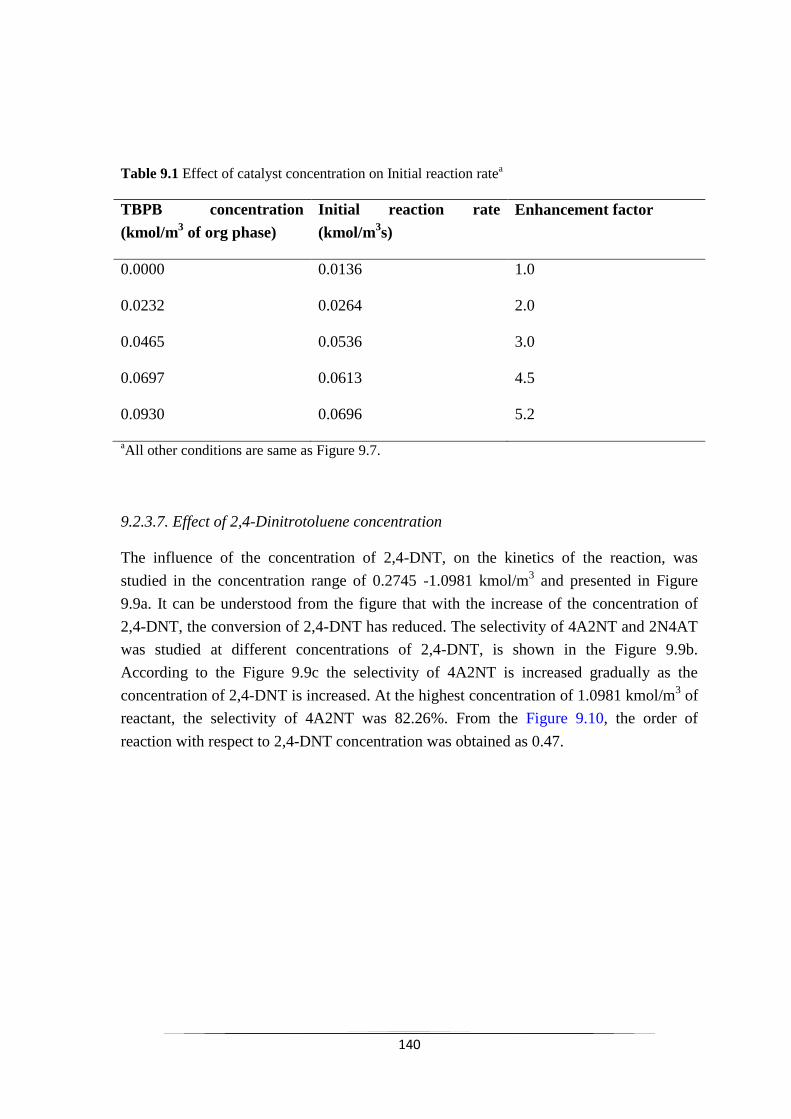
140
Table 9.1 Effect of catalyst concentration on Initial reaction ratea
TBPB concentration
(kmol/m3 of org phase)
Initial reaction rate
(kmol/m3s)
Enhancement factor
0.0000 0.0136 1.0
0.0232 0.0264 2.0
0.0465 0.0536 3.0
0.0697 0.0613 4.5
0.0930 0.0696 5.2
aAll other conditions are same as Figure 9.7.
9.2.3.7. Effect of 2,4-Dinitrotoluene concentration
The influence of the concentration of 2,4-DNT, on the kinetics of the reaction, was
studied in the concentration range of 0.2745 -1.0981 kmol/m3 and presented in Figure
9.9a. It can be understood from the figure that with the increase of the concentration of
2,4-DNT, the conversion of 2,4-DNT has reduced. The selectivity of 4A2NT and 2N4AT
was studied at different concentrations of 2,4-DNT, is shown in the Figure 9.9b.
According to the Figure 9.9c the selectivity of 4A2NT is increased gradually as the
concentration of 2,4-DNT is increased. At the highest concentration of 1.0981 kmol/m3 of
reactant, the selectivity of 4A2NT was 82.26%. From the Figure 9.10, the order of
reaction with respect to 2,4-DNT concentration was obtained as 0.47.
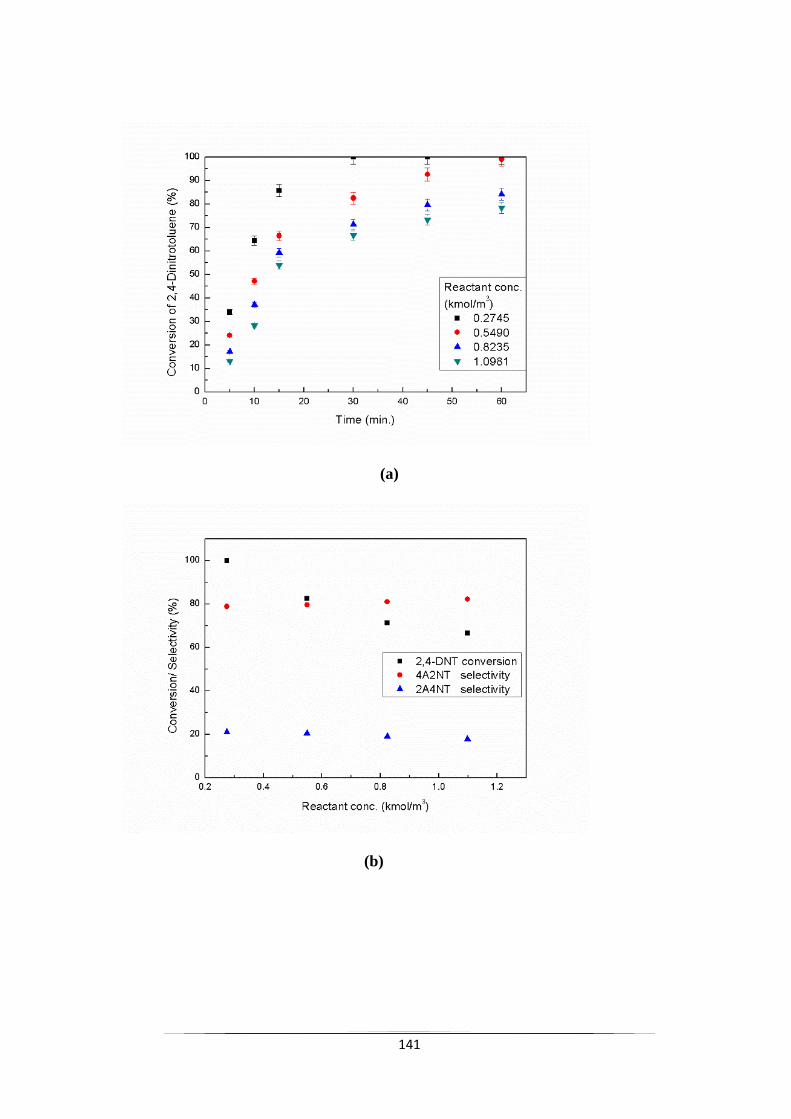
141
(a)
(b)
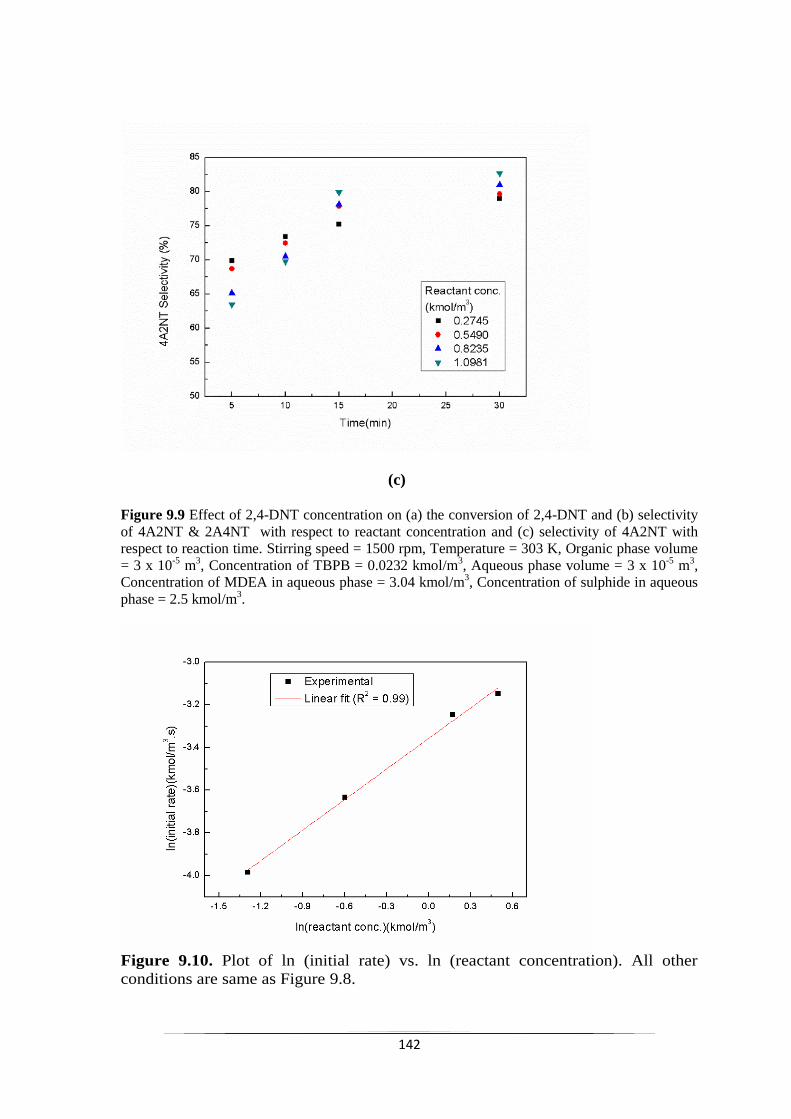
142
(c)
Figure 9.9 Effect of 2,4-DNT concentration on (a) the conversion of 2,4-DNT and (b) selectivity
of 4A2NT & 2A4NT with respect to reactant concentration and (c) selectivity of 4A2NT with
respect to reaction time. Stirring speed = 1500 rpm, Temperature = 303 K, Organic phase volume
= 3 x 10⁻⁵
m3, Concentration of TBPB = 0.0232 kmol/m
3, Aqueous phase volume = 3 x 10
-5 m
3,
Concentration of MDEA in aqueous phase = 3.04 kmol/m3, Concentration of sulphide in aqueous
phase = 2.5 kmol/m3.
Figure 9.10. Plot of ln (initial rate) vs. ln (reactant concentration). All other
conditions are same as Figure 9.8.
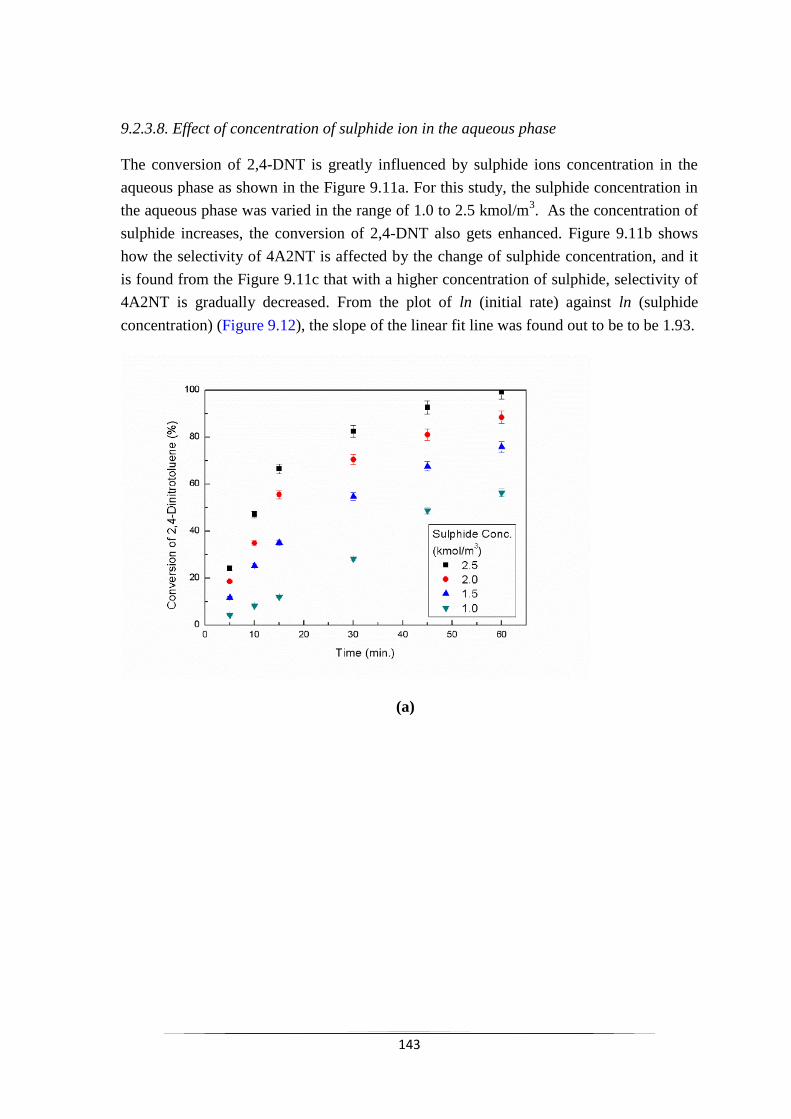
143
9.2.3.8. Effect of concentration of sulphide ion in the aqueous phase
The conversion of 2,4-DNT is greatly influenced by sulphide ions concentration in the
aqueous phase as shown in the Figure 9.11a. For this study, the sulphide concentration in
the aqueous phase was varied in the range of 1.0 to 2.5 kmol/m3. As the concentration of
sulphide increases, the conversion of 2,4-DNT also gets enhanced. Figure 9.11b shows
how the selectivity of 4A2NT is affected by the change of sulphide concentration, and it
is found from the Figure 9.11c that with a higher concentration of sulphide, selectivity of
4A2NT is gradually decreased. From the plot of ln (initial rate) against ln (sulphide
concentration) (Figure 9.12), the slope of the linear fit line was found out to be to be 1.93.
(a)
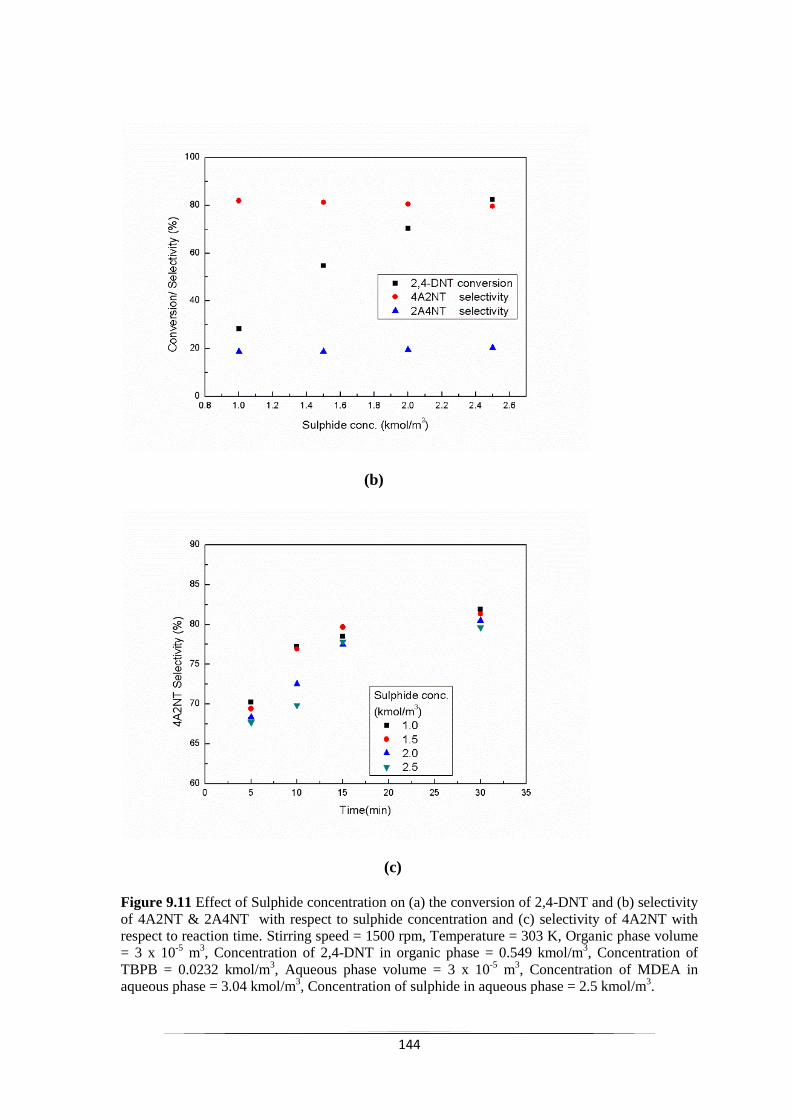
144
(b)
(c)
Figure 9.11 Effect of Sulphide concentration on (a) the conversion of 2,4-DNT and (b) selectivity
of 4A2NT & 2A4NT with respect to sulphide concentration and (c) selectivity of 4A2NT with
respect to reaction time. Stirring speed = 1500 rpm, Temperature = 303 K, Organic phase volume
= 3 x 10⁻⁵
m3, Concentration of 2,4-DNT in organic phase = 0.549 kmol/m
3, Concentration of
TBPB = 0.0232 kmol/m3, Aqueous phase volume = 3 x 10
-5 m
3, Concentration of MDEA in
aqueous phase = 3.04 kmol/m3, Concentration of sulphide in aqueous phase = 2.5 kmol/m
3.
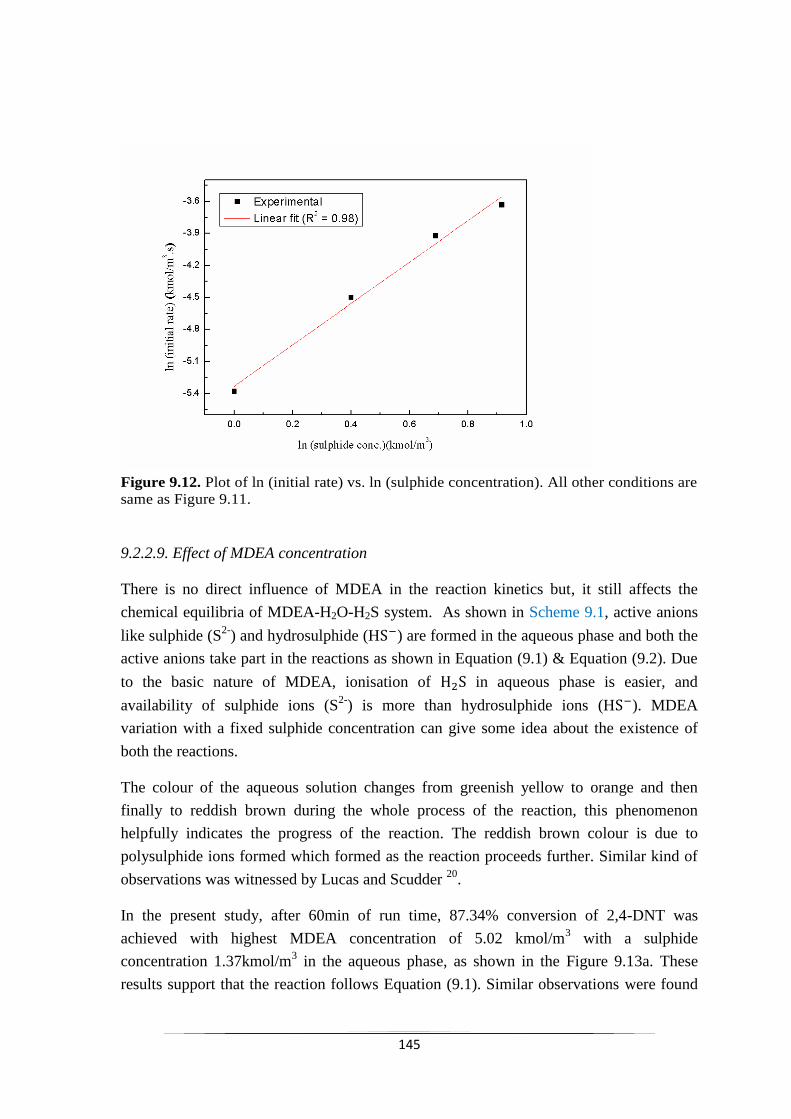
145
Figure 9.12. Plot of ln (initial rate) vs. ln (sulphide concentration). All other conditions are
same as Figure 9.11.
9.2.2.9. Effect of MDEA concentration
There is no direct influence of MDEA in the reaction kinetics but, it still affects the
chemical equilibria of MDEA-H2O-H2S system. As shown in Scheme 9.1, active anions
like sulphide (S2-
) and hydrosulphide (H ) are formed in the aqueous phase and both the
active anions take part in the reactions as shown in Equation (9.1) & Equation (9.2). Due
to the basic nature of MDEA, ionisation of in aqueous phase is easier, and
availability of sulphide ions (S2-
) is more than hydrosulphide ions (H ). MDEA
variation with a fixed sulphide concentration can give some idea about the existence of
both the reactions.
The colour of the aqueous solution changes from greenish yellow to orange and then
finally to reddish brown during the whole process of the reaction, this phenomenon
helpfully indicates the progress of the reaction. The reddish brown colour is due to
polysulphide ions formed which formed as the reaction proceeds further. Similar kind of
observations was witnessed by Lucas and Scudder 20
.
In the present study, after 60min of run time, 87.34% conversion of 2,4-DNT was
achieved with highest MDEA concentration of 5.02 kmol/m3 with a sulphide
concentration 1.37kmol/m3 in the aqueous phase, as shown in the Figure 9.13a. These
results support that the reaction follows Equation (9.1). Similar observations were found
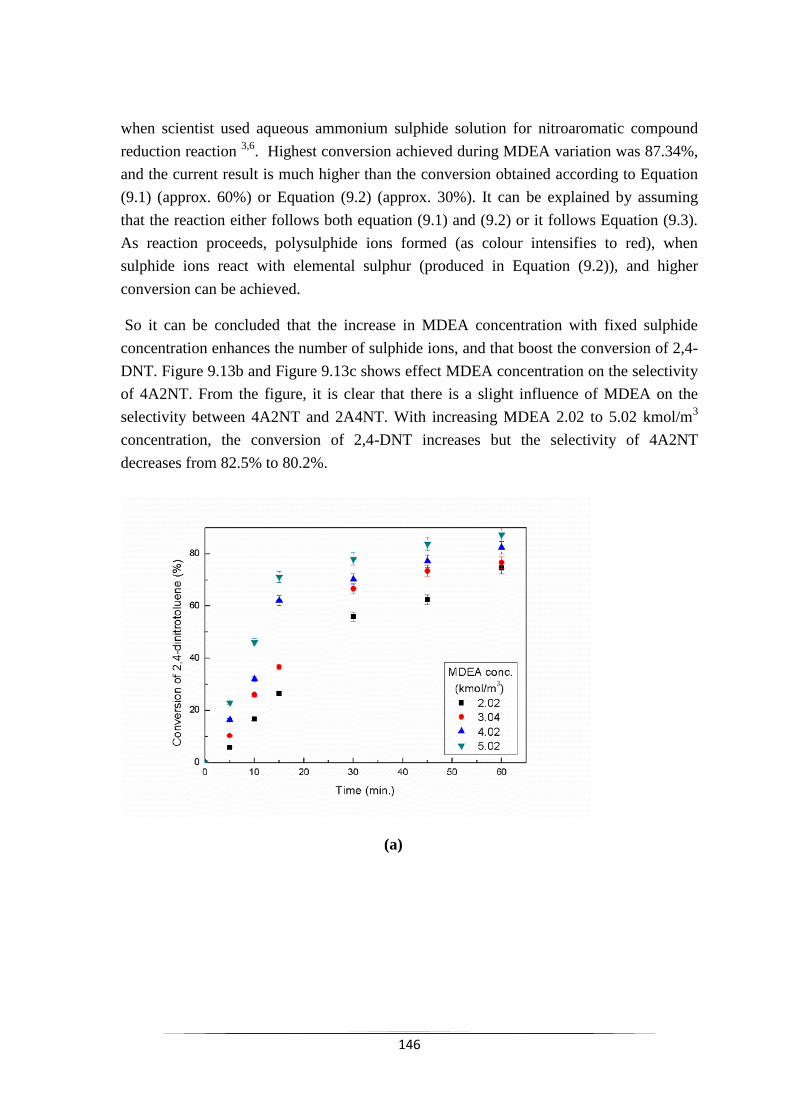
146
when scientist used aqueous ammonium sulphide solution for nitroaromatic compound
reduction reaction 3,6
. Highest conversion achieved during MDEA variation was 87.34%,
and the current result is much higher than the conversion obtained according to Equation
(9.1) (approx. 60%) or Equation (9.2) (approx. 30%). It can be explained by assuming
that the reaction either follows both equation (9.1) and (9.2) or it follows Equation (9.3).
As reaction proceeds, polysulphide ions formed (as colour intensifies to red), when
sulphide ions react with elemental sulphur (produced in Equation (9.2)), and higher
conversion can be achieved.
So it can be concluded that the increase in MDEA concentration with fixed sulphide
concentration enhances the number of sulphide ions, and that boost the conversion of 2,4-
DNT. Figure 9.13b and Figure 9.13c shows effect MDEA concentration on the selectivity
of 4A2NT. From the figure, it is clear that there is a slight influence of MDEA on the
selectivity between 4A2NT and 2A4NT. With increasing MDEA 2.02 to 5.02 kmol/m3
concentration, the conversion of 2,4-DNT increases but the selectivity of 4A2NT
decreases from 82.5% to 80.2%.
(a)
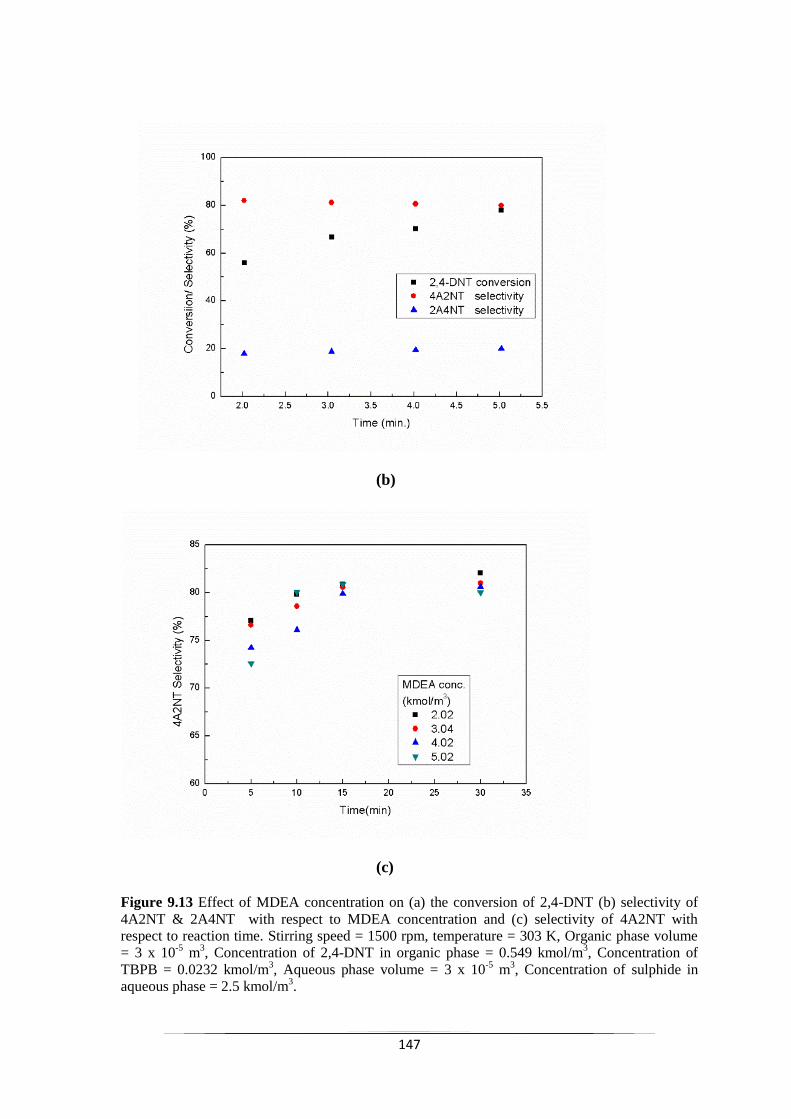
147
(b)
(c)
Figure 9.13 Effect of MDEA concentration on (a) the conversion of 2,4-DNT (b) selectivity of
4A2NT & 2A4NT with respect to MDEA concentration and (c) selectivity of 4A2NT with
respect to reaction time. Stirring speed = 1500 rpm, temperature = 303 K, Organic phase volume
= 3 x 10⁻⁵
m3, Concentration of 2,4-DNT in organic phase = 0.549 kmol/m
3, Concentration of
TBPB = 0.0232 kmol/m3, Aqueous phase volume = 3 x 10
-5 m
3, Concentration of sulphide in
aqueous phase = 2.5 kmol/m3.
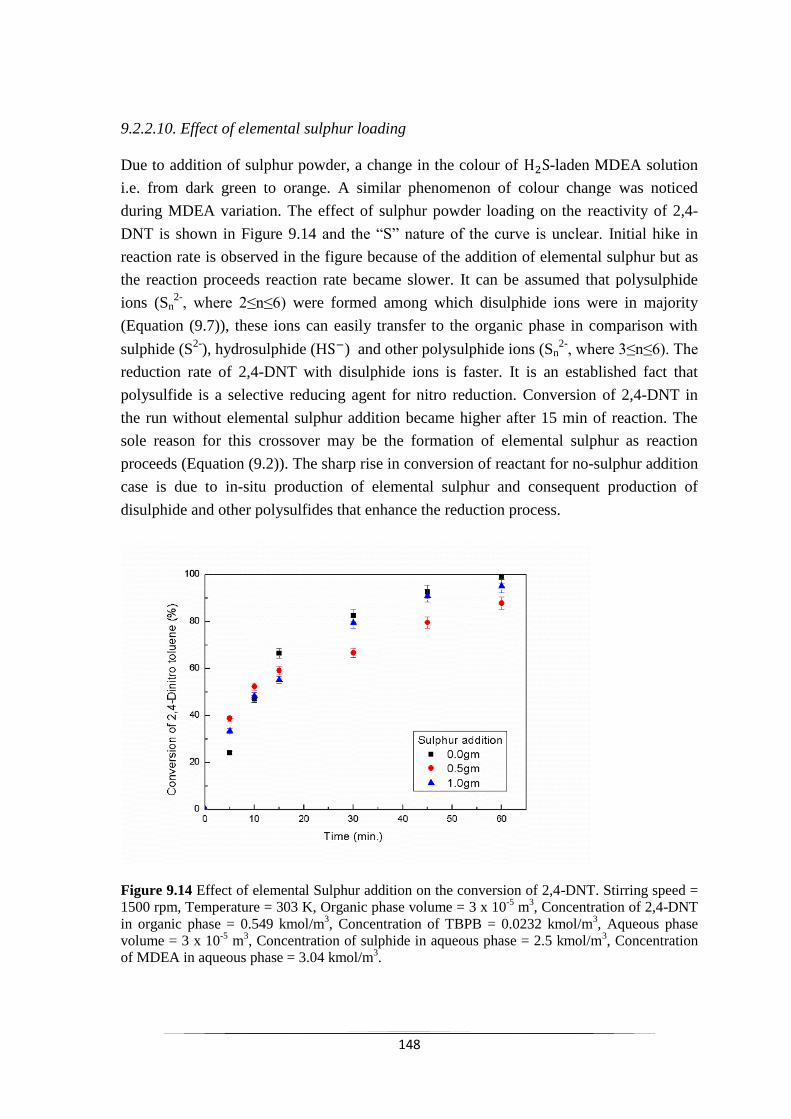
148
9.2.2.10. Effect of elemental sulphur loading
Due to addition of sulphur powder, a change in the colour of -laden MDEA solution
i.e. from dark green to orange. A similar phenomenon of colour change was noticed
during MDEA variation. The effect of sulphur powder loading on the reactivity of 2,4-
DNT is shown in Figure 9.14 and the “S” nature of the curve is unclear. Initial hike in
reaction rate is observed in the figure because of the addition of elemental sulphur but as
the reaction proceeds reaction rate became slower. It can be assumed that polysulphide
ions (Sn2-
, where 2≤n≤6) were formed among which disulphide ions were in majority
(Equation (9.7)), these ions can easily transfer to the organic phase in comparison with
sulphide (S2-
), hydrosulphide (H ) and other polysulphide ions (Sn2-
, where 3≤n≤6). The
reduction rate of 2,4-DNT with disulphide ions is faster. It is an established fact that
polysulfide is a selective reducing agent for nitro reduction. Conversion of 2,4-DNT in
the run without elemental sulphur addition became higher after 15 min of reaction. The
sole reason for this crossover may be the formation of elemental sulphur as reaction
proceeds (Equation (9.2)). The sharp rise in conversion of reactant for no-sulphur addition
case is due to in-situ production of elemental sulphur and consequent production of
disulphide and other polysulfides that enhance the reduction process.
Figure 9.14 Effect of elemental Sulphur addition on the conversion of 2,4-DNT. Stirring speed =
1500 rpm, Temperature = 303 K, Organic phase volume = 3 x 10⁻⁵
m3, Concentration of 2,4-DNT
in organic phase = 0.549 kmol/m3, Concentration of TBPB = 0.0232 kmol/m
3, Aqueous phase
volume = 3 x 10⁻⁵
m3, Concentration of sulphide in aqueous phase = 2.5 kmol/m
3, Concentration
of MDEA in aqueous phase = 3.04 kmol/m3.
149
9.2.3. Kinetic modeling of L-L PTC
A kinetic model has been developed based on the proposed mechanism shown in Scheme
9.1. The reaction occuring at interphase between the aqueous and organic phases is also
contributing significantly to the overall reaction. From the Figure (9.7.a) the without
catalyst run shows 70% conversion.
It is further assumed that the overall L-L PTC reaction follows both Equation (9.1) and
(9.2) where 2,4-DNT present in the organic phase is selectively reduced by sulphide and
hydrosulphide anions present in the aqueous phase to yield 4A2NT and 2A4NT as the
main products.
To eliminate the mass transfer effect, the reaction mixture was agitated with at an
optimum stirring speed of 1500 rpm. As the reaction commences, the PTC catalyst ion-
pair ( ) exchanges its anions with ions very rapidly in the aqueous
phase to transform into active catalyst ion-pair ( . The active catalyst ion-pair is
then transferred to the organic phase crossing the interface. After that the reaction
proceeds in the organic phase, and different transition anions are formed. Finally, the
active catalyst became inactive as the ion gets attached to quaternary cations .
ions transfer to the aqueous phase and reacts with to get reactivated as
again.
The elemental sulphur produced in the rection is enhancing the reaction rate initially and
it is the reason behind the „S‟ nature of the conversion versus time curve (Figure 9.12).
The formation polysulphide occurs when elemental sulphur reacts with H2S-laden MDEA
solution. Previously it was discussed that the overall conversion is decreased with the
addition of elemental sulphur due to the formation of polysulphide in large number in
comparison with disulphide ions, which the catalyst cation can not tranfer easily to the
organic phase. According to the Equation (3), the disulphide ( S
2-) ions are forming ion
pair with two catalyst cations (Q+
S2-
Q+) in the aqueous phase and tranfer to the organic
phase.
Development of a mathemetical model based on the mechnism proposed is quite diffficult
job because of the complexities involved in the current reaction as the selective reaction
of dinitro compound gives us two products i.e. 4A2NT and 2A4NT. So in our current
study, an empirical kinetic model has been developed to correlate with the conversion
version time data obtained experimentaly. In our current study the reaction order respect
to catlyst, reactant and sulphide concentration term has been evaluated and based on
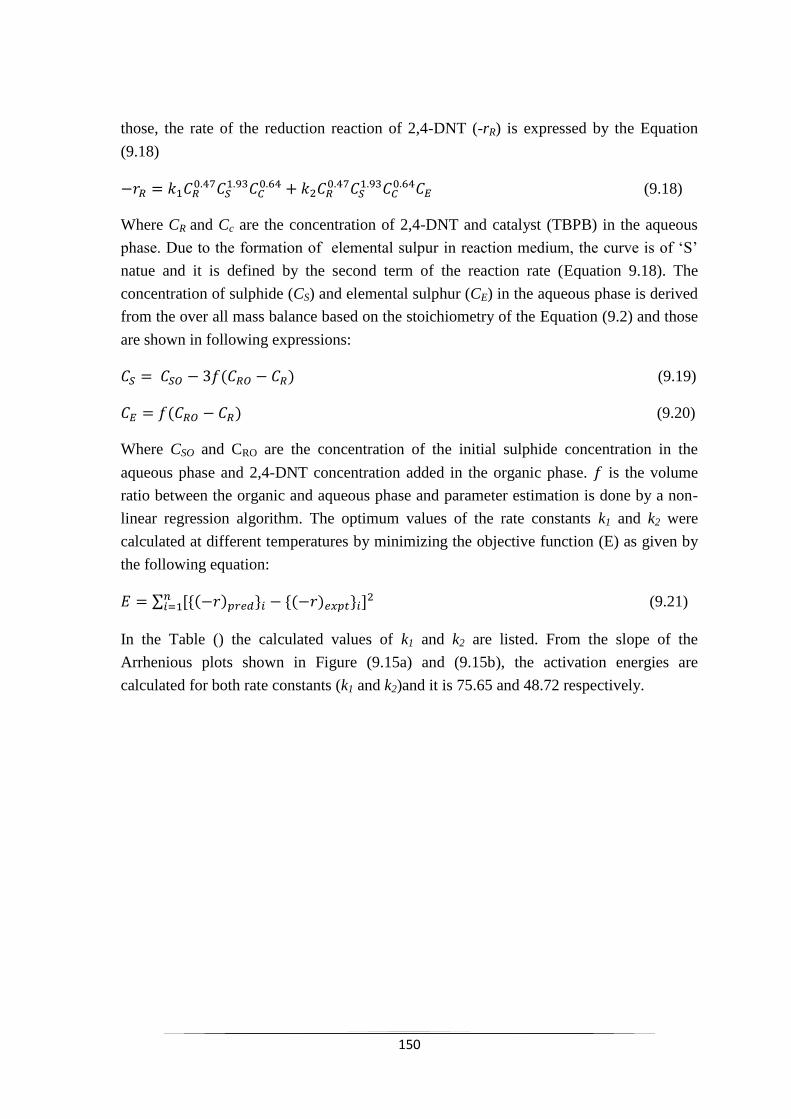
150
those, the rate of the reduction reaction of 2,4-DNT (-rR) is expressed by the Equation
(9.18)
(9.18)
Where CR and Cc are the concentration of 2,4-DNT and catalyst (TBPB) in the aqueous
phase. Due to the formation of elemental sulpur in reaction medium, the curve is of „S‟
natue and it is defined by the second term of the reaction rate (Equation 9.18). The
concentration of sulphide (CS) and elemental sulphur (CE) in the aqueous phase is derived
from the over all mass balance based on the stoichiometry of the Equation (9.2) and those
are shown in following expressions:
(9.19)
(9.20)
Where CSO and CRO are the concentration of the initial sulphide concentration in the
aqueous phase and 2,4-DNT concentration added in the organic phase. is the volume
ratio between the organic and aqueous phase and parameter estimation is done by a non-
linear regression algorithm. The optimum values of the rate constants k1 and k2 were
calculated at different temperatures by minimizing the objective function (E) as given by
the following equation:
∑ { } { }
(9.21)
In the Table () the calculated values of k1 and k2 are listed. From the slope of the
Arrhenious plots shown in Figure (9.15a) and (9.15b), the activation energies are
calculated for both rate constants (k1 and k2)and it is 75.65 and 48.72 respectively.
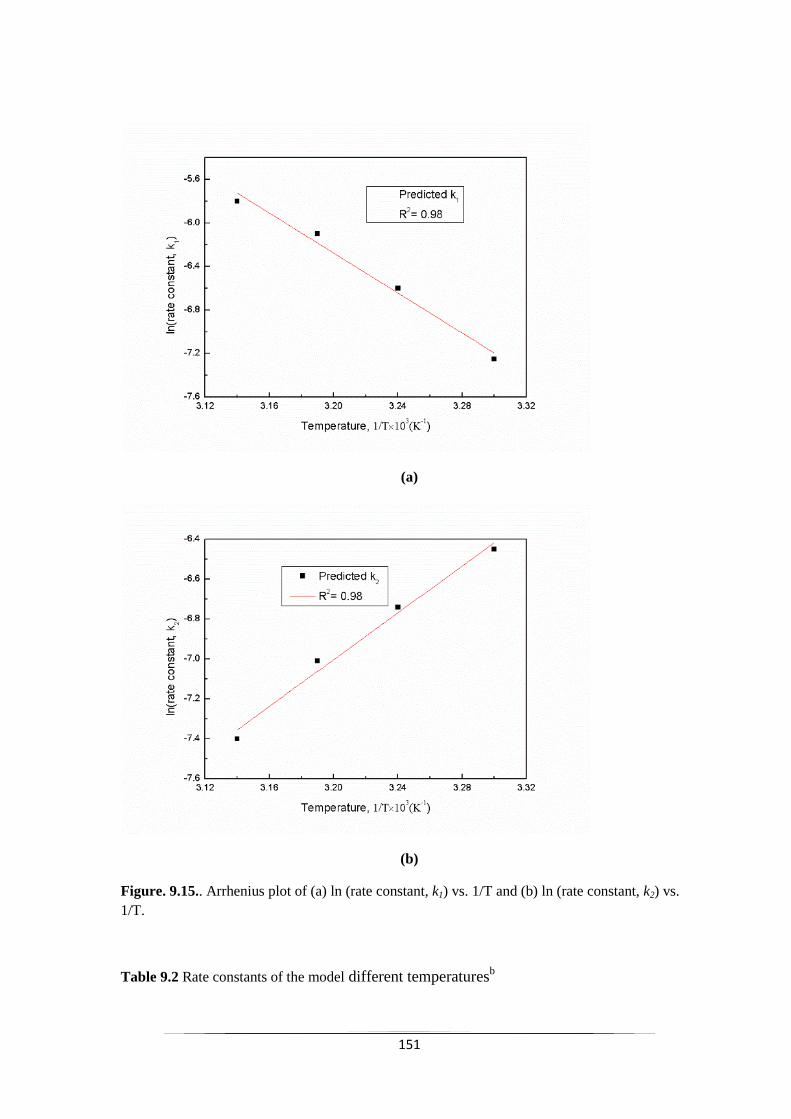
151
(a)
(b)
Figure. 9.15.. Arrhenius plot of (a) ln (rate constant, k1) vs. 1/T and (b) ln (rate constant, k2) vs.
1/T.
Table 9.2 Rate constants of the model different temperaturesb
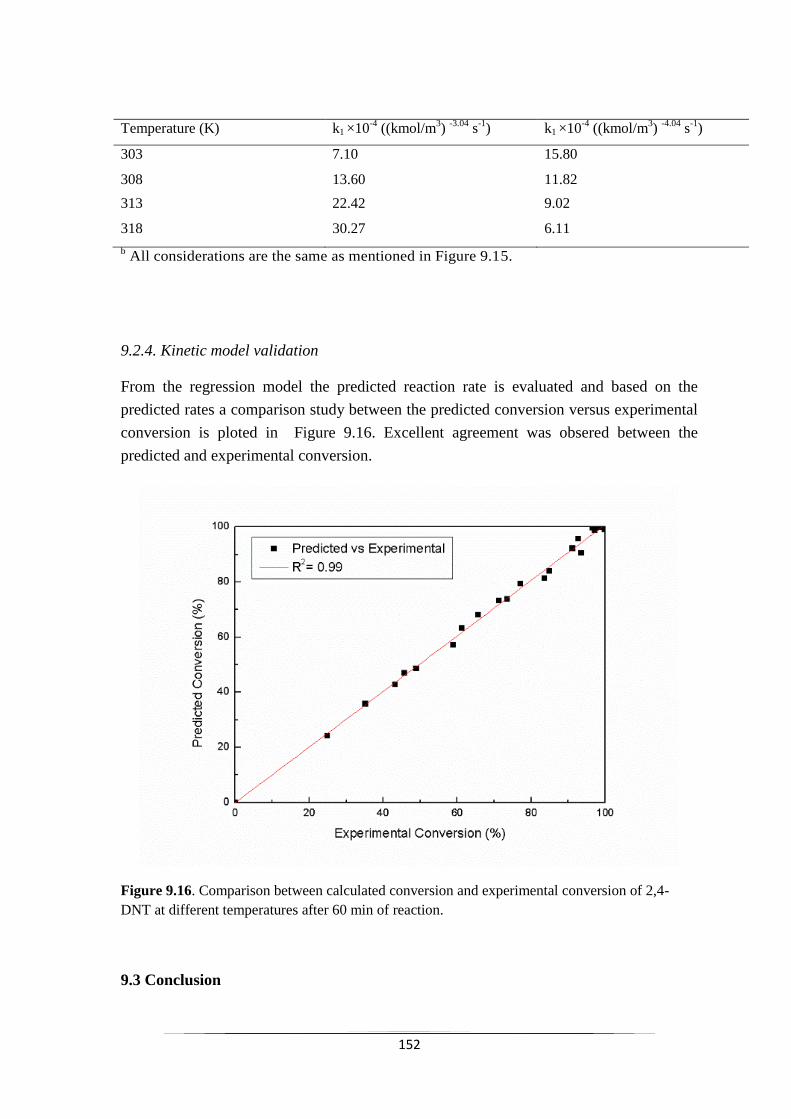
152
Temperature (K) k1 ×10-4
((kmol/m3)
-3.04 s
-1) k1 ×10
-4 ((kmol/m
3)
-4.04 s
-1)
303 7.10 15.80
308 13.60 11.82
313 22.42 9.02
318 30.27 6.11
b All considerations are the same as mentioned in Figure 9.15.
9.2.4. Kinetic model validation
From the regression model the predicted reaction rate is evaluated and based on the
predicted rates a comparison study between the predicted conversion versus experimental
conversion is ploted in Figure 9.16. Excellent agreement was obsered between the
predicted and experimental conversion.
Figure 9.16. Comparison between calculated conversion and experimental conversion of 2,4-
DNT at different temperatures after 60 min of reaction.
9.3 Conclusion
153
The current study shows the novelties of L-L PTC in the selective reduction of 2,4-DNT
to the corresponding amino compound by novel Zinin reagent, H2S-laden MDEA under
milder reaction conditions, thereby eliminating the use of a costly metallic catalyst, high-
temperature, and high-pressure reaction. As the reaction was very fast, 100% conversion
was achieved in a very short time room temperature (303K). Selective reduction leads to
the formation of two isomers- 2A4NT and 4A2NT, among them 4A2NT was much more
abundant than 2A4NT. The detailed parametric study suggested that with the increase of
temperature, catalyst concentration, sulphide ion concentration, MDEA concentration, the
selectivity of 4A2NT decreases and that of 2A4NT increases. Highest selectivity of
4A2NT was observed as 82.26% when reactant concentration in the reactor was 1.0981
kmol/m3. Reaction kinetics has been evaluated after details parametric studies and a
mechanistic model also been proposed, which was further confirmed by experimental
data. The activation energy of 46.25 kJ/mol makes current reaction a kinetically
controlled one. Figure 9.17-9.19 are the mass spectra of 2,4DNT, 4A2NT and 2A4NT
respectively.
Figure 9.17: MS spectra of 2-amino-6-nitrotoluene (2A6NT).
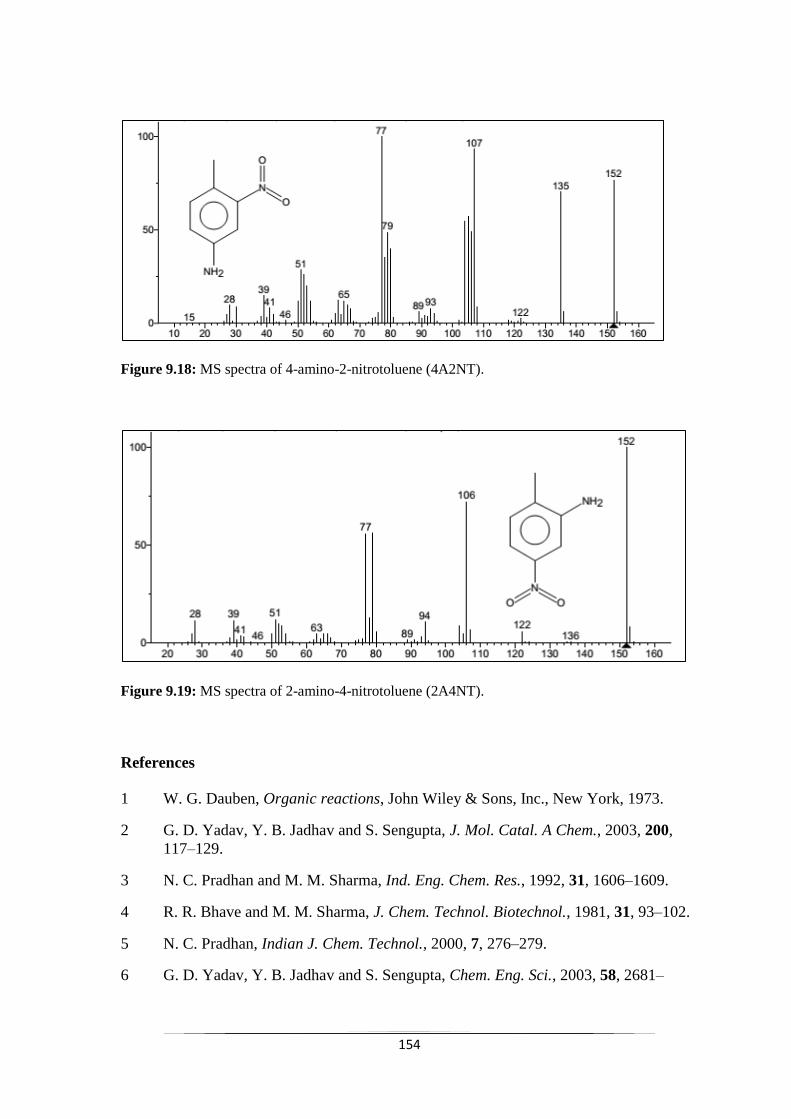
154
Figure 9.18: MS spectra of 4-amino-2-nitrotoluene (4A2NT).
Figure 9.19: MS spectra of 2-amino-4-nitrotoluene (2A4NT).
References
1 W. G. Dauben, Organic reactions, John Wiley & Sons, Inc., New York, 1973.
2 G. D. Yadav, Y. B. Jadhav and S. Sengupta, J. Mol. Catal. A Chem., 2003, 200,
117–129.
3 N. C. Pradhan and M. M. Sharma, Ind. Eng. Chem. Res., 1992, 31, 1606–1609.
4 R. R. Bhave and M. M. Sharma, J. Chem. Technol. Biotechnol., 1981, 31, 93–102.
5 N. C. Pradhan, Indian J. Chem. Technol., 2000, 7, 276–279.
6 G. D. Yadav, Y. B. Jadhav and S. Sengupta, Chem. Eng. Sci., 2003, 58, 2681–
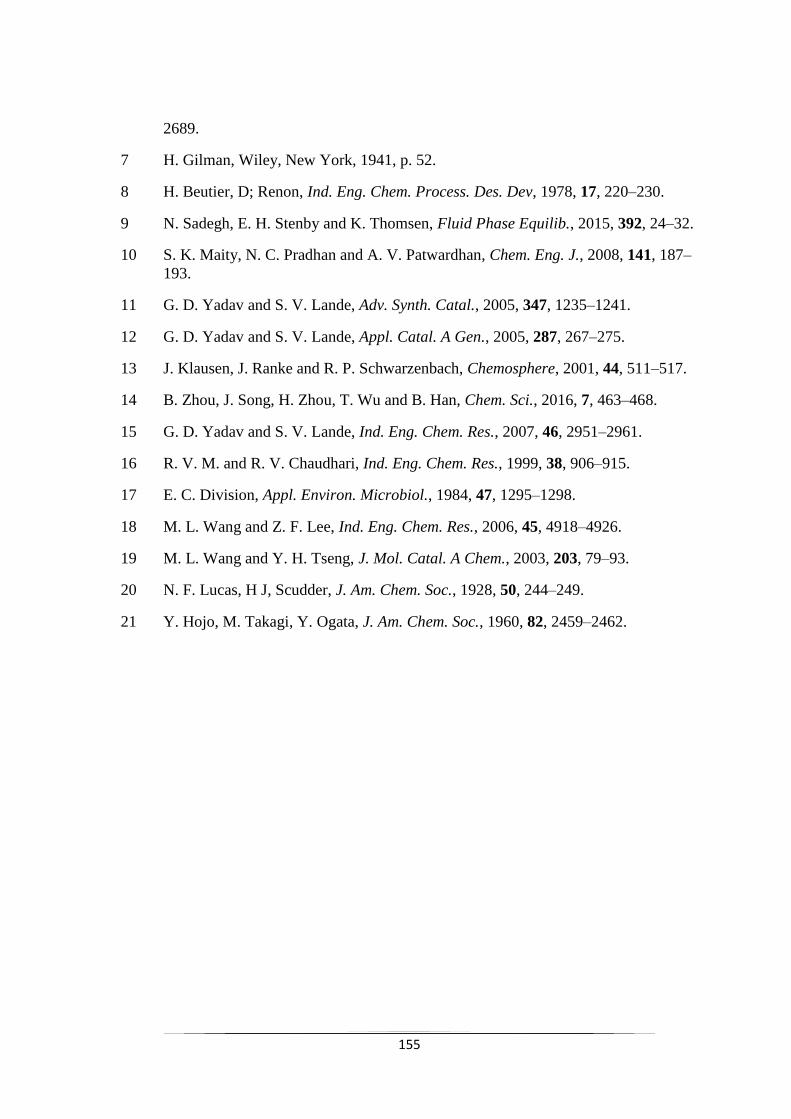
155
2689.
7 H. Gilman, Wiley, New York, 1941, p. 52.
8 H. Beutier, D; Renon, Ind. Eng. Chem. Process. Des. Dev, 1978, 17, 220–230.
9 N. Sadegh, E. H. Stenby and K. Thomsen, Fluid Phase Equilib., 2015, 392, 24–32.
10 S. K. Maity, N. C. Pradhan and A. V. Patwardhan, Chem. Eng. J., 2008, 141, 187–
193.
11 G. D. Yadav and S. V. Lande, Adv. Synth. Catal., 2005, 347, 1235–1241.
12 G. D. Yadav and S. V. Lande, Appl. Catal. A Gen., 2005, 287, 267–275.
13 J. Klausen, J. Ranke and R. P. Schwarzenbach, Chemosphere, 2001, 44, 511–517.
14 B. Zhou, J. Song, H. Zhou, T. Wu and B. Han, Chem. Sci., 2016, 7, 463–468.
15 G. D. Yadav and S. V. Lande, Ind. Eng. Chem. Res., 2007, 46, 2951–2961.
16 R. V. M. and R. V. Chaudhari, Ind. Eng. Chem. Res., 1999, 38, 906–915.
17 E. C. Division, Appl. Environ. Microbiol., 1984, 47, 1295–1298.
18 M. L. Wang and Z. F. Lee, Ind. Eng. Chem. Res., 2006, 45, 4918–4926.
19 M. L. Wang and Y. H. Tseng, J. Mol. Catal. A Chem., 2003, 203, 79–93.
20 N. F. Lucas, H J, Scudder, J. Am. Chem. Soc., 1928, 50, 244–249.
21 Y. Hojo, M. Takagi, Y. Ogata, J. Am. Chem. Soc., 1960, 82, 2459–2462.
156
Abstract
This study revolves around finding an alternative usage of a toxic and hazardous waste
i.e. Hydrogen sulphide other than industrially popular Claus process. In our current
approach we used H2S-laden Methyldiethanol amine as a reducing agent for the selective
reduction of mono/di-nitro arenes under the Liquid-Liquid mode of reaction with utilizing
n-tetrabutylphosphonium bromide (TBPB) as a phase transfer catalyst.
10.1 Introduction
Selective reduction of nitro aromatic compounds is an industrially important reaction as
the amino group can be further derivetize to give commercially important products1. The
production of Aniline and its derivative is a cornerstone of modern chemical industry. In
2013 value of global aniline market was ₤6.25 billion and expected to reach ₤ 10.17
billion by 20202. Aniline its derivatives are found to be very useful in plenty industries
such as pharmaceutical, polymer and materials (e. g. rubber, polyurethane), herbicides,
pesticide, bulk chemicals, photographic chemicals, and sometimes as an inhibitor of the
polymerization reaction and as stabilizing agent for many chemicals 3–7
. Azo and azoxy
compounds are prepared thorough oxidation of aromatic amines which is having
ubiquitous usage in dye industry as a raw material for the production of dyes and
pigments (e.g. indigo ) 4,8,9
.
A plethora methods are available for the reduction of nitro compounds including
Bechamp reduction 10
, catalytic hydrogenation11
, metal catalysed reduction but reducing
agent other than molecular hydrogen, stoichiometric reducing agent. Bechamp reduction
process involved stoichiometric amount metal catalyst (Fe, Zn, Al and Sn) or a metal
sulphide (Na2S) in the presence of acid. However selective reduction of a single nitro
group in the presence of carbonyl group in very difficult. On the other hand catalytic
hydrogenation reaction requires high reaction temperature and pressure for enhancing
reactivity because of lower intensive reactivity of the catalyst. So this makes whole
process energy expensive and difficult to operate as hydrogen handling is difficulty
process 3,12–18
. Use of potentially explosive hydrogen source in catalytic hydrogenation is
very risky job19
. Chemoselective hydrogenation also utilises stoichiometric reducing
agents such as sodium hydrosulphide 20
, hydrazine hydrate 1, silanes
21, decaborane
22 and
formats 23
as a hydrogen source.
All the existing catalysis methods are failing to meet the confluence of reactivity and
selectivity. Reaction involves highly active catalyst lacks selective reduction which leads
to production undesired side product which makes the purification process difficult.
157
Another drawback of the process mentioned above includes the reagents utilised are
expensive and moisture sensitive, extreme process handling conditions and high number
of safety concerns. Selective reduction of nitroaromatic compounds can be achieved by
Zinin reduction 1. The reduction reaction of nitroaromatic compounds by negative
divalent sulphur in the form of sulphide, hydrosulphide and polysulphide is called Zinin
reduction 24
. Ammonium sulphide, sodium sulphide have been used a reducing agent in
Zinin reduction for the reduction of several nitroaromatic compounds 25–30
.
Hydrogen sulphide (H2S) gas is normally a toxic and hazardous gas, but it can be used as
a reducing agent in Zinin reduction as H2S absorbed in amine or alkanolamine solution
also producing sulphide and hydrosulphide ions. H2S is produced as a gaseous by-product
in several industries like petroleum, natural gas processing industries, coal, kraft pulping 31,32
. Currently available crude petroleum is enriched with sulphur and nitrogen and
refineries are forces process this heavy crude. As a result after hydrotreating and
hydrodesulfurization, tons of H2S gas is generated as a gaseous by-product. Amine
treating unit (ATU) is a place where H2S gas is absorbed in amine or alkanolamine
solution to separate it from the gasious stream. Then H2S gas is regenerated from the
amine or alkanolamine solution ATU regenarator is treated by Claus process, which is a
high-temperature oxidation process and the end product is elemental sulphur 33
.
As the environmental emission rule become stricter and huge amount of elemental
sulphur produced in Claus process does not find any other use other than possessing
hazardous effect, other approaches of H2S utilization have to be taken. Ample approaches
have been taken such as thermal 34
, photochemical 35
, electrochemical 36–38
,
thermochemical processes 39
to convert H2S into some useful product like hydrogen(H2)
and sulphur (S2). Syngas (H2, CO) have been produced from acid gas (H2S, CO2) and can
be used as fuel for gas engines 40
. All the above approaches are costly to operate,
laborious and not enviro-friendly, so these setbacks are forcing to think for an innovative
and better utilization of H2S.
Removal of H2S gas from gas stream s difficult job and Alkanolamines are mostly used
for removal Acid gases (H2S, CO2) from the natural gas and synthetic ammonia gas
industry and petrochemical plants around the globe41
. Industrially important
alkanolamines are monoethanolamine (MEA), diethnolamine (DEA), N-
methyldiethanolamine (MDEA) and di-2-propanolamine (DIPA). Primary amine (MEA)
and secondary amine (DEA) react with CO2 and forms stable carbamates but tertiary
amine (MDEA) can selectively remove H2S gas from a gas stream which contains CO2
and H2S. Other advantages of MDEA includes high loading capacity and low heat of
158
reaction which make regeneration process an economical and energy efficient process41–
44.
Our proposed reaction is biphasic reaction system where aqueous phase is H2S laden
aqueous MDEA solution which constitutes reducing ions and organic phase contains
soluble PTC along with nitro compound dissolved in organic solvent. The main role of
PTC is to accelerate reaction rate by transferring aqueous phase inorganic anions to the
organic phase through the interphase. Two types of biphasic reaction are available in
literature involving soluble PTC catalyst are Liquid-Solid (L-S) and Liquid-Liquid (L-L)
systems and one multiphasic reaction system available which is Liquid-Liquid-Liquid (L-
L-L) system. L-L PTC system is the most simple and widely accepted system, because of
its simpleness, little requirement for solvent and raw materials, feasible operating
conditions, high selectivity and enhanced reaction rate.
PTC of different types have been utilised in multiphase reactions and PTCs can be
categorised into quaternary ammonium and phosphonium salts, Cryptands, Crown ethers,
Polyethylene glycols (PEG) 45
. Ammonium and phosphonium salts are most popular
because of their high reactivity, operational at higher temperature and cheaper.
Ethyltriphenylphosphonium bromide (ETPPB) have been used in Zinin reduction and the
quaternary phosphonium salt has shown good results in comparison with ammonium salts 25
. Tetra-n-butylphosphonium bromide (TBPB) is a type of quaternary phosphonium salt,
is used as PTC in several reactions which include synthesis of alkyl, aryl thioglycoside
and thiodisaccharide utilizing the thioiminium salt, synthesizing o-nitrophenyl octyl ether,
one-pot synthesis of pyrano- and furanoquinolines are available in several kinds of
literature 46–48
. Use of TBPB for selective reduction of di-nitro aromatic compounds by
H2S- laden MDEA as reducing agent at room temperature is a unique approach and taken
into consideration for the current study.
10.2 Experimental setup and procedure:
H2S gas was bubbled through the chilled aqueous MDEA solution to prepare aqueous
phase and this process was carried out till desired sulphide concentration attained in the
aqueous phase, which was measured by iodometric titration method 49
. The proposed
reactions were done in a 150ml capacity isothermal baffled stirred tank reactor. The
isothermal bath temperature was regulated with a PID controller (±1°C) and it was
provided with a digital regulation system. Our reaction system was composed with of two
equal volume phases, the aqueous phase was H2S-laden aqueous MDEA solution and the
other phase was organic phase which was a mixture of reactant (nitroaromatic
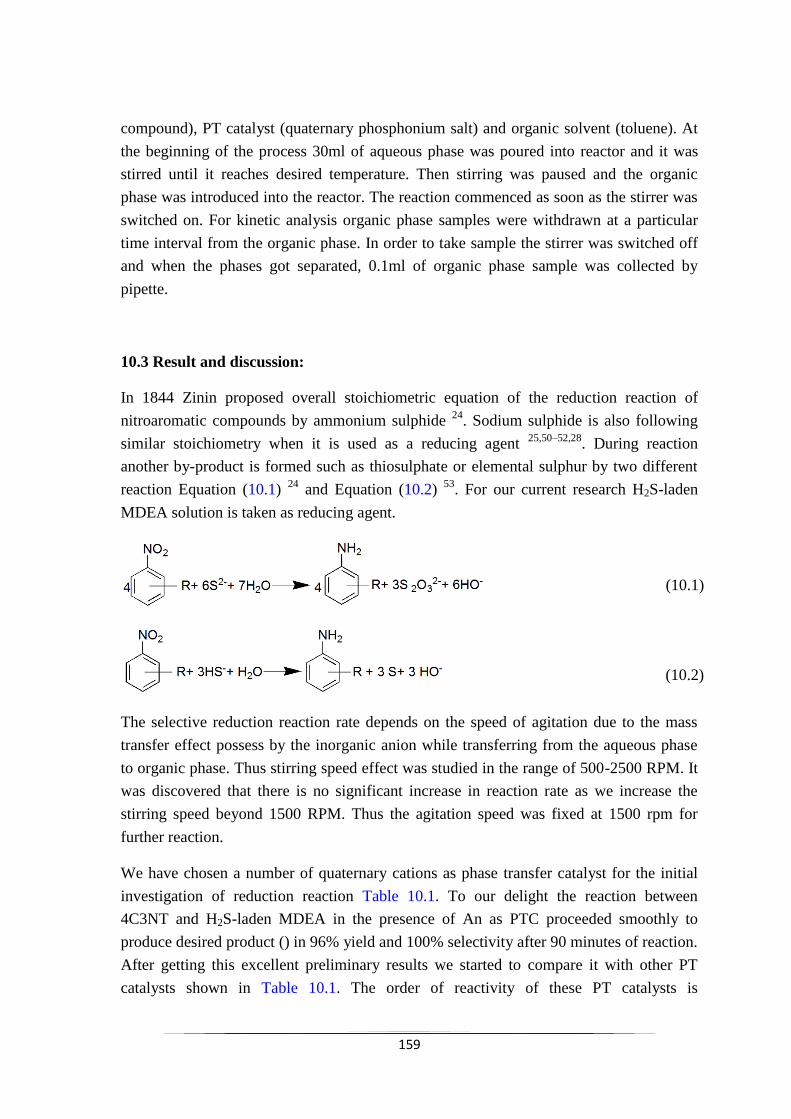
159
compound), PT catalyst (quaternary phosphonium salt) and organic solvent (toluene). At
the beginning of the process 30ml of aqueous phase was poured into reactor and it was
stirred until it reaches desired temperature. Then stirring was paused and the organic
phase was introduced into the reactor. The reaction commenced as soon as the stirrer was
switched on. For kinetic analysis organic phase samples were withdrawn at a particular
time interval from the organic phase. In order to take sample the stirrer was switched off
and when the phases got separated, 0.1ml of organic phase sample was collected by
pipette.
10.3 Result and discussion:
In 1844 Zinin proposed overall stoichiometric equation of the reduction reaction of
nitroaromatic compounds by ammonium sulphide 24
. Sodium sulphide is also following
similar stoichiometry when it is used as a reducing agent 25,50–52,28
. During reaction
another by-product is formed such as thiosulphate or elemental sulphur by two different
reaction Equation (10.1) 24
and Equation (10.2) 53
. For our current research H2S-laden
MDEA solution is taken as reducing agent.
The selective reduction reaction rate depends on the speed of agitation due to the mass
transfer effect possess by the inorganic anion while transferring from the aqueous phase
to organic phase. Thus stirring speed effect was studied in the range of 500-2500 RPM. It
was discovered that there is no significant increase in reaction rate as we increase the
stirring speed beyond 1500 RPM. Thus the agitation speed was fixed at 1500 rpm for
further reaction.
We have chosen a number of quaternary cations as phase transfer catalyst for the initial
investigation of reduction reaction Table 10.1. To our delight the reaction between
4C3NT and H2S-laden MDEA in the presence of An as PTC proceeded smoothly to
produce desired product () in 96% yield and 100% selectivity after 90 minutes of reaction.
After getting this excellent preliminary results we started to compare it with other PT
catalysts shown in Table 10.1. The order of reactivity of these PT catalysts is
(10.1)
(10.2)
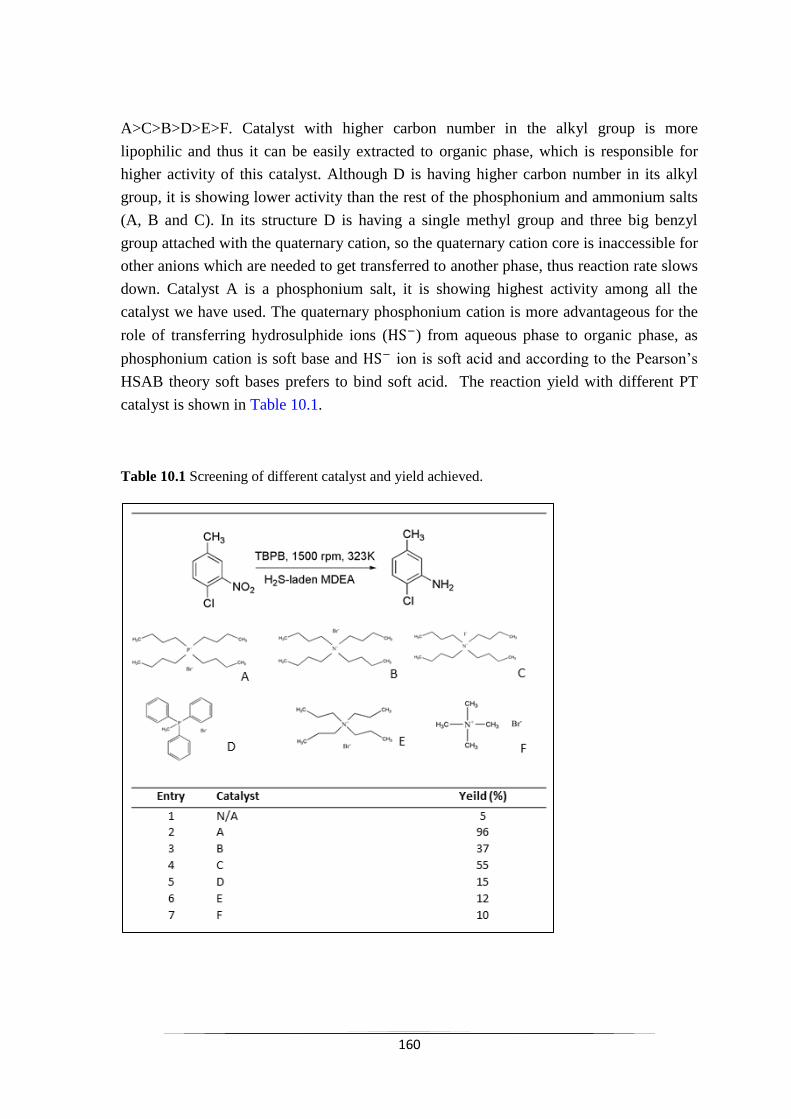
160
A>C>B>D>E>F. Catalyst with higher carbon number in the alkyl group is more
lipophilic and thus it can be easily extracted to organic phase, which is responsible for
higher activity of this catalyst. Although D is having higher carbon number in its alkyl
group, it is showing lower activity than the rest of the phosphonium and ammonium salts
(A, B and C). In its structure D is having a single methyl group and three big benzyl
group attached with the quaternary cation, so the quaternary cation core is inaccessible for
other anions which are needed to get transferred to another phase, thus reaction rate slows
down. Catalyst A is a phosphonium salt, it is showing highest activity among all the
catalyst we have used. The quaternary phosphonium cation is more advantageous for the
role of transferring hydrosulphide ions ( ) from aqueous phase to organic phase, as
phosphonium cation is soft base and ion is soft acid and according to the Pearson‟s
HSAB theory soft bases prefers to bind soft acid. The reaction yield with different PT
catalyst is shown in Table 10.1.
Table 10.1 Screening of different catalyst and yield achieved.
161
10.4 Mechanism of L-L PTC:
Current reduction reaction follows a complex mechanism and the number of elementary
reaction steps involved is envisaged. In the aqueous phase an ionic equilibrium exists
between sulphide ( and hydrosulphide ions. This ionic equilibrum is affected
by the concentration of basic MDEA. Formation of the ( and ion is shown in
the Scheme 10.1 from Equation (10.4) to Equation (10.6). Similar ionic equilibrium is
also reported in aqueous ammonium sulphide solution 54
.
Reaction mechanism of current reaction is proposed based on some previously published
work (Scheme 10.1) 25,28,55,56
. Sulphur can remain in multiple valence states (-2 to +6) and
in the aqueous phase sulphur exist in multiple anionic forms (
).
These anion can easily bind to the quaternary cations and get transfer to the organic
phase. On the other hand quaternary cations, , pairs up with the anions available in
aqueous phase for its reaction with organic substrate, but most of the quaternary cations
are found in the form of in the reaction medium.
Generally PTC mechanism can be expained by two approaches 1. extraction mechanism
by Stark‟s 57
2. Interfecial mechanism by Makosza‟s 58
. According to the extraction
mechanism when reaction rate increases proportionately with higher organophilicity of
quaternary catlyst and catalyst concentration but it is not related with stirring speed i.e.
reaction rate remains constant even at higher stirring speed, then the reaction is following
extraction mechanism 59,60
. Macosza‟s interfacial mechanism is highly dependent on
stirring speed. As our reaction is mass transfer effect free beyond 1500 rpm and above
this the reaction rate does not change, which made creent reaction following Stark‟s
extraction mechanism.
Current L-L PTC system is a cyclic process and it starts with the formation of ion pair
between quaternary cations and hydrosulphide ions to form ion pair,
then in the next step the ion pair transferred to the organic phase to react with the organic
substrate. After that a number of elementary reaction took place in the organic phase and
which leads to the formation of aromatic amines as shown in Scheme 10.1 (Equation
10.11 to Equation 10.16). In the organic phase a number of intermediates has formed
(nitrosobenzene and benzene hydroxylamines) 61,62
, but during GC-MS analysis these
intermediates have not been detected, which may be due to the fast appearance and
disappearance of those intermediates28,61,30,63,64
. At the last step of PTC cycle the
quaternary ion pair gets inactivated (Equation (10.17) and then it returns back
to the aqueous phase and reacts with with and got regenerated ( ) (Equation
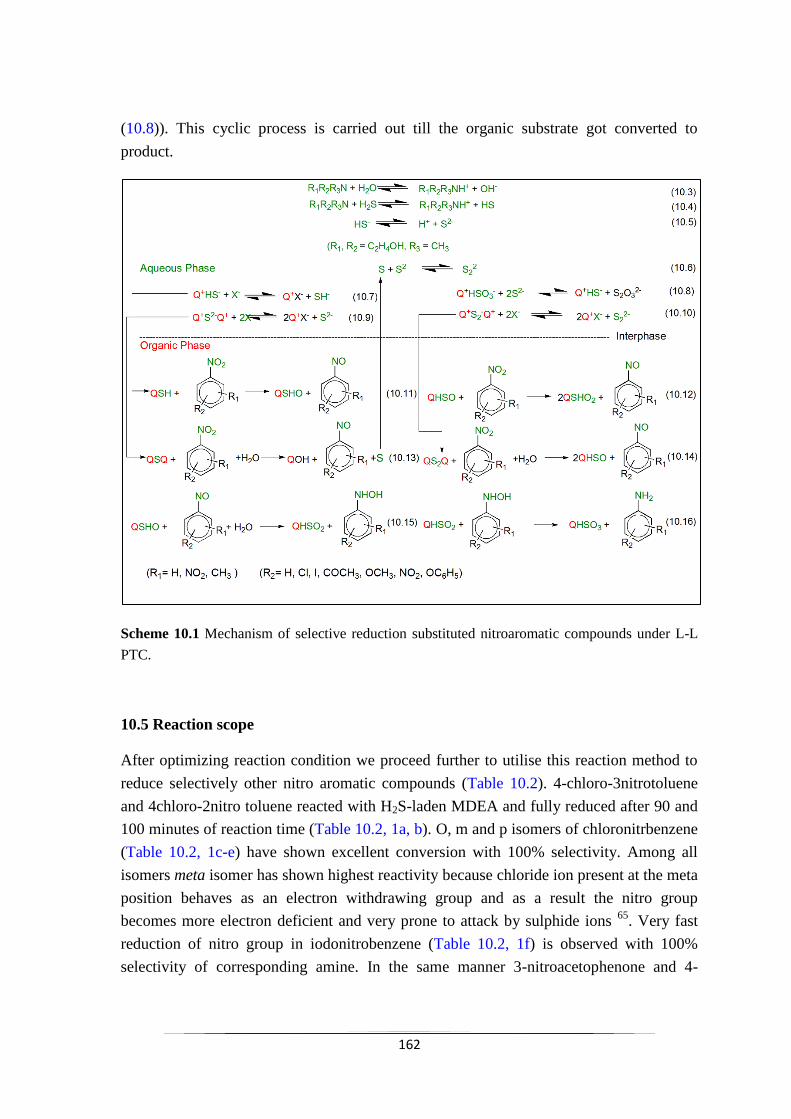
162
(10.8)). This cyclic process is carried out till the organic substrate got converted to
product.
Scheme 10.1 Mechanism of selective reduction substituted nitroaromatic compounds under L-L
PTC.
10.5 Reaction scope
After optimizing reaction condition we proceed further to utilise this reaction method to
reduce selectively other nitro aromatic compounds (Table 10.2). 4-chloro-3nitrotoluene
and 4chloro-2nitro toluene reacted with H2S-laden MDEA and fully reduced after 90 and
100 minutes of reaction time (Table 10.2, 1a, b). O, m and p isomers of chloronitrbenzene
(Table 10.2, 1c-e) have shown excellent conversion with 100% selectivity. Among all
isomers meta isomer has shown highest reactivity because chloride ion present at the meta
position behaves as an electron withdrawing group and as a result the nitro group
becomes more electron deficient and very prone to attack by sulphide ions 65
. Very fast
reduction of nitro group in iodonitrobenzene (Table 10.2, 1f) is observed with 100%
selectivity of corresponding amine. In the same manner 3-nitroacetophenone and 4-
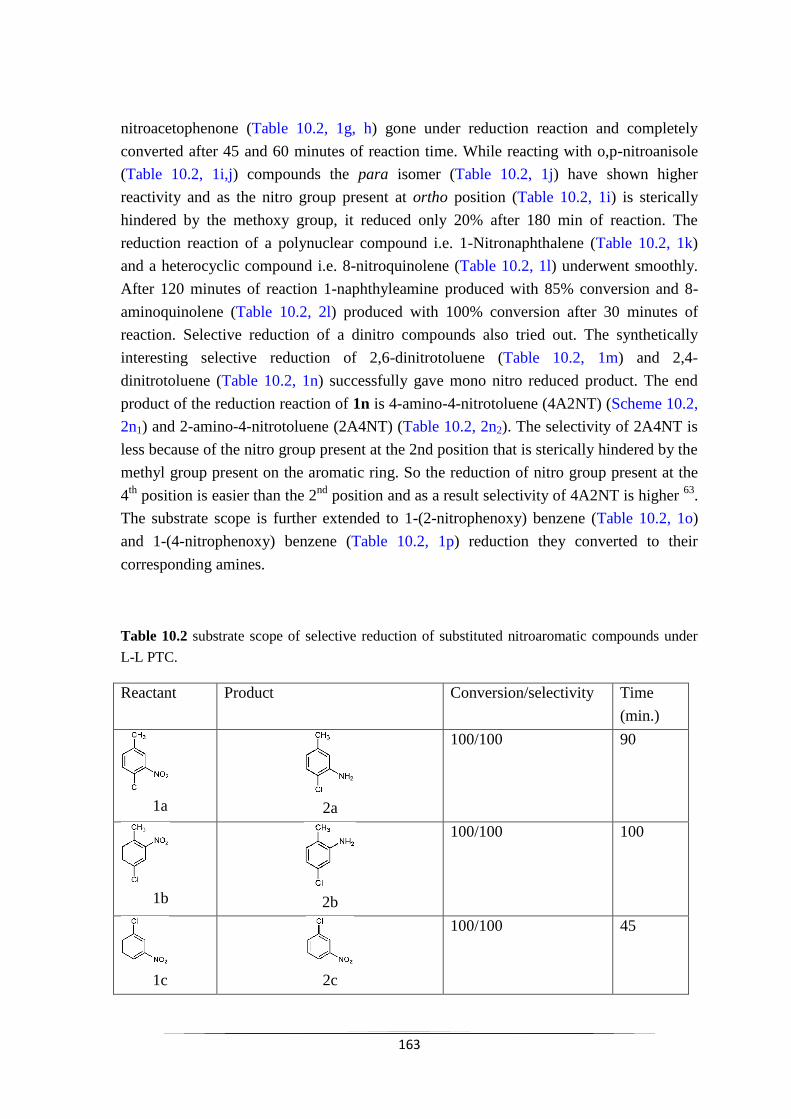
163
nitroacetophenone (Table 10.2, 1g, h) gone under reduction reaction and completely
converted after 45 and 60 minutes of reaction time. While reacting with o,p-nitroanisole
(Table 10.2, 1i,j) compounds the para isomer (Table 10.2, 1j) have shown higher
reactivity and as the nitro group present at ortho position (Table 10.2, 1i) is sterically
hindered by the methoxy group, it reduced only 20% after 180 min of reaction. The
reduction reaction of a polynuclear compound i.e. 1-Nitronaphthalene (Table 10.2, 1k)
and a heterocyclic compound i.e. 8-nitroquinolene (Table 10.2, 1l) underwent smoothly.
After 120 minutes of reaction 1-naphthyleamine produced with 85% conversion and 8-
aminoquinolene (Table 10.2, 2l) produced with 100% conversion after 30 minutes of
reaction. Selective reduction of a dinitro compounds also tried out. The synthetically
interesting selective reduction of 2,6-dinitrotoluene (Table 10.2, 1m) and 2,4-
dinitrotoluene (Table 10.2, 1n) successfully gave mono nitro reduced product. The end
product of the reduction reaction of 1n is 4-amino-4-nitrotoluene (4A2NT) (Scheme 10.2,
2n1) and 2-amino-4-nitrotoluene (2A4NT) (Table 10.2, 2n2). The selectivity of 2A4NT is
less because of the nitro group present at the 2nd position that is sterically hindered by the
methyl group present on the aromatic ring. So the reduction of nitro group present at the
4th
position is easier than the 2nd
position and as a result selectivity of 4A2NT is higher 63
.
The substrate scope is further extended to 1-(2-nitrophenoxy) benzene (Table 10.2, 1o)
and 1-(4-nitrophenoxy) benzene (Table 10.2, 1p) reduction they converted to their
corresponding amines.
Table 10.2 substrate scope of selective reduction of substituted nitroaromatic compounds under
L-L PTC.
Reactant Product Conversion/selectivity Time
(min.)
1a
2a
100/100 90
1b
2b
100/100 100
1c
2c
100/100 45
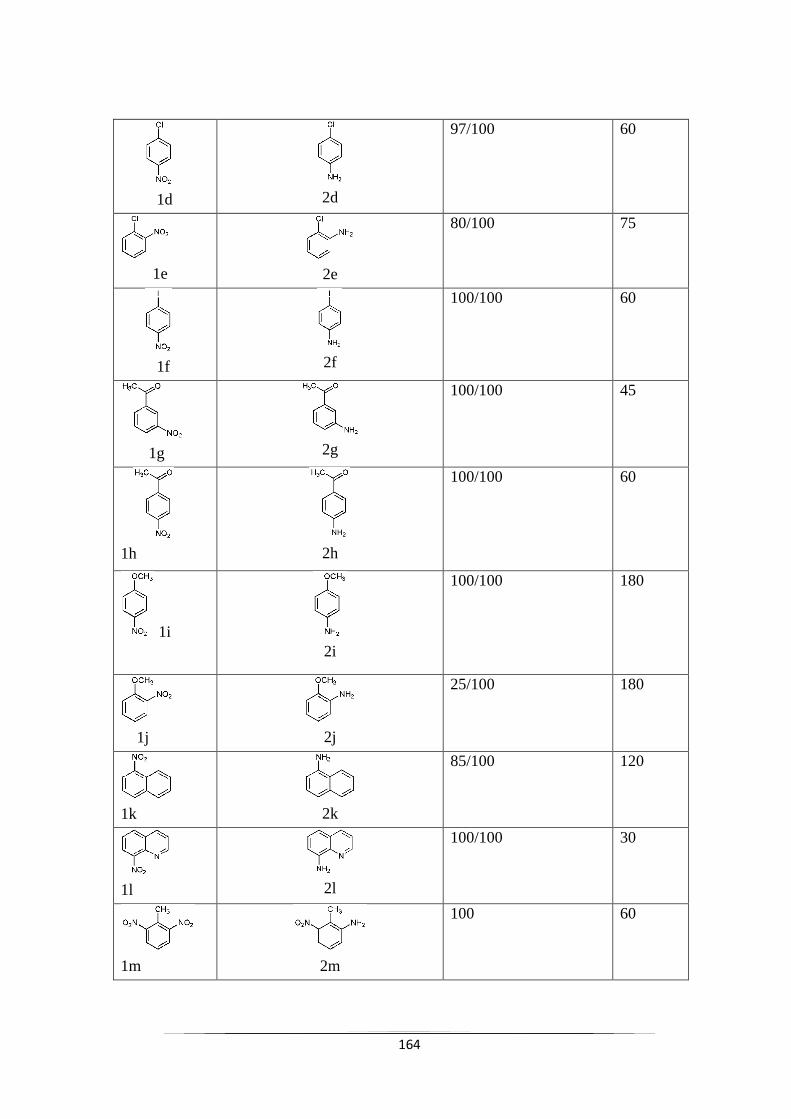
164
1d
2d
97/100 60
1e
2e
80/100 75
1f
2f
100/100 60
1g
2g
100/100 45
1h
2h
100/100 60
1i
2i
100/100 180
1j
2j
25/100 180
1k
2k
85/100 120
1l
2l
100/100 30
1m
2m
100 60
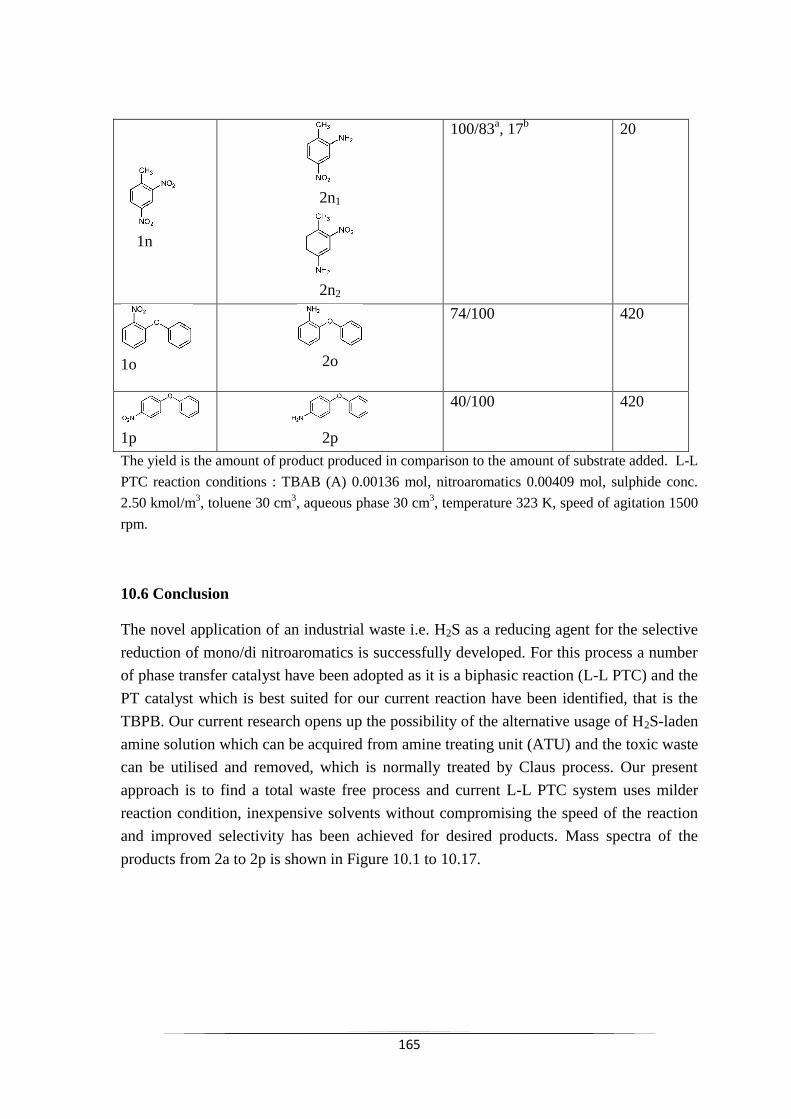
165
1n
2n1
2n2
100/83a, 17
b 20
1o
2o
74/100 420
1p
2p
40/100 420
The yield is the amount of product produced in comparison to the amount of substrate added. L-L
PTC reaction conditions : TBAB (A) 0.00136 mol, nitroaromatics 0.00409 mol, sulphide conc.
2.50 kmol/m3, toluene 30 cm
3, aqueous phase 30 cm
3, temperature 323 K, speed of agitation 1500
rpm.
10.6 Conclusion
The novel application of an industrial waste i.e. H2S as a reducing agent for the selective
reduction of mono/di nitroaromatics is successfully developed. For this process a number
of phase transfer catalyst have been adopted as it is a biphasic reaction (L-L PTC) and the
PT catalyst which is best suited for our current reaction have been identified, that is the
TBPB. Our current research opens up the possibility of the alternative usage of H2S-laden
amine solution which can be acquired from amine treating unit (ATU) and the toxic waste
can be utilised and removed, which is normally treated by Claus process. Our present
approach is to find a total waste free process and current L-L PTC system uses milder
reaction condition, inexpensive solvents without compromising the speed of the reaction
and improved selectivity has been achieved for desired products. Mass spectra of the
products from 2a to 2p is shown in Figure 10.1 to 10.17.
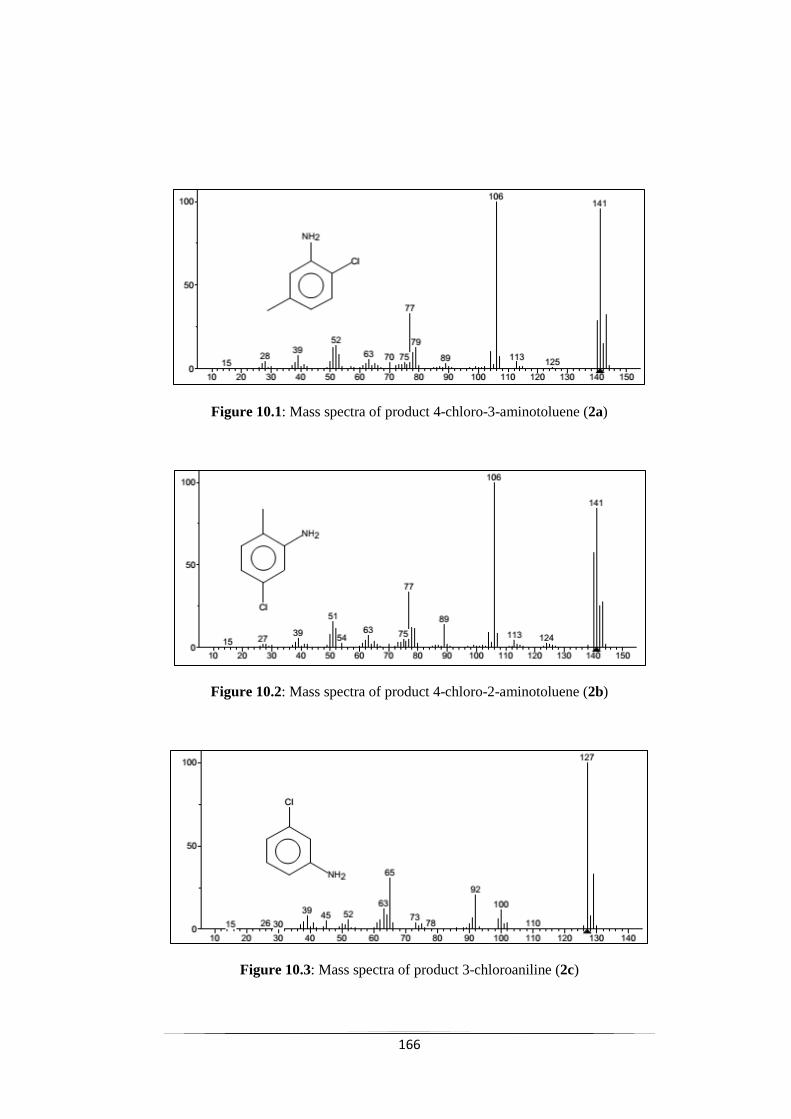
166
Figure 10.1: Mass spectra of product 4-chloro-3-aminotoluene (2a)
Figure 10.2: Mass spectra of product 4-chloro-2-aminotoluene (2b)
Figure 10.3: Mass spectra of product 3-chloroaniline (2c)
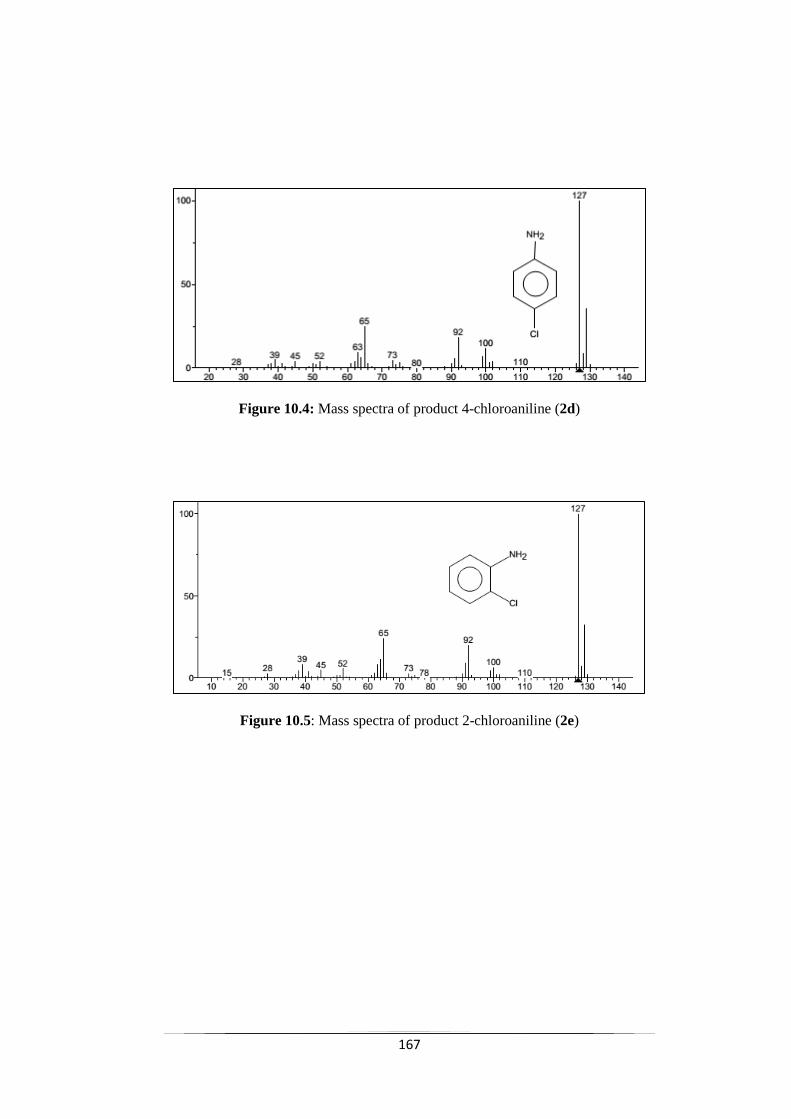
167
Figure 10.4: Mass spectra of product 4-chloroaniline (2d)
Figure 10.5: Mass spectra of product 2-chloroaniline (2e)
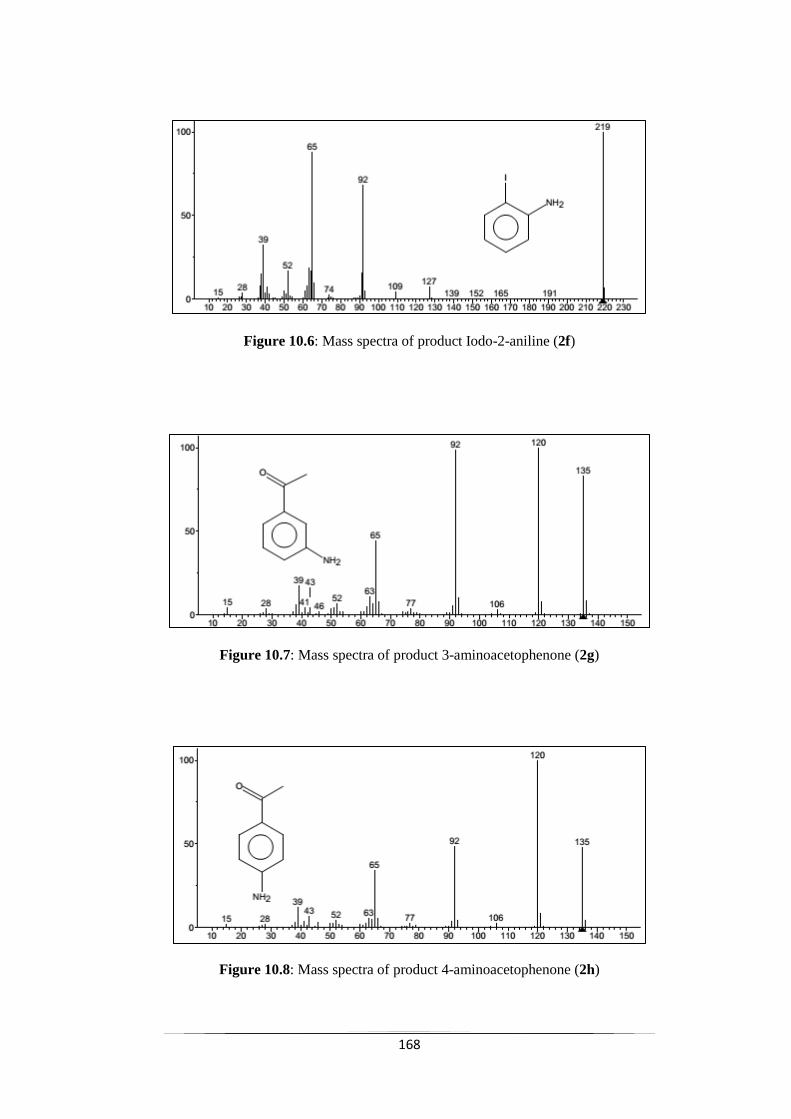
168
Figure 10.6: Mass spectra of product Iodo-2-aniline (2f)
Figure 10.7: Mass spectra of product 3-aminoacetophenone (2g)
Figure 10.8: Mass spectra of product 4-aminoacetophenone (2h)
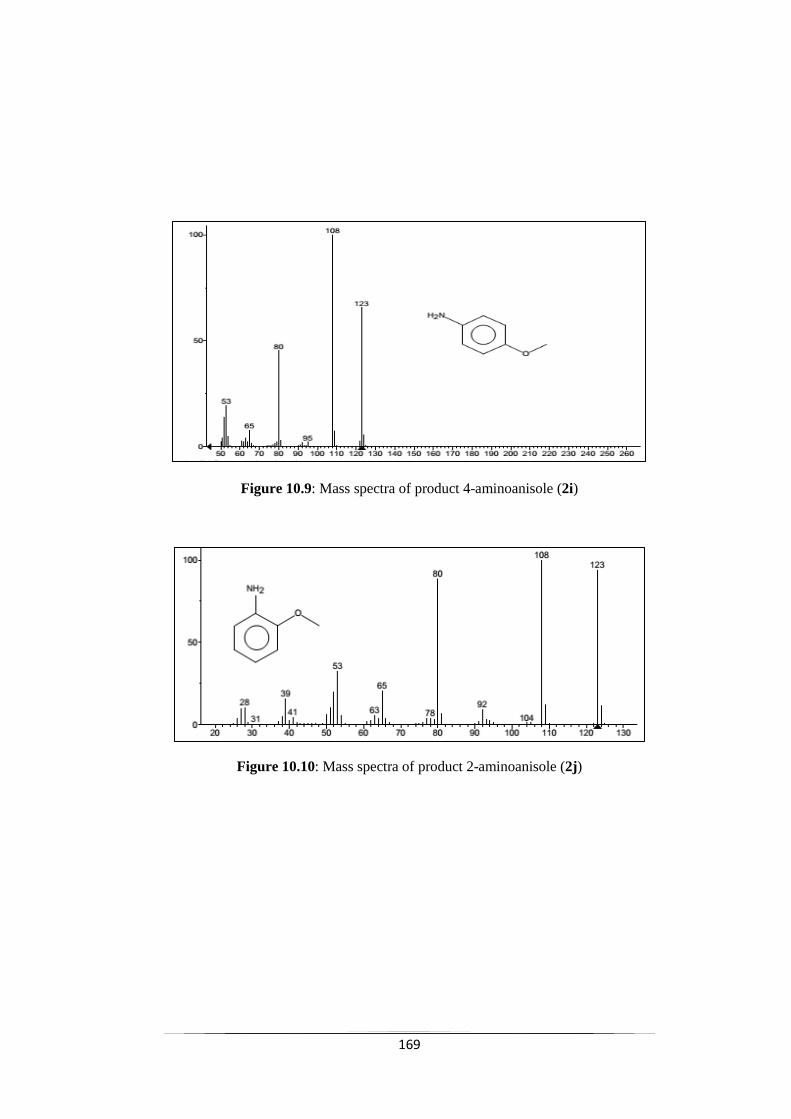
169
Figure 10.9: Mass spectra of product 4-aminoanisole (2i)
Figure 10.10: Mass spectra of product 2-aminoanisole (2j)
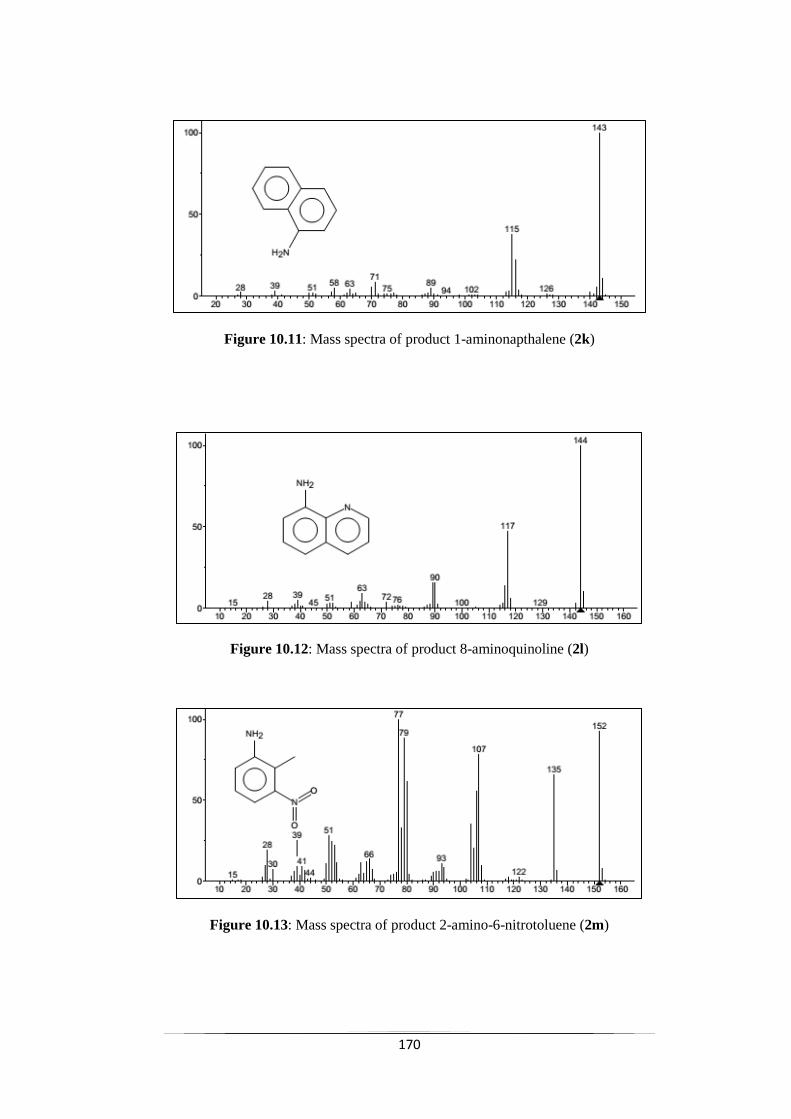
170
Figure 10.11: Mass spectra of product 1-aminonapthalene (2k)
Figure 10.12: Mass spectra of product 8-aminoquinoline (2l)
Figure 10.13: Mass spectra of product 2-amino-6-nitrotoluene (2m)
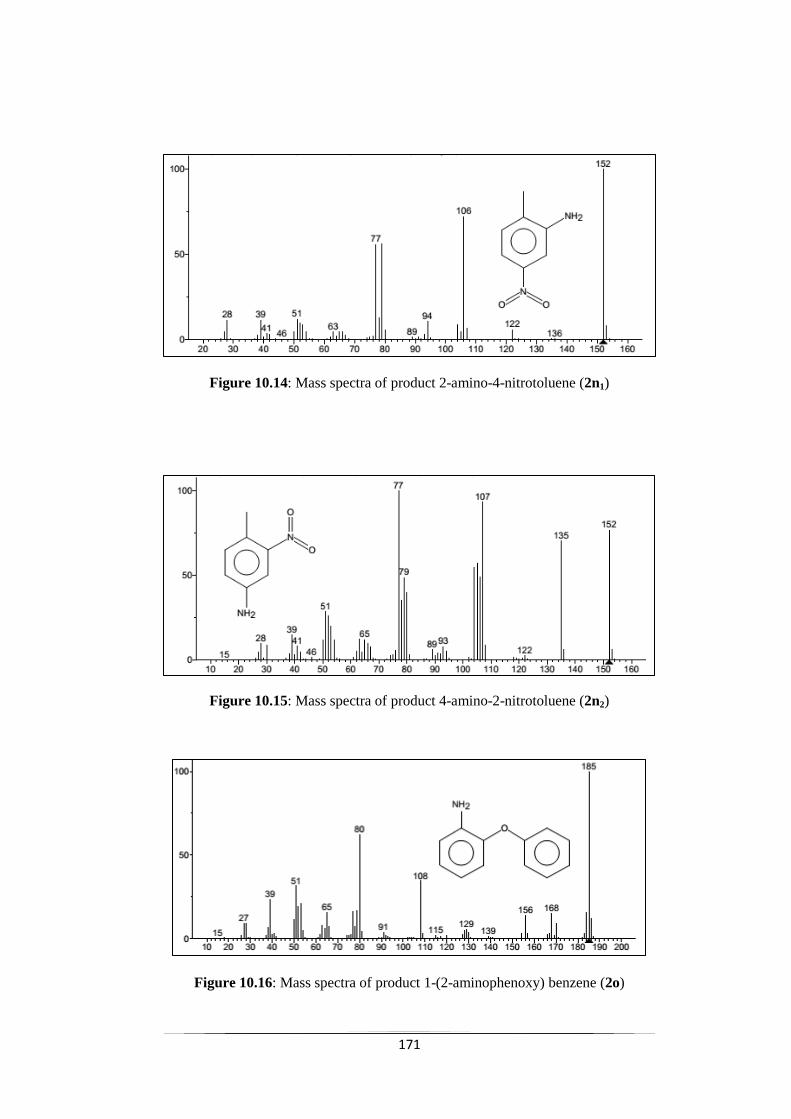
171
Figure 10.14: Mass spectra of product 2-amino-4-nitrotoluene (2n1)
Figure 10.15: Mass spectra of product 4-amino-2-nitrotoluene (2n2)
Figure 10.16: Mass spectra of product 1-(2-aminophenoxy) benzene (2o)
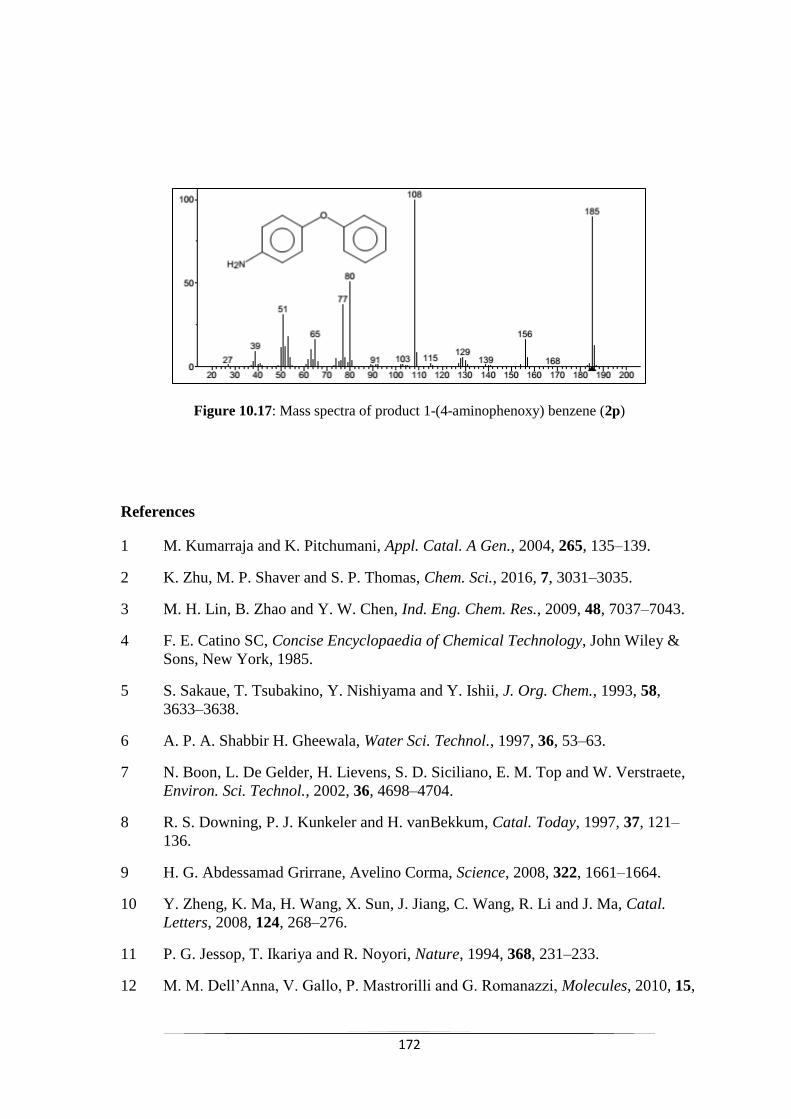
172
Figure 10.17: Mass spectra of product 1-(4-aminophenoxy) benzene (2p)
References
1 M. Kumarraja and K. Pitchumani, Appl. Catal. A Gen., 2004, 265, 135–139.
2 K. Zhu, M. P. Shaver and S. P. Thomas, Chem. Sci., 2016, 7, 3031–3035.
3 M. H. Lin, B. Zhao and Y. W. Chen, Ind. Eng. Chem. Res., 2009, 48, 7037–7043.
4 F. E. Catino SC, Concise Encyclopaedia of Chemical Technology, John Wiley &
Sons, New York, 1985.
5 S. Sakaue, T. Tsubakino, Y. Nishiyama and Y. Ishii, J. Org. Chem., 1993, 58,
3633–3638.
6 A. P. A. Shabbir H. Gheewala, Water Sci. Technol., 1997, 36, 53–63.
7 N. Boon, L. De Gelder, H. Lievens, S. D. Siciliano, E. M. Top and W. Verstraete,
Environ. Sci. Technol., 2002, 36, 4698–4704.
8 R. S. Downing, P. J. Kunkeler and H. vanBekkum, Catal. Today, 1997, 37, 121–
136.
9 H. G. Abdessamad Grirrane, Avelino Corma, Science, 2008, 322, 1661–1664.
10 Y. Zheng, K. Ma, H. Wang, X. Sun, J. Jiang, C. Wang, R. Li and J. Ma, Catal.
Letters, 2008, 124, 268–276.
11 P. G. Jessop, T. Ikariya and R. Noyori, Nature, 1994, 368, 231–233.
12 M. M. Dell‟Anna, V. Gallo, P. Mastrorilli and G. Romanazzi, Molecules, 2010, 15,
173
3311–3318.
13 M. L. Kantam, R. Chakravarti, U. Pal, B. Sreedhar and S. Bhargava, Adv. Synth.
Catal., 2008, 350, 822–827.
14 A. Corma, P. Serna, P. Concepcin and J. J. Calvino, J. Am. Chem. Soc., 2008, 130,
8748–8753.
15 M. Boronat, P. Concepción, A. Corma, S. González, F. Illas and P. Serna, J. Am.
Chem. Soc., 2007, 129, 16230–16237.
16 L. F. Chen and Y. W. Chen, Ind. Eng. Chem. Res., 2006, 45, 8866–8873.
17 P. Corma, A.; Serna, Science (80-. )., 2006, 332–334.
18 H. Liu, J. Deng and W. Li, Catal. Letters, 2010, 137, 261–266.
19 M. Kumar, U. Sharma, S. Sharma, V. Kumar, B. Singh and N. Kumar, RSC Adv.,
2013, 3, 4894–4898.
20 C. T. Redemann and C. Ernst Redemann, Org. Synth., 1949, 29, 8.
21 K. Junge, B. Wendt, N. Shaikh and M. Beller, Chem. Commun., 2010, 1769–1771.
22 J. W. Bae, Y. J. Cho, S. H. Lee, C.-O. M. Yoon and C. M. Yoon, Chem. Commun.,
2000, 1857–1858.
23 G. R. Srinivasa, K. Abiraj and D. C. Gowda, Indian J. Chem. - Sect. B Org. Med.
Chem., 2004, 43, 192–195.
24 W. G. Dauben, Organic reactions, John Wiley & Sons, Inc., New York, 1973.
25 G. D. Yadav, Y. B. Jadhav and S. Sengupta, J. Mol. Catal. A Chem., 2003, 200,
117–129.
26 S. K. Maity, N. C. Pradhan and A. V. Patwardhan, Appl. Catal. B Environ., 2008,
77, 418–426.
27 S. K. Maity, N. C. Pradhan and A. V. Patwardhan, Appl. Catal. A Gen., 2006, 301,
251–258.
28 G. D. Yadav, Y. B. Jadhav and S. Sengupta, Chem. Eng. Sci., 2003, 58, 2681–
2689.
29 C. Wright, US Pat., US 8835677 B2, 2014, 1–8.
30 G. D. Yadav and S. V. Lande, Ind. Eng. Chem. Res., 2007, 46, 2951–2961.
31 Y. Belmabkhout, G. De Weireld and A. Sayari, Langmuir, 2009, 25, 13275–13278.
32 D. D. E. Koyuncu and S. Yasyerli, Ind. Eng. Chem. Res., 2009, 48, 5223–5229.
33 M. A. Plummer, US Pat., US5334363 A, 1994.
174
34 F. Faraji, Int. J. Hydrogen Energy, 1998, 23, 451–456.
35 J. M. A. S. Cervera-March, L. Borrell, J. Giménez, R. Simarro, Int. J. Hydrogen
Energy, 1992, 17, 683–688.
36 H. Huang, Y. Yu and K. H. Chung, Energy & Fuels, 2009, 23, 4420–4425.
37 K. Petrov and S. Srinivasan, Int. J. Hydrogen Energy, 1996, 21, 163–169.
38 S. S Srinivasan. and A. J. A. Z. Mao, A. Anani, R. E. White, J. Electrochem. Soc.,
1991, 138, 1299–1303.
39 J. O. N. E. Noringt and E. A. Fletchers, Energy, 1982, 7, 651–666.
40 M. Groisil, S. Ibrahim, A. K. Gupta and A. AlShoaibi, Energy Procedia, 2015, 75,
3066–3070.
41 M.-H and K. Shen, J. Chem. Eng. Data, 1993, 105–108.
42 H. Xu, C. Zhang and Z. Zheng, Society, 2002, 6175–6180.
43 H. Xu, C. Zhang and Z. Zheng, Simulation, 2002, 2953–2956.
44 W. Pohl, J. Menzel, US Pat., US5607594 A, 1997.
45 G. D. Yadav, Top. Catal., 2004, 29, 145–161.
46 Z. Li, A. Zhu and J. Yang, J. Heterocycl. Chem., 2012, 49, 1458–1461.
47 P.-J. Lin and H.-M. Yang, J. Mol. Catal. A Chem., 2005, 235, 293–301.
48 T. T. Fujihira T. and M. S. Seno, J. Mol. Catal. A Chem., 1999, 137, 65–75.
49 W. W. Scott, Standard Methods of Chemical Analysis, Van Nostrand, New York,
6th Editio., 1966.
50 N. C. Pradhan and M. M. Sharma, Ind. Eng. Chem. Res., 1992, 31, 1606–1609.
51 R. R. Bhave and M. M. Sharma, J. Chem. Technol. Biotechnol., 1981, 31, 93–102.
52 N. C. Pradhan, Indian J. Chem. Technol., 2000, 7, 276–279.
53 H. Gilman, Wiley, New York, 1941, p. 52.
54 S. K. Maity, N. C. Pradhan and A. V. Patwardhan, Chem. Eng. J., 2008, 141, 187–
193.
55 G. D. Yadav and S. V. Lande, Adv. Synth. Catal., 2005, 347, 1235–1241.
56 G. D. Yadav and S. V. Lande, Appl. Catal. A Gen., 2005, 287, 267–275.
57 C. M. Starks, J. Am. Chem. Soc., 1971, 93, 195.
58 A. Makosza, M ; Jonczyk, Org. Synth., 1976, 55, 91.
175
59 P. A. Vivekanand and T. Balakrishnan, Catal. Commun., 2009, 10, 1962–1966.
60 E. Murugan and A. Siva, J. Mol. Catal. A Chem., 2005, 235, 220–229.
61 J. Klausen, J. Ranke and R. P. Schwarzenbach, Chemosphere, 2001, 44, 511–517.
62 B. Zhou, J. Song, H. Zhou, T. Wu and B. Han, Chem. Sci., 2016, 7, 463–468.
63 R. V. M. and R. V. Chaudhari, Ind. Eng. Chem. Res., 1999, 38, 906–915.
64 E. C. Division, Appl. Environ. Microbiol., 1984, 47, 1295–1298.
65 J. P. Ldoux and Wendell Plain, J. Chem. Educ., 1972, 49, 133.
176
Abstract
This chapter outlines the conclusions which are gathered from the previous chapters. Few
suggestions for the future work have been proposed based on the observations, results
and conclusions encapsulated from the present study. How the present study can be
utilised to improve the knowledge and utilization of phase transfer catalysis are shown.
11.1 Introduction
Present work carried out in the thesis emphasises a state of the art approach to the
utilization of a pollutant and hazardous gas, H2S, which is one of the most common bi-
product of many industries to synthesise value added fine chemicals. Our current
approach is a two-step process, first H2S gas is removed from the gas stream by
chemisorption in conventional solvents and second stage is the utilisation of the solution
obtained from the first stage to produce fine chemicals. The first stage is an industrially
adopted process which utilises alkanolamines as an absorbent and it can be imported from
the amine treating unit (ATU). The present work is stressed on the detailed study of the
synthesis of the fine chemicals like aromatic amines with utilization of the H2S-laden
aqueous alkanolamies in a batch reactor.
A number of aromatic amines have been successfully produced by Zinin reduction from
respective substituted nitro aromatic compounds. The reduction of chloronnitrobenzene
(CNB) by H2S-laden monoethanolamine (MEA) in the presence of Amberlite IR400 (Cl-
) as an insoluble PT catalyst (chapter 5), reduction CNB by H2S-laden n-methyl diethanol
amine (MDEA) in the presence of n-tetra butyl phosphonium bromide (TBPB) as PT
catalyst (chapter 6), reduction 1-nitronapthalene (1-NN) by H2S-(MDEA) in the presence
of TBPB as PT catalyst (chapter 7), reduction 3-nitroacetophenone (3-NAP) by H2S-
(MDEA) in the presence of TBPB as PT catalyst (chapter 8), reduction dinitrotoluenes
(DNT) by H2S-(MDEA) in the presence of TBPB as PT catalyst (chapter 9) and finally a
number of mono nitro, dinitro, heterocyclic nitro compound has been reduced to identical
reaction condition in the presence of TBPB as PT catalyst in bi-phasic reaction has been
investigated (chapter 10). During the present studies variety of reaction parameters (i. e.
stirring speed, temperature, catalyst loading, reactant loading, suphide concentration,
MEA/MDEA concentration and elemental sulphur loading) has been studied and their
influence on the conversion, yield and selectivity have been correctly enquired. Reaction
mechanism of either liquid-liquid-solid (L-L-S) or liquid-liquid (L-L) phase transfer
catalysis has been developed for all the reaction studied. The stirring speed was found to
have very little effect on the reaction rate. So the reaction can be assumed to have no mass
177
transfer resistance when it is operated at 1000 rpm. All the experiments were carried out
at 1500 rpm to ensure that the reaction is only kinetically controlled one. Based on the
kinetic studies a mathematical model has been developed (Chapter 5, 6, 7, 9) and the
model is able to predict the conversion correctly. Statistical method for the designing of
experiments has also been adopted in chapter 8 to optimise controlling process parameters
in order to enhance the conversion and selectivity of desired product.
11. 2 Conclusions
11.2.1 The salient achievements and major conclusions of chapter 5:
The Zinin reduction of m-CNB by -laden MEA was studying under L-L-S
mode in presence of solid reusable PTC, Amberlite IR-400 to yield m-CA as the
sole product.
The reaction was found to be kinetically controlled with apparent activation
energy of 56.16 kJ/mol. The rate of reduction was found to be first order with
respect to the concentration of catalyst and reactant and second order with respect
to the concentration of sulphide.
Only by increasing the catalyst concentration, reactant conversion of more than
62% was achieved with 10 grams (10% w/v) of catalyst loading whereas it was
about 36% without catalyst even after 8 hours of reaction under otherwise
identical conditions.
It can be seen that up to the three cycles, the catalyst can be used without
significant decrease in conversion, indicating that the catalyst has got excellent
reusable and recyclable property and high stability.
The process was found to follow a complex mechanism involving different ions
and molecules. Based on detailed kinetic studies and proposed mechanism, a
kinetic model was developed considering aqueous phase equilibria of -MEA-
H20 system and interfacial mechanism for insoluble PTC. The developed model
predicts conversion of
11.2.2 The salient achievements and major conclusions of chapter 6:
The liquid-liquid (L-L) phase transfer catalysis (PTC) reactions are carried out
under milder conditions, using less-expensive solvents at much faster reaction rate
and improved selectivity to desired products and, thus by definition, are waste
minimization processes.
This work addresses the novelties of the kinetics and mechanism of the selective
reduction of CNBs to respective amines using hydrogen sulphide absorbed in
industrially important sour gas absorber under L-L PTC.
178
The effects of different parameters such as stirring speed, temperature, MDEA
concentration, reactant concentrations (both sulphide and CNB), and sulphur
loading were studied. It was observed that the reaction rates were intensified under
L-L PTC. It leads to 100% selectivity of m-Chlroaniline.
The process was found to follow a complex mechanism involving different ions
and molecules. Based on detailed kinetic studies and proposed mechanism, a
kinetic model was developed considering Stark‟s extraction mechanism for L-L
PTC. The developed model predicts the conversion of m-CNB reasonable well at
all temperatures.
For this process, a number of phase transfer catalyst have been adopted as it is a
biphasic reaction (L-L PTC) and the PTC which is best suited for our current
reaction has been identified, that is TBPB.
11.2.3 The salient achievements and major conclusions of chapter 7:
H2S-rich MDEA is successfully used as reducing agent for Zinin reduction of 1-
NN in this work and 100% selectivity of 1-AN is achieved after the reaction. The
reaction is kinetically controlled with an activation energy of 20.77 kJ/mol.
This work addresses the novelties of the kinetics and mechanism of the selective
reduction of CNBs to respective amines using hydrogen sulphide absorbed in
industrially significant sour gas absorber under L-L PTC. The effects of different
parameters such as stirring speed, temperature, MDEA concentration, reactant
concentrations (both sulphide and 1-NN), and sulphur loading were studied.
The process was found to follow a complex mechanism involving different ions
and molecules. Based on detailed kinetic studies and proposed mechanism, a
kinetic model was developed considering Stark‟s extraction mechanism for L-L
PTC. The developed model predicts the conversion of 1-NN reasonable well at all
temperatures.
11.2.4 The salient achievements and major conclusions of chapter 8:
Based on experimental design methodology a statistical model of single response
surface optimization was carried out on the liquid-liquid phase transfer catalyzed
the reaction of p-NAP with H2S-ladden MDEA.
A quadratic model developed based on the relationship between p-NAP
conversion and four independent variables (temperature, catalyst conc., p-
NAP/sulfide mole ratio and MDEA conc.).
The contour plots, 3D surface plots and the value of different regression
coefficients have clearly explained the single parameter effect and interaction
effects of dual parameters on the p-NAP conversion.
179
The model fits well and is verified with optimum conditions for highest p-NAP
conversion. R2 value of the regression analysis confirms a good agreement
between the experimental data and predicted response.
11.2.5 The salient achievements and major conclusions of chapter 9:
The current study shows the novelties of L-L PTC in the selective reduction of
2,4-DNT to the corresponding amino compound by novel Zinin reagent, H2S-
laden MDEA under milder reaction conditions, thereby eliminating the use of a
costly metallic catalyst, high-temperature, and high-pressure reaction.
As the reaction was very fast, 100% conversion was achieved in a very short time
room temperature (303K). Selective reduction leads to the formation of two
isomers- 2A4NT and 4A2NT, among them 4A2NT was much more abundant than
2A4NT.
The detailed parametric study suggested that with the increase of temperature,
catalyst concentration, sulphide ion concentration, MDEA concentration, the
selectivity of 4A2NT decreases and that of 2A4NT increases.
Highest selectivity of 4A2NT was observed as 82.26% when reactant
concentration in the reactor was 1.0981 kmol/m3. Reaction kinetics has been
evaluated after details parametric studies and a mechanistic model also been
proposed, which was further confirmed by experimental data.
The activation energy of 46.25 kJ/mol makes current reaction a kinetically
controlled one.
11.2.6 The salient achievements and major conclusions of chapter 10:
In summary, the novel application of an industrial waste i.e. H2S as a reducing
agent for the chemoselective reduction of mono/di-substituted nitroaromatics is
successfully developed.
For this process, a number of phase transfer catalyst have been adopted as it is a
biphasic reaction (L-L PTC) and the PTC which is best suited for our current
reaction has been identified, that is TBPB.
Our current research opens up the possibility of the alternative usage of H2S-laden
amine solution which can be acquired from amine treating unit (ATU) and is
being normally treated by Claus process.
Our present approach is to find a total waste free process and current L-L PTC
system uses milder reaction condition, inexpensive solvents without
compromising the speed of the reaction and improved selectivity has been
achieved for desired products.
180
11. 3 Future recommendations
This present work is based upon the idea of reducing nitroaromatic compounds by H2S-
laden aqueous alkanolamine solution under either L-L PTC or L-L-S PTC reaction
condition. Based on the current findings a number of future recommendations can be
stated for the improvement of current process and for further reducing the cost and labour
of the process.
Current study is a two pot system which requires multiple subsystems to prepare
reducing agent (H2S-laden alkanolamines) and reducing reaction was performed in
a separate batch reactor. The whole system can be transformed into a single pot
system where autoclave reactor is the only equipment to be used. H2S can be
directly fed into the autoclave and organic substrate and catalyst mixed with
organic solvent will be added separately.
Solvent free process is unique approach which is more environment friendly and
possesses many advantages compared to present approaches such as requirement
of small size reactor, cheaper operation and easier handling, easy mode of
separation of product.
The influence of other parameters on the conversion and selectivity can also be
enquired. The pH of aqueous phase (H2S-laden alkanolamines), addition of other
anions (example NaCl), addition of co-catalyst etc.
In our present work for elimination the mass transfer effect we provide stirring
effect with a 6 blade stirrer at 1500 rpm which is quite energy intensive process.
So this stirring can be replaced with ultrasound sonication which can make this
work green technology.
For the increasing the reaction rate heating effect is provided with water bath in
our present work. Instead of using water bath the whole reaction can be operated
in microwave reactor which makes this work as a green technology.
The aqueous phase is an aqueous solution of alkanolamines (MEA/ MDEA) which
absorbed with H2S. There are other industrially used alkanolamines present such
as di-2-propanolamine (DIPA), secondary amine diethnolamine (DEA),
triethnolamine (TEA) which can be compared with current alkanolamines used.
This current system is an L-L or L-L-S PTC system which can be converted to
liquid-liquid-liquid (L-L-L) PTC system. By doing so product separation problem
can be avoided and faster reaction can be achieved.
181
Reusable catalyst is more favourable for any catalyst reaction because it not only
saves lots of money but it is easy to use also if we can little compromise the
reaction rate. Single or multisite solid phase transfer catalyst can be manufactured
or procured commercially and utilised in the current systems.
The aqueous amine solution can be reused for after the completion of the reaction.
The used alkanolamine solution can be again bubbled with H2S gas to get
regenerated and used to generate industrially important value added chemicals.
Dissemination
International Journals
1. Ujjal Mondal, Sujit Sen and Gaurav Singh,“Advances in hydrogen sulphide
utilisation: phase transfer catalysed selective reduction of nitronaphthalene”, RSC
Advances 2015, 5, 102942–102952
2. Ujjal Mondal, Aslam Puthankot, Sujit Sen and Gaurav Singh,“Novelties of triphasic
phase transfer catalysed Zinin reduction of nitrochlorobenzene by H2S-laden
monoethanolamine”, RSC Advances 2015, 2016, 6, 23666–23676
3. Ujjal Mondal, Sujit Sen, “Multivariate analysis in selective nitroacetophenone
conversion by toxic hydrogen sulfide under phase transfer catalysis „‟, Org. Process Res.
Dev. Org. Process Res. Dev., 2017, 21 (1), 23–30
4. Preeti Jha, Ujjal Mondal, Devipriya Gogoi, Gaurav Singh and Sujit Sen, “Novelties of
selective triphasic synthesis of bis-(p-chlorobenzyl) sulfide using hydrogen sulfide and
reusable phase transfer catalyst‟‟, J. Mol. Catal. A Chem. 2016. DOI:
10.1016/j.molcata.2016.03.030
5. Sujit Sen, Ujjal Mondal, Gaurav Singh, “Dual Optimization in Phase Transfer
Catalyzed Synthesis of Dibenzyl Sulfide using Response Surface Methodology (RSM)”,
Accepted in Org. Process Res. Dev. 2016.
6. Gaurav Singh, Priya G. Nakade, Dorothy Chetia, Preeti Jha, Ujjal Mondal, Saroj
Kumari and Sujit Sen, “Kinetics and mechanism of phase transfer catalyzed synthesis of
aromatic thioethers by H2S-rich methyldiethanolamine‟‟, J. Ind. Eng. Chjem. 2016. DOI:
10.1016/j.jiec.2016.03.022.
7. Gaurav Singh, Priya G. Nakade, Pratik Mishra, Preeti Jha, Sujit Sen, Ujjal
Mondal,“Kinetic investigation on liquid–liquid–solid phase transfer catalyzed synthesis
182
of dibenzyl disulfide with H2S-laden monoethanolamine”, J. Mol. Catal. A Chem. 2015,
411, 78–86
8. Ujjal Mondal, Sujit Sen “Modified Zinin Reduction of Nitroarenes by H2S-laden
Aqueous Methyldiethanolamine under Liquid-Liquid Phase Transfer Catalytic
Condition‟‟, J. Ind. Eng. Chem. (under review).
9. Ujjal Mondal, Sujit Sen “Selective Zinin reduction of dinitro arenes at room
temperature under Liquid-Liquid phase transfer catalysis‟‟, Appl. Catal., A. (under
review).
10. Ujjal Mondal, Sujit Sen “Hydrogen sulphide as an efficient reducing agent for
selective reduction mono/dinitro arenes under Liquid-Liquid Phase transfer catalysis‟‟,
Chem. Comn. (under review)
International Conferences
1. Ujjal Mondal, Sujit Sen, Gaurav Sing. “H2S-rich Alkanolamine: A new reagent for
Zinin Reduction”, Indian Chemical Engineering Congress (CHEMCON-2013), ICT
Mumbai, India, December 27-30, 2013
2. Gaurav Singh, Sujit Sen, Ujjal Mondal, Priya G. Nakade. “Synthesis of Symmetrical
Thioethers from Hydrogen Sulfide”, Indian Chemical Engineering Congress
(CHEMCON-2013), ICT Mumbai, India, December 27-30, 2013.
183
UJJAL MONDAL
Communication
Business Address Home Address
Department of Chemical Engineering C/O Uttam Kumar Mondal
National Institute of Technology 29, Purbasha, Ichapore
Rourkela – 769008, Odisha, India 24 pgs (N), West Bengal
Email: [email protected] Pin code-743144
Phone: +91-8902766097 (M)
Education
2012 - Present Doctoral Fellow (PhD)
Mentor: Prof. Sujit Sen
Department of Chemical Engineering
National Institute Of Technology, Rourkela
Title: “Chemoselective Reduction of Nitroarenes using
Hydrogen Sulphide under Phase Transfer Catalysis.”
2010 – 2012 Master of Technology (M.Tech.) in Chemical
Engineering.
Department of Chemical Engineering.
Manipal Institute Of Technology, Manipal
First Class (7.77 CGPA).
2005 – 2009 Bachelor of Technology (B.Tech.) in Biotechnology.
Department of Biotechnology.
Haldia Institute Of Technology, Haldia
West Bengal University of Technology

184
First Class (7.25 CGPA).
Personal Dossier
Date of Birth: 13th
August 1987
Marital Status: Single
Nationality: Indian