chemistry of submerged soils and growth and yield of rice
TRANSCRIPT
Plant and Soil 39, 567-579 (1973) Ms. 2100
C H E M I S T R Y O F S U B M E R G E D S O I L S
A N D G R O W T H A N D Y I E L D O F R I C E
II. EFFECT OF ADDITIONAL APPLICATION
OF F E R T I L I Z E R S ON SOIL AT F IELD CAPACITY
by A. ISLAIV[ and S. M. ULLAH
Department of Soil Science, University of Dacca, Bangladesh
SUMMARY
Submergence caused similar changes in pH, redox potential, nitrogen, phosphorus, potassium, calcium, magnesium, iron, and manganese contents of soils as were observed in Part 1.
Rice plants grown on pots at submergence and at field capacity with fertilization assimilated more nitrogen, phosphorus potassium, iron and manganese and as a result, grew better and tillered more than plants grown at field capacity without fertilizers. The grain yield at submergence and at field capacity with fertilizers were better compared to those at field capacity without fertilizers. All these observations lead to a conclusion that the ad- ditional application of nutrients in the form of fertilizers at field capacity condition can equate the benefits of submergence.
INTRODUCTION
Studies carried out at the International Rice Research Insti tute by P o n n a m p e r u m a and his associate 3 4 indicated that the better growth of rice plant at submerged condition was due to chemical benefits of submergence. Par t 1 of this paper showed that better yields obtained under submerged condition compared to field ca- pacity condition was due to higher assimilation of nitrogen, phos- phorous, calcium, iron, and manganese which were released more in submerged soils. With these views in mind, a greenhouse experi- ment was performed to see whether the additional application of nutrients at field capacity can equate the benefits of submergence.
568 A. ISLAM AND S. M. ULLAH
METHODS AND MATERIALS
Soil samples at a depth of 0-6" from the surface were collected from two rice growing areas of Bangladesh, namely Parbata and Narsingdi. Parbata sandy clay loam belonged to the red lateritic soil of Bangladesh and had a pH of 5.7 and 1.2 percent of organic matter. Rarsingdi sandy loam had a pH of 6.7 and 1.9 percent organic matter and belonged to the Brahmaputra alluvium. A total of 21 glazed silica pots each containing air-dried soil were arranged in a completely randomized design. One set of Parbata soil at field capacity received 80 lbs N per acre, 90 lbs P per acre and 80 lbs K per acre. Two sets of Narsingdi soil at field capacity received 40 lbs N per acre, 45 lbs P per acre and 40 lbs K per acre. and 80 lbs N per acre, 90 lbs P per acre and 80 lbs K per acre. Ammonium sulphate, superphosphate and muriate of potash were the sources of nitrogen, phosphorus and potassium respectively. Both the soils at field capacity and submergence without ferti- lizers were also included in the experiment. Two weeks old seedlings of Hashikalmi, an Aus variety, were transplanted at the rate of 5 plants per pot containing different treatments. Each t reatment was replicated thrice. The soils in pots at field capacity received sufficient distilled water to bring the soil just to field capacity and every effort was made to keep the moisture content at this level during the experiment by the addition of distilled water whenever needed. The soils under submerged condition were kept continu- ously submerged and 2" standing water in these pots was maintained by the daily addition of distilled water. The soil solutions used for analyses were the percolates collected from the bottom of the pots at submergence and the displaced soil solution from the pots at field capacity. They were collected in the absence of air in 500-ml erlenmyer flasks which were previously filled with nitrogen. The soil solutions collected at the intervals of 0, 2, 4, 6, 10, and 16 weeks from the date of submergence were analysed for (a) pH; (b) redox potential; (c) nitrogen; (d) phosphorus; (e) potassium; (f) calcium; (g) magnesium; (h) iron and (i) manganese. Plant heights were recorded at different stages of growth and the tiller numbers were also counted. Finally the grains were harvested from pots at submergence and field capacity, The plant samples at early vegetative stage, flowering stage and after the harvest of the grains were analysed for (1) nitrogen; (2) phosphorus; (3) potassium; (4) calcium; (5) magnesium; (6) iron and (7) manganese. Laboratory methods used here were described in Part I.
RESULTS AND DISCUSSION
Ef/ects on the soil
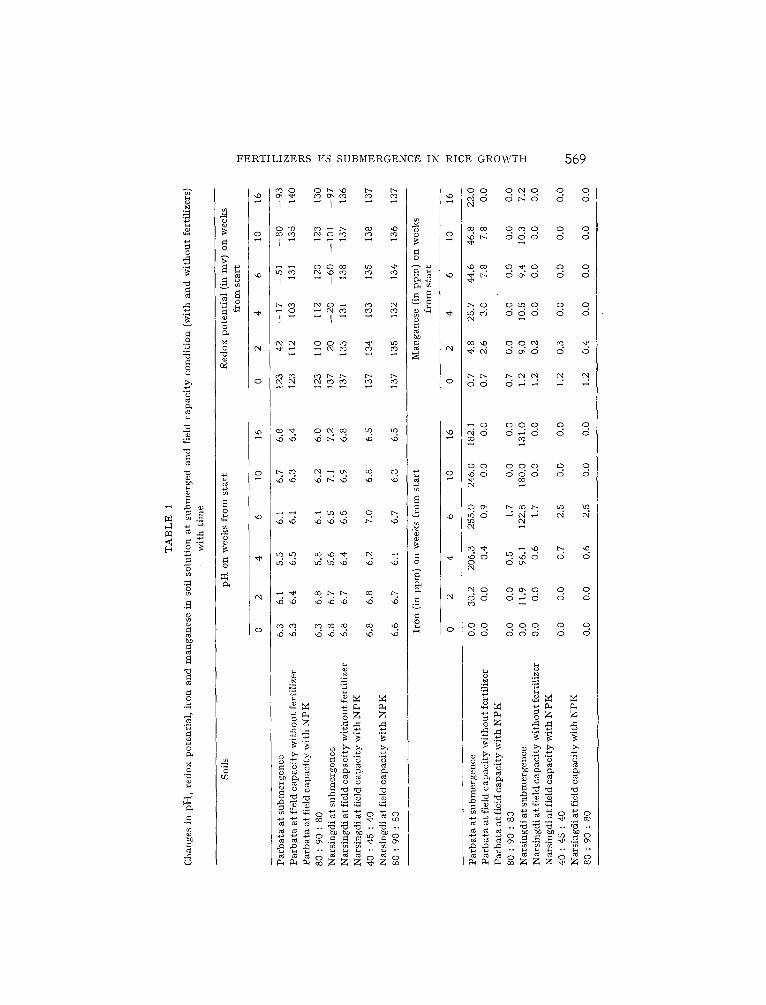
The p H of the soil solution (Table 1) showed similar t rends as was noticeable in the previous exper iment . The soil solution at sub- mergence registered a stable p H in the range of 6.1 to 7.2 af ter an initial decline. The initial decrease was the result of an accumu-
FERTILIZERS FS SUBMERGENCE IN RICE GROWTH 5 6 9
o
8
b0
~.~
.~ g.~
g
I ~ ~ I
I I
~ 0 0 ~ ~
I ~ ~ I
~ 0 0 ~ ~
d d d d d ~ ~
d ~ d d d ~ ~
~ o ~ o - ~ o . . ' ~ "C~ "C~ . . "C~ -,
.g ~ . . . .
~ q ~ q o o
~ 0 ~ 0 0 0 ~ d d d d d
~ o ~ o d o
~q o ~ q o ~ o ~ o o d
O O o
- - o o 0 0 o o ~ d d ~ d d d
O 0 0 0 0 0 0 dd ddd d d
o O ~
~ 0 0 ~ 0 0 0 o d d ~ d o d
O 0 0 0 0 0 d d d d d d o
~ o~
570 A. ISLAM AND S. M. ULLAH
lation of C02 ( P o n n a m p e r u m a 2), and also of the production of the organic acids (Motomura 1). The peak values of 6.8 and 7.2 were observed respectively in Parbata and Narsingdi soil after 16
72 \ \
6`" ~- ~ ~ . . . ." , ' ~ " ~ " - o
iii i/I
, / /
5 t `'8 o. / ,
q - ~-o
32
2,, [ ; ~ _ I .. i.._ i 2 ,,4 (~ 10 16
W E E K
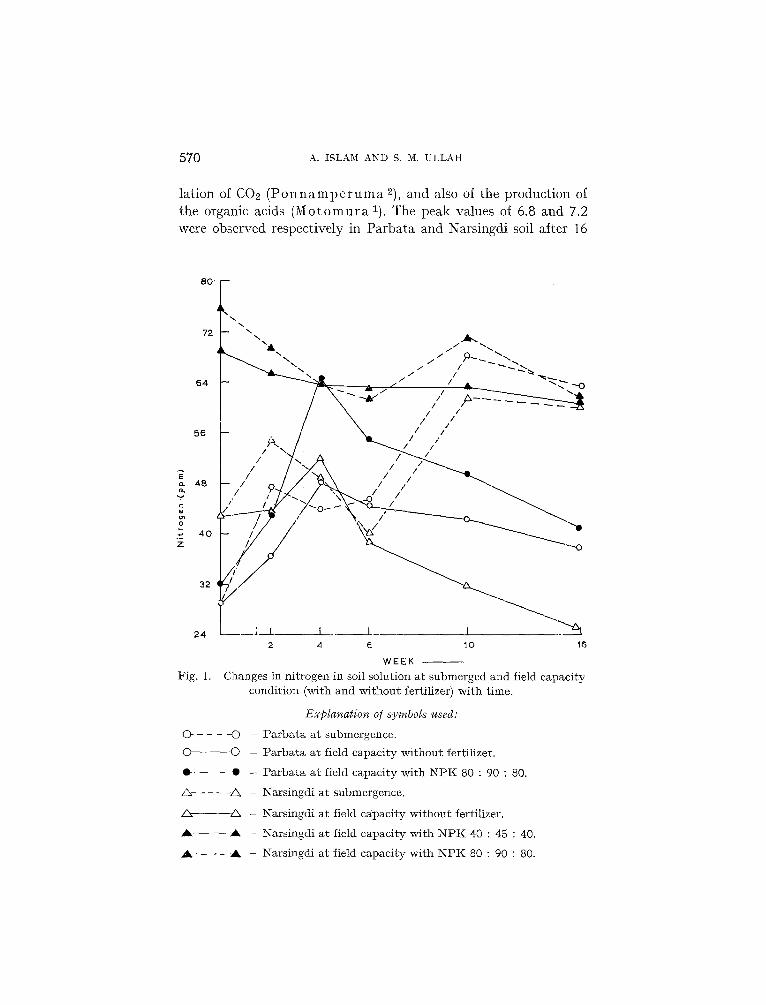
Fig . 1. C h a n g e s in n i t r o g e n in so i l s o l u t i o n a t s u b m e r g e d a n d f i e ld c a p a c i t y
c o n d i t i o n ( w i t h a n d w i t h o u t f e r t i l i ze r ) w i t h t i m e .
Explanation of symbols used:
C> - - - -O - P a r b a t a a t s u b m e r g e n c e .
© C) - P a r b a t a a t f i e ld c a p a c i t y w i t h o u t f e r t i l i z e r .
, "= - P a r b a t a a t f i e ld c a p a c i t y w i t h N P K 80 : 90 : 80.
A . . . . . z~ - N a r s i n g d i a t s u b m e r g e n c e .
A A - N a r s i n g d i a t f i e ld c a p a c i t y w i t h o u t f e r t i l i z e r .
A , - ~ - N a r s i n g d i a t f i e ld c a p a c i t y w i t h N P K 40 : 45 : 40.
A . . . . . A - N a r s i n g d i a t f i e ld c a p a c i t y w i t h N P K 80 : 90 : 80.
FERTILIZERS V S SUBMERGENCE IN RICE GROWTH 571
weeks of submergence. However, there was slight variation in pH at field capacity with and without fertilizers.
The redox potential followed the similar trends as observed in Part 1. Redox potentials declined sharply with time of submergence and attained the negative values within 4 weeks of submergence and then decreased to a minimum of --93.3 my in Parbata and --96.6 my in Narsingdi soil (Table 1). But the redox potentials at field ca- pacity with and without fertilizers ranged from q-l l0.0 my to + 1 4 0 . 0 m v and maintained more or less similar to their initial values during the 16-weeks period (Table 1).
The soil solutions at submergence registered the highest concen- trations of 68.1 ppm of nitrogen in Parbata soil and 61.5 ppm in Narsingdi soil (Fig. 1). In general the concentrations of nitrogen in Narsingdi soil showed a moderate increase. Parbata soil revealed
Fig. 2.
4 . 8
/ / / ~ X
/ / V \
o _ i l l \ \ \ 2.4
ill , #11 ^ '\-K~
2. 4 6 10 16 W E E K ~
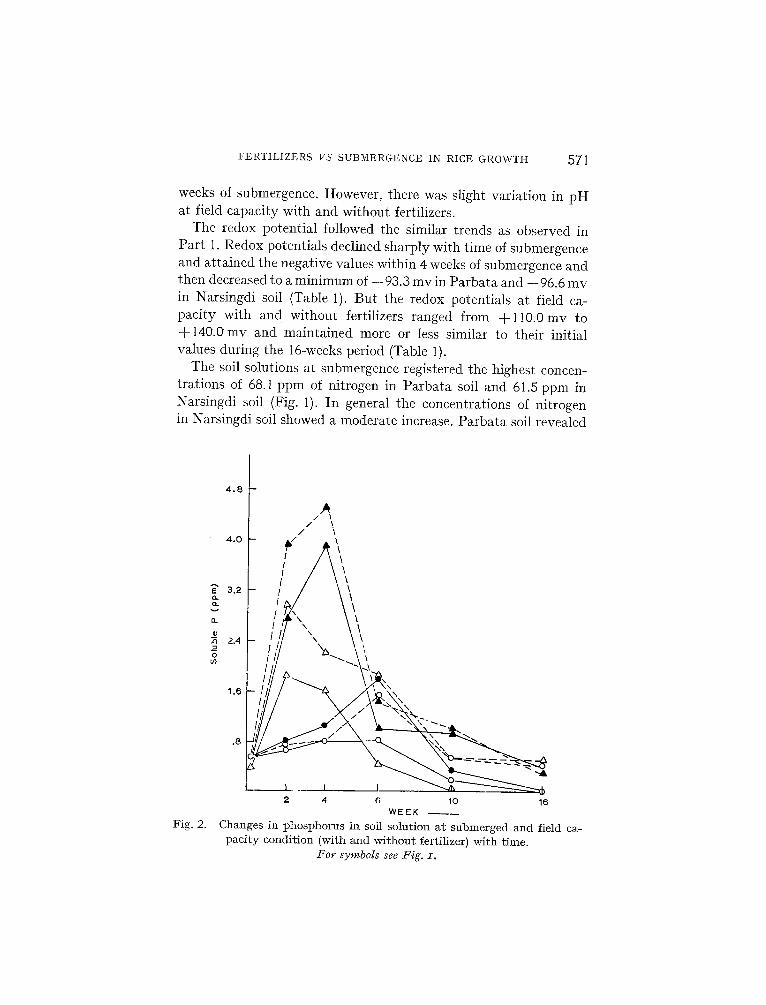
Changes in phosphorus in soil solution at submerged and field ca- pacity condition (with and without fertilizer) with time.
For symbols see Fig. z .
572 A. ISLAM AND S. M. ULLAH
Fig. 3.
4 0 0 -
3(3o
2 2 0
2 8 0
2 4 0
o .
2oo
160
190
80
40
\ \ \ \
\ \ \ \ \ \ \ \
\,. \ \ \ \
i \
\ \ \ \ \ \ \ \
---.-...,~ / t
/ /
/ /
2 4 6 10 16
W E E K
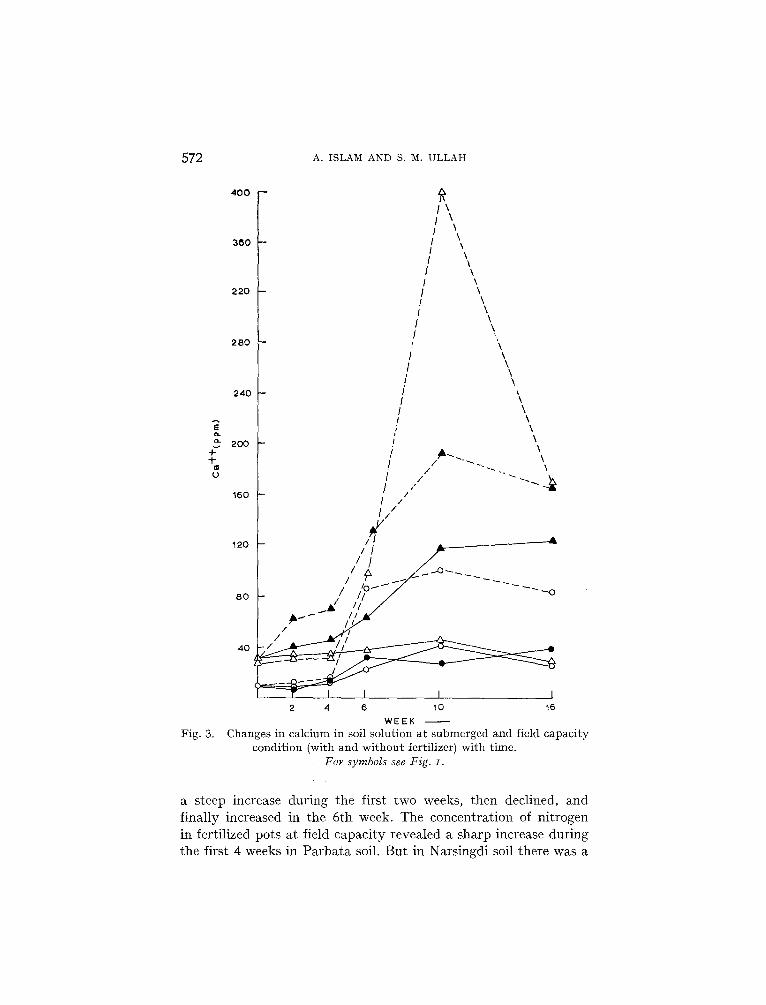
Changes in ca lc ium in soil so lu t ion a t s u b m e r g e d a n d field capac i t y cond i t i on (with a n d w i t h o u t fertil izer) w i t h t ime.
F o r s ymbo l s see F ig . L
a steep increase during the first two weeks, then declined, and finally increased in the 6th week. The concentration of nitrogen in fertilized pots at field capacity revealed a sharp increase during the first 4 weeks in Parbata soil. But in Narsingdi soil there was a
FERTILIZERS V S SUBMERGENCE IN RICE GROWTH 573
40
3 5
30
2 5
4- +
X 2O
Fig. 4.
15
10
/ /
/ /
/
I y , , , .
,-- / . , f \ "~.,,,
,/S \
I t t I t 2 4 6 10 16
WEEK
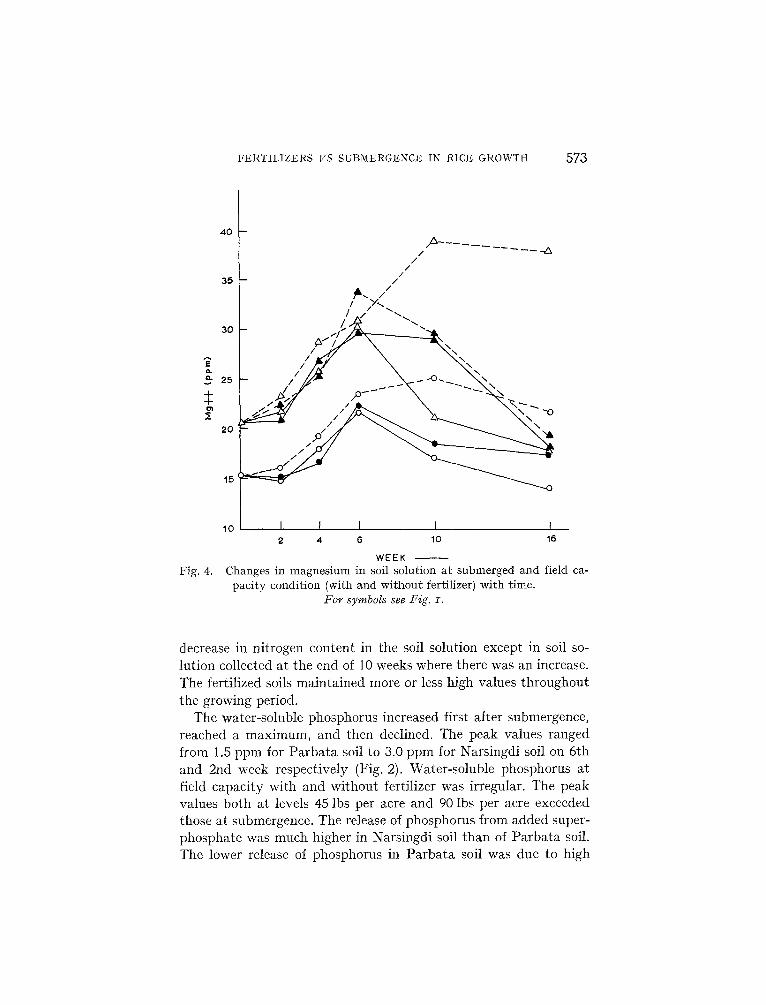
Changes in magnes ium in soil solut ion a t submerged and field ca- pac i ty condition (with and without fertilizer) with time.
For symbols see Fig. x.
decrease in nitrogen content in the soil solution except in soil so- lution collected at the end of 10 weeks where there was an increase. The fertilized soils maintained more or less high values throughout the growing period.
The water-soluble phosphorus increased first after submergence, reached a maximum, and then declined. The peak values ranged from 1.5 ppm for Parbata soil to 3.0 ppm for Narsingdi soil on 6th and 2nd week respectively (Fig. 2). Water-soluble phosphorus at field capacity with and without fertilizer was irregular. The peak values both at levels 45 lbs per acre and 90 lbs per acre exceeded those at submergence. The release of phosphorus from added super- phosphate was much higher in Narsingdi soil than of Parbata soil. The lower release of phosphorus in Parbata soil was due to high
574 A. ISLAM AND S. M. ULLAH
110 -
100 --
90--
8 0
7O
"~ 60
0- 50
4 0
/ / / /
I ] I
I I t I
P, I \
i \ I \
I X \ I \
\
% i /
/ ?
I l
I l
I l
30
20
10
Fig. 5.
2 4 6 10 16
W E E K
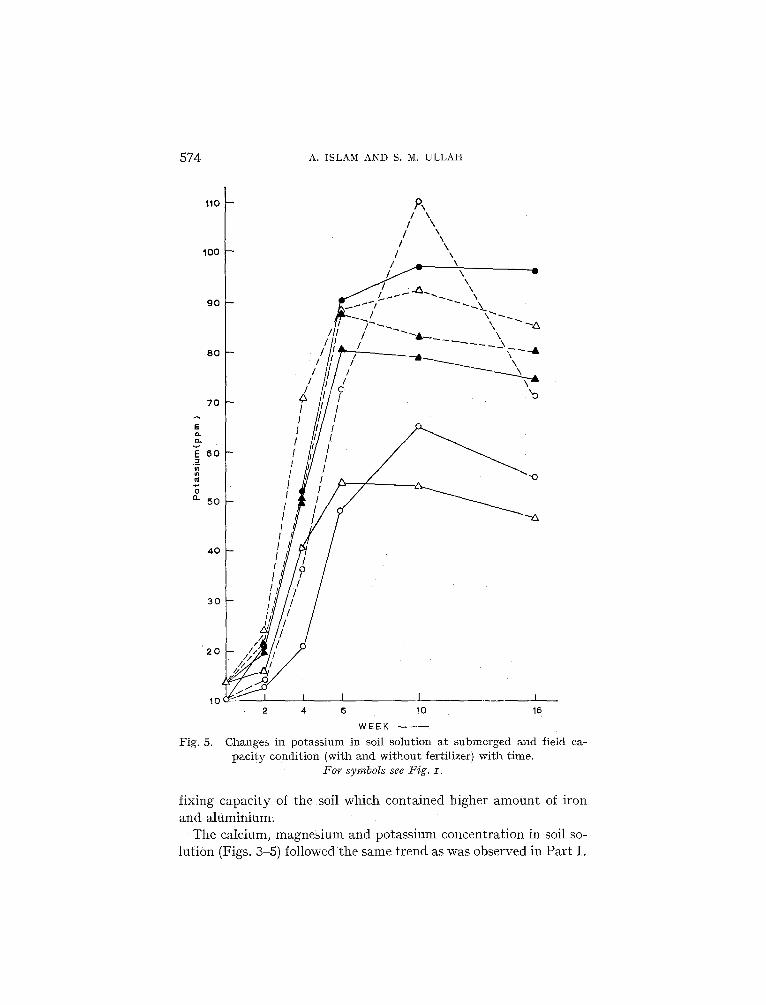
Changes ill potass ium in soil solut ion a t submerged and field ca- pac i ty condi t ion (with and wi thou t fertilizer) wi th time.
For symbols see Fig. z.
fixing capacity of the soil which contained higher amount of iron and aluminium~
The calcium, magnesium and potassium concentration in soil so- lution (Figs. 3-5) followed the same trend as was observed in Part I.
FERTILIZERS VS SUBMERGENCE IN RICE GROWTH 5 7 5
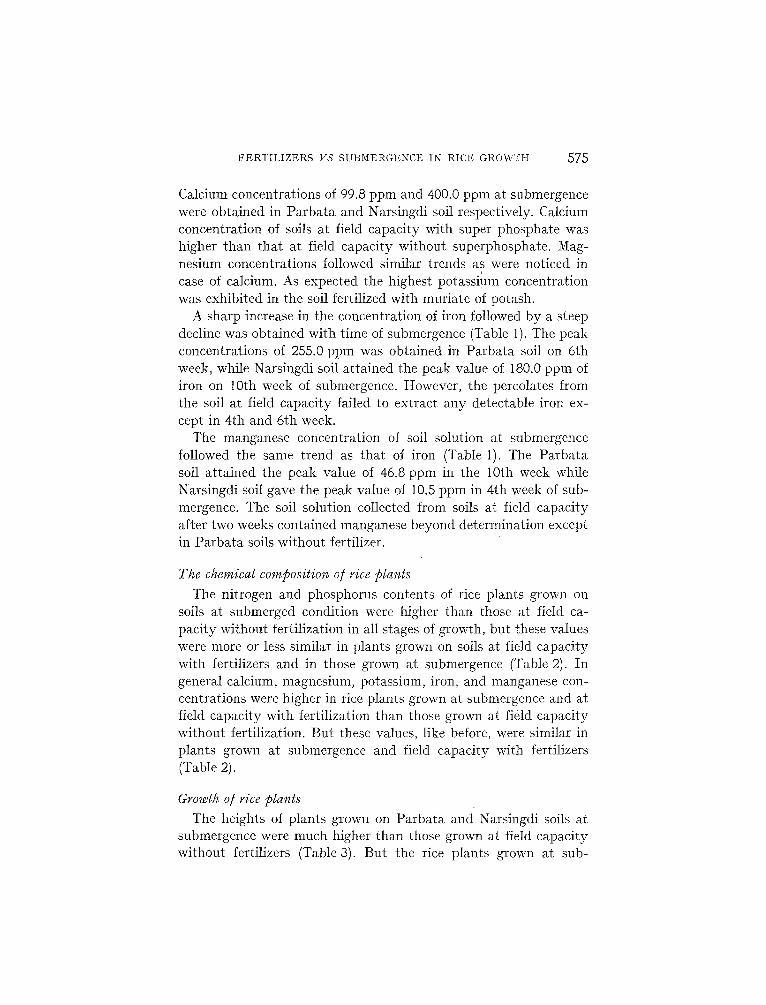
Calcium concentrations of 99.8 ppm and 400.0 ppm at submergence were obtained in Parbata and Narsingdi soil respectively. Calcium concentration of soils at field capacity with super phosphate was higher than that at field capacity without superphosphate. Mag- nesium concentrations followed similar trends as were noticed in case of calcium. As expected the highest potassium concentration was exhibited in the soil fertilized with muriate of potash.
A sharp increase in the concentration of iron followed by a steep decline was obtained with time of submergence (Table 1). The peak concentrations of 255.0 ppm was obtained in Parbata soil on 6th week, while Narsingdi soil attained the peak value of 180.0 ppm of iron on 10th week of submergence. However, the percolates from the soil at field capacity failed to extract any detectable iron ex- cept in 4th and 6th week.
The manganese concentration of soil solution at submergence followed the same trend as that of iron (Table 1). The Parbata soil attained the peak value of 46.8 ppm in the 10th week while Narsingdi soil gave the peak value of 10.5 ppm in 4th week of sub- mergence. The soil solution collected from soils at field capacity after two weeks contained manganese beyond determination except in Parbata soils without fertilizer.
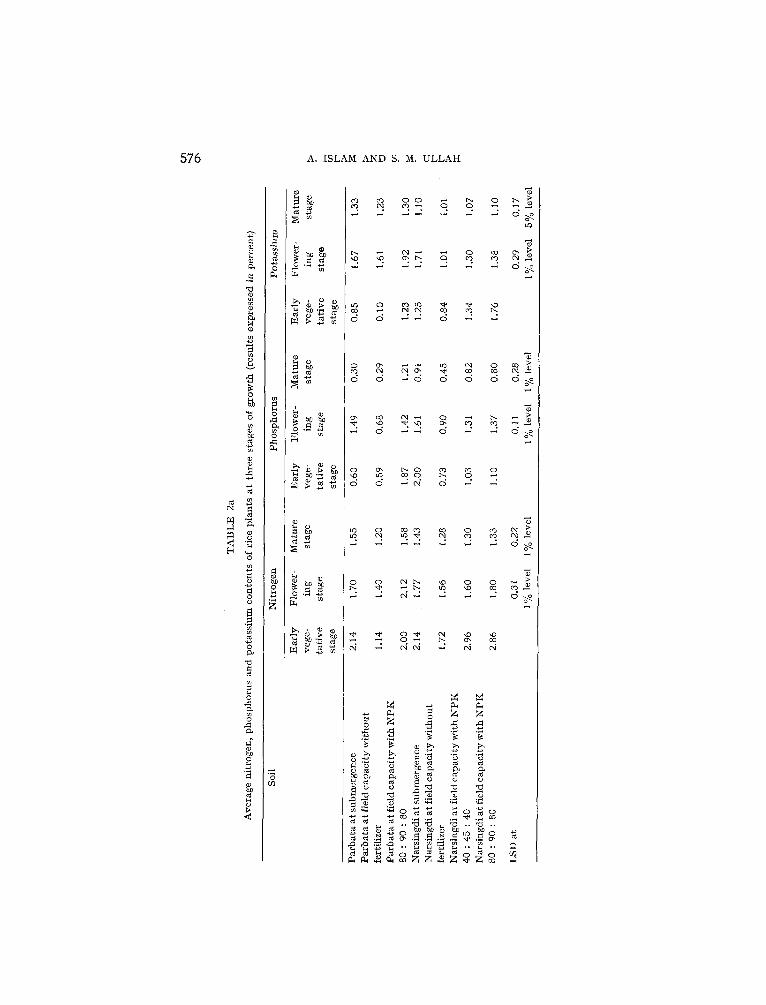
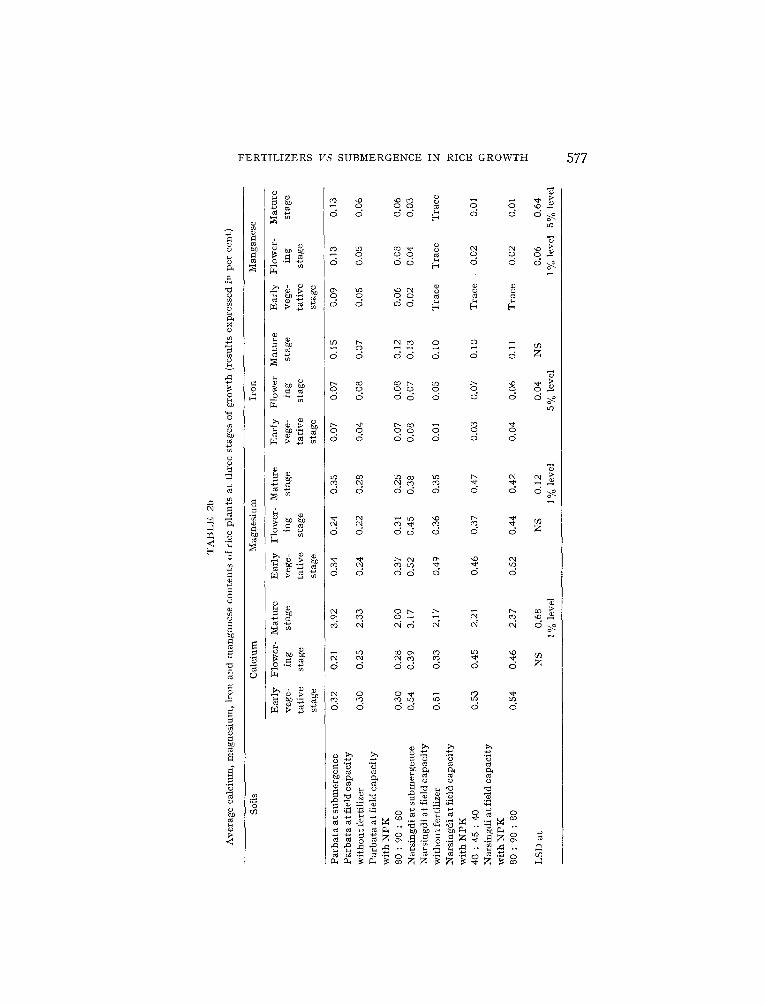
The chemical compositio~ o/ rice plaints The nitrogen and phosphorus contents of rice plants grown on
soils at submerged condition were higher than those at field ca- pacity without fertilization in all stages of growth, but these values were more or less similar in plants grown on soils at field capacity with fertilizers and in those grown at submergence (Table 2). In general calcium, magnesium, potassium, iron, and manganese con- centrations were higher in rice plants grown at submergence and at field capacity with fertilization than those grown at field capacity without fertilization. But these values, like before, were similar in plants grown at submergence and field capacity with fertilizers (Table 2).
Growth o/rice plasts The heights of plants grown on Parbata and Narsingdi soils at
submergence were much higher than those grown at field capacity without fertilizers (Table 3). But the rice plants grown at sub-
576 A. I S L A M A N D S. M. U L L A H
8
O
t~
o
O
z
~0
~ ~ o ~ ~ o ~ .g
I D
• o ' ) •
. . . . . . . d ~
"~2 ~ t ~ t O ",D 0 3 ~ . ~
¢q , : cqcq ~ ¢q ¢q
FERTILIZERS VS SUBMERGENCE IN RICE GROWTH 577
g
F o
"4
,..a
,.-1
o
8 ©
r4g
~ m
o
o
~ m
,s d d d B d d d ~ u$
o d d d d ~ d d ,5-. R
0,, ~ ~ d d d d ~ ~ b
d d d d d d ~;
d o o o d d d d ~
o ~ ~ ~ o ~ d o d d d d d
o d d d o d d d ~
d d d d d d d
o d d d d d d
a.-. ~. ~ ~
d d d d d
o o ~ ~ ~
c,i d ~
d
578 A. ISLAM AND S. M. ULLAH
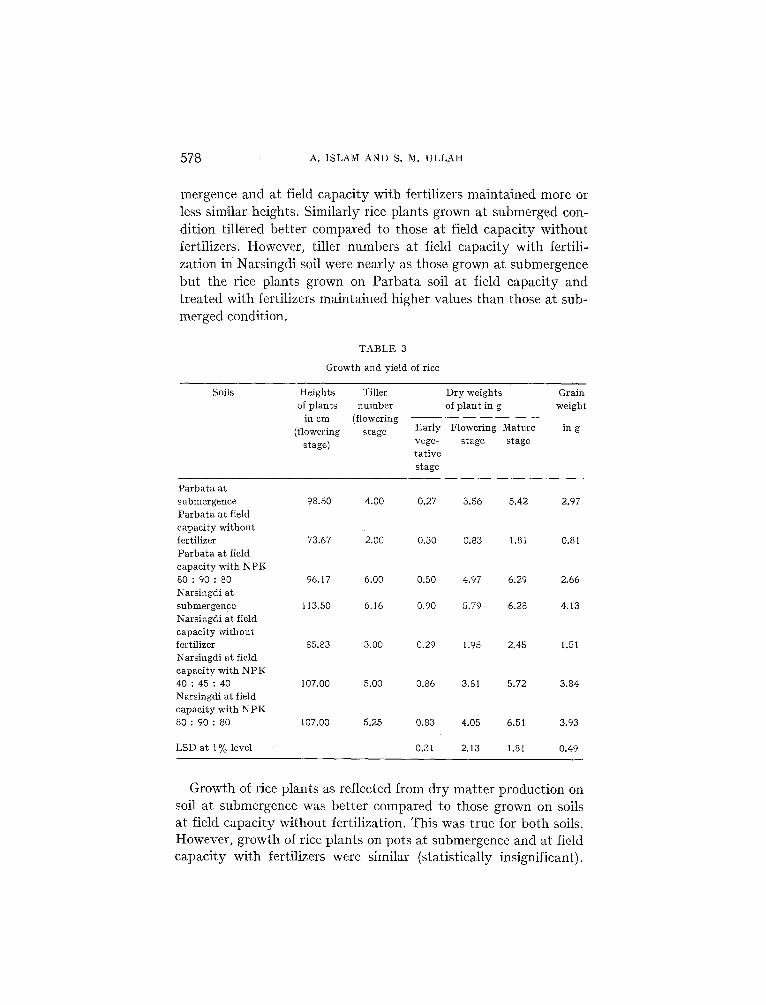
mergence and at field capacity with fertilizers maintained more or less similar heights. Similarly rice plants grown at submerged con- dition tillered better compared to those at field capacity without fertilizers. However, tiller numbers at field capacity with fertili- zation in Narsingdi soil were nearly as those grown at submergence but the rice plants grown on Parbata soil at field capacity and treated with fertilizers maintained higher values than those at sub- merged condition.
TABLE 3
Growth and yield of rice
Soils Heights Tiller Dry weights Grain of plants number of plant in g weight
in cm (flowering (flowering stage Ear ly Flowering Mature in g
stage) vege- stage stage ta t ive stage
Parba ta a t submergence 98.50 4.00 0.27 3.56 5.42 2.97 Parba ta at field
capaci ty wi thout fertilizer 73.67 2.00 0.30 0.83 1.81 0.81 Parba ta a t field capaci ty with NPK 80 : 90 : 80 96.17 6.00 0.50 4.97 6.29 2.66 Narsingdi at submergence 113.50 6.16 0.90 5.79 6.28 4.13 Narsingdi at field capacity wi thout fertilizer 85.83 3.00 0.29 1.95 2.45 1.51 Narsingdi at field capaci ty with NPK 40 : 45 : 40 107.00 5.00 0.86 3.81 5.72 3.84 Narsingdi at field capaci ty with NPK
80 : 90 : 80 107.00 5.25 0.83 4.05 6.51 3.93
0.31 2,13 1.81 0.49 LSD at 1% level
Growth of rice plants as reflected from dry matter production on soil at submergence was better compared to those grown on soils at field capacity without fertilization. This was true for both soils. However, growth of rice plants on pots at submergence and at field capacity with fertilizers were similar (statistically insignificant).
F E R T I L I Z E R S V S SUBMERGENCE IN RICE G R O W T H 579
The yield of grain on both soils at submergence and at field ca- pacity treated with fertilizers showed no variation. The grain weights at submergence and at field capacity with fertilizers were much higher than those at field capacity without fertilizers. The better yield at submerged and fertilized field capacity conditions was due to higher assimilation of nitrogen, phosphorus, potassium, calcium, magnesium, and manganese which were released more in the soil solution at those stage. This was so because positive corre- lations were obtained at the 1% probability level between nitrogen, potassium and magnesium in soil solution and those in plants. Sig- nificant positive correlations at the 5% level were also obtained in case of phosphorus, calcium and manganese of soil solution and those in plants.
From this study, it can be concluded that (a) soil at field ca- pacity can meet the water demands of the most vigorously growing rice plants, and (b) excellent vegetative growth can be obtained in soils at field capacity by supplying extra nitrogen, phosphorus and potassium.
Received November 13, 1972
REFERENCES
1 M o t o m u r a , S., The effect of organic mat te r s on the formation of ferrous iron in soil. Soil Sci. Plant Nutr i t ion 8, 20-29 (1962).
2 P o n n a m p e r u m a , F. N., The chemist ry of submerged soil in relation to the growth and yield of rice. Unpublished Ph.D. Thesis. Cornell Universi ty (1955).
3 P o n n a m p e r u m a , F. N., Annual Report. Internat ional Rice Research Ins t i tu te Los Banos, Laguna, Phillippines (1964).
4 P o n n a m p e r u m a , F. N., Annual Report, Internat ional Rice Research Inst i tute , Los Banos, Laguna, Phillippines (1965).