chemical reactor control - intech - opencdn.intechopen.com/pdfs/34192.pdfchemical reactor control 39...
TRANSCRIPT
3
Chemical Reactor Control
Azzouzi Messaouda1 and Popescu Dumitru2 1Ziane Achour University of Djelfa
2Politehnica University of Bucharest 1Algeria
2Romania
1. Introduction
The principal technological element of the industrial plants and the chemical reactions is the
chemical reactor. In this chapter, it is considered that the chemical reactor is an apparatus in
which the chemical process can be effectuated to obtain certain substances in technological
process. The automatic control systems by their dynamic bring those processes to a point
where the profile is optimal, a fact which imposes several methods to achieve the desired
performances. This chapter proposes a hierarchical configuration of control which treats
aspects related to the primary processing of data, processes identification, control and the
robustness analysis under some conditions of the operating regime for representative plants
in the chemical and petrochemical industry. It is a design of numerical control laws in a
pyrolysis reactor in order to achieve an efficient regime of operation that allows as much as
possible to optimize the concentration of produced ethylene by the chemical reactions
(Popescu et al., 2006a; Landau & Zito, 2006).
2. Technologic overview of the plant
2.1 Technical description and operating conditions
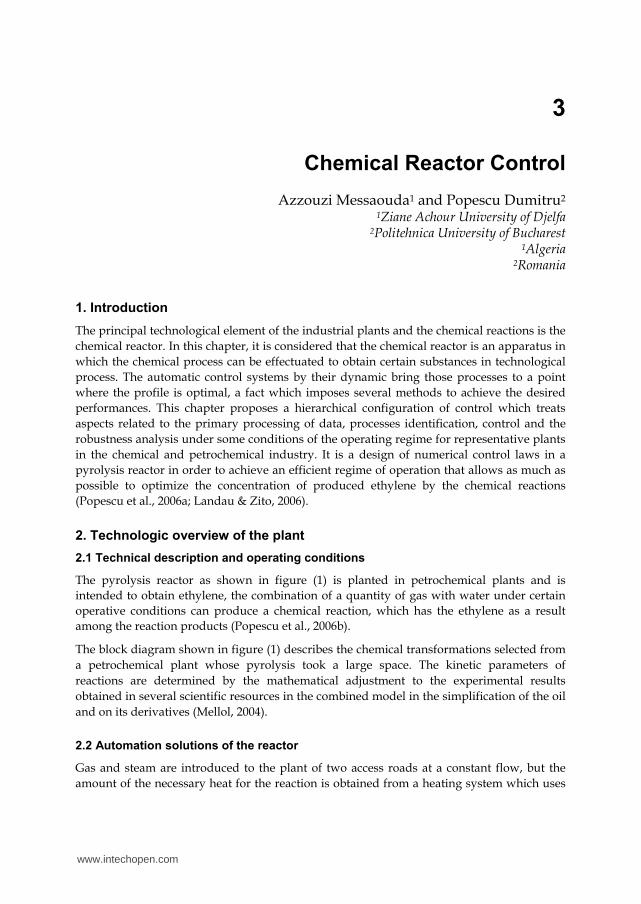
The pyrolysis reactor as shown in figure (1) is planted in petrochemical plants and is
intended to obtain ethylene, the combination of a quantity of gas with water under certain
operative conditions can produce a chemical reaction, which has the ethylene as a result
among the reaction products (Popescu et al., 2006b).
The block diagram shown in figure (1) describes the chemical transformations selected from
a petrochemical plant whose pyrolysis took a large space. The kinetic parameters of
reactions are determined by the mathematical adjustment to the experimental results
obtained in several scientific resources in the combined model in the simplification of the oil
and on its derivatives (Mellol, 2004).
2.2 Automation solutions of the reactor
Gas and steam are introduced to the plant of two access roads at a constant flow, but the
amount of the necessary heat for the reaction is obtained from a heating system which uses
www.intechopen.com
Petrochemicals
34
Fig. 1. Integration of Pyrolysis reactor into a petrochemical plant Where PR: pyrolysis reactor MR: Membrane reactor RR: Reforming reactor CR: Catalytic reactor
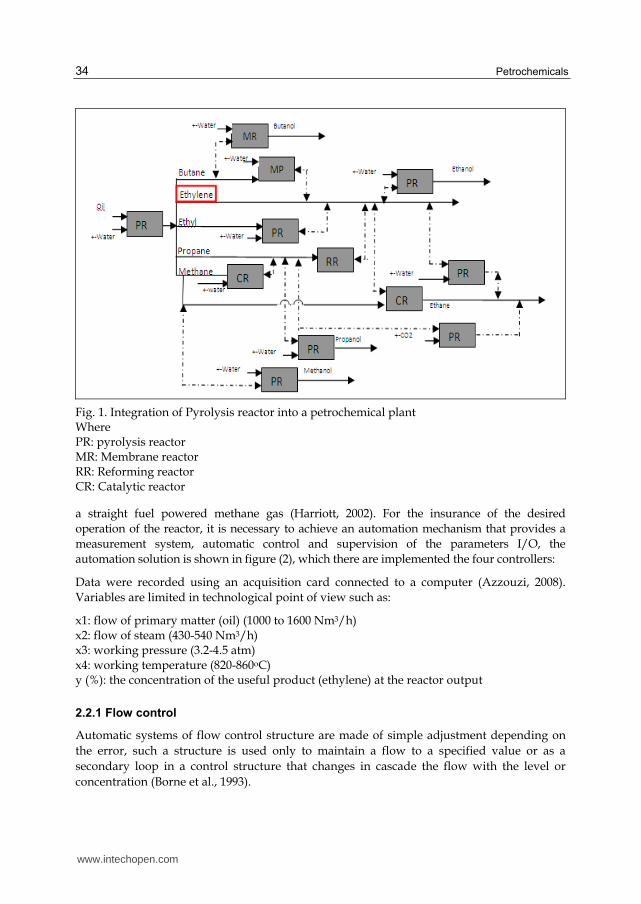
a straight fuel powered methane gas (Harriott, 2002). For the insurance of the desired
operation of the reactor, it is necessary to achieve an automation mechanism that provides a
measurement system, automatic control and supervision of the parameters I/O, the
automation solution is shown in figure (2), which there are implemented the four controllers:
Data were recorded using an acquisition card connected to a computer (Azzouzi, 2008).
Variables are limited in technological point of view such as:
x1: flow of primary matter (oil) (1000 to 1600 Nm3/h) x2: flow of steam (430-540 Nm3/h) x3: working pressure (3.2-4.5 atm) x4: working temperature (820-860oC) y (%): the concentration of the useful product (ethylene) at the reactor output
2.2.1 Flow control
Automatic systems of flow control structure are made of simple adjustment depending on
the error, such a structure is used only to maintain a flow to a specified value or as a
secondary loop in a control structure that changes in cascade the flow with the level or
concentration (Borne et al., 1993).
www.intechopen.com
Chemical Reactor Control
35
Fig. 2. Controller loops that govern the pyrolysis reactor.
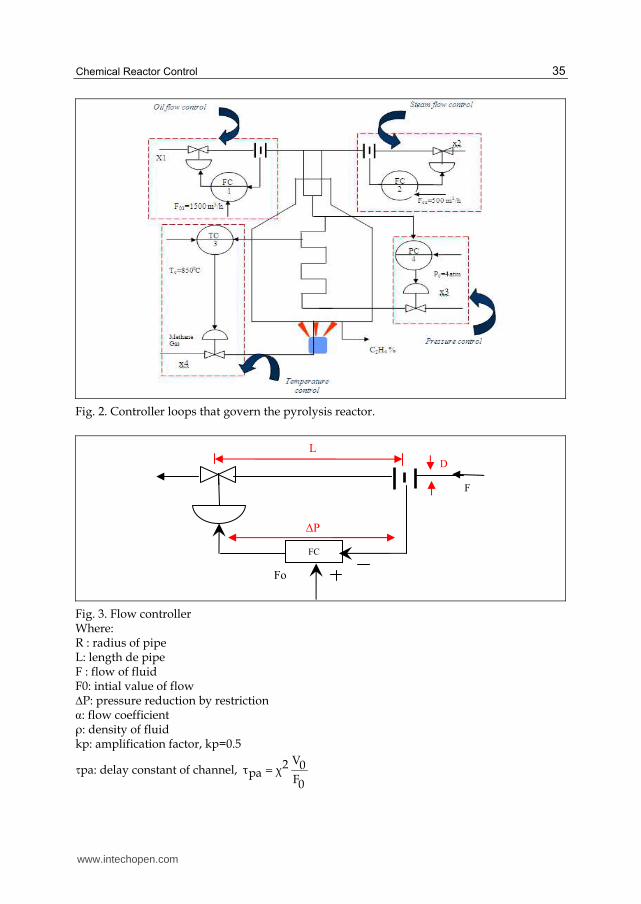
Fig. 3. Flow controller Where: R : radius of pipe L: length de pipe F : flow of fluid F0: intial value of flow ∆P: pressure reduction by restriction m: flow coefficient ┩: density of fluid kp: amplification factor, kp=0.5
pa: delay constant of channel, V2 0τ χpaF0
=
Fo
FC
ΔP
L
D
F
www.intechopen.com
Petrochemicals
36
V0: volume of fluid in the pipe in case of steady M: mass of liquid through the pipe v: flow rate of liquid through the pipe
For the flow control systems, using the theorem of short lines: pipeion is equivalent to a hydraulic resistance defined by the known relationship:
2ΔP
F αS┩
= (1)
For steady flow, the applied forces into the system are balanced, which implies:
2F ┩0ΔP 00 22α S− = (2)
where:
∆P0: is the active force to push the liquid in the pipe
2F ┩022α S
is the reaction force by the restriction
In dynamic regime, the deference between these two forces is compensated by the rate of change of pulse time of the system.
( )( )
( )2F t ┩ dΔP t S Mv
2 dt2α S− = (3)
Which imply that:
( )( )
( )( )2
122
F t dP t S LS F t
S dtS
ρρ
αΔ − = (4)
Values are obtained that depend on t , if the variations of two arbitrary values of steady
state are given as:
( ) ( )( ) ( )
( )
ΔP t ΔP Δ ΔP t ΔP Δp t0 0
F t F ΔF(t)0
= + = +
= + (5)
From (4) and (5):
( )( )2┩(F ΔF(t)) d0(ΔP Δp(t))S S ┩L F ΔF t0 02 2 dt2α S
++ − = + (6)
By extacting (6) and the steady state expressed by (2) and by ignoring the quadratic term
( )2ΔF t , the following equation can be obtained:
www.intechopen.com
Chemical Reactor Control
37
( )( )
( )( )2┩F ΔF t d0Δp t S S ┩L ΔF t
2 2 dt2α S− = (7)
By the normativity in the steady state:
( )( )ΔF t
y tF0
= and ( )( )Δp t
M tΔP0
=
Which results lthe linear model with adimensional variables:
( )
( ) ( )V dy t 12 0α y t m tF dt 20
+ = (8)
From equation (6), and by applying the Laplace transform, the transfer function of the execution channel can be got easily.
( )kp
H spa τ s 1pa=
+ (9)
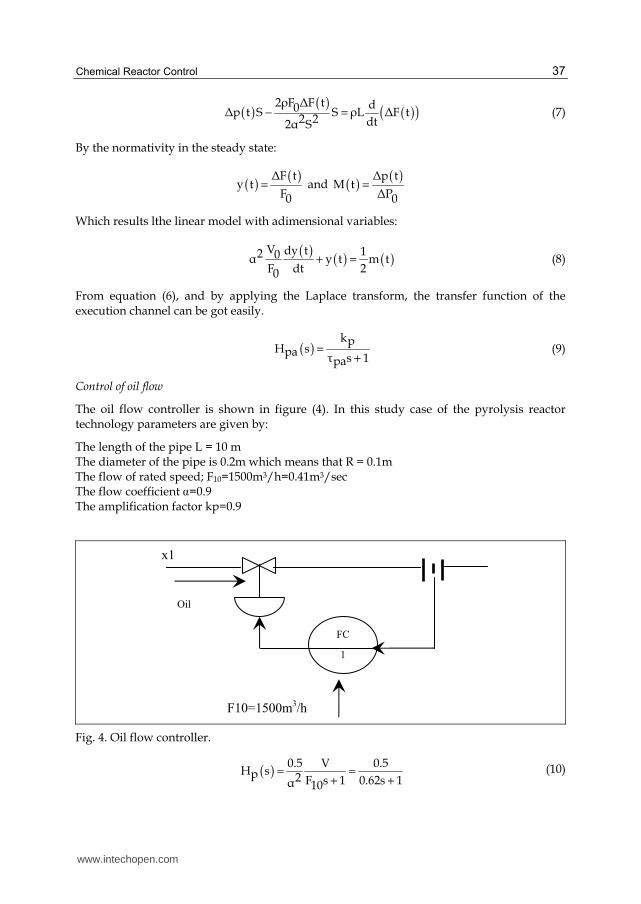
Control of oil flow
The oil flow controller is shown in figure (4). In this study case of the pyrolysis reactor technology parameters are given by:
The length of the pipe L = 10 m The diameter of the pipe is 0.2m which means that R = 0.1m The flow of rated speed; F10=1500m3/h=0.41m3/sec The flow coefficient m=0.9 The amplification factor kp=0.9
Fig. 4. Oil flow controller.
( )0.5 V 0.5
H sp 2 F s 1 0.62s 1α 10= =
+ + (10)
FC
1
Oil
x1
F10=1500m3/h
www.intechopen.com
Petrochemicals
38
20.22 3V ┨ r L ┨ 10 3.14 (0.01) (10) 0.314m2
= ∗ ∗ = ∗ = ∗ ∗ = (11)
V 0.3142 2α 0.9 0.62
F 0.4110= ∗ = (12)
0.66H (s)E 8s 1
=+
transfer function of the actuator
0.5H (s)p
0.62s 1=
+ transfer function of the process
FΔI 16 150010H 0.75T ΔF I 2000 161 0= ∗ = ∗ = transfer function of the sensor
( )( )
0.66 0.5H H H H 0.75F E P T 8s 1 0.62s 1
0.24
8s 1 0.62s 1
= ∗ ∗ = ∗ ∗+ +
=+ +
(13)
The parasite time constant 0.62 can be ignored because is too small compared to the main time constant 8s, so the controller has the following transfer function:
( )
K0.24 pH (s)F 8s 1 T s 1p
= =+ +
(14)
It is recommended that a PI controller which has the form ( )1
H s K . 1R R T si
= +
If Ti=Tp=8s
( ) ( )( ) K K .K1 T s p pRiH H s .H s KR F Rd T s T s 1 T sp pi
+= = =
+ (15)
( )
K K T sH p p 1RdH0 TH 1 pK K T s 1p pd R s 1K KpR
= = =+ +
+
(16)
Tp 8 33.33
T K0 RK .K 0.24K TpR R 0 = = = (17)
To set a time of 8s. It is necessary to choose, T 2s K 160 R= ≈ to facilitate the calculation.
www.intechopen.com
Chemical Reactor Control
39
( )( )
8s 1 0.24H 16. .
8s 8s 1 0.62s 1
+=
+ + (18)
MatLab is used to obtain graphs of the step response of this closed loop system. The transfer function of BF
30.72s 3.84
HBF3 239.68s 68.96s 38.72s 3.84
+=
+ + + (19)
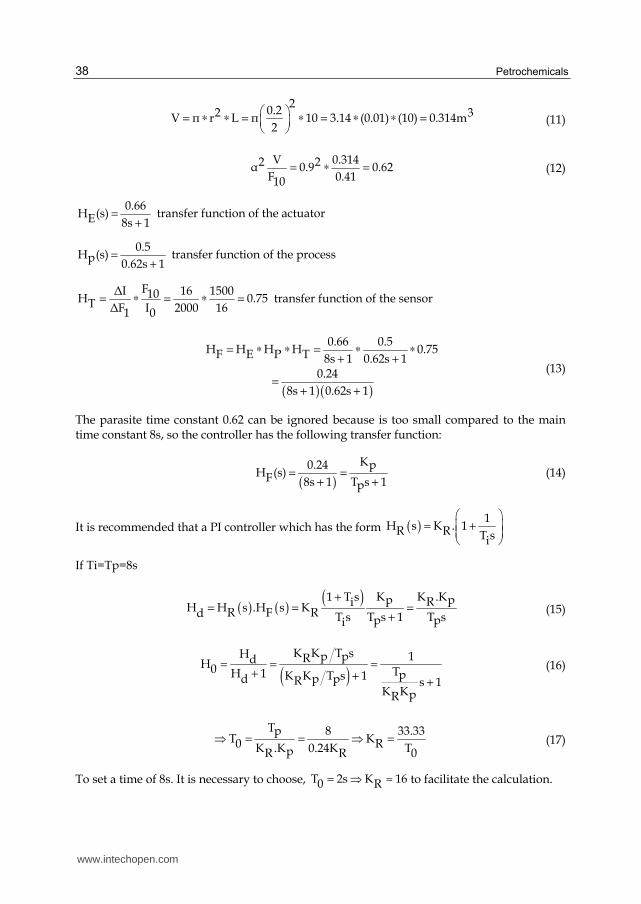
From the above equation, the oil flow, the time response, the step response and the robustness diagrams can be ploted as shown in figure (5).
(A) (B) (C) (D)
Fig. 5. (A) Step reponse, (B) Time response, (C) Bode diagram and (D) Nyquist diagram.
By the bilinear transformation12 1 q
s .1T 1 qp
−−=
−+, the deduced formula of the model and its
discrete PI controller is( ) ( )
( )
12T T q T 2Tk p pp i i1H (q )PI 12T 2T 1 qi i
−+ + − − = −−
, which results:
Model
2 10.85q 1.4q 3.451H(q )2 1q 2q 1
− −+ +− =− −+ +
(20)
Controller
( )1 1R q 3 q− −= − (21)
( ) ( )1 1S q 2 1 q− −= − (22)
( )1T q 2− = (23)
www.intechopen.com
Petrochemicals
40
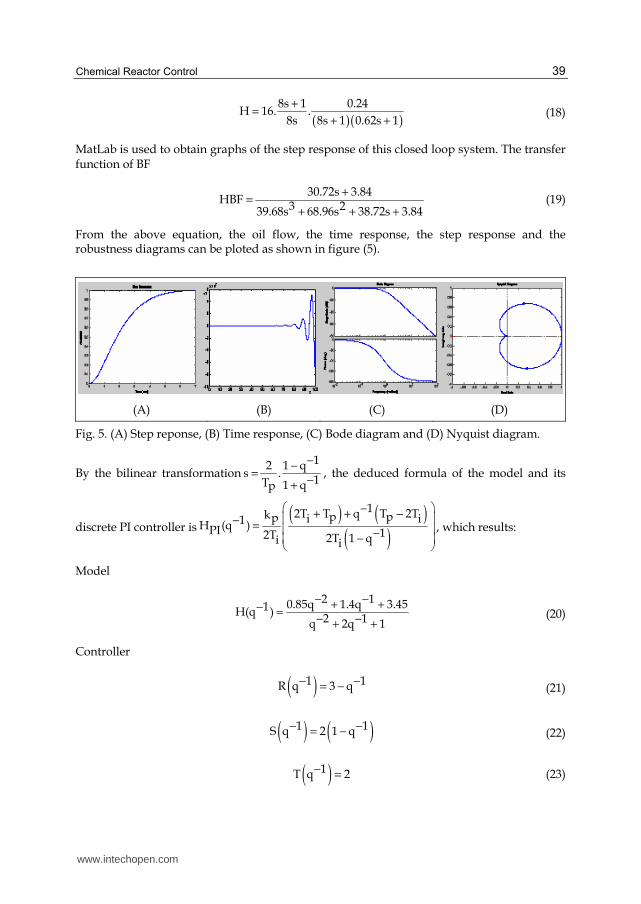
Steam flow control
The controller in case of steam flow is shown in figure (6). Such as the technological
parameters which are given by:
The length of the pipe 5 m
The diameter of the pipe is 0.1m which means that R = 0.05m
The flow of nominal regime F20=500m3/h=0.14m3/sec
Flow coefficient α = 0.95
( )0.5 1 0.5
H sp 2 2 0.16s 1α α V F s 110
= =++
(24)
Fig. 6. Control of steam flow.
2
0.12 2V ┨ r L ┨ 5 3.14 (0.05) (5) 0.42
= ∗ ∗ = ∗ = ∗ ∗ = (25)
V 0.42 2α 0.74 0.16
F 0.1420= ∗ = (26)
0.66H (s)E 4s 1
=+
transfer function of the actuator
0.5H (s)p
0.16s 1=
+ transfer function of the process
FΔI 16 50010H . . 0.66T ΔF I 2000 121 0= = = transfer function of the sensor
( )( )
0.66 0.5 0.21H H .H .H . .0.66F E P T 4s 1 0.16s 1 4s 1 0.16s 1
= = =+ + + +
(27)
F10=500m3/h
FC
2
Steam
x1
www.intechopen.com
Chemical Reactor Control
41
The parasite time constant 0.16s because it is too small compared to the main time constant
4s, then the controller transfer function will be: ( )
K0.21 pH (s)F 4s 1 T s 1p
= =+ +
It is recommended the use of PI controller ( )1
H s K . 1R R T si
= + , when Ti=Tp=4s
( ) ( )( ) K K .K1 T s p pRiH H s .H s KR F Rd T s T s 1 T sp pi
+= = =
+ (28)
( )
K K T sH p p 1RdH0 TH 1 pK K T s 1p pd R s 1K KpR
= = =+ +
+
(29)
Tp 4 19
T K0 RK .K 0.21K TpR R 0 = = = (30)
To specify a transient time of 8s, it is necessary to choose
( )1
T 2s K 9 H s 9 10 R R 8s
= ≈ = +
The use of MatLab to check the robustness of the closed loop system gives:
The transfer function:
0.21
HBF20.84s 4.16s 1.21
=+ +
(31)
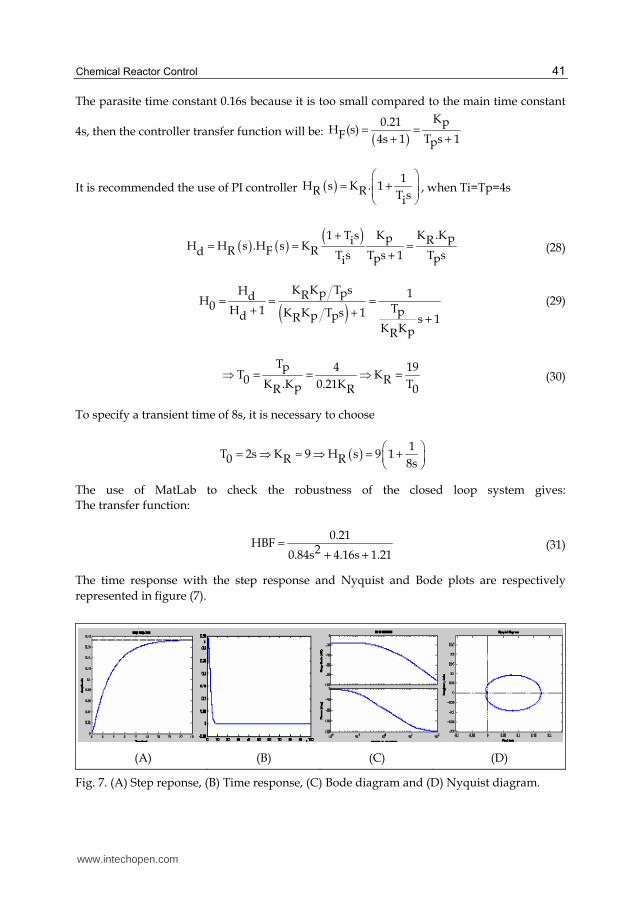
The time response with the step response and Nyquist and Bode plots are respectively
represented in figure (7).
(A) (B) (C) (D)
Fig. 7. (A) Step reponse, (B) Time response, (C) Bode diagram and (D) Nyquist diagram.
www.intechopen.com
Petrochemicals
42
After the bilinear transformation 12 1 q
s .1T 1 qp
−−=
−+
, so the discrete formula of the controller is
PI ( ) ( )
( )
12T T q T 2Tk p pp i i1H (q )PI 12T 2T 1 qi i
−+ + − − = −− which results:
Model
2 10.92q 1.68q 3.241H(q )2 1q 2q 1
− −− + +− =− −+ +
(32)
Controller
( ) ( )1 1R q 9 3 q− −= − (33)
( ) ( )1 1S q 16 1 q− −= − (34)
( )1T q 18− = (35)
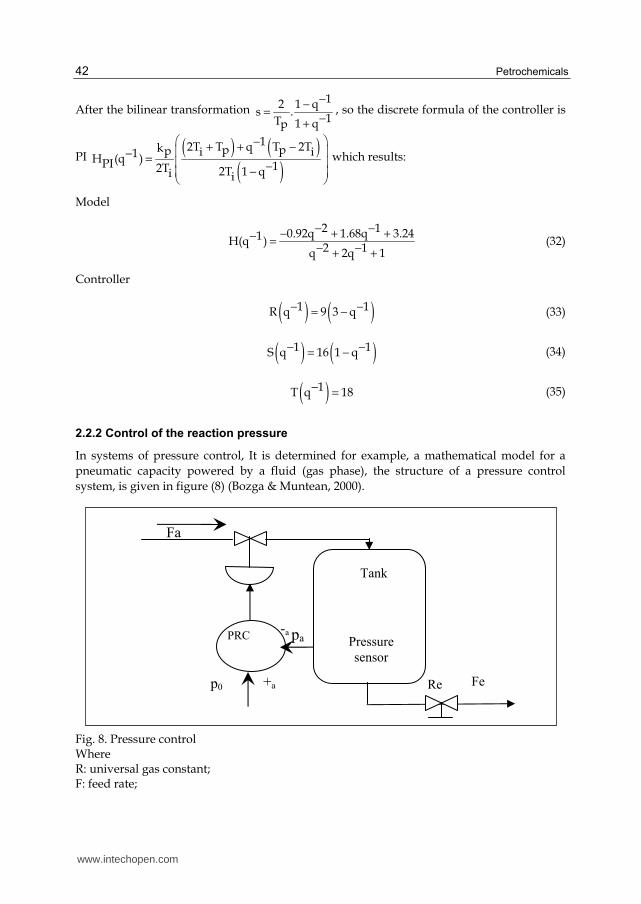
2.2.2 Control of the reaction pressure
In systems of pressure control, It is determined for example, a mathematical model for a
pneumatic capacity powered by a fluid (gas phase), the structure of a pressure control
system, is given in figure (8) (Bozga & Muntean, 2000).
Fig. 8. Pressure control Where R: universal gas constant; F: feed rate;
-a
Fe p0
+a
Fa
pa PRC
Tank
Pressure
sensor
Re
www.intechopen.com
Chemical Reactor Control
43
Fe extraction rate; p: pressure; p0: required value for the pressure.
After filtering data recorded previously, and estimated degrees of polynomials by the
software WinPim (Azzouzi, 2009b). It was found that the polynomial A is of the second
degree, while the polynomial B is of the first degree, the validation test has confirmed the
quality of the chosen model, the results of the identification and regulation respectively by
using WinPim and WinReg are:
Model
Structure of model of identification system: ARX
Identification method: recursive least squares
Adaptation algorithm parametric decreasing gain
Te=3s
Delay: D=0
( )( )( )
1 1B q 0.0471q1H q1 21 1 1.614q 0.653qA q
− −− = =
− −− − + (36)
Controller
Method : poles placement
( )1 1 2R q 43.173 45.371q 13.87q− − −= − + (37)
( )1 1S q 1 q− −= − (38)
( )1 1 2T q 21.227 12.35q 2.76q− − −= − + (39)
Refence model
( )1 1 2Am q 1 0.697q 0.151q− − −= − + (40)
( )1 1Bm q 0.297 0.157q− −= + (41)
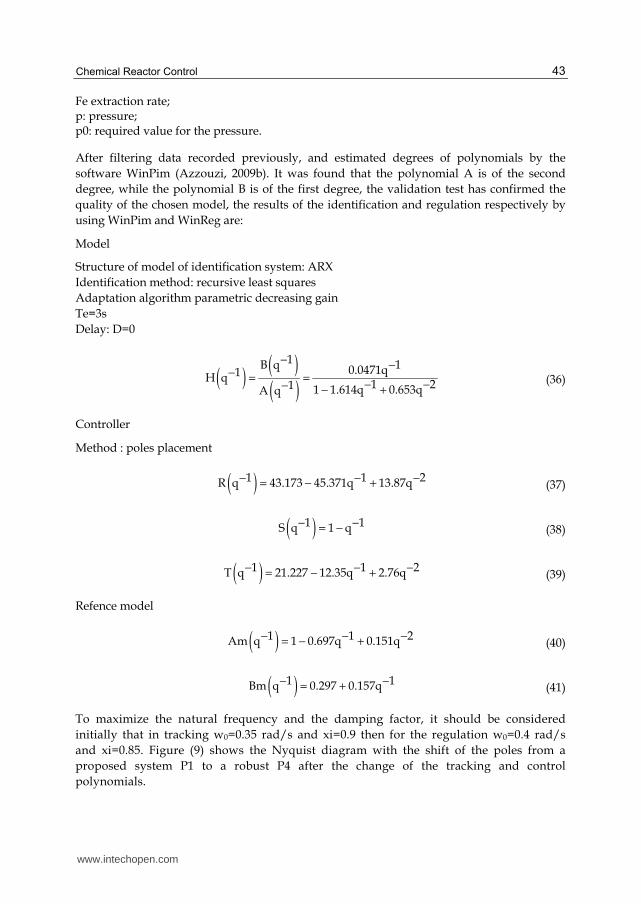
To maximize the natural frequency and the damping factor, it should be considered
initially that in tracking w0=0.35 rad/s and xi=0.9 then for the regulation w0=0.4 rad/s
and xi=0.85. Figure (9) shows the Nyquist diagram with the shift of the poles from a
proposed system P1 to a robust P4 after the change of the tracking and control
polynomials.
www.intechopen.com
Petrochemicals
44
Fig. 9. Nyquist diagram and poles in closed loop.
Robustness margins are respectively shown in table (1), the goal here is to approach the margins form known robustness margins. A slow change in parameter values and further regulation and traking may increase the system robustness in closed loop (Oustaloup, 1994).
Nr
Traking Regulation
∆G (dB) ∆l(o) ∆(s) ∆M(dB) Double Double
w0 xi w0 xi
1 0.35 0.9 0.4 0.85 2.64 22.8 0.69 11.64
2 0.1 0.65 0.2 0.5 4.94 41.4 1.84 -7.25
3 0.08 0.7 0.1 0.6 6.16 61.0 3.23 -5.88
4 0.075 0.88 0.08 0.87 6.03 59.9 3.02 -6.01
Table 1. Robustness margins in function of tracking and control parameters.
The robustness test is important to identify the operating factors which are not necessarily
considered in the development phase of the method, but could influence the results, and
therefore to anticipate problems that may occur during the application of the chosen
method. A series of curves to the robust sensitivity function analyzed by using WinReg is
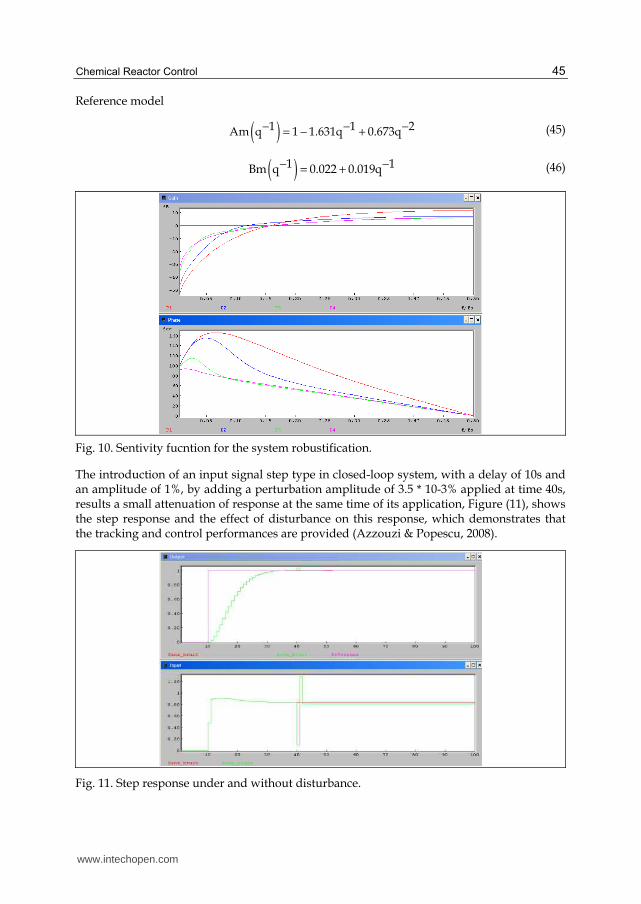
shown in figure (10). The new polynomials of the controller and the reference model are
given as follows:
Controller
( )1 1 2R q 21.274 34.150q 13.87q− − −= − + (42)
( )1 1S q 1 q− −= − (43)
( )1 1 2T q 21.227 34.213q 13.98q− − −= − + (44)
www.intechopen.com
Chemical Reactor Control
45
Reference model
( )1 1 2Am q 1 1.631q 0.673q− − −= − + (45)
( )1 1Bm q 0.022 0.019q− −= + (46)
Fig. 10. Sentivity fucntion for the system robustification.
The introduction of an input signal step type in closed-loop system, with a delay of 10s and an amplitude of 1%, by adding a perturbation amplitude of 3.5 * 10-3% applied at time 40s, results a small attenuation of response at the same time of its application, Figure (11), shows the step response and the effect of disturbance on this response, which demonstrates that the tracking and control performances are provided (Azzouzi & Popescu, 2008).
Fig. 11. Step response under and without disturbance.
www.intechopen.com
Petrochemicals
46
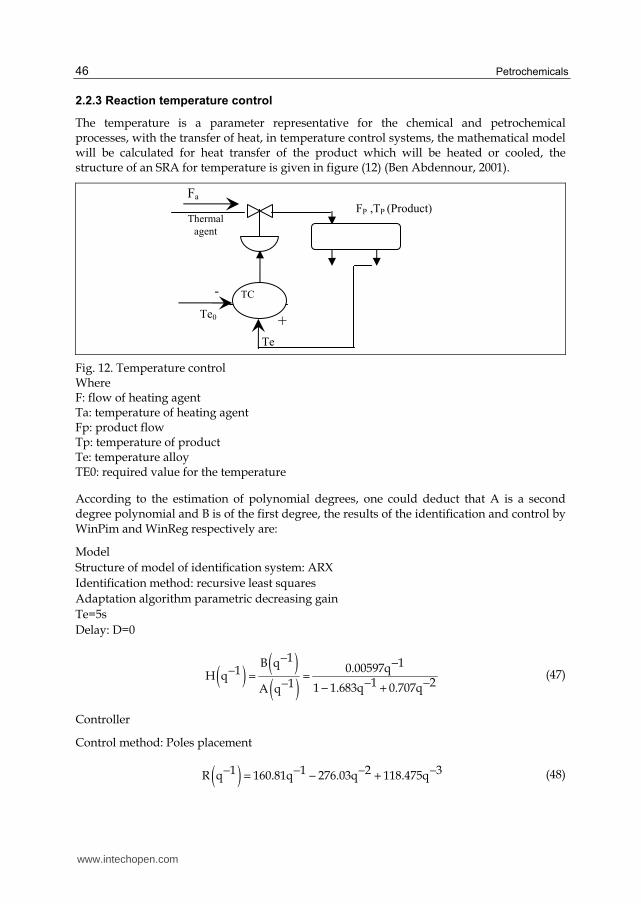
2.2.3 Reaction temperature control
The temperature is a parameter representative for the chemical and petrochemical processes, with the transfer of heat, in temperature control systems, the mathematical model will be calculated for heat transfer of the product which will be heated or cooled, the structure of an SRA for temperature is given in figure (12) (Ben Abdennour, 2001).
Fig. 12. Temperature control Where F: flow of heating agent Ta: temperature of heating agent Fp: product flow Tp: temperature of product Te: temperature alloy TE0: required value for the temperature
According to the estimation of polynomial degrees, one could deduct that A is a second degree polynomial and B is of the first degree, the results of the identification and control by WinPim and WinReg respectively are:
Model
Structure of model of identification system: ARX
Identification method: recursive least squares
Adaptation algorithm parametric decreasing gain
Te=5s
Delay: D=0
( )( )( )
1 1B q 0.00597q1H q1 21 1 1.683q 0.707qA q
− −− = =
− −− − + (47)
Controller
Control method: Poles placement
( )1 1 2 3R q 160.81q 276.03q 118.475q− − − −= − + (48)
-
Te0
Thermal
agent
Te
+
Fa
TC
FP ,TP (Product)
www.intechopen.com
Chemical Reactor Control
47
( )1 1S q 1 q− −= − (49)
( )1 1 2T q 167.504 288.712q 124.463q− − −= − + (50)
Reference model
( )1 1 2Am q 1 0.446q 0.05q− − −= − + (51)
( )1 1Bm q 0.442 0.161q− −= + (52)
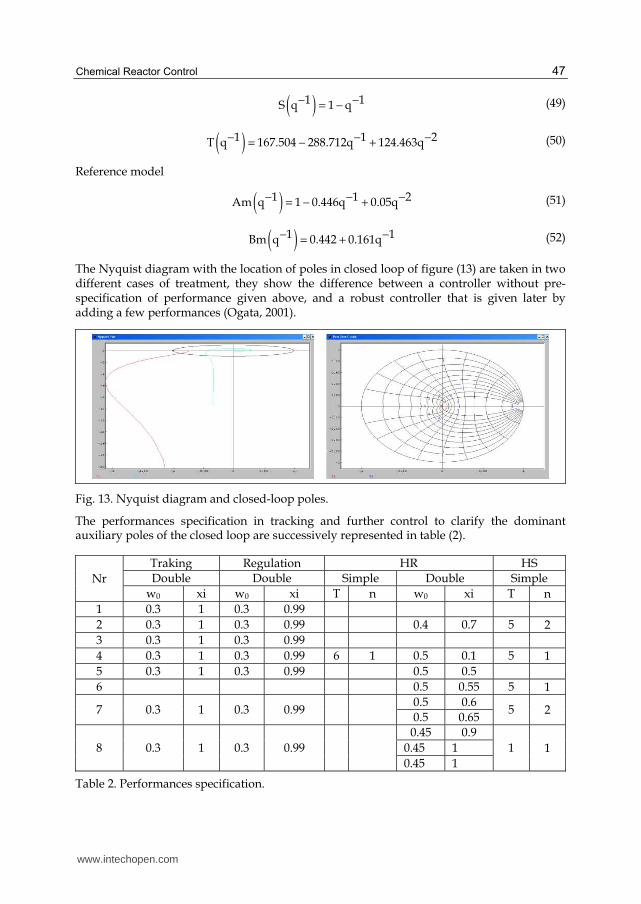
The Nyquist diagram with the location of poles in closed loop of figure (13) are taken in two different cases of treatment, they show the difference between a controller without pre-specification of performance given above, and a robust controller that is given later by adding a few performances (Ogata, 2001).
Fig. 13. Nyquist diagram and closed-loop poles.
The performances specification in tracking and further control to clarify the dominant auxiliary poles of the closed loop are successively represented in table (2).
Nr
Traking Regulation HR HS Double Double Simple Double Simple
w0 xi w0 xi T n w0 xi T n
1 0.3 1 0.3 0.99
2 0.3 1 0.3 0.99 0.4 0.7 5 2
3 0.3 1 0.3 0.99
4 0.3 1 0.3 0.99 6 1 0.5 0.1 5 1
5 0.3 1 0.3 0.99 0.5 0.5
6 0.5 0.55 5 1
7 0.3 1 0.3 0.99 0.5 0.6
5 2 0.5 0.65
8 0.3 1 0.3 0.99
0.45 0.9
1 1 0.45 1
0.45 1
Table 2. Performances specification.
www.intechopen.com
Petrochemicals
48
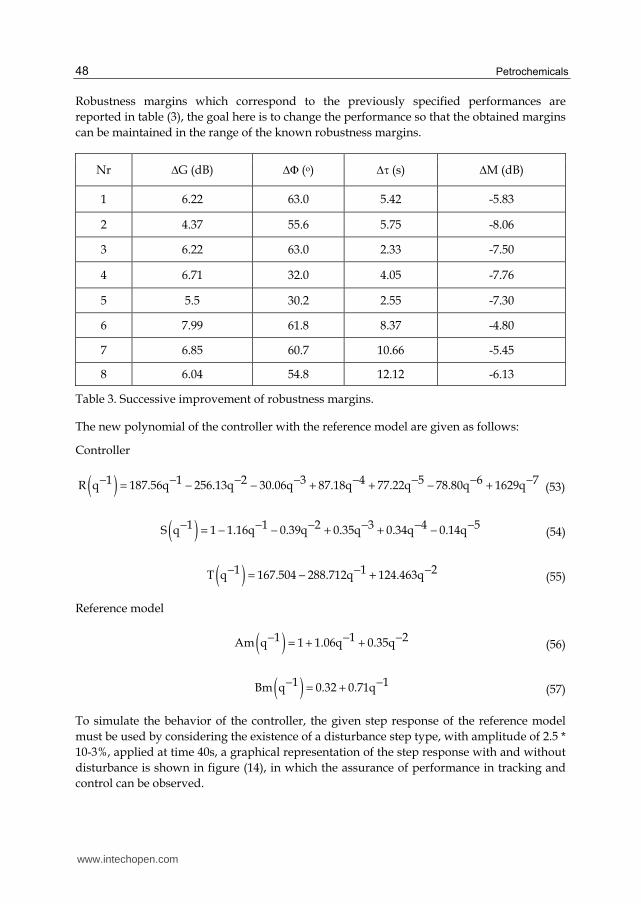
Robustness margins which correspond to the previously specified performances are
reported in table (3), the goal here is to change the performance so that the obtained margins
can be maintained in the range of the known robustness margins.
Nr ∆G (dB) ∆l (o) ∆ (s) ∆M (dB)
1 6.22 63.0 5.42 -5.83
2 4.37 55.6 5.75 -8.06
3 6.22 63.0 2.33 -7.50
4 6.71 32.0 4.05 -7.76
5 5.5 30.2 2.55 -7.30
6 7.99 61.8 8.37 -4.80
7 6.85 60.7 10.66 -5.45
8 6.04 54.8 12.12 -6.13
Table 3. Successive improvement of robustness margins.
The new polynomial of the controller with the reference model are given as follows:
Controller
( )1 1 2 3 4 5 6 7R q 187.56q 256.13q 30.06q 87.18q 77.22q 78.80q 1629q− − − − − − − −= − − + + − + (53)
( )1 1 2 3 4 5S q 1 1.16q 0.39q 0.35q 0.34q 0.14q− − − − − −= − − + + − (54)
( )1 1 2T q 167.504 288.712q 124.463q− − −= − + (55)
Reference model
( )1 1 2Am q 1 1.06q 0.35q− − −= + + (56)
( )1 1Bm q 0.32 0.71q− −= + (57)
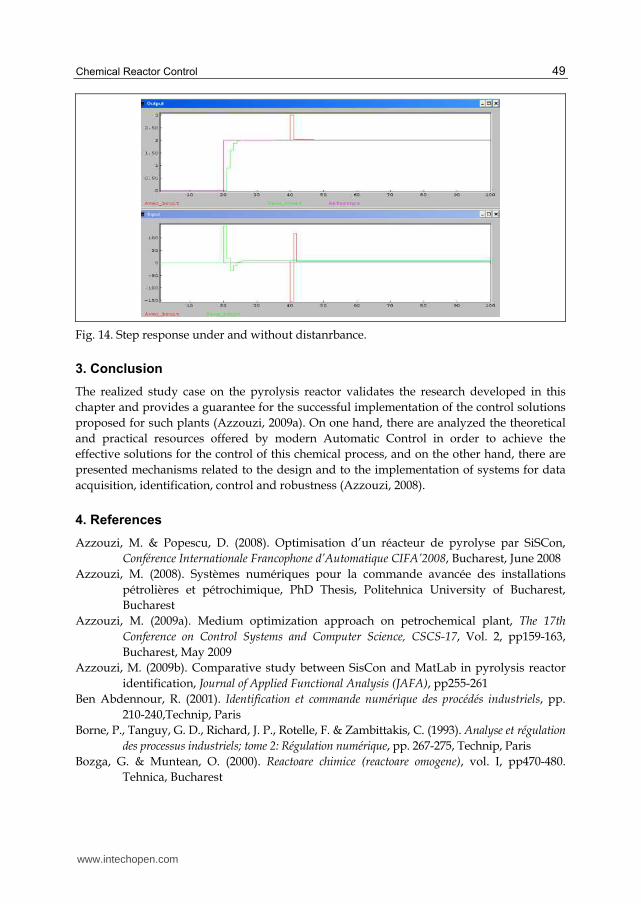
To simulate the behavior of the controller, the given step response of the reference model
must be used by considering the existence of a disturbance step type, with amplitude of 2.5 *
10-3%, applied at time 40s, a graphical representation of the step response with and without
disturbance is shown in figure (14), in which the assurance of performance in tracking and
control can be observed.
www.intechopen.com
Chemical Reactor Control
49
Fig. 14. Step response under and without distanrbance.
3. Conclusion
The realized study case on the pyrolysis reactor validates the research developed in this
chapter and provides a guarantee for the successful implementation of the control solutions
proposed for such plants (Azzouzi, 2009a). On one hand, there are analyzed the theoretical
and practical resources offered by modern Automatic Control in order to achieve the
effective solutions for the control of this chemical process, and on the other hand, there are
presented mechanisms related to the design and to the implementation of systems for data
acquisition, identification, control and robustness (Azzouzi, 2008).
4. References
Azzouzi, M. & Popescu, D. (2008). Optimisation d’un réacteur de pyrolyse par SiSCon,
Conférence Internationale Francophone d’Automatique CIFA’2008, Bucharest, June 2008
Azzouzi, M. (2008). Systèmes numériques pour la commande avancée des installations
pétrolières et pétrochimique, PhD Thesis, Politehnica University of Bucharest,
Bucharest
Azzouzi, M. (2009a). Medium optimization approach on petrochemical plant, The 17th
Conference on Control Systems and Computer Science, CSCS-17, Vol. 2, pp159-163,
Bucharest, May 2009
Azzouzi, M. (2009b). Comparative study between SisCon and MatLab in pyrolysis reactor
identification, Journal of Applied Functional Analysis (JAFA), pp255-261
Ben Abdennour, R. (2001). Identification et commande numérique des procédés industriels, pp.
210-240,Technip, Paris
Borne, P., Tanguy, G. D., Richard, J. P., Rotelle, F. & Zambittakis, C. (1993). Analyse et régulation
des processus industriels; tome 2: Régulation numérique, pp. 267-275, Technip, Paris
Bozga, G. & Muntean, O. (2000). Reactoare chimice (reactoare omogene), vol. I, pp470-480.
Tehnica, Bucharest
www.intechopen.com

Petrochemicals
50
Harriott, P. (2002). Chemical reactor design, pp. 131-142. CRC First Edition, New York
Landau, Y, D. & Zito, Gianluca. (2006). Digital Control Systems: Design, Identification and
Implementation, pp. 267-291, First Edition of Springer, Paris
Ogata. K. (2001). Modern control engineering, pp. 310-431. Prentice Hall fourth Edition, New
York
Oustaloup, A. (1994). La robustesse: Analyse et synthèse des commandes robustes, pp. 150-102,
Hermes, Paris
Popescu, D., Lupu, C., Petrescu, C. & Matescu, M. (2006b). Sisteme de Conducere a proceselor
industriale, pp. 24-29, Printech, Bucharest
Popescu, D., Stefanoiu, D., Lupu, C., Petrescu, C., Ciubotaru, B. & Dimon, C. (2006a).
Industrial Automation, Agir, Bucharest
www.intechopen.com
PetrochemicalsEdited by Dr Vivek Patel
ISBN 978-953-51-0411-7Hard cover, 318 pagesPublisher InTechPublished online 28, March, 2012Published in print edition March, 2012
InTech EuropeUniversity Campus STeP Ri Slavka Krautzeka 83/A 51000 Rijeka, Croatia Phone: +385 (51) 770 447 Fax: +385 (51) 686 166www.intechopen.com
InTech ChinaUnit 405, Office Block, Hotel Equatorial Shanghai No.65, Yan An Road (West), Shanghai, 200040, China
Phone: +86-21-62489820 Fax: +86-21-62489821
The petrochemical industry is an important constituent in our pursuit of economic growth, employmentgeneration and basic needs. It is a huge field that encompasses many commercial chemicals and polymers.This book is designed to help the reader, particularly students and researchers of petroleum science andengineering, understand the mechanics and techniques. The selection of topics addressed and the examples,tables and graphs used to illustrate them are governed, to a large extent, by the fact that this book is aimedprimarily at the petroleum science and engineering technologist. This book is must-read material for students,engineers, and researchers working in the petrochemical and petroleum area. It gives a valuable and cost-effective insight into the relevant mechanisms and chemical reactions. The book aims to be concise, self-explanatory and informative.
How to referenceIn order to correctly reference this scholarly work, feel free to copy and paste the following:
Azzouzi Messaouda and Popescu Dumitru (2012). Chemical Reactor Control, Petrochemicals, Dr Vivek Patel(Ed.), ISBN: 978-953-51-0411-7, InTech, Available from:http://www.intechopen.com/books/petrochemicals/chemical-reactor-control

© 2012 The Author(s). Licensee IntechOpen. This is an open access articledistributed under the terms of the Creative Commons Attribution 3.0License, which permits unrestricted use, distribution, and reproduction inany medium, provided the original work is properly cited.