chemical contaminants - fødevarestyrelsen publikationer... · chemical contaminants food...
TRANSCRIPT

Chemical contaminants Food monitoring, 1998-2003. Part 1. Prepared by: Arvid Fromberg Erik Huusfeldt Larsen Henrik Hartkopp John Christian Larsen Kit Granby Kevin Jørgensen Peter Have Rasmussen Tommy Cederberg Tue Christensen Danish Institute for Food and Veterinary Research Food monitoring, 1998-2003, consists of four sub-reports: Part 1: Chemical contaminants Part 2: Pesticides Part 3: Food additives Part 4: Microbial contaminants

2
Chemical contaminants Food monitoring, 1998-2003. Part 1. FødevareRapport 2005:01 1st Edition, 1st Circulation, April 2005 Copyright: Danish Veterinary and Food Administration Price: DKK ?.- incl. VAT ISBN: 87-91569-58-3 ISSN: 1399-0829 (FødevareRapport) Danish Veterinary and Food Administration Mørkhøj Bygade 19, DK-2860 Søborg Tel. + 45 33 95 60 00, fax + 45 33 95 60 01 Web site: www.fvst.dk The Danish Veterinary and Food Administration is part of the Ministry of Family and Con-sumer Affairs. The Danish Veterinary and Food Administration is responsible for the admini-stration and control within food and veterinary areas “from farm to fork”, as well as practical matters relating to animal protection (otherwise under the Ministry of Justice). Making of regulations, co-ordination and development, take place in the Administrations cen-ter in Moerkhoej. The 10 Regional Authorities handle the practical inspection of food and veterinary matters, including import/export etc. The central administration of The Danish Veterinary and Food Administration employ a staff of approx. 250 full-time employees, whilst the 10 regional authorities employ a further approx.1500 full-time employees.

3
Table of contents
1 Preface .............................................................................................................5
2 Sammenfatning og konklusion ......................................................................7
3 Summary and conclusion.............................................................................11
4 Monitoring programme for foods.................................................................15
5 Introduction ...................................................................................................17 5.1 Data on contents ...................................................................................18 5.2 Intake calculations.................................................................................18 5.3 Safety assessments ..............................................................................19
6 Trace elements ..............................................................................................20 6.1 Introduction............................................................................................20 6.2 Methods of sampling, analysis and quality assurance...........................20 6.3 Data on contents and developments over time .....................................23 6.4 Intake calculations and safety assessment ...........................................26
7 Nitrate in vegetables .....................................................................................36 7.1 Introduction............................................................................................36 7.2 Sampling, analytical method and quality assurance..............................36 7.3 Data on contents ...................................................................................37 7.4 Developments in nitrate contents of vegetables over time ....................39 7.5 Intake calculations.................................................................................41 7.6 Safety assessment ................................................................................42
8 Organic environmental contaminants .........................................................44 8.1 Introduction............................................................................................44 8.2 Sampling, analytical methods, and quality assurance ...........................48 8.3 Data on contents ...................................................................................49 8.4 Development in contents over time .......................................................56 8.5 Intake calculations.................................................................................64 8.6 Safety assessment ................................................................................72 8.7 Human milk ...........................................................................................76
9 Mycotoxins (ochratoxin A) ...........................................................................79 9.1 Introduction............................................................................................79 9.2 Sampling and analytical methods..........................................................79 9.3 Data on contents ...................................................................................80 9.4 Intake calculations.................................................................................82 9.5 Safety assessment ................................................................................83
10 References .....................................................................................................85

4
11 Appendices ....................................................................................................91 11.1 Appendix to Trace elements..................................................................92 11.1.1 Contents of lead (µg/kg fresh weight) in foods sampled, 1998-2003 ............................92 11.1.2 Contents of cadmium (µg/kg fresh weight) in foods sampled, 1998-2003 ....................95 11.1.3 Contents of nickel (µg/kg fresh weight) in foods sampled, 1998-2003..........................98 11.1.4 Contents of mercury (µg/kg fresh weight) in foods sampled, 1998-2003................... 101 11.1.5 Contents of selenium (µg/kg fresh weight) in foods sampled, 1998-2003.................. 104 11.1.6 Contents of arsenic (µg/kg fresh weight) in foods sampled, 1998-2003 .................... 107
11.2 Appendix to Nitrate..............................................................................110 11.2.1 Nitrate content (mg/kg fresh weight) in vegetables 1998, 1999, 2000 and 2001 ....... 110 11.2.2 Nitrate content (mg/kg fresh weight) in vegetables 2002 and 2003 ........................... 111
11.3 Appendix to Organic environmental contaminants ..............................112 11.3.1 Number of samples of different foods for OCPs and indicator PCB........................... 112 11.3.2 Number of samples of different foods analysed for dioxins and PCB, 1998-2003..... 113 11.3.3 Number of human samples analysed for dioxins, PCB and chlorinated pesticides ... 113 11.3.4 Tables of contents for alpha-HCH .............................................................................. 114 11.3.5 Tables of contents for beta-HCH ................................................................................ 115 11.3.6 Tables of contents for chlordan-sum .......................................................................... 116 11.3.7 Tables of contents for DDT-sum................................................................................. 117 11.3.8 Tables of contents for Endosulfan A........................................................................... 118 11.3.9 Tables of contents for endrin ...................................................................................... 119 11.3.10 Tables of contents for dieldrin..................................................................................... 120 11.3.11 Tables of contents for heptachlor ............................................................................... 121 11.3.12 Tables of contents for HCB......................................................................................... 122 11.3.13 Tables of contents for lindane..................................................................................... 123 11.3.14 Tables of contents for PCB-28.................................................................................... 124 11.3.15 Tables of contents for PCB-52.................................................................................... 125 11.3.16 Tables of contents for PCB-101.................................................................................. 126 11.3.17 Tables of contents for PCB-105.................................................................................. 127 11.3.18 Tables of contents for PCB-118.................................................................................. 128 11.3.19 Tables of contents for PCB-138.................................................................................. 129 11.3.20 Tables of contents for PCB-153.................................................................................. 130 11.3.21 Tables of contents for PCB-156.................................................................................. 131 11.3.22 Tables of contents for PCB-170.................................................................................. 132 11.3.23 Tables of contents for PCB-180.................................................................................. 133 11.3.24 Tables of contents for PCB-sum................................................................................. 134 11.3.25 Occurrence of dioxins in selected foods in 2000-2003............................................... 135 11.3.26 Occurrence of dioxin-like PCB in selected foods in 2000-2003.................................. 136 11.3.27 Occurrence of total TEQ (dioxins and dioxin-like PCB).............................................. 137 11.3.28 Occurrence of PCB 153 in selected foods in 2000-2003............................................ 138 11.3.29 Occurrence of dioxins, PCB and chlorinated pesticides in human milk ..................... 139 11.3.30 Commodity types used in the calculation ................................................................... 140 11.3.31 Limits of detection for organochlorine pesticides and indicator PCB ......................... 143
11.4 Appendix to Mycotoxins ......................................................................147 11.4.1 Occurrence of ochratoxin A in wheat (kernels and flour)............................................ 147 11.4.2 Occurrence of ochratoxin A in rye (kernels and flour) ................................................ 148 11.4.3 Estimates of ochratoxin A contents (µg/kg) in foods included in intake calculations . 149

5
1 Preface
The monitoring programme for foods was established in 1983. Results are reported for peri-ods of five or six years; thus, the present report covers the fourth period, 1998-2003.
The fourth period report of the monitoring programme consists of the following sub-reports:
Part 1: Chemical contaminants Part 2: Pesticides Part 3: Food additives Part 4: Microbial contaminants The Danish Veterinary and Food Administration coordinates the studies in collaboration with the Danish Institute for Food and Veterinary Research. The regional laboratories in Copenha-gen, Odense (until 1999), Ringsted, Aalborg (until 1999), and Århus carried out the analyses of chemical contaminants. The only exception is dioxin analyses, which for most parts where carried out by Danish Institute for Food and Veterinary Research. Most samples were taken by the regional veterinary and food control authorities; while samples of fish from Danish waters were taken by the Fisheries Inspections under the Danish Directorate of Fisheries. The reporting of chemical contaminants was coordinated by Arvid Fromberg, Danish Institute for Food and Veterinary Research.
April 2005


7
2 Sammenfatning og konklusion
I det danske overvågningsprogram for fødevarer har indholdet af kemiske forureninger været fulgt gennem 21 år. De fleste af de stoffer der er undersøgt i denne delrapport har været un-dersøgt siden overvågningsprogrammets start i 1983.
Nærværende rapport beskriver resultaterne af udvalgte fødevarers indhold af sporelementer, nitrat, organiske miljøforureninger og svampetoksiner i den 4. overvågningsperiode 1998-2003. Udviklingstendenser i koncentrationsniveauerne er undersøgt gennem perioden og er sammenlignet med tilsvarende data fra de tidligere overvågningsperioder.
Indtaget af forureningerne via kosten er blevet estimeret ud fra indholdsdata for de kemiske forureninger i fødevarer samt danskernes kostindtag. Kostindtagene er beregnet for voksne og for nogle af stofferne er indtaget også beregnet for børn. Der er foretaget en sundhedsmæssig vurdering på basis af de estimerede indtag i forhold til enten Acceptabel daglig indtagelse (ADI), Tolerabel daglig indtagelse (TDI), Tolerabel ugentlig indtagelse (TWI) eller Proviso-risk tolerabelt ugentligt indtag (PTWI). ADI/TDI/TWI/PTWI angiver ikke faregrænser, men den mængde mennesker kan indtage dagligt hele livet igennem uden at det betyder en risiko for sundhedsskade. Indtag over ADI/TDI/TWI/PTWI gennem kortere eller længere perioder forventes ikke at føre til en forhøjet risiko så længe det livslange gennemsnitlige indtag er på den sikre side.
Sporelementer
Overvågningsprogrammet inkluderer de toksiske sporelementer bly, cadmium, nikkel, kvik-sølv og arsen samt det essentielle sporelement selen. I alt 7585 prøver fordelt på 96 forskelli-ge fødevaretyper fra det danske marked er blevet udtaget og analyseret.
De fem toksiske sporelementer blev inkluderet i overvågningsprogrammet fordi tidligere overvågningsperioder har vist at indtaget af disse sporelementer var signifikant, uden dog at overskride det tolerable indtag. Selen blev inkluderet på grund af dets betydning som antioxi-dant.
Resultaterne fra overvågningsprogrammet 1998-2003 viser at indholdet af bly, cadmium og kviksølv i fødevarer fra det danske marked er forblevet på et konstant koncentrationsniveau sammenlignet med tidligere overvågningsperioder. Forekomsten af disse tre sporelementer i fødevarerne skyldes hovedsagelig atmosfærisk nedfald eller ved optag gennem rødderne fra opdyrket jord. I kontrast til dette kan naturlige biogeokemiske processer i det terrestriske eller marine miljø forklare tilstedeværelsen af nikkel, arsen og selen i fødevarer.
Indholdet af bly i bladgrønsager som f.eks. grønkål og i indmad som f.eks. oksenyrer, der blev benyttet som markør-fødevarer, har vist en nedgang over tid sammenlignet med data fra tidli-gere overvågningsperioder. En mindre, men signifikant nedgang, blev fundet for cadmium i

8
gulerødder og kartofler. Ingen signifikante ændringer blev fundet for kviksølv, nikkel og ar-sen.
For bly, cadmium og nikkel var brød og cerealier, grøntsager og drikkevarer de største kilder til indtaget. Drikkevarer inkluderer drikkevand (postevand), som generelt har en lav koncen-tration af disse sporelementer, selvom afsmitning fra visse vand-installationer kan forårsage en markant stigning i indholdet. Det høje indtag af vand forklarer hvorfor vand er en vigtig kilde for indtaget sporelementer. For arsen og kviksølv er fisk den vigtigste fødevaregruppe. For selen er kød, brød, cerealier samt fisk de vigtigste kilder til indtaget.
Indtaget af kviksølv og cadmium er for voksne henholdsvis 41% og 24% af PTWI værdien (provisorisk tolerabelt ugentligt indtag). For børn i aldersgruppen 4-6 år, er de samme værdier henholdsvis 45% og 57% af PTWI. Eftersom PTWI værdierne indikerer et indtag hvor skade-lige effekter kan forekomme i de mest sensitive individer, er indtaget for kviksølv og cadmi-um blevet vurderet som højt, dog uden at medføre sundhedsfare. Det estimerede indtag af bly, nikkel og arsen er relativt lavt og medfører ingen sundhedsfare. Indtaget af selen er tilstræk-keligt og overholder de nordiske anbefalinger.
Nitrat
Grøntsager udgør stadig det største bidrag til det humane indtag af nitrat i Danmark. I nærvæ-rende overvågningsperiode er nitratindholdet bestemt i kartofler, hovedsalat, icebergsalat, spinat, børnemad samt i en række andre grøntsager som rødbede, selleri og rucola salat.
Nitratindholdet i hovedsalat og i icebergsalat er lavere i denne overvågningsperiode sammen-lignet med den foregående periode fra 1993 til 1996, men højere i forhold til perioden fra 1984 til 1988. Ligesom for de to foregående overvågningsperioder er nitratindholdet højere i dansk produceret salat sammenlignet med udenlandsk salat, mens indholdet af nitrat i danske kartofler stadigvæk generelt er lavere end i udenlandske kartofler. De højeste nitratindhold blev fundet i rucolasalat med gennemsnitsindhold højere end 5200 mg/kg, mens det laveste indhold var i børnemad med gennemsnitsindhold på 9 mg/kg og 34 mg/kg for henholdsvis 2002 og 2003.
Salat og kartofler udgør stadig de største bidragsydere til indtaget af nitrat i Danmark, men i modsætning til de tidligere overvågningsperioder er nitratindtaget nu højere for salat end for kartofler. Således er nitratindtaget for indeværende overvågningsperiode bestemt til cirka 19 mg/dag for salat og 12 mg/dag for kartofler. Indtaget af salat er steget fra cirka 4 g/dag for perioderne 1984 – 1988 og 1993 – 1996 til cirka 9 g/dag i indeværende overvågningsperiode, samtidig med at indtaget af kartofler er faldet fra henholdsvis cirka 166 g/dag (1984 – 1988) og 124 g/dag (1993 - 1996) til cirka 100 g/dag i indeværende overvågningsperiode. Disse for-hold kan forklare, at indtaget af nitrat nu er højere for salat end for kartofler.

9
Det gennemsnitlige indtag af nitrat fra kosten, inklusiv drikkevand, for en voksen person på 70 kg er beregnet til cirka 61 mg/dag, hvilket er lavt i forhold til den fastlagte ADI værdi for nitrat på 257 mg/dag. Indholdet af nitrat i børnemad for indeværende overvågningsperiode er lav i forhold til EU grænseværdien på 200 mg/kg, hvilket viser at nitratindholdet i denne typer af produkter ikke er et sundhedsmæssigt problem.
Organiske miljøforureninger
De organiske forureninger, der er undersøgt i overvågningsprogrammet, inkluderer en række chlorpesticider og deres omdannelsesprodukter, samt polychlorerede biphenyler (PCB). Se-nest er også dioxin og dioxin-lignende PCB blevet tilføjet til overvågningsprogrammet. Alle disse stoffer er langsomt nedbrydelige og findes derfor i miljøet og dermed også i vore føde-varer. Det karakteristiske ved stofferne er, at de akkumuleres i fedtvæv hos dyr og mennesker.
Mange af de undersøgte chlororganiske forbindelser kan forårsage kræft hos dyr og menne-sker. Endvidere har nogle af de chlororganiske forbindelser i reagensglasforsøg vist potentiale til at påvirke hormonsystemet. For dioxiner er de mest følsomme effekter på forplantningsev-nen, immunforsvaret og centralnervesystemet.
Tilstedeværelsen af de organiske miljøforureninger er blevet undersøgt i kød, fisk og mejeri-produkter. I mange af prøverne er der ikke påvist indhold af de undersøgte chlorpesticider og indikator-PCB over detektionsgrænsen. De højeste gennemsnitlige indhold er fundet i torske-lever og fed fisk.
Udviklingen over tid for indholdene af chlorpesticider og indikator-PCB i fisk er fulgt i denne samt de tre tidligere overvågningsperioder. Der er observeret et generelt fald i indholdene i de forgående tre perioder, hvorimod der i den fjerde periode ikke har kunne konstateres et fald. For produkter af animalsk oprindelse kan der ikke ses nogen klar udvikling i koncentrations-niveauerne.
Den danske befolknings gennemsnitlige daglige indtag er estimeret til at være mellem 0,03 og 0,3 µg/dag for hver af chlorpesticiderne og 0,9 µg/dag for summen af indikator-PCB. Estima-tet for personer der har et relativt højt indtag af stofferne (0,95-fraktilen) viser, at de konsume-rer cirka dobbelt så meget som gennemsnitsdanskeren. Personer med specielle ind-tagsmønstre, f.eks. personer med betydelig konsumering af torskelever eller torskeleverolie forventes dog at have et endnu højere indtag. Det højeste bidrag til indtaget af chlororganiske forbindelser er fra fisk, kød og mejeriprodukter, hvor børn har et højere indtag fra mælk og mælkeprodukter og et lavere fra fisk end voksne.
Det kan konkluderes, ud fra en sammenligning af de estimerede indtag med ADI eller TDI for de respektive stoffer, at de fundne indhold ikke giver anledning til sundhedsmæssige be-tænkeligheder. Det højeste forhold mellem det estimerede indtag og TDI er for børns indtag af PCB, hvor det gennemsnitlige indtag udgør 25% af TDI og for voksne hvor det udgør 13% af TDI. Beskyttelsesniveauet for PCB er derfor signifikant lavere end for chlorpesticiderne.
10
For dioxin og dioxin-lignende PCB er det gennemsnitlige indtag for voksne ca. 50% af TWI (tolerabel ugentlig indtag). Personer med et højt kostindtag af dioxin og dioxin-lignende PCB (f.eks. 95-percentilen) er tæt ved at overskride TWI-værdien, afhængig af oprindelse, forure-ningsniveauet og hvor meget fed fisk de indtager. Børns indtag af dioxin og dioxin-lignende PCB fra andre fødevarer end fisk er i gennemsnit 2-3 gange større end for voksne. For disse fødevarer er mælk og andre mejeriprodukter den dominerende kilde til indtaget. Der er flere børn end voksne, der forventes at overskride TWI. Ved risikovurdering af voksnes og børns eksponering for dioxin og dioxin-lignende PCB vurderes et indtag over TWI i kortere tidsrum ikke at have betydning for risikoen. Forbrugeren er indenfor sikkerhedsmargenen, så længe man følger de anbefalede kostråd, specielt hvad angår indtag af fede fisk.
I denne overvågningsperiode har man, for at få et billede af den integrerede eksponering for organiske miljøforureninger, som noget nyt undersøgt modermælk for organiske chlorforbin-delser, PCB og dioxin. Tidligere undersøgelser har vist et fald i indholdene i modermælk fra danske kvinder og resultaterne i denne rapport viser en fortsættelse af denne tendens. Ved sammenligning med data fra 8-9 år siden er der for dioxin og dioxin-lignende PCB sket et fald på 46% , for PCB et fald på 57% og for chlorpesticider et fald på mellem 50-60%.
Mykotoksiner (ochratoksin A)
Ochratoksin A er blevet karakteriseret som et muligt humant kræftfremkaldende stof. Siden 1986 har ochratoksin A i kornprodukter været en del af det danske overvågningssystem. Ind-holdet af ochratoksin A i danske kornprodukter er faldet betragteligt i de senere år. Økologisk dyrkede kornprodukter har generelt indeholdt mere ochratoksin A end konventionelt dyrkede kornprodukter, men denne forskel synes dog at være mindsket i de seneste år. Forskellen mel-lem økologisk og konventionelt dyrkede kornprodukter har sandsynligvis været relateret til forhold omkring tørring af korn og opbevaringsforhold.
Kornprodukter er den vigtigste kilde til den danske befolknings indtag af ochratoksin A. Estimerede indtag baseret på data fra denne 4. overvågningsperiode viser, at personer, der har et højt indtag af ochratoksin A (95% fraktil) nu har et indtag under TDI værdien på 5 ng/kg legemsvægt/dag. Det gælder både personer, der konsumerer udelukkende konventionelle eller udelukkende økologiske kornprodukter. Omkring halvdelen af indtaget af ochratoksin A kommer fra kornprodukter og rugbrød er den vigtigste kilde.

11
3 Summary and conclusion
Chemical contaminants in foods has been a part of the monitoring programme for foods since its start in 1983; thus, some of the chemical contaminants dealt with in this sub-report have now been followed through a period of 21 years.
The report covers results from analyses of contents of trace elements, nitrate, organic envi-ronmental contaminants and mycotoxins in selected foods during the 4th monitoring period 1998-2003 as well as comparisons with corresponding data on contents from previous moni-toring periods.
Results from the chemical analyses are combined with data on the consumption of the con-cerned foods items in calculations of the adult Danish population’s intake of the substances. For some of the substances, intake calculations are also made for children. On basis of the calculated intakes of chemical contaminations combined with the substances Acceptable daily intake (ADI), Tolerable daily intake (TDI), Tolerable weekly intake (TWI) or Provisional tolerable weekly intake (PTWI), a safety assessment has been made. ADI/TDI/TWI/PTWI do not indicate any danger limit, but the daily or weekly intake on a life-long basis, which may take place with a high degree of safety, where intakes above the ADI/TDI/TWI/PTWI through shorter or longer periods of time are not considered to involve any increased risk as long as the long-term average intake is kept on the safe side.
Trace elements
The monitoring programme includes the toxic trace elements lead, cadmium, nickel, mercury and arsenic as well as the essential element selenium. A total of 7585 samples of 96 foods most frequently consumed by the Danes were sampled on the Danish market and analysed.
The five toxic trace elements were included in the monitoring programme, because the former monitoring periods have shown that the dietary intake was noticeable but not exceeding the tolerable intake. Selenium was included because of its importance as an antioxidant.
The results of the monitoring programme 1998-2003 show that the contents of lead, cadmium and mercury in foods marketed in Denmark remain at a stable concentration level in compari-son with the previous monitoring period. The occurrence of these three contaminants in foods is mainly caused by atmospheric deposition or by root uptake from arable soil. In contrast, natural biogeochemical processes in the terrestrial or marine environments mainly explain the contents of nickel, arsenic and selenium in food.
The content of lead in leafy vegetables such as curly kale and in offal such as ox kidney, which were used as marker foods, has shown a long-term decrease in concentration. A smaller but significant decrease was shown for cadmium in carrots and potatoes. No marked changes over time have occurred for mercury, nickel and arsenic.

12
For lead, cadmium and nickel, the highest contributors to the dietary intake are bread and ce-reals, vegetables and beverages. Beverages include drinking water (tap water), which gener-ally has a low concentration of these trace elements, although migration from some water in-stallations may cause this content to increase markedly. The high consumption explains why water is of importance for the trace element intake. For the intake of arsenic and mercury, fish is the most important food group. For selenium, meats, bread and cereals as well as fish are the most important contributors to the intake.
The adult dietary intake of mercury and cadmium is up to 41 % and 24 % of the provisional tolerable intake values (PTWI), respectively. For children from 4-6 years of age, the same values amount to 45 % and 57 % of the PTWI values. Because the PTWI values indicate an intake where adverse effects may occur in the most sensitive individuals, the estimated mer-cury and cadmium intakes are evaluated as being high but not causing any health concerns. The estimated dietary intake of lead, nickel and arsenic is evaluated a relatively low and safe. The selenium intake is sufficient and coincides with the Nordic recommendations.
Nitrate
Vegetables are the main contributor to the intake of nitrate in the human diet, generally pro-viding approximately 80 % of the total daily intake. The acute toxicity of nitrate is low, but in food and in the gastrointestinal tract the nitrate ion can be reduced to nitrite, which has higher acute toxicity. However, the health problem with nitrite is the contribution to the formation of nitrosamines, which have been found to be a potent carcinogenic in animal experiments. In addition, several of the nitrosamines are also considered to be carcinogenic to humans.
In the present monitoring period, nitrate content was determined in potatoes, head and iceberg lettuce, spinach, baby food and several other vegetables, such as beetroot, celery and rucola lettuce.
The average content of nitrate in both head lettuce and iceberg lettuce of Danish origin showed a small decrease compared to the period from 1993 – 1996, but an increase compared to the period (1984 – 1988). The contents of nitrate were generally lower in foreign than in Danish lettuce. However, the average nitrate content for all the samples of Danish and foreign lettuce was very similar for the three investigated monitoring periods, corresponding to ap-proximately 2000 mg/kg. In the present monitoring period, the content of nitrate in Danish potatoes was found to be very similar from year to year with an average content of approxi-mately 100 mg/kg. As in the previous two monitoring periods, higher nitrate contents were found in foreign than in Danish potatoes. Very high nitrate contents were found in samples of rucola lettuce with mean values above 5200 mg/kg, whereas the lowest contents were ob-tained in samples of baby food with mean values not exceeding 34 mg/kg.
Lettuce and potatoes are still the main contributor to intake of nitrate by the Danish popula-tion. However, contrary to the two foregoing monitoring periods, the nitrate intake is now

13
considerably higher for lettuce than for potatoes. Thus, the mean intake of nitrate in the pre-sent monitoring period was estimated to be approximately 19 mg/day for lettuce and 12 mg/day for potatoes. The intake of lettuce has increased from approximately 4 g/day during the periods from 1984 - 1988 and 1993 – 1996 to about 9 g/day in the present period. These differences explain why lettuce is now a more important contributor to the intake of nitrate than potatoes. The nitrate intake for a person weighing 70 kg was determined using the data from the present monitoring period to be approximately 60 mg/day, which is fairly low com-pared to the ADI value for nitrate (257 mg/day). The mean content of nitrate found in baby food in the present monitoring period is low compared to EU maximum limit for these prod-ucts (200 mg/kg), indicating that nitrate in baby food does not represent a food safety prob-lem.
Organic environmental contaminants
The organochlorine substances included in the monitoring programme are a number of or-ganochlorine pesticides, including metabolites and indicator PCB. Most recently dioxins and dioxin-like PCB have been added to the program. These substances are slowly degradable and therefore persist for long periods in the environment, where they accumulate in the fatty tis-sues of animals and humans.
Many of the organochlorine compounds included in the monitoring programme causes devel-opment of cancer in the liver of animals. Some of these organochlorine compounds have also shown a potential to affect hormone systems in vitro. For dioxins the most sensitive effects in animal studies are on the reproductive, immune and central nervous system.
The contents of organochlorine environmental contaminants have been analysed in meat, fish, and dairy products. In a large number of samples, the contents of the organochlorine pesti-cides and indicator PCB under study were not detected, being below the limit of detection. The highest average contents are found in cod liver and fatty fish.
The contents of organochlorine pesticides and indicator PCB in fish during the present and the three previous monitoring periods have been compared, and a general downward tendency in concentrations were observed for the previously periods but the tendency of the fourth period seems to be at steady state condition. The development in contents in products of animal ori-gin is not so clear.
The Danish population’s average daily intake has been estimated at between 0.03 and 0.3 µg/day for the individual organochlorine pesticides and 0.9 µg/day for indicator PCB-sum. Persons having a relatively high intake of the substances (the 0.95 quantile) are estimated to consume approximately twice as much, whereas persons with special intake patterns, e.g. a substantial consumption of cod liver or cod liver oil, may have even higher intakes. The high-est contributions to the intake of the organochlorine environmental contaminants are from fish, meat and dairy products, where children have higher intake from milk and milk products and lower intake from fish, than adults.

14
When the estimated intakes and the ADI/TDI values are compared, the found quantities of the organochlorine pesticides and indicator PCB measured is not considered to give occasion for health concerns. The highest ratio is found for the intake of PCB for children where the aver-age intake make up 25% of TDI and for adults the PCB intake make up 13% of TDI. The pro-tection level for PCB is therefore significantly lower than for the organochlorine pesticides measured.
For dioxins and dioxin-like PCB the average estimated intake for adults constitutes approxi-mately 50% of the TWI. Persons with high dietary intake of dioxin and dioxin-like PCB (e.g. the 0.95 quantile) are close to or exceed the TWI, depending on the origin and the contamina-tion level in especially the fatty fish they consume. For children the intake of dioxins and di-oxin-like PCB from food, excluding fish, is two to three times the intake estimated for adults. Milk and milk products are the dominant contributors to the intake. A larger proportion of children are likely to exceed the TWI than compared to adults. However, the overall risk as-sessment for the life time exposure of dioxin and dioxin-like PCB by adults and children does not find short time intake above TWI critical. The consumer is within a safe margin for dioxin exposure as long as the general dietary advises is followed, especially concerning intake of fatty fish.
Human milk has been included in the monitoring program in the recent period in order to fol-low the integrated human exposure to organic environmental contaminants. The samples have been analysed for organochlorine pesticides, PCB and dioxins. Previous surveys of Danish human milk have shown a decrease in contents by the dominating compounds, and the new data continues the trend. Compared to the levels 8-9 years ago dioxins and dioxin-like PCB have decreased by 46%, PCB by 57% and many organochlorine pesticides by 50% to 60%.
Mycotoxins (ochratoxin A)
Ochratoxin A has been classified as a possible human carcinogen. Since 1986 measurement of ochratoxin A in cereals has been a part of the Danish monitoring system. The content of ochratoxin A in Danish cereals has decreased in recent years. Organically grown cereals have generally contained more ochratoxin A than conventionally grown cereals. The difference has, however, tended to diminish in recent years. The difference between organic and conven-tional cereals can presumably be explained in terms of grain drying and storage conditions.
Cereals are the most important source to the Danish population’s intake of ochratoxin A. The intake estimates based on data from the 4th monitoring period show that persons having a high intake of ochratoxin A (the 0.95 quantile) have intakes below the TDI value of 5 ng/kg bw/day, based both on the consumption of exclusively conventional or organic cereals. Around half of the intake of ochratoxin A comes from cereals. Rye bread is the main source.

15
4 Monitoring programme for foods
The subjects of the monitoring programme have changed over time. For the first two periods (1983-1992) the monitoring programme covered nutrients and chemical contaminants, while in the third period (1993-1997) new subjects were included under the monitoring concept: Pesticides, veterinary drugs, food additives and microbial contaminants. The monitoring programme for nutrients has been reduced during the fourth period, and pur-pose of the analyses of veterinary drugs is food control rather than monitoring. Thus these two subjects are not reported for the fourth period. However, dioxin, dioxin-like PCB and seleni-um are included in the present monitoring period.
While each of the first two monitoring periods (1983-1987 and 1988-1992) was reported as a whole [1, 2], the reporting of the third period was divided into sub-reports according to sub-ject [3, 4, 5, 6, 7]. The fourth period is reported in four sub-reports covering, chemical conta-minants, pesticides, food additives and microbial contaminants.
The objectives of the monitoring programme are, by means of systematic studies of foods and the dietary habits of the Danish population,
• to ascertain whether our foods are subject to any long-term changes in terms of the con-tents of desirable and undesirable substances and/or microorganisms,
• to assess the health significance of any such changes in relation to major changes in dietary habits,
• to disclose potential problems within the area and to provide background material as well as a basis for decisions to remedy any problems which might have arisen.
The material provided may also serve as a documentation of the health quality of Danish foods, and be used for updating the Danish food composition databank. Monitoring results are used also in other connections; e.g., microbiological results are reported to the Danish Zoono-sis Centre, and results concerning residues of pesticides are reported to the EU.
Work with the monitoring programme consists of the following:
• to monitor, by means of analyses, the contents of desirable and undesirable substances/ microorganisms in specific foods,
• to investigate the dietary habits of the Danish population,
• to carry out intake estimates (wherever relevant) by combining contents in foods and data on the population’s diet.

16
Subsequently, a nutritional and/or toxicological assessment can be made. Such an assessment will be particularly important whenever changes are found.
Since changes in the contents of foods and changes in our dietary habits usually develop slowly, the studies cover a considerable number of years. Every five or six years, the results are reviewed, and the analytical results for the foods are compared with the dietary habits over the period. This permits an assessment of whether the intake of desirable substances is ade-quate, and whether the intake of undesirable substances or microorganisms is acceptably low.
Content findings and intake estimates are compared with earlier results, thus permitting an assessment of the development of contents and intakes over time.
Results are evaluated continuously during the monitoring period, enabling reactions to viola-tions of existing limits or other noteworthy observations.
The monitoring programme gives information on the immediate situation concerning Danish foods, the health significance for Danish consumers, and the direction in which matters are likely to develop. In this respect, the monitoring programme can provide background material and a basis for decisions on actions in the form of national or international regulations.

17
5 Introduction
Since the beginning of the monitoring system in 1983, chemical contaminants have been in-cluded in the monitoring system for foods [8,10,13]. Trends for some of the chemical con-taminants has therefore been studied within a time period of more than two decades. In Table 1, the total number of food categories and number of analyses for each substance monitored are displayed, and further details are found in the following individual chapters and their cor-responding appendixes.
Table 1. Number of food categories, samples and number of analytes during the 4th period of the monitoring (1998-2003). Substance Number of food categories Number of samples Number of analytes Lead Cadmium Nickel Mercury Selenium Arsenic Nitrate Organochlorine pesticides Indicator PCB Dioxin and PCB Ochratoxin A
96 96 96 81 96 81 6 36 36 16 2
1313 1313 1312 1167 1313 1167 1447 3552 3552 228 649
1 1 1 1 1 1 1
19 10 37 1
The listed chemical compounds prioritised for inclusion in the monitoring system are all po-tentially health hazardous compounds found in food. In the 4th monitoring period, selenium as well as dioxin and dioxin-like PCB congeners were included in the monitoring system. In addition to the food samples, human samples were also included in the 4th monitoring period (Table 2).
Table 2. Number of human samples and number of analytes analysed during the 4th period of the monitoring (1998-2003). Human milk Number of samples Number of analytes Organochlorine pesticides Indicator PCB Dioxin and PCB
38 38 38
19 10 37
Analyses of chemical compounds in human milk can be used as an indicator for the intake of the compounds, making it possible to look at development in their levels over time.

18
5.1 Data on contents
Quality of analyses
Analyses of the compounds were carried out at the regional laboratories, which were accred-ited according to EN45000 or ISO17025 during the monitoring period. Most of the dioxin analyses were carried out by Danish Institute for Food and Veterinary Research, which is ac-credited according to ISO17025. Various procedures for quality assurance are undertaken in connection with the analyses of the various contaminants. Generally, recovery tests are car-ried out within each series of analyses, reference materials are continuously being analysed, and laboratories participate regularly in proficiency tests.
5.2 Intake calculations
The intake estimates are based on the dietary intake data collected in the Danish nationwide food consumption survey 2000-2002 [9]. The food consumption data were sampled through-out the 3 years in order to take into account any possible seasonal variation in dietary habits. The representative sample of Danes included a total of 4120 respondents (2167 female and 1953 male) aged 4-75 yr. The Danish nationwide food consumption survey used a seven-day prospective food record with a pre-coded (semi-closed) questionnaire that included answering categories for the most commonly eaten foods and dishes in the Danish diet. The question-naire was organised according to a normal daily meal pattern. For food items not found in the pre-coded categories, it was allowed for the participant to manually fill in the missing food. The food amounts eaten were given in household measures, e.g. pieces, glasses, cups, spoons, etc. Standard portion sizes were used in the conversion of the reported amounts to weight (grams). Composite foods (e.g. dishes) were split up into ingredients by means of standard recipes. Due to the simplified design of the questionnaire, the total diet could be represented by the intake of 333 food items with Food Identification numbers (FoodId). The final result of these conversions was then recalculated and expressed as the daily mean intake for the seven-day food register of each participant in the survey.
Based upon the individual’s data, it was possible to describe the intake distribution of both foods and chemical contaminations for the population divided into children (4-14 years of age) and adults (15-75 years of age). For calculations of the intake of contaminants in this report, the individual-level consumption of each of the food items was multiplied by a quali-fied estimate of the contaminant content in that particular food item. The result of this is a distribution of the contaminant intake among adults or children. The intake distribution within the population has been described using an average as well as the 90%-quantile for high in-takes. The bodyweight of the individual respondents was used in those cases where the result of the intake calculation is stated as intake per kg bodyweight.

19
In the following chapters, the results for the chemical contaminants included in the 4th moni-toring period are described in detail and they are compared with the results from previous monitoring periods. When comparing intake calculations, it should be noted that the dietary data used of the calculations in the different periods are not identical. The calculated intakes in the present report shall be seen as the best intake estimate that can be given today using the available methods.
5.3 Safety assessments
Assessments of chemical substances in foods are usually based on the concept of ADI/TDI (Acceptable/Tolerable Daily Intake for humans), which indicates the quantity which humans may ingest daily for an entire lifetime with no recognizable health risk. ADI is used for sub-stances that are approved for use in the production of foods, such as food additives and pesti-cides, while TDI is used for substances that occur as unintentional contaminants.
On the basis of existing toxicological, epidemiological, and other studies, the NOAEL (No Observed Adverse Effect Level) is established, which is the daily dose, expressed in mg/kg bodyweight that has shown no adverse effects in the most sensitive, relevant study. Usually, results from animal studies are used, since relevant and sufficiently sensitive studies in hu-mans are rarely available. When establishing the ADI/TDI, this dose is reduced by an uncer-tainty factor that allows for the extrapolation of results from animals to humans and the varia-tions in the sensitivity and habits of humans, as well as the uncertainty inherent in the evalua-tion of the study itself. It must be pointed out that the ADI/TDI is no danger line. Intakes above the ADI/TDI over shorter periods of time (weeks, months) constitute no risk, as long as the average long-term intake does not exceed the ADI/TDI.

20
6 Trace elements
6.1 Introduction
The content and dietary intake of trace elements in foodstuffs sold on the Danish market has been repeatedly investigated in the Danish Food Monitoring Programme since its initiation in 1983 [10]. In this report the fourth monitoring period comprising 1998-2003 is reported, and the results are compared with earlier monitoring periods. The 20 years of continued monitor-ing of the toxic trace elements in food, lead, cadmium, mercury, nickel and arsenic, has gen-erated results of great importance for the assessment and handling of risks associated with consumption of food sold on the Danish market. The data obtained represents a comprehen-sive benchmark of the concentration levels and distribution of the five toxic trace elements in commercially available foods. Based on this knowledge, specific cases of geographically lo-calised food contamination caused by environmental contamination of soil or ambient air can be evaluated [11]. Finally, the monitoring data obtained for Danish foods provides a scientifi-cally sound background for establishing legislation on the European as well as the national level.
The samples taken of each of the food items included in the monitoring programme were ana-lysed individually, which provided detailed information on the variation of trace elements in foods eaten by the Danes. The results were combined with food consumption data [9] in order to estimate the Danes’ dietary intake of trace elements. In each 5-year period the same food items were sampled to allow for a comparison of the trace element contents over time. The Danes’ food consumption pattern was surveyed independently but overlapping in time with the repeated monitoring cycles. This allowed an estimation of the Danes’ current dietary in-take of trace elements.
The aims of the food monitoring programme 1998-2003 were (i) to monitor the content and changes over time of trace elements in food sold on the Danish market, and (ii) to estimate the intake of trace elements with the entire diet, and also to evaluate if any associated health con-sequences were likely to occur.
6.2 Methods of sampling, analysis and quality assurance
The samples taken during 1998-2003 and the chemical analyses were organised in 8 surveys, each covering food items from the same main food category as shown in Appendix 1. The number of samples taken of each food item was first of all dimensioned on the basis of the

21
cost of the laboratory work. Secondly, the number of samples was decided on the basis of earlier experience regarding variation in trace element content, the expected rate of changes in contents over time and the expected contribution of the food item to the total trace element intake. The Public Food Inspection Services in various parts of Denmark were in charge of the nationwide sampling. The types and numbers of foodstuffs included are given in Appen-dix 1.
Chemical analyses and quality assurance The content of cadmium, lead, nickel, mercury, selenium and arsenic was analysed by the regional laboratories in Århus and in Odense (until 1999). The samples were prepared accord-ing to common household practice, but none of the foods were cooked prior to analysis. Only edible parts of the foods were used and adhered soil was removed by brushing under clean water. The methods of analysis involved isolation of the relevant tissue or part of the sample by utensils, which did not contaminate the samples. The homogenised food sample was dis-solved by microwave-assisted wet-ashing in quartz vessels (Multiwave, Anton Paar, Austria) with nitric acid. Following this process the trace element content was determined by induc-tively coupled plasma- mass spectrometry using an Agilent 7500 ICP-MS instrument (Agilent Technologies, Waldbronn, Germany). A summary of the analytical settings used is given in Table 1. The analytical work was organised and run in batches comprising 15-20 unknown samples, one blank, one double determination for each 10 unknown samples and one certified reference material. The limit of detection (LOD), precision and accuracy were estimated from these controls for each of the 8 surveys. In case of deviations from a set of criteria for toler-able variation of blanks, for values obtained for CRMs (x-charts) and for double determina-tions (R-charts), all the analyses in that batch were repeated. The LODs, which were calcu-lated according to the three-sigma criterion, were estimated from the variance of the analytical blank values. Results indicated by ”less than” in Appendix 1 were below the LOD value for the analytical survey in which the result was produced. The repeatability has been summa-rised for each trace element in Table 1. The values correspond to the within-day random error for the analysis of trace element concentrations above 10 times the LOD.

22
Table 3 Summary of the ICP-MS method of analysis and figures of merit
Method performance Unit Cadmium Lead Nickel Mercury Selenium ArsenicMean blank concentrationA ng/l in solution 0.30 6.20 7.1 3.2 1.8 1.3 Limit of detectionB µg/kg w.w. 0.05 0.92 1.1 0.48 0.27 0.2 Relative standard deviation, sr
C % 3.0 3.4 3.9 2.3 2.9 1.6 RecoveryD % 103 101 101 97 107 100 Analytical method Isotopes detected amu 114 208 60 202 82 75 Integration time per mass ms 300 300 300 300 300 300 Repetitions 3 3 3 3 3 3 Internal standard Rh Bi Ge Rh Te Te A Expressed as element concentration in solution B Expressed for 2 g (wet weight) sample intake and 100 ml final volume following the three sigma criterion C Mean value calculated from double determinations of element concentrations > 10 * LOD D Mean value for standard added to sample digest diluted to 100 ml volume Handling of low results and data analysis
Analytical results close to the limit of detection (LOD) are associated with a larger relative standard deviation than those given in Table 1, and for values below the LOD, the confidence interval exceeds 100 % of the value. For those trace elements that were present at low concen-trations, the obtained values were anyhow collated. Their mean value was the best approxima-tion to the true concentration and was therefore used for the estimation of the total dietary trace element intake, as described in the following section. In contrast, using zero or the LOD value for these low concentrations would lead to an under or overestimation, respectively, of the trace element intake.
Estimation of dietary trace element intake
The dietary trace element intake was estimated as outlined in section 5.2. Since the monitor-ing system provided data for the trace element content in 96 food items, additional data were gathered from other surveys of trace elements in food sold in Denmark. Furthermore, for food items that were not included in the analytical surveys, concentration data from similar foods were used. This was particularly the case for several dairy products and types of bread. No corrections for losses and gains during food preparation were applied, as the current knowl-edge about these processes is insufficient. The mean values for trace element contents in the foods were used, because they were assumed to reflect the consumer’s average exposure to a trace element in marketed foods. Individuals who mainly consume food originating from geo-graphically localised areas, such as home-grown products, are not included in the intake esti-mations. For the purpose of comparing the intake estimates (µg/day) with the Provisional Tol-erable Daily Intake (PTWI) as µg/body weight/week (WHO), the intake was expressed as µg/person/day by dividing with the reported body mass for each respondent.

23
6.3 Data on contents and developments over time
The 7585 results for the contents of cadmium, lead, nickel, mercury, selenium and arsenic in 96 food items sampled during 1998-2003 are summarised in Appendix 1. The ICP-MS ana-lytical method used during 1998-2003 has limits of detection, which for lead and mercury are about a factor of 10 lower in comparison with the methods based on atomic absorption spec-trometry used in the former monitoring period 1993-1997 [12]. This improved detection ca-pability has provided a better analytical accuracy for trace elements present in the low µg/kg concentration range. Since the concentration of particularly lead and mercury is very low in many food items, the calculated contributions from such foods to the total trace element in-take have become more accurate. Furthermore, a new set of results for trace elements in drinking water, which is an important source of trace element intake, has been generated in 2004 (unpublished results).
Table 4. The content (µg/L) of four trace elements in drinking water sampled in Denmark in the spring 2004. LOD signifies the limit of detection of the ICP-MS analytical method used.
Although not originally planned as a part of the monitoring system, these data have provided an improved and updated knowledge on the significance of drinking water as a contributor to the total trace element intake. In summary, the change in the method of analysis and the avail-ability of newly generated data for trace element contents in certain food groups have made a more comprehensive intake estimation of the six trace elements possible.
Cadmium
The data for cadmium presents many modestly lower mean concentration values in the fourth period as compared with the third. The cadmium concentration in potatoes and in carrots, have been followed since the beginning of the monitoring system in 1983. The results for these ”marker foods” have been shown in Figure 1 A) – B). The mean cadmium content has been reduced over the 20-year monitoring period by approximately a factor of 2-2.5 in these vegetables. The interpretation of this reduction is, however, not straightforward. The results for cadmium in slaughter animals’ kidneys, which is another marker organ, is lower in com-parison with the 3rd monitoring period. Both sets of results for these marker foods of vegeta-ble and animal origin indicate a reduced burden by cadmium.
N Mean Minimum Maximum LOD Cadmium 208 0.11 <0.01 1.91 0.01 Lead 208 0.87 0.03 9.76 0.01 Nickel 208 2.21 0.35 21.3 0.04 Mercury 208 <0.01 <0.01 <0.01 0.01

24
0
20
40
60
1984 1986 1989 1991 1995 2003
µg/k
g
A
0
10
20
30
40
1983 1984 1986 1989 1992 1993 2003
B
Figure 1. The mean concentration of cadmium in marker-foods 1984-2003, A) carrots and B) potatoes
Lead
The lead concentration in curly kale, a marker-food for atmospheric deposition of lead, has decreased by a factor of approximately eight in 2003 in comparison with the 1980s [10]. The reduction of the lead contents found in kale as well as in spinach (not shown) follows the time course of reductions in lead emissions from the combustion of leaded petrol in Denmark and other European countries. The still detectable contamination of leafy vegetables by lead is likely originates from a combination of atmospheric deposition from a variety of emission sources and from lead-contaminated dust. The direct root uptake from contaminated soil is, however, very modest [11].
0
100
200
300
400
1984 1986 1989 1991 1995 2003
µg/k
g
A
0
50
100
150
200
1984 1986 1988 1992 1995 1997 2003
B
Figure 2. The mean concentration of lead in marker-foods 1984-2003. A) curly kale and B) Ox kidneys
As with cadmium, lead is taken up by the animals’ kidneys, which may be used to monitor the exposure of the animal to lead via its fodder. A marked decline by approximately a factor of 3 in mean lead contents has occurred for ox kidney, as shown Figure 2 B), but in pig’s kidney

25
the lead concentration has not changed from the 3rd to the 4th monitoring period (data not shown).
Nickel
In general, the contents of nickel in the food items in Appendix 1 show a large variability within the 4th monitoring period as well as between periods [4]. The wide range of the results prevents the finding of any significant changes in nickel content, and the nickel content in rye bread, which was tested as a marker food for nickel [13], has not changed relative to the 3rd monitoring period. As with cadmium in drinking water, newly generated data by ICP-MS analyses (unpublished data) has provided updated knowledge on the occurrence of nickel in drinking water.
Mercury
The content of mercury in fish, contributing substantially to the dietary intake of this element, is present at a stable concentration level in comparison with the 3rd monitoring period. Using plaice and cod as marker foods, the concentration of mercury in these fish species has re-mained stable over the four monitoring periods. In geographically localised areas of the Dan-ish seas, mercury emissions from chlorine-alkali and other chemical industries have previ-ously led to highly elevated contents of this element in marine biota, particularly in fish from The Sound [14]. The sources of the emissions have been stopped, and for over a decade the mercury contents in locally caught fish have decreased [15].
Selenium
The selenium content in food has been generally stable over the years, but large differences exist between foods of animal and plant origin. This can be explained by the conventional farming practice of supplementing the animals’ fodder with selenium. In contrast, the sele-nium content of arable soil is not fortified by selenium, and consequently the content in cere-als and vegetables is low and reflects the low natural selenium content in Danish arable soil. The content of selenium in cabbage species such as curly kale, Brussels sprouts and cauli-flower, which naturally concentrates selenium (and sulphur), is the highest among the vegeta-bles.
Arsenic
Arsenic is mainly found in marine foods and occurs due to natural processes in the sea. The contents found in fish greatly vary for the same fish species. Part of the variation in the arse-nic content found in flounder, herring and cod could be explained by salinity differences be-tween the seas where the fish was caught [16]. In general, the arsenic contents were high in fish caught in waters with a high salinity (The North Sea and The Kattegat) and low in more brackish waters (The Belt Sea and The Baltic).

26
6.4 Intake calculations and safety assessment
The high degree of detail in the available consumption information (section 5.2) had to be matched by correspondingly detailed data on the trace element content in order to generate a complete estimate of the dietary intake of trace elements. Because only 96 individual food items were analysed in the 1998-2003 monitoring period, a number of assumptions regarding the trace element content of the remaining food items had to be made based on the actual data collected for similar food items. Given these limitations, the calculated dietary intake of cad-mium, lead, nickel, mercury, selenium and arsenic is given in Table 5 for Danes between 15-75 years of age.
In general, the estimated intakes of cadmium, lead, nickel and mercury for the 4th monitoring period have decreased in comparison with the previous three monitoring periods. These changes may be caused by different eating habits reflected in the 2000-2002 national dietary survey and by reduced trace element contents of the food items investigated, or both factors at the same time.

Table 5. Estimated intake for adults (15-75 years) of six trace elements from the Danish diet during four 5-year monitoring periods covering 1983-2003. The intakes are given as the mean and 95th percentile values or, for selenium, as the mean and 5th percentile values. The Provisional Tolerable Weekly Intake (PTWI) and the Nordic Nutrition Recommendations (NNR) indicate upper tolerable and target intakes, respectively. For nickel neither recommended intake nor PTWI value exists.
Monitoring Cadmium Lead Nickel Mercury Selenium Arsenic period µg/day % PTWI µg/day % PTWI µg/day µg/day % PTWI µg/day % NNR µg/day % PTWI A
1998-2003 Mean 10 14% 19 7% 109 1.9 12% C 43 87% 62 B < 2 %
95th percentile 17 24% 31 13% 197 4.1 41% C 227 B 5th percentile 23
1993-1997 Mean 16 22% 18 7% 167 3.5 7% 48 96% 95th percentile 24 33% 28 11% 278 5.8 11% 5th percentile 27
1988-1992 Mean 17 24% 27 11% 157 5.0 10% 49 98% 95th percentile 28 40% 46 18% 281 9.0 18% 5th percentile 25
1983-1987 Mean 20 29% 42 17% 199 7.0 14% 51 102% 118 < 4% 95th percentile 32 46% 76 30% 252 15 30% 5th percentile 28
A The assumption has been made that less than 5 % of the total content in seafood is inorganic arsenic [17] for which a PTWI value has been set. B The estimated intake of arsenic is based on data for vegetables, meats, poultry, fish and beverages. C The PTWI value used, which is 1,6 µg/kg b.w./week, is for methyl mercury [18]. It is assumed that the mercury contained in fish is MeHg only, and that mercury contained in
all other food items is present as inorganic mercury.

28
The dietary intake of the toxic trace elements by infants is listed in Table 6. Young children ingest more food relative to their body weight than adults, and the associated dietary intake of trace elements per kg of body weight therefore amounts to higher values.
Table 6. Estimated intake of lead, cadmium and mercury by infants of 4-6 years using con-sumption data from the Danish dietary survey 2000-2002 [9].
Cadmium
Cadmium may accumulate in the body, primarily in kidneys and liver, and has a half-life of several decades. The toxic effect occurs in the kidneys and may lead to proteinuria. The PTWI value has been established at 7 µg/kg body weight [19] equivalent to 72 µg/person/day. Cad-mium has been classified as a carcinogen when inhaled, but such an effect was neither sub-stantiated nor declined [20] for oral exposure. The mean and 95th percentile of cadmium in-takes (Table 5), which have been estimated at 10 µg/day and 16 µg/day for 1998-2003, are equivalent to 14 and 22 % of the PTWI value, respectively. The median cadmium intake of 9.6 µg/day is in good accordance with the mean value. The food groups that contribute the most to the intake are bread and cereals followed by vegetables, as shown in Figure 3. The decrease in cadmium intake in comparison with the previous monitoring period [12] mainly occurs for bread and cereals, vegetables and for beverages including drinking water.
N Cadmium Lead Mercury µg/day % PTWI µg/day % PTWI µg/day % PTWI Mean 230 7.7 36% 9.7 13% 1.3 16% 95th percentile 11,9 57% 15.4 20% 2.9 45%

29
Figure 3. Intake of cadmium from main food groups by Danes aged 15-75 years
Keeping in mind the low safety factor, if any, the margin between the intake of cadmium via food in Denmark and the PTWI value, which corresponds to the adverse effect level, is mod-est. When setting the PTWI value, an average intestinal absorption rate of 5 % was assumed. This value may vary depending on factors such as the food matrix and the chemical species of cadmium present in the food. For a more detailed risk assessment, studies on absorption rate and cadmium speciation in the foods contributing most to the intake are needed.
Lead Ingested lead is accumulated in the body, and its most adverse effect is associated with the development of the central nervous system in the foetus and newborn child. A possible asso-ciation between increased lead content in blood and reduced intelligence quotient has been substantiated, and a lower threshold value could not be set. A PTWI value has been estab-lished at 25µg/kg body weight [21], which is equivalent to 257 µg/person/day. The mean and 95th percentile intake of lead (Table 5), which have been estimated at 17 µg/day and 30 µg/day for 1998-2003, are equivalent to 7 and 11 % of the PTWI value, respectively. The median intake value, which is 16 µg/day, is in good accordance with the mean value. The food groups that contribute mostly to the lead intake are beverages followed by vegetables,
0,0 0,5 1,0 1,5 2,0 2,5 3,0 3,5 4,0 4,5 5,0
Snacks
Spices
Beverages
Sugar and condiments
Fats
Eggs
Poultry
Fish
Meats
Fruit
Vegetables
Bread and cereals
Icecream
Cheese
Milk and milk products
Intake, µg/day

30
bread and cereals, fruit and sugars, as shown in Figure 4. The high proportion of lead intake from beverages is caused by a high mass of beverages in the total diet combined with the re-ported concentrations in Appendix 11.1.1.
Figure 4. Intake of lead from main food groups by Danes aged 15-75 years
The dietary intake of lead estimated for the most recent monitoring period is unchanged in comparison with the 3rd monitoring period but much lower than those estimated for the 1st and 2nd monitoring periods (Table 5). This is consistent with the general decrease in the lead con-tent in foods during the same time period, and the possible adverse effects of lead to adults is not a matter of concern.
A 2-year-old child, however, with a body weight of 15 kg consumes on average 59 % of the adult food consumption [9]. Because the dietary survey does not include consumption data for this age group, we made the assumption that the child’s diet is composed of the same foods as that of the adult. This is, however, an approximation because of known differences between the adult’s and the child’s diet for certain lead-containing food items such as wine and offal. Therefore, a conservative estimate of the mean and 95th percentile lead intake for the 2-year old is equal to or less than 11 µg/day (20 % of the PTWI) and 17 µg/day (31 % of the PTWI), respectively. The tendency of small children to ingest soil or inhale lead-containing dust from
0 1 2 3 4 5 6 7 8 9 10
Snacks
Spices
Beverages
Sugar and condiments
Fats
Eggs
Poultry
Fish
Meats
Fruit
Vegetables
Bread and cereals
Icecream
Cheese
Milk and milk products
Intake, µg/day

31
e.g. playgrounds or house dust represents an additional source of lead exposure that should be kept to a minimum. If not strictly observed, the PTWI value may be exceeded when also tak-ing these environmental lead sources of exposure into account.
Nickel
The dietary intake of nickel does not represent any health risks to the general population. Al-though troublesome to some sensitised individuals, a tolerable oral intake of nickel has not been established. The estimated mean and 95th percentile intake of nickel at 104 µg/day and 190 µg/day, respectively, (Table 5) are lower than those estimated for the three previous monitoring periods.
0
5
10
15
20
25
30
17 30 60 90 120 150 180 210 244 270 303 340 362Intake, µg/day
Freq
uenc
y
Figure 5. Distribution in nickel intake in the Danes aged 15-75 years
The distribution in nickel intake is shown in Figure 5 and has a median value of 95 µg/day, but the upper end indicates that some individuals are exposed to this trace element at up to 350 µg/day. The food groups that contribute the most to the nickel intake are beverages fol-lowed by cereals and milk, as shown in Figure 6. Considering the additional risk of nickel exposure from metallic surfaces in direct contact with food, e.g. water kettles or nickel-containing kitchen utensils, adverse effects may occur. Even more importantly, the varying nickel content in drinking water (Table 5), due to the migration of this metal from water in-stallations, may cause an intake not reflected by the present mean intake estimate, and there-fore pose a problem to sensitised individuals. In cases of high nickel migration from drinking water installations, the intake via water may, for certain individuals, increase by 20-30 µg/day.

32
The food groups that contribute the most to the intake of nickel are beverages, followed by bread and cereals and sugars. The reason for the high nickel intake from beverages is similar to that mentioned for lead from beverages.
Figure 6. Intake of nickel from main food groups by Danes aged 15-75 years
Mercury
Ingested mercury is accumulated in the body, and the most toxic species is methyl mercury, which occurs in fish. The adverse effect of inorganic mercury first shows in the kidneys, while methyl mercury may affect the central nervous system. The PTWI value has been estab-lished at 5µg/kg body weight/week for mercury in general and at 1,6 µg/kg body weight/week specifically for methyl mercury [18]. The mean and 95th percentile dietary intakes of mercury, which have been estimated at 1.9 µg/day and 4.1 µg/day for 1998-2003 (Table 5), have been evaluated in the following way. About 60 % of the mean mercury intake (1.1 µg/day) origi-nates from fish (Figure 7). It is assumed that all mercury contained in fish is present as methyl mercury, whereas the mercury in all other foods occurs as inorganic mercury. Because fish is the main contributor to the total mercury intake and the PTWI value for methyl mercury is lower than that for mercury, the estimated intake of mercury as methyl mercury from fish will lead to the most restrictive risk assessment. As indicated in Table 5, the methyl mercury frac-tion of the total mercury intakes corresponds to 12 % of the PTWI for the mean intake and to 41 % of the PTWI for the 95th percentile intake.
0 5 10 15 20 25 30 35 40 45
Snacks
Spices
Beverages
Sugar and condiments
Fats
Eggs
Poultry
Fish
Meats
Fruit
Vegetables
Bread and cereals
Icecream
Cheese
Milk and milk products
Intake, µg/day

33
Figure 7. Intake of mercury from main food groups by Danes aged 15-75 years.
In comparison with previous monitoring periods, the mercury intake was evaluated more seri-ously during the 1998-2003 monitoring period. This is because of the newly issued and lower tolerable intake for methyl mercury, which reflects the greater toxicological concern for the mercury species.
Selenium
Selenium is an essential element to humans and is a constituent in selenoamino acids con-tained in selenoenzymes, such as the glutathione peroxidases. This group of enzymes cataly-ses the reduction of peroxides and thereby takes part in the body’s anti-oxidative defence. A severely low selenium intake may cause heart disease (Keshan’s disease). Therefore, possible adverse health effects are associated with a low intake of this element and justify the focus on the low percentile selenium intake of the population. The food groups that contribute the most to the selenium intake are meat (including offal), followed by bread and cereals and fish, as shown in Figure 8.
0.0 0.2 0.4 0.6 0.8 1.0 1.2
Snacks
Spices
Beverages
Sugar and condiments
Fats
Eggs
Poultry
Fish
Meats
Fruit
Vegetables
Bread and cereals
Icecream
Cheese
Milk and milk products
Intake, µg/day

34
Figure 8. Intake of selenium from main food groups by Danes aged 15-75 years
The estimated mean and 5th percentile intake of selenium in 1998-2003 are 42 and 22 µg/day, respectively, and the selenium intake shows only small changes with a decreasing tendency over that past 20 years (Table 5). The selenium intake is in good agreement with the recom-mended level of 40 and 50 µg/day for women and men, respectively. Few individuals have an intake below the lower intake of 20 µg/day [22]. The recommendations do, however, not take into consideration the possible cancer-preventive effect of selenium at higher doses [23].
Arsenic Arsenic, being a potentially toxic element in its inorganic chemical forms [19], occurs in sea-food as the non-toxic arsenobetaine and other minor organoarsenicals [24]. Inorganic arsenic however, may lead to the development of skin cancer. The intake of arsenic from the total diet given in Table 5 was estimated in the first monitoring period at 118 µg/day [10]. In the two following monitoring periods (2nd and 3rd), only the arsenic content in fish was followed and consequently a re-evaluation of the total dietary arsenic intake was not possible. In the 4th period, however, a wider range of foods were included in the programme (11.1.6), and the arsenic intake from these food groups was estimated at 64 µg/day (Table 5). A vast majority of the intake (91 % of the total intake) occurs from fish, as shown in Figure 9.
0 2 4 6 8 10 12 14
Snacks
Spices
Beverages
Sugar and condiments
Fats
Eggs
Poultry
Fish
Meats
Fruit
Vegetables
Bread and cereals
Icecream
Cheese
Milk and milk products
Intake, µg/day

35
Figure 9. Intake of arsenic from main food groups by Danes aged 15-75 years
Assuming that inorganic arsenic occurs in fish and other seafood products at 5 % of the total arsenic [19], the intake of the inorganic forms via seafood corresponds to 2 % of the PTWI value for inorganic arsenic, which is 15 µg/body weight/week or 154 µg/person/day [25]. A more relevant method for monitoring arsenic in seafood in relation to human health risk as-sessment should therefore particularly include the inorganic arsenic species [26].
0 10 20 30 40 50 60
Beverages
Fats
Poultry
Fish
Meats
Fruit
Vegetables
Intake, µg/day

36
7 Nitrate in vegetables
7.1 Introduction
Nitrate is present as a natural constituent in plants and may accumulate in different tissues of the plant. Vegetables are the main contributors of nitrates in the human diet, generally provid-ing approximately 80 % of the total daily intake [27]. The level of nitrate content can vary considerably according to plant species, extent of fertiliser use, humidity, temperature and amount of sunlight. For this reason, the nitrate levels of some commodities e.g. lettuce vary with geographic location and tend to be higher in samples from northern Europe than from Mediterranean countries.
The acute toxicity of nitrate is low, but in food and in the gastrointestinal tract the nitrate ion can be reduced to nitrite, which has a higher acute toxicity. However, the major health prob-lem with nitrite is its contribution to the formation of nitrosamines, which have been found to be potent carcinogens in animal experiments. Several of the nitrosamines are therefore sup-posed to be carcinogenic in humans [28].
The content of nitrate in various vegetables has been monitored during several periods from 1984 to 1988 [29,30] and from 1993 to 1996 [31]. The selection of crops in the present moni-toring program for nitrates in vegetables is based on these previous studies. There are EU regulations for the nitrate content of different vegetables such as head lettuce, iceberg and spinach. From April 2004 the nitrate content in baby food and processed cereal based food for infants and young children was also regulated by the EU. Nitrate content data for these types of vegetables and products on the Danish market will also be presented.
7.2 Sampling, analytical method and quality assurance
The sampling was carried out on a nationwide basis by authorized personnel from local food control units. Samples collected in 1998 and 1999 were analysed for nitrate at the regional laboratory in Odense, whereas samples collected during the period from 2000 to 2003 were sent to the regional laboratory in Copenhagen. Samples from the latter period were primarily taken at GASA and at the vegetable market in Copenhagen. The analyses were performed according to the method for the determination of nitrate in fruits and vegetables from the Dan-ish Veterinary and Food Administration (FIA-method, TM-1481). The limit of detection was 5 mg/kg for nitrate. The regional laboratories in Odense and Copenhagen both participate in

37
intercalibrations/performance tests through FAPAS Food Analysis Performance Assessment Scheme, Central Science Laboratory, UK.
7.3 Data on contents
Head lettuce, iceberg, spinach and potatoes were analysed for nitrate in each year of the pre-sent monitoring period from 1998 - 2003. As in the previous monitoring periods from 1984 – 1988 and 1993 – 1996, crops of both Danish and foreign vegetables were collected from open air and from greenhouses. In 2002 and 2003, samples of beetroot, rucola lettuce, celery and fennel and as well as baby food were also analysed for nitrate, whereas samples of Danish Chinese cabbage were only collected in 2003.
The results for each year are shown in Appendix 11.2.1 and 11.2.2. In total 1447 samples were analysed for nitrate content during the period from 1998 to 2003. The nitrate content varied widely according to the crop. In general the highest values were found in head lettuce and spinach and the lowest contents in potatoes. However, as shown in the appendix, there is a considerable variation in the nitrate contents within the same crop, which is illustrated by the great differences between the minimum and maximum values. In accordance with these findings, it is well known that great differences in nitrate contents may be obtained in the same crop (e.g. head lettuce) even when grown within a short distance from one another.
Lettuce and spinach
Most head lettuce in Denmark is grown in greenhouses and as shown appendix 11.2.1 and 11.2.2 only a minor part of the samples were collected in open air. Furthermore, due to collec-tion problems during the period from 2000 to 2003, it was difficult to determine whether Dan-ish samples of head lettuce were grown in open air or under glass. In the present study, these unknown samples were assumed to come from greenhouses. The same problem occur with head lettuce samples of foreign origin, and therefore these samples were not further catego-rised and thus consisted of both lettuce grown under glass and in open air. The average and median nitrate content in Danish head lettuce were similar during the whole period from 1998 to 2003. As shown in the appendix, the nitrate content in foreign head lettuce seemed to in-crease during the monitoring period. From 1998 to 2001 the mean and median values for the nitrate content were lower in foreign than in Danish head lettuce from greenhouses, whereas the contents were very similar in 2002 and 2003. In accordance with earlier Danish monitor-ing programs [30,31] the nitrate content in iceberg lettuce is considerably lower than for head lettuce, which was observed for lettuce of both Danish and foreign origin. Furthermore, very similar nitrate contents were found in Danish and foreign samples of iceberg lettuce between 1998 and 2003. Also for Danish spinach the nitrate content showed relatively small changes

38
throughout the monitoring period, whereas the content of nitrate in foreign spinach seemed to increase from 1998 to 2003. Higher nitrate contents were obtained in fresh spinach than in frozen and preserved spinach for both the Danish and the foreign samples. This is expected due to the loss of nitrate during freezing and frozen storage and during the blanching process.
Potatoes
In the present monitoring period, the content of nitrate in Danish potatoes was found to be very similar from year to year and with an average value of approximately 100 mg/kg, vary-ing between 76 mg/kg in 1999 to 120 mg/kg in 2002. As in the previous two monitoring peri-ods (1984 – 1988 and 1993- 1996) higher nitrate contents were found in foreign than in Dan-ish potatoes. Thus, the content was nearly two times higher in the foreign potatoes in 1998, 1999 and 2000, respectively. However, in 2001 no differences were observed between the nitrate contents of foreign and Danish potatoes. In 2002 and 2003, only Danish potatoes were analysed for nitrate.
Other vegetables and baby food In the present monitoring period, different other vegetables were included in the last two years of the program such as baby food, beetroot, celery, Chinese cabbage, fennel and lettuce from rucola. As shown in appendix 11.2.2, the lowest nitrate contents were found in baby food with mean values of 9 mg/kg and 34 mg/kg in 2002 and 2003, respectively. The corre-sponding maximum values for these two years were 24 mg/kg and 120 mg/kg. In 2004 the European Union introduced maximum nitrate levels of 200 mg/kg for baby food as well as and processed cereal-based foods for infants and young children. Thus, the mean as well as the maximum values obtained in the present study are far below the EU maximum limit, indi-cating that nitrate in baby food does not represent a food safety problem. Compared to the other vegetables, relatively low levels of nitrate were also found in celery. The highest nitrate contents were found in samples of rucola lettuce with mean values of 5276 mg/kg (median value 5300 mg/kg) and 5399 mg/kg (median value 5850 mg/kg) in 2002 and 2003 (appendix 11.2.2). One sample of rucola lettuce collected in 2000 had a content 6100 mg/kg. This shows, that rucola lettuce may contain high levels of nitrate in comparison to the other vege-tables mentioned in the appendix 11.2.1 and 11.2.2. There are no regulations in EU for the nitrate content in rucola lettuce. However, compared to e.g. head lettuce harvested between 1st October and 31st March, the EU maximum limit for nitrate of 4500 mg/kg will be ex-ceeded for most of the rucola samples.

39
7.4 Developments in nitrate contents of vegetables over time
In the two previous Danish monitoring periods from 1984-1988 and 1993-1996, lettuce in-cluded both iceberg and head lettuces. For this reason the data for head lettuce and iceberg from the present period were collected so as to compare the nitrate content between the differ-ent monitoring periods. The results for lettuce and beetroot are shown in Figure 10. Data for beetroot was only available from 2002 and 2003 (appendix 11.2.2). The average content of nitrate in Danish lettuce showed a small decrease from the previous monitoring period (1993 – 1996), but an increase compared to the first period (1984 – 1988). For foreign lettuce a small increase in the nitrate content was observed in the present period compared with the foregoing period from 1993 to 1996. The contents of nitrate were lower in foreign lettuce than in Danish lettuce. As shown in appendix 11.2.1 and 11.2.2, most of the Danish samples are mainly head lettuce grown in greenhouses and they generally contain higher amounts of ni-trate than the foreign samples. This may explain the differences between the observed nitrate contents in Danish and foreign lettuce. The nitrate content varies throughout the year with the highest concentration occurring in the winter, where the temperature and amount of natural light are limiting growth factors. In Denmark, normally no artificial light is used in the green-houses during the winter period, and for this reason the content of nitrate in Danish produced lettuce may be higher compared to foreign lettuce grown in areas with more natural light and higher temperatures.
In total, the average content of nitrate in all the lettuce samples is similar for the last two monitoring periods, but slightly higher compared to the first period from 1984 – 1988. As seen in Figure 10, the content of nitrate in beetroot from this monitoring period has the same level as the foregoing period (1993 – 1996), but is considerably lower compared to the first monitoring period between 1984 and 1988.

40
Figure 10. Comparison of the average content of nitrate in lettuce, beetroot and spinach dur-ing the years 1984 - 1988, 1993 – 1996 and 1998 - 2003.
Figure 11 shows that in the present monitoring period as well as in the two foregoing periods higher contents of nitrate were found in foreign than in Danish potatoes. The highest average contents were found for the 1993 – 1996 period, varying between 140 mg/kg and 260 mg/kg for Danish and foreign potatoes, respectively. The lowest contents were observed for the monitoring period between 1984 and 1988, where average values for Danish and foreign pota-toes between 80 mg/kg and 120 mg/kg. The observed differences may have several causes, such as different cultivars, places of origin with respect to e.g. climate and soil, fertilization and dry matter contents.
Figure 11. Comparison of the average nitrate contents in potatoes during the periods 1984 – 1988, 1993 – 1996 and 1998 – 2003.
0
500
1000
1500
2000
2500
3000
1984-1988 1993-1996 1998-2003
Monitoring period
Nitr
ate
cont
ent (
mg/
kg)
Lettuce, DanishLettuce, foreignLettuce, all samplesBeetrootSpinach,freshSpinach,preserved
0
50
100
150
200
250
300
1984-1988 1993-1996 1998-2003
Monitoring period
Nitr
ate
cont
ent (
mg/
kg)
Potato, DanishPotato, foreignPotato, all samples

41
7.5 Intake calculations
The average intake of nitrate from various vegetables from the present period compared to the two previous monitoring periods is shown in Figure 12. For each product, the mean value of contents from all the years in each monitoring period were used for the intake calculations. The consumption surveys do not distinguish between the consumption of Danish and foreign vegetables of lettuce and potatoes, and therefore the nitrate contents in the Danish and foreign samples were pooled for the intake calculations. In the period 1984 – 1988, consumption data was obtained from Statistics Denmark [32] and in this survey Chinese cabbage was included in the consumption of lettuce, consisting of both head lettuce and iceberg lettuce. In the die-tary survey from 1993 – 1996, data from the Danish Veterinary and Food Administration was used [31], where separate consumption data is available for Chinese cabbage, iceberg lettuce and other lettuce (Figure 10).
In the period 1998 – 2003, dietary survey data was only available for the total intake of head lettuce and iceberg lettuce, and therefore Figure 12 does not have separate columns for the intake of head and iceberg lettuce.
The nitrate intake from potatoes is similar for the first period from 1984 – 1988 and for the present period with mean intakes of 13.7 mg/day and 11.7 mg/day, respectively. As shown in Figure 12, the nitrate intake from potatoes in the present has decreased by about 50 % com-pared to the period from 1993 – 1996. There are several explanations to this. As shown in Figure 11, the nitrate content in potatoes has decreased considerably from 175 mg/kg in the period 1993 – 1996 to 120 mg/kg in the period 1998 – 2003, when referring to all the samples that consist of both Danish and foreign potatoes. In addition, the average consumption of po-tatoes has decreased in the same period from 124 g/day [31] to about 100 g/day [9]. These conditions may explain the observed differences in nitrate intake.
In the two foregoing monitoring periods, potatoes were the major individual contributor to the nitrate intake from vegetables followed by lettuce. However, in the present period the nitrate intake from lettuce has increased considerably compared to the periods from 1984– 1988 and from 1993 – 1996 (Figure 12). Furthermore, the nitrate intake from lettuce was considerably higher than for potatoes in the present monitoring period, where the mean intakes were ap-proximately 19 mg/day and 12 mg/day for lettuce and potatoes, respectively. The content of nitrate for all the lettuce samples (Figure 10) was approximately 2000 mg/kg in all three of the monitoring periods, but the intake of lettuce has increased during the present period. Thus, in the monitoring periods 1984 – 1988 and 1993 – 1996, the intake of both iceberg lettuce and head lettuce was similar corresponding to approximately 4 g/day [32]. In the last monitoring period from 1998 – 2003, the intake of lettuce increased to about 9 g/day, which shows that the consumption of lettuce is nearly doubled compared to the earlier periods. These differ-

42
ences can thus explain that lettuce is now a more important contributor to the intake of nitrate than potatoes.
Figure 12. Comparison of the nitrate intake from vegetables included in the monitoring pro-grammes from 1984 – 1988, 1993 – 1996 and 1998 – 2003. The nitrate intake from beetroot has decreased during the whole period from 3.9 mg/day in 1984 – 1988 to 0.8 mg/day in the period 1998 – 2003. Although the nitrate content in beetroot was higher in the first period compared to the present period (Figure 10), the average differ-ences in nitrate intake between the two periods are mainly due to a lower consumption. Thus, the consumption of beetroot has decreased from 2 g/day in 1984 – 1988 [33,34] to 0.5 g/day in 1998 – 2003 [9].
The intake of nitrate from the vegetables included in the Danish Food Monitoring programme is now approximately 36 mg/day, which is very similar to the value obtained in last monitor-ing period from 1993 – 1996 corresponding to 37 mg/day. In the first monitoring period from 1984 – 1988 the intake of nitrate from vegetables was estimated to be approximately 30 mg/day. In addition to the vegetables monitored in the present programs, other vegetables, fruits, bread and dairy products will also contribute to nitrate intake. The same is true of drinking water, which is another important contributor to nitrate intake. By assuming that the intake of nitrate from these sources is in the same range as suggested for the last monitoring period from 1993 –1996, this will give a total nitrate intake of approximately 60 mg/day.
7.6 Safety assessment
The acceptable daily intake (ADI) for nitrate is 5 mg per kg body weight (EU Scientific Committee for Food, 1995). The value is expressed as sodium nitrate, which after conversion
0
5
10
15
20
25
1984-1988 1993-1996 1998-2003
Monitoring period
Inta
ke (m
g/da
y)
PotatoLettuceIceberg lettuceChinese cabbageBeetrootSpinach
43
gives a value of 3.7 mg nitrate per kg body weight. This corresponds to a daily intake of 257 mg nitrate for a person weighing 70 kg, which is fairly high compared to the actual estimated intake of approximately 60 mg/day. The mean content of nitrate found in samples of baby food collected during 2002 and 2003 is low compared to the EU maximum limit of 200 mg/kg, indicating that nitrate in baby food does not represent a food safety problem.

44
8 Organic environmental contaminants
8.1 Introduction
Organic environmental contaminants refer to a large number of compounds found as con-taminants in the environment as a consequence of industrial pollution. A number of sub-stances have been found to be persistent in the environment and are found as contaminants in our foods today. Analyses for organochlorine compounds are carried out because of their po-tentially hazardous health effects on humans. Attention has been directed towards persistent organochlorine contaminants such as PCB (polychlorinated biphenyls), dioxins and com-pounds that have earlier been widely used as pesticides (for example DDT).
PCB is a group of 209 compounds that, due to their physical and chemical properties, were utilized for industrial purposes since the 1930s. PCB has been widely used as an isolating material in capacitors and transformers. Furthermore, because of its chemical stability and fire-retarding properties, PCB has been used in hydraulic systems and as an additive to paints, printing inks, coolants, and cutting oils, and PCB has been used as a plasticizer in plastics.
Dioxins is a short expression for a group of 210 compounds including polychlorinated dibenzo-p-dioxins (PCDD) and polychlorinated dibenzofuranes (PCDF). Dioxins are formed during industrial and household combustion processes and as by products by certain industrial productions eg metal manufacturing and metal reclamation. A subgroup of PCB congeners has the same toxicological effects as dioxins and they are referred to as dioxin-like PCB.
The studies comprise a number of organochlorine pesticides, which were earlier used mostly as insect-controlling pesticides and are today found as environmental contaminants.
Sources of intake for organochlorine compounds
Contents of organochlorine compounds may derive from the pollution of the environment where the compounds, being fat-soluble and because of their apolar properties, accumulate up through the food chain. In meat, eggs, dairy products and farmed fish, contents of the or-ganochlorine compounds may also derive from residual contents in feedstuffs or, in the case of organochlorine pesticides, from applications in the environment around the animals. The occurrence of persistent organochlorine compounds in the environment is changing relatively slowly over a span of years; similar time trends are characteristic of their contents in fish, meat, eggs, and dairy products, which are the foods making the greatest contributions to the intake of organochlorine compounds.

45
Compounds analysed
In the monitoring system two analytical chemical methods are used for analysing the organic environmental contaminants, one includes the organochlorine pesticides and indicator PCB and the other dioxin and PCB. Both methods analyse for the presence of PCB in the samples, but the dioxin and PCB method includes more PCB congeners and attains lower limits of de-tection than the method for the analysis of organochlorine pesticides and indicator PCB. Therefore and because of a very large difference in the number of samples obtained using the two different analytical methods, results are treated separately in the present report.
The method analysing for organochlorine pesticides and indicator PCB comprises a number of organochlorine pesticides: p,p'-DDT with its metabolites p,p'-DDE, p,p'-DDD and o,p’-DDT, aldrin, isodrin, endrin, dieldrin, HCB (hexachlorobenzene), α- and β-HCH (hexa-chlorocyclohexane), lindane (γ-HCH), heptachlor and heptachlor epoxide, which is a metabo-lite of heptachlor, α-chlordan, γ-chlordan, oxychlordan, trans-nonachlor, α-endosulfan. Very few samples contained the compounds aldrin, isodrin, endrin, heptachlor and γ-chlordan. Hence the results of these substances are not included in the present report. The values for p,p'-DDT, p,p'-DDE, p,p'-DDD and o,p’-DDT are reported here as the sum of the four, re-ferred to as ΣDDT, which mainly consist of the metabolite p,p’-DDE as DDT is no longer in use.
Ten indicator PCB congeners are included in the analytical method also covering the or-ganochlorine pesticides. Each PCB congener is named by a number and the determination involves a specific determination of 10 individual indicator PCB congeners: PCB28, PCB52, PCB101, PCB105, PCB118, PCB138, PCB153, PCB156, PCB170, and PCB180. Indicator PCB-sum is calculated as the sum of the 10 congeners.
The method analysing for dioxins and PCB incorporates 17 dioxins, 12 dioxin-like PCB and 7 non dioxin-like PCB. The dioxins determined are the 2,3,7,8 chlorine substituted congeners (PCDDs and PCDFs), which have been assigned dioxin toxicity equivalency factors (TEF). The dioxin-like PCB has been assigned TEF-values as well, and the congerners are: PCB 77, PCB 81, PCB 126, PCB 169, PCB 105, PCB 114, PCB 118, PCB 123, PCB 156, PCB 157, PCB 167 and PCB 189. The TEF-values are used to weigth the concentrations of the individ-ual congeners before summing to produce the total toxic equivalency for dioxin (TEQ). The non dioxin-like PCB included are: PCB 28, PCB 52, PCB 101, PCB 138, PCB 153, PCB 170 and PCB 180.
Regulation of organochlorine pesticides, PCB and dioxins
From 1st December 1994, the import and sale of lindane were prohibited, and from 1st July 1995 all use was prohibited [35]. In 1988 dieldrin was discontinued, whereas aldrin was with-drawn already in 1963. The use of DDT was prohibited in 1984, and heptachlor has not been

46
used since 1972 [36]. HCB and α- and β-HCH have never been permitted for use in Denmark. However, since the time of the Second World War organochlorine pesticides have been used worldwide and are still being used in some developing countries. A substance such as DDT has been widely used, e.g. for controlling malaria-carrying mosquitoes as well as the control of insect pests in Denmark. Previously the stability of the substance was considered an advan-tage in relation to its insect-controlling purposes; and it was not realized until later that DDT and other organochlorine pesticides degrade slowly in animals and humans. Being also highly fat-soluble, the substances concentrate in fatty tissues from which they are not readily elimi-nated.
Table 7 shows the maximum residue limits (MRLs) for organochlorine pesticides in fat from meat, dairy products, and eggs [37].
Table 7. Maximum residue limits for organochlorine pesticides (General view, details in ref-erence [37])
Substance Maximum residue limit (mg/kg*)
Fat from meat Milk, cheese, etc. Eggs
Aldrin 0.2 0.006 0.02 Chlordan 0.05 0.002 0.005 ΣDDT 1.0 0.04 0.05 Dieldrin 0.2 0.006 0.02 Endosulfan 0.1 0.004 0.1 Endrin 0.05 0.0008 0.005 Heptachlor 0.2 0.004 0.02 HCB 0.2 0.01 0.02 α-HCH 0.2 0.004 0.02 β-HCH 0.1 0.003 0.01 Lindane 0.02 (0,7**) 0.001 0.1 * mg/kg fat for meat and dairy products, and mg/kg fresh weight for eggs.
**Poultry.
In fish and fish products, a national maximum residue limit of 2 mg/kg for ΣDDT has been established, while fish liver has a MRL of 5 mg/kg for ΣDDT [38]. No corresponding maxi-mum residue limits exist for the other substances.
Since the 1980s, the introduction of regulations in Denmark has led to significant restrictions on the use of PCB. Thus, in 1986 the import and sale of PCB and PCB-containing products were prohibited [39]. Until January 1995, use of larger, existing transformers and capacitors containing PCB was permitted, while smaller transformers and capacitors containing PCB may be used for as long as they last [39]. Even though the use of PCB has been regulated over a number of years in most western countries, the substances will, due to their stability, remain in the environment for many years to come.

47
For dioxins maximum levels for a range of foodstuffs of animal origin has been established by EU and enforced by July 1, 2002 [40]. Action levels for dioxins have been introduced as well [41]. Foodstuffs with contents of dioxins above the action levels but below the maximum levels are allowed to be marketed, but the EU member state is committed to try to find the cause for the increased levels of dioxins. Maximum levels and action levels are listed in Table 8.
Table 8. Maximum levels and actions levels for dioxins in foodstuffs
Products pg WHO-PCDD/F-TEQ/g fat or product*
Maximum level Action level
Meat and meat products from ruminants 3 2 Meat and meat products from poultry 2 1.5 Meat and meat products from pigs 1 0.6 Liver and derived products 6 4 Muscle meat of fish and fishery products 4* 3* Milk and milk products 3 2 Hen eggs and eggs products 3 2 Vegetable oil 0.75 0.5 Fish oil for human consumption 2 1.5 Fruit, vegetable and cereals - 0.4
Assessment of contents in fish oil in relation to recommended values for acceptable con-tents
In the previous monitoring report (1993-1997), a list of recommended values for acceptable contents of indicator PCB and organochlorine pesticides in fish oil [42] was described. The values are listed in Table 9. These values may serve as an indication of the quantities that are tolerable in other foods. Fish oil has been included in the monitoring period by a survey of fish oil food supplements.
Table 9. Recommended values for acceptable contents of PCB and organochlorine pesticides in fish oil [42].
Substance mg/kg fish oil
ΣDDT 0.4 Dieldrin 0.1 Heptachlor epoxide 0.02 HCB 0.05 α-HCH 0.02 β-HCH 0.02 Lindane 0.02 PCB-153 0.1 Indicator ΣPCB 0.4

48
It should be noted that the recommended value for ΣDDT in fish oil is somewhat lower than the maximum residue limits of fish products and fish liver.
8.2 Sampling, analytical methods, and quality assurance
Lean fish such as cod, plaice, and flounder have appreciably lower contents of organochlorine pesticides and indicator PCB than fat fish such as herring or salmon. The monitoring study was planned with the intent of closely following all food items with either a high content of residues or high consumption. Cod liver and herring were used for monitoring the pollution levels of the different Danish waters from the Baltic Sea in the East to the North Sea in the West. Furthermore, the following fish were investigated: Farmed trout from fish farming and sea farming and farmed eel as well as fish from retail trade; herring (raw, smoked, pickled), mackerel (raw, smoked, in tomato sauce), salmon, (raw), Greenland halibut (raw), garfish (raw), plaice (raw), cod (raw), swordfish (raw) and lumpsucker (raw).
For the analyses of meat, eggs, milk and farmed fish, sampling was performed according to EU directive 96/23/EC on measures for monitoring certain substances in live animals and animal products. In addition, surveys of imported dairy products, including imported milk, butter and cheese, were made. Samples of meat and farmed fish were taken at the slaughter-houses; eggs were taken at the egg packing stations, and milk was taken either at the dairy works or directly from the livestock.
The monitored substances are fat-soluble, and hence they will be found in the lipid phase i.e. the fat. Therefore, dairy products having relatively high fatty contents, such as butter, milk fat and cheese were sampled.
Kidney fat from cattle and pigs and subcutaneous fat from poultry were also was analysed. Studies [43,44,45,46] have shown that the contents of organochlorine pesticides and indicator PCB in such fatty tissues are representative of the contents in the market meat when measured on the basis of fat. Fillets of fish were analysed after removing the skin, as it is presumed that only few people eat the fish skin and that the migration of the substances from the skin to the rest of the fish during preparation is minimal.
In Appendix 11.3.1 the number of various food samples within the monitoring period is pre-sented.
The chemical analyses of organochlorine pesticides and indicator PCB were carried out at the regional laboratory in Århus or until 1999 at the regional laboratory in Aalborg in accordance with the quality assurance manual. The analytical procedure includes extraction using an or-ganic solvent, after which the organochlorine contaminants are isolated from the fatty phase and detected by gas chromatography with EC detection. For further information on the ana-

49
lytical methods, see reference [47]. The results are calculated as mg/kg fish/cod liver/eggs (fresh weight), or as mg/kg fat for pigs, cattle, poultry, and dairy products.
The sampling plans for the analyses of dioxin and related PCB are presented in Appendix 11.3.2 and 11.3.3. The tables show the number of samples of the various foods and human milk. The majority of the analyses of dioxins and related PCB were performed at the Danish Institute for Food and Veterinary Research. Samples from 2003 of fat from poultry, beef, pork and sheep were carried out at the regional laboratory in Ringsted.
The analyses were carried out in accordance to the requirements for sampling and analytical method described in EU directive 2002/69/EC [48]. Both the laboratories participate in inter-national ring tests.
For the analyses of meat, eggs, milk and farmed fish sampling was made according to EU directive 96/23/EC setting measures to monitoring certain substances in live animals and ani-mal products. Samples of meat and farmed fish were taken at slaughterhouses; eggs were taken at the egg packing stations and milk was taken either at dairy works or directly at live-stocks. In addition surveys were made of dairy products and fish oil supplements collected at retail stores and wild fish collected by the Danish Directorate of Fisheries.
Limit of detection
Contents of persistent organochlorine pesticides and indicator PCB in foods have decreased, since these substances are no longer in use. In order to follow the lower contents and to better estimate the dietary intake of the population, all findings above the limit of detection have been reported since 1995. This limit varies for the different substances and may also vary from year to year. Appendix 11.3.31 presents tables with the limit of detections used.
8.3 Data on contents
8.3.1 Organochlorine pesticides and indicator PCB The average contents of the substances analysed in various foods are presented in Appendix 11.3.4 to 11.3.24. The tables show the total number of samples for each of the foodstuffs un-der study, the number of samples with contents above the detection limits; the average con-tents of the individual organochlorine compounds; Median, 90%-quantile (given only in some cases; see below); and the maximum value. The indicator PCB-sum has been calculated as the sum of the averages in Appendix 11.3.24 for 10 indicator congeners.

50
Calculation of average contents
Calculations of the average contents of the various organochlorine environmental contami-nants in foods are briefly described below.
For the environmental contaminants PCB and organochlorine pesticides, it may be assumed that they are present in varying quantities everywhere in the environment. When calculating the average contents of the various substances, values below limit of detection e.g. the content may be zero or it may be just below the limit of detection. To compensate for this fact in cal-culations of average contents in the present monitoring period, values below the limit of de-tection are set to one-third of the limit of detection. One-third of the limit of detection was chosen on the basis of what had been used in the previous monitoring period for figures below the limit of detection when only a few data are above the limit of detection. This approach will probably lead to an overestimation of the contents in those cases where no contents were found in any samples and an underestimation in those cases where the contents were found in almost all the samples.
For the monitoring period 1983-1987, values below the reporting limit were set to zero if the average was above the limit, which leads to an underestimation of the contents. For calculated averages below the reporting limit, the contents were set to the limit, which leads to an over-estimation of the contents. For the monitoring period 1988-1992, values below the reporting limit were set to one-half of the reporting limit. For the monitoring period 1993-1997, a statis-tic programme was used to calculate the intake, using a logarithmic normal distribution or one-third of the limit of detection to calculate the average content. Finally for the monitoring period 1998-2003, all values below the limit of detection were set to one-third of the limit of detection.
Different estimation methods for the contents in foods, different detection limits or reporting limits from year to year as well as differences in the dietary data make a comparison of the estimated intake between the different monitoring periods difficult. However calculations from the third and fourth monitoring period are expected to be comparable, bearing in mind the differences described above.
Contents in fish
The contents of organochlorine pesticides and indicator PCB in fish depend among other things on the fish species as well as on the water where the fish was caught. The contents of these substances vary according to the fish species due to the fact that the fatty content of dif-ferent fish species varies. Differences in the organochlorine levels between the bodies of wa-ter may be explained by differences in the environmental pollution of the waters with or-ganochlorine pesticides and indicator PCB. The present monitoring period does not include additional information on factors concerning the fish, such as their food basis, age and sex. It is, however, likely that a relationship exists between these parameters and the variation in the

51
contents of organochlorine pesticides and indicator PCB in the fish. Partly for that reason, even when the samples are grouped according to fish species and waters, there are great varia-tions within the same species and the same body of water.
In Figure 13 and Figure 14, the average contents of organochlorine compounds in herring and cod liver are displayed. In the figures, the bars illustrate the fish samples according to their Danish fishing grounds; 1) the Baltic Sea, the Belts, the Sound; and 2) the North Sea, the Skagerrak, the Kattegat 3) all waters.
Figure 13. Average contents of organochlorine pesticides and indicator PCB in herring.
Figure 14. Average contents of organochlorine pesticides and indicator PCB in cod liver.
0
0.1
0.2
0.3
0.4
0.5
0.6
PCB
sum
PCB2
8
PCB5
2
PCB1
01
PCB1
05
PCB1
18
PCB1
38
PCB1
53
PCB1
56
PCB1
70
PCB1
80
DD
T su
m
HC
B
Lind
ane
a-H
CH
b-H
CH
Die
ldrin
Hep
tach
lor s
um
Chl
orda
n su
m
Ave
rage
s, m
g/kg
Baltic Sea, Belts, Sound
North Sea, Skagerrak, Kattegat
all waters
0
0.01
0.02
0.03
PCB
sum
PCB2
8
PCB5
2
PCB1
01
PCB1
05
PCB1
18
PCB1
38
PCB1
53
PCB1
56
PCB1
70
PCB1
80
DDT
sum
HCB
Linda
ne
a-HC
H
b-HC
H
Dield
rin
Hepta
chlor
sum
Chlor
dan s
um
Aver
ages
, mg/k
g
Baltic Sea, Belts, Sound
North Sea, Skagerrak, Kattegat
all waters

52
It appears in Figure 13 and Figure 14 that the organochlorine contents in fish from the Baltic Sea typically are higher than the content in fish from the North Sea. Thus, the measured con-tents reflect a higher pollution level in the inner Danish waters. The highest contributions found in fish are from ΣDDT, PCB-153 and PCB-138.
As the organochlorine compounds accumulate in the fat tissue of fish, cod liver with a fat content of 30-80 per cent, has a higher content of organochlorine pesticides than herring with a fat content of 1-15 per cent [49,50], depending on, e.g., the time of the year.
Contents in products of animal origin
In animal fat, ΣDDT is detected at low levels in the majority of animal fat samples, and HCB is also detected at low levels in the majority of samples, except for poultry and pork samples where HCB is only detected in a few samples. Indicator PCB is not commonly detected in animal fat samples, however the average summarised indicator PCB contents are at the same level as the content of HCB.
The majority of dairy products contain ΣDDT and HCB at low average levels except for Dan-ish butter, where the compounds are only found in a few samples. Lindane occurs mostly in foreign cheese. Dieldrin is found in foreign produced dairy products more often than in Dan-ish produced dairy products, however, the average levels are the same.
Contents in fruits and vegetables
The monitoring programme does not comprise analyses for indicator PCB in cereals, fruits and vegetables, however organochlorine pesticides in fruits and vegetables are reported in the sub-report on pesticides [51].
8.3.2 Dioxins and PCB The measured contents of dioxins and PCB in food items analysed are presented in Appendix 11.3.25 to 11.3.28. For each foodstuff the tables show the total number of samples, the mini-mum value, mean, median, 90%-fractile and the maximum value. The contents of dioxins and dioxin-like PCB as well as the sum of the dioxins and dioxin-like PCB are listed as toxic equivalency for dioxin (TEQ). TEQ is calculated by multiplying the concentration of each congener with an assigned dioxin toxicity equivalency factor (TEF). The weighted concentra-tions are summed to produce TEQ for dioxins, TEQ for dioxin-like PCB and Total TEQ that is the sum of TEQ for dioxins and dioxin-like PCB. The TEF values are shown in Table 10.

53
Table 10. Dioxin toxicity equivalency factors (TEF) as defined by WHO [52]
Congener TEF-value Congener TEF-value
PCDD Non-ortho PCB 2,3,7,8-TCDD 1 PCB 77 0,0001 1,2,3,7,8-PeCDD 1 PCB 81 0,0001 1,2,3,4,7,8-HxCDD 0,1 PCB 126 0,1 1,2,3,6,7,8-HxCDD 0,1 PCB 169 0,01 1,2,3,7,8,9-HxCDD 0,1 1,2,3,4,6,7,8-HpCDD 0,01 OCDD 0,0001 PCDF Mono-ortho PCB 2,3,7,8-TCDF 0,1 PCB 105 0,0001 1,2,3,7,8-PeCDF 0,05 PCB 114 0,0005 2,3,4,7,8-PeCDF 0,5 PCB 118 0,0001 1,2,3,4,7,8-HxCDF 0,1 PCB 123 0,0001 1,2,3,6,7,8-HxCDF 0,1 PCB 156 0,0005 1,2,3,7,8,9-HxCDF 0,1 PCB 157 0,0005 2,3,4,6,7,8-HxCDF 0,1 PCB 167 0,00001 1,2,3,4,6,7,8-HpCDF 0,01 PCB 189 0,0001 1,2,3,4,7,8,9-HpCDF 0,01 OCDF 0,0001
In Figure 15 and Figure 16 the results of the dioxin TEQ are displayed together with the EU maximum levels for dioxins. It can be seen that for foodstuffs of animal origin the measured values of dioxins are generally well below the maximum levels. The same is true for the ac-tion levels, which are approximately 25% lower than the maximum level.
Three out of four samples of herring caught east of Bornholm exceeded the dioxin maximum level, and one eel sample out of five caught in the Sound exceeded the action level. These results reflects the fact that the Baltic Sea has higher levels of organic environmental con-taminants than the other seas surrounding Denmark, and that fatty fish has a tendency to ac-cumulate organic contaminants due to the lipophillic behaviour of the compounds.

54
Figure 15. Contents of dioxins in foodstuffs of animal origin. The average values are shown in addition to the maximum and the minimum. EU maximum levels are indicated for each foodstuff.
Figure 16. Contents of dioxins in fish and fish oil supplement. The average values are shown in addition to the maximum and the minimum. EU maximum levels are indicated for fish and fish oil respectively.
0
0,5
1
1,5
2
2,5
3
3,5
Pork fa
t
Chicke
n fat
Turkey
fat
Beef fa
t
Sheep
fat
Hens e
ggs
Cows m
ilk
Dairy p
roduc
ts
pg W
HO
-TE
Q/g
fat
Maximum levelsAverage
Dioxins
0123456789
Farmed
trout
Herring
- Nort
h Sea
and B
elts
Herring
- Balt
ic Sea
, W. o
f Born
holm
Herring
- Balt
ic Sea
, E. o
f Born
holm
Eel - T
he Sou
nd
Eel - T
he K
atteg
at w. o
f Hirs
holm
en
Blue m
usse
ls
Fish oi
l sup
plemen
t
pg W
HO
-TE
Q/g
fres
h w
eigh
t
Maximum levelsAverage
Dioxins

55
Two out of five samples of fish oil supplements exceeded the maximum level but these sam-ples were analysed before the maximum level for fish oil for human consumption was estab-lished. The supplements were based on cod liver oil, which has a tendency for high levels of dioxins and PCB if not properly cleaned.
In Figure 17 and Figure 18 the results of the sum of TEQ for dioxins and dioxin-like PCB are displayed. The proposed EU maximum levels for the sum of TEQ for dioxins and dioxin-like PCB are indicated on the graphs. For the analysed foodstuffs the same trend is seen as for the dioxin-TEQ alone: The foodstuffs of animal origins are generally well below the proposed maximum levels and Baltic Herring from east of Bornholm and eel from the Sound has a high risk for exceeding the maximum level. In fact the situation for the eel is worse because the content of PCB is relatively higher.
Figure 17. Contents of the sum of dioxins and dioxin-like PCB in foodstuffs of animal origin. The average values are shown in addition to the maximum and the minimum. Proposed EU maximum levels are indicated for each foodstuff.
0
1
2
3
4
5
6
7
Pork fa
t
Chicke
n fat
Turkey
fat
Beef fa
t
Sheep
fat
Hens e
ggs
Cows m
ilk
Dairy p
roduc
ts
pg W
HO
-TE
Q/g
fat
Maximum levels
Average
Dioxins+PCB

56
Figure 18. Contents of the sum of dioxins and dioxin-like PCB in fish and fish oil supplement. The average values are shown in addition to the maximum and the minimum. Proposed EU maximum levels are indicated for fish and fish oil respectively.
8.4 Development in contents over time
This section is focussing on organochlorine pesticides and indicator PCB due to the fact that dioxins and dioxin-like PCB were only included in the present monitoring period. Any sig-nificant changes in levels are expected to occur over a longer time of years than has been cov-ered so far.
Fish
Contents of organochlorine environmental contaminants in fish have significantly decreased during the 1970s and the beginning of the 1980s [53]. However developments in recent years do not show a clear trend, but rather a more or less steady state condition. This section dis-cusses the development in organochlorine contaminants during the three latest monitoring periods (1988-2003).
The contents of contaminants in fish depend on a number of significant factors, which were not taken into consideration in the present monitoring period, e.g. the food basis of the fish, their age, weight and sex, and the time of year. In particular, a decline in concentration over time may be seen if the fish caught today are younger, and thus, other things being equal,
02468
101214161820
Farmed
trout
Herring
- Nort
h Sea
and B
elts
Herring
- Balt
ic Sea
, W. o
f Born
holm
Herring
- Balt
ic Sea
, E. o
f Born
holm
Eel - T
he S
ound
Eel - T
he K
atteg
at w. o
f Hirs
holm
en
Blue m
usse
ls
Fish oi
l sup
plemen
t
pg W
HO
-TE
Q/g
fres
h w
eigh
tMaximum levelsAverage
Dioxins+PCB 38

57
have not had the same time to accumulate the contaminants. Such an effect will hardly be distinguishable from the effect of lower concentrations in the marine environment over time.
Cod liver was selected to model the development over time, since almost all the cod liver re-sults are above the limit of detection. Statistic analyses of data from cod liver showed that the distribution of concentrations is best described by a logarithmic normal distribution, and that the development over time can be described by a linear regression based on logarithmized data [54]. As the cod liver and herring data sets contain observations below the limit of detec-tion, a special programme was used to estimate regression lines for the organochlorine com-pounds [55]. The programme describes results by means of a logarithmic normal distribution estimating values below the limit of detection on the basis of values above the limit of detec-tion. By means of an analysis of variance, the programme did at the same time assess whether the regression lines for different waters could be pooled. This programme has been used on the results of cod liver and herring. Waters that have been pooled because their regression lines do not differ significantly, and because the waters are at the same time physically joined, are indicated by the same symbol in Figure 19 to Figure 25.
Figure 19 shows the development over time for total PCB in cod liver. Total PCB is a meas-ure of the entire PCB content based on a previously used analytical method. The content of PCB is today estimated by summarising the content of the individual PCB compounds ana-lysed. Total PCB content for the period 1994 to 2003 is estimated using the correlation be-tween Total PCB and indicator PCB-sum described in the monitoring programme 1993-1997. A significant decline in the PCB concentration is seen from the beginning of the first monitor-ing period in 1988, but since the mid of the 1990s the decline has almost been absent. The indicator PCB concentration in cod liver from the Baltic Sea, the Belts, and the Sound is typi-cally highest, while the concentration in cod liver from the Skagerrak typically is lowest.

58
Figure 19. Total PCB in cod liver from Danish waters, 1988 - 2003. Each point represents one sample, and the lines show the regressions based on logarithmized data. Data for the period 1998 to 2003 is estimated from the indicator PCB-sum.
In Figure 20 the corresponding development over time for indicator PCB-sum in cod liver is seen. Indicator PCB congeners have been analysed since 1994 and the figure show no signifi-cant decline in the indicator PCB levels in cod liver from the Danish waters.
Figure 20. Indicator ΣPCB in cod liver from Danish waters, 1994 - 2003. Each point repre-sents one measurement, and the lines show the linear regressions based on logarithmized data.
0
1
2
3
4
5
6
1988 1989 1990 1991 1992 1993 1994 1995 1996 1997 1998 1999 2000 2001 2002 2003
Tota
l PC
B m
g/kg
North Sea
Baltic Sea, Belts and Sound
Kattegat
Skagerrak
0.0
0.2
0.4
0.6
0.8
1.0
1.2
1.4
1.6
1994 1995 1996 1997 1998 1999 2000 2001 2002 2003
Sum
-PC
B (m
g/kg
)
Baltic Sea, Belts and Sound
Kattegat
Skagerrak and North Sea

59
In Figure 21 the development over time for ΣDDT in cod liver is seen. Also here a significant decline is seen in the concentration of DDT from 1988 to the mid of the 1990s and then al-most steady-state conditions. The highest concentrations are found in cod liver from the Baltic Sea and the lowest in cod liver from the Skagerrak.
Figure 21. DDT in cod liver from Danish waters, 1988 - 2003. Each point represents one measuring, and the lines show the linear regressions based on logarithmized data. One Baltic Sea sample from 1989 had a content of 7.77 mg/kg and is not displayed in the graph.
Figure 22 and Figure 23 show the development over time for HCB and dieldrin, respectively. The development for these substances is as for DDT, a decline for, especially the Baltic Sea, until the mid of the 1990s and then an almost steady state. Only in cod liver from the Baltic Sea, a significant decline is observed.
0
0.5
1
1.5
2
2.5
3
3.5
1988 1989 1990 1991 1992 1993 1994 1995 1996 1997 1998 1999 2000 2001 2002 2003
DD
T su
m (m
g/kg
)
Baltic Sea
Belts and Sound
Kattegat
North Sea
Skagerrak

60
Figure 22. HCB in cod liver from Danish waters, 1988 - 2003. Each point represents one sample, and the lines show the linear regressions based on logarithmized data.
Figure 23. Dieldrin in cod liver from Danish waters, 1988 - 2003. Each point represents one sample, and the lines show the regression lines from a linear regression based on logarith-mized data. For herring several samples that contain ΣDDT above the limit of detection, Figure 24 shows that the ΣDDT content from the Baltic Sea is typically higher than the content in herring from other waters. The contents of ΣDDT in other waters than the Baltic Sea are typically below the limit of detection in the previous monitoring periods, but above the limit of detection in
0
0.02
0.04
0.06
0.08
0.1
0.12
0.14
1988 1989 1990 1991 1992 1993 1994 1995 1996 1997 1998 1999 2000 2001 2002 2003
HC
B (m
g/kg
)Baltic Sea
Sound
North Sea, Skagerrak, Kattegat and Belts
0
0.02
0.04
0.06
0.08
0.1
0.12
0.14
0.16
1988 1989 1990 1991 1992 1993 1994 1995 1996 1997 1998 1999 2000 2001 2002 2003
Die
ldrin
(mg/
kg)
Baltic Sea
North Sea and Skagerrak
Kattegat, Belts and Sound

61
the present monitoring period from 1998 to 2003, due to lower limit of detection. Hence, the regression line, based on the logarithmized data for other waters than the Baltic Sea, shows a slight increase in the level of ΣDDT since 1988. However, the content of ΣDDT in herring is not expected to have increased during the period since 1988, but rather to be due to technical differences.
Figure 24. DDT in herring from Danish waters, 1988 - 2003. Each point represents one sam-ple, and the lines show the regression lines from a linear regression based on logarithmized data.
Since 1988, fish samples shows overall tendency towards a decline in concentrations over time, but with an almost steady state since 1995.
In general, when solely considering the 4th monitoring period (1998-2003), no clear develop-ment for organochlorine pesticides and indicator PCB in fish is seen. Accordingly, the year of catch has been disregarded in the calculation of contents in the appendixes 11.3.4 to 11.3.24.
Products of animal origin
In products of animal origin only few compounds are found above the limit of detection. Hence it is difficult to observe any development in concentrations. However a few com-pounds were found in a significant number of samples, and means was estimated using one third of the limit of detection for the samples with concentrations below the limit of detection. This approach is however problematic for the indicator PCB-sum, as it is the sum of ten com-pounds and therefore influenced by ten limits of detections and their variation between the different years. Especially the limits of detection for the year 2003 are significantly lower
0
0.05
0.1
0.15
0.2
0.25
0.3
1988 1989 1990 1991 1992 1993 1994 1995 1996 1997 1998 1999 2000 2001 2002 2003
DD
T su
m (m
g/kg
)
Baltic Sea
Skagerrak, Kattegat, Belts and Sound

62
than the other years. Hence, comparisons of the average content between different years should be done with caution for the indicator PCB-sum.
The findings in animal fat are almost all just above the limit of detection, and the average con-tents do not differ from year to year. The most pronounced compounds in fat from different animals are the same, but some inequalities between the different food items are seen.
For pork fat (Figure 25) the highest average was found for ΣDDT, but indicator PCB-sum and HCB were also found. The compounds were found at almost the same levels from 1998 to 2003 with a minor decrease for ΣDDT.
In beef fat (Figure 26) ΣDDT, indicator PCB-sum and HCB were also found, where ΣDDT and HCB had the highest average contents, but also dieldrin was found in samples of beef fat. The distribution between the substances as well as the levels seems to be very constant throughout the monitoring period.
For poultry fat (Figure 27), almost the same picture is seen, findings of ΣDDT, indicator PCB-sum and HCB were almost at a constant average level, and there were also findings of dieldrin. In addition to these compounds, and in contrast to the other animal fats, lindane was observed in a significant number of samples of poultry fat, but at very low levels just above the limit of detection.
Figure 25. Pork fat, 1998-2003. Average contents of substances found in pork fat (mg/kg).
0.000
0.005
0.010
0.015
0.020
1998 1999 2000 2001 2002 2003
mg/kg fat HCBPCB sumDDT-sum

63
Figure 26. Beef fat, 1998-2003. Average contents of substances found in beef fat (mg/kg).
Figure 27. Poultry fat, 1998-2003. Average contents of substances found in poultry fat (mg/kg).
Figure 28 shows the average contents of the organochlorine contaminants in dairy products. A distinction is made between dairy of Danish and foreign origin. It seems that the average con-tents of the substances in Danish and foreign dairy produce were about the same, except for the content of indicator PCB-sum in Danish milk and ΣDDT in foreign butter, where higher average levels was found. Although there were almost no differences between the average levels, there were differences between the frequencies of the findings, for instance dieldrin was found with a frequency that is two to ten times higher in foreign than in the Danish dairy produce.
0.0000.0050.0100.0150.0200.025
1998 1999 2000 2001 2002 2003
mg/kg fat DieldrinHCBPCB sumDDT-sum
0.000
0.005
0.010
0.015
0.020
1998 1999 2000 2001 2002 2003
mg/kg fat LindaneDieldrinHCBPCB sumDDT-sum

64
Figure 28. Dairy produce, average contents of the substances (mg/kg). A distinction has been made between samples of Danish and foreign origin
8.5 Intake calculations
8.5.1 Organochlorine pesticides and indicator PCB
Procedure
Section 5.2 describes how the intake calculations were carried out, and Appendix 11.3.30 lists the product types used for the different food items, as well as their percentages of fat.
For samples of dairy produce, it was noted whether the product is of Danish or foreign origin. For example, the contents of ΣDDT are higher in foreign than in Danish butter: 0.011 mg/kg in samples of foreign butter and 0.002 mg/kg in samples of Danish butter. The distribution between the consumption of Danish and foreign cheese and butter is known, and it was taken into consideration in the calculation of average intakes. The average contents in Danish and foreign cheese have been summed up after being multiplied by 0.7 for Danish cheese and 0.3 for foreign cheese, respectively [56]. For butter, considerably fewer foreign samples than Danish samples have been analysed; hence, the intake calculations were based on the Danish figures.
0.000
0.005
0.010
0.015
0.020
Milk,Danish
Milk,foreign
Cheese,Danish
Cheese,foreign
Butter,Danish
Butter,foreign
mg/kg Heptachlorbeta-HCHalfa-HCHChlordanLindaneDieldrinHCBPCB sumDDT-sum

65
In the calculation of daily intakes, the contribution from herring was taken from the content in raw herring sampled directly for this purpose and not herring where the sampling had the pur-pose of following the development over time in the different Danish waters. As cod roe has not been analysed, the content of organochlorine compounds in cod roe has been estimated relative to the fat content of 3.7%
For certain food items where data from the 4th monitoring period is absent, e.g. vegetable oils or margarine, results from the 3rd monitoring period were used. In the 3rd monitoring period, organochlorine pesticides and indicator PCB were not found in samples of vegetable oils nor were organochlorine pesticides found in the analyses of grain and cereals in the present moni-toring period. For these foods, the contents were set to zero in the calculation of the Danish population’s intake of organochlorine pesticides.
Assessment of daily intakes
The calculated average daily intakes of organochlorine compounds are presented in Table 11, excluding any contribution from fruits and vegetables. Furthermore, the 0.90 and 0.95 quan-tiles for the daily intake are given in the table.

66
Table 11. Calculated intakes as µg per day, excluding fruit and vegetables
Substance Average (µg/day) 0.90 quantile (µg/day) 0.95 quantile (µg/day)
ΣChlordan 0.11 0.19 0.23 ΣDDT 0.27 0.46 0.60 Dieldrin 0.13 0.21 0.25 Endosulfan A 0.03 0.05 0.06 HCB 0.09 0.14 0.16 α-HCH 0.04 0.06 0.07 β-HCH 0.04 0.06 0.07 Heptachlor sum 0.05 0.08 0.09 Lindane 0.06 0.09 0.10 PCB28 0.09 0.14 0.17 PCB52 0.10 0.15 0.18 PCB101 0.08 0.13 0.16 PCB105 0.08 0.12 0.14 PCB118 0.07 0.11 0.13 PCB138 0.10 0.16 0.20 PCB153 0.10 0.17 0.21 PCB156 0.04 0.06 0.07 PCB170 0.05 0.07 0.09 PCB180 0.06 0.09 0.10 Indicator PCB-sum * 0.90 1.41 1.66 *The intake of indicator ΣPCB was calculated on the basis of the sum of average contents of the 10 indicator PCB congeners. Due to rounding off, the indicator ΣPCB is not in accordance with the figures obtained by adding the average contents of the individual PCB congeners in the table.
Intake calculations have been made for organochlorine pesticides and indicator PCB, and in comparison with the previous monitoring periods the intakes have apparently decreased. The following values for average daily intakes were reported for ΣDDT: < 3.4 µg/day (1983-1987), < 2 µg/day (1988-1992), 0.5 µg/day (1993-1997) and 0.3 µg/day (1998-2003), and for indicator PCB sum: 2.2 µg/day (1993-1997) and 0.9 µg/day (1998-2003). For the other or-ganochlorine pesticides, the values for daily intake were < 1.2 µg/day (1983-1987), < 0.8 µg/day (1988-1992), 0.2 - 0.3 µg/day (1993-1997) and 0.04 – 0.13 µg/day in the present pe-riod. When comparing the figures for average daily intakes of indicator PCB and ΣDDT in the monitoring periods, it is important to bear in mind that dietary data as well as calculation methods for average contents (see Section 8.3) differ.
In the first monitoring period (1983-1987), intake calculations were performed using only a few foodstuffs i.e. those that were assumed to contribute with the largest part of the intake of the substances concerned. In the second monitoring period (1988-1992), the intake calcula-tions were based on the average daily intake of fish and the total average intake of fat. In the third monitoring period (1993-1997), two methods for the calculation of average contents were used, which should lead to a more real picture of the intake. In the present monitoring period (1998-2003), average contents were calculated using a simpler estimation method (see

67
Section 8.3), however expecting to obtain results comparable with results from the 3rd moni-toring period. When comparing the intakes from the four periods the greatest uncertainty is the ’<’ symbols, as it is impossible, to say whether <3.4 µg/day is greater or lesser than <2 µg/day for the ΣDDT. As it appears from Section 8.4, there is a generally downward trend for the contents of organochlorine compounds in fish. The development for products of animal origin is, however, as seen in Figure 25 to Figure 27, not so clear.
Organochlorine pesticides in fruits and vegetables have been described in the sub-report on pesticides [51]. As mentioned earlier, the calculations are more difficult when the majority of measuring is below the limit of detection. The limit of detections for fruits and vegetables are higher than those presented in Appendix 11.3.31, and only a few results are above the limit of detection. Thus, it does not make any sense to compare the intake from fruits and vegetables with the intake from fish and products of animal origin as reported here. In spite of an occa-sionally higher estimated intake from fruits and vegetables [51], the largest contribution of organochlorine environmental contaminants is assumed to derive from fish, meat, dairy prod-ucts, and eggs.
A histogram for the intake distribution for adults of PCB-153, which is often used as an indi-cator for PCB [57], is shown in Figure 29, and for ΣDDT and HCB in Figure 30 and Figure 31. The contribution from fruits and vegetables is not included. The HCB histogram is closer to a normal distribution (bell-shaped) than the other two histograms, reflecting the fact that especially milk and cheese contribute to the intake. The distribution for the intake of milk and cheese is more evenly distributed than for e.g. fish, of which many eat next to nothing and a few eat a lot. Both for PCB and ΣDDT, the contribution from fish is greater, which causes the histogram to appear more lopsided.
Figure 29. Daily intake of PCB153 (µg per day), distribution for adults
0%5%
10%15%20%25%30%35%
0.02 0.1 0.15 0.2 0.25 0.3 0.35 0.4 0.45 0.5 0.55 0.6
µg PCB153 per day
% o
f all
adul
ts

68
Figure 30. Daily intake of ΣDDT (µg per day), distribution for adults.
0%5%
10%15%20%25%30%
0.02 0.04 0.06 0.08 0.1 0.12 0.14 0.16 0.18 0.2 0.22 0.24
µg HCB per day
% o
f all
adul
ts
Figure 31. Daily intake of HCB (µg per day), distribution for adults.
Contributions of individual foods groups to the daily intake
Figure 32 shows the estimated contributions of individual food groups to the average daily intake of PCB153, ΣDDT and HCB, but does not include fruits and vegetables. The group of fats includes the contributions from composite products, butter, vegetable oil and cod liver oil. Especially fish contributes to the average daily intake of ΣDDT and also PCB153, where there is an apparently more even distribution between the contributions of the food groups. In Ap-pendix 11.3.20, it is seen that contents of PCB153 above the limit of detection are found pre-dominantly in fish. Figure 32 shows that foods where many samples have contents below the limit of detection may nonetheless are great contributors to the calculated average intake, if the limit of detection is relatively high and the consumption is of a certain size. An example is PCB153, where the contribution from eggs, fats, meat and milk products originates from only a few samples with content above the limit of detection.
0%
10%
20%
30%
40%
0.1 0.2 0.3 0.4 0.5 0.6 0.7 0.8 0.9 1 1.1 1.2
µg DDTsum per day
% o
f all
adul
ts

69
For ΣDDT, approximately 45% of the average daily intake derives from fish. As seen in Ap-pendix 11.3.12, HCB was only found in low quantities in fish, which in fact is also reflected in a low contribution to the average daily intake of HCB from fish.
Figure 32. Adults, estimated contributions of various food groups to intakes of a) PCB153, b) ΣDDT, and c) HCB. Fruits and vegetables are not included. Similar calculations of the contribution of individual food groups to the daily intake have been made for children (Figure 33). For PCB153 the distribution is similar to the contribution for adults, whereas for DDT-sum and HCB children have a higher intake of the compounds through milk and a smaller part of the intake from fish.
a) PCB153
fats
poultry
fish
meat
cheese
milk products (incl.
icecream)
eggs
c) HCB
eggs
milk products (incl.
icecream)
cheese
meat
fish
poultry
fats
b) DDTsum
eggs
milk products (incl.
icecream)
cheese
meat
fish
poultry
fats

70
Figure 33. Children, estimated contributions of various food groups to intakes of a) PCB153, b) ΣDDT, and c) HCB. Fruits and vegetables are not included.
Cod liver and fish oils
The dietary survey has not recorded any significant consumption of cod liver. In order to il-lustrate the significance which cod liver may have for the intakes of indicator ΣPCB and ΣDDT, Table 12 gives an example of how much cod liver must be consumed to double the fish-derived part of the daily average intakes of these substances. It is seen that an average daily consumption of cod liver of 0.4 g and 0.5 g is required to double the contribution from fish to the average daily intakes of indicator ΣPCB and ΣDDT, respectively. This corresponds to a yearly consumption of one to two tins of 125 g.
a) PCB153
eggs
milk products (incl.
icecream)
cheese
meat
fish
poultry
fats
c) HCBfats
poultry
fish
meat cheese
milk products (incl.
icecream)eggs
b) DDTsumfats
poultry
fish meat
cheese
milk products (incl.
icecream)eggs

71
Table 12. Rough estimates of how much cod liver must be consumed to double the fish-derived part of the average intakes of indicator ΣPCB and ΣDDT, respectively
Substance Content*
(mg/kg liver)
Intake from fish **
(µg/day)
Required consumption of cod liver to double the contribution from fish
(g/day)
ΣPCB 0.47 0.20 0.4
ΣDDT 0.26 0.12 0.5
* Average of averages for all waters. ** The part of the average daily intake of the substance deriving from fish. Likewise for fish oils, no real picture of the Danish consumption exists. Table 13 shows the approximate contents [58] of ΣPCB and ΣDDT in fish oils. In order to double the fish-derived part of the average daily intakes of ΣPCB and ΣDDT, a daily consumption of 3.0 g and 2.9 g, respectively, of an ordinary fish oil is required. If the fish oil consists of cod liver oil a daily consumption of 1.1 g is required for doubling the average intake of ΣPCB and 0.6 g is re-quired for doubling the average intake of ΣDDT. The contents of organochlorine environ-mental contaminants in the individual fish oil samples vary considerably. The use of an aver-age content in fish oil in Table 13 may be somewhat misleading, as the consumer will typi-cally buy one bottle of fish oil and use the entire contents.
Table 13. Rough estimates of how much fish oil must be consumed to double the fish-derived part of the average daily intakes of indicator ΣPCB and ΣDDT, respectively.
Substance Fish oil type Content* (mg/kg fish oil)
Intake from fish ** (µg/day)
Required consumption of fish oil to double the contribution from fish
(g/day)
ΣPCB Fish oil 0.06 0.20 3.0
ΣDDT Fish oil 0.04 0.12 2.9
ΣPCB Cod liver oil 0.18 0.20 1.1
ΣDDT Cod liver oil 0.20 0.12 0.6
* Average contents [58]. ** The part of the average daily intake of the substance deriving from fish. 8.5.2 Dioxins and PCB The intake calculations are carried out as described in Section 5.2. Dioxins and dioxin-like PCB accumulates in fatty tissue and this fact is the basis for allocation of a figure of content to the many type of food item in the consumption survey despite the relatively few type of foodstuffs analysed in the monitoring programme.

72
The Danish action plan for dioxins started in 2000 and ended in 2004. The samples taken from 2000 to 2003 are a part of the present monitoring programme, but because the action plan ran for one more year, the intake calculations were carried out using the average contents in the analysed foodstuffs from the period 2000-2004 [59]. Table 14 summarises the calculated daily intakes. There are two sets of calculations. One with the calculated intake from food excluding fish and another where fish is included and the salmon part of the intake has been given three different levels of dioxins and PCB contents.
Table 14. Calculated daily intakes of dioxins and dioxin-like PCB.
Dioxin and dioxin-like PCB pg WHO-TEQ/kg bw/day
Average 95% percentile Food excluding fish Adults 0.51 0.91 Children age 4-14 1.1 2.0 Children age 4-6 1.5 2.4 Food including fish Adults – salmon at relative low levels of dioxins 0.82 1.8 Adults – salmon at middle levels of dioxins 0.92 2.3 Adults – salmon at maximum levels of dioxins 1.1 3.7
For the calculation excluding fish, intake figures by adults as well as children have been ob-tained. It appears that children because of the relatively large food intake compared to their bodyweight have two to three times the daily intake of dioxins and dioxin-like PCB than adults. The 95%-percentile for children is close to or exceeds the Tolerable weekly intake (TWI) at 14 pg WHO-TEQ/kg bw/week (which is equivalent to 2 pg WHO-TEQ/kg bw/day). To account for the difficulties in selecting the true composition of fish meal with regards to catching area and thereby level of contamination, the intake from food, including fish, has been carried out by setting the contents of dioxins and PCB in salmon to three different levels. The calculations show that the average intake of dioxins and dioxin-like PCB for adults are close to 50% of TWI. Consumers with high dietary intake of dioxins and dioxin-like PCB are close to or exceed TWI. The contribution from the main food groups to the average intake is 30-40% from milk or milk products, 3-4% from eggs, 13-18% from meat and 38-55% from fish.
8.6 Safety assessment
A common aspect for many of the organochlorine compounds included in the monitoring pro-gramme is that the liver is one of the most sensitive organ systems in the experimental ani-

73
mals. Following high daily doses, mice and rats have been observed to develop cancer of the liver. None of the substances cause genotoxicity, i.e. damage to the DNA, and it is generally agreed that the carcinogenic effects of these substances show thresholds. Some of these or-ganochlorine compounds have also shown a potential to affect hormone systems in vitro and to affect reproduction and developmental neurotoxicity in vivo, but these effects are in most cases only seen at higher doses than those producing liver toxicity. Impact on certain enzyme systems in the liver is a characteristic effect of these substances and is also believed to be of significance for some of the effects that can be observed on various hormone systems in ex-perimental animals following the administration of high doses.
Tolerable daily intake (TDI) or Acceptable daily intake (ADI) values established for the or-ganochlorine compounds are briefly mentioned below. More detailed descriptions and back-grounds for some of the established values may be found in reference [60].
HCB: In 1998, IPCS under WHO suggested a TDI of 0.17 µg/kg bodyweight per day for the non-carcinogenic effects of HCB, while 0.16 µg/kg bodyweight per day was suggested as a recommended value for the carcinogenic effect of HCB [61].
Lindane: The substance was most recently assessed by the FAO/WHO Joint Meeting on Pes-ticide Residues (JMPR) in 1997, where a provisional ADI of 1 µg/kg bodyweight was estab-lished [62].
α- and β-HCH: No ADI or TDI values have been established for α- and β-HCH. The Ameri-can ATSDR (Agency for Toxic Substances and Disease Registry) has suggested a ’Minimal Risk Level’ of 0.6 µg/kg bodyweight/day for β-HCH [63].
Cis and trans-chlordane: JMPR established an ADI of 0.5 µg/kg bodyweight for chlordane in 1986. Oxychlordane and trans-nonachlor are major constituents of technical chlordane, and may be regarded as included in the ADI for chlordane [64].
Heptachlor and heptachlor epoxide: JMPR assessed these substances in 1991, and established an ADI of 0.1 µg/kg bodyweight for the sum of heptachlor and heptachlor epoxide [65].
Dieldrin and aldrin: Aldrin is rapidly converted into dieldrin in plants and animals; therefore dieldrin is the subject of the greatest safety interest. Already in 1977, JMPR established an ADI of 0.1 µg/kg bodyweight for the sum of dieldrin and aldrin. For dieldrin, IPCS suggested a TDI of 0.05 µg/kg bodyweight in 1989 [66].
Endrin: JMPR has evaluated endrin in 1963, 1965 and 1970, where an ADI of 0.2 µg/kg bodyweight was established [67].
Isodrin: Isodrin has not been evaluated by JMPR, however based on its structure, the toxicity of isodrin is considered to be similar to aldrin, dieldrin and endrin.

74
ΣDDT: In 2000, JMPR established a Provisional Tolerable Daily Intake (PTDI) of 10 µg/kg bodyweight for all combinations of DDT, DDD, and DDE, based on studies in humans [68]. Later, the US Environmental Protection Agency has established an RfD (corresponding to tolerable daily intake) of 0.5 µg/kg bodyweight/day [69] for the non-carcinogenic effects of DDT. On the background of recent studies and assessments, a TDI of 0.5 µg/kg bodyweight for the sum of DDT, DDE, and DDD is considered the most relevant.
Endosulfan: In 1998, JMPR established an ADI of 6 µg/kg bodyweight for endosulfan [70].
Dioxins: Polychlorinated dibenzo-p-dioxins (PCDD), polychlorinated dibenzofurans (PCDF), and dioxin-like polychlorinated biphenyls were evaluated in 2001 by both the EC Scientific Committee on Food (SCF) and the Joint FAO/WHO Expert group on Food Additives (JECFA) [71]. The SCF established a tolerable weekly intake of 14 picogram/kg bodyweight [72] whereas JECFA established a monthly tolerable intake of 70 picogram/kg bodyweight [73]
PCB: The safety assessment of the non-dioxin-like PCB is particularly complicated, involving mixtures of congeners having different toxicological properties and effects. Most toxicologi-cal studies were carried out on the original, commercial products that are not representative of the mixtures that are concentrated in the food chains. There are also a number of other uncer-tainties in the existing toxicological studies concerning PCB [60]. On the basis of various considerations discussed in the reference [60], a TDI for total PCB of 0.1 µg/kg body-weight/day is considered appropriate.

75
Figure 34 gives the calculated intakes of the organochlorine substances for adult’s relative to the ADI/TDI values discussed above, and Figure 35 displays the calculated results for chil-dren.
Figure 34. Adults, average and 0.90 quantile intake relative to ADI/TDI
Figure 35. Children, average and 0.90 quantile intake relative to ADI/TDI
The calculated intakes percentage of ADI/TDI are higher for children, approximately twice as high as for adults, due to children’s high intake of some food groups, e.g. milk, in relation to their weight. The results, however, give no occasion for any immediate safety concerns, even
0% 5% 10% 15% 20%
PCB-sum
DDT-sum
Dieldrin
HCB
alpha-HCH
beta-HCH
Heptachlor-sum
Lindane
Chlordan-sum
Percent of ADI/TDI
Average intakeIntake, 0.90 quantile
0% 5% 10% 15% 20% 25% 30% 35% 40% 45%
PCB-sum
DDT-sum
Dieldrin
HCB
alpha-HCH
beta-HCH
Heptachlor-sum
Lindane
Chlordan-sum
Percent of ADI/TDI
Average intakeIntake, 0.90 quantile

76
for children with high intakes of the substances. In this context should be mentioned that the protection level for PCB is significantly lower than that for the other organochlorine sub-stances measured.
The ADI/TDI does not indicate any danger line, but the quantity which humans can ingest daily on a life-long basis without any recognizable health hazard. For the above-mentioned organochlorine substances, it is the total quantity that is assimilated in the human body, rather than the daily intake, which is important. Thus, short-term or long-term (weeks, months) in-takes above the ADI/TDI are of no health significance, as long as the average exposure over very long periods of time is kept below this value.
For dioxins and dioxin-like PCB the average estimated intake for adults constitutes 50% of the TWI. Persons with high dietary intake of dioxin and dioxin-like PCB (e.g. the 0.95 quan-tile) are close to or exceed the TWI, depending on the origin and hence the contamination level in especially the fatty fish they consume.
For children the intake of dioxins and dioxin-like PCB from food, excluding fish, is two to three times the intake estimated for adults. Milk and milk products are the dominant contribu-tors to the intake. A larger proportion of children are likely to exceed the TWI than compared to adults.
The overall risk assessment for the life time exposure of dioxin and dioxin-like PCB by adults and children does not find short time intake above TWI critical. The consumer is within a safe margin for dioxin exposure as long as the general dietary advises is followed, especially con-cerning intake of fatty fish.
8.7 Human milk
Human milk has been included in the present monitoring period and the samples have been analysed for chlorinated pesticides, PCB and dioxins. The milk is obtained from two hospitals in Denmark (Hvidovre and Skejby) and is collected from mothers who are 25 – 29 years old and are giving birth for the first time. This standardised sampling plan ensures that the results from different surveys can be compared over a period of time and internationally as proposed by WHO. In Appendix 11.3.29 the results are presented.
Surveys of human milk have previously been conducted in Denmark [74]. The results from 1993-94 showed a significant decrease by 50-80% in contents of chlorinated pesticides and PCB over a ten years period. Dioxins were analysed for the first time in Danish human milk in 1986 and the time trend to the results from 1993-94 showed only a minor decrease.

77
In Figure 36 and Figure 37 the results from the human milk samples collected in 1999 and 2000 are displayed together with the results from the last survey of Danish human milk in 1993-94. The bars represent the average contents from each of the years 1999 and 2002. One sample from each of the years 1999 an 2002 were removed before calculating the average used in Figure 36. These two samples were obvious outliers compared to the rest of the sam-ples with different profiles of compounds e.g. high levels of β-HCH and DDT and low levels of PCB. In Figure 37 all samples were included.
The time trend with decreasing levels of most chlorinated pesticides and PCB has continued during the last 8-9 years period. The decrease is 50-60%. For dioxins and the sum of dioxins and dioxin-like PCB the decrease over the last 8-9 years amounts to 38% and 46% respec-tively.
Figure 36. Chlorinated pesticides and indicator PCB in Danish human milk. Average con-tents in human milk samples collected in 1993[74], 1999 and 2002.
0
50
100
150
200
250
p,p'
-DD
E
PCB1
53
HC
B
b-H
CH
Die
ldrin
Hep
tach
lore
poxi
d
ng/g
fat 1993
19992002

78
Figure 37. Dioxins and the sum of dioxins and dioxin-like PCB in Danish human milk. Aver-age contents in human milk samples collected in 1993[74], 1999 and 2002.
05
10152025303540
TEQ
dio
xin
TEQ
diox
in+P
CB
pg W
HO
-TE
Q/g
fat
1993
1999
2002

79
9 Mycotoxins (ochratoxin A)
9.1 Introduction
Mycotoxins are toxins produced by fungi. They can cause disease in humans and animals and can give rise to lesions of, e.g. the liver, kidneys, or the nervous system. Some mycotoxins have been found carcinogenic in animal experiments, and a few are believed to have similar effects in humans. Ochratoxin A has been classified as a possible human carcinogen. Exam-ples of mycotoxins that may be important in connection with foods are aflatoxins, ochratoxin A, patulin, and trichothecenes.
Fungi of the genera Aspergillus and Penicillium produce Ochratoxin A. P. verrucosum is as-sumed to be the only important ochratoxin A producing species under Danish climatic condi-tions where, given favourable conditions, it is capable of producing considerable quantities of toxin. The occurrence of ochratoxin A in Danish-produced grain is considered the potentially most serious problem in relation to the occurrence of mycotoxins in Danish crops; but also other mycotoxins may be found in Danish crops.
Analysis of ochratoxin A in cereals has been a part of the monitoring programme since 1986. The results from the period 1986-1997 were reported in the reports for the monitoring pro-gramme 1988-1992 [8] and 1993-1997 [13] as well as in two articles [75,76]. All results for samples of wheat and rye kernels and flour analysed since 1986 are included in the present report; see Appendix 11.4.
A Danish maximum limit of 5 µg/kg for contents of ochratoxin A in cereals for human con-sumption was introduced in 1995. EU regulation was introduced in 2002, and this lowered the maximum limit to 3 µg/kg.
9.2 Sampling and analytical methods
Ochratoxin A may occur in grain that has been harvested having a high content of water and dried inefficiently or too slowly, or in grain that has been stored under humid conditions. The occurrence may vary from year to year due to climatic differences during harvest, for which reason samples are collected and analysed for ochratoxin A every year.
As mentioned, ochratoxin A in cereals has been a part of the monitoring programme since 1986. The problem with the occurrence of ochratoxin A has been reduced in this period. Therefore, the number of samples was reduced during the years, and the number of products monitored was also reduced as discussed in the report from the 3rd monitoring period [13] and

80
[76]. In the period 1998-2003, there have also been changes. In 1998 and 1999 samples of both wheat flour and kernels and rye flour and kernels were analysed, in 2000 wheat flour and rye flour were analysed, and in 2001, 2002 and 2003 only rye flour have been analysed. The total number of samples each year is listed in Appendix 11.4.
The samples were randomly taken at flourmills or in retail shops all over Denmark. The sam-ples can have both a Danish or foreign origin.
The analyses of samples from 1998 and 1999 were carried out at the regional laboratory in Aalborg. The samples from 2000-2003 were analysed at the regional laboratory in Ringsted. All samples were analysed using immunoaffinity columns and HPLC/FLD.
9.3 Data on contents
The results are shown in the tables in Appendix 11.4. In this table, all the results for wheat and rye kernels and flour from 1986 are shown. The results of flour and kernels have been pooled. Sixteen consecutive years of monitoring wheat (Figure 38) and eighteen consecutive years of monitoring rye (Figure 39) are now available.
0
1
2
3
4
1986
1987
1988
1989
1990
1991
1992
1993
1994
1995
1996
1997
1998
1999
2000
2001
2002
2003
Year
mic
rogr
am/k
g
Conventionally grown wheat Organically grown wheat
Figure 38. Mean content of ochratoxin A in conventionally or organically grown wheat (ker-nels and flour samples are pooled) in the period 1986-2000.

81
0
2
4
6
8
10
12
14
1986
1987
1988
1989
1990
1991
1992
1993
1994
1995
1996
1997
1998
1999
2000
2001
2002
2003
Year
mic
rogr
am/k
g
Conventionally grown rye Organically grown rye
Figure 39. Mean content of ochratoxin A in conventionally or organically grown rye (kernels and flour samples are pooled) in the period 1986-2003.
The occurrence and content of ochratoxin A in cereals depend on many factors, one is the weather conditions before and during harvest; i.e. wet harvest years give generally higher con-tents of ochratoxin A in cereals. The occurrence of ochratoxin A over the years also depends on the agricultural practice, particularly it may change with changes in grain-drying and stor-age procedures. The relation between weather conditions and content of ochratoxin A might not always be clear, e.g. in years with wet harvest conditions, the agricultural sector could be more aware of the importance of grain-drying. While in years with more dry harvest condi-tions, this aspect might be paid less attention.
The harvest years 1998 and 1999 were the first harvest years for several years with wet or average harvest conditions, and the levels of ochratoxin A in cereals were found to be lower than in the wet mid-1980s. The Danish agricultural grain-drying capacities were improved after the problems with wet grain in the mid-1980s. The present data indicate that this is a contributing factor to the lower contents found in the latest years. Improved agricultural prac-tices have also been shown to be effective in relation to decreasing the content of ochratoxin A in pig feed and correspondingly in Danish pigs [77].
Since ochratoxin A was included in the Danish monitoring system in 1986, organically grown cereals have tended to have higher contents of ochratoxin A than the corresponding conven-tional products (Figure 38 and Figure 39), especially for rye. The difference between the two categories has decreased in the last years. However, the mean content of ochratoxin A in

82
wheat and especially rye have also been highest in organically grown cereals in the 4th moni-toring period (see tables in Appendix 11.4).
The problem with ochratoxin A contents in cereals was pointed out to the organic farming indus-try in the mid-1990s, and since then the industry is attempting to make improvements, e.g. in the form of better drying and storage conditions and improved self-imposed control at the mills. These attempts seem to have improved the quality of organically grown cereals.
The difference between organic and conventional cereals can presumably be explained in terms of grain drying and storage conditions. The use or absence of fungicides has probably no significant influence on the growth of P. verrucosum and potential ochratoxin A produc-tion in the critical period just after harvest and during storage. However, one cannot preclude the possibility that there may be differences between the organic and the conventional cultiva-tion methods, which may render organic grain more susceptible to the growth of P. verruco-sum, e.g. higher amount of impurities in organic cereals or less uniform maturity could mean that correct handling and drying is even more important for organic than for conventional cereals.
9.4 Intake calculations
The intake calculations were carried out as described in Section 5.2.
In the report of the 3rd monitoring period [13], comprehensive intake calculations were per-formed. The main conclusions were that cereals are the main sources of the Danish popula-tion’s intake of ochratoxin A, and that the intake of ochratoxin A for persons who eat organic cereals was found to be higher than for persons who eat conventional cereals.
Here only two intake estimates for adults are calculated based on the data for wheat and rye kernels and flour from this monitoring period 1998-2003 (tables in Appendix 11.4), one for consumption of exclusively conventional wheat and rye and one for consumption of exclu-sively organic wheat and rye. The estimates of ochratoxin A content in all other food items included in the intake estimate are the same as those used in the report of the 3rd monitoring period [13]. All estimates of content in food items are listed in the table in Appendix 11.4.
The results of the intake calculations are shown in Table 15. There is still a difference be-tween the intake estimates exclusively based on the consumption of conventional and organic cereals, respectively. However, the difference is rather small.

83
Table 15. Calculated estimated intakes by an adult Danish person (70 kg) via the total food supply. One estimate is based on exclusively consumption of conventional wheat and rye, and the other estimate is based on exclusively consumption of organic wheat and rye.
Consumption of conventional wheat and rye
(ng/kg bw/day)
Consumption of organic wheat and rye
(ng/kg bw/day)
Average intake (mean) 1.8 2.3 High intake (0.95 quantile) 3.3 4.1
Wheat contributes to 14% and rye to 34% of the average intake based on the consumption of conventional cereals, and wheat contributes to 17% and rye to 43% of the average intake based on the consumption of organic cereals.
9.5 Safety assessment
Several risk assessments of ochratoxin A have been carried out internationally, and it has been proposed to establish the tolerable daily intake in the interval between “as low as possi-ble and no higher than 5 ng/ kg bodyweight/day or up to 14 ng/kg bodyweight/day, depending on the toxic effect and calculation method on which the establishment is based”. SCF reas-sessed ochratoxin A in 1998 [78] and recommended a TDI value as low as possible and no higher than 5 ng/kg bodyweight/day. This TDI value was based on the possible carcinogenic effect, corresponding to the limit arrived at by a Nordic toxicology group in 1991 [79], and has been in use in Denmark since then.
The intake estimates based on data from the 4th monitoring period show that persons having a high intake of ochratoxin A (the 0.95 quantile) have intakes below the TDI value of 5 ng/kg bw/day, both based on the consumption of exclusively conventional or organic cereals. This is an improvement compared to earlier monitoring periods [4].


85
10 References 1. National Food Agency of Denmark, Food monitoring in Denmark. Nutrients and con-
taminants 1983 – 1987. Publication No. 195 (September 1990).
2. National Food Agency of Denmark, Food monitoring 1988 – 1992. Publication No. 232 (December 1995).
3. Danish Veterinary and Food Administration, Nurients, Food monitoring, 1993-1997, Part 1. Fødevarerapport 2001:17 (October 2001).
4. Danish Veterinary and Food Administration, Chemical Contaminants, Food monitoring, 1993-1997, Part 2. Fødevarerapport 2001:18 (October 2001).
5. Danish Veterinary and Food Administration, Production aids (pesticides and veterinary drugs), Food monitoring, 1993-1997, Part 3. Fødevarerapport 2001:19 (October 2001). (e-publication).
6. Danish Veterinary and Food Administration, Food additives, Food monitoring, 1993-1997, Part 4. Fødevarerapport 2001:20 (October 2001). (e-publication).
7. Danish Veterinary and Food Administration, Microbial contaminants, Food monitoring, 1993-1997, Part 5. Fødevarerapport 2001:21 (October 2001). (e-publication)
8 . National Food Agency, Food monitoring in Denmark, 1995, Food Monitoring 1998-1992, Publication No. 232 (Søborg: Danish Veterinary and Food Administration).
9. Andersen, NL et al., The Danes’ dietary habits 2000-2002. Main results (In press). In Da-nish. (Søborg: Danish Institute for Food and Veterinary Research)
10. National Food Agency, 1990, Food monitoring in Denmark. Nutrients and contaminants 1983-1987, Publication No. 195 (Søborg: Danish Veterinary and Food Administration).
11. L. Samsøe-Petersen, E.H. Larsen, P.B. Larsen, & P. Bruun, Uptake of trace elements and PAHs by fruit and vegetables from contaminated soils, Env. Sci. Technol., 36, 3057-3063 (2002).
12. E.H. Larsen, N.L. Andersen, A. Møller, A. Petersen, G.K. Mortensen, & J. Petersen, Mo-nitoring the content and intake of trace elements from food in Denmark, Fd. Addit. Con-tamin., 19, 33-46 (2002).
13. Danish Veterinary and Food Administration, 2001, Monitoring system for foods, 1993-1997. Part 2. Chemical contaminants. Publication No. 2001:18.
14. L.A. Jørgensen & B. Pedersen, Trace metals in fish used for time trend analysis and as environmental indicators, Marine Pollution Bulletin, 28, 235-243 (1994).

86
15. National Food Agency, 1994, Contamination on Fish from Øresund. Mercury in cod and
flounder, Publication No. ILF 1994.10, (Søborg: Danish Veterinary and Food Admini-stration). In Danish.
16. E.H. Larsen & K.A. Francesconi, Arsenic concentrations correlate with salinity for fish taken from the North Sea and Baltic waters, J. Mar. Biol. Ass. UK, 83, 283-284 (2003).
17. Edmonds, J.S. & K.J. Francesconi, K.J., Arsenic in seafood: human health aspects and regulations, Marine Pollution Bulletin, 26, 665-674 (1993).
18. http://www.inchem.org/documents/jecfa/jeceval/jec_1307.htm
19. FAO/WHO, 1989, Toxicological evaluation of certain food additives and contaminants, WHO Food Additive Series, 24, Geneva: World Health Organization
20. Scientific Committee for Food, 1995, Reports from the Scientific Committee for Food, Thirty-sixth Series, The European Commission, Luxembourg.
21. FAO/WHO, 1993, Evaluation of certain food additives and contaminants, WHO Techni-cal Report Series, 837, Geneva: World Health Organization.
22. Nordic Council of Ministers, Nordic Nutrition Recommendations NNR 2004-integrating nutrition and physical activity. Nord 2004:013 (In press).
23. L.C. Clark, G.F. Combs, B.W. Turnbull, E.H. Slate, D.K. Chalker, J. Chow, L.S. Davis, R.A. Glover, G.F. Graham, E.G. Gross, A. Krongrad, J.L. Lesher, H.K. Park, B.B. San-ders, C.L. Smith and J.R. Taylor, J. Am. Med. Assoc., 276, 1957- (1996).
24. E.H. Larsen, G. Pritzl, & S.H. Hansen, Arsenic speciation in seafood samples with emphasis on minor constituents: an investigation using high-performance liquid chroma-tography with detection by inductively coupled plasma mass spectrometry, J. Anal. Atom. Spectrom., 8, 1075-1084 (1993).
25. FAO/WHO, 1989, Toxicological evaluation of certain food additives and contaminants, WHO Food Additive Series, 24, Geneva: World Health Organization
26. E.H. Larsen & T. Berg, Position paper on arsenic, in: Trace Element Speciation for Envi-ronment, Food and Health, Eds.: Ebdon, L., Crews, H., Cornelis, R., Donard, O.F.X. and Quevauviller, P., Cambridge: Royal Chemical Society (2001).
27. EU Scientific Committee on Food, Opinions of the Scientific Committee for Food on: Nitrates and nitrite. Directorate-General for Industry (1997).
28. Gry, J., I. Knudsen, E. Kristiansen, H.R. Lam, J.J. Larsen, E.S. Madsen, O. Meyer, B.E. Mikkelsen, P.A. Olsen, M. Osler & I. Thorup. Kost og kræft, Levnedsmiddelstyrelsen (Diet and cancer, National Food Agency of Denmark, Publication No. 132 (October 1986).
29. National Agency of Denmark, Food Monitoring in Denmark, Nutrients and contaminants 1983 – 1987. Publication No. 195 (September 1990).
30. National Food Agency of Denmark, Food Monitoring in Denmark, Nutrients and conta-minants 1983 – 1992. Publiation No. 232 (December 1995).

87
31. Danish Veterinary and Food Administration, Food monitoring, 1993 – 1997. Part 2 (De-
cember 1999).
32. Petersen, A. & S. Stoltze. Nitrate and nitrite in vegetables on the Danish market: content and intake, Food Additives and Contaminants, 16, 291 (1999).
33. Danmarks Statistik (Statistics Denmark), Indkomst, forbrug og priser (Income, consump-tion, and prices, Statistiskeke Efterretninger, nr. 12 (1985).
34. Danmarks Statistik (Statistics Denmark), Indkomst, forbrug og priser (Income, consump-tion, and prices), Statistiske Efterretninger, nr. 3 (1986).
35. Miljø- og Energiministeriets bekendtgørelse nr. 673 af 20. august 1997. Bekendtgørelse om helt eller delvist forbud mod visse bekæmpelsesmidler (Danish Ministry of Environ-ment and Energy, Order No. 673 of 20 August 1997 on total or partial prohibition of cer-tain controlling agents) (1997).
36. Oplysning fra Miljøstyrelsen (Danish Environmental Protection Agency, information) (1999).
37. Fødevaredirektoratet, Bekendtgørelse om pesticidrester i fødevarer og foderstoffer, Be-kendtgørelse nr. 122 af 25. februar 2004 (Danish Veterinary and Food Administration, Order No. 122 of 25 february on maximum limits for contents of controlling agents in foods).
38. Levnedsmiddelstyrelsen, Bekendtgørelse om ændringer af bekendtgørelse om maksimal-grænseværdier for indhold af bekæmpelsesmidler i levnedsmidler, Levnedsmiddelstyrle-sens bekendtgørlse af 9. maj 1988.
39. Miljø- og Energiministeriets bekendtgørelse nr. 925 af 13. december 1998, Bekendtgørel-se om PCB, PCT og erstatningsstoffer herfor (Danish Ministry of Environment and Ener-gy, Order No. 925 of 13 December 1998 on PCB, PCT, and substitutes for these) (1998).
40. Council Regulation (EC) No. 2375/2001 of 29 November 2001 amending Commission Regulation (EC) No 466/2001 of 8 March 2001 setting maximum levels for certain con-taminants in foodstuffs.
41. Commission Recommendation 2002/201/EC of 4 March 2002 on the reduction of the presence of dioxin, furans and PCBs in feedingstuffs and foodstuffs.
42. Veterinær- og Fødevaredirektoratet (Danish Veterinary and Food Administration), 5 Fe-bruary 1999, J.No. 521.1030-0035: Vejledende værdier for acceptabelt indhold af PCB og chlorholdige pesticider i fiskeolie (Recommended values for acceptable contents of PCB and organochlorine pesticides in fish oils), (1999).
43. Fries, G.F., R.M. Cook & L.R. Prewitt, Distribution of polybrominated biphenyl residues in the tissues of environmentally contaminated dairy cows, J. Dairy Sci. 61, 420-425 (1978).

88
44. Fries, G.F. & G.S. Marrrow, Distribution of hexachlorobenzene residues in beef steers, J.
Animal Sci. 45, 1160 (1977).
45. Lorber, V. Feil, D. Winters & J. Ferrario, Distribution of dioxins, furans, and coplanar PCBs in different fat matrices in cattle, Organohalogen compounds, 32, 327 (1997).
46. Rumsey, T.S., P.A. Putnam, R.E. Davis & C. Corley, Distribution of p,p’-DDT residues in adipose and muscle tissues of beef cattle, J. Agr. Food Chem., 15, 898 (1967).
47. Veterinær- og Fødevaredirektoratet, Analysemetode FC024.1 (Danish Veterinary and Food Administration, Analytical method FC024.1).
48. Commission Directive 2002/69/EC of 26 July 2002 laying down the sampling methods and the methods of analysis for the official control of dioxins and the detection of dioxin-like PCB in foodstuffs.
49. Fromberg, A., T. Cederberg, G. Hilbert & A. Büchert, Levels of toxaphene congeners in fish from Danish waters, Chemosphere, 40 (2000).
50. Levnedsmiddelstyrelsen (National Food Agency of Denmark), Intern rapport, projekt nr. 96529-01, Overvågning: Chlorholdige pesticider og PCB i fede fisk og torskelever fra danske hovedfarvande (Internal report, Project No. 96529-01, Monitoring: Organochlori-ne pesticides and PCB in fat fish and cod liver from Danish main waters).
51. Danish Veterinary and Food Administration, Pesticides, Monitoring system for foods 1998-2003. Part 2. (under preparation).
52. van den Berg M., Birnbaum, L., Bosveld, B.T.C., et al. Toxic Equivalency Factors (TEFs) for PCBs, PCDDs, PCDFs for humans and vildlife. Environ. Health Perspect. 1998, 106, 775-792.
53. Hilbert, G., L. Lillemark & P. Nilsson, PCB in cod liver - Time trend study and correla-tion between total PCB (Aroclor 1260) and PCB congeners, Organohalogen compounds 32. 340-343, 17th International symposium on chlorinated dioxins and related com-pounds, Indianapolis, Indiana (1997).
54. Sommer Statistics, Torskelever, Notat angående principperne i analyse af torskeleverdata. Specifikt er der set på total-PCB fra perioden 1988-1996 (Cod liver, Note concerning the principles of analysis of cod liver data, with special reference to total PCB during the pe-riod 1988-1996) (May 1999).
55. Sommer Statistics, Regres-BDL, version 1.0. Program til estimation af regressionslinje for datasæt indeholdende observationer under detektionsgrænsen (Programme for the estimation of regression lines for data sets containing observations below the limit of de-tection) (May 1999).
56. Landbrugsstatistikårbøger (Agrostatistical Yearbooks) (1990-1997). Der er gjort den an-tagelse, at lagerforskydningen for importeret og egenproduceret ost er den samme (It has been assumed that the stock shift for imported and home-produced cheese is the same).

89
57. Atuma, S.S., C-E Linder, Ö. Andersson, A. Bergh, L. Hansson & A. Wicklund-Glynn,
PCB153 as indicator for congener specific determination of PCBs in diverse fish species from Swedish waters, Chemosphere, 33, 1459-1464 (1996).
58. Veterinær- og Fødevaredirektoratet (Danish Veterinary and Food Administration), Internt papir: Oversigt over PCB og chlorpesticider i fiskeolie – kosttilskud (Internal paper: Out-line of PCB and organochlorine pesticides in fish oil – food supplements), (May 1998).
59. Danmarks Fødevareforskning (Danish Institute for Food and Veterinary Research). Dio-xinhandlingsplan 2000-2004. Slutrapport. May 2005.
60. Sundhedsstyrelsen & Fødevaredirektoratet (Danish National Board of Health & Danish Veterinary and Food Administration), Indhold af dioxiner, PCB, visse chlorholdige pesti-cider, kviksølv og selen i modermælk hos danske kvinder 1993-94 (Contents of dioxins, PCB, certain organochlorine pesticides, mercury, and selenium in breast milk of Danish women 1993-94) (1999).
61. IPCS (WHO), Hexachlorobenzene, Environmental Health Criteria 195, (1998).
62. JMPR (FAO, WHO, IPCS), Lindane. In: Pesticide residues in food - 1997 evaluations, Part II - Toxicological and Environmental, WHO/PCS/98.6, (1998).
63. ATSDR (USA), Toxicological Profile for alpha-, beta-, gamma- and delta-hexachloro-cyclohexane (Update), U.S. Department of Health & Human Services, Public Health Ser-vice, (1997).
64. JMPR (FAO, WHO, IPCS), Chlordane. In: Pesticide residues in food – 1986 evaluations. Part II – Toxicology. FAO Plant Production and Protection Paper 78/2, (1987).
65. JMPR (FAO,WHO, IPCS), Heptachlor and heptachlorepoxide. In: Pesticide residues in food – 1991. Evaluations. Part II - Toxicology, WHO/PCS/92.52, (1992).
66. IPCS (WHO), Aldrin and dieldrin, Environmental Health Criteria 91, (1989).
67. IPCS (WHO), Endrin, Environmental Health Criteria 130, (1992).
68. JMPR (FAO, WHO, IPCS), DDT. In: Pesticide residues in food: 2000 evaluations, Part II. Toxicological, WHO/PCS/01.3, (2001).
69. IRIS (USA EPA), DDT, DDE, DDD, US Environmental Protection Agency, US EPA Integrated Risk Information System, (2004).
70. JMPR (FAO, WHO, IPCS), Endosulfan. In: Pesticide residues in food: 1998 evaluations, Part II. Toxicological, WHO/PCS/99.18, (1999).
71. JECFA (2002). Polychlorinated dibenzodioxins, polychlorinated dibenzofurans, and coplanar polychlorinated biphenyls. WHO Food Additives Series. Safety evaluation of certain food additives and contaminants. Prepared by the Fifty Seventh meeting of the Joint FAO/WHO Expert Committee on Food Additives (JECFA). International Pro-gramme on Chemical Safety (IPCS), World Health Organization, Geneva, pp 451-664.

90
72. SCF. Opinion of the Scientific Committee on Food (SCF) on the risk assessment of dio-
xins and dioxin-like PCBs in food. Update based on new scientific information available since the adoption of the SCF opinion of 22nd November 2000. Adopted on 30 May 2001. Http://europa.eu.int/comm/food/fs/sc/scf/outcome_en.html.
73. JECFA. Polychlorinated dibenzodioxins, polychlorinated dibenzofurans, and coplanar polychlorinated biphenyls. WHO Food Additives Series, 48. Safety evaluation of certain food additives and contaminants. Prepared by the Fifty Seventh meeting of the Joint FAO/WHO Expert Committee on Food Additives (JECFA). International Programme on Chemical Safety (IPCS), World Health Organization, Geneva, pp 451-664, (2002).
74. Sundhedsstyrelsen/Fødevaredirektoratet. Indhold af dioxiner, PCB, visse chlorholdige pesticider, kviksølv og selen i modermælk hos danske kvinder 1993-94 (content of dio-xin, PCB, selected organochlorine pesticides, mercury and selenium in mothers milk from Danish women 1993-94)1999, ISBN 87-90765-49-4.
75. K. Jørgensen, G. Rasmussen & I. Thorup, Ochratoxin A in Danish cereals 1986-1992 and daily intake by the Danish population, Food Additives and Contaminants 13, 95-104 (1996).
76. K. Jørgensen & J. S. Jacobsen, Ochratoxin A in Danish wheat and rye, 1992-99, Food Additives and Contaminants 19, 1184-1189 (2002).
77. K. Jørgensen & A. Petersen, Content of ochratoxin A paired kidney and meat samples form healthy Danish slaughter pigs, Food Additives and Contaminants 19, 562-567 (2002).
78. EU Scientific Committee on Food, Opinion on ochratoxin A, CS/CNTM/MYC/14 final, published on the Internet only. (September 1998).
79. The Nordic Working Group on Food Toxicology and Risk Evaluation, Health Evaluation of ochratoxin A in food products, Nordiske Seminar-og Arbejdsrapporter (Nordic Semi-nar and Work Reports), 545 (1991).

91
11 Appendices

92
11.1 Appendix to Trace elements
11.1.1 Contents of lead (µg/kg fresh weight) in foods sampled, 1998-2003 Foodstuff
Number
Number< LOD
Average
Minimum
Maximum
Median
0.90 quantile
Pb Vegetables: Aubergines 10 2 6.2 < 0.4 48.2 1.1 9.8 Beans 9 0 3.1 0.6 8.7 2.7 4.9 Beetroots 10 0 5.6 3.5 8.1 5.4 7.8 Broccoli 10 1 5.3 < 0.4 23.5 2.3 9.5 Brussel sprouts 9 0 5.8 2.2 20.5 3.8 8.7 Cabbage 11 0 1.2 0.5 5.3 0.8 1.5 Carrots 39 0 8.8 0.5 34.0 6.1 22.5 Cauliflower 10 4 1.1 < 0.8 2.2 1.0 2.1 Celeriac 9 0 3.2 0.8 5.8 3.5 4.1 Celery 12 0 3.0 1.0 7.4 2.3 6.3 Chinese cabbage 10 0 1.6 0.4 4.0 1.3 2.8 Cucumber 10 0 1.4 0.6 3.4 1.3 2.4 Curly kale 15 0 35.4 5.1 79.5 32.7 77.7 Leeks 11 0 2.1 0.6 3.6 2.2 3.4 Lettuce 31 0 16.3 0.5 139 8.1 35.9 Mushrooms 10 0 2.0 0.8 3.9 1.9 3.1 Onions 20 0 1.9 0.7 8.0 1.3 2.9 Peas 10 0 3.6 1.1 9.0 3.1 6.4 Pepper 13 0 1.9 1.1 4.5 1.7 2.8 Potatoes 30 8 1.7 < 0.8 7.2 1.5 2.9 Rhubarb 8 0 47.0 23.5 87.6 33.9 85.6 Spinach 28 0 22.4 2.4 92.7 12.4 52.5 Squash 10 0 1.5 0.6 2.9 1.2 2.7 Tomato 20 0 1.6 0.5 5.7 0.9 3.0 Offal: Liver, calf 20 0 22.6 6.0 60.9 18.5 45.6 Liver, chicken 12 10 < 6.0 < 6.0 6.2 < 6.0 < 6.0 Liver, ox 14 0 19.0 9.7 35.6 18.0 26.7 Liver, pig 19 9 6.8 < 6.0 20.0 6.0 9.8 Kidney, calf 23 0 46.0 22.0 80.9 42.6 71.5 Kidney, ox 43 0 45.7 20.0 84.9 43.8 66.5 Kidney, pig 32 10 9.8 < 6.0 56.8 7.3 14.0 Meat products: Pate, meat 10 0 6.5 2.5 12.0 6.4 8.3 Pork, flank, cooked 10 2 3.9 < 2.0 13.0 3.3 5.3 Pork, liver paste 10 0 5.1 2.7 8.4 5.0 7.9 Pork, mettwurst, smoked 11 2 3.6 < 2.0 7.3 3.1 6.8 Pork, saddle, smoked 10 8 < 2.0 < 2.0 3.4 < 2.0 2.7

93
Foodstuff
Number
Number< LOD
Average
Minimum
Maximum
Median
0.90 quantile
Pork, sausage, frankfurter 13 2 9.7 < 2.0 70.7 3.8 9.3 Pork, sausage, saveloy 9 1 6.3 < 2.0 27.0 3.8 11.1 Sausage, chicken 11 1 4.7 < 2.0 9.2 4.1 7.4 Sausage, salami 10 2 4.1 < 2.0 11.0 3.5 7.2 Sausage, turkey 8 2 3.0 < 2.0 4.3 3.2 4.0 Meat: Beef 41 18 < 5.0 < 5.0 29.0 < 5.0 9.5 Chicken 30 23 < 5.0 < 5.0 15.0 < 5.0 6.8 Lamb 7 6 < 5.0 < 5.0 5.5 < 5.0 < 5.0 Mutton 2 2 < 5.0 < 5.0 < 5.0 < 5.0 < 5.0 Pork 43 30 < 5.0 < 5.0 24.6 < 5.0 < 5.0 Turkey 12 11 < 5.0 < 5.0 5.0 < 5.0 < 5.0 Veal 18 10 < 5.0 < 5.0 18.0 < 5.0 < 5.0 Fish: Cod 30 19 3.7 < 2.0 37.0 < 2.0 7.0 Cod liver 10 4 5.0 < 2.0 14.0 3.5 10.0 Eel 8 1 6.1 < 2.0 12.0 4.2 12.0 Flounder 22 12 2.6 < 2.0 13.0 < 2.0 5.9 Garfish 15 5 3.8 < 2.0 23.6 2.6 4.3 Herring 18 2 8.5 < 2.0 30.3 5.4 20.7 Mackerel 22 17 < 2.0 < 2.0 10.0 < 2.0 5.6 Mussel 15 0 142 31 383 144 180 Plaice 21 13 < 2.0 < 2.0 6.5 < 2.0 3.1 Shrimp 10 3 4.3 < 2.0 7.0 4.6 6.7 Tuna 12 8 < 2.0 < 2.0 4.8 < 2.0 3.1 Beverages: Apple juice 6 0 5.7 1.3 10.9 5.2 10.2 Beer, lager 15 9 0.7 < 0.6 3.7 < 0.6 2.5 Fruit juice 6 0 39.5 4.0 207 6.9 108 Orange juice 11 4 4.2 < 0.6 15.2 1.9 13.3 Red wine 15 0 28.4 12.9 43.8 26.8 43.0 Soft drinks 21 12 1.4 < 0.6 11.3 < 0.6 1.8 Water, carbonated 4 2 0.8 < 0.6 2.1 < 0.6 1.7 White wine 10 0 30.5 16.5 58.0 27.8 47.6 Dairy products: Blended spread 5 4 < 4.0 < 4.0 5.0 < 4.0 < 4.0 Butter 5 5 < 4.0 < 4.0 < 4.0 < 4.0 < 4.0 Cheese, brie 10 4 3.5 < 2.0 10.6 2.5 7.6 Cheese, firm, Danbo 10 3 3.4 < 3.0 4.2 3.4 4.1 Cocoa, instant 9 0 2.7 1.5 5.8 2.2 4.5 Cream, whipping 10 6 < 2.0 < 2.0 3.9 < 2.0 3.7

94
Foodstuff
Number
Number< LOD
Average
Minimum
Maximum
Median
0.90 quantile
Ice cream, dairy 11 5 2.9 < 2.0 11.6 2.3 3.6 Milk, buttermilk 10 5 < 0.4 < 0.4 0.6 < 0.4 0.5 Milk, partly skimmed 10 5 0.5 < 0.4 1.8 < 0.4 0.8 Milk, skimmed 10 4 0.8 < 0.4 3.1 0.5 1.3 Milk, skimmed with choco-late 2 0 2.3 2.3 2.4 2.3 2.3 Milk, whole 10 8 < 0.5 < 0.5 1.0 < 0.5 0.6 Ymer 10 4 1.7 < 0.6 7.8 0.6 3.9 Yoghurt 11 7 < 0.6 < 0.6 1.9 < 0.6 1.1 Bread and cereals: Bread, white 10 7 < 20.0 < 20.0 42.0 < 20.0 29.4 Bread, white coarse grain 10 8 < 20.0 < 20.0 28.0 < 20.0 27.1 Bread, white roll 10 7 < 20.0 < 20.0 27.0 < 20.0 20.7 Bread, wholemeal 10 10 < 20.0 < 20.0 < 20.0 < 20.0 < 20.0 Breakfast cereal 10 7 < 20.0 < 20.0 41.0 < 20.0 26.6 Corn flakes 10 8 < 20.0 < 20.0 61.0 < 20.0 25.0 Crispbread, rye 7 7 < 20.0 < 20.0 < 20.0 < 20.0 < 20.0 Crispbread, wheat 3 3 < 20.0 < 20.0 < 20.0 < 20.0 < 20.0 Oats, rolled 10 10 < 20.0 < 20.0 59.0 < 20.0 < 20.0 Pasta 10 6 21.0 < 20.0 59.0 < 20.0 55.4 Rice, polished 6 6 < 20.0 < 20.0 < 20.0 < 20.0 < 20.0 Rye bread 10 9 < 20.0 < 20.0 27.0 < 20.0 < 20.0 Rye bread, wholemeal 20 19 < 20.0 < 20.0 24.0 < 20.0 < 20.0 Rye flour, whole meal 10 7 < 20.0 < 20.0 33.0 < 20.0 25.8 Wheat flour 10 8 < 20.0 < 20.0 20.0 < 20.0 20.0

95
11.1.2 Contents of cadmium (µg/kg fresh weight) in foods sampled, 1998-2003
Foodstuff (Cd)
Number
Number < LOD
Average
Minimum
Maximum
Median
0.90 quantile
Vegetables: Aubergines 10 1 2.9 < 0.3 16.9 0.9 4.4 Beans 9 1 1.0 < 0.3 2.2 1.0 1.8 Beetroots 10 0 28.0 12.5 42.5 28.0 37.0 Broccoli 10 0 6.0 2.6 10.6 5.7 9.8 Brussel sprouts 9 0 7.3 5.0 11.7 6.7 10.2 Cabbage 11 0 4.1 1.4 9.3 3.8 6.9 Carrots 39 0 26.4 2.1 62.8 23.5 56.3 Cauliflower 10 0 4.4 2.1 7.6 3.9 7.0 Celeriac 9 1 63.5 < 0.3 116 58.9 108 Celery 12 0 21.5 1.3 49.4 20.8 38.4 Chinese cabbage 10 0 13.9 6.2 36.1 10.9 20.6 Cucumber 10 8 < 0.3 < 0.3 1.7 < 0.3 0.5 Curly kale 15 0 16.7 3.9 50.2 11.7 29.5 Leeks 11 0 19.8 1.8 49.2 19.2 37.5 Lettuce 31 0 21.3 3.5 69.6 15.3 40.6 Mushrooms 10 0 13.5 3.9 38.2 9.4 25.9 Onions 20 0 16.4 5.3 40.6 15.1 25.3 Peas 10 0 3.3 1.4 8.5 2.4 5.1 Pepper 13 4 2.8 < 0.3 13.6 0.5 9.4 Potatoes 30 0 13.4 0.8 37.6 12.7 20.8 Rhubarb 8 0 24.2 8.1 44.7 20.5 40.7 Spinach 28 0 63.8 < 0.3 278 58.4 92.5 Squash 10 3 1.7 < 0.3 9.4 0.9 2.3 Tomato 20 9 3.1 < 0.3 21.8 0.6 7.7 Offal: Liver, calf 20 0 40.8 11.3 239 24.6 52.7 Liver, chicken 12 0 15.6 6.7 46.9 14.2 18.2 Liver, ox 14 0 64.2 11.7 174 59.9 91.8 Liver, pig 19 0 25.1 13.6 47.5 23.8 33.9 Kidney, calf 23 0 126 44.0 448 105 195 Kidney, ox 43 0 434 29.0 2710 345 643 Kidney, pig 32 0 206 61.7 461 176 349 Meat products: Pate, meat 10 0 9.4 3.9 18.1 7.7 17.2 Pork, flank, cooked 10 9 1.1 < 1.0 2.8 < 1.0 2.0 Pork, liver paste 10 0 12.7 10.6 17.5 11.9 15.3 Pork, mettwurst, smoked 11 2 2.7 < 1.0 4.0 3.2 3.8 Pork, saddle, smoked 10 10 < 1.0 < 1.0 1.3 < 1.0 1.0 Pork, sausage, frankfurter 13 8 2.1 < 1.0 5.1 1.8 4.9 Pork, sausage, saveloy 9 5 2.0 < 1.0 3.8 1.9 3.2
96
Foodstuff (Cd)
Number
Number < LOD
Average
Minimum
Maximum
Median
0.90 quantile
Sausage, chicken 11 4 2.8 < 1.0 6.6 2.9 5.3 Sausage, salami 10 9 < 1.0 < 1.0 2.5 < 1.0 1.8 Sausage, turkey 8 6 1.2 < 1.0 2.6 1.2 2.2 Meat: Beef 41 40 < 3.0 < 3.0 < 3.0 < 3.0 < 3.0 Chicken 30 30 < 3.0 < 3.0 < 3.0 < 3.0 < 3.0 Lamb 7 7 < 3.0 < 3.0 < 3.0 < 3.0 < 3.0 Mutton 2 2 < 3.0 < 3.0 < 3.0 < 3.0 < 3.0 Pork 43 43 < 3.0 < 3.0 < 3.0 < 3.0 < 3.0 Turkey 12 12 < 3.0 < 3.0 < 3.0 < 3.0 < 3.0 Veal 18 18 < 3.0 < 3.0 < 3.0 < 3.0 < 3.0 Fish: Cod 30 29 < 0.6 < 0.6 0.8 < 0.6 < 0.6 Cod liver 10 0 24.8 2.9 75.0 18.0 43.0 Eel 8 4 0.6 < 0.6 1.5 0.6 1.2 Flounder 22 9 1.1 < 0.6 7.4 0.6 1.8 Garfish 15 7 1.4 < 0.6 5.0 0.7 3.1 Herring 18 0 4.3 0.7 13.8 4.0 7.6 Mackerel 22 0 3.9 1.2 13.1 3.2 4.3 Mussel 15 0 101 54.8 169 95.8 140 Plaice 21 16 < 0.6 < 0.6 1.4 < 0.6 1.1 Shrimp 10 1 25.8 < 0.6 56.1 26.3 50.6 Tuna 12 0 11.6 5.4 32.4 7.6 20.6 Beverages: Apple juice 6 0 0.4 0.3 0.5 0.4 0.5 Beer, lager 15 13 < 0.1 < 0.1 0.3 < 0.1 < 0.1 Fruit juice 6 0 2.1 0.1 8.9 0.6 5.7 Orange juice 11 6 0.1 < 0.1 0.4 < 0.1 0.4 Red wine 15 1 0.3 < 0.1 0.6 0.3 0.4 Soft drinks 21 21 < 0.1 < 0.1 < 0.1 < 0.1 < 0.1 Water, carbonated 4 4 < 0.1 < 0.1 < 0.1 < 0.1 < 0.1 White wine 10 0 0.3 0.1 0.5 0.3 0.5 Dairy products: Blended spread 5 5 < 3.0 < 3.0 < 3.0 < 3.0 < 3.0 Butter 5 5 < 3.0 < 3.0 < 3.0 < 3.0 < 3.0 Cheese, brie 10 10 < 1.0 < 1.0 < 1.0 < 1.0 < 1.0 Cheese, firm, Danbo 10 9 < 1.0 < 1.0 1.1 < 1.0 < 1.0 Cocoa, instant 9 0 2.9 2.2 3.4 2.9 3.3 Cream, whipping 10 10 < 1.0 < 1.0 < 1.0 < 1.0 < 1.0 Ice cream, dairy 11 9 < 1.0 < 1.0 2.4 < 1.0 1.6 Milk, buttermilk 10 7 0.2 < 0.1 0.8 < 0.1 0.7 Milk, partly skimmed 10 10 < 0.3 < 0.3 < 0.3 < 0.3 < 0.3

97
Foodstuff (Cd)
Number
Number < LOD
Average
Minimum
Maximum
Median
0.90 quantile
Milk, skimmed 10 10 < 0.2 < 0.2 < 0.2 < 0.2 < 0.2 Milk, skimmed with chocolate 2 0 3.3 3.3 3.4 3.3 3.4 Milk, whole 10 10 < 0.3 < 0.3 < 0.3 < 0.3 < 0.3 Ymer 10 8 < 0.4 < 0.4 0.5 < 0.4 0.4 Yoghurt 11 10 < 0.4 < 0.4 1.0 < 0.4 < 0.4 Bread and cereals: Bread, white 10 0 20.4 15.0 24.0 21.0 24.0 Bread, white coarse grain 10 0 42.5 14.0 81.0 40.5 71.1 Bread, white roll 10 0 22.7 17.0 34.0 21.5 28.6 Bread, wholemeal 10 0 24.6 20.0 29.0 24.0 28.1 Breakfast cereal 10 1 27.8 < 1.5 66.0 27.0 54.3 Corn flakes 10 2 3.0 < 1.5 8.2 2.3 5.6 Crispbread, rye 7 0 7.5 5.4 10.0 6.7 9.5 Crispbread, wheat 3 0 22.3 18.0 30.0 19.0 27.8 Oats, rolled 10 0 23.2 13.0 110.0 23.5 29.8 Pasta 10 0 21.7 8.9 33.0 22.0 29.4 Rice, polished 6 0 17.9 8.2 27.0 17.0 26.5 Rye bread 10 10 7.2 5.1 12.0 7.0 9.7 Rye bread, wholemeal 20 12 26.8 4.5 110.0 14.5 61.6 Rye flour, whole meal 10 10 8.1 4.3 9.9 8.7 9.7 Wheat flour 10 1 32.1 15.0 58.0 30.0 43.6

98
11.1.3 Contents of nickel (µg/kg fresh weight) in foods sampled, 1998-2003 Foodstuff (Ni)
Number
Number < LOD
Average
Minimum
Maximum
Median
0.90 quantile
Vegetables: Aubergines 10 0 6 1 16 3 12 Beans 9 0 250 78 434 251 346 Beetroots 10 0 26 15 39 27 34 Broccoli 10 0 97 5 329 35 273 Brussel sprouts 9 0 38 28 47 39 47 Cabbage 11 0 23 5 53 15 49 Carrots 39 0 44 13 145 31 105 Cauliflower 10 0 22 9 38 21 37 Celeriac 9 0 81 2 137 76 135 Celery 12 0 27 8 62 22 46 Chinese cabbage 10 0 20 7 41 19 31 Cucumber 10 1 5 < 1 14 3 11 Curly kale 15 0 87 28 190 80 151 Leeks 11 0 28 8 64 18 50 Lettuce 31 0 35 4 173 25 78 Mushrooms 10 0 4 1 10 3 7 Onions 20 0 34 7 73 35 52 Peas 10 0 449 130 1070 281 1043 Pepper 13 1 26 < 1 96 6 74 Potatoes 30 0 33 4 365 17 56 Rhubarb 8 0 78 38 133 68 113 Spinach 28 0 60 9 341 28 137 Squash 10 0 50 3 156 33 107 Tomato 20 4 16 < 1 142 4 29 Offal: Liver, calf 20.0 19.0 < 9 < 9 42 < 9 < 9 Liver, chicken 12.0 7.0 < 9 < 9 24 < 9 13 Liver, ox 14.0 13.0 < 9 < 9 73 < 9 < 9 Liver, pig 19.0 15.0 < 9 < 9 22 < 9 11 Kidney, calf 23.0 11.0 < 9 < 9 16 < 9 10 Kidney, ox 43.0 10.0 14 < 9 153 10 19 Kidney, pig 32.0 3.0 43 < 6 217 18 111 Meat products: Pate, meat 10 0 52 14 213 34 79 Pork, flank, cooked 10 0 18 < 9 58 15 32 Pork, liver paste 10 0 26 9 84 16 50 Pork, mettwurst, smoked 11 0 47 13 144 26 117 Pork, saddle, smoked 10 3 < 9 < 9 < 9 < 9 < 9 Pork, sausage, frankfurter 13 0 88 < 9 524 39 215 Pork, sausage, saveloy 9 0 37 19 58 32 55 Sausage, chicken 11 1 39 < 9 154 21 105 Sausage, salami 10 1 14 < 9 40 14 20

99
Foodstuff (Ni)
Number
Number < LOD
Average
Minimum
Maximum
Median
0.90 quantile
Sausage, turkey 8 0 16 < 9 25 16 24 Meat: Beef 41 25 < 7 < 7 35 < 7 < 7 Chicken 30 16 < 7 < 7 44 < 7 < 7 Lamb 7 5 < 7 < 7 24 < 7 11 Mutton 2 1 < 7 < 7 < 7 < 7 < 7 Pork 43 34 < 7 < 7 65 < 7 < 7 Turkey 12 11 < 7 < 7 < 7 < 7 < 7 Veal 18 10 < 7 < 7 37 < 7 10 Fish: Cod 30 18 8 < 5 71 < 5 20 Cod liver 10 2 17 < 5 70 11 25 Eel 8 6 < 5 < 5 5 < 5 5 Flounder 22 13 7 < 5 36 < 5 16 Garfish 15 5 9 < 5 21 7 17 Herring 17 12 < 5 < 5 21 < 5 8 Mackerel 22 21 < 5 < 5 7 < 5 < 5 Mussel 15 0 197 80 506 145 375 Plaice 21 2 20 < 5 70 15 42 Shrimp 10 5 20 < 5 143 < 5 38 Tuna 12 10 14 < 5 143 < 5 9 Beverages: Apple juice 6 0 9 5 12 10 12 Beer, lager 15 0 9 2 58 4 4 Fruit juice 6 0 113 5 578 20 311 Orange juice 11 0 14 4 21 14 19 Red wine 15 0 21 11 30 22 26 Soft drinks 21 3 4 < 1 11 2 10 Water, carbonated 4 2 1 < 1 2 1 2 White wine 10 0 23 13 39 21 33 Dairy products: Blended spread 5 5 < 7 < 7 < 7 < 7 < 7 Butter 5 5 < 7 < 7 < 7 < 7 < 7 Cheese, brie 10 0 49 39 56 48 55 Cheese, firm, Danbo 10 0 67 57 76 67 75 Cocoa, instant 9 0 172 112 216 164 211 Cream, whipping 10 10 < 3 < 3 < 3 < 3 < 3 Ice cream, dairy 11 0 24 15 74 19 24 Milk, buttermilk 10 0 10 9 13 9 12 Milk, partly skimmed 10 0 7 6 8 7 7 Milk, skimmed 10 0 8 7 9 8 9

100
Foodstuff (Ni)
Number
Number < LOD
Average
Minimum
Maximum
Median
0.90 quantile
Milk, skimmed with chocolate 2 0 181 176 186 181 185 Milk, whole 10 0 10 5 13 10 11 Ymer 10 0 18 16 19 18 18 Yoghurt 11 0 12 7 16 13 15 Bread and cereals: Bread, white 10 7 < 60 < 60 176 < 60 112 Bread, white coarse grain 10 2 154 < 60 308 150 295 Bread, white roll 10 9 < 60 < 60 62 < 60 < 60 Bread, wholemeal 10 8 < 60 < 60 107 < 60 77 Breakfast cereal 10 2 392 < 60 1200 190 939 Corn flakes 10 7 < 60 < 60 156 < 60 129 Crispbread, rye 7 5 < 60 < 60 95 < 60 76 Crispbread, wheat 3 2 < 60 < 60 72 < 60 64 Oats, rolled 10 0 1411 380 1680 1195 2462 Pasta 10 0 94 67 124 99 116 Rice, polished 6 0 286 187 368 275 352 Rye bread 10 11 < 60 < 60 119 < 60 80 Rye bread, wholemeal 20 9 123 < 60 414 84 318 Rye flour, whole meal 10 3 68 < 60 105 69 99 Wheat flour 10 9 < 60 < 60 74 < 60 < 60

101
11.1.4 Contents of mercury (µg/kg fresh weight) in foods sampled, 1998-2003
Foodstuff (Hg)
Number
Number < LOD
Average
Minimum
Maximum
Median
0.90 quantile
Vegetables: Aubergines 10 10 < 0.2 < 0.2 < 0.2 < 0.2 < 0.2 Beans 9 9 < 0.2 < 0.2 < 0.2 < 0.2 < 0.2 Beetroots 10 10 < 0.4 < 0.4 < 0.4 < 0.4 < 0.4 Broccoli 10 10 < 0.2 < 0.2 < 0.2 < 0.2 < 0.2 Brussel sprouts 9 9 < 0.4 < 0.4 < 0.4 < 0.4 < 0.4 Cabbage 11 11 < 0.2 < 0.2 < 0.2 < 0.2 < 0.2 Carrots 39 22 < 0.2 < 0.2 0.5 < 0.2 0.4 Cauliflower 10 10 < 0.4 < 0.4 < 0.4 < 0.4 < 0.4 Celeriac 9 3 0.3 < 0.2 0.5 0.3 0.4 Celery 12 7 0.2 < 0.2 0.4 < 0.2 0.3 Chinese cabbage 10 10 < 0.2 < 0.2 < 0.2 < 0.2 < 0.2 Cucumber 10 10 < 0.2 < 0.2 < 0.2 < 0.2 < 0.2 Curly kale 15 0 5.4 1.9 11.1 4.7 9.2 Leeks 11 11 < 0.2 < 0.2 < 0.2 < 0.2 < 0.2 Lettuce 31 22 0.2 < 0.2 2.0 < 0.2 0.6 Mushrooms 10 0 3.6 1.3 10.5 2.6 7.0 Onions 20 19 < 0.2 < 0.2 0.6 < 0.2 < 0.2 Peas 10 10 < 0.4 < 0.4 < 0.4 < 0.4 < 0.4 Pepper 13 13 < 0.2 < 0.2 < 0.2 < 0.2 < 0.2 Potatoes 30 29 < 0.4 < 0.4 0.8 < 0.4 < 0.4 Rhubarb 8 8 < 0.2 < 0.2 < 0.2 < 0.2 < 0.2 Spinach 28 0 0.8 0.2 2.6 0.6 1.5 Squash 10 10 < 0.2 < 0.2 < 0.2 < 0.2 < 0.2 Tomato 20 20 < 0.2 < 0.2 < 0.2 < 0.2 < 0.2 Offal: Liver, calf 20 20 < 3.0 < 3.0 4.0 < 3.0 < 3.0 Liver, chicken 12 11 < 3.0 < 3.0 6.1 < 3.0 3.6 Liver, ox 14 14 < 3.0 < 3.0 3.5 < 3.0 < 3.0 Liver, pig 19 18 < 3.0 < 3.0 13.3 < 3.0 < 3.0 Kidney, calf 23 19 < 3.0 < 3.0 6.3 < 3.0 5.3 Kidney, ox 43 25 5.6 < 3.0 14.9 4.9 10.9 Kidney, pig 32 25 5.0 < 3.0 24.5 < 3.0 8.1 Meat products: Pate, meat 10 10 < 1.0 < 1.0 < 1.0 < 1.0 < 1.0 Pork, flank, cooked 10 10 < 1.0 < 1.0 < 1.0 < 1.0 < 1.0 Pork, liver paste 10 10 < 1.0 < 1.0 1.2 < 1.0 1.1 Pork, mettwurst, smoked 11 11 < 1.0 < 1.0 < 1.0 < 1.0 < 1.0 Pork, saddle, smoked 10 10 < 1.0 < 1.0 < 1.0 < 1.0 < 1.0 Pork, sausage, frankfurter 13 13 < 1.0 < 1.0 < 1.0 < 1.0 < 1.0 Pork, sausage, saveloy 9 9 < 1.0 < 1.0 < 1.0 < 1.0 < 1.0

102
Foodstuff (Hg)
Number
Number < LOD
Average
Minimum
Maximum
Median
0.90 quantile
Sausage, chicken 11 10 < 1.0 < 1.0 4.7 < 1.0 1.2 Sausage, salami 10 9 < 1.0 < 1.0 2.0 < 1.0 1.3 Sausage, turkey 8 8 < 1.0 < 1.0 < 1.0 < 1.0 < 1.0 Meat: Beef 41 41 < 2.0 < 2.0 < 2.0 < 2.0 < 2.0 Chicken 30 28 < 2.0 < 2.0 3.1 < 2.0 < 2.0 Lamb 7 7 < 2.0 < 2.0 < 2.0 < 2.0 < 2.0 Mutton 2 2 < 2.0 < 2.0 < 2.0 < 2.0 < 2.0 Pork 43 40 < 2.0 < 2.0 6.5 < 2.0 < 2.0 Turkey 12 12 < 2.0 < 2.0 < 2.0 < 2.0 < 2.0 Veal 18 18 < 2.0 < 2.0 < 2.0 < 2.0 < 2.0 Fish: Cod 30 0 57.9 21.1 160 48.9 94.7 Cod liver 10 1 17.2 < 2.6 47.9 13.1 41.7 Eel 8 0 178 20.5 488 94.8 459 Flounder 22 0 40.0 2.9 102 36.8 60.1 Garfish 15 0 71.6 29.9 184 55.9 130 Herring 18 0 41.2 18.1 77.1 34.6 64.5 Mackerel 22 0 34.1 22.2 44.7 34.2 42.2 Mussel 15 0 10.3 2.6 27.7 8.0 22.2 Plaice 21 0 35.3 2.9 80.4 28.7 72.4 Shrimp 10 0 20.0 5.9 57.7 13.9 36.3 Tuna 12 0 474 154 1900 218 968 Beverages: Apple juice 6 6 < 0.3 < 0.3 < 0.3 < 0.3 < 0.3 Beer, lager 15 15 < 0.3 < 0.3 < 0.3 < 0.3 < 0.3 Fruit juice 6 6 < 0.3 < 0.3 < 0.3 < 0.3 < 0.3 Orange juice 11 11 < 0.3 < 0.3 < 0.3 < 0.3 < 0.3 Red wine 15 15 < 0.3 < 0.3 < 0.3 < 0.3 < 0.3 Soft drinks 21 21 < 0.3 < 0.3 < 0.3 < 0.3 < 0.3 Water, carbonated 4 4 < 0.3 < 0.3 < 0.3 < 0.3 < 0.3 White wine 10 10 < 0.3 < 0.3 < 0.3 < 0.3 < 0.3 Dairy products: Blended spread 5 5 < 0.9 < 0.9 < 0.9 < 0.9 < 0.9 Butter 5 5 < 0.9 < 0.9 < 0.9 < 0.9 < 0.9 Cheese, brie 10 0.4 < 0.4 < 0.4 < 0.4 < 0.4 < 0.4 Cheese, firm, Danbo 10 10 < 0.5 < 0.5 < 0.5 < 0.5 < 0.5 Cocoa, instant 9 0 0.4 0.1 1.3 0.4 0.6 Cream, whipping 10 10 < 0.4 < 0.4 < 0.4 < 0.4 < 0.4 Ice cream, dairy 11 11 < 0.4 < 0.4 < 0.4 < 0.4 < 0.4 Milk, buttermilk 10 7 < 0.1 < 0.1 0.2 < 0.1 0.1 Milk, partly skimmed 10 10 < 0.1 < 0.1 < 0.1 < 0.1 < 0.1

103
Foodstuff (Hg)
Number
Number < LOD
Average
Minimum
Maximum
Median
0.90 quantile
Milk, skimmed 10 9 < 0.1 < 0.1 0.1 < 0.1 < 0.1 Milk, skimmed with chocolate 2 0 0.3 0.3 0.3 0.3 0.3 Milk, whole 10 10 < 0.1 < 0.1 < 0.1 < 0.1 < 0.1 Ymer 10 5 0.1 < 0.1 0.3 < 0.1 0.1 Yoghurt 11 10 < 0.1 < 0.1 0.1 < 0.1 < 0.1

104
11.1.5 Contents of selenium (µg/kg fresh weight) in foods sampled, 1998-2003
Foodstuff (Se)
Number
Number < LOD
Average
Minimum
Maximum
Median
0.90 quantile
Vegetables: Aubergines 10 5 0.7 < 0.4 1.7 0.5 1.4 Beans 9 1 3.9 < 0.4 7.2 4.5 7.0 Beetroots 10 6 < 0.8 < 0.8 1.4 < 0.8 1.2 Broccoli 10 1 7.1 0.4 20.2 6.0 14.3 Brussel sprouts 9 0 25.5 6.0 54.2 29.1 48.5 Cabbage 11 2 5.1 < 0.4 29.3 2.5 5.7 Carrots 39 10 2.5 < 0.4 13.0 1.2 7.8 Cauliflower 10 1 22.8 < 0.8 166.0 6.1 31.9 Celeriac 9 1 4.3 0.4 12.0 2.5 7.6 Celery 12 4 2.1 < 0.4 7.2 2.4 3.5 Chinese cabbage 10 4 2.5 < 0.4 14.1 1.0 5.3 Cucumber 10 7 < 0.4 < 0.4 1.9 < 0.4 0.8 Curly kale 15 4 29.6 < 0.8 95.5 15.4 83.8 Leeks 11 1 7.0 < 0.4 23.6 3.5 20.7 Lettuce 31 17 1.1 < 0.4 7.3 < 0.4 2.8 Mushrooms 10 0 129 35.4 473 92.7 181 Onions 20 2 7.2 < 0.4 49.7 2.0 21.1 Peas 10 0 8.9 4.0 24.0 6.4 14.1 Pepper 13 6 5.0 < 0.4 53.9 0.7 2.7 Potatoes 30 9 1.4 < 0.8 3.4 1.1 2.8 Rhubarb 8 8 < 0.4 < 0.4 < 0.4 < 0.4 < 0.4 Spinach 28 2 6.0 < 0.4 88.8 1.1 11.2 Squash 10 4 1.4 < 0.4 4.1 1.2 2.9 Tomato 20 8 2.7 < 0.4 22.7 0.9 5.8 Offal: Liver, calf 20 0 367 62 1050 307 572 Liver, chicken 12 0 461 315 538 469 514 Liver, ox 14 0 337 119 717 322 501 Liver, pig 19 0 457 371 618 449 559 Kidney, calf 23 0 1229 767 1600 1220 1457 Kidney, ox 43 0 1135 391 1530 1140 1427 Kidney, pig 32 0 1639 1150 2326 1610 1938 Meat products: Pate, meat 10 0 188 118 294 145 290 Pork, flank, cooked 10 0 104 66.0 141 105 137 Pork, liver paste 10 0 196 161 220 196 212 Pork, mettwurst, smoked 11 0 74.4 52.0 93.0 80.0 93.0 Pork, saddle, smoked 10 0 116 82.0 164 113 144 Pork, sausage, frankfurter 13 0 71.1 57.0 93.0 71.0 76.8 Pork, sausage, saveloy 9 0 66.9 58.0 82.0 65.0 76.4 Sausage, chicken 11 0 103 63.0 203 99.0 121

105
Foodstuff (Se)
Number
Number < LOD
Average
Minimum
Maximum
Median
0.90 quantile
Sausage, salami 10 0 94.7 75.0 113 96.0 109 Sausage, turkey 8 0 78.1 61.0 88.0 82.0 85.9 Meat: Beef 41 0 101 61.0 161 99.4 130 Chicken 30 0 94.6 64.0 149 94.4 107 Lamb 7 0 23.6 12.0 37.0 23.0 31.0 Mutton 2 0 22.5 21.0 24.0 22.5 23.7 Pork 43 0 126 95.3 259 123 138 Turkey 12 0 89.0 32.7 137 95.6 126 Veal 18 0 76.4 13.0 106 81.1 99.1 Fish: Cod 30 0 269 167 377 272 339 Cod liver 10 0 635 296 1742 539 811 Eel 8 0 335 238 677 295 473 Flounder 22 0 233 170 358 230 324 Garfish 15 0 262 222 297 258 296 Herring 18 0 331 218 535 292 501 Mussel 15 0 294 158 565 293 393 Mackerel 22 0 250 201 375 245 292 Plaice 21 0 325 177 1223 302 394 Shrimp 10 0 187 134 237 179 222 Tuna 12 0 772 488 1141 791 1040 Beverages: Apple juice 6 4 0.3 < 0.3 0.6 < 0.3 0.6 Beer, lager 15 2 1.2 < 0.3 2.5 1.3 2.5 Fruit juice 6 3 1.7 < 0.3 9.5 < 0.3 5.0 Orange juice 11 4 0.4 < 0.3 0.8 0.4 0.7 Red wine 15 3 0.7 < 0.3 2.2 0.6 1.5 Soft drinks 21 16 0.4 < 0.3 2.8 < 0.3 1.9 Water, carbonated 4 1 0.5 < 0.3 1.0 0.5 0.8 White wine 10 4 0.4 < 0.3 1.3 0.3 0.9 Dairy products: Blended spread 5 5 < 8.0 < 8.0 < 8.0 < 8.0 < 8.0 Butter 5 5 < 8.0 < 8.0 < 8.0 < 8.0 < 8.0 Cheese, brie 10 0 58.4 5.7 105 50.7 94.7 Cheese, firm, Danbo 10 0 87.5 69.1 94.8 90.3 94.8 Cocoa, instant 9 0 13.9 11.8 15.3 13.6 15.1 Cream, whipping 10 0 12.9 10.1 16.0 12.7 15.6 Ice cream, dairy 11 2 8.4 < 4.0 16.0 7.9 12.1 Milk, buttermilk 10 0 15.2 11.8 17.0 15.7 16.6 Milk, partly skimmed 10 0 15.4 11.3 20.1 15.0 19.4

106
Foodstuff (Se)
Number
Number < LOD
Average
Minimum
Maximum
Median
0.90 quantile
Milk, skimmed 10 0 16.6 14.0 19.3 16.4 19.0 Milk, skimmed with chocolate 2 0 13.1 12.1 14.1 13.1 13.9 Milk, whole 10 0 16.1 12.8 19.0 15.9 18.3 Ymer 10 0 26.2 23.2 28.4 26.8 27.8 Yoghurt 11 0 18.3 15.5 20.2 18.9 19.7 Bread and cereals: Bread, white 10 5 44.3 < 40 98 44 75.5 Bread, white coarse grain 10 4 56.7 < 40 154 55 112.6 Bread, white roll 10 2 61.8 < 40 99 63 87.3 Bread, wholemeal 10 9 < 40 < 40 41 < 40 < 40 Breakfast cereal 10 1 85.1 < 40 207 71 151.2 Corn flakes 10 5 49.5 < 40 96 49.5 80.7 Crispbread, rye 7 5 < 40 < 40 101 < 40 69.8 Crispbread, wheat 3 3 < 40 < 40 < 40 < 40 < 40 Oats, rolled 10 2 49.7 < 40 208 51 88.8 Pasta 10 2 63.7 < 40 208 52 97.3 Rice, polished 6 2 87 < 40 149 87.5 147.5 Rye bread 10 7 < 40 < 40 54 < 40 < 40 Rye bread, wholemeal 20 19 < 40 < 40 113 < 40 < 62.2 Rye flour, whole meal 10 8 < 40 < 40 50 < 40 43.7 Wheat flour 10 9 < 40 < 40 52 < 40 < 40

107
11.1.6 Contents of arsenic (µg/kg fresh weight) in foods sampled, 1998-2003 Foodstuff (As)
Number
Number < LOD
Average
Minimum
Maximum
Median
0.90 quantile
Vegetables: Aubergines 10 4 2.2 < 0.4 8.5 0.5 6.8 Beans 9 1 1.5 < 0.4 2.7 1.3 2.6 Beetroots 10 4 1.1 < 0.7 2.7 0.9 2.0 Broccoli 10 0 1.9 0.7 4.2 1.0 3.8 Brussel sprouts 9 0 4.8 1.1 8.9 4.9 7.6 Cabbage 11 1 0.9 < 0.4 3.1 0.7 1.2 Carrots 39 0 2.6 0.7 6.3 2.2 4.9 Cauliflower 10 2 2.0 < 0.7 5.8 1.4 4.2 Celeriac 9 0 2.7 0.6 7.3 2.1 4.4 Celery 12 0 2.8 1.3 6.8 2.3 4.1 Chinese cabbage 10 0 2.2 0.6 4.3 1.6 3.9 Cucumber 10 3 2.0 < 0.4 6.1 0.9 5.0 Curly kale 15 0 5.0 2.1 8.2 5.1 7.4 Leeks 11 0 2.1 0.7 4.8 1.7 3.6 Lettuce 31 1 3.8 < 0.4 16.1 2.3 9.4 Mushrooms 10 0 20.1 9.0 38.9 17.5 30.4 Onions 20 0 5.5 0.8 28.6 2.7 11.1 Peas 10 1 1.6 < 0.7 2.8 1.4 2.7 Pepper 13 5 0.7 < 0.4 2.3 0.5 1.4 Potatoes 30 14 1.4 < 0.7 10.5 1.0 2.7 Rhubarb 8 0 1.9 0.7 5.3 1.4 3.4 Spinach 28 0 8.1 1.5 24.1 6.2 17.9 Squash 10 3 1.5 < 0.4 5.4 0.8 3.4 Tomato 20 9 0.5 < 0.4 1.0 0.4 0.9 Offal: Liver, calf 20 1 19.0 < 4.0 112 13.0 26.8 Liver, chicken 12 1 22.7 5.7 62.1 19.5 40.4 Liver, ox 14 2 12.8 4.2 32.0 11.5 22.1 Liver, pig 19 0 14.5 6.0 23.0 14.0 22.2 Kidney, calf 23 0 43.1 14.0 63.3 49.0 61.5 Kidney, ox 43 0 47.2 14.0 136 46.0 63.3 Kidney, pig 32 0 34.0 13.0 79.6 35.0 61.3 Meat products: Pate, meat 10 0 13.3 8.5 19.0 13.0 17.2 Pork, flank, cooked 10 0 7.7 3.4 13.0 7.1 11.2 Pork, liver paste 10 0 12.6 11.0 15.0 12.0 15.0 Pork, mettwurst, smoked 11 1 6.4 < 3.0 11.0 6.5 9.7 Pork, saddle, smoked 10 0 7.0 4.3 12.0 6.8 8.5 Pork, sausage, frankfurter 13 0 5.4 < 3.0 11.0 4.8 8.7 Pork, sausage, saveloy 9 0 8.0 4.5 12.0 7.8 11.2 Sausage, chicken 11 0 56.1 7.3 261 18.0 206

108
Foodstuff (As)
Number
Number < LOD
Average
Minimum
Maximum
Median
0.90 quantile
Sausage, salami 10 0 7.2 4.5 11.0 6.6 9.8 Sausage, turkey 8 0 9.9 4.8 16.0 9.7 14.6 Meat: Beef 41 3 5.1 < 5.0 14.0 < 5.0 8.3 Chicken 30 1 14.2 < 5.0 61.4 9.2 31.2 Lamb 7 5 < 5.0 < 5.0 < 5.0 < 5.0 < 5.0 Mutton 2 2 < 5.0 < 5.0 < 5.0 < 5.0 < 5.0 Pork 43 3 7.1 < 5.0 81.1 < 5.0 8.1 Turkey 12 1 5.5 < 5.0 11.0 5.8 7.3 Veal 18 3 < 5.0 < 5.0 8.0 5.1 6.4 Fish: Cod 30 0 2409 316 12179 1931 4619 Cod liver 10 0 2773 1565 4003 2673 3830 Eel 8 0 477 243 654 505 608 Flounder 22 0 2000 197 6667 1061 4520 Garfish 15 0 352 120 771 343 476 Herring 18 0 1514 334 2648 1470 1999 Mackerel 22 0 2027 1458 2612 2084 2435 Mussel 15 0 1077 413 2024 972 1858 Plaice 21 0 10708 3268 23989 8569 19807 Shrimp 10 0 4099 271 20924 2555 5554 Tuna 12 0 1179 677 2327 1132 1453 Beverages: Apple juice 6 5 2.1 < 2.0 6.3 < 2.0 4.0 Beer, lager 15 6 4.2 < 2.0 10.0 3.5 6.0 Fruit juice 6 2 9.3 < 2.0 43.8 2.4 24.3 Orange juice 11 5 3.4 < 2.0 12.0 2.0 9.3 Red wine 15 3 4.4 < 2.0 14.0 2.7 9.7 Soft drinks 21 19 < 2.0 < 2.0 2.3 < 2.0 < 2.0 Water, carbonated 4 3 3.5 < 2.0 8.9 < 2.0 6.8 White wine 10 0 8.7 2.8 21.3 7.7 12.9 Dairy products: Blended spread 5 5 < 8.0 < 8.0 < 8.0 < 8.0 < 8.0 Butter 5 5 < 8.0 < 8.0 < 8.0 < 8.0 < 8.0 Cheese, brie 10 5 7.4 < 4.0 13.9 6.3 13.9 Cheese, firm, Danbo 10 2 6.6 < 5.0 9.9 6.2 9.2 Cocoa, instant 9 3 1.1 < 1.0 1.5 1.2 1.5 Cream, whipping 10 9 < 4.0 < 4.0 4.2 < 4.0 < 4.0 Ice cream, dairy 11 6 < 3.0 < 3.0 5.5 < 3.0 4.9 Milk, buttermilk 10 2 0.8 < 0.7 1.2 0.8 1.1 Milk, partly skimmed 10 2 1.4 < 0.8 2.9 1.1 2.6 Milk, skimmed 10 0 1.1 0.9 1.4 1.0 1.4 Milk, skimmed with chocolate 2 1 1.1 < 1.0 1.4 1.1 1.3 Milk, whole 10 1 1.6 < 0.9 2.1 1.7 2.0

109
Foodstuff (As)
Number
Number < LOD
Average
Minimum
Maximum
Median
0.90 quantile
Ymer 10 2 1.4 < 1.0 1.7 1.5 1.7 Yoghurt 11 4 1.1 < 1.0 1.9 1.1 1.6

110
11.2 Appendix to Nitrate
11.2.1 Nitrate content (mg/kg fresh weight) in vegetables from 1998, 1999, 2000 and 2001
Year and type of vegetable
No. samples
Minimum(mg/kg)
Maximum(mg/kg)
Mean (mg/kg)
Median (mg/kg)
90th perc.(mg/kg)
1998 Head lettuce, greenhouse (Danish) Head lettuce, open air (Danish) Head lettuce, foreign Iceberg, Danish Iceberg, foreign Spinach, fresh Danish Spinach, frozen Danish Spinach, foreign Potatoes, Danish Potatoes, foreign
78
7 25 33 20 8 6 7 50 25
747
784 16 93
316 908 13 24 7 62
4484
2828 3063 2525 1544 3158 1323 1817 311 498
2734
1711 1311 1092 1012 1777 871 927 116 210
2644
1694 1524 1031 1024 1406 946 958 106 187
4092
2828 2680 1750 1497 3158 1323 1817 229 365
1999 Head lettuce, greenhouse (Danish) Head lettuce, open air (Danish) Head lettuce, foreign Iceberg, Danish Iceberg, foreign Spinach, fresh Danish Spinach, frozen Danish Spinach, foreign Potatoes, Danish Potatoes, foreign
73 10
20 18 20 12 9 3 69 30
835 193
34
192 422 106 83
808 <5 26
4255 2480
3104 1822 3074 2425 1665 1964 305 592
2667 1291
1586 873 960 1294 1028 1073
76 179
2609 1197
1567 864 780 1171 1213 1073
68 152
3863 2222
2660 1354 1573 2425 1665 1964 154 367
2000 Head lettuce, greenhouse (Danish) Head lettuce, foreign Iceberg, Danish Iceberg, foreign Spinach, Danish, fresh Spinach, Danish, frozen Spinach, foreign Potatoes, Danish Potatoes, foreign Rucola
63 24 5 38 3 5 9 74 2 1
1000
29 420
0 610 315 315 17
150 6100
5800 4450 930 1750 3800 1190 1100 415 250 6100
2793 2230 626 928 1680 828 718 112 200 6100
2600 2275 560 943 630 875 690 105 200 6100
4300 4450 930 1400 3800 1190 1100 185 250 6100
2001 Head lettuce, Danish (greenhouse) Head lettuce, foreign Iceberg, Danish Iceberg, foreign Spinach, Danish fresh Spinach, foreign Spinach, frozen (D+F) Potatoes, Danish Potatoes, new, Danish Potatoes, foreign
39
10 3 21 15 10 8 39 4 15
69
1100 577 430 440 140 140 11 4 33
4053
2800 960 1000 3767 2000 1700 350 220 250
2379
1678 789 745 1676 1011 889 106 127 108
2400
1600 830 750 1500 920 820 93
108 100
3800
2800 960 1000 3200 1850 1700 205 220 160
111
11.2.2 Nitrate content (mg/kg fresh weight) in vegetables from 2002 and 2003 Year and type of vege-table
Number of sam-
ples
Minimum (mg/kg)
Maximum(mg/kg)
Mean (mg/kg)
Median (mg/kg)
90th percentile (mg/kg)
2002 Head lettuce, green-house (Danish) Head lettuce, open air (Danish) Head lettuce, foreign Iceberg, Danish Iceberg, foreign Spinach, Danish Spinach, foreign Potato, Danish Potato, Danish, new Beetroot, Danish Ruccola Fennel, Danish Fennel, foreign Celery, Danish Celery, foreign Baby food
79
3
10 8
15 22 6
90 4
28 11 2 9
21 7
14
95
360
1200 230 260 140 690 13 <5 96 660 905 140
7 60 <5
5100
1500
3300 2300 1400 3800 2500 380 44
4300 8000 1100 1300 675 220 24
2324
1020
2463 833 736
1493 1570 120 17
1400 5276 1002 756 254 190
9
2300
1200
2600 650 780 1400 1450 110 11
1150 5300 1003 810 220 190 13
3400
1500
3050 2300 1100 2767 2500 190 44
2900 7060 1100 1300 580 220 19
2003 Head lettuce, green-house (Danish) Head lettuce, open air (Danish) Head lettuce, foreign Iceberg, Danish Iceberg, foreign Spinach, Danish fresh Spinach, foreign Potato, Danish Chinese cabbage (Danish) Beetroot, Danish Rucola Fennel, Danish Fennel, foreign Celery, Danish Celery, foreign Baby food
47
1 9
10 9
20 4
55 23
20 13 2 9
17 5
17
520
1000
1100 290 480 110 360 15 270
220
1700 905 140 <5 80 <5
3900
1000
1800 1000 1400 3900 2800 280
1900
4900 7800 1100 1300 940 850 120
2545
1000
4733 748 953
1779 1357 105 869
1648 5399 1002 756 279 518 34
2700
1000
5850 830 1000 1900 1135
88 800
1250 5850 1002 810 170 560 21
3600
1000
7800 990
1400 2996 2800 220
1300
3850 7000 1100 1300 610 850 110

112
11.3 Appendix to Organic environmental contaminants
11.3.1 Number of samples of different foods for OCPs and indicator PCB Foodstuff 1998
Number of sam-
ples
1999 Number of sam-
ples
2000 Number of sam-
ples
2001 Number of sam-
ples
2002 Number of sam-
ples
2003 Number of sam-
ples
1998-2003
Samples, total
Poultry fat 34 60 63 45 45 45 292 Beef fat 153 60 50 41 41 40 385 Pork fat 121 160 152 150 150 151 884 Lamb fat 4 10 9 6 5 3 37 Fats, composite 2 9 3 6 20 Milk products 90 45 44 48 72 299 Cheese 80 31 30 34 31 203 Butter 123 10 14 157 Mixed butter fat 9 9 Eggs 25 35 60 55 50 55 280 Cod 10 10 Eel farmed 40 40 10 20 10 10 130 Garfish 5 5 Greenland hal-ibuts
9 9
Herring 10 18 28 Herring, pickled 10 10 Herring, smoked 12 12 Lumpsucker 4 7 11 Mackerel 6 14 20 Mackerel, smoked 18 18 Mackerel, tinned in tomato
6 6
Plaice 10 10 Rainbow trout, farmed
40 22 35 75 51 50 273
Salmon 11 9 20 Swordfish 6 6 Trout, marine farmed
18 19 20 10 10 77
Cod liver 22 16 25 23 25 111 Herring 60 30 38 44 47 219 Fish oil 21 21 Cod liver oil 9 9

113
*11.3.2 Number of samples of different foods analysed for dioxins and PCB,
1998-2003 Foodstuff 2000
Number of samples
2001 Number of samples
2002 Number of samples
2003 Number of samples
2000-2003 Samples,
total Poultry fat 5 5 5 29 44 Beef fat 5 5 5 10 25 Pork fat 5 5 5 10 25 Sheep - 5 5 10 20 Hens eggs 5 5 10 3 23 Cows milk 5 5 5 4 19 Dairy products - 10 - - 10 Farmed trout 5 - 5 10 20 Wild fish 5 - 20 15 40 Fish oil supplements 5 - - - 5 *Dioxins were incorporated in the monitoring programme from the year 2000. The analytical method includes dioxins, dioxin-like PCB and non dioxin-like PCB.
11.3.3 Number of human samples analysed for dioxins, PCB and chlorinated
pesticides, 1998-2003 Type of human sample 1999
Number of samples
2002 Number of samples
1998-2003 Samples,
total Human milk 19 19 38

114
11.3.4 Tables of contents for alpha-HCH
Foodstuff Number of samples
Samples >d.* Mean** Median 90% fractile Maximum
mg/kg*** mg/kg*** mg/kg*** mg/kg*** Chicken fat 197 6 0.0004 <d. <d. 0.004 Turkey fat 85 1 0.0003 <d. <d. 0.002 Duck fat 5 0 Other poultry fat 4 0 Beef fat 385 0 Pork fat 884 3 0.0004 <d. <d. 0.020 Lamb sheep fat 37 0 Animal fats, other 20 0 Milk, Danish 248 5 0.0003 <d. <d. 0.001 Milk, foreign 41 0 Cheese, Danish 40 0 Cheese, foreign 166 5 0.0005 <d. <d. 0.003 Butter, Danish 126 0 Butter, foreign 22 0 Butter fat, mixed 10 0 Eggs 280 0 Cod, raw 10 0 Eel, farmed, raw 130 121 0.002 0.002 0.003 0.003 Garfish, raw 5 0 Greenland halibut, raw 7 6 0.001 0.001 0.002 0.002 Herring, raw 26 15 0.0004 0.0003 0.001 0.001 Herring, pickled 11 11 0.0006 0.001 0.001 0.001 Herring, smoked 12 12 0.0004 0.0003 0.001 0.001 Lumpsucker, raw 11 7 0.001 0.001 0.002 0.002 Mackerel, raw 20 15 0.0006 0.001 0.001 0.001 Mackerel, smoked 18 18 0.0008 0.001 0.001 0.002 Mackerel, tinned in tomato 6 5 0.0002 0.0002 0.000 0.0004 Plaice, raw 10 0 Rainbow trout, farmed, raw 273 20 0.0004 <d. <d. 0.0003 Salmon, raw 20 2 0.0004 <d. 0.000 0.001 Swordfish, raw 6 0 Trout, marine farmed, raw 77 25 0.0007 <d. 0.001 0.001 Fish oil 21 3 0.002 <d. 0.007 0.009 Cod liver oil 9 4 0.005 <d. 0.009 0.015 Herring: 219 90 0.0007 <d. 0.001 0.002 The Baltic Sea 37 19 0.0008 0.0003 0.002 0.002 The Sound 34 18 0.0009 0.001 0.002 0.002 The Belts 38 15 0.0006 <d. 0.001 0.001 The Kattegat 34 8 0.0006 <d. 0.0006 0.001 The Skagerrak 40 13 0.0007 <d. 0.0010 0.001 The North Sea 36 17 0.0007 <d. 0.0010 0.002 Cod liver: 111 77 0.002 0.001 0.006 0.010 The Baltic Sea 19 18 0.004 0.004 0.007 0.009 The Sound 22 17 0.004 0.002 0.010 0.010 The Belts 21 18 0.002 0.001 0.003 0.005 The Kattegat 14 9 0.001 0.001 0.004 0.004 The Skagerrak 19 9 0.002 <d. 0.003 0.005 The North Sea 16 6 0.001 <d. 0.002 0.002 *d.=limit of detection. The limit of detection varies during the monitoring period; see Appendix 11.3.31 ** mean is calculated including 1/3*d. for values below the detection limit. *** mg/kg fish and egg and mg/kg fat for the rest of the foods.

115
11.3.5 Tables of contents for beta-HCH
Foodstuff Number of samples
Samples >d.* Mean** Median 90% fractile Maximum
mg/kg*** mg/kg*** mg/kg*** mg/kg*** Chicken fat 197 2 0.0003 <d. <d. 0.002 Turkey fat 85 0 Duck fat 5 0 Other poultry fat 4 0 Beef fat 385 5 0.0003 <d. <d. 0.005 Pork fat 884 0 Lamb sheep fat 37 0 Animal fats, other 20 2 0.0004 <d. 0.0002 0.002 Milk, Danish 248 0 Milk, foreign 41 0 Cheese, Danish 40 0 Cheese, foreign 166 11 0.0004 <d. <d. 0.005 Butter, Danish 126 0 Butter, foreign 22 1 0.0003 <d. <d. 0.001 Butter fat, mixed 10 0 Eggs 280 0 Cod, raw 10 0 Eel, farmed, raw 130 111 0.0021 0.002 0.003 0.005 Garfish, raw 5 0 Greenland halibut, raw 7 0 Herring, raw 26 8 0.0005 <d. 0.001 0.001 Herring, pickled 11 8 0.0005 0.0004 0.0006 0.001 Herring, smoked 12 4 0.0005 <d. 0.001 0.001 Lumpsucker, raw 11 7 0.0008 0.001 0.001 0.002 Mackerel, raw 20 0 Mackerel, smoked 18 0 Mackerel, tinned in tomato 6 2 0.0003 <d. 0.0003 0.0004 Plaice, raw 10 0 Rainbow trout, farmed, raw 273 7 0.0004 <d. <d. 0.0004 Salmon, raw 20 2 0.0005 <d. 0.0001 0.004 Swordfish, raw 6 0 Trout, marine farmed, raw 77 25 0.0006 <d. 0.001 0.002 Fish oil 21 2 0.0017 <d. <d. 0.009 Cod liver oil 9 0 Herring: 219 58 0.0007 <d. 0.001 0.004 The Baltic Sea 37 24 0.0010 0.001 0.002 0.003 The Sound 34 4 0.0005 <d. 0.001 0.001 The Belts 38 18 0.0008 <d. 0.002 0.004 The Kattegat 34 6 0.0005 <d. 0.0004 0.001 The Skagerrak 40 3 0.0005 <d. <d. 0.001 The North Sea 36 3 0.0005 <d. <d. 0.002 Cod liver: 111 56 0.003 0.000 0.007 0.022 The Baltic Sea 19 16 0.006 0.006 0.010 0.013 The Sound 22 15 0.004 0.002 0.007 0.022 The Belts 21 20 0.003 0.002 0.005 0.005 The Kattegat 14 3 0.001 <d. 0.002 0.003 The Skagerrak 19 1 0.001 <d. <d. 0.001 The North Sea 16 1 0.001 <d. <d. 0.001 *d.=limit of detection. The limit of detection varies during the monitoring period; see Appendix 11.3.31 ** mean is calculated including 1/3*d. for values below the detection limit. *** mg/kg fish and egg and mg/kg fat for the rest of the foods.

116
11.3.6 Tables of contents for chlordan-sum
Foodstuff Number of samples
Samples >d.* Mean** Median 90% fractile Maximum
mg/kg*** mg/kg*** mg/kg*** mg/kg*** Chicken fat 197 4 0.0011 <d. <d. 0.0045 Turkey fat 85 0 Duck fat 5 0 Other poultry fat 4 0 Beef fat 385 1 0.0011 <d. <d. 0.0020 Pork fat 884 1 0.0010 <d. <d. 0.0020 Lamb sheep fat 37 1 0.0012 <d. <d. 0.0024 Animal fats, other 20 0 Milk, Danish 248 0 Milk, foreign 41 0 Cheese, Danish 40 1 0.0017 <d. <d. 0.0190 Cheese, foreign 166 4 0.0012 <d. <d. 0.0060 Butter, Danish 126 0 Butter, foreign 22 0 Butter fat, mixed 10 0 Eggs 280 0 Cod, raw 10 0 Eel, farmed, raw 130 126 0.0093 0.008 0.015 0.0256 Garfish, raw 5 0 Greenland halibut, raw 7 7 0.0136 0.011 0.022 0.0320 Herring, raw 26 18 0.0021 0.001 0.002 0.0048 Herring, pickled 11 11 0.0067 0.007 0.008 0.0099 Herring, smoked 12 12 0.0027 0.002 0.003 0.0047 Lumpsucker, raw 11 11 0.0094 0.009 0.015 0.0170 Mackerel, raw 20 17 0.0016 0.002 0.003 0.0032 Mackerel, smoked 18 17 0.0027 0.002 0.004 0.0042 Mackerel, tinned in tomato 6 6 0.0012 0.001 0.001 0.0006 Plaice, raw 10 0 Rainbow trout, farmed, raw 273 147 0.0020 0.001 0.002 0.0070 Salmon, raw 20 12 0.0048 0.004 0.010 0.0130 Swordfish, raw 6 1 0.0010 <d. 0.001 0.0010 Trout, marine farmed, raw 77 60 0.0034 0.002 0.005 0.0080 Fish oil 21 5 0.0248 <d. 0.105 0.2000 Cod liver oil 9 9 0.0931 0.059 0.194 0.2010 Herring: 219 130 0.0031 0.001 0.003 0.0218 The Baltic Sea 37 24 0.0032 0.002 0.004 0.0055 The Sound 34 18 0.0030 0.001 0.004 0.0053 The Belts 38 20 0.0027 0.001 0.003 0.0040 The Kattegat 34 17 0.0029 <d. 0.003 0.0054 The Skagerrak 40 21 0.0031 <d. 0.002 0.0180 The North Sea 36 22 0.0028 0.001 0.002 0.0040 Cod liver: 111 108 0.0272 0.020 0.060 0.1210 The Baltic Sea 19 18 0.0426 0.039 0.066 0.1210 The Sound 22 21 0.0287 0.019 0.068 0.0810 The Belts 21 21 0.0219 0.016 0.052 0.0730 The Kattegat 14 14 0.0212 0.023 0.031 0.0360 The Skagerrak 19 19 0.0210 0.017 0.033 0.0900 The North Sea 16 16 0.0282 0.023 0.060 0.0630 *d.=limit of detection. The limit of detection varies during the monitoring period; see Appendix 11.3.31 ** mean is calculated including 1/3*d. for values below the detection limit. *** mg/kg fish and egg and mg/kg fat for the rest of the foods.

117
11.3.7 Tables of contents for DDT-sum
Foodstuff Number of samples
Samples >d.* Mean** Median 90% fractile Maximum
mg/kg*** mg/kg*** mg/kg*** mg/kg*** Chicken fat 197 97 0.002 <d. 0.004 0.017 Turkey fat 85 85 0.002 0.001 0.004 0.015 Duck fat 5 1 0.002 <d. 0.004 0.007 Other poultry fat 4 2 0.015 0.008 0.036 0.045 Beef fat 385 285 0.003 0.002 0.007 0.025 Pork fat 884 705 0.003 0.002 0.005 0.099 Lamb sheep fat 37 36 0.006 0.004 0.008 0.075 Animal fats, other 20 12 0.003 0.001 0.007 0.028 Milk, Danish 248 203 0.003 0.002 0.005 0.171 Milk, foreign 41 34 0.003 0.003 0.005 0.009 Cheese, Danish 40 33 0.003 0.003 0.007 0.015 Cheese, foreign 166 131 0.004 0.002 0.008 0.068 Butter, Danish 126 26 0.002 <d. 0.003 0.058 Butter, foreign 22 14 0.011 0.001 0.027 0.068 Butter fat, mixed 10 2 0.001 <d. 0.002 0.003 Eggs 280 29 0.001 <d. 0.001 0.010 Cod, raw 10 3 0.001 <d. 0.001 0.002 Eel, farmed, raw 130 130 0.061 0.061 0.086 0.175 Garfish, raw 5 5 0.005 0.002 0.011 0.015 Greenland halibut, raw 7 7 0.015 0.011 0.029 0.029 Herring, raw 26 26 0.008 0.007 0.014 0.017 Herring, pickled 11 11 0.011 0.012 0.016 0.017 Herring, smoked 12 12 0.007 0.006 0.011 0.012 Lumpsucker, raw 11 11 0.015 0.014 0.021 0.022 Mackerel, raw 20 20 0.004 0.004 0.005 0.006 Mackerel, smoked 18 18 0.005 0.004 0.010 0.012 Mackerel, tinned in tomato 6 6 0.002 0.001 0.002 0.003 Plaice, raw 10 0 Rainbow trout, farmed, raw 273 272 0.005 0.004 0.008 0.028 Salmon, raw 20 18 0.015 0.012 0.029 0.071 Swordfish, raw 6 6 0.009 0.009 0.018 0.022 Trout, marine farmed, raw 77 77 0.013 0.011 0.020 0.049 Fish oil 21 10 0.04 <d. 0.24 0.30 Cod liver oil 9 9 0.20 0.28 0.32 0.36 Herring: 219 219 0.014 0.011 0.027 0.098 The Baltic Sea 37 37 0.027 0.023 0.047 0.098 The Sound 34 34 0.015 0.013 0.027 0.039 The Belts 38 38 0.015 0.014 0.025 0.031 The Kattegat 34 34 0.009 0.010 0.015 0.019 The Skagerrak 40 40 0.009 0.008 0.015 0.057 The North Sea 36 36 0.007 0.005 0.012 0.022 Cod liver: 111 111 0.260 0.141 0.629 1.599 The Baltic Sea 19 19 0.599 0.629 0.831 1.579 The Sound 22 22 0.282 0.223 0.474 0.885 The Belts 21 21 0.274 0.141 0.607 1.599 The Kattegat 14 14 0.144 0.126 0.227 0.353 The Skagerrak 19 19 0.108 0.096 0.192 0.314 The North Sea 16 16 0.092 0.085 0.122 0.176 *d.=limit of detection. The limit of detection varies during the monitoring period; see Appendix 11.3.31 ** mean is calculated including 1/3*d. for values below the detection limit. *** mg/kg fish and egg and mg/kg fat for the rest of the foods.

118
11.3.8 Tables of contents for Endosulfan A
Foodstuff Number of samples
Samples >d.* Mean** Median 90% fractile Maximum
mg/kg*** mg/kg*** mg/kg*** mg/kg*** Chicken fat 197 0 Turkey fat 85 0 Duck fat 5 0 Other poultry fat 4 0 Beef fat 385 0 Pork fat 884 0 Lamb sheep fat 37 0 Animal fats, other 20 0 Milk, Danish 248 1 0.0008 <d. <d. 0.003 Milk, foreign 41 0 Cheese, Danish 40 0 Cheese, foreign 166 0 Butter, Danish 126 0 Butter, foreign 22 0 Butter fat, mixed 10 0 Eggs 280 0 Cod, raw 10 0 Eel, farmed, raw 130 7 0.0007 <d. <d. 0.002 Garfish, raw 5 0 Greenland halibut, raw 7 0 Herring, raw 26 0 Herring, pickled 11 0 Herring, smoked 12 0 Lumpsucker, raw 11 3 0.0006 <d. 0.001 0.001 Mackerel, raw 20 1 0.0006 <d. <d. 0.001 Mackerel, smoked 18 0 Mackerel, tinned in tomato 6 0 Plaice, raw 10 0 Rainbow trout, farmed, raw 273 38 0.0006 <d. 0.000 0.002 Salmon, raw 20 0 Swordfish, raw 6 0 Trout, marine farmed, raw 77 15 0.0009 <d. 0.001 0.002 Fish oil 21 1 0.002 <d. <d. 0.011 Cod liver oil 9 0 Herring: 219 4 0.0009 <d. <d. 0.001 The Baltic Sea 37 0 The Sound 34 0 The Belts 38 1 0.0009 <d. <d. 0.001 The Kattegat 34 3 0.001 <d. <d. 0.001 The Skagerrak 40 0 The North Sea 36 0 Cod liver: 111 4 0.002 <d. <d. 0.037 The Baltic Sea 19 0 The Sound 22 1 0.003 <d. <d. 0.037 The Belts 21 0 The Kattegat 14 2 0.003 <d. 0.007 0.017 The Skagerrak 19 1 0.002 <d. <d. 0.016 The North Sea 16 0 *d.=limit of detection. The limit of detection varies during the monitoring period; see Appendix 11.3.31 ** mean is calculated including 1/3*d. for values below the detection limit. *** mg/kg fish and egg and mg/kg fat for the rest of the foods.

119
11.3.9 Tables of contents for endrin
Foodstuff Number of samples
Samples >d.* Mean** Median 90% fractile Maximum
mg/kg*** mg/kg*** mg/kg*** mg/kg*** Chicken fat 197 0 Turkey fat 85 0 Duck fat 5 0 Other poultry fat 4 0 Beef fat 385 0 Pork fat 884 3 0.0003 <d. <d. 0.004 Lamb sheep fat 37 0 Animal fats, other 20 0 Milk, Danish 248 0 Milk, foreign 41 0 Cheese, Danish 40 0 Cheese, foreign 166 0 Butter, Danish 126 0 Butter, foreign 22 0 Butter fat, mixed 10 0 Eggs 280 0 Cod, raw 10 0 Eel, farmed, raw 130 0 Garfish, raw 5 0 Greenland halibut, raw 7 4 0.007 0.0010 0.0010 0.0010 Herring, raw 26 4 0.0008 <d. 0.0008 0.0013 Herring, pickled 11 0 Herring, smoked 12 0 Lumpsucker, raw 11 1 0.0006 <d. <d. 0.002 Mackerel, raw 20 1 0.0008 <d. <d. 0.001 Mackerel, smoked 18 0 Mackerel, tinned in tomato 6 0 Plaice, raw 10 0 Rainbow trout, farmed, raw 273 1 0.0007 <d. <d. 0.0003 Salmon, raw 20 4 0.0007 <d. 0.0010 0.002 Swordfish, raw 6 0 Trout, marine farmed, raw 77 2 0.0008 <d. <d. 0.0008 Fish oil 21 0 Cod liver oil 9 0 Herring: 219 0 The Baltic Sea 37 0 The Sound 34 0 The Belts 38 0 The Kattegat 34 0 The Skagerrak 40 0 The North Sea 36 0 Cod liver: 111 1 0.0009 <d. <d. 0.010 The Baltic Sea 19 0 The Sound 22 0 The Belts 21 0 The Kattegat 14 0 The Skagerrak 19 0 The North Sea 16 1 0.001 0.002 0.028 0.034 *d.=limit of detection. The limit of detection varies during the monitoring period; see Appendix 11.3.31 ** mean is calculated including 1/3*d. for values below the detection limit. *** mg/kg fish and egg and mg/kg fat for the rest of the foods.

120
11.3.10 Tables of contents for dieldrin
Foodstuff Number of samples
Samples >d.* Mean** Median 90% fractile Maximum
mg/kg*** mg/kg*** mg/kg*** mg/kg*** Chicken fat 197 13 0.001 <d. <d. 0.007 Turkey fat 85 4 0.001 <d. <d. 0.004 Duck fat 5 0 Other poultry fat 4 1 0.006 <d. 0.013 0.019 Beef fat 385 30 0.002 <d. <d. 0.008 Pork fat 884 12 0.001 <d. <d. 0.015 Lamb sheep fat 37 0 Animal fats, other 20 0 Milk, Danish 248 70 0.001 <d. 0.003 0.010 Milk, foreign 41 25 0.002 0.002 0.003 0.006 Cheese, Danish 40 6 0.002 <d. 0.003 0.007 Cheese, foreign 166 45 0.002 <d. 0.003 0.012 Butter, Danish 126 2 0.002 <d. <d. 0.007 Butter, foreign 22 5 0.002 <d. 0.002 0.016 Butter fat, mixed 10 0 Eggs 280 4 0.000 <d. <d. 0.003 Cod, raw 10 0 Eel, farmed, raw 130 130 0.013 0.012 0.018 0.024 Garfish, raw 5 0 Greenland halibut, raw 7 7 0.007 0.006 0.010 0.016 Herring, raw 26 26 0.003 0.003 0.005 0.006 Herring, pickled 11 11 0.005 0.005 0.006 0.006 Herring, smoked 12 12 0.003 0.003 0.004 0.004 Lumpsucker, raw 11 11 0.005 0.004 0.006 0.009 Mackerel, raw 20 19 0.003 0.003 0.004 0.006 Mackerel, smoked 18 18 0.004 0.004 0.006 0.007 Mackerel, tinned in tomato 6 6 0.001 0.001 0.002 0.002 Plaice, raw 10 0 Rainbow trout, farmed, raw 273 216 0.001 0.001 0.002 0.007 Salmon, raw 20 15 0.003 0.003 0.006 0.007 Swordfish, raw 6 0 Trout, marine farmed, raw 77 73 0.003 0.002 0.005 0.011 Fish oil 21 3 0.009 <d. 0.050 0.063 Cod liver oil 9 7 0.025 0.013 0.060 0.065 Herring: 219 206 0.003 0.002 0.005 0.014 The Baltic Sea 37 35 0.004 0.003 0.006 0.011 The Sound 34 30 0.003 0.003 0.005 0.005 The Belts 38 33 0.002 0.001 0.004 0.005 The Kattegat 34 32 0.003 0.002 0.005 0.007 The Skagerrak 40 40 0.003 0.002 0.005 0.014 The North Sea 36 36 0.003 0.003 0.005 0.012 Cod liver: 111 105 0.018 0.016 0.031 0.049 The Baltic Sea 19 18 0.024 0.024 0.043 0.049 The Sound 22 19 0.018 0.020 0.031 0.038 The Belts 21 19 0.012 0.012 0.020 0.036 The Kattegat 14 14 0.015 0.014 0.020 0.030 The Skagerrak 19 19 0.021 0.020 0.032 0.044 The North Sea 16 16 0.017 0.015 0.028 0.034 *d.=limit of detection. The limit of detection varies during the monitoring period; see Appendix 11.3.31 ** mean is calculated including 1/3*d. for values below the detection limit. *** mg/kg fish and egg and mg/kg fat for the rest of the foods.

121
11.3.11 Tables of contents for heptachlor
Foodstuff Number of samples
Samples >d.* Mean** Median 90% fractile Maximum
mg/kg*** mg/kg*** mg/kg*** mg/kg*** Chicken fat 197 2 0.0005 <d. <d. 0.003 Turkey fat 85 2 0.0005 <d. <d. 0.002 Duck fat 5 0 Other poultry fat 4 0 Beef fat 385 0 Pork fat 884 0 Lamb sheep fat 37 0 Animal fats, other 20 0 Milk, Danish 248 0 Milk, foreign 41 0 Cheese, Danish 40 1 0.0007 <d. <d. 0.004 Cheese, foreign 166 25 0.0007 <d. 0.001 0.009 Butter, Danish 126 2 0.0006 <d. <d. 0.003 Butter, foreign 22 2 0.0007 <d. <d. 0.004 Butter fat, mixed 10 0 Eggs 280 0 Cod, raw 10 0 Eel, farmed, raw 130 64 0.0015 <d. 0.003 0.004 Garfish, raw 5 0 Greenland halibut, raw 7 5 0.0008 0.0010 0.001 0.001 Herring, raw 26 14 0.0006 0.0003 0.001 0.001 Herring, pickled 11 11 0.0005 0.0005 0.001 0.001 Herring, smoked 12 8 0.0007 0.0004 0.001 0.001 Lumpsucker, raw 11 6 0.0012 0.001 0.002 0.002 Mackerel, raw 20 15 0.0010 0.0006 0.002 0.002 Mackerel, smoked 18 8 0.0010 <d. 0.001 0.001 Mackerel, tinned in tomato 6 1 0.0011 <d. 0.000 0.000 Plaice, raw 10 0 Rainbow trout, farmed, raw 273 45 0.0007 <d. 0.000 0.001 Salmon, raw 20 4 0.0006 <d. 0.001 0.001 Swordfish, raw 6 0 Trout, marine farmed, raw 77 15 0.0008 <d. <d. 0.001 Fish oil 21 1 0.0008 <d. <d. 0.004 Cod liver oil 9 3 0.002 <d. 0.006 0.008 Herring: 219 56 0.0009 <d. 0.001 0.002 The Baltic Sea 37 10 0.0009 <d. 0.001 0.002 The Sound 34 11 0.0008 <d. 0.001 0.001 The Belts 38 11 0.0008 <d. 0.001 0.001 The Kattegat 34 7 0.0009 <d. 0.001 0.001 The Skagerrak 40 6 0.0009 <d. 0.000 0.001 The North Sea 36 11 0.0009 <d. 0.001 0.001 Cod liver: 111 68 0.003 0.002 0.005 0.010 The Baltic Sea 19 10 0.003 0.002 0.005 0.007 The Sound 22 12 0.003 0.002 0.005 0.010 The Belts 21 13 0.002 0.001 0.004 0.007 The Kattegat 14 10 0.002 0.002 0.002 0.003 The Skagerrak 19 12 0.003 0.002 0.006 0.010 The North Sea 16 11 0.003 0.002 0.006 0.007 *d.=limit of detection. The limit of detection varies during the monitoring period; see Appendix 11.3.31 ** mean is calculated including 1/3*d. for values below the detection limit. *** mg/kg fish and egg and mg/kg fat for the rest of the foods.

122
11.3.12 Tables of contents for HCB
Foodstuff Number of samples
Samples >d.* Mean** Median 90% fractile Maximum
mg/kg*** mg/kg*** mg/kg*** mg/kg*** Chicken fat 197 48 0.001 <d. 0.002 0.005 Turkey fat 85 28 0.001 <d. 0.002 0.011 Duck fat 5 0 Other poultry fat 4 3 0.006 0.005 0.011 0.013 Beef fat 385 320 0.003 0.002 0.004 0.088 Pork fat 884 185 0.0006 <d. 0.0010 0.016 Lamb sheep fat 37 34 0.005 0.004 0.011 0.021 Animal fats, other 20 17 0.006 0.003 0.015 0.033 Milk, Danish 248 234 0.002 0.002 0.003 0.028 Milk, foreign 41 35 0.002 0.002 0.002 0.005 Cheese, Danish 40 33 0.002 0.002 0.004 0.006 Cheese, foreign 166 145 0.002 0.002 0.004 0.014 Butter, Danish 126 35 0.0009 <d. 0.002 0.007 Butter, foreign 22 11 0.0010 0.001 0.002 0.004 Butter fat, mixed 10 1 0.0004 <d. 0.0001 0.002 Eggs 280 6 0.0002 <d. <d. 0.005 Cod, raw 10 0 Eel, farmed, raw 130 130 0.005 0.005 0.007 0.010 Garfish, raw 5 0 Greenland halibut, raw 7 7 0.004 0.003 0.005 0.007 Herring, raw 26 19 0.001 0.001 0.001 0.002 Herring, pickled 11 11 0.0012 0.0011 0.002 0.002 Herring, smoked 12 12 0.0009 0.0010 0.001 0.001 Lumpsucker, raw 11 11 0.004 0.004 0.006 0.007 Mackerel, raw 20 17 0.0009 0.0009 0.002 0.002 Mackerel, smoked 18 16 0.0010 0.0010 0.002 0.002 Mackerel, tinned in tomato 6 5 0.0004 0.0004 0.001 0.001 Plaice, raw 10 0 Rainbow trout, farmed, raw 273 183 0.0008 0.0010 0.001 0.005 Salmon, raw 20 13 0.002 0.001 0.003 0.004 Swordfish, raw 6 1 0.0004 <d. 0.001 0.001 Trout, marine farmed, raw 77 59 0.001 0.001 0.003 0.004 Fish oil 21 3 0.004 <d. 0.018 0.033 Cod liver oil 9 5 0.011 0.003 0.023 0.034 Herring: 219 146 0.0010 0.0010 0.002 0.003 The Baltic Sea 37 28 0.0013 0.0010 0.003 0.003 The Sound 34 28 0.0011 0.0010 0.002 0.002 The Belts 38 22 0.0008 0.0005 0.001 0.002 The Kattegat 34 23 0.0009 0.0009 0.001 0.002 The Skagerrak 40 26 0.0009 0.0007 0.002 0.002 The North Sea 36 19 0.0008 0.0004 0.001 0.002 Cod liver: 111 106 0.007 0.006 0.016 0.028 The Baltic Sea 19 18 0.013 0.012 0.023 0.028 The Sound 22 21 0.009 0.010 0.017 0.019 The Belts 21 20 0.005 0.004 0.011 0.012 The Kattegat 14 13 0.005 0.005 0.007 0.012 The Skagerrak 19 18 0.006 0.006 0.008 0.019 The North Sea 16 16 0.006 0.006 0.009 0.016 *d.=limit of detection. The limit of detection varies during the monitoring period; see Appendix 11.3.31 ** mean is calculated including 1/3*d. for values below the detection limit. *** mg/kg fish and egg and mg/kg fat for the rest of the foods.

123
11.3.13 Tables of contents for lindane
Foodstuff Number of samples
Samples >d.* Mean** Median 90% fractile Maximum
mg/kg*** mg/kg*** mg/kg*** mg/kg*** Chicken fat 197 42 0.001 <d. 0.004 0.009 Turkey fat 85 22 0.001 <d. 0.002 0.008 Duck fat 5 0 Other poultry fat 4 2 0.006 0.005 0.011 0.011 Beef fat 385 24 0.001 <d. <d. 0.006 Pork fat 884 6 0.0004 <d. <d. 0.019 Lamb sheep fat 37 0 Animal fats, other 20 0 Milk, Danish 248 4 0.0004 <d. <d. 0.009 Milk, foreign 41 0 Cheese, Danish 40 7 0.0010 <d. 0.002 0.004 Cheese, foreign 166 69 0.002 <d. 0.005 0.046 Butter, Danish 126 5 0.0006 <d. <d. 0.002 Butter, foreign 22 0 Butter fat, mixed 10 1 0.0010 <d. 0.0004 0.004 Eggs 280 0 Cod, raw 10 0 Eel, farmed, raw 130 107 0.003 0.003 0.004 0.012 Garfish, raw 5 0 Greenland halibut, raw 7 0 Herring, raw 26 14 0.001 0.000 0.003 0.004 Herring, pickled 11 0 Herring, smoked 12 4 0.0005 <d. 0.0005 0.001 Lumpsucker, raw 11 10 0.003 0.001 0.006 0.006 Mackerel, raw 20 1 0.00070 <d. <d. 0.001 Mackerel, smoked 18 0 Mackerel, tinned in tomato 6 1 0.0005 <d. 0.0002 0.000 Plaice, raw 10 0 Rainbow trout, farmed, raw 273 52 0.0009 <d. 0.0002 0.001 Salmon, raw 20 9 0.0013 <d. 0.002 0.004 Swordfish, raw 6 0 Trout, marine farmed, raw 77 45 0.0010 0.0003 0.0010 0.002 Fish oil 21 2 0.002 <d. <d. 0.005 Cod liver oil 9 1 0.002 <d. 0.002 0.004 Herring: 219 132 0.0011 0.0005 0.002 0.004 The Baltic Sea 37 31 0.0013 0.0010 0.002 0.003 The Sound 34 21 0.0010 0.0006 0.002 0.002 The Belts 38 27 0.0011 0.0008 0.002 0.003 The Kattegat 34 23 0.0013 0.0010 0.002 0.004 The Skagerrak 40 17 0.0010 <d. 0.002 0.002 The North Sea 36 14 0.0010 <d. 0.002 0.003 Cod liver: 111 80 0.005 0.003 0.012 0.016 The Baltic Sea 19 18 0.006 0.006 0.012 0.016 The Sound 22 16 0.006 0.004 0.015 0.016 The Belts 21 17 0.004 0.002 0.009 0.014 The Kattegat 14 8 0.003 0.002 0.010 0.016 The Skagerrak 19 11 0.003 0.002 0.006 0.016 The North Sea 16 10 0.005 0.003 0.012 0.013 *d.=limit of detection. The limit of detection varies during the monitoring period; see Appendix 11.3.31 ** mean is calculated including 1/3*d. for values below the detection limit. *** mg/kg fish and egg and mg/kg fat for the rest of the foods.

124
11.3.14 Tables of contents for PCB-28
Foodstuff Number of samples
Samples >d.* Mean** Median 90% fractile Maximum
mg/kg*** mg/kg*** mg/kg*** mg/kg*** Chicken fat 197 3 0.0007 <d. <d. 0.003 Turkey fat 85 2 0.0006 <d. <d. 0.005 Duck fat 5 0 Other poultry fat 4 0 Beef fat 385 9 0.0013 <d. <d. 0.012 Pork fat 884 6 0.0007 <d. <d. 0.011 Lamb sheep fat 37 1 0.0009 <d. <d. 0.008 Animal fats, other 20 0 Milk, Danish 248 30 0.0013 <d. <d. 0.016 Milk, foreign 41 1 0.0010 <d. <d. 0.003 Cheese, Danish 40 2 0.002 <d. <d. 0.005 Cheese, foreign 166 4 0.0009 <d. <d. 0.005 Butter, Danish 126 0 Butter, foreign 22 0 Butter fat, mixed 10 0 Eggs 280 0 Cod, raw 10 0 Eel, farmed, raw 130 68 0.0016 0.0010 0.003 0.004 Garfish, raw 5 0 Greenland halibut, raw 7 5 0.0009 0.0010 0.001 0.001 Herring, raw 26 1 0.0008 <d. <d. 0.0003 Herring, pickled 11 0 Herring, smoked 12 0 Lumpsucker, raw 11 3 0.0007 <d. 0.001 0.001 Mackerel, raw 20 0 Mackerel, smoked 18 0 Mackerel, tinned in tomato 6 0 Plaice, raw 10 0 Rainbow trout, farmed, raw 273 75 0.0008 <d. 0.001 0.003 Salmon, raw 20 5 0.0007 <d. 0.001 0.001 Swordfish, raw 6 0 Trout, marine farmed, raw 77 19 0.0011 0.0000 0.001 0.002 Fish oil 21 1 0.002 <d. <d. 0.005 Cod liver oil 9 2 0.004 <d. 0.009 0.016 Herring: 219 49 0.001 <d. 0.001 0.002 The Baltic Sea 37 15 0.001 <d. 0.001 0.001 The Sound 34 5 0.001 <d. 0.001 0.001 The Belts 38 13 0.001 <d. 0.001 0.002 The Kattegat 34 5 0.001 <d. 0.001 0.001 The Skagerrak 40 3 0.001 <d. <d. 0.002 The North Sea 36 8 0.001 <d. 0.001 0.001 Cod liver: 111 81 0.004 0.004 0.010 0.017 The Baltic Sea 19 13 0.006 0.006 0.010 0.012 The Sound 22 18 0.005 0.004 0.013 0.017 The Belts 21 18 0.005 0.003 0.010 0.014 The Kattegat 14 11 0.003 0.003 0.005 0.007 The Skagerrak 19 12 0.004 0.003 0.007 0.011 The North Sea 16 9 0.003 0.003 0.006 0.009 *d.=limit of detection. The limit of detection varies during the monitoring period; see Appendix 11.3.31 ** mean is calculated including 1/3*d. for values below the detection limit. *** mg/kg fish and egg and mg/kg fat for the rest of the foods.

125
11.3.15 Tables of contents for PCB-52
Foodstuff Number of samples
Samples >d.* Mean** Median 90% fractile Maximum
mg/kg*** mg/kg*** mg/kg*** mg/kg*** Chicken fat 197 3 0.0008 <d. <d. 0.003 Turkey fat 85 0 Duck fat 5 1 0.0018 <d. 0.002 0.004 Other poultry fat 4 0 Beef fat 385 4 0.0010 <d. <d. 0.006 Pork fat 884 12 0.0008 <d. <d. 0.006 Lamb sheep fat 37 0 Animal fats, other 20 0 Milk, Danish 248 8 0.0009 <d. <d. 0.006 Milk, foreign 41 0 Cheese, Danish 40 1 0.0013 <d. <d. 0.007 Cheese, foreign 166 2 0.0006 <d. <d. 0.007 Butter, Danish 126 0 Butter, foreign 22 0 Butter fat, mixed 10 0 Eggs 280 4 0.0030 <d. <d. 0.001 Cod, raw 10 0 Eel, farmed, raw 130 45 0.0022 <d. 0.003 0.006 Garfish, raw 5 0 Greenland halibut, raw 7 7 0.001 0.001 0.002 0.002 Herring, raw 26 4 0.002 <d. 0.001 0.002 Herring, pickled 11 10 0.002 0.002 0.003 0.003 Herring, smoked 12 5 0.001 <d. 0.001 0.001 Lumpsucker, raw 11 7 0.002 0.001 0.003 0.005 Mackerel, raw 20 5 0.001 <d. 0.002 0.003 Mackerel, smoked 18 0 Mackerel, tinned in tomato 6 0 Plaice, raw 10 0 Rainbow trout, farmed, raw 273 130 0.001 <d. 0.001 0.003 Salmon, raw 20 6 0.002 <d. 0.001 0.002 Swordfish, raw 6 0 Trout, marine farmed, raw 77 53 0.002 0.001 0.002 0.003 Fish oil 21 1 0.002 <d. <d. 0.019 Cod liver oil 9 3 0.006 <d. 0.017 0.017 Herring: 219 92 0.002 <d. 0.001 0.006 The Baltic Sea 37 19 0.002 0.001 0.002 0.006 The Sound 34 14 0.002 <d. 0.001 0.002 The Belts 38 21 0.002 0.001 0.001 0.002 The Kattegat 34 11 0.002 <d. 0.001 0.002 The Skagerrak 40 13 0.002 <d. 0.002 0.004 The North Sea 36 14 0.002 <d. 0.001 0.003 Cod liver: 111 78 0.009 0.006 0.0180 0.0390 The Baltic Sea 19 14 0.013 0.014 0.0216 0.0330 The Sound 22 17 0.011 0.010 0.0180 0.0390 The Belts 21 17 0.009 0.007 0.0210 0.0360 The Kattegat 14 9 0.006 0.005 0.0100 0.0180 The Skagerrak 19 11 0.007 0.003 0.0148 0.0280 The North Sea 16 10 0.006 0.004 0.0105 0.0120 *d.=limit of detection. The limit of detection varies during the monitoring period; see Appendix 11.3.31 ** mean is calculated including 1/3*d. for values below the detection limit. *** mg/kg fish and egg and mg/kg fat for the rest of the foods.

126
11.3.16 Tables of contents for PCB-101
Foodstuff Number of samples
Samples >d.* Mean** Median 90% fractile Maximum
mg/kg*** mg/kg*** mg/kg*** mg/kg*** Chicken fat 197 0 Turkey fat 85 0 Duck fat 5 0 Other poultry fat 4 0 Beef fat 385 0 Pork fat 884 6 0.0006 <d. <d. 0.004 Lamb sheep fat 37 0 Animal fats, other 20 0 Milk, Danish 248 6 0.0007 <d. <d. 0.008 Milk, foreign 41 0 Cheese, Danish 40 0 Cheese, foreign 166 2 0.0005 <d. <d. 0.002 Butter, Danish 126 0 Butter, foreign 22 0 Butter fat, mixed 10 0 Eggs 280 0 Cod, raw 10 0 Eel, farmed, raw 130 119 0.003 0.004 0.006 0.011 Garfish, raw 5 5 0.003 0.002 0.004 0.004 Greenland halibut, raw 7 7 0.002 0.001 0.003 0.003 Herring, raw 26 22 0.002 0.002 0.004 0.005 Herring, pickled 11 11 0.002 0.002 0.002 0.002 Herring, smoked 12 11 0.002 0.002 0.002 0.002 Lumpsucker, raw 11 11 0.002 0.003 0.004 0.004 Mackerel, raw 20 10 0.002 0.001 0.003 0.005 Mackerel, smoked 18 5 0.001 <d. 0.002 0.002 Mackerel, tinned in tomato 6 2 0.001 <d. 0.001 0.001 Plaice, raw 10 7 0.002 0.002 0.003 0.005 Rainbow trout, farmed, raw 273 217 0.001 0.001 0.002 0.007 Salmon, raw 20 15 0.002 0.002 0.004 0.005 Swordfish, raw 6 0 Trout, marine farmed, raw 77 72 0.002 0.002 0.004 0.009 Fish oil 21 3 0.005 <d. 0.026 0.031 Cod liver oil 9 7 0.017 0.016 0.034 0.034 Herring: 219 197 0.002 0.002 0.004 0.010 The Baltic Sea 37 36 0.003 0.003 0.005 0.007 The Sound 34 32 0.002 0.002 0.003 0.005 The Belts 38 38 0.003 0.003 0.004 0.007 The Kattegat 34 32 0.002 0.002 0.003 0.005 The Skagerrak 40 32 0.002 0.002 0.004 0.010 The North Sea 36 26 0.001 0.001 0.003 0.005 Cod liver: 111 109 0.040 0.031 0.076 0.131 The Baltic Sea 19 19 0.065 0.060 0.090 0.126 The Sound 22 22 0.053 0.054 0.093 0.104 The Belts 21 21 0.045 0.031 0.113 0.131 The Kattegat 14 14 0.024 0.022 0.040 0.043 The Skagerrak 19 17 0.021 0.021 0.035 0.058 The North Sea 16 16 0.019 0.014 0.027 0.055 *d.=limit of detection. The limit of detection varies during the monitoring period; see Appendix 11.3.31 ** mean is calculated including 1/3*d. for values below the detection limit. *** mg/kg fish and egg and mg/kg fat for the rest of the foods.

127
11.3.17 Tables of contents for PCB-105
Foodstuff Number of samples
Samples >d.* Mean** Median 90% fractile Maximum
mg/kg*** mg/kg*** mg/kg*** mg/kg*** Chicken fat 197 2 0.0008 <d. <d. 0.001 Turkey fat 85 0 Duck fat 5 0 Other poultry fat 4 0 Beef fat 385 0 Pork fat 884 1 0.0010 <d. <d. 0.008 Lamb sheep fat 37 0 Animal fats, other 20 0 Milk, Danish 248 0 Milk, foreign 41 0 Cheese, Danish 40 0 Cheese, foreign 166 4 0.0009 <d. <d. 0.001 Butter, Danish 126 0 Butter, foreign 22 0 Butter fat, mixed 10 0 Eggs 280 0 Cod, raw 10 0 Eel, farmed, raw 130 76 0.002 0.0020 0.004 0.014 Garfish, raw 5 0 Greenland halibut, raw 7 4 0.0008 0.0010 0.001 0.002 Herring, raw 26 7 0.0007 <d. 0.001 0.003 Herring, pickled 11 7 0.006 0.0006 0.001 0.001 Herring, smoked 12 6 0.0006 0.0002 0.001 0.001 Lumpsucker, raw 11 1 0.0006 <d. <d. 0.002 Mackerel, raw 20 4 0.0006 <d. 0.001 0.002 Mackerel, smoked 18 0 Mackerel, tinned in tomato 6 0 Plaice, raw 10 0 Rainbow trout, farmed, raw 273 58 0.0006 <d. 0.000 0.002 Salmon, raw 20 7 0.0009 <d. 0.002 0.003 Swordfish, raw 6 0 Trout, marine farmed, raw 77 20 0.0009 <d. 0.001 0.002 Fish oil 21 8 0.004 <d. 0.012 0.013 Cod liver oil 9 6 0.009 0.013 0.014 0.016 Herring: 219 56 0.0011 <d. 0.001 0.003 The Baltic Sea 37 16 0.0014 <d. 0.002 0.003 The Sound 34 9 0.0009 <d. 0.001 0.001 The Belts 38 13 0.0011 <d. 0.001 0.003 The Kattegat 34 10 0.0012 <d. 0.002 0.003 The Skagerrak 40 4 0.0011 <d. <d. 0.002 The North Sea 36 5 0.0012 <d. 0.000 0.002 Cod liver: 111 108 0.017 0.014 0.030 0.060 The Baltic Sea 19 19 0.020 0.019 0.027 0.042 The Sound 22 22 0.025 0.024 0.043 0.060 The Belts 21 20 0.016 0.012 0.031 0.046 The Kattegat 14 14 0.015 0.014 0.221 0.036 The Skagerrak 19 18 0.014 0.010 0.025 0.054 The North Sea 16 15 0.009 0.009 0.015 0.017 *d.=limit of detection. The limit of detection varies during the monitoring period; see Appendix 11.3.31 ** mean is calculated including 1/3*d. for values below the detection limit. *** mg/kg fish and egg and mg/kg fat for the rest of the foods.

128
11.3.18 Tables of contents for PCB-118
Foodstuff Number of samples
Samples >d.* Mean** Median 90% fractile Maximum
mg/kg*** mg/kg*** mg/kg*** mg/kg*** Chicken fat 197 4 0.0009 <d. <d. 0.003 Turkey fat 85 1 0.0008 <d. <d. 0.001 Duck fat 5 0 Other poultry fat 4 0 Beef fat 385 8 0.0008 <d. <d. 0.005 Pork fat 884 0 Lamb sheep fat 37 0 Animal fats, other 20 3 0.0009 <d. 0.001 0.001 Milk, Danish 248 0 Milk, foreign 41 0 Cheese, Danish 40 2 0.0004 <d. <d. 0.002 Cheese, foreign 166 8 0.0006 <d. <d. 0.005 Butter, Danish 126 0 Butter, foreign 22 0 Butter fat, mixed 10 0 Eggs 280 0 Cod, raw 10 0 Eel, farmed, raw 130 130 0.008 0.008 0.011 0.020 Garfish, raw 5 4 0.0013 0.001 0.002 0.002 Greenland halibut, raw 7 6 0.0019 0.001 0.003 0.004 Herring, raw 26 18 0.0016 0.001 0.003 0.005 Herring, pickled 11 11 0.002 0.002 0.003 0.004 Herring, smoked 12 12 0.0012 0.001 0.002 0.002 Lumpsucker, raw 11 11 0.0019 0.002 0.003 0.003 Mackerel, raw 20 9 0.0011 <d. 0.002 0.004 Mackerel, smoked 18 7 0.0010 <d. 0.002 0.004 Mackerel, tinned in tomato 6 3 0.0005 0.000 0.001 0.001 Plaice, raw 10 1 0.0005 <d. 0.000 0.002 Rainbow trout, farmed, raw 273 186 0.0009 0.001 0.001 0.005 Salmon, raw 20 15 0.002 0.002 0.003 0.005 Swordfish, raw 6 0 Trout, marine farmed, raw 77 76 0.002 0.002 0.004 0.008 Fish oil 21 3 0.011 <d. 0.029 0.105 Cod liver oil 9 9 0.021 0.027 0.037 0.039 Herring: 219 196 0.002 0.002 0.003 0.009 The Baltic Sea 37 37 0.003 0.002 0.004 0.006 The Sound 34 31 0.002 0.002 0.003 0.004 The Belts 38 38 0.003 0.003 0.004 0.007 The Kattegat 34 33 0.002 0.002 0.003 0.004 The Skagerrak 40 29 0.002 0.001 0.004 0.009 The North Sea 36 27 0.002 0.001 0.003 0.034 Cod liver: 111 111 0.048 0.043 0.085 0.152 The Baltic Sea 19 19 0.061 0.058 0.086 0.103 The Sound 22 22 0.065 0.057 0.112 0.123 The Belts 21 21 0.051 0.047 0.086 0.152 The Kattegat 14 14 0.046 0.044 0.060 0.087 The Skagerrak 19 19 0.035 0.034 0.061 0.850 The North Sea 16 16 0.026 0.027 0.035 0.038 *d.=limit of detection. The limit of detection varies during the monitoring period; see Appendix 11.3.31 ** mean is calculated including 1/3*d. for values below the detection limit. *** mg/kg fish and egg and mg/kg fat for the rest of the foods.

129
11.3.19 Tables of contents for PCB-138
Foodstuff Number of samples
Samples >d.* Mean** Median 90% fractile Maximum
mg/kg*** mg/kg*** mg/kg*** mg/kg*** Chicken fat 197 5 0.0008 <d. <d. 0.005 Turkey fat 85 4 0.0008 <d. <d. 0.004 Duck fat 5 0 Other poultry fat 4 0 Beef fat 385 56 0.0013 <d. 0.003 0.015 Pork fat 884 41 0.0008 <d. <d. 0.009 Lamb sheep fat 37 0 Animal fats, other 20 6 0.0016 <d. 0.005 0.007 Milk, Danish 248 2 0.0007 <d. <d. 0.005 Milk, foreign 41 0 Cheese, Danish 40 6 0.0012 <d. 0.002 0.005 Cheese, foreign 166 50 0.0011 <d. 0.003 0.005 Butter, Danish 126 0 Butter, foreign 22 1 0.0005 <d. <d. 0.002 Butter fat, mixed 10 0 Eggs 280 1 0.0006 <d. <d. 0.027 Cod, raw 10 0 Eel, farmed, raw 130 130 0.017 0.016 0.025 0.041 Garfish, raw 5 3 0.002 0.002 0.004 0.005 Greenland halibut, raw 7 7 0.003 0.002 0.004 0.005 Herring, raw 26 24 0.004 0.003 0.007 0.011 Herring, pickled 11 11 0.002 0.002 0.003 0.004 Herring, smoked 12 11 0.003 0.002 0.005 0.005 Lumpsucker, raw 11 10 0.003 0.002 0.004 0.005 Mackerel, raw 20 10 0.002 0.001 0.003 0.008 Mackerel, smoked 18 13 0.002 0.002 0.003 0.005 Mackerel, tinned in tomato 6 5 0.001 0.001 0.001 0.002 Plaice, raw 10 0 Rainbow trout, farmed, raw 273 221 0.002 0.001 0.003 0.010 Salmon, raw 20 16 0.003 0.003 0.007 0.009 Swordfish, raw 6 1 0.001 <d. 0.001 0.002 Trout, marine farmed, raw 77 75 0.004 0.004 0.007 0.012 Fish oil 21 7 0.016 <d. 0.081 0.092 Cod liver oil 9 9 0.058 0.049 0.102 0.108 Herring: 219 207 0.005 0.004 0.009 0.024 The Baltic Sea 37 37 0.007 0.006 0.012 0.024 The Sound 34 34 0.005 0.005 0.009 0.011 The Belts 38 38 0.007 0.006 0.013 0.017 The Kattegat 34 34 0.004 0.004 0.006 0.010 The Skagerrak 40 34 0.004 0.003 0.007 0.016 The North Sea 36 30 0.003 0.003 0.006 0.008 Cod liver: 111 111 0.132 0.117 0.229 0.441 The Baltic Sea 19 19 0.167 0.160 0.227 0.414 The Sound 22 22 0.180 0.168 0.311 0.419 The Belts 21 21 0.159 0.115 0.394 0.441 The Kattegat 14 14 0.111 0.109 0.166 0.176 The Skagerrak 19 19 0.080 0.065 0.133 0.163 The North Sea 16 16 0.071 0.067 0.106 0.110 *d.=limit of detection. The limit of detection varies during the monitoring period; see Appendix 11.3.31 ** mean is calculated including 1/3*d. for values below the detection limit. *** mg/kg fish and egg and mg/kg fat for the rest of the foods.

130
11.3.20 Tables of contents for PCB-153
Foodstuff Number of samples
Samples >d.* Mean** Median 90% fractile Maximum
mg/kg*** mg/kg*** mg/kg*** mg/kg*** Chicken fat 197 10 0.0009 <d. <d. 0.006 Turkey fat 85 7 0.0010 <d. <d. 0.005 Duck fat 5 0 Other poultry fat 4 1 0.007 <d. 0.018 0.026 Beef fat 385 53 0.0014 <d. 0.003 0.024 Pork fat 884 61 0.0010 <d. <d. 0.012 Lamb sheep fat 37 9 0.002 <d. 0.004 0.012 Animal fats, other 20 10 0.003 0.001 0.007 0.008 Milk, Danish 248 2 0.0005 <d. <d. 0.003 Milk, foreign 41 0 Cheese, Danish 40 5 0.0008 <d. 0.002 0.004 Cheese, foreign 166 64 0.0014 <d. 0.003 0.008 Butter, Danish 126 2 0.0006 <d. <d. 0.002 Butter, foreign 22 2 0.0005 <d. <d. 0.002 Butter fat, mixed 10 1 0.0007 <d. 0.000 0.001 Eggs 280 3 0.0004 <d. <d. 0.004 Cod, raw 10 0 Eel, farmed, raw 130 130 0.016 0.014 0.025 0.049 Garfish, raw 5 5 0.003 0.002 0.005 0.006 Greenland halibut, raw 7 7 0.004 0.004 0.008 0.009 Herring, raw 26 25 0.004 0.004 0.006 0.011 Herring, pickled 11 11 0.002 0.002 0.003 0.003 Herring, smoked 12 12 0.003 0.004 0.006 0.006 Lumpsucker, raw 11 11 0.003 0.003 0.003 0.004 Mackerel, raw 20 14 0.003 0.002 0.005 0.009 Mackerel, smoked 18 15 0.002 0.002 0.004 0.006 Mackerel, tinned in tomato 6 5 0.001 0.001 0.002 0.002 Plaice, raw 10 6 0.001 0.001 0.002 0.002 Rainbow trout, farmed, raw 273 237 0.002 0.002 0.004 0.011 Salmon, raw 20 16 0.003 0.003 0.006 0.011 Swordfish, raw 6 4 0.001 0.001 0.002 0.003 Trout, marine farmed, raw 77 77 0.005 0.005 0.009 0.017 Fish oil 21 13 0.014 0.004 0.069 0.088 Cod liver oil 9 9 0.051 0.047 0.096 0.098 Herring: 219 206 0.006 0.005 0.010 0.105 The Baltic Sea 37 37 0.007 0.007 0.011 0.017 The Sound 34 33 0.005 0.005 0.008 0.010 The Belts 38 38 0.008 0.007 0.013 0.027 The Kattegat 34 34 0.005 0.005 0.007 0.016 The Skagerrak 40 37 0.004 0.003 0.005 0.018 The North Sea 36 30 0.003 0.002 0.008 0.013 Cod liver: 111 111 0.16 0.15 0.28 0.54 The Baltic Sea 19 19 0.20 0.21 0.27 0.28 The Sound 22 22 0.22 0.24 0.29 0.37 The Belts 21 21 0.20 0.16 0.40 0.54 The Kattegat 14 14 0.15 0.15 0.20 0.30 The Skagerrak 19 19 0.09 0.08 0.16 0.19 The North Sea 16 16 0.09 0.08 0.12 0.15 *d.=limit of detection. The limit of detection varies during the monitoring period; see Appendix 11.3.31 ** mean is calculated including 1/3*d. for values below the detection limit. *** mg/kg fish and egg and mg/kg fat for the rest of the foods.

131
11.3.21 Tables of contents for PCB-156
Foodstuff Number of samples
Samples >d.* Mean** Median 90% fractile Maximum
mg/kg*** mg/kg*** mg/kg*** mg/kg*** Chicken fat 197 0 Turkey fat 85 0 Duck fat 5 0 Other poultry fat 4 0 Beef fat 385 0 Pork fat 884 0 Lamb sheep fat 37 0 Animal fats, other 20 0 Milk, Danish 248 0 Milk, foreign 41 0 Cheese, Danish 40 0 Cheese, foreign 166 0 Butter, Danish 126 0 Butter, foreign 22 0 Butter fat, mixed 10 0 Eggs 280 0 Cod, raw 10 0 Eel, farmed, raw 130 18 0.0007 <d. 0.0010 0.003 Garfish, raw 5 0 Greenland halibut, raw 7 0 Herring, raw 26 7 0.0004 <d. <d. 0.002 Herring, pickled 11 2 0.004 <d. 0.002 0.002 Herring, smoked 12 8 0.0002 0.0002 0.0003 0.0004 Lumpsucker, raw 11 0 Mackerel, raw 20 0 Mackerel, smoked 18 0 Mackerel, tinned in tomato 6 0 Plaice, raw 10 0 Rainbow trout, farmed, raw 273 22 0.0004 <d. <d. 0.001 Salmon, raw 20 3 0.0006 <d. 0.0010 0.001 Swordfish, raw 6 0 Trout, marine farmed, raw 77 5 0.0005 <d. <d. 0.001 Fish oil 21 2 0.002 <d. <d. 0.004 Cod liver oil 9 3 0.003 <d. 0.005 0.006 Herring: 219 33 0.0010 <d. 0.0003 0.048 The Baltic Sea 37 10 0.0009 <d. 0.0006 0.004 The Sound 34 6 0.0007 <d. 0.0003 0.001 The Belts 38 9 0.0007 <d. 0.0003 0.001 The Kattegat 34 3 0.0007 <d. <d. 0.000 The Skagerrak 40 4 0.0007 <d. <d. 0.000 The North Sea 36 2 0.0007 <d. <d. 0.000 Cod liver: 111 104 0.010 0.008 0.0200 0.086 The Baltic Sea 19 19 0.012 0.011 0.0184 0.026 The Sound 22 21 0.016 0.015 0.0256 0.037 The Belts 21 20 0.010 0.007 0.0200 0.023 The Kattegat 14 14 0.008 0.007 0.0140 0.015 The Skagerrak 19 15 0.009 0.004 0.0104 0.086 The North Sea 16 15 0.004 0.004 0.0065 0.009 *d.=limit of detection. The limit of detection varies during the monitoring period; see Appendix 11.3.31 ** mean is calculated including 1/3*d. for values below the detection limit. *** mg/kg fish and egg and mg/kg fat for the rest of the foods.

132
11.3.22 Tables of contents for PCB-170
Foodstuff Number of samples
Samples >d.* Mean** Median 90% fractile Maximum
mg/kg*** mg/kg*** mg/kg*** mg/kg*** Chicken fat 197 0 Turkey fat 85 1 0.0004 <d. <d. 0.002 Duck fat 5 0 Other poultry fat 4 1 0.003 <d. 0.008 0.011 Beef fat 385 0 Pork fat 884 2 0.0005 <d. <d. 0.001 Lamb sheep fat 37 0 Animal fats, other 20 2 0.0005 <d. 0.0001 0.003 Milk, Danish 248 0 Milk, foreign 41 0 Cheese, Danish 40 0 Cheese, foreign 166 1 0.0004 <d. <d. 0.001 Butter, Danish 126 0 Butter, foreign 22 0 Butter fat, mixed 10 0 Eggs 280 0 Cod, raw 10 0 Eel, farmed, raw 130 43 0.0010 <d. 0.002 0.005 Garfish, raw 5 0 Greenland halibut, raw 7 1 0.0004 <d. 0.0004 0.001 Herring, raw 26 8 0.0004 <d. 0.0004 0.001 Herring, pickled 11 5 0.0003 <d. 0.0003 0.000 Herring, smoked 12 6 0.0003 0.0002 0.0004 0.001 Lumpsucker, raw 11 0 Mackerel, raw 20 2 0.0003 <d. 0.0001 0.001 Mackerel, smoked 18 2 0.0003 <d. 0.0002 0.001 Mackerel, tinned in tomato 6 0 Plaice, raw 10 0 Rainbow trout, farmed, raw 273 51 0.0004 <d. 0.0001 0.001 Salmon, raw 20 2 0.0005 <d. 0.0001 0.001 Swordfish, raw 6 0 Trout, marine farmed, raw 77 14 0.0005 <d. 0.0005 0.001 Fish oil 21 2 0.006 <d. <d. 0.087 Cod liver oil 9 3 0.003 <d. 0.005 0.006 Herring: 219 57 0.0008 <d. 0.0008 0.003 The Baltic Sea 37 16 0.0009 <d. 0.0010 0.003 The Sound 34 8 0.0008 <d. 0.0005 0.001 The Belts 38 17 0.0009 <d. 0.0010 0.002 The Kattegat 34 7 0.0008 <d. 0.0004 0.001 The Skagerrak 40 5 0.0007 <d. <d. 0.001 The North Sea 36 8 0.0008 <d. 0.0007 0.001 Cod liver: 111 104 0.013 0.011 0.024 0.041 The Baltic Sea 19 19 0.017 0.017 0.024 0.033 The Sound 22 22 0.017 0.018 0.024 0.027 The Belts 21 20 0.017 0.014 0.034 0.041 The Kattegat 14 14 0.013 0.013 0.021 0.027 The Skagerrak 19 15 0.007 0.006 0.014 0.016 The North Sea 16 14 0.006 0.006 0.010 0.010 *d.=limit of detection. The limit of detection varies during the monitoring period; see Appendix 11.3.31 ** mean is calculated including 1/3*d. for values below the detection limit. *** mg/kg fish and egg and mg/kg fat for the rest of the foods.

133
11.3.23 Tables of contents for PCB-180
Foodstuff Number of samples
Samples >d.* Mean** Median 90% fractile Maximum
mg/kg*** mg/kg*** mg/kg*** mg/kg*** Chicken fat 197 9 0.0005 <d. <d. 0.002 Turkey fat 85 2 0.0005 <d. <d. 0.003 Duck fat 5 0 Other poultry fat 4 1 0.010 <d. 0.026 0.037 Beef fat 385 19 0.0008 <d. <d. 0.013 Pork fat 884 20 0.0005 <d. <d. 0.004 Lamb sheep fat 37 6 0.0007 <d. 0.0008 0.004 Animal fats, other 20 10 0.0013 0.0004 0.003 0.006 Milk, Danish 248 1 0.0003 <d. <d. 0.001 Milk, foreign 41 0 Cheese, Danish 40 1 0.0009 <d. <d. 0.001 Cheese, foreign 166 21 0.0006 <d. 0.001 0.003 Butter, Danish 126 3 0.0009 <d. <d. 0.001 Butter, foreign 22 1 0.0005 <d. <d. 0.001 Butter fat, mixed 10 0 Eggs 280 1 0.0003 <d. <d. 0.002 Cod, raw 10 0 Eel, farmed, raw 130 129 0.004 0.004 0.006 0.014 Garfish, raw 5 0 Greenland halibut, raw 7 2 0.0008 <d. 0.0018 0.003 Herring, raw 26 14 0.0007 <d. 0.0009 0.002 Herring, pickled 11 8 0.0004 0.0004 0.0006 0.001 Herring, smoked 12 11 0.0007 0.0007 0.0011 0.001 Lumpsucker, raw 11 3 0.0006 <d. 0.0010 0.001 Mackerel, raw 20 12 0.0007 0.0006 0.0012 0.002 Mackerel, smoked 18 12 0.0008 0.0006 0.0020 0.003 Mackerel, tinned in tomato 6 6 0.0003 0.0003 0.0005 0.001 Plaice, raw 10 0 Rainbow trout, farmed, raw 273 135 0.0007 <d. 0.0010 0.003 Salmon, raw 20 7 0.0008 <d. 0.0011 0.003 Swordfish, raw 6 1 0.0006 <d. 0.0010 0.002 Trout, marine farmed, raw 77 50 0.0010 0.001 0.0020 0.004 Fish oil 21 6 0.005 <d. 0.018 0.023 Cod liver oil 9 14 0.011 0.013 0.026 0.028 Herring: 219 103 0.0013 <d. 0.002 0.007 The Baltic Sea 37 27 0.0019 0.002 0.003 0.007 The Sound 34 15 0.0012 <d. 0.002 0.004 The Belts 38 26 0.0019 0.001 0.003 0.007 The Kattegat 34 12 0.0010 <d. 0.001 0.002 The Skagerrak 40 10 0.0010 <d. 0.001 0.005 The North Sea 36 13 0.0009 <d. 0.001 0.002 Cod liver: 111 111 0.036 0.029 0.063 0.135 The Baltic Sea 19 19 0.051 0.053 0.074 0.104 The Sound 22 22 0.047 0.044 0.069 0.079 The Belts 21 21 0.046 0.035 0.105 0.135 The Kattegat 14 14 0.028 0.029 0.045 0.053 The Skagerrak 19 19 0.019 0.017 0.033 0.044 The North Sea 16 16 0.016 0.015 0.026 0.028 *d.=limit of detection. The limit of detection varies during the monitoring period; see Appendix 11.3.31 ** mean is calculated including 1/3*d. for values below the detection limit. *** mg/kg fish and egg and mg/kg fat for the rest of the foods.

134
11.3.24 Tables of contents for PCB-sum
Foodstuff Number of samples
Samples >d.* Mean** Maximum
mg/kg*** mg/kg*** Chicken fat 197 20 0.0054 0.014 Turkey fat 85 9 0.0041 0.013 Duck fat 5 1 0.0018 0.004 Other poultry fat 4 1 0.0205 0.074 Beef fat 385 96 0.0066 0.054 Pork fat 884 92 0.0059 0.025 Lamb sheep fat 37 13 0.0034 0.016 Animal fats, other 20 12 0.0068 0.024 Milk, Danish 248 36 0.0044 0.030 Milk, foreign 41 1 0.0010 0.003 Cheese, Danish 40 12 0.0068 0.012 Cheese, foreign 166 80 0.0070 0.019 Butter, Danish 126 3 0.0015 0.003 Butter, foreign 22 2 0.0015 0.004 Butter fat, mixed 10 1 0.0007 0.001 Eggs 280 7 0.0036 0.008 Cod, raw 10 0 Eel, farmed, raw 130 130 0.0563 0.160 Garfish, raw 5 5 0.0089 0.015 Greenland halibut, raw 7 7 0.0149 0.025 Herring, raw 26 26 0.0158 0.037 Herring, pickled 11 11 0.0206 0.014 Herring, smoked 12 12 0.0119 0.018 Lumpsucker, raw 11 11 0.0133 0.019 Mackerel, raw 20 18 0.0100 0.028 Mackerel, smoked 18 16 0.0074 0.015 Mackerel, tinned in tomato 6 6 0.0037 0.006 Plaice, raw 10 7 0.0035 0.007 Rainbow trout, farmed, raw 273 238 0.0100 0.040 Salmon, raw 20 18 0.0158 0.039 Swordfish, raw 6 4 0.0026 0.007 Trout, marine farmed, raw 77 77 0.0196 0.049 Fish oil 21 13 0.0646 0.40 Cod liver oil 9 9 0.1824 0.33 Herring: 219 215 0.0228 0.069 The Baltic Sea 37 37 0.0291 0.062 The Sound 34 34 0.0216 0.035 The Belts 38 38 0.0287 0.072 The Kattegat 34 34 0.0199 0.029 The Skagerrak 40 37 0.0187 0.062 The North Sea 36 35 0.0168 0.040 Cod liver: 111 111 0.4712 1.53 The Baltic Sea 19 19 0.6128 1.15 The Sound 22 22 0.6325 1.11 The Belts 21 21 0.5533 1.53 The Kattegat 14 14 0.4082 0.69 The Skagerrak 19 19 0.2887 0.57 The North Sea 16 16 0.2461 0.37 *d.=limit of detection. The limit of detection varies during the monitoring period; see Appendix 11.3.31 ** mean is calculated including 1/3*d. for values below the detection limit. *** mg/kg fish and egg and mg/kg fat for the rest of the foods.
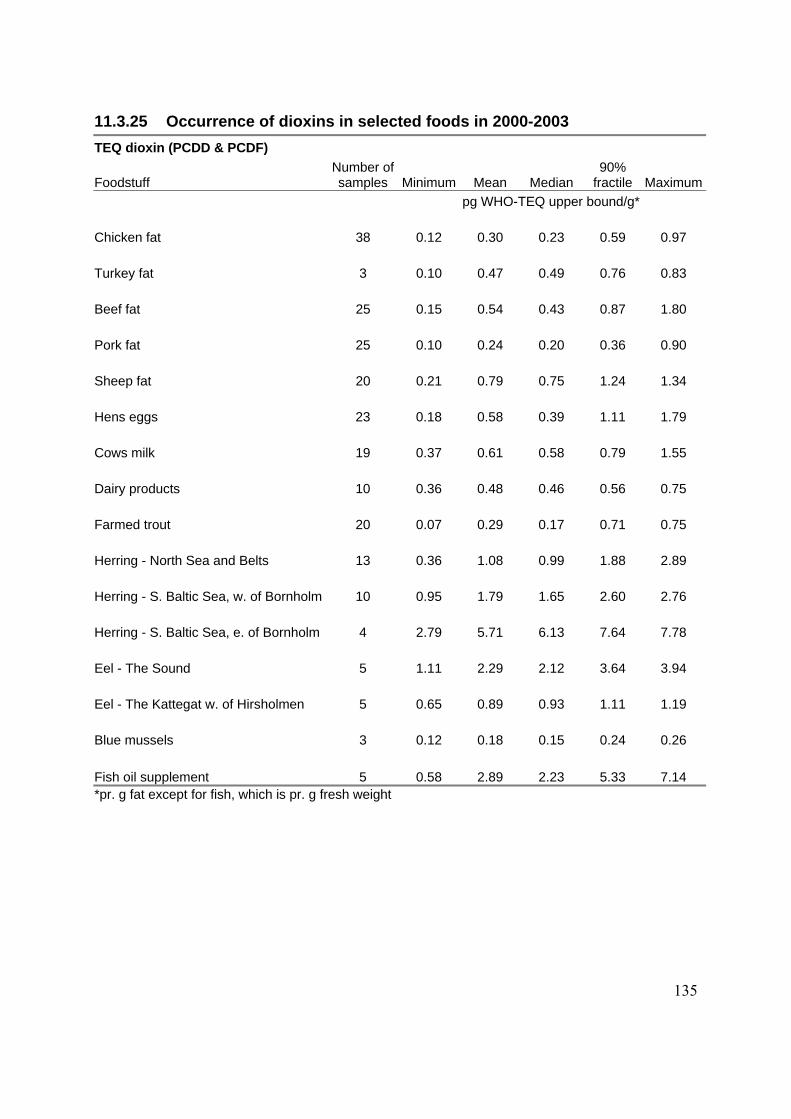
135
11.3.25 Occurrence of dioxins in selected foods in 2000-2003 TEQ dioxin (PCDD & PCDF)
Foodstuff Number of samples Minimum Mean Median
90% fractile Maximum
pg WHO-TEQ upper bound/g* Chicken fat 38 0.12 0.30 0.23 0.59 0.97 Turkey fat 3 0.10 0.47 0.49 0.76 0.83 Beef fat 25 0.15 0.54 0.43 0.87 1.80 Pork fat 25 0.10 0.24 0.20 0.36 0.90 Sheep fat 20 0.21 0.79 0.75 1.24 1.34 Hens eggs 23 0.18 0.58 0.39 1.11 1.79 Cows milk 19 0.37 0.61 0.58 0.79 1.55 Dairy products 10 0.36 0.48 0.46 0.56 0.75 Farmed trout 20 0.07 0.29 0.17 0.71 0.75 Herring - North Sea and Belts 13 0.36 1.08 0.99 1.88 2.89 Herring - S. Baltic Sea, w. of Bornholm 10 0.95 1.79 1.65 2.60 2.76 Herring - S. Baltic Sea, e. of Bornholm 4 2.79 5.71 6.13 7.64 7.78 Eel - The Sound 5 1.11 2.29 2.12 3.64 3.94 Eel - The Kattegat w. of Hirsholmen 5 0.65 0.89 0.93 1.11 1.19 Blue mussels 3 0.12 0.18 0.15 0.24 0.26 Fish oil supplement 5 0.58 2.89 2.23 5.33 7.14 *pr. g fat except for fish, which is pr. g fresh weight

136
11.3.26 Occurrence of dioxin-like PCB in selected foods in 2000-2003 TEQ PCB (mono and ortho PCB)
Foodstuff Number of samples Minimum Mean Median
90% frac-tile Maximum
pg WHO-TEQ upper bound/g* Chicken fat 38 0.05 0.32 0.12 0.86 1.65 Turkey fat 3 0.22 0.63 0.43 1.08 1.24 Beef fat 25 0.21 0.58 0.45 1.17 1.86 Pork fat 25 0.05 0.09 0.06 0.19 0.21 Sheep fat 20 0.10 0.56 0.60 0.90 0.96 Hens eggs 23 0.15 0.78 0.52 1.76 2.82 Cows milk 19 0.28 0.45 0.45 0.57 0.73 Dairy products 10 0.24 0.39 0.38 0.47 0.47 Farmed trout 20 0.17 0.78 0.45 1.92 2.02 Herring - North Sea and Belts 13 0.31 1.21 1.04 1.86 4.70 Herring - S. Baltic Sea, w. of Bornholm 10 1.29 2.18 2.07 3.04 3.49 Herring - S. Baltic Sea, e. of Bornholm 4 2.65 5.17 5.30 7.09 7.44 Eel - The Sound 5 2.44 6.02 6.79 7.88 8.29 Eel - The Kattegat w. of Hirsholmen 5 1.83 2.43 2.31 2.91 2.94 Blue mussels 3 0.12 0.17 0.17 0.21 0.22 Fish oil supplement 5 3.45 11.56 7.82 21.85 30.90 *pr. g fat except for fish, which is pr. g fresh weight

137
11.3.27 Occurrence of total TEQ (dioxins and dioxin-like PCB) in selected
food items in 2000-2003 TEQ total (dioxin & PCB)
Foodstuff Number of samples Minimum Mean Median
90% frac-tile Maximum
pg WHO-TEQ upper bound/g* Chicken fat 38 0.21 0.63 0.35 1.43 2.62 Turkey fat 3 0.31 1.10 0.92 1.84 2.07 Beef fat 25 0.38 1.10 0.78 1.97 3.65 Pork fat 25 0.15 0.30 0.26 0.37 1.01 Sheep fat 20 0.30 1.35 1.37 2.01 2.29 Hens eggs 23 0.34 1.36 0.90 3.05 4.60 Cows milk 19 0.73 1.06 0.95 1.39 2.09 Dairy products 10 0.60 0.86 0.88 1.03 1.11 Farmed trout 20 0.26 1.07 0.59 2.64 2.74 Herring - North Sea and Belts 13 0.68 2.30 2.04 3.74 7.58 Herring - S. Baltic Sea, w. of Bornholm 10 2.30 3.97 3.60 5.36 5.94 Herring - S. Baltic Sea, e. of Bornholm 4 5.44 10.88 11.43 14.73 15.22 Eel - The Sound 5 3.56 8.31 9.38 11.33 12.24 Eel - The Kattegat w. of Hirsholmen 5 2.48 3.33 3.28 4.00 4.05 Blue mussels 3 0.24 0.35 0.32 0.45 0.48 Fish oil supplement 5 4.02 14.45 9.72 27.18 38.04 *pr. g fat except for fish, which is pr. g fresh weight

138
11.3.28 Occurrence of PCB 153 in selected foods in 2000-2003 PCB 153*
Foodstuff Number of samples Minimum Mean Median
90% fractile Maximum
ng/g** Chicken fat 38 0.14 0.90 0.45 2.30 4.30 Turkey fat 3 0.69 1.73 1.07 2.95 3.42 Beef fat 25 0.55 1.52 1.03 3.05 4.49 Pork fat 25 0.18 0.70 0.64 1.07 1.49 Sheep fat 20 0.73 2.09 1.97 3.12 4.49 Hens eggs 23 0.47 2.23 1.64 4.68 7.42 Cows milk 19 0.61 0.88 0.78 1.16 1.35 Dairy products 10 0.51 0.88 0.85 1.18 1.59 Farmed trout 20 0.47 2.25 1.53 5.23 5.92 Herring - North Sea and Belts 13 1.04 3.60 3.81 6.37 6.77 Herring - S. Baltic Sea, w. of Bornholm 10 7.02 10.26 10.33 12.65 13.95 Herring - S. Baltic Sea, e. of Bornholm 4 9.10 20.04 18.95 30.35 33.15 Eel - The Sound 5 22.70 34.43 34.35 42.46 44.10 Eel - The Kattegat w. of Hirsholmen 5 8.46 10.95 11.90 12.75 12.85 Blue mussels 3 0.43 0.54 0.56 0.61 0.62 Fish oil supplement 5 18.10 66.96 76.40 95.68 100.00 *Determined by the analytical method used for dioxins. This method has lower detection limit than the method use for indicator PCB (Appendix 11.3.31). **pr. g fat except for fish, which is pr. g fresh weight

139
11.3.29 Occurrence of dioxins, PCB and chlorinated pesticides in human milk collected in 1999 and 2002
Human milk Compound*
Number of samples Minimum Mean Median
90% fractile Maximum
pg WHO-TEQ upper bound/g fat TEQ WHO dioxin 38 5.8 11.8 11.6 15.4 24.0 TEQ WHO PCB 38 3.6 9.1 8.0 13.3 25.3 TEQ WHO Total (dioxin & PCB) 38 10.8 20.8 19.4 28.6 45.6
ng/g fat PCB 28 38 0.7 4.2 3.1 8.0 14.9 PCB 52 38 0.1 0.6 0.6 1.0 2.2 PCB 101 38 0.2 0.9 0.7 1.3 4.8 PCB 105 38 0.5 2.4 2.0 3.4 10.9 PCB 114 38 0.2 0.5 0.4 0.7 2.9 PCB 118 38 4.3 10.6 9.1 14.5 43.6 PCB 123 38 0.1 0.2 0.1 0.3 0.6 PCB 138 38 7.2 32.5 29.9 55.5 67.7 PCB 153 38 9.3 55.8 47.7 91.5 137.0 PCB 156 38 0.9 5.0 4.1 9.3 15.1 PCB 157 38 0.2 0.8 0.7 1.2 2.9 PCB 167 38 0.4 1.4 1.2 2.4 3.2 PCB 170 38 1.7 12.0 10.6 21.1 35.2 PCB 180 38 3.2 24.8 21.1 44.8 83.0 PCB 189 38 0.1 0.2 0.2 0.3 0.4 HCB 38 2 21 20 27 76 β-HCH 38 7 117 20 29 2787 Oxychlordane 38 2 5 5 9 17 trans-Nonachlor 38 2 5 4 8 14 Dieldrine 38 3 10 10 14 15 Heptachlorepoxid 38 2 4 3 6 10 sum-DDT 38 44 217 111 176 3240 *In addition to the listed chlorinated pesticides the following compounds were analysed and detected in few sam-ples or below detection limit (app. 1-2 ng/g fat): α-HCH, Lindane, cis-chlordane, trans-chlordane, heptachlor, aldrine, endrine, isodrine, endosulfan A

140
11.3.30 Commodity types used in the calculation
of daily intakes of organic environmental contaminants
Foodstuff FoodId g fat/100 g
foodstuff Commodity type used in calculation.
Full milk 156 3.5 milk A38 157 3.5 milk Cocoa milk 159 1.8 milk Creme fraîche 18% 160 18.6 milk Creme fraîche 38% 161 38.4 milk Cream 13% 165 13.5 milk Cream 38%, double cream 166 38.1 milk Buttermilk 168 0.5 milk Low-fat milk 170 1.6 milk Skimmed milk 251 0.3 milk Quark, 5+ 261 0.4 milk Junket, plain 332 3.5 milk Yoghurt, plain 333 3.6 milk Low-fat yoghurt with juice 334 1.6 milk Yoghurt with fruit, unspec. 335 3.2 milk Skimmed-milk powder 366 1.7 milk Ice cream 848 10.0 milk Quark with fruit 1300 8.2 milk Cottage cheese, 20+ 260 5.4 cheese* Quark, 5+ 261 0.4 cheese* Cheese, unripened, smoked, 40+ 264 10.3 cheese* Processed cheese, 45+ 265 24.5 cheese* Feta 40+ 363 19.2 cheese* Cheese, cream 70+ 364 36.9 cheese* Cheese, hard, parmesan, grate 365 30.0 cheese* Cheese, Danish Blue, 60+ 755 36.1 cheese* Brie cheese, 60+ 759 33.6 cheese* Cheese, processed, 30+ 760 16.5 cheese* Cheese, firm, Danbo 45+ 769 25.0 cheese* Cheese, firm, Danbo 30+ 775 15.7 cheese* Cheese, firm, Danbo 20+ 776 12.1 cheese* Cheese, firm, Havarti 60+ 779 38.1 cheese* Feta cheese, 50+ 787 25.2 cheese* Bacon, roasting piece 13 42.0 pork fat Black pudding 16 20.8 pork fat Lamb, unspec., raw 138 30.5 lamb fat Lamb, fore end, raw 139 13.3 lamb fat Liver, calf, raw 144 3.9 beef fat Liver, pig, raw 146 3.2 pork fat Ham, boiled, tinned 248 5.4 pork fat Ham, smoked 249 13.0 pork fat Ham, smoked, boiled 250 14.0 pork fat

141
Foodstuff FoodId g fat/100 g foodstuff
Commodity type used in calculation.
Salami 274 41.7 pork/beef fat** Pork tenderloin, trimmed, raw 286 5.3 pork fat Pork shoulder with rind, raw 287 12.9 pork fat Frankfurt sausage 292 23.2 pork fat Mettwurst, raw 294 17.3 pork fat Pork roll 295 25.2 pork fat Saveloy 296 22.8 Pork fat Liver paste 297 21.7 pork fat Pork fillet, smoked 298 2.2 pork fat Pork, brawn 299 18.2 pork fat Pork, hand, approx. 16% fat, raw 376 16.0 pork fat Pork, tenderloin, trimmed, raw 378 3.8 pork fat Pork, loin with rind, raw 379 18.3 pork fat Pork, loin, defatted (approx. 3 mm fat), raw 380 12.2 pork fat Pork, collar, defatted, raw 381 11.8 pork fat Pork, collar with rind, raw 382 22.5 pork fat Beef, inside “cap on”, raw 418 8.6 beef fat Beef, outside, round, raw 420 6.2 beef fat Beef, rumpsteak “cap on”, raw 424 10.4 beef fat Beef, fillet, defatted, raw 428 6.4 beef fat Beef, striploin “cap on”, raw 429 17.3 beef fat Beef, Brisket, anterior part, raw 436 15.1 beef fat Beef brisket, posterior part, raw 438 27.8 beef fat Saddle of pork, smoked, boiled 548 10.0 pork fat Salt meat 549 3.0 beef fat Beef brisket, boiled 551 22.1 beef fat Lamb leg, trimmed, raw 941 5.5 lamb fat Garfish 82 2.7 garfish, raw Caviar, Danish (roe, lump-sucker) 118 5.7 lumpsucker, raw Salmon, raw 135 10.0 salmon, raw Mackerel, raw 175 24.4 mackerel Mackerel, smoked 177 24.3 mackerel, smoked Mackerel in tomato sauce, tinned 178 15.5 mackerel in tomato sauce Shrimps, tinned 219 1.2 plaice, raw Plaice, raw 236 1.5 plaice, raw Herring, pickled 244 15.9 herring, pickled Herring, smoked 245 12.3 herring, raw Herring, raw 246 13.1 herring, raw Cod fillet, raw 312 0.6 cod Cod roe, tinned 317 3.7 cod relative to fat content Tuna in water, tinned 318 1.0 tuna in water Eel, raw 353 31.5 eel, raw Eel, smoked 354 27.8 eel, raw Rainbow trout, farmed, raw 886 6.7 rainbow trout, farmed Saithe, fillet, frozen 908 0.2 plaice, raw Shrimps, frozen 910 1.1 plaice, raw Duck, meat and skin, raw 6 39.3 duck fat

142
Foodstuff FoodId g fat/100 g foodstuff
Commodity type used in calculation.
Duck, meat, raw 7 5.1 duck fat Goose, meat and skin, raw 66 33.6 other poultry fat Goose, meat, raw 67 7.1 other poultry fat Hen, meat, raw 97 2.7 chicken fat Turkey, meat, raw 110 2.2 turkey fat Chicken, meat, raw 131 5.7 chicken fat Chicken, meat and skin, raw 132 11.8 chicken fat Eggs, yolk, raw 339 30.9 eggs Eggs, whole, raw 340 11.2 eggs Eggs, white, raw 341 0.0 eggs Eggs, whole, powdered 1032 41.8 eggs Butter, salted 269 81.4 butter Soyabean oil 271 100.0 vegetable oil Cod liver oil 315 100.0 Cod liver oil Grapeseed oil 328 100.0 vegetable oil Olive oil 482 100.0 vegetable oil Rape seed oil 1100 100.0 vegetable oil Mixed butter fat 1235 80.8 mixed butter fat Margarine, 80% fat, vegetable fat, table use
1250 82.6 margarine
Margarine, 80% fat for frying/baking, vegetable fat
1253 82.5 margarine
Margarine, 80% fat for frying/baking, animal and vegetable fat
1254 82.6 margarine
* Based on 70% of contents in Danish cheese and 30% of contents in foreign cheese.
** Based on an average of average contents in beef fat and pork fat.

143
11.3.31 Limits of detection for organochlorine pesticides and indicator PCB
Limit of detection for cheese (mg/kg fat).
Year 1998 1999 2000 2001 2002 2003Substanceα-HCH 0.002 0.001 0.003 0.001 0.001 0.001β-HCH 0.001 0.001 0.001 0.001 0.001 0.001ΣChlordan 0.004 0.005 0.005 0.003 0.003 0.002ΣDDT 0.002 0.001 0.001 0.001 0.001 0.001Dieldrin 0.005 0.003 0.003 0.002 0.001 0.001Endosulfan A 0.001 0.001 0.001 0.004 0.002 0.001HCB 0.001 0.001 0.001 0.001 0.001 0.001ΣHeptachlor 0.002 0.001 0.001 0.002 0.002 0.001Lindane 0.002 0.001 0.001 0.001 0.001 0.001ΣPCB 0.031 0.019 0.019 0.022 0.010 0.007PCB28 0.007 0.002 0.002 0.003 0.001 0.001PCB52 0.004 0.001 0.001 0.003 0.001 0.001PCB101 0.002 0.002 0.002 0.002 0.001 0.001PCB105 0.005 0.004 0.004 0.004 0.001 0.001PCB118 0.001 0.003 0.003 0.002 0.001 0.001PCB138 0.003 0.002 0.002 0.003 0.001 0.001PCB153 0.002 0.002 0.002 0.002 0.001 0.001PCB156 0.001 0.001 0.001 0.001 0.001 0.001PCB170 0.003 0.001 0.001 0.001 0.001 0.001PCB180 0.003 0.001 0.001 0.001 0.001 0.001
Limit of detection for milk, butter ect. (mg/kg fat).
Year 1998 1999 2000 2001 2002 2003Substanceα-HCH 0.002 0.001 0.001 0.001 0.001 0.001β-HCH 0.001 0.001 0.001 0.001 0.001 0.001ΣChlordan 0.003 0.003 0.003 0.003 0.003 0.002ΣDDT 0.002 0.002 0.002 0.002 0.002 0.000Dieldrin 0.005 0.003 0.002 0.002 0.001 0.002Endosulfan A 0.001 0.004 0.004 0.004 0.001 0.001HCB 0.001 0.001 0.001 0.001 0.001 0.001ΣHeptachlor 0.002 0.002 0.002 0.002 0.001 0.001Lindane 0.002 0.001 0.001 0.001 0.001 0.002ΣPCB 0.034 0.022 0.022 0.022 0.013 0.012PCB28 0.007 0.003 0.003 0.003 0.001 0.002PCB52 0.004 0.003 0.003 0.003 0.002 0.002PCB101 0.002 0.002 0.002 0.002 0.002 0.002PCB105 0.006 0.004 0.004 0.004 0.002 0.001PCB118 0.002 0.002 0.002 0.002 0.001 0.001PCB138 0.003 0.003 0.003 0.003 0.001 0.001PCB153 0.003 0.002 0.002 0.002 0.001 0.002PCB156 0.001 0.001 0.001 0.001 0.001 0.001PCB170 0.003 0.001 0.001 0.001 0.001 0.001PCB180 0.003 0.001 0.001 0.001 0.001 0.0004

144
Limit of detection for fish oil including cod liver oil (mg/kg).
Year 1998Substanceα-HCH 0.002β-HCH 0.004ΣChlordan 0.009ΣDDT 0.002Dieldrin 0.004Endosulfan A 0.004HCB 0.002ΣHeptachlor 0.004Lindane 0.004ΣPCB 0.042PCB28 0.004PCB52 0.010PCB101 0.002PCB105 0.005PCB118 0.002PCB138 0.004PCB153 0.003PCB156 0.004PCB170 0.004PCB180 0.004
Limit of detection for cod liver and herring (mg/kg).
Year 1998 1999 2000 2002 2003Substanceα-HCH 0.002 0.002 0.004 0.001 0.001β-HCH 0.002 0.002 0.002 0.001 0.001ΣChlordan 0.010 0.010 0.012 0.003 0.004ΣDDT 0.002 0.002 0.002 0.001 0.001Dieldrin 0.002 0.002 0.005 0.006 0.003Endosulfan A 0.004 0.004 0.004 0.001 0.002HCB 0.002 0.002 0.002 0.001 0.001ΣHeptachlor 0.004 0.004 0.003 0.001 0.004Lindane 0.002 0.002 0.004 0.004 0.002ΣPCB 0.033 0.031 0.040 0.017 0.022PCB28 0.004 0.004 0.006 0.002 0.004PCB52 0.001 0.001 0.006 0.004 0.004PCB101 0.002 0.002 0.003 0.002 0.003PCB105 0.004 0.004 0.005 0.001 0.002PCB118 0.002 0.002 0.005 0.001 0.002PCB138 0.004 0.004 0.003 0.002 0.003PCB153 0.004 0.002 0.005 0.002 0.003PCB156 0.004 0.004 0.002 0.001 0.001PCB170 0.004 0.004 0.002 0.001 0.001PCB180 0.004 0.004 0.003 0.001 0.001

145
Limit of detection for egg (mg/kg).
Year 1998 1999 2000 2001 2002 2003Substanceα-HCH 0.001 0.001 0.001 0.001 0.0005 0.0004β-HCH 0.002 0.001 0.001 0.001 0.0002 0.0003ΣChlordan 0.002 0.002 0.002 0.003 0.001 0.001ΣDDT 0.001 0.001 0.001 0.001 0.0005 0.0005Dieldrin 0.002 0.002 0.002 0.002 0.0004 0.0005Endosulfan A 0.001 0.001 0.001 0.001 0.0002 0.0002HCB 0.001 0.001 0.001 0.001 0.0003 0.0002ΣHeptachlor 0.002 0.001 0.001 0.001 0.001 0.001Lindane 0.001 0.001 0.001 0.001 0.0004 0.0004ΣPCB 0.014 0.015 0.015 0.016 0.005 0.004PCB28 0.002 0.002 0.002 0.002 0.001 0.001PCB52 0.002 0.001 0.001 0.001 0.001 0.001PCB101 0.002 0.001 0.001 0.001 0.0002 0.0003PCB105 0.001 0.002 0.002 0.002 0.001 0.001PCB118 0.001 0.002 0.002 0.002 0.0004 0.0003PCB138 0.001 0.002 0.002 0.002 0.001 0.001PCB153 0.001 0.002 0.002 0.002 0.0004 0.0004PCB156 0.002 0.001 0.001 0.001 0.0001 0.0001PCB170 0.001 0.001 0.002 0.002 0.0003 0.0001PCB180 0.001 0.002 0.001 0.001 0.0003 0.0002
Limit of detection for animal fat (pork, beef, poultry, lamb etc.)(mg/kg fat).
Year 1998 1999 2000 2001 2002 2003Substanceα-HCH 0.002 0.001 0.001 0.001 0.001 0.001β-HCH 0.001 0.001 0.001 0.001 0.001 0.001ΣChlordan 0.004 0.004 0.004 0.004 0.003 0.002ΣDDT 0.002 0.002 0.001 0.001 0.001 0.001Dieldrin 0.005 0.003 0.004 0.004 0.005 0.001Endosulfan A 0.001 0.001 0.001 0.001 0.001 0.001HCB 0.001 0.001 0.001 0.001 0.001 0.001ΣHeptachlor 0.002 0.002 0.002 0.001 0.001 0.001Lindane 0.002 0.002 0.001 0.001 0.001 0.001ΣPCB 0.034 0.026 0.024 0.024 0.018 0.007PCB28 0.007 0.003 0.001 0.001 0.002 0.001PCB52 0.004 0.002 0.003 0.003 0.003 0.001PCB101 0.002 0.002 0.002 0.002 0.003 0.001PCB105 0.006 0.003 0.005 0.005 0.001 0.001PCB118 0.002 0.003 0.004 0.004 0.002 0.001PCB138 0.003 0.003 0.003 0.003 0.002 0.001PCB153 0.003 0.003 0.003 0.003 0.002 0.001PCB156 0.001 0.001 0.001 0.001 0.001 0.001PCB170 0.003 0.003 0.001 0.001 0.001 0.001PCB180 0.003 0.003 0.001 0.001 0.001 0.001
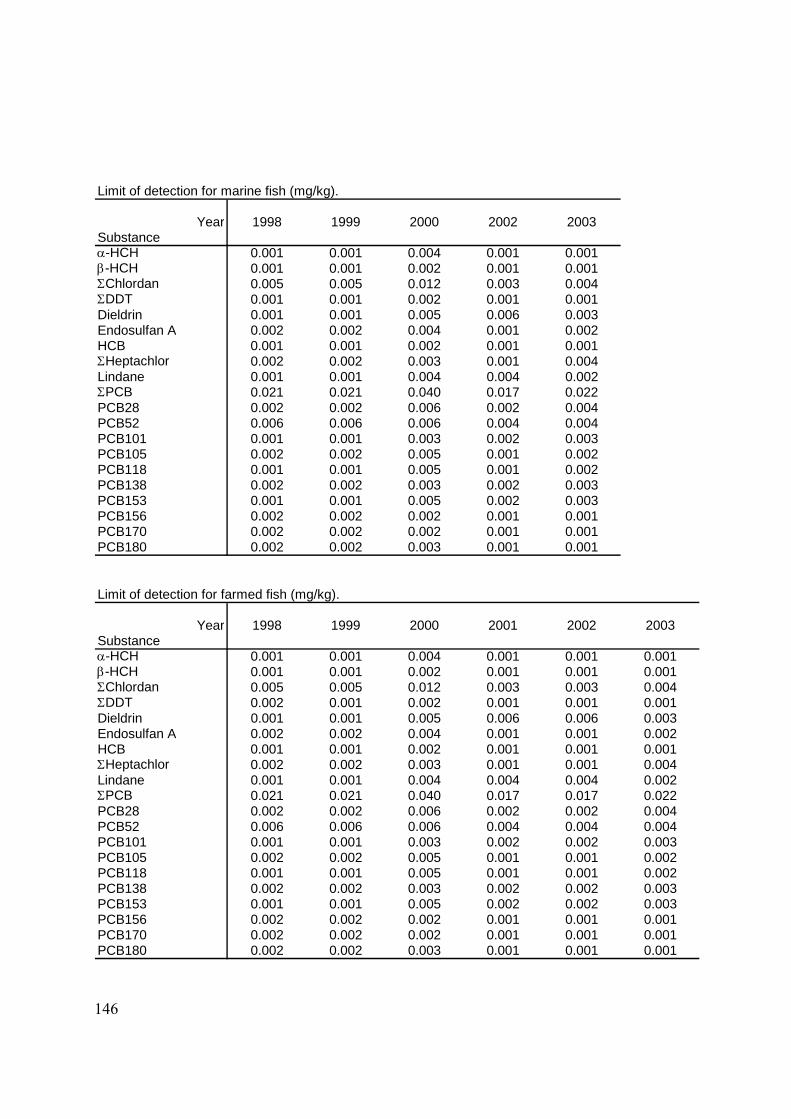
146
Limit of detection for marine fish (mg/kg).
Year 1998 1999 2000 2002 2003Substanceα-HCH 0.001 0.001 0.004 0.001 0.001β-HCH 0.001 0.001 0.002 0.001 0.001ΣChlordan 0.005 0.005 0.012 0.003 0.004ΣDDT 0.001 0.001 0.002 0.001 0.001Dieldrin 0.001 0.001 0.005 0.006 0.003Endosulfan A 0.002 0.002 0.004 0.001 0.002HCB 0.001 0.001 0.002 0.001 0.001ΣHeptachlor 0.002 0.002 0.003 0.001 0.004Lindane 0.001 0.001 0.004 0.004 0.002ΣPCB 0.021 0.021 0.040 0.017 0.022PCB28 0.002 0.002 0.006 0.002 0.004PCB52 0.006 0.006 0.006 0.004 0.004PCB101 0.001 0.001 0.003 0.002 0.003PCB105 0.002 0.002 0.005 0.001 0.002PCB118 0.001 0.001 0.005 0.001 0.002PCB138 0.002 0.002 0.003 0.002 0.003PCB153 0.001 0.001 0.005 0.002 0.003PCB156 0.002 0.002 0.002 0.001 0.001PCB170 0.002 0.002 0.002 0.001 0.001PCB180 0.002 0.002 0.003 0.001 0.001
Limit of detection for farmed fish (mg/kg).
Year 1998 1999 2000 2001 2002 2003Substanceα-HCH 0.001 0.001 0.004 0.001 0.001 0.001β-HCH 0.001 0.001 0.002 0.001 0.001 0.001ΣChlordan 0.005 0.005 0.012 0.003 0.003 0.004ΣDDT 0.002 0.001 0.002 0.001 0.001 0.001Dieldrin 0.001 0.001 0.005 0.006 0.006 0.003Endosulfan A 0.002 0.002 0.004 0.001 0.001 0.002HCB 0.001 0.001 0.002 0.001 0.001 0.001ΣHeptachlor 0.002 0.002 0.003 0.001 0.001 0.004Lindane 0.001 0.001 0.004 0.004 0.004 0.002ΣPCB 0.021 0.021 0.040 0.017 0.017 0.022PCB28 0.002 0.002 0.006 0.002 0.002 0.004PCB52 0.006 0.006 0.006 0.004 0.004 0.004PCB101 0.001 0.001 0.003 0.002 0.002 0.003PCB105 0.002 0.002 0.005 0.001 0.001 0.002PCB118 0.001 0.001 0.005 0.001 0.001 0.002PCB138 0.002 0.002 0.003 0.002 0.002 0.003PCB153 0.001 0.001 0.005 0.002 0.002 0.003PCB156 0.002 0.002 0.002 0.001 0.001 0.001PCB170 0.002 0.002 0.002 0.001 0.001 0.001PCB180 0.002 0.002 0.003 0.001 0.001 0.001

147
11.4 Appendix to Mycotoxins
11.4.1 Occurrence of ochratoxin A in wheat (kernels and flour) from the Danish marked, in relation to harvest years (1986-2003) and method of cultivation (conventional and organic)
Product Harvest year* (estimated har-vest conditions)
No. of samples
Number of samples containing ochratoxin A in the interval
(µg/kg)
Mean
(µg/kg)
Maximum
(µg/kg) **d.-4.9 5.0-25 >25 Conventionally grown wheat
1986 (average) 1987 (very wet) 1988 (dry) 1989 (very dry) 1990 (very dry) 1991 (very dry) 1992 (very dry) 1993 (average) 1994 (dry) 1995 (very dry) 1996 (very dry) 1997 (very dry) 1998 (wet) 1999 (average) 2000 (dry) Total 1986-2000 Total 1998-2000
61 41 63 68 63 69 65
111 78 71 66 68 67 35 70
996
172
25 22 13 17
7 22 29 76 53 20 36 39 25 12
8
3 2 0 1 0 0 2 0 1 0 1 0 1 0 0
0 2 0 1 0 0 0 1 0 0 0 0 0 0 0
0.9 2.8 0.2 1.0 0.1 0.1 0.4 0.5 0.3 0.1 0.3 0.2 0.4 0.1 0.1
0.4
0.2
24 37 2.6 51 4.7 1.7 9.3 32 16 0.6 8.0 0.9 16 1.1 0.7
Organically grown wheat
1986 (average) 1987 (very wet) 1988 (dry) 1989 (very dry) 1990 (very dry) 1991 (very dry) 1992 (very dry) 1993 (average) 1994 (dry) 1995 (very dry) 1996 (very dry) 1997 (very dry) 1998 (wet) 1999 (average) 2000 (dry) Total 1986-2000 Total 1998-2000
10 10
8 17 11 16
2 21 11 21 21 22 23 13 13
219
49
5 4 2 3 6 5 1
16 11 19 21 18 10
6 4
0 2 0 0 0 1 0 1 0 0 0 0 0 0 0
0 0 0 0 1 0 0 0 0 0 0 0 0 0 0
0.6 2.9 0.2 0.2 3.8 0.5
0.04 1.4 0.4 0.1 0.4 0.3 0.4 0.3 0.2
0.7 0.3
4.9 21 1.2 2.9 36 6.8
0.08 19 0.6 0.4 1.0 1.5 1.7 1.6 1.2
* Harvest conditions in harvest years were assessed as one of five: very wet, wet, average, dry, and very dry. For details, see Jørgensen et al. (1996). ** d.: limit of detection.

148
11.4.2 Occurrence of ochratoxin A in rye (kernels and flour) from the Danish marked, in relation to harvest years (1986-2003) and method of cultivation (conventional and organic)
Product Harvest year* (estimated harvest
conditions)
Number of samples
Number of samples containing ochratoxin A in the interval
(µg/kg)
Mean
(µg/kg)
Maximum
(µg/kg) **d.-4.9 5.0-25 >25 Conventionally grown rye
1986 (average) 1987 (very wet) 1988 (dry) 1989 (very dry) 1990 (very dry) 1991 (very dry) 1992 (very dry) 1993 (average) 1994 (dry) 1995 (very dry) 1996 (very dry) 1997 (very dry) 1998 (wet) 1999 (average) 2000 (dry) 2001 (average) 2002 (dry) 2003 (very dry) Total 1986-2003 Total 1998-2003
102 40 89 97 64 69 64 77 75 83 75 80 74 42 45 42 56 41
1215
300
35 17 19 29 11 38 27 56 61 69 53 47 42 21 25 23 34 28
4 6 3 1 1 1 2 5 0 0 2 2 2 0 2 0 0 0
3 1 0 0 0 0 1 3 0 0 0 0 0 2 0 0 0 0
2.5 5.3 0.5 0.3 0.2 0.4 0.7 2.2 0.3 0.2 0.4 0.4 1.0 2.5 1.5 0.5 0.2 0.4
1.0 1.0
77 121 12
9.2 8.4 7.2 26 33
4.2 3.1 9.8 8.4 12 63 25
3.6 1.6 2.0
Organically grown rye
1986 (average) 1987 (very wet) 1988 (dry) 1989 (very dry) 1990 (very dry) 1991 (very dry) 1992 (very dry) 1993 (average) 1994 (dry) 1995 (very dry) 1996 (very dry) 1997 (very dry) 1998 (wet) 1999 (average) 2000 (dry) 2001 (average) 2002 (dry) 2003 (very dry) Total 1986-2003 Total 1998-2003
12 22 11 14 16 16 1
10 15 28 32 37 32 17 8
24 26 21
342 128
8 11 7 5
10 14 1 8
13 27 29 30 28 8 3
14 15 13
0 7 1 2 2 0 0 0 1 1 2 2 0 0 0 2 2 2
1 2 0 0 1 0 0 0 1 0 0 1 2 0 0 0 0 0
9.1 12.5 2.1 1.0 3.8 0.5 4.8 0.4 5.8 1.0 1.3 2.0 3.3 0.3 0.5 1.1 1.7 1.1
2.7 1.6
100 120 20
6.4 37
1.4 4.8 1.3 68
5.7 5.9 45 55
2.0 3.0 7.6 19
8.7
* Harvest conditions in harvest years were assessed as one of five: very wet, wet, average, dry, and very dry. For details, see Jørgensen et al. (1996). ** d.: limit of detection.

149
11.4.3 Estimates of ochratoxin A contents (µg/kg) in foods included in intake calculations
Foodstuff (Food Id. No.)
Conventional wheat and rye
1998-2003 (µg/kg)
Organic wheat and rye 1998-2003
(µg/kg)
Wheat bran (86) a 0.7 0.7
Wheat bread, wheat products (174, 532, 533, 594, 854, 1009, 1016, 1018, 1310, 1311, 1313, 1317, 1318, 1456-1458, 1463-1470) b
0.14 0.21
Pasta, cooked (398) f 0.04 0.06
Oatmeal (530) a 0.4 0.4
Wheat flour (531, 542) c 0.2 0.3
Rye bread products (535, 536, 732, 1309, 1314, 1315) d
0.7 1.12
Rye flour and kernels (541, 862) c 1.0 1.6
Raisins (227) a 1.0 1.0
Pork products (248-250, 298, 374, 376, 378-382, 548, 925, 1247) a
0.15 0.15
Poultry products (6,7,66,67,97, 110,131,132) a 0.03 0.03
Coffee (105) a 0.035 0.035
Red wine (237) a 0.3 0.3
Beer (346, 348-350,979) a 0.05 0.05
a) See page 132 in [OV 1993-97]. b) Calculated on the basis of factor of 70% for contents of wheat in the products c) Calculated on the basis of all samples of both kernels and flour. d) Calculated on the basis of a factor of 70% for contents of rye in the products. f) Calculated on the basis of samples of wheat and 70% water in cooked product.

150