charleston county school district · charleston county school district ... scope, and methodology...
TRANSCRIPT

Charleston County School District
Report on Forensic Accounting Examination

Charleston County School District Contents
Transmittal Letter ...................................................................................................................................................... 1 Executive Summary ........................................................................................................................................ 2 Basis, Scope, and Methodology ...................................................................................................................... 4 Results of Procedures and Findings .......................................................................................................................... 6
IT Governance and Control .................................................................................................................................. 6 Budgetary and Budget to Actual ........................................................................................................................ 11 Payroll and HR .................................................................................................................................................... 20
Conclusion and Recommendations ............................................................................................................... 31 Exhibit One – Budget to Actual by Location Exhibit Two – Budget to Actual by Function Exhibit Three – Budget to Actual by Object

Board of Trustees Charleston County School District Attn. Mr. Todd Garrett Charleston, South Carolina Dear Mr. Garrett:
We have concluded our forensic accounting examination for the Charleston County School District (the
“District”). This report presents our findings based upon the results of our procedures. In performing our
services, we made inquiries and completed analyses based on the information made available to us, and we
relied on the sufficiency, accuracy and reliability of the information provided by the District. Our procedures do
not constitute an audit, review or compilation of such information, and we offer no assurance on the
completeness or accuracy of the information.
We performed the procedures listed in this report. The procedures cannot be relied upon to disclose all errors,
fraud or other illegal acts that may exist. Had we performed additional procedures, other matters might have
come to our attention that would have been reported to you.
This report is intended solely for the information and use of the Board of Trustees and District management and
is not intended to be and should not be used by any other party. In addition, our report is based on the results of
the procedures performed through the date of our report; we have no responsibility to update our report for
events and circumstances that relate to the period of our examination that are made known to us after March
14, 2016.
Charleston, South Carolina March 14, 2016

Executive Summary
2
Executive Summary
Elliott Davis Decosimo, LLC (“Elliott Davis Decosimo”, the “Firm”, or “we”) conducted a forensic accounting
examination upon the execution of services agreement no. 01602336 with the District. The purpose of the
examination was to ascertain the factor or factors that resulted in the District’s budget overage in payroll and
payroll-related expenditures for the fiscal year ended June 30, 2015 (specific procedures as listed in
“Attachment A” accompanying the services agreement). The scope of our examination was the period
beginning July 1, 2012 and ending June 30, 2015 (i.e. fiscal years, or “FY”, 2013, 2014, and 2015).
The District as a whole experienced a net negative budget variance of approximately $18.9 million in FY2015,
resulting from several significant factors as laid out below:
(9.3)$ million - revenues under budget in the General Fund
(2.0) million - charter school payments over budget
(1.9) million - food services operations (less payroll/benefits) over budget
(0.5) million - all other functions/objects, net, over budget
(5.2) million - payroll/benefits expenditures over budget
(18.9)$ million
The scope of our examination is the negative variance in the amount of $5.2 million related to payroll and
benefit expenditures.
Our procedures included conducting meetings with District personnel from the human resources (HR), payroll,
information technology (IT), and finance departments in order to develop an understanding of the significant
processes and workflows in these departments as related to the objective of our examination. Additionally, we
obtained several hundred pieces of documentation from District personnel in the form of general ledger details,
budget to actual reports, payroll registers, human resources action entry reports, salary/wage rate schedules,
employee roster reports, and other information in order to develop and perform our analyses. Our analytical
procedures included budget to actual analysis, employee payments year-over-year analysis, comparison of
employee salary/wage rate to approved schedules, analysis of payments to terminated employees, and analysis
of overtime payments, among others.
The results of our procedures resulted in the identification of certain issues, including, but not limited to, the
following:
Ineffective IT governance and lack of basic IT general controls;
Underutilization of District-wide IT applications including MUNIS (general ledger and enterprise
management program) and Kronos time-keeping application;
Highly decentralized processes for executing standard HR and payroll functions that has resulted in
chronic unscheduled payroll runs and has prevented terminated employees from being removed from
the payroll timely;
A labor intensive budgeting process that uses prior year budget rather than prior year actual results as a
starting point, and which does not provide for timely and effective mid-year reporting;
A lack of basic budgetary control that prevented the identification of significant budget overages until
Executive Summary
3
after the end of the fiscal year;
Payroll and benefit related expenditures in the General Fund, Special Revenue Fund, EIA Fund, and Food
Service Fund were collectively over budget by approximately $5.2 million in FY2015;
Approximately $4.8 million of the $5.2 million budget overage for payroll and benefit expenditures can
be attributed to the “School-Wide Accounts” location code and is related to significant budgeted savings
from lapsed salaries not being realized; budgeted negative expenditures from lapsed salaries/benefits
were ($10,628,984), ($4,398,267), and ($7,120,682) in FY2015, FY2014, and FY2013, respectively;
The District classified a late filing penalty of approximately $462,000 for late filing of a previous year’s
W-2 forms as an instructional expenditure for purchased services in October of 2014; this expenditure
was unbudgeted and contributed to the District’s overall expenditure budget overage for FY2015;
Employees are being paid overtime pay without appropriate approval in accordance with District policy;
also, overtime pay of approximately $633,000 for FY2013 through FY2015 was recorded in the general
ledger in regular salary (i.e. non-overtime) object codes; overtime expense, including amounts recorded
to non-overtime object codes, increased from approximately $948,000 in FY2013 to $1,270,000 in
FY2014 and $1,730,000 in FY2015;
We identified confirmed overpayments to a sample of terminated employees totaling over $98,000, and
we estimate that total overpayments for the period are likely higher; the District lacks a standardized
process and tracking mechanism for the identification and recollection of overpayments to terminated
employees.
In addition to presenting our findings, we have included certain recommendations for improvement to District
processes and strengthening District controls. Among our recommendations is that the District continue its
efforts to appropriately staff and structure the IT department to achieve an appropriate model of governance
and implement sound IT general controls. Along these lines, we recommend that the District work to fully
implement the total functionality of the MUNIS enterprise application and utilize the Kronos time-keeping
software District-wide. We further recommend that the District evaluate their current HR and payroll processes
in an effort to streamline the execution and approval of action entries, including terminations. As a part of
improving payroll-related processes, we encourage the District to hold the schools and other locations
accountable for their respective responsibilities related to the approval of employee time cards, approval of
time and attendance batches, and adherence to overtime policies. Detailed recommendations along these lines
and other recommendations are included in the back of the report.

Basis, Scope, and Methodology
4
Basis, Scope and Methodology
As noted previously, the scope of our examination, which was established by the District as stated in their
request for proposals, was the fiscal year 2013 through 2015 (i.e. July 1, 2012 through June 30, 2015). We
developed our forensic examination approach based on the specifications outlined in the District’s request for
proposals that sought to provide an answer to the following over-arching questions:
What condition(s) resulted in the payroll-related budget overage in 2015?
What prevented the condition(s) from being discovered earlier?
Were District salary levels and wage rates uniformly applied and in accordance with approved
schedules?
How should processes be modified in order to prevent future occurrences of similar conditions?
Our approach to the examination included the following phases: (1) preliminary planning, (2) documentation
gathering / processing, (3) execution of analyses, and (4) analysis of results.
Preliminary Planning
We conducted an engagement “kick-off” meeting with certain members of District management on November
30, 2015. Included in the kick-off meeting were representatives from the internal audit, financial services, IT,
and human resources departments. We confirmed the objectives of the examination, provided a preliminary
documentation listing, and set a tentative engagement timeline.
Subsequent to our kick-off meeting we scheduled and conducted department level meetings during the month
of December 2015. We met with management from the HR, IT, and financial services departments (including
the Payroll Director) individually in order to gain an understanding of the processes. From these early
informational meetings we further refined our proposed examination approach and developed the parameters
of our specific analyses/procedures.
Documentation Gathering / Processing
From the information we gathered during the preliminary planning stage of our examination, we identified the
relevant documentation needed to proceed. Such documentation included (for all three fiscal years included in
the project scope):
Audited annual financial statements
General ledger detail and year-end trial balances for all funds containing payroll-related expenditures
Payroll registers
Budget to actual reports from MUNIS at general ledger account level detail
Approved salary and wage rate schedules
Reports of all HR action entries (e.g. new hires, salary changes, terminations, etc.)
Relevant District policies, procedure manuals, and organizational charts
Results of the internal audit department’s testing of the fidelity of implementation of the Fox Lawson
compensation and classification study
Basis, Scope, and Methodology
5
We utilized data analysis software in order to organize and manage the large volume of data contained in the
documentation noted above (for example, the combined monthly payroll registers for just one fiscal year
contain over 3.2 million lines of data). Our analyses were conducted using the processed and synthesized data
and at times exporting certain data to spreadsheets for further analysis and summarization of results.
Execution of Analyses
Using the data contained in the sources noted in the documentation gathering / processing section above, we
performed analyses including the following:
Budget to actual comparison of general ledger expenditure accounts year-over-year by fund, location,
function, and object
Analysis of budgetary transfers/adjustments
Scheduled vs. non-scheduled payroll run identification
Comparison of payroll by employee year-over-year
Supplemental or “lump sum” payments by employee analysis
Employee salary / wage comparison with approved schedules
Employee title/status change analysis
“Ghost employee” identification
Employee address analysis
Overpayment to terminated employee identification
Analysis of overtime payments by employee, location, and fiscal year
Analysis of Results
From the performance of the procedures outlined above we arrived at initial conclusions and identified certain
“outliers” or other instances that required additional follow-up procedures. We performed such follow-up with
the assistance of various District personnel and also through our own research procedures using the read-only
MUNIS access and District shared “U drive” access that was provided to us.
From these follow-up procedures we were able to conclude that each particular instance was either (1)
explained and reasonable based on supporting documentation made available, or (2) represented an exception
to policy/procedure and therefore warranted inclusion in our report. The results of our analyses, including all
identified exceptions or other noteworthy items, are detailed in the Results of Procedures and Findings section
that follows.

Results of Procedures and Findings
IT Governance and Control
6
Results of Procedures and Findings
IT Governance and Control Observations
Identification of IT control gaps
Our assessment of IT control gaps and/or risks was the result of information gathered during the on-site
meetings with District staff augmented by subsequent follow-up emails to clarify the information obtained
during the on-site visits. The risk observations listed are a result of specific meeting comments along with our
experience with payroll and human resources processes, IT processes and systems, and organizational dynamics
all taken together to develop general observations or assessments.
We used the generally accepted body of IT general controls to begin the assessment of the IT department. The
primary focus was on the Information Technology department and their role in supporting the MUNIS system.
The table below lists the full body of controls normally reviewed in an IT control gap assessment. A project
emphasis of “Direct” indicates that we directly reviewed as we deemed these controls to be most directly
correlated to the overall project objectives.
IT General Control Area Project Emphasis
IT Governance and Management
Risk Assessments and IT Strategic Plan Direct
Staffing, Training, and Segregation of Duties Direct
IT Governance – Steering Committee Direct
IT Policies and Data Classification Direct
Security Administration
New user provisioning and changes to user’s roles in MUNIS Direct
Removal of user access to MUNIS Direct
User Access Reviews- review of roles and segregation of duties Direct
Logical Security
Authentication controls and Passwords Note 1
Privilege Users Note 2
Security Monitoring Note 2
Physical Note 1
Results of Procedures and Findings
IT Governance and Control
7
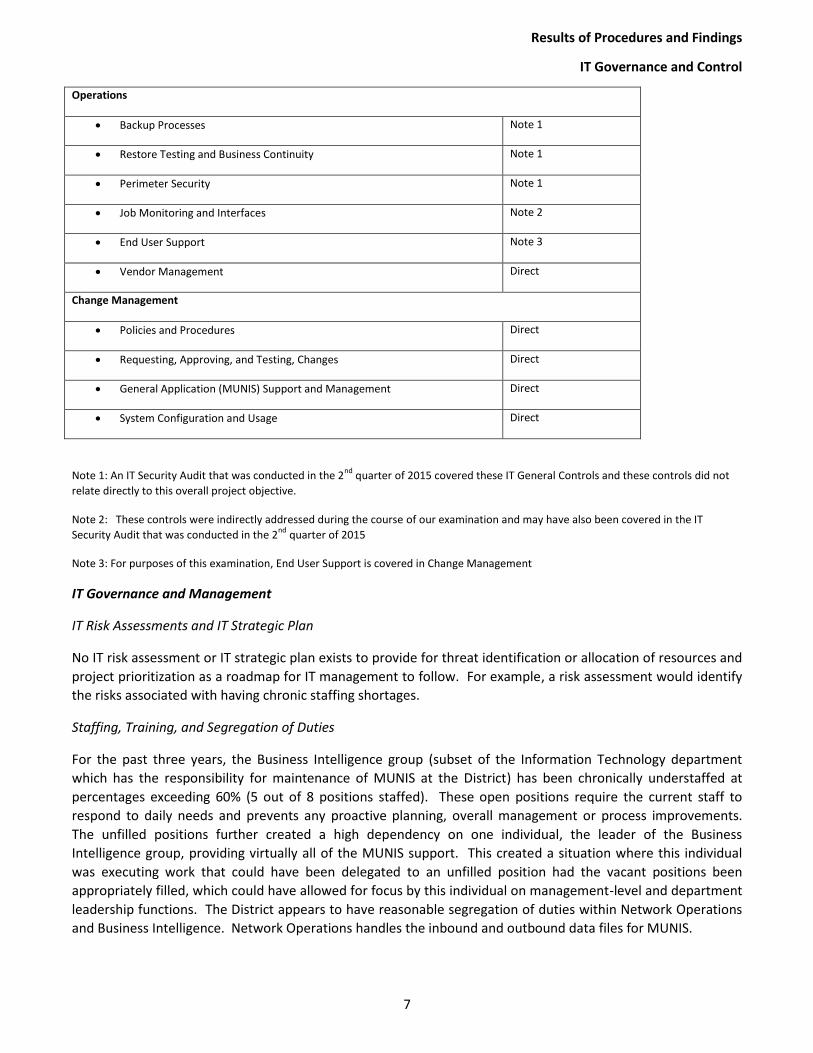
Operations
Backup Processes Note 1
Restore Testing and Business Continuity Note 1
Perimeter Security Note 1
Job Monitoring and Interfaces Note 2
End User Support Note 3
Vendor Management Direct
Change Management
Policies and Procedures Direct
Requesting, Approving, and Testing, Changes Direct
General Application (MUNIS) Support and Management Direct
System Configuration and Usage Direct
Note 1: An IT Security Audit that was conducted in the 2nd
quarter of 2015 covered these IT General Controls and these controls did not
relate directly to this overall project objective.
Note 2: These controls were indirectly addressed during the course of our examination and may have also been covered in the IT
Security Audit that was conducted in the 2nd
quarter of 2015
Note 3: For purposes of this examination, End User Support is covered in Change Management
IT Governance and Management
IT Risk Assessments and IT Strategic Plan
No IT risk assessment or IT strategic plan exists to provide for threat identification or allocation of resources and
project prioritization as a roadmap for IT management to follow. For example, a risk assessment would identify
the risks associated with having chronic staffing shortages.
Staffing, Training, and Segregation of Duties
For the past three years, the Business Intelligence group (subset of the Information Technology department
which has the responsibility for maintenance of MUNIS at the District) has been chronically understaffed at
percentages exceeding 60% (5 out of 8 positions staffed). These open positions require the current staff to
respond to daily needs and prevents any proactive planning, overall management or process improvements.
The unfilled positions further created a high dependency on one individual, the leader of the Business
Intelligence group, providing virtually all of the MUNIS support. This created a situation where this individual
was executing work that could have been delegated to an unfilled position had the vacant positions been
appropriately filled, which could have allowed for focus by this individual on management-level and department
leadership functions. The District appears to have reasonable segregation of duties within Network Operations
and Business Intelligence. Network Operations handles the inbound and outbound data files for MUNIS.

Results of Procedures and Findings
IT Governance and Control
8
Steering Committee
A Steering Committee, comprised of an appropriate mix of functional areas, is in place headed by the Finance
Director. The Committee appears to be more short-term task oriented and not necessarily providing longer term
vision, strategy, or high level oversight and direction. Minutes are not kept and overall tracking of progress on
projects does not appear to be measured and monitored by this group or reported to higher levels.
IT Policies and Data Classifications
No policies specific to IT operations for logical security, security administration, change management,
operations, or overall IT governance exist. No real data classification exists and it is unclear who is classified as
system owners. Data classification is important to ensure the appropriate type and layers of security are applied
to the various types of data. Typical data classifications include data that has these attributes: 1) personally
identifiable information, 2) confidential information, and 3) public information. Additionally, the data
classification process would require a data owner. The data owners should be fully responsible for approving
access to their data. IT’s role should be to grant the approved access level. The user access and role security
reviews (mentioned under Security Administration) should be performed with data owner involvement. Lack of
partnership between IT and other District departments has resulted in frustration, delays, and communication
break-downs.
Additionally, the District may not be required to abide by the South Carolina Division of Information Security (SC
DIS) new Information Security requirements; however, this framework and its policies would provide an
excellent starting point for development and enhancement of the District’s IT policies. The SC DIS Information
Security Policy – Governance (http://www.admin.sc.gov/technology-/information-security) section contains
specific guidance for the implementation of security policies.
Security Administration
Provisioning users to MUNIS
The District has defined procedures for adding or changing user’s access to MUNIS. A standard form is used and
defined roles are given.
Removing users from MUNIS
The District also has a defined process for removal of terminated users from MUNIS, which appears adequately
designed. We noted that some vendors have limited access to MUNIS; however there is not a defined process
for removal of vendor named accounts in the event a vendor employee is terminated.

Results of Procedures and Findings
IT Governance and Control
9
Security Access Reviews
The primary area of concern within security administration is in the definition of roles and possible segregation
of duties among roles. Roles within MUNIS can be customized by IT. The District uses two primary roles (Basis
and Supervisor) and has 18 customized roles plus two for vendors. All payroll and HR roles are in the set of
custom roles. Some type of security review was conducted in past years; however, it did not appear to be a
segregation of duties review. Additionally, the review was not documented in an auditable manner. Security
roles can be complex to review properly with consideration for job functions across business areas and can be a
time consuming project. It is common, but incorrect, to assign roles based on functions needed to perform a job
versus looking at specific job functions and determining if there are conflicts first, then designing and assigning
roles. It is our understanding that roles are now being reviewed across the board for alignment with job
responsibilities.
Logical Security
The logical security controls were indirectly assessed during this project. Logical security was addressed during
the 2015 IT Security Audit that was coordinated through internal audit. With respect to MUNIS, we noted that
all MUNIS users have unique user ID and passwords. Additionally, MUNIS does track individual user activity into
audit logs; however, no process or defined audits have been developed to review available transactional details.
Typically, periodic reviews of audit logs are used to look for unusual activity, trends, unrecognized user ids,
activity during non-business hours, and other potential warnings for unwarranted activity. For example, there is
a “Role Change History Report” from MUNIS that shows all changes made to security roles.
This type of review is particularly important as it would provide some oversight to the activities of the Business
Intelligence group. With this group being significantly under staffed with one individual controlling assignments
within the Business Intelligence group, oversight of this person’s activities becomes more critical.
Additionally, we noted that the District’s internal IT Security Audit raised several overall security concerns that
could compromise the import and export of data files to third parties.
Operations
Job monitoring
Our consideration of job monitoring was limited to review of the process by which files are transferred into or
out of MUNIS. For example, ACH payroll files going to the bank may sit on a network file share and these files
are typically editable. Access to such files needs to be in a secure network location to prevent editing the files
and altering records. All file transmissions appear to be controlled within IT by the Network Operations group,
distinct from the Business Intelligence group.

Results of Procedures and Findings
IT Governance and Control
10
Vendor Management
The District is highly dependent upon their relationship with Tyler Technologies. As such, the management of
this vendor is critical to the on-going relationship and support for MUNIS. The MUNIS system is hosted by Tyler
Technologies; therefore, Tyler Technologies has full access to the District’s data at all times. The IT Security
Audit conducted in 2015 revealed that Tyler Technologies will not provide the following: audit process
documentation, network diagram, information system inventory, telecommunication service process, events
constituting a system recovery and reconstitution. Tyler Technologies provides a device for communication
from the District to Tyler; however the device was not allowed to be included in the internal or external
vulnerability scans conducted by a contracted third party. While some of these items are outside the scope of
this examination, the audit process documentation is information that, if requested, should be made available.
Since Tyler Technologies does not have a Service Organization Control Report (SOC 1), the District should
explore options to obtain assurance that Tyler Technology has internal controls to safeguard the District’s data.
Change Management
Policies and Practices
No change management policies exist. Change management policies and procedures are often associated with
in-house development activity. While the District does not perform any true coding changes to MUNIS, they do
have the ability to change system parameters, build reports, modify workflow rules, alerts, and routings – all
tasks that can directly affect the processes, approvals, and reporting within payroll and human resources. These
types of changes should be better controlled and documented as they can have financial impact.
Requesting, approving, and testing changes
IT has a ticketing system (HEAT); however, this system is not consistently used for the intake of user requests
being made to IT, making it impossible to obtain a good population of users’ requests. Requests have been
received in IT through informal means such as calls or emails. User visibility into the status of requests is
extremely limited. The prioritization of requests revolved around one individual with some input from the
Steering Committee. User requests may be discussed in IT Steering Committee meetings, but no process is
apparent for determining the validity or need for some requests. Requests may be acted upon without
consideration of the root cause. For example, a request may be made regarding a particular report, but further
analysis may reveal that the true need is additional training in MUNIS. How IT prioritizes requests or considers
overlapping or potentially conflicting requests has been up to the discretion of the leader of the Business
Intelligence Group. There is no system in place to hold the Business Intelligence group accountable for requests
within time frames.
Additionally, project management for large projects has clearly been impacted through staffing issues,
prioritization of requests, and general lack of sufficient IT oversight and leadership. These factors have resulted
in functional areas, such as Payroll and Human Resources, having considerable frustration with Business
Intelligence.
System configuration and usage
We noted or were made aware of multiple examples of employees not utilizing MUNIS effectively, likely due to
training issues, time to examine set-up options in MUNIS, or lack of general knowledge of MUNIS capabilities.
The system has the capability to help ‘enforce’ business processes, but in many cases this capability is not being
leveraged. The system can be better utilized to help enforce process discipline in a highly decentralized
environment.

Results of Procedures and Findings
Budgetary and Budget to Actual
11
Budgetary and Budget/Actual Procedures
Budgeting Process
As part of our preliminary planning procedures we met with several individuals from the Office of Financial
Services to discuss the District’s process for developing the approved budgets for fiscal years ended June 30,
2013, 2014, and 2015. We noted that the process was similar for each of these three fiscal years, and as such
our observations here are primarily related to the development of the FY2015 budget.
With some exceptions, the District employed an “incremental budgeting” approach whereby the previous year’s
budget was used as the starting point for the succeeding year as opposed to a “zero based budgeting” approach
which calls for effectively “starting from scratch” each year. Accordingly, the starting point for FY2015’s general
fund expenditure budget was the total expenditures amount from the FY2014 budget ($382,064,659). The
‘Balancing the Budget’ section on pages 45 through 47 of the FY 2015 Second Reading document (June 9, 2014)
provides a high-level reconciliation of the FY2014 general fund expenditure budget amount to the approved
FY2015 amount of $404,009,148. Included in the $21,944,489 net increase in budgeted expenditures from
FY2014 to FY2015 are the following items:
$8,500,000 for implementation of the new salary/wage schedules
$3,100,000 step increase
$2,000,000 based on projected student enrollment for additional staff and supply allocations
$2,270,281 increase in charter school payments (general fund only; total budgeted payments to charter
schools actually decreased for all funds combined from FY2014 to FY2015)
According to the FY2015 Budget Assumptions section of the FY 2015 Second Reading document, increased
enrollment of 500 students was built into the $2,000,000 enrollment increase amount shown above. Per review
of the Projected Enrollment schedules contained in the FY2014 and FY2015 budget documents, the FY2015
budget actually considers an expected increase of 1,064 students (increase of 571 in grades K through 12 and
increase of 493 in Head Start, Early Head Start, and CD). The Finance Director explained to us that the additional
564 students are spread throughout several of the other budgeted increases, including the $2,270,281 charter
school payment increase shown above as well as certain transportation line items.
We compared the District’s enrollment estimates to the South Carolina Department of Education’s (SCDE) active
student headcounts published and made available on their website. We noted that the SCDE’s headcounts do
not contain Head Start, Early Head Start, and CD students, so we backed these out of the District’s enrollment
estimates to arrive at K12 enrollment projections. As shown below, the District projected an increase of 571
students for grades K through 12 whereas the actual increase in average headcount per the SCDE was 1,180 (or
approximately 207% of the District’s estimate).
FY2015 FY2014 Change
Average Count - K12 - SCDE 46,799 45,619 1,180
Projected Enrollment Used in Budget - K12 46,087 45,516 571

Results of Procedures and Findings
Budgetary and Budget to Actual
12
School-Wide Accounts
The District’s approved budget groups expenditures by location but also includes a “School-Wide Accounts”
location (location code 0999) that contains expenditures that are not specific to one location. The District
Budget Director described this location as containing “holding accounts”, meaning accounts meant to house
certain budgeted items until they can be transferred or are incurred by a specific location.
We noted from our inspection of the School-Wide Accounts location the inclusion of significant negative
budgeted expenditures, particularly in the General Fund for payroll and benefit related expenditures. We
inquired as to the reason for negative expenditure items and determined that such items represented estimates
for lapsed salaries District-wide (i.e. savings contained in time between termination of a teacher and the hiring
of his/her replacement). We inspected the approved FY2015 budget document and could locate no mention of
lapsed salaries as an assumption used in the budgeting process.
We have summarized the payroll and benefit related expenditures contained in the school-wide accounts
location in the FY2015 budget as illustrated below in Figure 1. District-wide, lapsed salaries/benefits netted
against true payroll and benefit related expenditures in location code 0999 to arrive at final budgeted
expenditure amount of negative $2.8 million for payroll benefits (i.e. an estimated savings from lapsed
salaries/benefits of $2.8 million). Actual net payroll and benefit related expenditures in this location code,
however, were positive $2.0 million, resulting in an overall negative budget variance of $4.8 million from the
School-Wide Accounts location code.
Figure 1 - Location Code 0999 (School-Wide Accounts) FY2015 Payroll/Benefit Expenditures Budget-to-Actual Results
Original
Budget
Budget
Transfers /
Adjustments Final Budget
Actual
FY2015
(Over) /
Under
Budget
General Fund
Payroll/Benefit Expenditures 9,684,673$ (2,449,982)$ 7,234,691$ 3,786,519$ 3,448,172$
Lapsed Salaries/Benefits (11,440,221) (836,452) (12,276,673) (2,312,527) (9,964,146)
Total General Fund (1,755,548) (3,286,434) (5,041,982) 1,473,992 (6,515,974)
Special Revenue
Payroll/Benefit Expenditures 5,431,662 (3,618,191) 1,813,471 493,327 1,320,144
Lapsed Salaries/Benefits - (54,454) (54,454) - (54,454)
Total Special Revenue 5,431,662 (3,672,645) 1,759,017 493,327 1,265,690
EIA
Payroll/Benefit Expenditures 35,771 (22,521) 13,250 13,250 -
Lapsed Salaries/Benefits - - - - -
Total EIA 35,771 (22,521) 13,250 13,250 -
Food Service
Payroll/Benefit Expenditures 2,097,069 (1,659,291) 437,778 - 437,778
Lapsed Salaries/Benefits - - - - -
Total Food Service 2,097,069 (1,659,291) 437,778 - 437,778
Total Location 0999 - School-Wide Accounts
Payroll/Benefit Expenditures 17,249,175 (7,749,985) 9,499,190 4,293,096 5,206,094
Lapsed Salaries/Benefits (11,440,221) (890,906) (12,331,127) (2,312,527) (10,018,600)
Total School-Wide Accounts 5,808,954$ (8,640,891)$ (2,831,937)$ 1,980,569$ (4,812,506)$

Results of Procedures and Findings
Budgetary and Budget to Actual
13
The ($12,331,127) in budgeted lapsed salaries/benefits (final budget) was spread amongst the following functions and objects:
Figure 2 - Location Code 0999 Breakdown of Budgeted Lapsed Salaries/Benefits by Function and Object
Function Description Final Budget Actual FY2015Over / (Under)
Budget
1130 ELEMENTARY GRADES 4 THRU 8 (7,486,569)$ (288,520)$ (7,198,049)$ 1450 HOMEBOUND (1,078) 1,147 (2,225) 1900 INSTRUCTIONAL PUPIL ACTIVITY (72,940) - (72,940) 2122 COUNSELING SERVICES (219,635) - (219,635) 2134 NURSE SERVICES (717,070) - (717,070) 2212 INSTRUCTION/CURRICULUM DEV SRV (340,000) - (340,000) 2222 SCHOOL MEDIA CENTER SERVICES (14,304) 113,378 (127,682) 2319 OTHER BOARD OF EDUCATION SRVS (1,685,128) (2,138,532) 453,404 2321 OFFICE OF THE SUPERINTENDENT (170,000) - (170,000) 2331 OFFICE OF THE PRINCIPAL (170,000) - (170,000) 2525 FINANCIAL ACCOUNTING SERVICES (257,964) - (257,964) 2542 BLDG REPAIR MAINTENANCE SRVS (257,900) - (257,900) 2643 PERSONNEL BENEFITS (340,000) - (340,000) 2710 PUPIL SERVICE ACTIVITIES (598,539) - (598,539)
(12,331,127)$ (2,312,527)$ (10,018,600)$
Object Description Final Budget Actual FY2015Over / (Under)
Budget
110 ADMINISTRATIVE SALARY (1,705,864)$ -$ (1,705,864)$ 112 TEACHER/PROFESSIONAL ED SALARY (3,322,994) 149,617 (3,472,611) 113 PROFESSIONAL OTHER SALARY (702,419) - (702,419) 114 TECHNICAL SALARY (49,635) - (49,635) 115 TEACHER AST/CLERICAL SALARY (1,252,915) (160,640) (1,092,275) 140 TERMINAL LEAVE (132,457) - (132,457) 142 SUPPLEMENTAL SALARY (506,693) - (506,693) 210 GROUP HEALTH AND LIFE INS (2,074,901) 111,047 (2,185,948) 220 EMPLOYEE RETIREMENT (527,026) 7,901 (534,927) 230 SOCIAL SECURITY (354,080) 23,046 (377,126) 260 UNEMPLOYMENT COMPENSATION TAX (1,860) 460 (2,320) 270 WKRS' COMP - REIMB OTHR FUNDS (1,700,283) (2,443,958) 743,675
(12,331,127)$ (2,312,527)$ (10,018,600)$
Of the above budgeted negative expenditures, object codes 110 through 230 represent estimated lapsed salaries/benefits ($10,628,984), and the net negative budget variance for these objects totals ($10,759,955). The net negative budget variance related to estimated lapsed salaries/benefits in FY2014 and FY2013 was ($5,671,898) and ($7,447,560), respectively.
Adjustments to Approved Original Budget
We noted from inspection of the budget to actual reports provided that there were significant additions to the General Fund expenditure budget for each of the three fiscal years, which resulted in the “final” budget. We

Results of Procedures and Findings
Budgetary and Budget to Actual
14
determined from our inquiries that the majority of the additions to the expenditure budget are due to open
purchase orders at year-end (encumbrances) being carried over to the subsequent year’s budget:
In FY2015 we noted net additions to the General Fund expenditure budget of $2,935,207, compared to
reported encumbrances in the FY2014 audited financial statements of $2,938,167.
In FY2014 we noted net additions to the General Fund expenditure budget of $3,067,553, compared to
reported encumbrances in the FY2013 audited financial statements of $2,801,690; there were also
offsetting increases to the FY2014 General Fund revenue budget in the amount of $272,453.
In FY2013 we noted net additions to the General Fund expenditure budget of $1,733,747, compared to
reported encumbrances in the FY2012 audited financial statements of $1,881,449.
In addition to the adjustments made to the approved budget for the addition of encumbrances outstanding at
prior year-end, we noted that a significant number of adjustments are made to the budget throughout the year.
In FY2015 we noted that there were over 2,600 separate “journal entries” made to the General Fund’s budget.
Excluding the entries to record the encumbrances, these journal entries totaled over 22,600 data lines, but
resulted in an increase of budgeted expenditures of only $11,862. While only resulting in a net increase of
$11,862 in expenditures for the fund, these budgetary adjustments did result in significant shifts at the location,
function, and object level. For instance, the payroll and benefit expenditure object codes (100s and 200s)
experienced a combined increase of approximately $2.2 million from the FY2015 budget adjustments. Because
the quarterly interim financial reports provided to the Board during FY2015 were at a very high level, the
significant adjustments made to the originally approved budget were not presented. The quarterly financial
reports only showed budgeted (original and revised) and actual expenditures grouped in the following
categories: instruction, support services, community services, intergovernmental, payments to component units,
debt service, and transfers out. The information would have to have been presented at the locational,
functional, and object level in order to have sufficiently portrayed the nature and extent of adjustments made to
the originally approved budget.
Budget to Actual Comparisons
The District presents budget to actual comparisons in their audited financial statements each year for the
General Fund and for the Special Revenue, Educational Improvement Act (EIA), and Food Service funds. We
obtained budget to actual reports at the general ledger account level from MUNIS and reconciled to both the
approved budget as well as the general ledger.
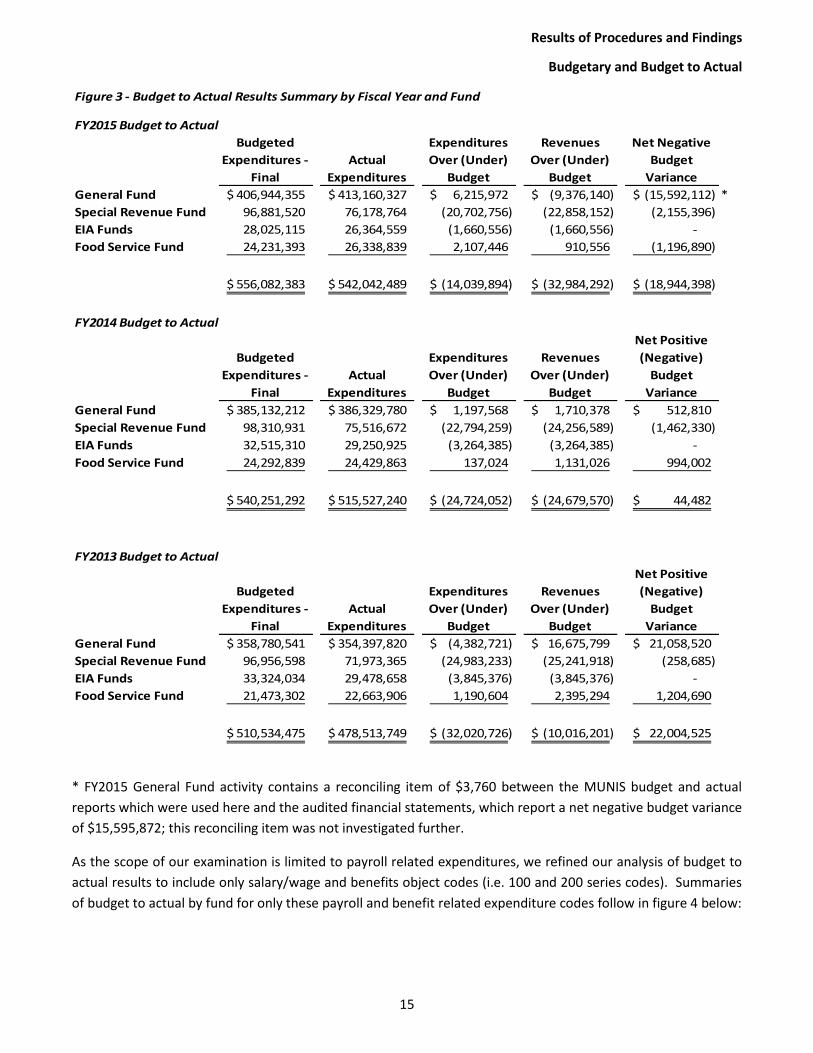
High-level budget to actual summaries of these funds follow in figure 3 below. As indicated, FY2015 was the
only year in the scope of our examination where the General Fund had a net negative budget variance
($15,592,112). The Special Revenue fund experienced a net negative budget variance each of the three years,
trending from ($258,685) in FY2013 to ($2,155,396) in FY2015. The EIA fund is constantly adjusted such that
budgeted revenues and expenditures equal actual revenues and expenditures. The Food Service fund went
from a positive net budget variance of $1,204,690 in FY2013 to a negative net budget variance of ($1,196,890) in
FY2015. Other financing sources and uses, including transfers in/out, are included in the revenues/expenditures
columns in the summaries below.
Results of Procedures and Findings
Budgetary and Budget to Actual
15
Figure 3 - Budget to Actual Results Summary by Fiscal Year and Fund
FY2015 Budget to Actual
Budgeted
Expenditures -
Final
Actual
Expenditures
Expenditures
Over (Under)
Budget
Revenues
Over (Under)
Budget
Net Negative
Budget
Variance
General Fund 406,944,355$ 413,160,327$ 6,215,972$ (9,376,140)$ (15,592,112)$ *
Special Revenue Fund 96,881,520 76,178,764 (20,702,756) (22,858,152) (2,155,396)
EIA Funds 28,025,115 26,364,559 (1,660,556) (1,660,556) -
Food Service Fund 24,231,393 26,338,839 2,107,446 910,556 (1,196,890)
556,082,383$ 542,042,489$ (14,039,894)$ (32,984,292)$ (18,944,398)$
FY2014 Budget to Actual
Budgeted
Expenditures -
Final
Actual
Expenditures
Expenditures
Over (Under)
Budget
Revenues
Over (Under)
Budget
Net Positive
(Negative)
Budget
Variance
General Fund 385,132,212$ 386,329,780$ 1,197,568$ 1,710,378$ 512,810$
Special Revenue Fund 98,310,931 75,516,672 (22,794,259) (24,256,589) (1,462,330)
EIA Funds 32,515,310 29,250,925 (3,264,385) (3,264,385) -
Food Service Fund 24,292,839 24,429,863 137,024 1,131,026 994,002
540,251,292$ 515,527,240$ (24,724,052)$ (24,679,570)$ 44,482$
FY2013 Budget to Actual
Budgeted
Expenditures -
Final
Actual
Expenditures
Expenditures
Over (Under)
Budget
Revenues
Over (Under)
Budget
Net Positive
(Negative)
Budget
Variance
General Fund 358,780,541$ 354,397,820$ (4,382,721)$ 16,675,799$ 21,058,520$
Special Revenue Fund 96,956,598 71,973,365 (24,983,233) (25,241,918) (258,685)
EIA Funds 33,324,034 29,478,658 (3,845,376) (3,845,376) -
Food Service Fund 21,473,302 22,663,906 1,190,604 2,395,294 1,204,690
510,534,475$ 478,513,749$ (32,020,726)$ (10,016,201)$ 22,004,525$
* FY2015 General Fund activity contains a reconciling item of $3,760 between the MUNIS budget and actual
reports which were used here and the audited financial statements, which report a net negative budget variance
of $15,595,872; this reconciling item was not investigated further.
As the scope of our examination is limited to payroll related expenditures, we refined our analysis of budget to
actual results to include only salary/wage and benefits object codes (i.e. 100 and 200 series codes). Summaries
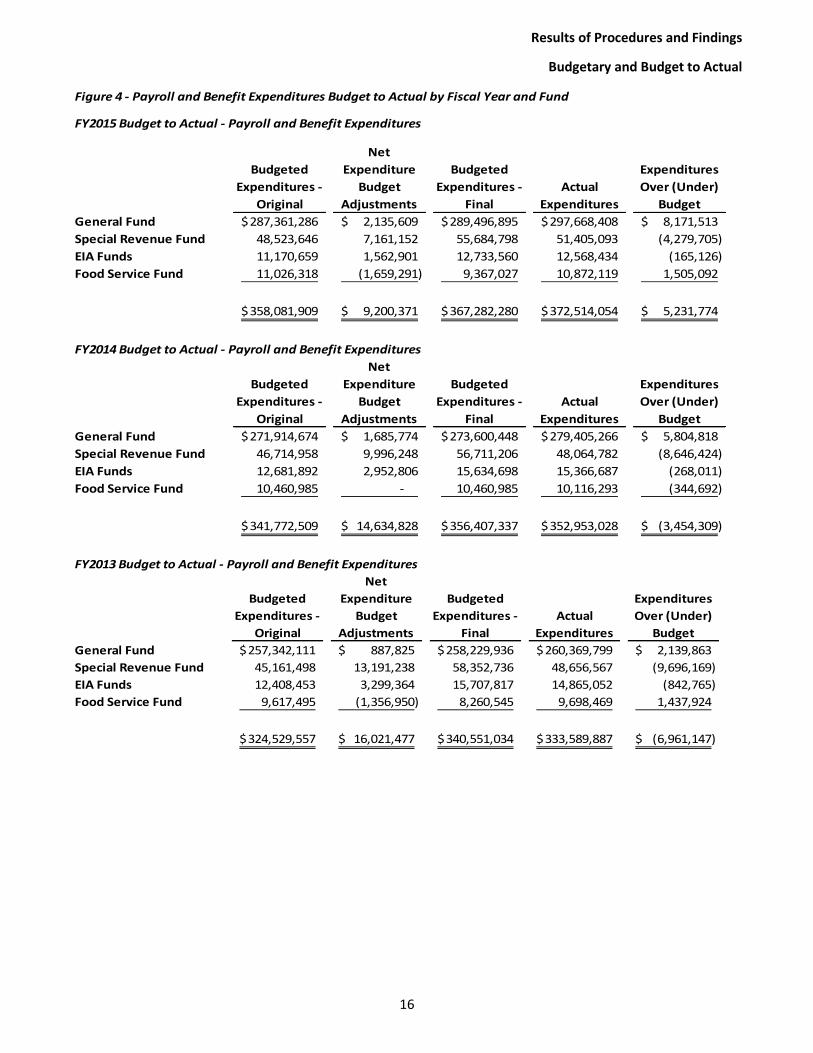
of budget to actual by fund for only these payroll and benefit related expenditure codes follow in figure 4 below:
Results of Procedures and Findings
Budgetary and Budget to Actual
16
Figure 4 - Payroll and Benefit Expenditures Budget to Actual by Fiscal Year and Fund
FY2015 Budget to Actual - Payroll and Benefit Expenditures
Budgeted
Expenditures -
Original
Net
Expenditure
Budget
Adjustments
Budgeted
Expenditures -
Final
Actual
Expenditures
Expenditures
Over (Under)
Budget
General Fund 287,361,286$ 2,135,609$ 289,496,895$ 297,668,408$ 8,171,513$
Special Revenue Fund 48,523,646 7,161,152 55,684,798 51,405,093 (4,279,705)
EIA Funds 11,170,659 1,562,901 12,733,560 12,568,434 (165,126)
Food Service Fund 11,026,318 (1,659,291) 9,367,027 10,872,119 1,505,092
358,081,909$ 9,200,371$ 367,282,280$ 372,514,054$ 5,231,774$
FY2014 Budget to Actual - Payroll and Benefit Expenditures
Budgeted
Expenditures -
Original
Net
Expenditure
Budget
Adjustments
Budgeted
Expenditures -
Final
Actual
Expenditures
Expenditures
Over (Under)
Budget
General Fund 271,914,674$ 1,685,774$ 273,600,448$ 279,405,266$ 5,804,818$
Special Revenue Fund 46,714,958 9,996,248 56,711,206 48,064,782 (8,646,424)
EIA Funds 12,681,892 2,952,806 15,634,698 15,366,687 (268,011)
Food Service Fund 10,460,985 - 10,460,985 10,116,293 (344,692)
341,772,509$ 14,634,828$ 356,407,337$ 352,953,028$ (3,454,309)$
FY2013 Budget to Actual - Payroll and Benefit Expenditures
Budgeted
Expenditures -
Original
Net
Expenditure
Budget
Adjustments
Budgeted
Expenditures -
Final
Actual
Expenditures
Expenditures
Over (Under)
Budget
General Fund 257,342,111$ 887,825$ 258,229,936$ 260,369,799$ 2,139,863$
Special Revenue Fund 45,161,498 13,191,238 58,352,736 48,656,567 (9,696,169)
EIA Funds 12,408,453 3,299,364 15,707,817 14,865,052 (842,765)
Food Service Fund 9,617,495 (1,356,950) 8,260,545 9,698,469 1,437,924
324,529,557$ 16,021,477$ 340,551,034$ 333,589,887$ (6,961,147)$
Results of Procedures and Findings
Budgetary and Budget to Actual
17
As indicated in the summaries, General Fund payroll and benefit related expenditures have been significantly
over budget not just in FY2015, but also in FY2014 and FY2013. The amount exceeding budget has been
trending upward from $2,139,863 in FY2013 to $5,804,818 in FY2014 to $8,171,513 in FY2015. In addition to
the General Fund, the Food Service Fund had payroll and benefit related expenditures exceed budget by
$1,437,924 in FY2013 and by $1,505,092 in FY2015. While the Special Revenue fund came in significantly under
budget on payroll and benefit related expenditures, the related revenues for the Special Revenue fund were
under budget for each of the three years resulting in an overall negative budget variance fund-wide.
Additionally, we noted that Special Revenue payroll and benefit related expenditures totaling at least $2.5
million were moved from the Special Revenue fund to the General Fund in FY2015 to cover overages in the IDEA
fund (fund 203) and others.
District-wide, payroll and benefit related expenditures were over budget only in FY2015, with a combined
negative budget variance of $5,231,774.
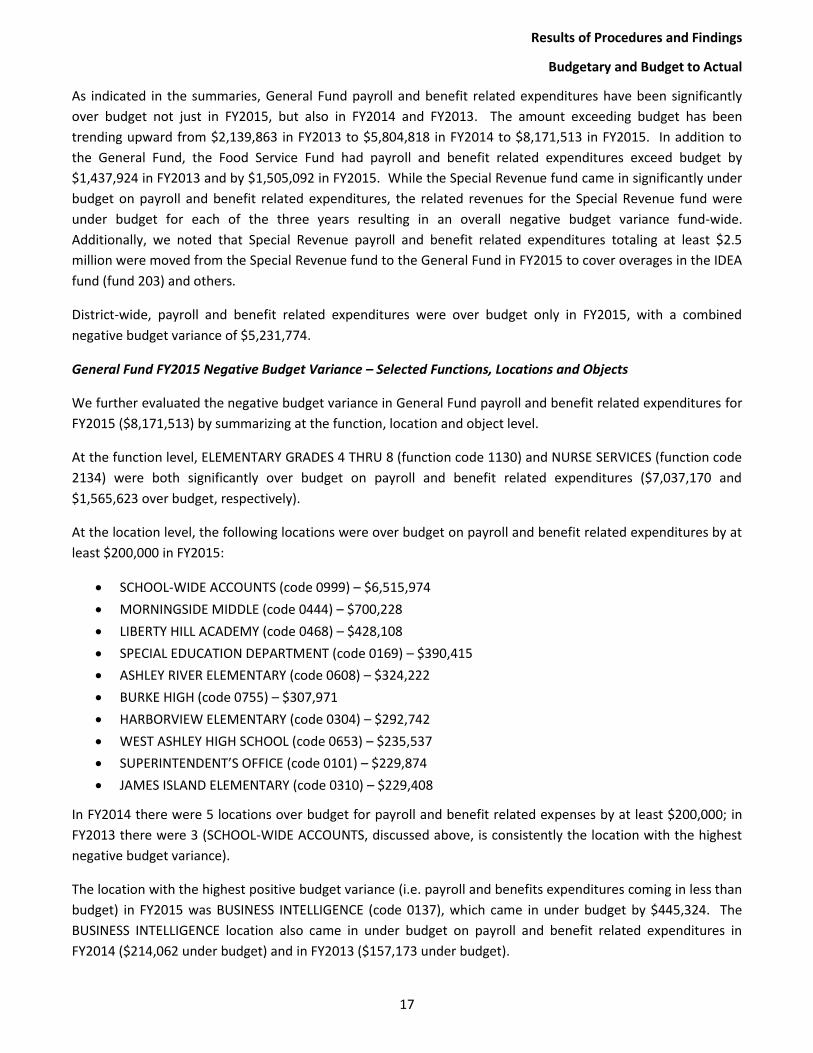
General Fund FY2015 Negative Budget Variance – Selected Functions, Locations and Objects
We further evaluated the negative budget variance in General Fund payroll and benefit related expenditures for
FY2015 ($8,171,513) by summarizing at the function, location and object level.
At the function level, ELEMENTARY GRADES 4 THRU 8 (function code 1130) and NURSE SERVICES (function code
2134) were both significantly over budget on payroll and benefit related expenditures ($7,037,170 and
$1,565,623 over budget, respectively).
At the location level, the following locations were over budget on payroll and benefit related expenditures by at
least $200,000 in FY2015:
SCHOOL-WIDE ACCOUNTS (code 0999) – $6,515,974
MORNINGSIDE MIDDLE (code 0444) – $700,228
LIBERTY HILL ACADEMY (code 0468) – $428,108
SPECIAL EDUCATION DEPARTMENT (code 0169) – $390,415
ASHLEY RIVER ELEMENTARY (code 0608) – $324,222
BURKE HIGH (code 0755) – $307,971
HARBORVIEW ELEMENTARY (code 0304) – $292,742
WEST ASHLEY HIGH SCHOOL (code 0653) – $235,537
SUPERINTENDENT’S OFFICE (code 0101) – $229,874
JAMES ISLAND ELEMENTARY (code 0310) – $229,408
In FY2014 there were 5 locations over budget for payroll and benefit related expenses by at least $200,000; in
FY2013 there were 3 (SCHOOL-WIDE ACCOUNTS, discussed above, is consistently the location with the highest
negative budget variance).
The location with the highest positive budget variance (i.e. payroll and benefits expenditures coming in less than
budget) in FY2015 was BUSINESS INTELLIGENCE (code 0137), which came in under budget by $445,324. The
BUSINESS INTELLIGENCE location also came in under budget on payroll and benefit related expenditures in
FY2014 ($214,062 under budget) and in FY2013 ($157,173 under budget).
Results of Procedures and Findings
Budgetary and Budget to Actual
18
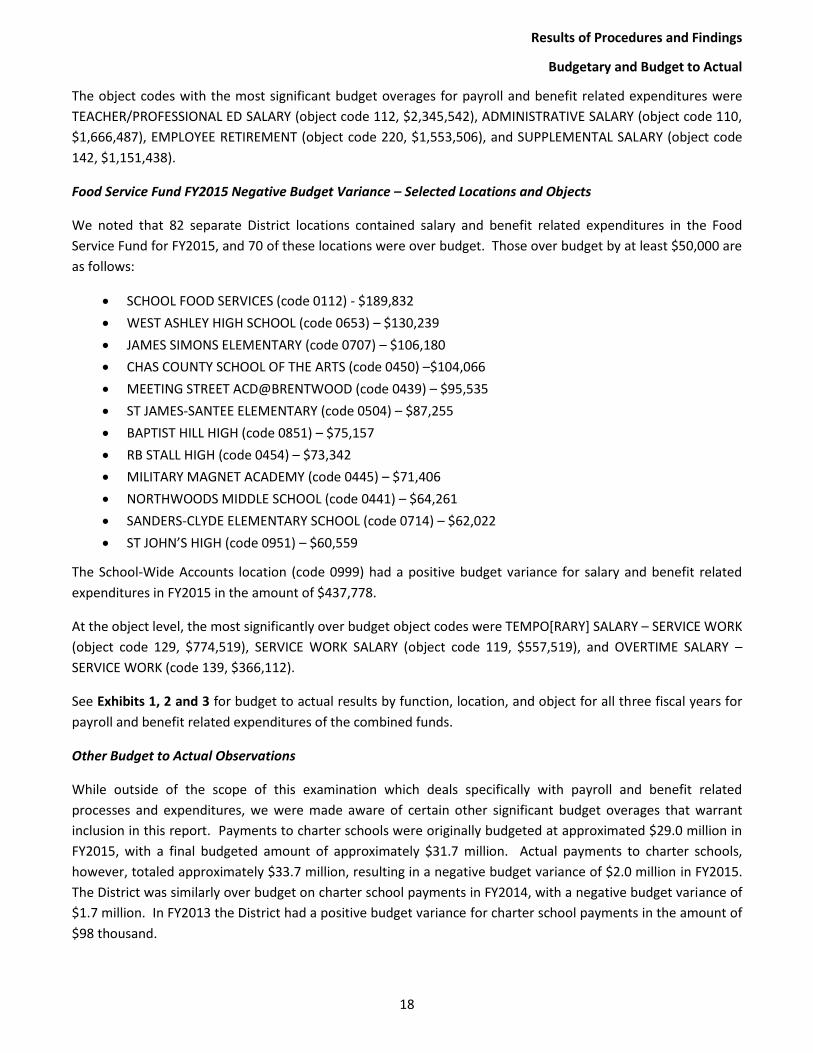
The object codes with the most significant budget overages for payroll and benefit related expenditures were
TEACHER/PROFESSIONAL ED SALARY (object code 112, $2,345,542), ADMINISTRATIVE SALARY (object code 110,
$1,666,487), EMPLOYEE RETIREMENT (object code 220, $1,553,506), and SUPPLEMENTAL SALARY (object code
142, $1,151,438).
Food Service Fund FY2015 Negative Budget Variance – Selected Locations and Objects
We noted that 82 separate District locations contained salary and benefit related expenditures in the Food
Service Fund for FY2015, and 70 of these locations were over budget. Those over budget by at least $50,000 are
as follows:
SCHOOL FOOD SERVICES (code 0112) - $189,832
WEST ASHLEY HIGH SCHOOL (code 0653) – $130,239
JAMES SIMONS ELEMENTARY (code 0707) – $106,180
CHAS COUNTY SCHOOL OF THE ARTS (code 0450) –$104,066
MEETING STREET ACD@BRENTWOOD (code 0439) – $95,535
ST JAMES-SANTEE ELEMENTARY (code 0504) – $87,255
BAPTIST HILL HIGH (code 0851) – $75,157
RB STALL HIGH (code 0454) – $73,342
MILITARY MAGNET ACADEMY (code 0445) – $71,406
NORTHWOODS MIDDLE SCHOOL (code 0441) – $64,261
SANDERS-CLYDE ELEMENTARY SCHOOL (code 0714) – $62,022
ST JOHN’S HIGH (code 0951) – $60,559
The School-Wide Accounts location (code 0999) had a positive budget variance for salary and benefit related
expenditures in FY2015 in the amount of $437,778.
At the object level, the most significantly over budget object codes were TEMPO[RARY] SALARY – SERVICE WORK
(object code 129, $774,519), SERVICE WORK SALARY (object code 119, $557,519), and OVERTIME SALARY –
SERVICE WORK (code 139, $366,112).
See Exhibits 1, 2 and 3 for budget to actual results by function, location, and object for all three fiscal years for
payroll and benefit related expenditures of the combined funds.
Other Budget to Actual Observations
While outside of the scope of this examination which deals specifically with payroll and benefit related
processes and expenditures, we were made aware of certain other significant budget overages that warrant
inclusion in this report. Payments to charter schools were originally budgeted at approximated $29.0 million in
FY2015, with a final budgeted amount of approximately $31.7 million. Actual payments to charter schools,
however, totaled approximately $33.7 million, resulting in a negative budget variance of $2.0 million in FY2015.
The District was similarly over budget on charter school payments in FY2014, with a negative budget variance of
$1.7 million. In FY2013 the District had a positive budget variance for charter school payments in the amount of
$98 thousand.

Results of Procedures and Findings
Budgetary and Budget to Actual
19
The amounts originally budgeted for charter school payments have decreased year-by-year since FY2013: $29.9
million in FY2013, $29.7 million in FY2014, and $29.0 million in FY2015. Conversely, Actual amounts paid to
charter schools have increased steadily during the same timeframe: $30.3 million in FY2013, $32.8 million in
FY2014, and $33.7 million in FY2015.
We also noted from our interviews that a significant unbudgeted expenditure in FY2015 was a result of an IRS
penalty for late filing of the District’s form W-2s for a prior year. The current Payroll Director, who was not
employed at the time the first notice was received, claims that the IRS notices relating to this late filing were
simply filed away in a box and ignored. We noted from inspection of the District’s general ledger that a payment
to the IRS in the amount of $462,140 was made on October 15, 2014. The payment was charged to an
expenditure account in the General Fund with a corresponding function of “elementary grades 4 thru 8” and an
object code of “other purchased services”. This means that the expenditure was included as an ‘instruction’
related expenditure in the District’s FY2015 audited financial statements for purchased services and reported as
such to the South Carolina Department of Education. This represents a misclassification as the expenditure
would have been more appropriately reported as an ‘other object’ and assigned to a ‘support’ function such as
fiscal services.
Results of Procedures and Findings
Payroll and HR
20
Payroll and HR Related Procedures
We conducted interviews with various management level personnel in order to obtain an understanding of
relevant processes and procedures related to HR and payroll. We determined that there are three groups that
are essential in processing most payroll and HR related transactions: the school or other District location, the HR
department, and the payroll department (part of the Office of Financial Services).
Many processes are initiated by the school, such as the requisition for a job posting for a new hire and the
termination of an existing employee. Such actions are forwarded from the school or other location to the HR
department where the action is approved and finalized in the system. Payroll does not approve action entries in
MUNIS, but does review them in order to check for accuracy (correct salary/wage rate used, correct pay-periods
remaining, etc.).
Employee Termination Process
We determined from our interviews that employee terminations are often delayed from being executed in
MUNIS due to inaction or delayed action on the part of the responsible individual at the school or other location.
We observed that the delay in communicating and promptly executing termination actions in MUNIS frequently
results in the terminated employee being paid well beyond their termination date.
In addition to the initial action usually performed at the schools or other District location, employee
terminations must also currently be routed to and approved by both an associate superintendent as well as an
HR group representative. These other stops in the process also delay termination actions and result in
overpayments to terminated employees as HR will not execute a termination until all necessary paperwork has
been received.
Payroll Batch Entry and Approval Process
The schools and other District locations also play a significant role in the normal recurring payroll process.
Currently, hourly employees record their time manually on paper timesheets. The timesheets are then keyed
manually into a time and attendance (T&A) batch in MUNIS by an administrative personnel at the school. Once
keyed, the T&A batch is to be approved by a designated individual at the school or location (typically a principal
or supervisor). However, we noted that these T&A batches are not always approved by the designated
individual, and as a result personnel in the payroll department end up approving the batch themselves in order
to be able to process payroll.
We inquired as to the possibility of running a report in MUNIS to isolate the occurrences of T&A batches that
were approved by payroll department personnel as opposed to the appropriate location-specific supervisory
personnel, but we were informed that such a report was unavailable. However, we noted that the Payroll
Director began tracking such occurrences at the beginning of FY2015 by making a log via spreadsheet at the end
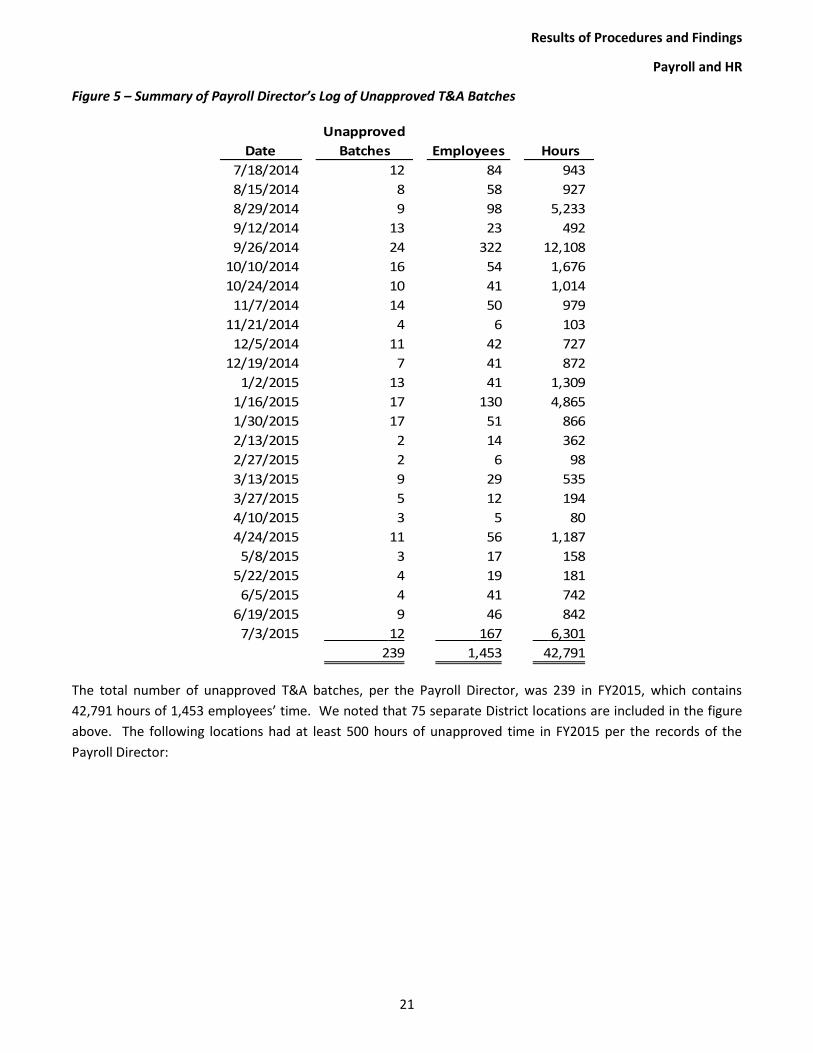
of each payroll run. We have summarized this log of unapproved T&A batches provided by the Payroll Director,
as shown in figure 5 below:
Results of Procedures and Findings
Payroll and HR
21
Figure 5 – Summary of Payroll Director’s Log of Unapproved T&A Batches
Date
Unapproved
Batches Employees Hours
7/18/2014 12 84 943
8/15/2014 8 58 927
8/29/2014 9 98 5,233
9/12/2014 13 23 492
9/26/2014 24 322 12,108
10/10/2014 16 54 1,676
10/24/2014 10 41 1,014
11/7/2014 14 50 979
11/21/2014 4 6 103
12/5/2014 11 42 727
12/19/2014 7 41 872
1/2/2015 13 41 1,309
1/16/2015 17 130 4,865
1/30/2015 17 51 866
2/13/2015 2 14 362
2/27/2015 2 6 98
3/13/2015 9 29 535
3/27/2015 5 12 194
4/10/2015 3 5 80
4/24/2015 11 56 1,187
5/8/2015 3 17 158
5/22/2015 4 19 181
6/5/2015 4 41 742
6/19/2015 9 46 842
7/3/2015 12 167 6,301
239 1,453 42,791
The total number of unapproved T&A batches, per the Payroll Director, was 239 in FY2015, which contains
42,791 hours of 1,453 employees’ time. We noted that 75 separate District locations are included in the figure
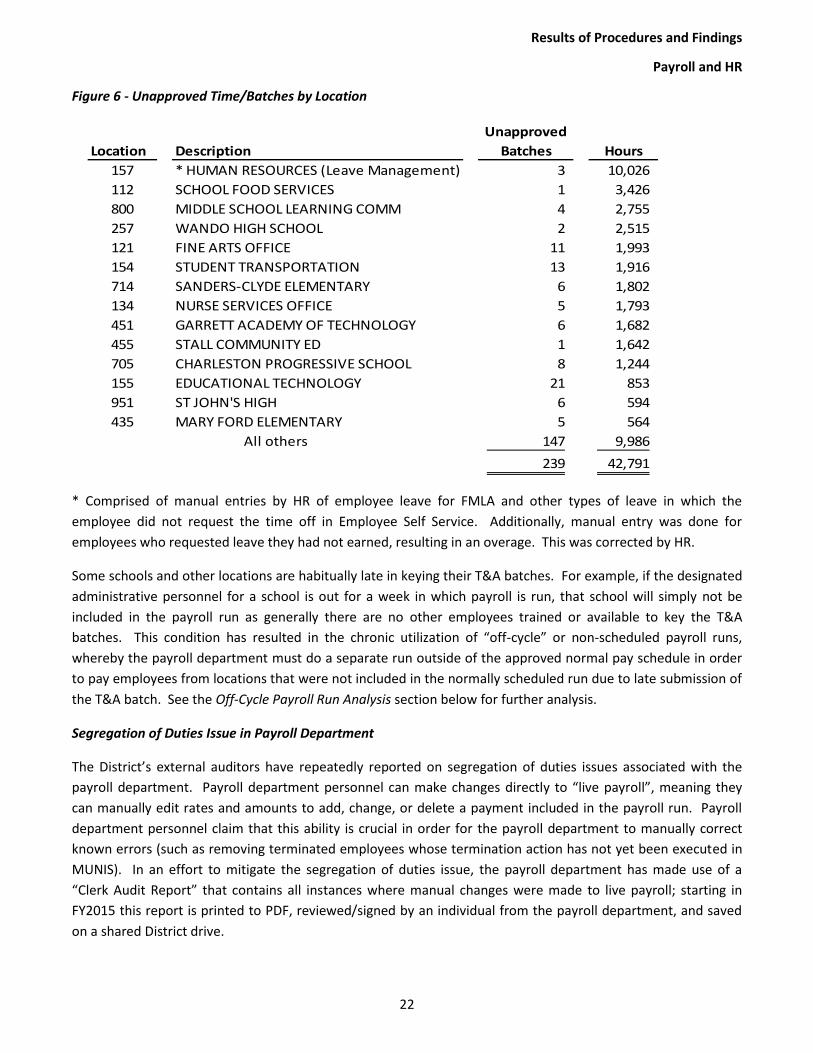
above. The following locations had at least 500 hours of unapproved time in FY2015 per the records of the
Payroll Director:
Results of Procedures and Findings
Payroll and HR
22
Figure 6 - Unapproved Time/Batches by Location
Location Description
Unapproved
Batches Hours
157 * HUMAN RESOURCES (Leave Management) 3 10,026
112 SCHOOL FOOD SERVICES 1 3,426
800 MIDDLE SCHOOL LEARNING COMM 4 2,755
257 WANDO HIGH SCHOOL 2 2,515
121 FINE ARTS OFFICE 11 1,993
154 STUDENT TRANSPORTATION 13 1,916
714 SANDERS-CLYDE ELEMENTARY 6 1,802
134 NURSE SERVICES OFFICE 5 1,793
451 GARRETT ACADEMY OF TECHNOLOGY 6 1,682
455 STALL COMMUNITY ED 1 1,642
705 CHARLESTON PROGRESSIVE SCHOOL 8 1,244
155 EDUCATIONAL TECHNOLOGY 21 853
951 ST JOHN'S HIGH 6 594
435 MARY FORD ELEMENTARY 5 564
147 9,986
239 42,791
All others
* Comprised of manual entries by HR of employee leave for FMLA and other types of leave in which the
employee did not request the time off in Employee Self Service. Additionally, manual entry was done for
employees who requested leave they had not earned, resulting in an overage. This was corrected by HR.
Some schools and other locations are habitually late in keying their T&A batches. For example, if the designated
administrative personnel for a school is out for a week in which payroll is run, that school will simply not be
included in the payroll run as generally there are no other employees trained or available to key the T&A
batches. This condition has resulted in the chronic utilization of “off-cycle” or non-scheduled payroll runs,
whereby the payroll department must do a separate run outside of the approved normal pay schedule in order
to pay employees from locations that were not included in the normally scheduled run due to late submission of
the T&A batch. See the Off-Cycle Payroll Run Analysis section below for further analysis.
Segregation of Duties Issue in Payroll Department
The District’s external auditors have repeatedly reported on segregation of duties issues associated with the
payroll department. Payroll department personnel can make changes directly to “live payroll”, meaning they
can manually edit rates and amounts to add, change, or delete a payment included in the payroll run. Payroll
department personnel claim that this ability is crucial in order for the payroll department to manually correct
known errors (such as removing terminated employees whose termination action has not yet been executed in
MUNIS). In an effort to mitigate the segregation of duties issue, the payroll department has made use of a
“Clerk Audit Report” that contains all instances where manual changes were made to live payroll; starting in
FY2015 this report is printed to PDF, reviewed/signed by an individual from the payroll department, and saved
on a shared District drive.
Results of Procedures and Findings
Payroll and HR
23
Note on Payroll Analyses Our analyses outlined below where we examine employee pay year-over-year and compare to approved
salary/wage schedules were completed using total pay amounts as determined based on actual amounts paid
for the 12 months of each fiscal year (that is, July through June). The District, however, as is common practice
for school districts, gives teachers the option of having their pay for a school year split evenly between the start
and end of the school year (for example, between August 16, 2014 and August 15, 2015). Accordingly, the
District records an accrual as of June 30 (i.e. the fiscal year end) for the teachers’ salaries to be paid out in July
and August for the preceding fiscal year. For our analyses it was not practical to split out certain classes of
employees to arrive at fiscal year pay from the monthly payroll registers, so we opted to compare the three
years as recorded without factoring in accruals for teachers whose pay schedule does not line up with the start
and end of the fiscal year. We have accordingly allowed for a minimal expected difference when performing the
various analyses below; we believe that the effect of not factoring in the different start/end months for
teachers’ pay will not have a significant impact on our analyses or affect our observations in a material way.
Payroll Analysis– Payments by Employee by Year
We obtained District payroll registers from MUNIS for all months in the period of our examination and compiled
annual registers for FY2013, FY2014, and FY2015. We summarized the annual registers by employee and by pay-
type to arrive at a schedule of payments by employee broken down between regular/base pay, supplemental
pay, employer deductions, and employee deductions.
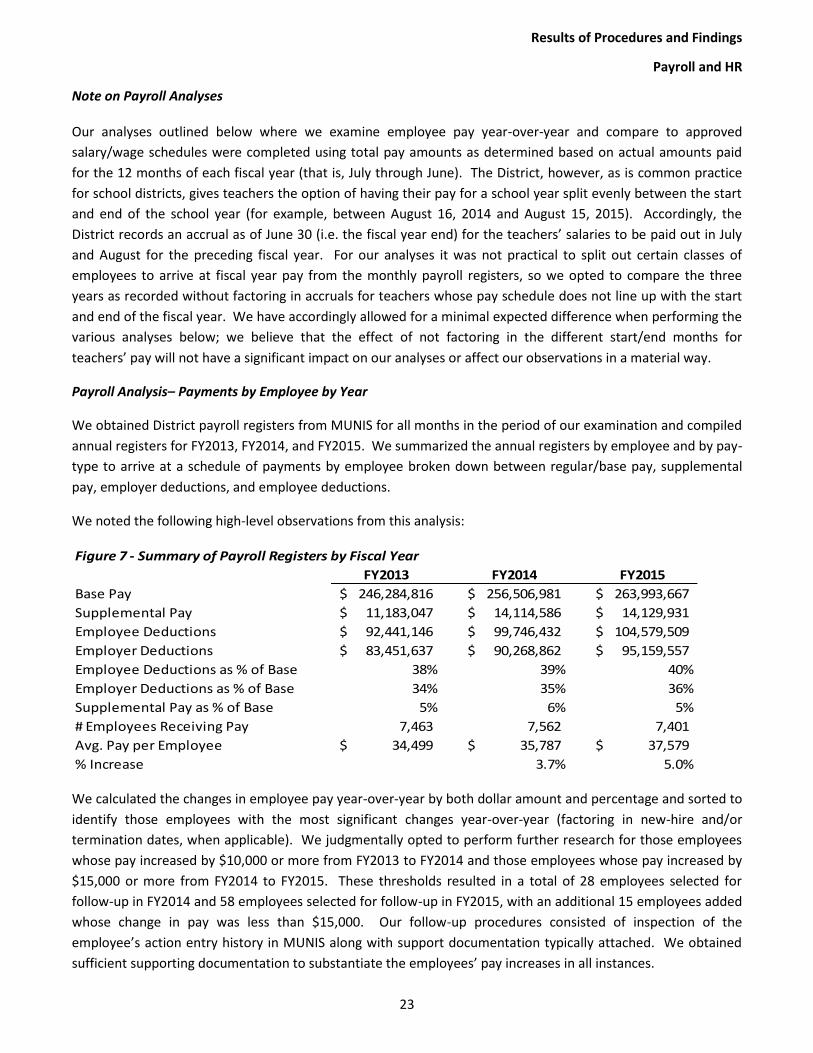
We noted the following high-level observations from this analysis:
Figure 7 - Summary of Payroll Registers by Fiscal Year
FY2013 FY2014 FY2015
Base Pay 246,284,816$ 256,506,981$ 263,993,667$
Supplemental Pay 11,183,047$ 14,114,586$ 14,129,931$
Employee Deductions 92,441,146$ 99,746,432$ 104,579,509$
Employer Deductions 83,451,637$ 90,268,862$ 95,159,557$
Employee Deductions as % of Base 38% 39% 40%
Employer Deductions as % of Base 34% 35% 36%
Supplemental Pay as % of Base 5% 6% 5%
# Employees Receiving Pay 7,463 7,562 7,401
Avg. Pay per Employee 34,499$ 35,787$ 37,579$
% Increase 3.7% 5.0%
We calculated the changes in employee pay year-over-year by both dollar amount and percentage and sorted to
identify those employees with the most significant changes year-over-year (factoring in new-hire and/or
termination dates, when applicable). We judgmentally opted to perform further research for those employees
whose pay increased by $10,000 or more from FY2013 to FY2014 and those employees whose pay increased by
$15,000 or more from FY2014 to FY2015. These thresholds resulted in a total of 28 employees selected for
follow-up in FY2014 and 58 employees selected for follow-up in FY2015, with an additional 15 employees added
whose change in pay was less than $15,000. Our follow-up procedures consisted of inspection of the
employee’s action entry history in MUNIS along with support documentation typically attached. We obtained
sufficient supporting documentation to substantiate the employees’ pay increases in all instances.

Results of Procedures and Findings
Payroll and HR
24
Payroll Analysis– Comparison of FY2015 Pay to Approved Salary/Wage Schedules
We compared FY2015 base pay by employee (calculated as discussed above) to the approved salary/wage
schedules developed as part of the Fox Lawson compensation and classification study and implemented in
FY2015.
Employees with Assigned Grade/Step
For each employee included on the FY2015 payroll registers we matched the assigned grade and step from the
report of HR actions entries and from an “Employee Job Salary Report” used by the District’s Internal Audit
department in their testing of the Fox Lawson implementation. We obtained the final approved salary
schedules and reformatted in order to align with the population of employees using grade and step numbers.
We then compared actual base pay from the payroll registers to our expectation of pay according to their
assigned grade and step.
We judgmentally opted to perform further research for those employees whose FY2015 pay differed from our
expectation based on the assigned grade/step by at least $8,000 and 10%. Our follow-up procedures consisted
of inspection of the employee’s action entry history in MUNIS along with support documentation typically
attached. We obtained sufficient supporting documentation to substantiate the employees’ actual FY2015 in all
instances.
In addition to these procedures, we were provided access to the Internal Audit department’s workpapers and
draft report from their Compensation and Classification Study Implementation audit report. We noted that the
Internal Audit department concluded in their report that the new compensation/classification system was
implemented with fidelity, and we made efforts not to duplicate work already performed by the Internal Audit
department.
Employees with No Assigned Grade/Step
From our analysis we noted a total of 783 employees that were included in the payroll in FY2015 with no
associated grade/step from the new Fox Lawson classification. We noted the following types of employees that
have no assigned grade/step (summarized by “pay type description”):
Various types of “counselor” – 279
Food service temporary employees – 177
“Nonexempt” – 80
Site coordinators – 40
“Additional comp” – 29
Student workers – 28
ROTC instructors – 28
Nurse temporary employees – 19
Head Start employees – 18
Negotiated contracts – 6
Other – 79
Results of Procedures and Findings
Payroll and HR
25
For these employees where no associated grade/step could be determined, we assessed FY2015 pay based on
other information available in the various actions entry details available in MUNIS, including approved hourly or
annual salary. We also recalculated the hourly rate for each group of hourly employees from those listed above
and reviewed that pay rates were used consistently and appeared reasonable based on the pay type description.
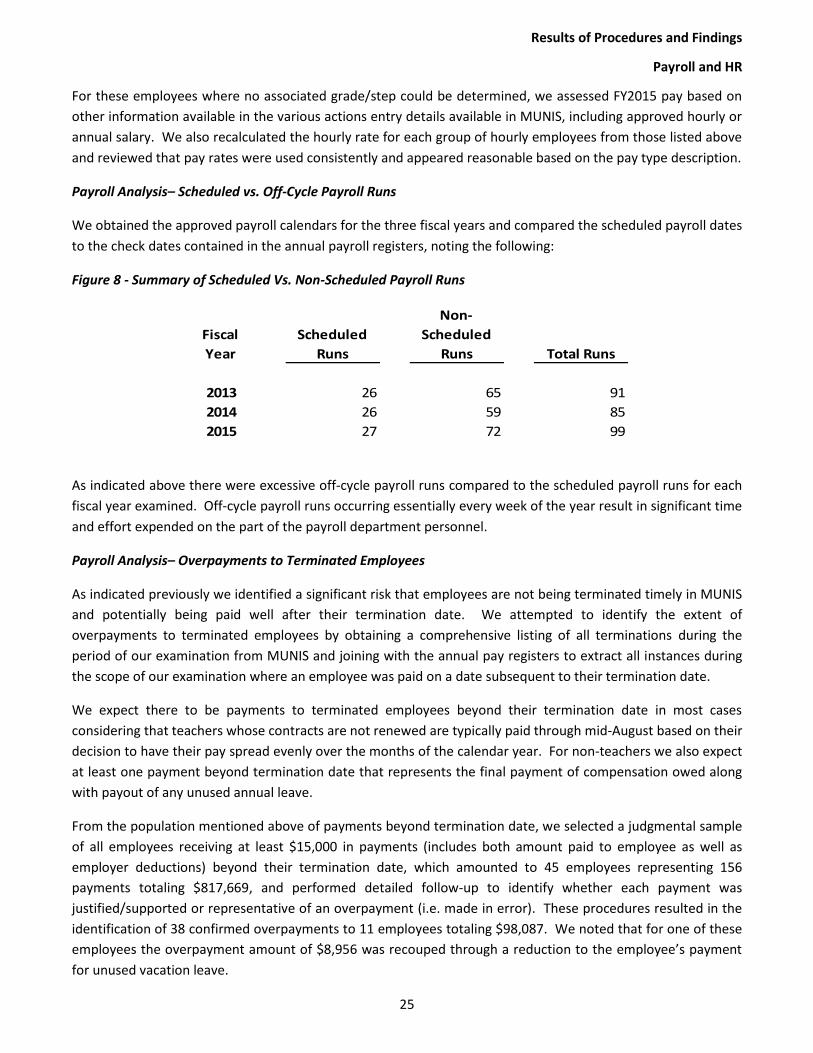
Payroll Analysis– Scheduled vs. Off-Cycle Payroll Runs
We obtained the approved payroll calendars for the three fiscal years and compared the scheduled payroll dates
to the check dates contained in the annual payroll registers, noting the following:
Figure 8 - Summary of Scheduled Vs. Non-Scheduled Payroll Runs
Fiscal
Year
Scheduled
Runs
Non-
Scheduled
Runs Total Runs
2013 26 65 91
2014 26 59 85
2015 27 72 99
As indicated above there were excessive off-cycle payroll runs compared to the scheduled payroll runs for each
fiscal year examined. Off-cycle payroll runs occurring essentially every week of the year result in significant time
and effort expended on the part of the payroll department personnel.
Payroll Analysis– Overpayments to Terminated Employees
As indicated previously we identified a significant risk that employees are not being terminated timely in MUNIS
and potentially being paid well after their termination date. We attempted to identify the extent of
overpayments to terminated employees by obtaining a comprehensive listing of all terminations during the
period of our examination from MUNIS and joining with the annual pay registers to extract all instances during
the scope of our examination where an employee was paid on a date subsequent to their termination date.
We expect there to be payments to terminated employees beyond their termination date in most cases
considering that teachers whose contracts are not renewed are typically paid through mid-August based on their
decision to have their pay spread evenly over the months of the calendar year. For non-teachers we also expect
at least one payment beyond termination date that represents the final payment of compensation owed along
with payout of any unused annual leave.
From the population mentioned above of payments beyond termination date, we selected a judgmental sample
of all employees receiving at least $15,000 in payments (includes both amount paid to employee as well as
employer deductions) beyond their termination date, which amounted to 45 employees representing 156
payments totaling $817,669, and performed detailed follow-up to identify whether each payment was
justified/supported or representative of an overpayment (i.e. made in error). These procedures resulted in the
identification of 38 confirmed overpayments to 11 employees totaling $98,087. We noted that for one of these
employees the overpayment amount of $8,956 was recouped through a reduction to the employee’s payment
for unused vacation leave.
Results of Procedures and Findings
Payroll and HR
26
In our analysis of the population and the results of our sample we identified two variables as significant: 1)
number of days between termination date and check date, and 2) number of days between termination date
and action entry date in MUNIS. As noted above, we typically expect employees to receive between 1 and 3
payments beyond their termination date, and there appears to be a correlation between the number of days
between termination date and payment date and the likelihood of overpayment: the greater the time lag
between termination date and payment date, the greater the chance the payment was made in error and is an
overpayment.
Similarly, we noted a correlation between the amount of time between an employee’s termination date and the
date on which the termination action was actually processed in MUNIS (or, the “action entry” date). We noted
that in many instances (approximately 41%), the employee’s termination date was entered into MUNIS in
advance of the actual termination; for instance, an employee to be terminated on June 5 had his termination
action entry processed a month earlier on May 5. We noted zero overpayments in our sample for instances
where an employee’s termination was processed in MUNIS in advance of or on the termination date; in other
words, when termination action entries are processed timely by the schools or other District locations,
overpayments to terminated employees does not appear to be an issue. However, we noted that when an
employee’s termination was processed after the termination date, the likelihood of overpayments increased as
the lag time between termination and action entry date increased.
We did not perform detailed testing beyond the items in the sample discussed above, but we did note that a
significant amount of payments to employees beyond termination date exist outside of the items contained in
our sample. For instance, the population of payments beyond termination date for our scope contains over
$535,000 of payments where the check date is 50 or more days after the employee’s termination date.
Likewise, the population contains over $1.3 million of payments where the employee’s termination action entry
was executed in MUNIS at least 51 days after their actual termination date. Further testing would be required
to identify the total extent of overpayments that occurred during the period under examination.
From our interviews with payroll department personnel we determined that the District generally will prepare
an “overpayment letter” to send to a former employee when an overpayment is identified. However, it appears
that the identification and tracking of overpayments and their recovery status has not been handled
consistently. Of the $98,087 identified overpayments, only the $8,956 noted above (reduction in vacation
payout) has been recouped by the District. Further, no overpayment letter was prepared and sent for three of
the former employees we identified that received overpayments.
We recommend that the District proceed with investigation of the remaining payments in the population,
starting with the payments with the greatest period of time between termination and check date and
termination and action entry date.
Payroll Analysis– Overtime Pay
We extracted all payments from the annual payroll registers coded to pay-code 903, 904, and 905, which
represent overtime payments. We compared the overtime payments from the payroll registers to the amounts
in the general ledger (objects 134 through 139) and noted that the overtime payments as recorded in the payroll
registers exceeded what was recorded as overtime in the general ledger. We further inspected the detail of the
overtime payments from the payroll registers and noted that many of the overtime payments are not being

Results of Procedures and Findings
Payroll and HR
27
charged to an overtime object code in the general ledger, but rather to one of the normal salary/wage object
codes. The following schedule illustrates the disposition of overtime payments in the general ledger:
Figure 9 - Overtime From Payroll Registers as Recorded in General Ledger
General Ledger FY2013 FY2014 FY2015 Total
Overtime Object 702,126$ 74% 992,837$ 78% 1,620,264$ 94% 3,315,227$ 84%
Regular Salary/Wage Object 246,241 26% 277,401 22% 109,858 6% 633,500 16%
Total Overtime 948,367 1,270,238 1,730,122 3,948,727
Budgeted Overtime
(Object Codes 13X) 605,530 878,615 894,781 2,378,926
Overtime Over Budget 342,837$ 391,623$ 835,341$ 1,569,801$
Overtime Payments from Registers
As indicated above actual overtime incurred has increased year-over-year at a rate exceeding the increase in
budgeted overtime. Note that amounts above from the payroll registers will not agree to the general ledger
without the inclusion of reconciling items for beginning and ending accrual balances, as discussed further in the
Note on Payroll Analyses paragraph on page 23.
From our interviews we were made aware of a concern that the District’s policy of having overtime authorized in
advance was not being followed consistently, and as such we decided to request supporting documentation
(overtime authorization form and corresponding time sheet(s)) for a sample of employees who were paid
overtime in each of the three fiscal years under examination. We summarized the population of overtime
payments by employee and extracted employees receiving at least $15,000 in overtime pay over the three
years; we noted there were 56 such employees representing 33 separate locations. We inspected available
documentation attached in MUNIS for each of these employees and noted that 48 of the 56 had an “OT
Calculation” form included; 42 of the 56 employees had documentation attached in MUNIS indicating that they
had at least one “add-a-job” (that is, an hourly job separate from their primary position) during the period. 3 of
the 56 employees had neither an OT Calculation form nor showed any indication of having an “add-a-job”.
To further test for the proper approval of overtime per District policy, we judgmentally selected 17 of the 56
employees mentioned above from 6 separate locations and requested supporting documentation in the form of
approved timesheets and overtime approval forms. Results are summarized below:

Results of Procedures and Findings
Payroll and HR
28
Figure 10 - Overtime Sample Summary and Results
Location
Number of
Employees
Selected
Total Pay-
Periods
with OT in
FY2015
Total OT Pay for
These Employees
in FY2015
Results
of
Testing
Wando High School 3 46 28,423$ A
Liberty Hill Academy 4 79 32,352$ B
Plant Operations 3 47 32,362$ C
Public Safety Office 3 34 40,542$ D
School Food Services 2 48 11,893$ E
Chief Finance and Operations 2 44 24,220$ F
A – Of the forty-six pay periods where overtime was incurred by the three employees in the sample: in one
instance the overtime was approved before being incurred; two instances where the overtime was approved for
an amount “TBD”; five instances where there was no overtime approval documented at all; and 38 instances
where the overtime was approved after being incurred.
B – All overtime for the employees in the sample was attributed to their “add-a-job” as a bus rider. The only
approval noted for these employees was contained in the add-a-job form completed in 2012. Per discussion
with school management, their understanding is that “add-a-jobs” need only be approved once at the start of
the job.
C – We noted forty-seven total pay periods containing overtime for these employees, all of which were
approved after incurred.
D – Of the thirty-four pay periods where overtime was incurred by the three employees in the sample: twenty-
two instances where there was no approval documented; four instances where an overtime form had been
completed but not signed as being authorized; and eight instances where overtime was approved after incurred.
E – All overtime for the employees in the sample was attributed to their “add-a-job”.
F – We noted no instances where overtime was approved for any of the pay periods in which these employees
were paid overtime.
Payroll Analysis– Lump Sum and Supplemental Pay
As part of our Payments by Employee by Year analysis documented above, we also compared supplemental pay
year-over-year (i.e. payment in addition to base salary or wage, such as bonus pay, National Board Certification
pay, and other “lump sum” payments). As part of this analysis we identified instances where supplemental pay
represented a significant portion of an employee’s total compensation as well as instances where an employee’s
supplemental pay increased significantly from one year to the next.
Results of Procedures and Findings
Payroll and HR
29
We noted that the supplemental pay approval forms are filed electronically on the Districts shared U drive, to
which we were given access. However, only forms dating back to FY2014 are maintained, and as such we were
unable to substantiate proper approval for FY2013 supplemental pay amounts. We noted no instances where
an employee’s supplemental pay in FY2014 or FY2015 was not supported by a supplemental pay approval form.
The standard form documenting approval of supplemental pay is an Excel spreadsheet titled “FYXX LUMP SUM
PAYMENT REQUEST FORM”, which contains the following fields:
Name and position of originator
Authorized department head approval
Additional approval
Human Resources approval
Type of work performed
Listing of employee(s) to receive pay, including name, position, account number, department number,
number of days/hours, rate, and total
As the forms are maintained electronically, the approval “signatures” contained in these spreadsheets are
simply typed-in names rather than actual hand-written signatures. We noted several instances where the
originator and approver are the same individual, typically an individual from Human Resources.
Payroll Analysis– Procedures for Identification of Ghost Employees
We performed several procedures over the population of employees paid during the three fiscal years in an
effort to identify possible “ghost employees”. The term ghost employee refers to someone on the payroll who
does not actually work for the organization. A ghost employee could be a fictitious person or a real individual
who simply does not work for the organization.
A common characteristic among ghost employee fraud schemes is the lack of normal deductions and
withholdings typically included to arrive at an employee’s net pay. From the monthly payroll registers we
summarized by employee to determine not just gross pay, but also total employee and employer deductions in
order to identify any instance where an employee’s deductions were nonexistent or unusually low compared to
gross pay. No instances of unreasonably low or nonexistent deductions were noted as a result of these
procedures.
Additionally, we performed duplicate detection procedures for both social security numbers and employee
identification numbers over the population of employees paid. We identified three instances where a social
security number was associated with two separate employee ID numbers. However, through further research
we determined that each instance represented a situation in which an employee was assigned a new ID number,
and there was no overlap of payment from one number to the next. As this change in employee number was
found to have occurred only three times with no resulting overpayment, we did not perform further
examination to determine the reason for change of employee number.
Our final test for the existence of ghost employees involved analyzing employee addresses. We obtained
employee rosters for both active and inactive employees as of 2/15/2016 (MUNIS “employee inquiry” reports).
We identified all instances where an address was shared by two or more employees and evaluated whether
circumstances were reasonable that the address would be common (for example, spouses both employed by

Results of Procedures and Findings
Payroll and HR
30
the District, parent and child both employed by District, younger teachers hired at the same time living as
roommates, etc.). We identified a total of 267 addresses shared by at least two employees (total of 543
employees) receiving payment during the scope of our examination; however, we found no irregularities as a
result of these procedures.
Conclusion and Recommendations
31
Conclusion and Recommendations
The combined results of the General Fund, Special Revenue Fund, EIA Fund, and Food Service Fund (i.e. the
budgeted funds as presented in the District’s audited annual financial statements) yielded a net negative budget
variance of $18.9 million in FY2015. Of this net negative budget variance, $5.2 million can be attributed to
payroll and benefit expenditures exceeding budgeted amounts.
It is impractical to assign specific District locations their fair share of the $5.2 million payroll/benefits
expenditure shortfall in FY2015 due to the existence of the School-Wide Accounts location code, which was $4.8
million over budget mainly due to unrealized savings from lapsed salaries. Budgeted negative expenditures
representing estimated savings from lapsed salaries/benefits increased from ($4,398,267) in FY2014 to
($10,628,984) in FY2015. At the functional level, elementary grades 4 thru 8, food service operations, and nurse
services were the most significantly over budget, totaling approximately $9.7 million between the three.
The process employed by the District during the period of this examination for drafting the annual budget was
manually intensive and relied on the input of multiple parties including the management of the
schools/departments, the Office of Financial Services (which contains the dedicated Budget Department),
outside stakeholders including preschool providers, and the Board of Trustees who ultimately approved the
document. What we did not find, however, was enough basic budgetary control to allow for the monitoring of
the budget throughout the fiscal year on a regular basis.
The lack of strong IT leadership, an overall strategic vision to guide activities, and an informal internal control
structure within IT, all created a situation where, over time, Business Intelligence was unable to meet the
expectation of their customers, primarily Human Resources. Inefficient usage of the Tyler Technology support
and chronic staffing shortages further prevented them from adequately managing projects to support the needs
of Payroll and Human Resources and meet general user requests in a timely manner. Inadequate internal
control structure, visibility, accountability, staffing shortages, and discipline around change management and
general IT project management caused severe project delays, further weakening the working relationship
between Business Intelligence and functional departments.
The decentralized nature of the payroll and HR processes District-wide results in certain inherent difficulties.
Currently, schools and other locations in the District are not being held accountable for their responsibilities
related to processing and approving of payroll time and attendance batches, overtime approval, and initiation of
timely actions, particularly for terminations. As a result we noted and reported on regularly occurring
unapproved time and attendance batches being processed, off-cycle payroll runs occurring regularly during the
year, unapproved or improperly approved overtime, and payments being made to terminated employees.
Based on the above observations and findings, we make the following recommendations to the District.
IT
Remediation or approaches to address the gaps identified can vary and will need to be addressed in conjunction
with each other. Planning for the approach to implement lasting internal controls and integrating them into daily
job functions will take some time. Awareness of IT controls and incorporating them into IT processes needs to be
enhanced.

Conclusion and Recommendations
32
The table below summarizes our key IT-related recommendations:
Area Recommendation
IT GOVERNANCE AND MANAGEMENT
Risk
Assessments
and Strategic
Plan
Develop an IT Strategic plan with key stakeholders District-wide to provide clear direction
and common understanding of the business needs of the District and IT’s role in supporting
these needs. Develop plans to conduct periodic risk assessments within IT to identify new,
persistent, and changing threats. As previously mentioned in this report, staffing issues over
time pose a different risk than temporary staffing issues.
Staffing,
Training, and
Segregation of
Duties
Develop an IT hiring plan to meet the support needs of the District. This should occur in
conjunction with the overall evaluation of MUNIS and the current configuration and usage
gaps in MUNIS. MUNIS functionality and configuration needs to be better leveraged along
with additional user training. This potentially will impact the IT support staffing needs.
IT Governance
and Steering
Committee
Develop a tracking mechanism / project management function for accountability of all user
requests and projects to provide up front validation, project discipline, tracking cost, delays,
big picture view, enhance visibility and to help prioritize work.
The outsourced Internal Audit report on IT security conducted in 2015 was valuable and
provides a solid foundation for improving the overall security posture of CCSD.
IT Policies and
Data
classifications
The South Carolina Division of Information Security (SC DIS) has a comprehensive set of
Information Security requirements. This framework and policies provide an excellent
starting point for development of IT policies and data classification guidance.
SECURITY ADMINISTRATION
User Access
Reviews
A valid user access review includes a thorough review of all roles with consideration of
segregation of duties. No real user access review where full consideration of the user roles
and segregation of duties has taken place. Limited reviews have been conducted in
conjunction with system upgrades or changes; however, they are not well documented or
auditable.
CHANGE MANAGEMENT
Policies and
Procedures
Policies and clear processes need to be developed for all user requests coming into Business
Intelligence. A system needs to be implemented to track all incoming requests, provide for a
mechanism to prioritize the requests, analyze the request in light of inherent system
functionality, and user training needs.
General
application
(MUNIS)
support and
management
Tyler Technologies does not provide a Service Organization Control (SOC) report to the
District. As such, the district has no assurance of the internal controls at Tyler Technologies
where the District data resides. We recommend that management request Tyler
Technologies to provide assurance of internal controls that exist at Tyler Technologies due to
the high dependency on this vendor. A SOC report is one way to achieve the assurance.
Other options are to perform an audit at Tyler Technologies to review their processes to
safeguard the Districts data and their controls to ensure processing integrity within MUNIS.

Conclusion and Recommendations
33
Area Recommendation
System
configuration
and usage
The District should work with Tyler Technologies to review all key processes in place and
evaluate how the system is currently being utilized and develop a plan of action to ‘re-
implement’ aspects of MUNIS where appropriate to streamline user processes and gain
efficiencies. This review, along with user training to provide better understanding and
comfort level regarding the inherent controls and integrity within MUNIS, will help to
eliminate manual verification processes.
Budgeting
The District should continue moving away from the incremental budgeting approach formerly employed where
current year budget is based on prior year’s budget and adopt a modified “zero based” approach that allows for
compliance with state-mandated required staffing models. The use of the School-Wide Accounts location in the
budget process should also be reconsidered in order to avoid significant negative budgeted expenditures that
are not realizable.
The District should make each location accountable for monitoring their performance against budget. We
recommend that the District provide training to appropriate personnel District-wide so that a designated
individual at each location is familiar with their budget and therefore able to monitor budget to actual results
and be prepared to respond to variances against budget. We further recommend that the District continue to
refine the process of encumbering salaries/benefits in MUNIS (started in FY2016) which would allow for more
accurate mid-year projections of payroll and benefit related expense.
Finally, the District should provide more detailed and useful budget to actual reporting to the Board of Trustees
on a monthly basis.
Payroll / HR
In order to streamline the process for entering and approving time and attendance batches, we recommend that
the District fully roll-out the Kronos timekeeping software District-wide as soon as feasible. We understand,
however, that the implementation of Kronos is very much dependent on remediation of certain IT related
findings addressed earlier.
Additionally, we recommend that the District revisit the results of the study performed by the SAS Institute
(published February 1, 2013). This comprehensive study provided recommendations on ways to streamline
significant processes including new hires onboarding/set-up, internal movements, lump sum payments, and
terminations. The District should move away from manual calculations and approvals and towards automation
(i.e. eliminate use of offline tools such as Microsoft Word and Excel documents and replace by allowing
information to be entered directly into MUNIS).
We further recommend that the District clearly communicate the responsibilities of the schools and other
locations related to payroll and HR processes. This includes the schools’ responsibility for timely entering and
approval of time and attendance batches in MUNIS, which would result in fewer unscheduled payroll runs and
alleviate the burden placed on the payroll department. Additionally, we recommend that the District enforce
their policies related to the appropriate authorization of overtime; also, the District should ensure that MUNIS is
Conclusion and Recommendations
34
set up to ensure that all overtime payments are recorded to an appropriate overtime general ledger object
code.
Finally, the District should emphasize to the schools the importance of timely execution of HR action entries in
MUNIS, particularly as related to employee terminations. As noted above, we noted no overpayments to
terminated employees when the action entry was entered either the day of the actual termination or in
advance of the termination, which in our analysis indicates that the schools / originating locations play the
biggest part in preventing overpayments. The District should make the schools and other locations accountable
for these responsibilities and develop a standardized approach for handling instances of noncompliance on the
part of the responsible individuals.
The District should develop a policy and standardized process for the identification and recovery of
overpayments to terminated employees. First, the District should seek to identify the total extent of
overpayments that occurred in the last several years. Once identified, a system for tracking the status of the
recovery efforts should be developed. We recommend that the results of these efforts be made part of
standard reporting at senior management meetings and Board of Trustee meetings.
This concludes our report detailing the procedures performed as part of our examination and the resulting
findings and recommendations. Had we performed additional procedures or modified the scope of our
examination, other matters might have come to our attention that would have been reported to you. We
welcome the opportunity to be of further assistance to the District.

Exhibit 1 Payroll and Benefit Related Expenditures - By Location - Compared to Final BudgetGeneral, Special Revenue, EIA and Food Service Funds
FY2015
Location Code Description
Original Budget Adjustments Final Budget
Actual Expenditure
(Over) / Under Final Budget
999 SCHOOL-WIDE ACCOUNTS 5,808,954$ (8,640,891)$ (2,831,937)$ 1,980,569$ (4,812,506)$ 444 MORNINGSIDE MIDDLE 4,528,216 74,422 4,602,638 5,211,237 (608,599) 468 LIBERTY HILL ACADEMY 3,340,102 (160,212) 3,179,890 3,607,999 (428,109) 608 ASHLEY RIVER ELEMENTARY 4,320,204 196 4,320,400 4,747,721 (427,321) 169 SPECIAL EDUCATION DEPARTMENT 2,491,529 (240,551) 2,250,978 2,636,884 (385,906) 310 JAMES ISLAND ELEMENTARY 3,340,662 (56,196) 3,284,466 3,619,428 (334,962) 653 WEST ASHLEY HIGH SCHOOL 10,560,931 511,914 11,072,845 11,380,477 (307,632) 384 STUDENT INTERVENTION SERVICES 3,648,854 (189,733) 3,459,121 3,755,461 (296,340) 304 HARBORVIEW ELEMENTARY 3,068,956 313,555 3,382,511 3,678,437 (295,926) 504 ST JAMES-SANTEE ELEMENTARY 1,980,020 2,705 1,982,725 2,264,031 (281,306) 101 SUPERINTENDENT'S OFFICE 465,302 42,427 507,729 737,603 (229,874) 123 ADULT EDUCATION 887,307 159,540 1,046,847 1,275,635 (228,788) 422 MATILDA F DUNSTON ELEMENTARY 2,623,643 242,857 2,866,500 3,085,068 (218,568) 446 ZUCKER MIDDLE SCHOOL 3,090,822 235,019 3,325,841 3,524,788 (198,947) 247 CARIO MIDDLE 6,522,179 233,567 6,755,746 6,951,648 (195,902) 112 SCHOOL FOOD SERVICES 990,518 - 990,518 1,180,350 (189,832) 151 HEADSTART/EHS/PRESCHOOL 1,931,363 (366,090) 1,565,273 1,750,966 (185,693) 707 JAMES SIMONS ELEMENTARY 2,557,905 54,729 2,612,634 2,791,074 (178,440) 342 JAMES ISLAND MIDDLE 2,268,995 (34,864) 2,234,131 2,410,904 (176,773) 450 CHAS COUNTY SCHOOL OF THE ARTS 6,646,802 207,460 6,854,262 7,030,569 (176,307) 343 FORT JOHNSON MIDDLE 2,815,805 75,737 2,891,542 3,066,882 (175,340) 611 SPRINGFIELD ELEMENTARY 4,172,929 111,652 4,284,581 4,451,712 (167,131) 414 LAMBS ELEMENTARY 2,782,956 207,964 2,990,920 3,155,197 (164,277) 208 CHARLES PINCKNEY ELEMENTARY 6,155,750 (244,432) 5,911,318 6,068,874 (157,556) 755 BURKE HIGH 4,429,912 471,279 4,901,191 5,049,523 (148,332) 258 WANDO COMMUNITY SCHOOL 271,619 11,893 283,512 422,860 (139,348) 756 BURKE COMMUNITY ED 200,022 44,704 244,726 380,800 (136,074) 203 MAMIE P WHITESIDES ELEMENTARY 4,374,328 (18,398) 4,355,930 4,488,169 (132,239) 242 LAING MIDDLE 3,516,151 46,541 3,562,692 3,674,278 (111,586) 454 R B STALL HIGH 7,473,130 557,440 8,030,570 8,138,973 (108,403) 800 MIDDLE SCHOOL LEARNING COMM 928,338 145,442 1,073,780 1,177,835 (104,055) 439 MEETING STREET ACD@BRENTWOOD - 68,473 68,473 169,954 (101,481) 205 BELLE HALL ELEMENTARY 4,389,893 50,222 4,440,115 4,532,826 (92,711) 743 LOW COUNTRY TECH 861,183 21,350 882,533 971,552 (89,019) 207 JENNIE MOORE ELEMENTARY 4,765,778 (18,719) 4,747,059 4,832,878 (85,819) 906 MT ZION ELEMENTARY 2,144,332 62,240 2,206,572 2,292,138 (85,566) 424 HUNLEY PARK ELEMENTARY 3,041,777 317,388 3,359,165 3,443,047 (83,882) 359 SEPTIMA P CLARK ACADEMY 1,553,898 (137,221) 1,416,677 1,499,456 (82,779) 309 MURRAY-LASAINE ELEMENTARY 2,793,683 9,410 2,803,093 2,882,115 (79,022) 305 STILES POINT ELEMENTARY 4,149,675 181,037 4,330,712 4,407,305 (76,593) 701 PLANT OPERATIONS 477,064 20,576 497,640 572,528 (74,888) 202 MT PLEASANT ACADEMY 3,650,946 108,084 3,759,030 3,826,804 (67,774) 413 E A BURNS ELEMENTARY 3,941,570 842,862 4,784,432 4,852,119 (67,687) 951 ST JOHN'S HIGH 2,919,382 297,660 3,217,042 3,277,599 (60,557) 463 DANIEL JENKINS ACADEMY 1,974,568 63,262 2,037,830 2,096,064 (58,234) 419 NORTH CHAS CREATIVE ARTS ELEM 2,810,370 147,513 2,957,883 3,011,264 (53,381) 852 BAPTIST HILL COMM ED 68,443 - 68,443 119,891 (51,448) 245 MOULTRIE MIDDLE 5,000,970 58,438 5,059,408 5,109,287 (49,879) 111 MAINTENANCE DEPARTMENT 702,583 (25,219) 677,364 725,093 (47,729) 140 PUBLIC SAFETY OFFICE 661,254 7,689 668,943 713,072 (44,129) 135 CAREER & TECHNOLOGY EDUCATION 458,547 12,491 471,038 511,956 (40,918) 350 JAMES ISLAND CHARTER HIGH 309,215 (20,375) 288,840 329,153 (40,313) 118 GIFTED & TALENTED OFFICE 145,563 33,912 179,475 216,011 (36,536) 458 ACADEMIC MAGNET HIGH SCHOOL 3,928,043 204,106 4,132,149 4,167,347 (35,198) 182 VIDEO SERVICES 166,260 - 166,260 200,078 (33,818) 403 LAMBS SERVICE CENTER 20,000 (2,600) 17,400 49,209 (31,809) 411 CHILD & FAMILY DEVELOPMENT CTR 942,552 (119,647) 822,905 854,123 (31,218) 117 OFFICE OF GENERAL COUNSEL 261,750 - 261,750 291,753 (30,003) 180 CHIEF FINANCE & OPERATIONS 512,475 - 512,475 541,429 (28,954) 421 W B GOODWIN ELEMENTARY 4,328,663 296,711 4,625,374 4,653,162 (27,788) 126 OPERATIONAL PLANNING - - - 24,929 (24,929)

Exhibit 1 Payroll and Benefit Related Expenditures - By Location - Compared to Final BudgetGeneral, Special Revenue, EIA and Food Service Funds
FY2015
Location Code Description
Original Budget Adjustments Final Budget
Actual Expenditure
(Over) / Under Final Budget
154 STUDENT TRANSPORTATION 177,659 6,426 184,085 205,354 (21,269) 642 C E WILLIAMS ACADEMIC MAGNET 3,568,667 45,704 3,614,371 3,635,524 (21,153) 143 SCIENCE OFFICE 156,650 - 156,650 175,229 (18,579) 646 WEST ASHLEY MIDDLE 14,966 (11,855) 3,111 19,023 (15,912) 752 THOMAS MYERS II 829,935 (21,013) 808,922 823,666 (14,744) 166 RISK MANAGEMENT 372,473 - 372,473 386,396 (13,923) 420 MALCOLM C HURSEY ELEMENTARY 3,390,210 26,349 3,416,559 3,429,800 (13,241) 121 FINE ARTS OFFICE 153,583 111,447 265,030 278,269 (13,239) 484 PSYCHOLOGICAL SVS & AUTISM 18,633 35 18,668 31,381 (12,713) 134 NURSE SERVICES OFFICE 316,898 (22,209) 294,689 304,934 (10,245) 655 WA HEAD START 584,749 4,872 589,621 599,501 (9,880) 139 ARCHIVES & RECORDS OFFICE 41,499 - 41,499 50,094 (8,595) 167 GUIDANCE & COUNSELING 116,705 (7,972) 108,733 117,012 (8,279) 100 BOARD OF TRUSTEES 87,133 - 87,133 95,057 (7,924) 164 CARPENTRY SHOP 1,243,395 61,324 1,304,719 1,310,533 (5,814) 402 BRENTWOOD SERVICE CENTER 20,000 (3,200) 16,800 21,064 (4,264) 648 ST ANDREWS MIDDLE 22,547 (17,368) 5,179 9,121 (3,942) 300 OLD DISTRICT 3 LEARN COMM 27,764 52,569 80,333 83,854 (3,521) 172 ELECTRICAL SHOP 834,504 32,498 867,002 869,350 (2,348) 150 CHILD DEV OFFICE 254,343 (4,110) 250,233 251,853 (1,620) 199 BUFFER - - - 1,549 (1,549) 709 BUIST ACADEMY ELEMENTARY 2,956,711 (104,647) 2,852,064 2,853,461 (1,397) 173 CHIEF INFORMATION OFFICE 126,920 750 127,670 129,036 (1,366) 239 MONTESSORI MT PLEA CHARTER ES 5,542 - 5,542 6,837 (1,295) 107 COMMUNITY SCHOOLS OFFICE 174,420 1,434 175,854 176,364 (510) 739 CHARLESTON DEVELOPMENT ACADEMY 14,995 (8,209) 6,786 6,825 (39) 443 MORNINGSIDE BOYS ACADEMY - - - 2 (2) 122 ENGLISH AS A SECOND LANGUAGE 227,211 (12,569) 214,642 214,642 - 160 HVAC SHOP 1,481,783 (178,269) 1,303,514 1,303,514 - 162 PLUMBING SHOP 1,061,776 (32,057) 1,029,719 1,029,720 (1) 201 PLANT OPERATIONS 38,384 (38,384) - - - 268 WINDWOOD FARMS PROGRAM - 22,102 22,102 22,102 - 465 SUMMIT PROGRAM 367,754 (29,377) 338,377 338,377 - 506 RISING STAR - 125,842 125,842 125,842 - 777 CHS COUNTY HUMAN SERVICES 143,963 51,658 195,621 195,621 - 784 CHILD FIND 175,207 (49,199) 126,008 126,008 - 761 CHAS MATH & SCIENCE CHARTER 14,995 (6,686) 8,309 8,138 171 600 DISTRICT 10 CONSTITUENT OFFICE 1,226 - 1,226 852 374 119 PLANT OPERATIONS 163,577 7,376 170,953 169,137 1,816 210 GOV JAMES B EDWARDS ELEMENTARY 3,777,943 158,673 3,936,616 3,934,769 1,847 555 LINCOLN COMMUNITY ED 1,863 - 1,863 - 1,863 410 MCNAIR BUILDING - 2,489 2,489 - 2,489 453 GARRETT COMMUNITY ED 104,672 - 104,672 102,173 2,499 445 MILITARY MAGNET ACADEMY 4,035,793 402,203 4,437,996 4,434,153 3,843 436 PEPPERHILL ELEMENTARY 4,075,531 182,088 4,257,619 4,251,887 5,732 181 TITLE I DISTRICT WIDE 1,255,260 19,752 1,275,012 1,269,040 5,972 158 BUDGETING OFFICE 887,872 (99,661) 788,211 780,646 7,565 141 INTERNAL AUDIT 519,116 5,330 524,446 515,191 9,255 902 ANGEL OAK ELEMENTARY 3,024,190 181,110 3,205,300 3,195,193 10,107 606 OAKLAND ELEMENTARY 3,711,263 318,265 4,029,528 4,018,983 10,545 601 PLANT OPER/QUALITY ASSUR - 77,550 77,550 66,981 10,569 603 ST ANDREWS ELEMENTARY 4,369,744 15,499 4,385,243 4,362,733 22,510 952 ST JOHNS COMM ED 124,083 (4,000) 120,083 96,836 23,247 204 SULLIVAN'S ISLAND ELEMENTARY 3,052,143 180,662 3,232,805 3,209,401 23,404 464 JUVENILE DETENTION CTR TWIN RI 153,349 121,915 275,264 250,754 24,510 452 NORTH CHARLESTON HIGH 4,159,182 583,190 4,742,372 4,717,640 24,732 136 PUPIL ACCOUNTING OFFICE 360,870 - 360,870 336,108 24,762 130 HUMAN CAPITAL DEV OFFICE 504,387 96,156 600,543 573,649 26,894 441 NORTHWOODS MIDDLE SCHOOL 5,436,033 545,157 5,981,190 5,954,128 27,062 103 FACILITIES AND ASSET MGMT 191,241 37,404 228,645 200,339 28,306 200 ELEMENTARY LEARNING COMM 562,784 90,855 653,639 621,080 32,559

Exhibit 1 Payroll and Benefit Related Expenditures - By Location - Compared to Final BudgetGeneral, Special Revenue, EIA and Food Service Funds
FY2015
Location Code Description
Original Budget Adjustments Final Budget
Actual Expenditure
(Over) / Under Final Budget
809 JANE EDWARDS ELEMENTARY 1,213,035 76,200 1,289,235 1,253,669 35,566 808 C C BLANEY ELEMENTARY - 118,278 118,278 81,952 36,326 612 MONTESSORI COMMUNITY SCHL CHAS 1,712,497 63,982 1,776,479 1,734,458 42,021 616 DRAYTON HALL ELEMENTARY 4,207,653 17,444 4,225,097 4,182,970 42,127 144 PROCUREMENT SERVICES 458,250 - 458,250 415,881 42,369 170 ASSESSMENT & EVALUATION 1,231,937 6,418 1,238,355 1,192,220 46,135 161 ENERGY SERVICES 255,543 (11,238) 244,305 197,173 47,132 193 GENERAL SERVICES 503,059 - 503,059 455,328 47,731 907 EDITH FRIERSON ELEMENTARY 1,366,751 122,573 1,489,324 1,440,615 48,709 605 STONO PARK ELEMENTARY 2,594,249 301,380 2,895,629 2,846,441 49,188 400 DISTRICT 4 CONSTITUENT OFFICE 276,320 55,360 331,680 274,865 56,815 156 IT CUSTOMER SUPPORT 1,545,812 12,620 1,558,432 1,500,994 57,438 115 COMMUNICATIONS 582,360 40,428 622,788 564,319 58,469 714 SANDERS-CLYDE ELEMENTARY 4,332,633 581,955 4,914,588 4,855,791 58,797 706 MEMMINGER ELEMENTARY 3,021,978 266,729 3,288,707 3,228,180 60,527 132 COMMUNITY OUTREACH 456,949 24,458 481,407 415,472 65,935 415 LADSON ELEMENTARY 5,091,045 118,725 5,209,770 5,142,242 67,528 108 EMPLOYEE RELATIONS 439,135 - 439,135 371,315 67,820 171 CONTRACTS/PROCUREMENT SRVS 293,035 - 293,035 222,325 70,710 128 PROFESSIONAL DEVELOPMENT 182,119 129,886 312,005 240,789 71,216 106 ACCOUNTING OFFICE 669,823 (24,133) 645,690 574,003 71,687 607 ORANGE GROVE CHARTER ELMNTRY 175,371 - 175,371 102,890 72,481 351 JAMES IS HI COMMUNITY SCHOOL 251,565 - 251,565 173,836 77,729 647 ADVANCED STUDIES WEST ASHLEY 4,730,011 344,659 5,074,670 4,996,068 78,602 700 HIGH SCHOOL LEARNING COMMUNITY 1,233,327 124,635 1,357,962 1,271,981 85,981 209 LAUREL HILL PRIMARY 6,673,340 355,719 7,029,059 6,943,076 85,983 455 STALL COMMUNITY ED 336,045 20,284 356,329 266,472 89,857 102 MIDDLE SCHOOL LEARNING COLLAB. 967,808 87,489 1,055,297 963,588 91,709 712 JULIAN MITCHELL ELEMENTARY 3,158,343 120,317 3,278,660 3,186,387 92,273 810 E B ELLINGTON ELEMENTARY 2,447,017 510,887 2,957,904 2,853,510 104,394 705 CHARLESTON PROGRESSIVE SCHOOL 2,641,507 172,496 2,814,003 2,708,251 105,752 426 MIDLAND PARK PRIMARY SCHOOL 4,409,561 (15,667) 4,393,894 4,288,140 105,754 105 PAYROLL OFFICE 626,374 4,950 631,324 521,691 109,633 120 FEDERAL PROGRAMS OFFICE 906,876 257,702 1,164,578 1,050,092 114,486 425 A C CORCORAN ELEMENTARY 4,774,694 168,640 4,943,334 4,818,187 125,147 157 HUMAN RESOURCES 3,387,429 168,436 3,555,865 3,422,356 133,509 811 MINNIE HUGHES ELEMENTARY 2,549,843 (183,906) 2,365,937 2,229,393 136,544 195 FINANCIAL SERVICES 585,802 221,476 807,278 667,274 140,004 152 TECHNOLOGY & INFORMATION SYST 385,613 61,325 446,938 286,422 160,516 944 HAUT GAP MIDDLE 3,306,960 211,547 3,518,507 3,351,708 166,799 851 BAPTIST HILL HIGH 4,302,528 257,750 4,560,278 4,379,275 181,003 654 WEST ASHLEY COMM SCHL 343,892 41,329 385,221 195,370 189,851 554 LINCOLN HIGH 2,832,288 104,693 2,936,981 2,740,098 196,883 416 PINEHURST ELEMENTARY 3,392,086 199,491 3,591,577 3,361,807 229,770 125 CURRICULUM & INSTRUCTION 1,197,650 540,496 1,738,146 1,505,923 232,223 257 WANDO HIGH SCHOOL 23,411,531 316,101 23,727,632 23,460,052 267,580 153 IT NETWORK OPERATIONS 1,068,917 200,659 1,269,576 982,333 287,243 435 MARY FORD ELEMENTARY 3,153,479 460,209 3,613,688 3,323,540 290,148 418 NORTH CHARLESTON ELEMENTARY 3,697,888 467,794 4,165,682 3,868,594 297,088 104 CHIEF ACADEMIC OFFICE 2,475,633 1,220,799 3,696,432 3,398,874 297,558 451 GARRETT ACADEMY OF TECHNOLOGY 5,713,846 380,689 6,094,535 5,792,461 302,074 137 BUSINESS INTELLIGENCE 1,092,755 - 1,092,755 647,431 445,324 124 OFFICE OF TCHR EFFECTIVENESS 2,591,116 86,972 2,678,088 2,186,538 491,550 412 CHICORA ELEMENTARY 3,365,242 428,948 3,794,190 3,250,655 543,535 155 EDUCATIONAL TECHNOLOGY 792,652 765,169 1,557,821 961,959 595,862
358,081,909$ 9,200,371$ 367,282,280$ 372,514,054$ (5,231,774)$

Exhibit 1 Payroll and Benefit Related Expenditures - By Location - Compared to Final BudgetGeneral, Special Revenue, EIA and Food Service Funds
FY2014
Location Code Description
Original Budget Adjustments Final Budget
Actual Expenditure
(Over) / Under Final Budget
999 SCHOOL-WIDE ACCOUNTS (66,354)$ 3,606,848$ 3,540,494$ 7,996,820$ (4,456,326)$ 245 MOULTRIE MIDDLE 4,380,771 (55,362) 4,325,409 4,854,013 (528,604) 342 JAMES ISLAND MIDDLE 1,981,758 (80,451) 1,901,307 2,201,517 (300,210) 419 NORTH CHAS CREATIVE ARTS ELEM 1,825,759 135,042 1,960,801 2,207,516 (246,715) 435 MARY FORD ELEMENTARY 2,757,493 244,602 3,002,095 3,185,469 (183,374) 123 ADULT EDUCATION 1,055,309 (8,553) 1,046,756 1,207,364 (160,608) 112 SCHOOL FOOD SERVICES 822,047 250 822,297 977,173 (154,876) 444 MORNINGSIDE MIDDLE 4,086,614 348,654 4,435,268 4,587,358 (152,090) 646 WEST ASHLEY MIDDLE 2,078,451 (50,320) 2,028,131 2,162,504 (134,373) 700 HIGH SCHOOL LEARNING COMMUNITY 950,243 188,974 1,139,217 1,249,199 (109,982) 209 LAUREL HILL PRIMARY 7,063,176 (491,213) 6,571,963 6,648,280 (76,317) 642 C E WILLIAMS ACADEMIC MAGNET 3,123,778 133,658 3,257,436 3,331,679 (74,243) 118 GIFTED & TALENTED OFFICE 214,558 (63,862) 150,696 216,245 (65,549) 611 SPRINGFIELD ELEMENTARY 4,144,219 (251,695) 3,892,524 3,952,762 (60,238) 705 CHARLESTON PROGRESSIVE SCHOOL 2,366,490 36,856 2,403,346 2,462,243 (58,897) 458 ACADEMIC MAGNET HIGH SCHOOL 3,574,445 225,514 3,799,959 3,858,776 (58,817) 605 STONO PARK ELEMENTARY 2,469,151 27,024 2,496,175 2,549,304 (53,129) 413 E A BURNS ELEMENTARY 4,254,067 35,368 4,289,435 4,342,200 (52,765) 743 LOW COUNTRY TECH 756,150 11,547 767,697 817,453 (49,756) 180 CHIEF FINANCE & OPERATIONS 311,111 140,914 452,025 501,496 (49,471) 418 NORTH CHARLESTON ELEMENTARY 3,956,225 (155,708) 3,800,517 3,848,511 (47,994) 800 MIDDLE SCHOOL LEARNING COMM 1,222,782 (269,177) 953,605 993,443 (39,838) 350 JAMES ISLAND CHARTER HIGH 256,507 9,996 266,503 302,784 (36,281) 130 HUMAN CAPITAL DEV OFFICE 728,401 (77,282) 651,119 686,378 (35,259) 468 LIBERTY HILL ACADEMY 3,665,674 (272,419) 3,393,255 3,423,393 (30,138) 300 OLD DISTRICT 3 LEARN COMM 37,297 2,211 39,508 65,804 (26,296) 143 SCIENCE OFFICE 149,388 (39,928) 109,460 135,214 (25,754) 451 GARRETT ACADEMY OF TECHNOLOGY 5,026,154 275,171 5,301,325 5,324,096 (22,771) 343 FORT JOHNSON MIDDLE 2,876,997 95,668 2,972,665 2,992,722 (20,057) 166 RISK MANAGEMENT 473,333 (111,712) 361,621 381,622 (20,001) 105 PAYROLL OFFICE 521,677 89,571 611,248 629,062 (17,814) 108 EMPLOYEE RELATIONS 368,745 381 369,126 386,681 (17,555) 103 FACILITIES AND ASSET MGMT 170,690 - 170,690 186,771 (16,081) 384 STUDENT INTERVENTION SERVICES 3,482,722 257,398 3,740,120 3,755,995 (15,875) 416 PINEHURST ELEMENTARY 3,103,388 2,942 3,106,330 3,121,718 (15,388) 134 NURSE SERVICES OFFICE 195,215 64,061 259,276 273,097 (13,821) 752 THOMAS MYERS II 655,678 103,727 759,405 770,810 (11,405) 414 LAMBS ELEMENTARY 2,864,545 132,670 2,997,215 3,007,912 (10,697) 445 MILITARY MAGNET ACADEMY 3,671,230 546,434 4,217,664 4,227,533 (9,869) 655 WA HEAD START 670,177 (119,016) 551,161 559,630 (8,469) 607 ORANGE GROVE CHARTER ELMNTRY 103,112 - 103,112 109,404 (6,292) 420 MALCOLM C HURSEY ELEMENTARY 3,236,184 (42,147) 3,194,037 3,200,099 (6,062) 154 STUDENT TRANSPORTATION 172,766 609 173,375 178,445 (5,070) 119 PLANT OPERATIONS 159,801 - 159,801 163,454 (3,653) 415 LADSON ELEMENTARY 4,781,907 (97,263) 4,684,644 4,687,996 (3,352) 403 LAMBS SERVICE CENTER - 56,983 56,983 58,792 (1,809) 101 SUPERINTENDENT'S OFFICE 457,830 (1,300) 456,530 457,320 (790) 361 APPLE CHARTER SCHOOL - - - 607 (607) 100 BOARD OF TRUSTEES 84,495 - 84,495 85,000 (505) 761 CHAS MATH & SCIENCE CHARTER - 7,975 7,975 8,438 (463) 443 MORNINGSIDE BOYS ACADEMY - - - 209 (209) 742 BUIST MIDDLE SCHOOL - - - 157 (157) 461 GREGG MATHIS CHARTER - - - 123 (123) 167 GUIDANCE & COUNSELING 48,351 (20,987) 27,364 27,364 - 206 LHP CONSTRUCTION DO NOT USE 34,082 (34,082) - - - 239 MONTESSORI MT PLEA CHARTER ES 3,326 2,574 5,900 5,900 - 268 WINDWOOD FARMS PROGRAM 11,685 26,820 38,505 38,505 - 402 BRENTWOOD SERVICE CENTER - 16,262 16,262 16,262 - 484 PSYCHOLOGICAL SVS & AUTISM 18,555 76 18,631 18,631 - 506 RISING STAR - 118,011 118,011 118,011 - 739 CHARLESTON DEVELOPMENT ACADEMY - 7,975 7,975 7,975 -

Exhibit 1 Payroll and Benefit Related Expenditures - By Location - Compared to Final BudgetGeneral, Special Revenue, EIA and Food Service Funds
FY2014
Location Code Description
Original Budget Adjustments Final Budget
Actual Expenditure
(Over) / Under Final Budget
777 CHS COUNTY HUMAN SERVICES 240,921 (45,203) 195,718 195,718 - 784 CHILD FIND 155,780 (42,917) 112,863 112,863 - 464 JUVENILE DETENTION CTR TWIN RI 292,143 39,264 331,407 331,362 45 182 VIDEO SERVICES 163,661 - 163,661 163,222 439 410 MCNAIR BUILDING - 2,330 2,330 1,861 469 139 ARCHIVES & RECORDS OFFICE 49,932 - 49,932 49,219 713 600 DISTRICT 10 CONSTITUENT OFFICE 53,949 (52,723) 1,226 469 757 117 OFFICE OF GENERAL COUNSEL 253,706 - 253,706 251,893 1,813 140 PUBLIC SAFETY OFFICE 553,077 78,783 631,860 629,685 2,175 152 TECHNOLOGY & INFORMATION SYST 158,045 128,085 286,130 283,492 2,638 151 HEADSTART/EHS/PRESCHOOL 1,845,337 (442,218) 1,403,119 1,397,562 5,557 200 ELEMENTARY LEARNING COMM 696,645 (72,817) 623,828 617,726 6,102 465 SUMMIT PROGRAM 367,096 13,827 380,923 372,501 8,422 160 HVAC SHOP 1,385,166 (57,515) 1,327,651 1,317,672 9,979 135 CAREER & TECHNOLOGY EDUCATION 500,809 (175,136) 325,673 315,230 10,443 196 ADMIN BLDG (75 CALHOUN ST.) 44,235 - 44,235 33,456 10,779 411 CHILD & FAMILY DEVELOPMENT CTR 892,628 (48,764) 843,864 832,504 11,360 453 GARRETT COMMUNITY ED 105,561 - 105,561 93,660 11,901 612 MONTESSORI COMMUNITY SCHL CHAS 1,545,793 13,523 1,559,316 1,546,591 12,725 107 COMMUNITY SCHOOLS OFFICE 172,810 - 172,810 159,740 13,070 181 TITLE I DISTRICT WIDE 542,104 747,791 1,289,895 1,275,733 14,162 554 LINCOLN HIGH 2,412,448 470,530 2,882,978 2,868,030 14,948 555 LINCOLN COMMUNITY ED 87,883 - 87,883 71,412 16,471 952 ST JOHNS COMM ED 97,881 - 97,881 80,427 17,454 258 WANDO COMMUNITY SCHOOL 355,473 (12,900) 342,573 322,641 19,932 412 CHICORA ELEMENTARY 2,932,780 177,982 3,110,762 3,089,157 21,605 204 SULLIVAN'S ISLAND ELEMENTARY 2,911,755 (30,579) 2,881,176 2,858,516 22,660 351 JAMES IS HI COMMUNITY SCHOOL 187,695 - 187,695 163,333 24,362 359 SEPTIMA P CLARK ACADEMY 1,547,478 (117,494) 1,429,984 1,405,150 24,834 173 CHIEF INFORMATION OFFICE 142,610 - 142,610 117,014 25,596 205 BELLE HALL ELEMENTARY 4,501,356 (6,119) 4,495,237 4,468,502 26,735 148 FOREIGN LANGUAGE 76,880 (50,000) 26,880 - 26,880 309 MURRAY-LASAINE ELEMENTARY 2,901,854 (127,505) 2,774,349 2,746,780 27,569 141 INTERNAL AUDIT 385,044 73,247 458,291 430,239 28,052 808 C C BLANEY ELEMENTARY 1,956,855 84,737 2,041,592 2,012,983 28,609 203 MAMIE P WHITESIDES ELEMENTARY 4,343,208 (69,013) 4,274,195 4,245,017 29,178 852 BAPTIST HILL COMM ED 172,563 - 172,563 138,215 34,348 701 PLANT OPERATIONS 506,741 73,780 580,521 542,783 37,738 207 JENNIE MOORE ELEMENTARY 4,544,654 72,131 4,616,785 4,575,252 41,533 906 MT ZION ELEMENTARY 2,064,817 52,987 2,117,804 2,075,704 42,100 202 MT PLEASANT ACADEMY 3,301,683 506,814 3,808,497 3,765,134 43,363 136 PUPIL ACCOUNTING OFFICE 377,746 (14,568) 363,178 317,723 45,455 305 STILES POINT ELEMENTARY 4,371,416 85,743 4,457,159 4,410,173 46,986 907 EDITH FRIERSON ELEMENTARY 1,367,314 (65,054) 1,302,260 1,254,117 48,143 811 MINNIE HUGHES ELEMENTARY 1,769,258 (32,983) 1,736,275 1,687,250 49,025 170 ASSESSMENT & EVALUATION 983,864 (49,261) 934,603 883,596 51,007 164 CARPENTRY SHOP 1,196,518 (16,500) 1,180,018 1,128,750 51,268 125 CURRICULUM & INSTRUCTION 790,260 (84,657) 705,603 653,995 51,608 809 JANE EDWARDS ELEMENTARY 1,229,931 123,069 1,353,000 1,300,237 52,763 242 LAING MIDDLE 3,220,917 60,434 3,281,351 3,228,482 52,869 155 EDUCATIONAL TECHNOLOGY 965,236 (177,253) 787,983 734,972 53,011 426 MIDLAND PARK PRIMARY SCHOOL 4,142,307 41,092 4,183,399 4,129,195 54,204 421 W B GOODWIN ELEMENTARY 4,318,193 (28,567) 4,289,626 4,234,071 55,555 603 ST ANDREWS ELEMENTARY 4,263,135 (78,715) 4,184,420 4,128,615 55,805 111 MAINTENANCE DEPARTMENT 676,796 9,654 686,450 630,586 55,864 902 ANGEL OAK ELEMENTARY 3,017,520 (19,232) 2,998,288 2,937,960 60,328 193 GENERAL SERVICES 492,700 4,277 496,977 432,914 64,063 121 FINE ARTS OFFICE 364,576 (52,229) 312,347 246,482 65,865 436 PEPPERHILL ELEMENTARY 3,715,201 103,889 3,819,090 3,752,744 66,346 400 DISTRICT 4 CONSTITUENT OFFICE 114,424 31,935 146,359 76,732 69,627 455 STALL COMMUNITY ED 258,614 32,752 291,366 220,085 71,281

Exhibit 1 Payroll and Benefit Related Expenditures - By Location - Compared to Final BudgetGeneral, Special Revenue, EIA and Food Service Funds
FY2014
Location Code Description
Original Budget Adjustments Final Budget
Actual Expenditure
(Over) / Under Final Budget
712 JULIAN MITCHELL ELEMENTARY 2,823,052 395,297 3,218,349 3,146,983 71,366 210 GOV JAMES B EDWARDS ELEMENTARY 4,090,537 (156,225) 3,934,312 3,862,040 72,272 115 COMMUNICATIONS 606,749 (22,478) 584,271 511,952 72,319 162 PLUMBING SHOP 984,658 66,684 1,051,342 977,529 73,813 608 ASHLEY RIVER ELEMENTARY 4,552,826 (12,987) 4,539,839 4,463,588 76,251 102 MIDDLE SCHOOL LEARNING COLLAB. 1,066,635 (276,498) 790,137 713,132 77,005 944 HAUT GAP MIDDLE 3,240,406 106,856 3,347,262 3,267,341 79,921 161 ENERGY SERVICES 132,262 115,712 247,974 167,925 80,049 304 HARBORVIEW ELEMENTARY 3,398,279 (70,298) 3,327,981 3,245,655 82,326 106 ACCOUNTING OFFICE 660,261 (33,820) 626,441 543,046 83,395 463 DANIEL JENKINS ACADEMY 2,201,452 (88,767) 2,112,685 2,028,416 84,269 310 JAMES ISLAND ELEMENTARY 3,454,231 65,169 3,519,400 3,433,170 86,230 424 HUNLEY PARK ELEMENTARY 3,325,011 4,960 3,329,971 3,241,490 88,481 195 FINANCIAL SERVICES 437,608 (7,318) 430,290 341,320 88,970 606 OAKLAND ELEMENTARY 3,948,459 (130,465) 3,817,994 3,727,330 90,664 425 A C CORCORAN ELEMENTARY 4,658,369 506 4,658,875 4,564,363 94,512 172 ELECTRICAL SHOP 829,580 15,399 844,979 748,204 96,775 156 IT CUSTOMER SUPPORT 2,395,372 (1,048,454) 1,346,918 1,249,539 97,379 122 ENGLISH AS A SECOND LANGUAGE 164,548 65,420 229,968 132,530 97,438 452 NORTH CHARLESTON HIGH 4,103,278 631,020 4,734,298 4,634,116 100,182 714 SANDERS-CLYDE ELEMENTARY 4,227,265 201,752 4,429,017 4,328,814 100,203 422 MATILDA F DUNSTON ELEMENTARY 2,588,067 107,457 2,695,524 2,593,815 101,709 653 WEST ASHLEY HIGH SCHOOL 10,847,928 515,824 11,363,752 11,260,474 103,278 153 IT NETWORK OPERATIONS - 994,292 994,292 889,451 104,841 756 BURKE COMMUNITY ED 224,734 98,497 323,231 218,038 105,193 851 BAPTIST HILL HIGH 3,860,221 95,957 3,956,178 3,845,090 111,088 504 ST JAMES-SANTEE ELEMENTARY 2,128,700 109,762 2,238,462 2,119,068 119,394 709 BUIST ACADEMY ELEMENTARY 2,719,072 287,394 3,006,466 2,880,769 125,697 257 WANDO HIGH SCHOOL 20,458,258 812,174 21,270,432 21,137,735 132,697 450 CHAS COUNTY SCHOOL OF THE ARTS 6,611,881 284,042 6,895,923 6,760,000 135,923 144 PROCUREMENT SERVICES 423,050 (36,985) 386,065 248,064 138,001 654 WEST ASHLEY COMM SCHL 228,530 - 228,530 83,690 144,840 157 HUMAN RESOURCES 3,003,302 177,520 3,180,822 3,035,773 145,049 132 COMMUNITY OUTREACH 598,920 37,710 636,630 486,990 149,640 446 ZUCKER MIDDLE SCHOOL 3,243,149 73,938 3,317,087 3,156,182 160,905 171 CONTRACTS/PROCUREMENT SRVS 368,418 - 368,418 204,660 163,758 158 BUDGETING OFFICE 882,573 (21,418) 861,155 695,137 166,018 706 MEMMINGER ELEMENTARY 2,954,557 338,031 3,292,588 3,111,253 181,335 648 ST ANDREWS MIDDLE 2,779,051 61,770 2,840,821 2,655,795 185,026 169 SPECIAL EDUCATION DEPARTMENT 2,689,231 318,794 3,008,025 2,806,662 201,363 951 ST JOHN'S HIGH 3,535,922 379,016 3,914,938 3,704,216 210,722 137 BUSINESS INTELLIGENCE 612,092 206,995 819,087 605,025 214,062 128 PROFESSIONAL DEVELOPMENT 348,010 705,393 1,053,403 838,293 215,110 124 OFFICE OF TCHR EFFECTIVENESS 1,115,860 344,221 1,460,081 1,244,854 215,227 810 E B ELLINGTON ELEMENTARY 2,316,159 242,523 2,558,682 2,336,189 222,493 707 JAMES SIMONS ELEMENTARY 2,954,029 (364,658) 2,589,371 2,364,545 224,826 208 CHARLES PINCKNEY ELEMENTARY 5,540,507 340,826 5,881,333 5,644,004 237,329 120 FEDERAL PROGRAMS OFFICE 887,938 502,633 1,390,571 1,063,253 327,318 454 R B STALL HIGH 7,910,307 548,013 8,458,320 8,076,371 381,949 755 BURKE HIGH 5,848,896 559,661 6,408,557 5,975,088 433,469 441 NORTHWOODS MIDDLE SCHOOL 4,818,901 451,153 5,270,054 4,813,917 456,137 247 CARIO MIDDLE 6,469,621 448,586 6,918,207 6,443,860 474,347 616 DRAYTON HALL ELEMENTARY 4,738,689 (153,264) 4,585,425 4,103,762 481,663 104 CHIEF ACADEMIC OFFICE 2,319,961 578,483 2,898,444 2,310,156 588,288
341,772,509$ 14,634,828$ 356,407,337$ 352,953,028$ 3,454,309$
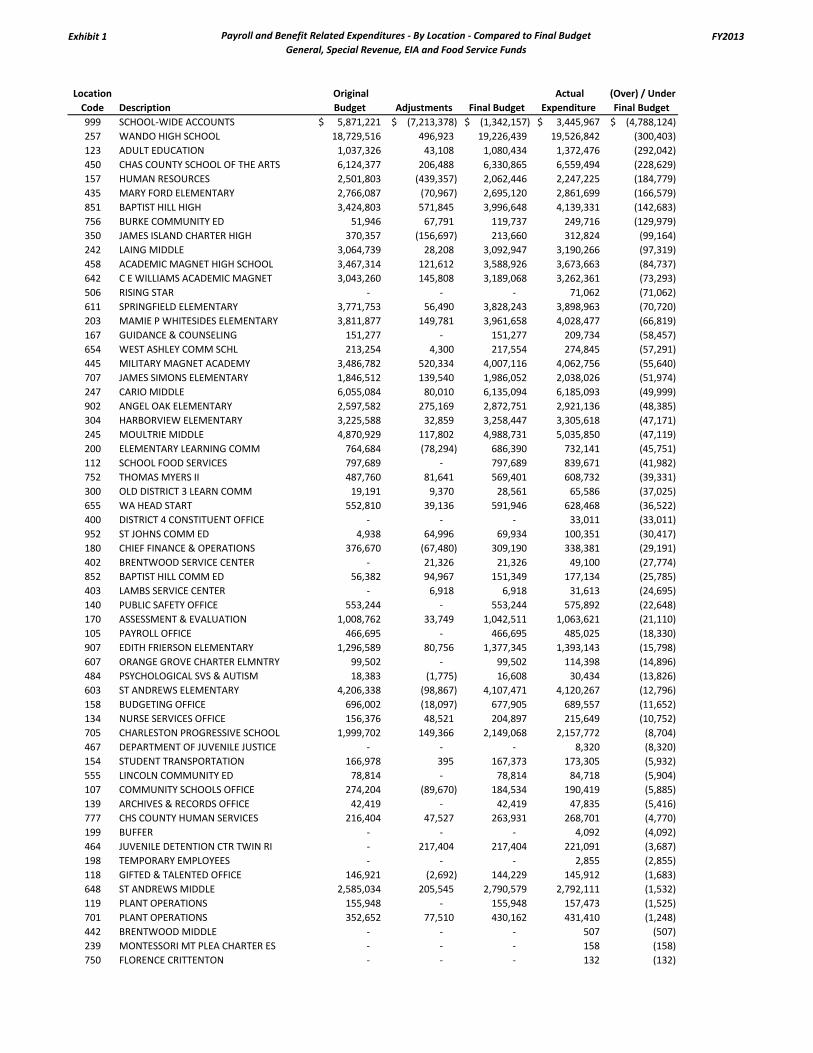
Exhibit 1 Payroll and Benefit Related Expenditures - By Location - Compared to Final BudgetGeneral, Special Revenue, EIA and Food Service Funds
FY2013
Location Code Description
Original Budget Adjustments Final Budget
Actual Expenditure
(Over) / Under Final Budget
999 SCHOOL-WIDE ACCOUNTS 5,871,221$ (7,213,378)$ (1,342,157)$ 3,445,967$ (4,788,124)$ 257 WANDO HIGH SCHOOL 18,729,516 496,923 19,226,439 19,526,842 (300,403) 123 ADULT EDUCATION 1,037,326 43,108 1,080,434 1,372,476 (292,042) 450 CHAS COUNTY SCHOOL OF THE ARTS 6,124,377 206,488 6,330,865 6,559,494 (228,629) 157 HUMAN RESOURCES 2,501,803 (439,357) 2,062,446 2,247,225 (184,779) 435 MARY FORD ELEMENTARY 2,766,087 (70,967) 2,695,120 2,861,699 (166,579) 851 BAPTIST HILL HIGH 3,424,803 571,845 3,996,648 4,139,331 (142,683) 756 BURKE COMMUNITY ED 51,946 67,791 119,737 249,716 (129,979) 350 JAMES ISLAND CHARTER HIGH 370,357 (156,697) 213,660 312,824 (99,164) 242 LAING MIDDLE 3,064,739 28,208 3,092,947 3,190,266 (97,319) 458 ACADEMIC MAGNET HIGH SCHOOL 3,467,314 121,612 3,588,926 3,673,663 (84,737) 642 C E WILLIAMS ACADEMIC MAGNET 3,043,260 145,808 3,189,068 3,262,361 (73,293) 506 RISING STAR - - - 71,062 (71,062) 611 SPRINGFIELD ELEMENTARY 3,771,753 56,490 3,828,243 3,898,963 (70,720) 203 MAMIE P WHITESIDES ELEMENTARY 3,811,877 149,781 3,961,658 4,028,477 (66,819) 167 GUIDANCE & COUNSELING 151,277 - 151,277 209,734 (58,457) 654 WEST ASHLEY COMM SCHL 213,254 4,300 217,554 274,845 (57,291) 445 MILITARY MAGNET ACADEMY 3,486,782 520,334 4,007,116 4,062,756 (55,640) 707 JAMES SIMONS ELEMENTARY 1,846,512 139,540 1,986,052 2,038,026 (51,974) 247 CARIO MIDDLE 6,055,084 80,010 6,135,094 6,185,093 (49,999) 902 ANGEL OAK ELEMENTARY 2,597,582 275,169 2,872,751 2,921,136 (48,385) 304 HARBORVIEW ELEMENTARY 3,225,588 32,859 3,258,447 3,305,618 (47,171) 245 MOULTRIE MIDDLE 4,870,929 117,802 4,988,731 5,035,850 (47,119) 200 ELEMENTARY LEARNING COMM 764,684 (78,294) 686,390 732,141 (45,751) 112 SCHOOL FOOD SERVICES 797,689 - 797,689 839,671 (41,982) 752 THOMAS MYERS II 487,760 81,641 569,401 608,732 (39,331) 300 OLD DISTRICT 3 LEARN COMM 19,191 9,370 28,561 65,586 (37,025) 655 WA HEAD START 552,810 39,136 591,946 628,468 (36,522) 400 DISTRICT 4 CONSTITUENT OFFICE - - - 33,011 (33,011) 952 ST JOHNS COMM ED 4,938 64,996 69,934 100,351 (30,417) 180 CHIEF FINANCE & OPERATIONS 376,670 (67,480) 309,190 338,381 (29,191) 402 BRENTWOOD SERVICE CENTER - 21,326 21,326 49,100 (27,774) 852 BAPTIST HILL COMM ED 56,382 94,967 151,349 177,134 (25,785) 403 LAMBS SERVICE CENTER - 6,918 6,918 31,613 (24,695) 140 PUBLIC SAFETY OFFICE 553,244 - 553,244 575,892 (22,648) 170 ASSESSMENT & EVALUATION 1,008,762 33,749 1,042,511 1,063,621 (21,110) 105 PAYROLL OFFICE 466,695 - 466,695 485,025 (18,330) 907 EDITH FRIERSON ELEMENTARY 1,296,589 80,756 1,377,345 1,393,143 (15,798) 607 ORANGE GROVE CHARTER ELMNTRY 99,502 - 99,502 114,398 (14,896) 484 PSYCHOLOGICAL SVS & AUTISM 18,383 (1,775) 16,608 30,434 (13,826) 603 ST ANDREWS ELEMENTARY 4,206,338 (98,867) 4,107,471 4,120,267 (12,796) 158 BUDGETING OFFICE 696,002 (18,097) 677,905 689,557 (11,652) 134 NURSE SERVICES OFFICE 156,376 48,521 204,897 215,649 (10,752) 705 CHARLESTON PROGRESSIVE SCHOOL 1,999,702 149,366 2,149,068 2,157,772 (8,704) 467 DEPARTMENT OF JUVENILE JUSTICE - - - 8,320 (8,320) 154 STUDENT TRANSPORTATION 166,978 395 167,373 173,305 (5,932) 555 LINCOLN COMMUNITY ED 78,814 - 78,814 84,718 (5,904) 107 COMMUNITY SCHOOLS OFFICE 274,204 (89,670) 184,534 190,419 (5,885) 139 ARCHIVES & RECORDS OFFICE 42,419 - 42,419 47,835 (5,416) 777 CHS COUNTY HUMAN SERVICES 216,404 47,527 263,931 268,701 (4,770) 199 BUFFER - - - 4,092 (4,092) 464 JUVENILE DETENTION CTR TWIN RI - 217,404 217,404 221,091 (3,687) 198 TEMPORARY EMPLOYEES - - - 2,855 (2,855) 118 GIFTED & TALENTED OFFICE 146,921 (2,692) 144,229 145,912 (1,683) 648 ST ANDREWS MIDDLE 2,585,034 205,545 2,790,579 2,792,111 (1,532) 119 PLANT OPERATIONS 155,948 - 155,948 157,473 (1,525) 701 PLANT OPERATIONS 352,652 77,510 430,162 431,410 (1,248) 442 BRENTWOOD MIDDLE - - - 507 (507) 239 MONTESSORI MT PLEA CHARTER ES - - - 158 (158) 750 FLORENCE CRITTENTON - - - 132 (132)

Exhibit 1 Payroll and Benefit Related Expenditures - By Location - Compared to Final BudgetGeneral, Special Revenue, EIA and Food Service Funds
FY2013
Location Code Description
Original Budget Adjustments Final Budget
Actual Expenditure
(Over) / Under Final Budget
187 PALMETTO BEHAVIOR HEALTH - 7,025 7,025 7,025 - 410 MCNAIR BUILDING - 1,232 1,232 1,232 - 152 TECHNOLOGY & INFORMATION SYST 155,120 192 155,312 153,951 1,361 100 BOARD OF TRUSTEES 84,632 - 84,632 83,185 1,447 117 OFFICE OF GENERAL COUNSEL 243,060 - 243,060 241,477 1,583 182 VIDEO SERVICES 165,720 - 165,720 161,677 4,043 160 HVAC SHOP 1,558,016 (210,392) 1,347,624 1,341,799 5,825 202 MT PLEASANT ACADEMY 3,380,963 (11,832) 3,369,131 3,362,338 6,793 309 MURRAY-LASAINE ELEMENTARY 2,190,146 104,319 2,294,465 2,287,344 7,121 342 JAMES ISLAND MIDDLE 2,227,964 (17,793) 2,210,171 2,199,860 10,311 196 ADMIN BLDG (75 CALHOUN ST.) 43,715 - 43,715 33,153 10,562 258 WANDO COMMUNITY SCHOOL 274,234 17,998 292,232 280,454 11,778 463 DANIEL JENKINS ACADEMY 1,798,355 185,844 1,984,199 1,971,855 12,344 122 ENGLISH AS A SECOND LANGUAGE 116,644 65,522 182,166 169,133 13,033 268 WINDWOOD FARMS PROGRAM 13,885 34,623 48,508 35,371 13,137 173 CHIEF INFORMATION OFFICE 166,777 - 166,777 153,509 13,268 106 ACCOUNTING OFFICE 638,040 3,775 641,815 625,489 16,326 144 PROCUREMENT SERVICES 375,243 12,304 387,547 368,419 19,128 411 CHILD & FAMILY DEVELOPMENT CTR 737,203 93,156 830,359 810,747 19,612 132 COMMUNITY OUTREACH 526,864 4,505 531,369 511,649 19,720 161 ENERGY SERVICES 191,192 (51,717) 139,475 119,171 20,304 343 FORT JOHNSON MIDDLE 2,776,414 51,588 2,828,002 2,807,467 20,535 141 INTERNAL AUDIT 367,450 - 367,450 346,528 20,922 808 C C BLANEY ELEMENTARY 1,956,505 258,623 2,215,128 2,193,131 21,997 455 STALL COMMUNITY ED 166,294 59,810 226,104 204,058 22,046 108 EMPLOYEE RELATIONS 364,658 21,055 385,713 362,387 23,326 120 FEDERAL PROGRAMS OFFICE 700,764 370,913 1,071,677 1,047,770 23,907 128 PROFESSIONAL DEVELOPMENT 1,493,575 (1,124,739) 368,836 344,243 24,593 612 MONTESSORI COMMUNITY SCHL CHAS 1,497,483 20,451 1,517,934 1,492,367 25,567 453 GARRETT COMMUNITY ED 108,276 11,822 120,098 94,440 25,658 811 MINNIE HUGHES ELEMENTARY 1,474,870 191,151 1,666,021 1,637,706 28,315 207 JENNIE MOORE ELEMENTARY 4,234,044 74,898 4,308,942 4,280,625 28,317 111 MAINTENANCE DEPARTMENT 605,238 45,168 650,406 621,638 28,768 204 SULLIVAN'S ISLAND ELEMENTARY 2,714,525 31,183 2,745,708 2,715,468 30,240 101 SUPERINTENDENT'S OFFICE 453,367 29,688 483,055 452,005 31,050 171 CONTRACTS/PROCUREMENT SRVS 275,349 29,471 304,820 270,435 34,385 944 HAUT GAP MIDDLE 2,903,268 307,260 3,210,528 3,174,974 35,554 416 PINEHURST ELEMENTARY 2,864,590 133,171 2,997,761 2,959,424 38,337 135 CAREER & TECHNOLOGY EDUCATION 65,536 84,349 149,885 110,474 39,411 422 MATILDA F DUNSTON ELEMENTARY 2,615,910 93,651 2,709,561 2,669,901 39,660 359 SEPTIMA P CLARK ACADEMY 1,431,894 39,339 1,471,233 1,431,344 39,889 784 CHILD FIND 333,109 (44,039) 289,070 245,763 43,307 600 DISTRICT 10 CONSTITUENT OFFICE 35,128 9,417 44,545 773 43,772 121 FINE ARTS OFFICE 331,724 (21,860) 309,864 265,300 44,564 465 SUMMIT PROGRAM 382,180 (3,146) 379,034 333,162 45,872 554 LINCOLN HIGH 2,283,710 243,898 2,527,608 2,481,688 45,920 210 GOV JAMES B EDWARDS ELEMENTARY 3,618,925 293,300 3,912,225 3,865,711 46,514 125 CURRICULUM & INSTRUCTION 349,593 339,267 688,860 640,355 48,505 906 MT ZION ELEMENTARY 1,840,536 258,394 2,098,930 2,048,302 50,628 743 LOW COUNTRY TECH 341,327 (12,000) 329,327 276,843 52,484 605 STONO PARK ELEMENTARY 2,414,613 141,121 2,555,734 2,503,068 52,666 193 GENERAL SERVICES 335,214 126,214 461,428 407,988 53,440 136 PUPIL ACCOUNTING OFFICE 379,893 - 379,893 326,362 53,531 305 STILES POINT ELEMENTARY 4,111,531 191,905 4,303,436 4,243,290 60,146 143 SCIENCE OFFICE 144,231 16,704 160,935 99,672 61,263 809 JANE EDWARDS ELEMENTARY 1,145,383 133,414 1,278,797 1,212,846 65,951 443 MORNINGSIDE BOYS ACADEMY 263,135 (37,669) 225,466 156,564 68,902 351 JAMES IS HI COMMUNITY SCHOOL 222,578 18,486 241,064 170,567 70,497 714 SANDERS-CLYDE ELEMENTARY 3,811,860 578,311 4,390,171 4,310,669 79,502 310 JAMES ISLAND ELEMENTARY 3,098,238 133,575 3,231,813 3,148,210 83,603
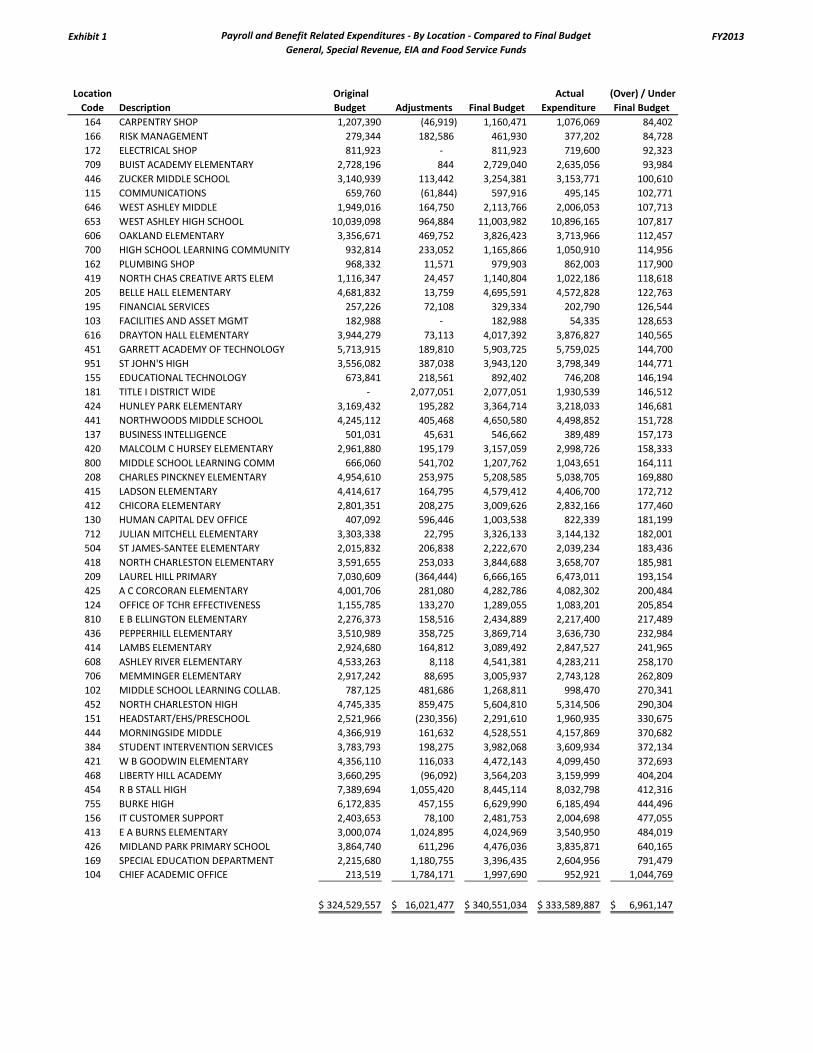
Exhibit 1 Payroll and Benefit Related Expenditures - By Location - Compared to Final BudgetGeneral, Special Revenue, EIA and Food Service Funds
FY2013
Location Code Description
Original Budget Adjustments Final Budget
Actual Expenditure
(Over) / Under Final Budget
164 CARPENTRY SHOP 1,207,390 (46,919) 1,160,471 1,076,069 84,402 166 RISK MANAGEMENT 279,344 182,586 461,930 377,202 84,728 172 ELECTRICAL SHOP 811,923 - 811,923 719,600 92,323 709 BUIST ACADEMY ELEMENTARY 2,728,196 844 2,729,040 2,635,056 93,984 446 ZUCKER MIDDLE SCHOOL 3,140,939 113,442 3,254,381 3,153,771 100,610 115 COMMUNICATIONS 659,760 (61,844) 597,916 495,145 102,771 646 WEST ASHLEY MIDDLE 1,949,016 164,750 2,113,766 2,006,053 107,713 653 WEST ASHLEY HIGH SCHOOL 10,039,098 964,884 11,003,982 10,896,165 107,817 606 OAKLAND ELEMENTARY 3,356,671 469,752 3,826,423 3,713,966 112,457 700 HIGH SCHOOL LEARNING COMMUNITY 932,814 233,052 1,165,866 1,050,910 114,956 162 PLUMBING SHOP 968,332 11,571 979,903 862,003 117,900 419 NORTH CHAS CREATIVE ARTS ELEM 1,116,347 24,457 1,140,804 1,022,186 118,618 205 BELLE HALL ELEMENTARY 4,681,832 13,759 4,695,591 4,572,828 122,763 195 FINANCIAL SERVICES 257,226 72,108 329,334 202,790 126,544 103 FACILITIES AND ASSET MGMT 182,988 - 182,988 54,335 128,653 616 DRAYTON HALL ELEMENTARY 3,944,279 73,113 4,017,392 3,876,827 140,565 451 GARRETT ACADEMY OF TECHNOLOGY 5,713,915 189,810 5,903,725 5,759,025 144,700 951 ST JOHN'S HIGH 3,556,082 387,038 3,943,120 3,798,349 144,771 155 EDUCATIONAL TECHNOLOGY 673,841 218,561 892,402 746,208 146,194 181 TITLE I DISTRICT WIDE - 2,077,051 2,077,051 1,930,539 146,512 424 HUNLEY PARK ELEMENTARY 3,169,432 195,282 3,364,714 3,218,033 146,681 441 NORTHWOODS MIDDLE SCHOOL 4,245,112 405,468 4,650,580 4,498,852 151,728 137 BUSINESS INTELLIGENCE 501,031 45,631 546,662 389,489 157,173 420 MALCOLM C HURSEY ELEMENTARY 2,961,880 195,179 3,157,059 2,998,726 158,333 800 MIDDLE SCHOOL LEARNING COMM 666,060 541,702 1,207,762 1,043,651 164,111 208 CHARLES PINCKNEY ELEMENTARY 4,954,610 253,975 5,208,585 5,038,705 169,880 415 LADSON ELEMENTARY 4,414,617 164,795 4,579,412 4,406,700 172,712 412 CHICORA ELEMENTARY 2,801,351 208,275 3,009,626 2,832,166 177,460 130 HUMAN CAPITAL DEV OFFICE 407,092 596,446 1,003,538 822,339 181,199 712 JULIAN MITCHELL ELEMENTARY 3,303,338 22,795 3,326,133 3,144,132 182,001 504 ST JAMES-SANTEE ELEMENTARY 2,015,832 206,838 2,222,670 2,039,234 183,436 418 NORTH CHARLESTON ELEMENTARY 3,591,655 253,033 3,844,688 3,658,707 185,981 209 LAUREL HILL PRIMARY 7,030,609 (364,444) 6,666,165 6,473,011 193,154 425 A C CORCORAN ELEMENTARY 4,001,706 281,080 4,282,786 4,082,302 200,484 124 OFFICE OF TCHR EFFECTIVENESS 1,155,785 133,270 1,289,055 1,083,201 205,854 810 E B ELLINGTON ELEMENTARY 2,276,373 158,516 2,434,889 2,217,400 217,489 436 PEPPERHILL ELEMENTARY 3,510,989 358,725 3,869,714 3,636,730 232,984 414 LAMBS ELEMENTARY 2,924,680 164,812 3,089,492 2,847,527 241,965 608 ASHLEY RIVER ELEMENTARY 4,533,263 8,118 4,541,381 4,283,211 258,170 706 MEMMINGER ELEMENTARY 2,917,242 88,695 3,005,937 2,743,128 262,809 102 MIDDLE SCHOOL LEARNING COLLAB. 787,125 481,686 1,268,811 998,470 270,341 452 NORTH CHARLESTON HIGH 4,745,335 859,475 5,604,810 5,314,506 290,304 151 HEADSTART/EHS/PRESCHOOL 2,521,966 (230,356) 2,291,610 1,960,935 330,675 444 MORNINGSIDE MIDDLE 4,366,919 161,632 4,528,551 4,157,869 370,682 384 STUDENT INTERVENTION SERVICES 3,783,793 198,275 3,982,068 3,609,934 372,134 421 W B GOODWIN ELEMENTARY 4,356,110 116,033 4,472,143 4,099,450 372,693 468 LIBERTY HILL ACADEMY 3,660,295 (96,092) 3,564,203 3,159,999 404,204 454 R B STALL HIGH 7,389,694 1,055,420 8,445,114 8,032,798 412,316 755 BURKE HIGH 6,172,835 457,155 6,629,990 6,185,494 444,496 156 IT CUSTOMER SUPPORT 2,403,653 78,100 2,481,753 2,004,698 477,055 413 E A BURNS ELEMENTARY 3,000,074 1,024,895 4,024,969 3,540,950 484,019 426 MIDLAND PARK PRIMARY SCHOOL 3,864,740 611,296 4,476,036 3,835,871 640,165 169 SPECIAL EDUCATION DEPARTMENT 2,215,680 1,180,755 3,396,435 2,604,956 791,479 104 CHIEF ACADEMIC OFFICE 213,519 1,784,171 1,997,690 952,921 1,044,769
324,529,557$ 16,021,477$ 340,551,034$ 333,589,887$ 6,961,147$
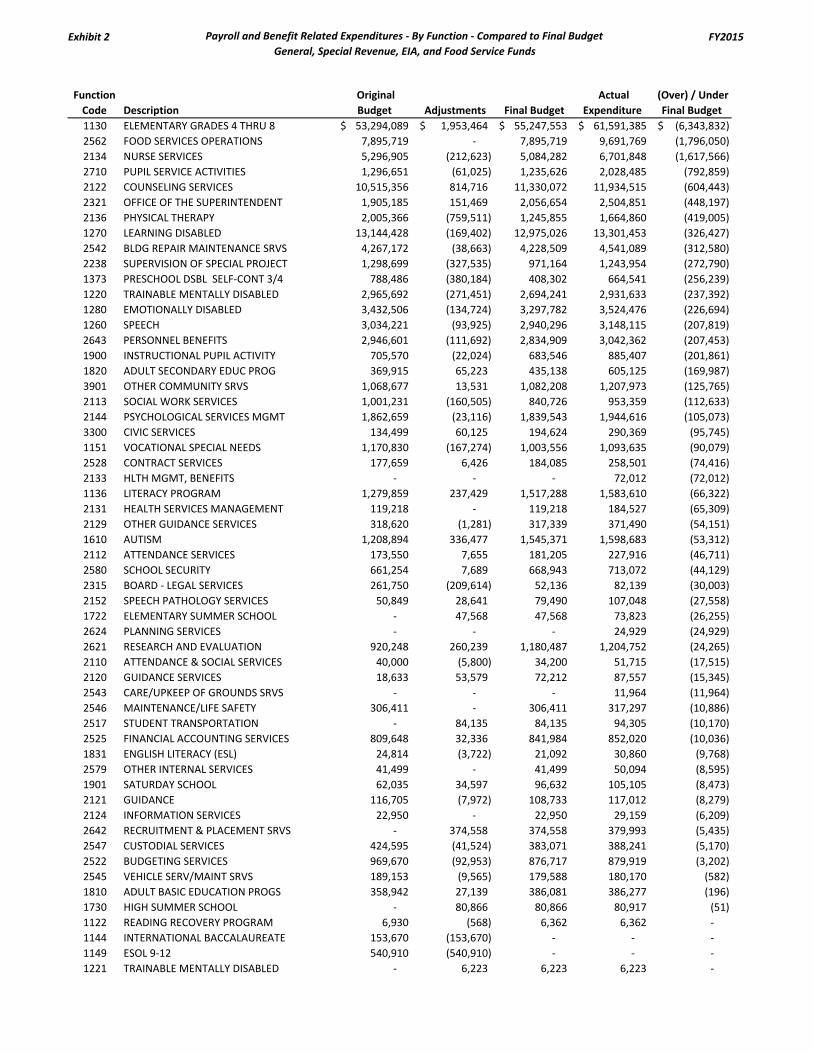
Exhibit 2 Payroll and Benefit Related Expenditures - By Function - Compared to Final BudgetGeneral, Special Revenue, EIA, and Food Service Funds
FY2015
Function Code Description
Original Budget Adjustments Final Budget
Actual Expenditure
(Over) / Under Final Budget
1130 ELEMENTARY GRADES 4 THRU 8 53,294,089$ 1,953,464$ 55,247,553$ 61,591,385$ (6,343,832)$ 2562 FOOD SERVICES OPERATIONS 7,895,719 - 7,895,719 9,691,769 (1,796,050) 2134 NURSE SERVICES 5,296,905 (212,623) 5,084,282 6,701,848 (1,617,566) 2710 PUPIL SERVICE ACTIVITIES 1,296,651 (61,025) 1,235,626 2,028,485 (792,859) 2122 COUNSELING SERVICES 10,515,356 814,716 11,330,072 11,934,515 (604,443) 2321 OFFICE OF THE SUPERINTENDENT 1,905,185 151,469 2,056,654 2,504,851 (448,197) 2136 PHYSICAL THERAPY 2,005,366 (759,511) 1,245,855 1,664,860 (419,005) 1270 LEARNING DISABLED 13,144,428 (169,402) 12,975,026 13,301,453 (326,427) 2542 BLDG REPAIR MAINTENANCE SRVS 4,267,172 (38,663) 4,228,509 4,541,089 (312,580) 2238 SUPERVISION OF SPECIAL PROJECT 1,298,699 (327,535) 971,164 1,243,954 (272,790) 1373 PRESCHOOL DSBL SELF-CONT 3/4 788,486 (380,184) 408,302 664,541 (256,239) 1220 TRAINABLE MENTALLY DISABLED 2,965,692 (271,451) 2,694,241 2,931,633 (237,392) 1280 EMOTIONALLY DISABLED 3,432,506 (134,724) 3,297,782 3,524,476 (226,694) 1260 SPEECH 3,034,221 (93,925) 2,940,296 3,148,115 (207,819) 2643 PERSONNEL BENEFITS 2,946,601 (111,692) 2,834,909 3,042,362 (207,453) 1900 INSTRUCTIONAL PUPIL ACTIVITY 705,570 (22,024) 683,546 885,407 (201,861) 1820 ADULT SECONDARY EDUC PROG 369,915 65,223 435,138 605,125 (169,987) 3901 OTHER COMMUNITY SRVS 1,068,677 13,531 1,082,208 1,207,973 (125,765) 2113 SOCIAL WORK SERVICES 1,001,231 (160,505) 840,726 953,359 (112,633) 2144 PSYCHOLOGICAL SERVICES MGMT 1,862,659 (23,116) 1,839,543 1,944,616 (105,073) 3300 CIVIC SERVICES 134,499 60,125 194,624 290,369 (95,745) 1151 VOCATIONAL SPECIAL NEEDS 1,170,830 (167,274) 1,003,556 1,093,635 (90,079) 2528 CONTRACT SERVICES 177,659 6,426 184,085 258,501 (74,416) 2133 HLTH MGMT, BENEFITS - - - 72,012 (72,012) 1136 LITERACY PROGRAM 1,279,859 237,429 1,517,288 1,583,610 (66,322) 2131 HEALTH SERVICES MANAGEMENT 119,218 - 119,218 184,527 (65,309) 2129 OTHER GUIDANCE SERVICES 318,620 (1,281) 317,339 371,490 (54,151) 1610 AUTISM 1,208,894 336,477 1,545,371 1,598,683 (53,312) 2112 ATTENDANCE SERVICES 173,550 7,655 181,205 227,916 (46,711) 2580 SCHOOL SECURITY 661,254 7,689 668,943 713,072 (44,129) 2315 BOARD - LEGAL SERVICES 261,750 (209,614) 52,136 82,139 (30,003) 2152 SPEECH PATHOLOGY SERVICES 50,849 28,641 79,490 107,048 (27,558) 1722 ELEMENTARY SUMMER SCHOOL - 47,568 47,568 73,823 (26,255) 2624 PLANNING SERVICES - - - 24,929 (24,929) 2621 RESEARCH AND EVALUATION 920,248 260,239 1,180,487 1,204,752 (24,265) 2110 ATTENDANCE & SOCIAL SERVICES 40,000 (5,800) 34,200 51,715 (17,515) 2120 GUIDANCE SERVICES 18,633 53,579 72,212 87,557 (15,345) 2543 CARE/UPKEEP OF GROUNDS SRVS - - - 11,964 (11,964) 2546 MAINTENANCE/LIFE SAFETY 306,411 - 306,411 317,297 (10,886) 2517 STUDENT TRANSPORTATION - 84,135 84,135 94,305 (10,170) 2525 FINANCIAL ACCOUNTING SERVICES 809,648 32,336 841,984 852,020 (10,036) 1831 ENGLISH LITERACY (ESL) 24,814 (3,722) 21,092 30,860 (9,768) 2579 OTHER INTERNAL SERVICES 41,499 - 41,499 50,094 (8,595) 1901 SATURDAY SCHOOL 62,035 34,597 96,632 105,105 (8,473) 2121 GUIDANCE 116,705 (7,972) 108,733 117,012 (8,279) 2124 INFORMATION SERVICES 22,950 - 22,950 29,159 (6,209) 2642 RECRUITMENT & PLACEMENT SRVS - 374,558 374,558 379,993 (5,435) 2547 CUSTODIAL SERVICES 424,595 (41,524) 383,071 388,241 (5,170) 2522 BUDGETING SERVICES 969,670 (92,953) 876,717 879,919 (3,202) 2545 VEHICLE SERV/MAINT SRVS 189,153 (9,565) 179,588 180,170 (582) 1810 ADULT BASIC EDUCATION PROGS 358,942 27,139 386,081 386,277 (196) 1730 HIGH SUMMER SCHOOL - 80,866 80,866 80,917 (51) 1122 READING RECOVERY PROGRAM 6,930 (568) 6,362 6,362 - 1144 INTERNATIONAL BACCALAUREATE 153,670 (153,670) - - - 1149 ESOL 9-12 540,910 (540,910) - - - 1221 TRAINABLE MENTALLY DISABLED - 6,223 6,223 6,223 -

Exhibit 2 Payroll and Benefit Related Expenditures - By Function - Compared to Final BudgetGeneral, Special Revenue, EIA, and Food Service Funds
FY2015
Function Code Description
Original Budget Adjustments Final Budget
Actual Expenditure
(Over) / Under Final Budget
1281 EMOTIONALLY DISABLED - 146 146 146 - 1325 PRESCHOOL DS ITINERANT 5YR 84,125 (1,123) 83,002 83,002 - 1751 INST BEYOND SCHOOL DAY 7,753 (1,106) 6,647 6,647 - 1811 ADULT BASIC EDUCATION PROGS 3,529 (1,398) 2,131 2,131 - 1832 ENGLISH LITERACY (ESL) (SRF) 13,607 (7,786) 5,821 5,821 - 2130 HEALTH SERVICES - 84,860 84,860 84,860 - 2132 MEDICAL SERVICES 139,671 (62,878) 76,793 76,793 - 2143 PSYCHOLOGICAL COUNSELING SERV - 38,315 38,315 38,315 - 2224 SCHOOL MEDIA CENTER SERVICES 9,317 17 9,334 9,333 1 2513 STUDENT TRANSPORTATION - 73,313 73,313 73,313 - 2553 VEHICLE OPERATION SRV -W/O BEN - 66,414 66,414 66,414 - 2610 HEAD OF COMPONENT UNIT - 1,036,886 1,036,886 1,036,886 - 4310 INDIRECT COSTS 26,321 (26,321) - - - 1139 ESOL K-8 3,251,707 (3,250,324) 1,383 1,370 13 1411 GIFTED AND TALENTED EIA 6,211 12,917 19,128 19,089 39 2629 OTHER PLANNING RESEARCH DEVELP 83,390 (2,384) 81,006 80,788 218 1111 KINDERGARTEN - 63,006 63,006 62,458 548 2552 STUDENT TRANSPORTATION 280,417 948 281,365 280,218 1,147 1734 SUMMER SCHOOL HIGH SCHOOL - 14,722 14,722 13,109 1,613 1134 ELEMENTARY - 14,934 14,934 12,284 2,650 1712 PRIMARY SUMMER SCHOOL - 197,855 197,855 195,173 2,682 2649 OTHER STAFF SERVICES 592,599 12,122 604,721 601,677 3,044 2212 INSTRUCTION/CURRICULUM DEV SRV 4,074,771 442,150 4,516,921 4,513,085 3,836 2244 IMP INST SRVS-INSRV/STAFF TRN 69,475 7,554 77,029 68,875 8,154 2590 INTERNAL AUDITING SERVICES 519,116 (135,605) 383,511 374,256 9,255 2230 SUPERVISION OF SPECIAL PROJECT 3,565,451 137,695 3,703,146 3,693,694 9,452 1180 MONTESSORI PRIMARY 1,685,808 151,944 1,837,752 1,827,386 10,366 1740 GIFTED & TALENTED SUMMER SCHL - 320,953 320,953 309,403 11,550 2245 IMP INST SRVS-INSRV/STAFF TRN - 84,678 84,678 72,256 12,422 1240 VISUALLY DISABLED 287,049 (70,906) 216,143 203,087 13,056 2213 IMP OF INSTRUCTION/SPEC PROG 582,586 45,636 628,222 614,601 13,621 2623 EVALUATION SERVICES 216,777 - 216,777 203,121 13,656 1156 VOCATIONAL SPECIAL NEEDS 212,748 34,873 247,621 232,936 14,685 2126 PLACEMENT SERVICES - 41,926 41,926 26,048 15,878 1181 MONTESSORI LOWER EL 1,451,794 (142,528) 1,309,266 1,292,993 16,273 1135 ELEMENTARY - 98,805 98,805 80,347 18,458 2572 PURCHASING SERVICES 458,250 - 458,250 438,070 20,180 1250 HEARING DISABLED 993,404 18,488 1,011,892 991,312 20,580 1731 HIGH SUMMER SCHOOL - 34,532 34,532 13,188 21,344 2330 SUPPORT SERVICES-SCH ADMIN - 23,991 23,991 - 23,991 2541 OPERATION & MAINT OF PLANT 1,417,314 9,751 1,427,065 1,399,695 27,370 2622 DEVELOPMENT SERVICES 30,666 - 30,666 1,162 29,504 2544 CARE/UPKEEP OF EQUIP SRVS 624,117 6,936 631,053 601,356 29,697 2142 PSYCHOLOGICAL TESTING SERVICES 1,064,024 66,350 1,130,374 1,095,479 34,895 2631 INFORMATION SERVICES 582,360 50,973 633,333 597,891 35,442 1710 PRIMARY SUMMER SCHOOL - 270,353 270,353 233,123 37,230 1720 ELEMENTARY SUMMER SCHOOL - 71,976 71,976 30,360 41,616 2215 IMPROVEMENT OF INSTRUCTION 574,671 37,761 612,432 569,798 42,634 1230 ORTHOPEDICALLY DISABLED 284,337 (34,695) 249,642 205,407 44,235 1183 MONTESSORI MST 336,089 16,138 352,227 305,826 46,401 2573 WAREHOUSING & DISTRIBUTING SRV 503,059 - 503,059 455,328 47,731 1182 MONTESSORI UPPER EL 1,037,308 9,333 1,046,641 996,538 50,103 1320 PRESCHOOL ITINERANT 5YR 2,199,201 2,992 2,202,193 2,141,771 60,422 2523 ACCOUNTING SERVICES 669,823 (24,133) 645,690 574,003 71,687 1410 GIFTED & TALENTED - ACADEMIC 3,191,518 23,712 3,215,230 3,131,509 83,721 1215 SPECIAL EDUCATION ASSISTANT 4,068,230 (159,829) 3,908,401 3,817,376 91,025

Exhibit 2 Payroll and Benefit Related Expenditures - By Function - Compared to Final BudgetGeneral, Special Revenue, EIA, and Food Service Funds
FY2015
Function Code Description
Original Budget Adjustments Final Budget
Actual Expenditure
(Over) / Under Final Budget
2111 PUPIL ACCOUNTING 838,768 19,236 858,004 766,427 91,577 1480 GIFTED & TALENTED - ARTISTIC 88,495 117,462 205,957 113,977 91,980 1390 EARLY CHILDHOOD PROGRAM 12,687,126 (142,680) 12,544,446 12,446,977 97,469 3500 CUSTODY & CARE OF CHILDREN SRV 6,322,306 265,149 6,587,455 6,482,405 105,050 1732 SUMMER SCHOOL 46,258 240,794 287,052 177,497 109,555 2524 PAYROLL SERVICES 626,374 4,950 631,324 521,691 109,633 1617 AUTISM 740,665 (138,344) 602,321 489,060 113,261 1750 INSTR PROG BEYOND SCHL DAY 145,935 1,627,584 1,773,519 1,655,579 117,940 1450 HOMEBOUND 709,091 - 709,091 590,194 118,897 2210 IMPROVEMENT INSTR/CURR DVLP 3,941,536 264,672 4,206,208 4,075,220 130,988 2571 INTERNAL SERVICES 293,035 - 293,035 146,406 146,629 1880 PARENTING/FAMILY LITERACY 1,163,425 1,346,819 2,510,244 2,356,498 153,746 2214 IMPROVEMENT OF INSTRUCTION 2,122,539 2,412,842 4,535,381 4,359,663 175,718 2319 OTHER BOARD OF EDUCATION SRVS 1,555,894 (1,052) 1,554,842 1,377,206 177,636 2231 SUPERVISION OF SPECIAL PROJECT 1,762,974 (1,426,977) 335,997 136,417 199,580 1210 EDUCABLE MENTALLY DISABLED 3,320,678 (634,796) 2,685,882 2,439,478 246,404 2222 SCHOOL MEDIA CENTER SERVICES 5,583,626 98,893 5,682,519 5,426,659 255,860 2211 IMPROVEMENT INST/CURR DVLP - 326,613 326,613 51,492 275,121 2561 FOOD SERVICES MANAGEMENT 3,130,599 (1,659,291) 1,471,308 1,180,350 290,958 2667 TECHNOLOGY INFRASTRUCTURE 1,990,613 206,343 2,196,956 1,881,971 314,985 1110 KINDERGARTEN 16,847,991 207,951 17,055,942 16,704,213 351,729 1126 LITERACY & MATH ACADEMIES 7,989,838 (165,771) 7,824,067 7,312,618 511,449 1629 ESOL - 3,839,903 3,839,903 3,327,868 512,035 1150 VOCATIONAL 9,480,434 (205,182) 9,275,252 8,692,924 582,328 2661 TECH/DP ADMINISTRATION 1,771,549 (193,406) 1,578,143 977,184 600,959 2331 OFFICE OF THE PRINCIPAL 29,962,643 1,345,927 31,308,570 30,697,515 611,055 1120 PRIMARY GRADES 1 & 2 36,118,333 727,212 36,845,545 36,049,311 796,234 1140 HIGH SCHOOL GRADES 9 TO 12 38,973,355 (153,333) 38,820,022 38,010,940 809,082 2240 IMP INST SRVS-INSRV/STAFF TRN 5,010,313 481,062 5,491,375 4,151,695 1,339,680
358,081,909$ 9,200,371$ 367,282,280$ 372,514,054$ (5,231,774)$

Exhibit 2 Payroll and Benefit Related Expenditures - By Function - Compared to Final BudgetGeneral, Special Revenue, EIA, and Food Service Funds
FY2014
Function Code Description
Original Budget Adjustments Final Budget
Actual Expenditure
(Over) / Under Final Budget
1130 ELEMENTARY GRADES 4 THRU 8 54,187,387$ 4,442,037$ 58,629,424$ 61,322,836$ (2,693,412)$ 2562 FOOD SERVICES OPERATIONS 7,634,479 250 7,634,729 9,139,621 (1,504,892) 2331 OFFICE OF THE PRINCIPAL 25,122,620 1,346,864 26,469,484 27,821,828 (1,352,344) 1120 PRIMARY GRADES 1 & 2 36,784,539 (1,390,637) 35,393,902 36,028,812 (634,910) 2710 PUPIL SERVICE ACTIVITIES 1,324,294 2,026 1,326,320 1,850,148 (523,828) 2319 OTHER BOARD OF EDUCATION SRVS 1,641,683 1,550 1,643,233 2,063,829 (420,596) 1410 GIFTED & TALENTED - ACADEMIC 2,424,967 148,580 2,573,547 2,980,120 (406,573) 2214 IMPROVEMENT OF INSTRUCTION 1,260,606 1,153,573 2,414,179 2,632,532 (218,353) 3300 CIVIC SERVICES 47,344 - 47,344 191,141 (143,797) 1900 INSTRUCTIONAL PUPIL ACTIVITY 701,196 4,317 705,513 844,623 (139,110) 2222 SCHOOL MEDIA CENTER SERVICES 4,887,469 141,343 5,028,812 5,166,256 (137,444) 2122 COUNSELING SERVICES 8,857,107 2,586,502 11,443,609 11,554,602 (110,993) 2134 NURSE SERVICES 4,853,366 376,243 5,229,609 5,327,120 (97,511) 2321 OFFICE OF THE SUPERINTENDENT 1,843,858 279,899 2,123,757 2,220,620 (96,863) 1810 ADULT BASIC EDUCATION PROGS 363,318 16,227 379,545 453,643 (74,098) 2643 PERSONNEL BENEFITS 2,554,063 115,882 2,669,945 2,725,262 (55,317) 2133 HLTH MGMT, BENEFITS - - - 54,762 (54,762) 1149 ESOL 9-12 142,627 156,806 299,433 352,108 (52,675) 1180 MONTESSORI PRIMARY 1,717,220 (80,521) 1,636,699 1,678,725 (42,026) 2144 PSYCHOLOGICAL SERVICES MGMT 1,869,670 (72,194) 1,797,476 1,828,497 (31,021) 2524 PAYROLL SERVICES 521,677 89,571 611,248 629,062 (17,814) 2649 OTHER STAFF SERVICES 526,359 (35,610) 490,749 508,305 (17,556) 1820 ADULT SECONDARY EDUC PROG 472,223 (12,237) 459,986 477,529 (17,543) 1832 ENGLISH LITERACY (ESL) (SRF) 13,607 (5,738) 7,869 16,549 (8,680) 1144 INTERNATIONAL BACCALAUREATE 62,580 49,381 111,961 120,603 (8,642) 2552 STUDENT TRANSPORTATION 267,135 9,700 276,835 284,357 (7,522) 2621 RESEARCH AND EVALUATION 694,496 238,879 933,375 939,563 (6,188) 2543 CARE/UPKEEP OF GROUNDS SRVS - 17,460 17,460 21,663 (4,203) 2641 HR ADMIN 45,814 (45,814) - 1,847 (1,847) 2110 ATTENDANCE & SOCIAL SERVICES - 73,245 73,245 75,054 (1,809) 1182 MONTESSORI UPPER EL 640,286 (1,500) 638,786 639,298 (512) 2629 OTHER PLANNING RESEARCH DEVELP 97,775 (17,910) 79,865 80,369 (504) 1141 FINE ARTS ACCOUNTS - - - 408 (408) 2546 MAINTENANCE/LIFE SAFETY 295,012 - 295,012 295,246 (234) 2241 IMP INST SRVS/INSRV/STAFF TRN - 1,478 1,478 1,501 (23) 1122 READING RECOVERY PROGRAM 18,203 (1,354) 16,849 16,849 - 1125 PRIMARY - 6,111 6,111 6,111 - 1260 SPEECH 3,661,798 (709,931) 2,951,867 2,951,867 - 1274 LEARNING DISABLED - 105,869 105,869 105,869 - 1291 COORD EARLY INTERVENE SERV 78,364 (78,364) - - - 1325 PRESCHOOL DS ITINERANT 5YR 75,450 43,932 119,382 119,383 (1) 1411 GIFTED AND TALENTED EIA 6,185 (940) 5,245 5,245 - 1811 ADULT BASIC EDUCATION PROGS 3,414 115 3,529 3,529 - 1831 ENGLISH LITERACY (ESL) 30,925 (6,111) 24,814 24,814 - 2113 SOCIAL WORK SERVICES 792,447 (86,343) 706,104 706,104 - 2120 GUIDANCE SERVICES 9,278 74,081 83,359 83,359 - 2127 COUNSELING SERV TITLE I - 21 21 21 - 2130 HEALTH SERVICES 67,211 (692) 66,519 66,519 - 2132 MEDICAL SERVICES 73,200 (5,447) 67,753 67,753 - 2137 HEALTH SERVICE MANAGEMENT 75,615 (73,964) 1,651 1,651 - 2140 PSYCHOLOGY SERVICES - 928 928 928 - 2152 SPEECH PATHOLOGY SERVICES 53,497 67,694 121,191 121,191 - 2215 IMPROVEMENT OF INSTRUCTION 498,312 5,544 503,856 503,856 - 2223 MEDIA SERVICES - 329 329 329 - 2224 SCHOOL MEDIA CENTER SERVICES 9,278 25 9,303 9,303 - 2235 LITERACY/TEACHER COACH 67,544 (67,544) - - -

Exhibit 2 Payroll and Benefit Related Expenditures - By Function - Compared to Final BudgetGeneral, Special Revenue, EIA, and Food Service Funds
FY2014
Function Code Description
Original Budget Adjustments Final Budget
Actual Expenditure
(Over) / Under Final Budget
2333 SUPPORT SRV SCH ADMIN - 105,817 105,817 105,817 - 2517 STUDENT TRANSPORTATION - 35,879 35,879 35,879 - 2551 PUPIL TRANSPORTATION - 149 149 149 - 1240 VISUALLY DISABLED 276,492 (8,973) 267,519 267,519 - 2129 OTHER GUIDANCE SERVICES 293,420 28,816 322,236 322,235 1 2124 INFORMATION SERVICES 22,395 709 23,104 23,021 83 1280 EMOTIONALLY DISABLED 3,798,524 (173,377) 3,625,147 3,625,026 121 1480 GIFTED & TALENTED - ARTISTIC 55,553 (12,000) 43,553 43,347 206 1230 ORTHOPEDICALLY DISABLED 284,887 (8,282) 276,605 276,211 394 1610 AUTISM 1,513,394 (367,850) 1,145,544 1,145,026 518 2579 OTHER INTERNAL SERVICES 49,932 - 49,932 49,219 713 2112 ATTENDANCE SERVICES 68,990 65,143 134,133 133,371 762 1111 KINDERGARTEN - 81,837 81,837 81,063 774 1250 HEARING DISABLED 950,566 (14,834) 935,732 934,429 1,303 2315 BOARD - LEGAL SERVICES 253,706 - 253,706 251,893 1,813 2580 SCHOOL SECURITY 553,077 78,783 631,860 629,685 2,175 2244 IMP INST SRVS-INSRV/STAFF TRN 46,548 23,442 69,990 67,035 2,955 1156 VOCATIONAL SPECIAL NEEDS 228,713 (92,339) 136,374 133,241 3,133 2213 IMP OF INSTRUCTION/SPEC PROG 132,528 (52,049) 80,479 77,214 3,265 2545 VEHICLE SERV/MAINT SRVS 183,009 - 183,009 178,612 4,397 2142 PSYCHOLOGICAL TESTING SERVICES 86,466 966,473 1,052,939 1,048,000 4,939 1139 ESOL K-8 2,615,508 (230,129) 2,385,379 2,378,380 6,999 2126 PLACEMENT SERVICES 202,078 (168,650) 33,428 24,925 8,503 1110 KINDERGARTEN 16,970,888 (587,310) 16,383,578 16,373,370 10,208 1320 PRESCHOOL ITINERANT 5YR 2,241,719 (174,657) 2,067,062 2,055,928 11,134 2135 NURSES SERVICES - 27,124 27,124 15,189 11,935 1722 ELEMENTARY SUMMER SCHOOL - 120,358 120,358 108,340 12,018 2245 IMP INST SRVS-INSRV/STAFF TRN 62,580 11,411 73,991 61,692 12,299 2131 HEALTH SERVICES MANAGEMENT 160,755 - 160,755 147,151 13,604 1901 SATURDAY SCHOOL 60,714 39,649 100,363 81,543 18,820 2121 GUIDANCE 48,351 93,716 142,067 122,980 19,087 1134 ELEMENTARY - 19,875 19,875 - 19,875 1710 PRIMARY SUMMER SCHOOL - 34,552 34,552 14,649 19,903 1133 ELEMENTARY EIA - 101,226 101,226 80,888 20,338 1881 PARENTING 57,436 (36,842) 20,594 - 20,594 1450 HOMEBOUND 828,901 (339,769) 489,132 465,502 23,630 2513 STUDENT TRANSPORTATION - 197,495 197,495 173,435 24,060 2571 INTERNAL SERVICES 137,181 - 137,181 111,946 25,235 2547 CUSTODIAL SERVICES 1,158,352 (71,093) 1,087,259 1,061,459 25,800 1731 HIGH SUMMER SCHOOL - 50,686 50,686 24,484 26,202 2590 INTERNAL AUDITING SERVICES 385,044 73,247 458,291 430,239 28,052 1220 TRAINABLE MENTALLY DISABLED 2,891,855 50,252 2,942,107 2,912,972 29,135 2542 BLDG REPAIR MAINTENANCE SRVS 4,445,884 5,830 4,451,714 4,418,107 33,607 1720 ELEMENTARY SUMMER SCHOOL - 37,785 37,785 3,870 33,915 1210 EDUCABLE MENTALLY DISABLED 3,082,986 (484,995) 2,597,991 2,557,138 40,853 2525 FINANCIAL ACCOUNTING SERVICES 748,719 12,682 761,401 720,246 41,155 2642 RECRUITMENT & PLACEMENT SRVS 449,240 (4,543) 444,697 401,727 42,970 1151 VOCATIONAL SPECIAL NEEDS 1,541,878 (315,571) 1,226,307 1,182,439 43,868 1373 PRESCHOOL DSBL SELF-CONT 3/4 686,389 37,344 723,733 679,481 44,252 1135 ELEMENTARY - 122,176 122,176 75,070 47,106 1181 MONTESSORI LOWER EL 1,283,634 (20,931) 1,262,703 1,214,544 48,159 1233 ORTHOPEDICALLY DISABLED 70,211 (19,413) 50,798 - 50,798 2139 OTHER HEALTH SERV 30,701 33,716 64,417 12,694 51,723 1390 EARLY CHILDHOOD PROGRAM 12,418,342 (578,087) 11,840,255 11,787,065 53,190 1183 MONTESSORI MST 205,890 17,931 223,821 169,593 54,228 1126 LITERACY & MATH ACADEMIES 6,955,882 80,748 7,036,630 6,980,609 56,021

Exhibit 2 Payroll and Benefit Related Expenditures - By Function - Compared to Final BudgetGeneral, Special Revenue, EIA, and Food Service Funds
FY2014
Function Code Description
Original Budget Adjustments Final Budget
Actual Expenditure
(Over) / Under Final Budget
2153 SPEECH/HEARING 74,909 (13,443) 61,466 - 61,466 1150 VOCATIONAL 8,890,055 (693,415) 8,196,640 8,134,844 61,796 2573 WAREHOUSING & DISTRIBUTING SRV 492,700 4,277 496,977 432,914 64,063 1732 SUMMER SCHOOL - 179,873 179,873 110,921 68,952 2622 DEVELOPMENT SERVICES - 136,914 136,914 66,120 70,794 1740 GIFTED & TALENTED SUMMER SCHL 130,200 19,707 149,907 76,941 72,966 2111 PUPIL ACCOUNTING 735,117 71,608 806,725 732,187 74,538 2523 ACCOUNTING SERVICES 660,261 (33,820) 626,441 543,046 83,395 2623 EVALUATION SERVICES 289,367 - 289,367 199,770 89,597 2541 OPERATION & MAINT OF PLANT 1,291,004 15,892 1,306,896 1,217,015 89,881 2667 TECHNOLOGY INFRASTRUCTURE 1,771,018 (121,147) 1,649,871 1,557,022 92,849 2544 CARE/UPKEEP OF EQUIP SRVS 683,627 6,109 689,736 582,635 107,101 2631 INFORMATION SERVICES 710,935 10,378 721,313 613,873 107,440 2136 PHYSICAL THERAPY 2,422,095 (780,982) 1,641,113 1,530,597 110,516 1215 SPECIAL EDUCATION ASSISTANT 3,673,793 23,342 3,697,135 3,579,995 117,140 2572 PURCHASING SERVICES 423,050 (36,985) 386,065 268,620 117,445 1730 HIGH SUMMER SCHOOL 169,617 50,435 220,052 101,695 118,357 2211 IMPROVEMENT INST/CURR DVLP 156,941 33,028 189,969 44,303 145,666 1617 AUTISM 602,575 359,856 962,431 810,862 151,569 2528 CONTRACT SERVICES 404,003 609 404,612 246,440 158,172 1712 PRIMARY SUMMER SCHOOL - 455,023 455,023 293,493 161,530 1136 LITERACY PROGRAM 1,361,315 238,174 1,599,489 1,436,512 162,977 2522 BUDGETING SERVICES 960,705 (77,766) 882,939 705,980 176,959 2212 INSTRUCTION/CURRICULUM DEV SRV 3,304,692 (49,626) 3,255,066 3,037,101 217,965 2661 TECH/DP ADMINISTRATION 1,076,408 80,038 1,156,446 917,751 238,695 1270 LEARNING DISABLED 13,102,894 95,415 13,198,309 12,957,056 241,253 2210 IMPROVEMENT INSTR/CURR DVLP 5,014,438 1,726,728 6,741,166 6,490,566 250,600 1140 HIGH SCHOOL GRADES 9 TO 12 38,089,031 (290,502) 37,798,529 37,539,830 258,699 3901 OTHER COMMUNITY SRVS 1,312,844 (10,900) 1,301,944 1,019,820 282,124 2230 SUPERVISION OF SPECIAL PROJECT 3,820,808 (35,297) 3,785,511 3,484,826 300,685 1880 PARENTING/FAMILY LITERACY 1,513,410 497,019 2,010,429 1,701,852 308,577 2231 SUPERVISION OF SPECIAL PROJECT 190,591 313,659 504,250 177,383 326,867 2238 SUPERVISION OF SPECIAL PROJECT 1,323,097 322,820 1,645,917 1,309,382 336,535 1750 INSTR PROG BEYOND SCHL DAY 88,077 1,011,828 1,099,905 723,464 376,441 3500 CUSTODY & CARE OF CHILDREN SRV 6,034,787 132,572 6,167,359 5,030,707 1,136,652 2561 FOOD SERVICES MANAGEMENT 2,826,506 - 2,826,506 976,923 1,849,583 2240 IMP INST SRVS-INSRV/STAFF TRN 2,256,823 3,336,639 5,593,462 2,901,815 2,691,647
341,772,509$ 14,634,828$ 356,407,337$ 352,953,028$ 3,454,309$
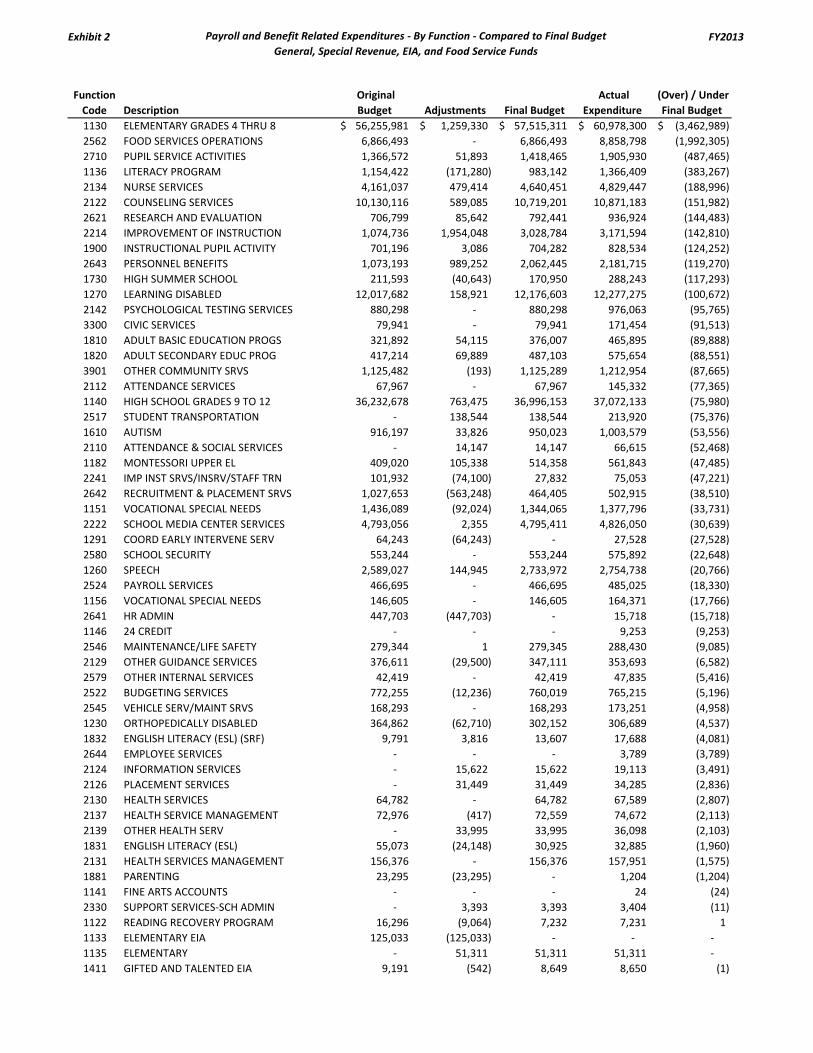
Exhibit 2 Payroll and Benefit Related Expenditures - By Function - Compared to Final BudgetGeneral, Special Revenue, EIA, and Food Service Funds
FY2013
Function Code Description
Original Budget Adjustments Final Budget
Actual Expenditure
(Over) / Under Final Budget
1130 ELEMENTARY GRADES 4 THRU 8 56,255,981$ 1,259,330$ 57,515,311$ 60,978,300$ (3,462,989)$ 2562 FOOD SERVICES OPERATIONS 6,866,493 - 6,866,493 8,858,798 (1,992,305) 2710 PUPIL SERVICE ACTIVITIES 1,366,572 51,893 1,418,465 1,905,930 (487,465) 1136 LITERACY PROGRAM 1,154,422 (171,280) 983,142 1,366,409 (383,267) 2134 NURSE SERVICES 4,161,037 479,414 4,640,451 4,829,447 (188,996) 2122 COUNSELING SERVICES 10,130,116 589,085 10,719,201 10,871,183 (151,982) 2621 RESEARCH AND EVALUATION 706,799 85,642 792,441 936,924 (144,483) 2214 IMPROVEMENT OF INSTRUCTION 1,074,736 1,954,048 3,028,784 3,171,594 (142,810) 1900 INSTRUCTIONAL PUPIL ACTIVITY 701,196 3,086 704,282 828,534 (124,252) 2643 PERSONNEL BENEFITS 1,073,193 989,252 2,062,445 2,181,715 (119,270) 1730 HIGH SUMMER SCHOOL 211,593 (40,643) 170,950 288,243 (117,293) 1270 LEARNING DISABLED 12,017,682 158,921 12,176,603 12,277,275 (100,672) 2142 PSYCHOLOGICAL TESTING SERVICES 880,298 - 880,298 976,063 (95,765) 3300 CIVIC SERVICES 79,941 - 79,941 171,454 (91,513) 1810 ADULT BASIC EDUCATION PROGS 321,892 54,115 376,007 465,895 (89,888) 1820 ADULT SECONDARY EDUC PROG 417,214 69,889 487,103 575,654 (88,551) 3901 OTHER COMMUNITY SRVS 1,125,482 (193) 1,125,289 1,212,954 (87,665) 2112 ATTENDANCE SERVICES 67,967 - 67,967 145,332 (77,365) 1140 HIGH SCHOOL GRADES 9 TO 12 36,232,678 763,475 36,996,153 37,072,133 (75,980) 2517 STUDENT TRANSPORTATION - 138,544 138,544 213,920 (75,376) 1610 AUTISM 916,197 33,826 950,023 1,003,579 (53,556) 2110 ATTENDANCE & SOCIAL SERVICES - 14,147 14,147 66,615 (52,468) 1182 MONTESSORI UPPER EL 409,020 105,338 514,358 561,843 (47,485) 2241 IMP INST SRVS/INSRV/STAFF TRN 101,932 (74,100) 27,832 75,053 (47,221) 2642 RECRUITMENT & PLACEMENT SRVS 1,027,653 (563,248) 464,405 502,915 (38,510) 1151 VOCATIONAL SPECIAL NEEDS 1,436,089 (92,024) 1,344,065 1,377,796 (33,731) 2222 SCHOOL MEDIA CENTER SERVICES 4,793,056 2,355 4,795,411 4,826,050 (30,639) 1291 COORD EARLY INTERVENE SERV 64,243 (64,243) - 27,528 (27,528) 2580 SCHOOL SECURITY 553,244 - 553,244 575,892 (22,648) 1260 SPEECH 2,589,027 144,945 2,733,972 2,754,738 (20,766) 2524 PAYROLL SERVICES 466,695 - 466,695 485,025 (18,330) 1156 VOCATIONAL SPECIAL NEEDS 146,605 - 146,605 164,371 (17,766) 2641 HR ADMIN 447,703 (447,703) - 15,718 (15,718) 1146 24 CREDIT - - - 9,253 (9,253) 2546 MAINTENANCE/LIFE SAFETY 279,344 1 279,345 288,430 (9,085) 2129 OTHER GUIDANCE SERVICES 376,611 (29,500) 347,111 353,693 (6,582) 2579 OTHER INTERNAL SERVICES 42,419 - 42,419 47,835 (5,416) 2522 BUDGETING SERVICES 772,255 (12,236) 760,019 765,215 (5,196) 2545 VEHICLE SERV/MAINT SRVS 168,293 - 168,293 173,251 (4,958) 1230 ORTHOPEDICALLY DISABLED 364,862 (62,710) 302,152 306,689 (4,537) 1832 ENGLISH LITERACY (ESL) (SRF) 9,791 3,816 13,607 17,688 (4,081) 2644 EMPLOYEE SERVICES - - - 3,789 (3,789) 2124 INFORMATION SERVICES - 15,622 15,622 19,113 (3,491) 2126 PLACEMENT SERVICES - 31,449 31,449 34,285 (2,836) 2130 HEALTH SERVICES 64,782 - 64,782 67,589 (2,807) 2137 HEALTH SERVICE MANAGEMENT 72,976 (417) 72,559 74,672 (2,113) 2139 OTHER HEALTH SERV - 33,995 33,995 36,098 (2,103) 1831 ENGLISH LITERACY (ESL) 55,073 (24,148) 30,925 32,885 (1,960) 2131 HEALTH SERVICES MANAGEMENT 156,376 - 156,376 157,951 (1,575) 1881 PARENTING 23,295 (23,295) - 1,204 (1,204) 1141 FINE ARTS ACCOUNTS - - - 24 (24) 2330 SUPPORT SERVICES-SCH ADMIN - 3,393 3,393 3,404 (11) 1122 READING RECOVERY PROGRAM 16,296 (9,064) 7,232 7,231 1 1133 ELEMENTARY EIA 125,033 (125,033) - - - 1135 ELEMENTARY - 51,311 51,311 51,311 - 1411 GIFTED AND TALENTED EIA 9,191 (542) 8,649 8,650 (1)
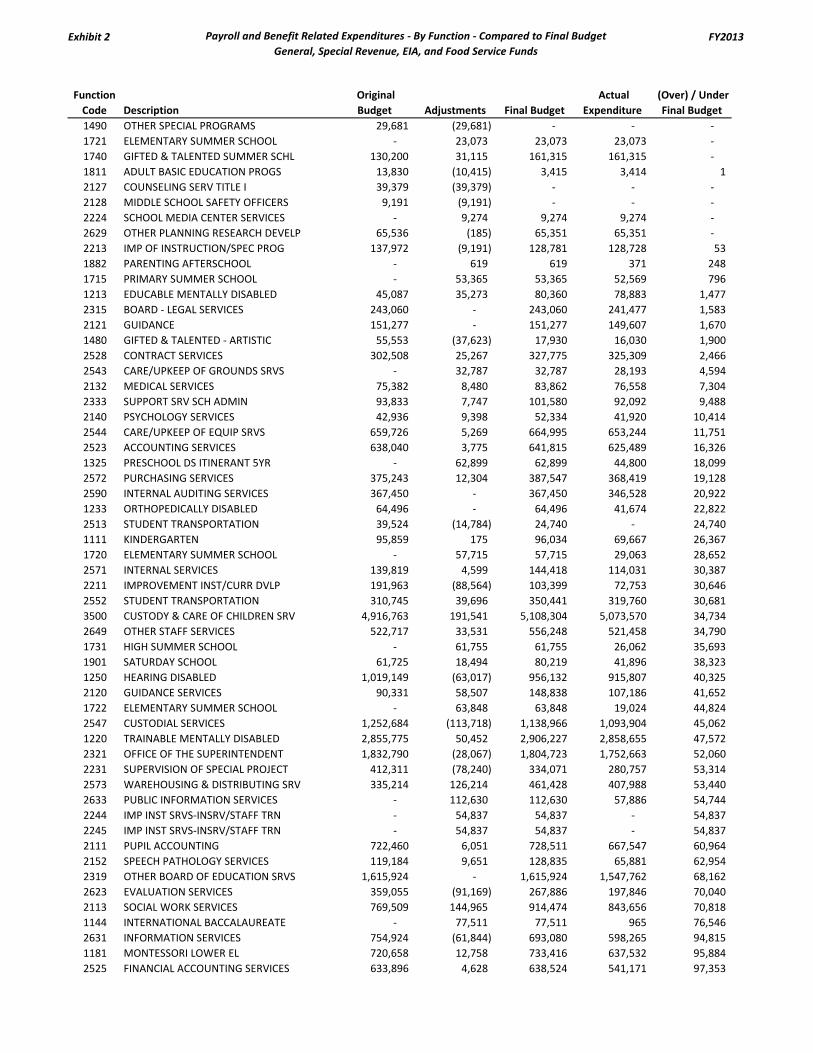
Exhibit 2 Payroll and Benefit Related Expenditures - By Function - Compared to Final BudgetGeneral, Special Revenue, EIA, and Food Service Funds
FY2013
Function Code Description
Original Budget Adjustments Final Budget
Actual Expenditure
(Over) / Under Final Budget
1490 OTHER SPECIAL PROGRAMS 29,681 (29,681) - - - 1721 ELEMENTARY SUMMER SCHOOL - 23,073 23,073 23,073 - 1740 GIFTED & TALENTED SUMMER SCHL 130,200 31,115 161,315 161,315 - 1811 ADULT BASIC EDUCATION PROGS 13,830 (10,415) 3,415 3,414 1 2127 COUNSELING SERV TITLE I 39,379 (39,379) - - - 2128 MIDDLE SCHOOL SAFETY OFFICERS 9,191 (9,191) - - - 2224 SCHOOL MEDIA CENTER SERVICES - 9,274 9,274 9,274 - 2629 OTHER PLANNING RESEARCH DEVELP 65,536 (185) 65,351 65,351 - 2213 IMP OF INSTRUCTION/SPEC PROG 137,972 (9,191) 128,781 128,728 53 1882 PARENTING AFTERSCHOOL - 619 619 371 248 1715 PRIMARY SUMMER SCHOOL - 53,365 53,365 52,569 796 1213 EDUCABLE MENTALLY DISABLED 45,087 35,273 80,360 78,883 1,477 2315 BOARD - LEGAL SERVICES 243,060 - 243,060 241,477 1,583 2121 GUIDANCE 151,277 - 151,277 149,607 1,670 1480 GIFTED & TALENTED - ARTISTIC 55,553 (37,623) 17,930 16,030 1,900 2528 CONTRACT SERVICES 302,508 25,267 327,775 325,309 2,466 2543 CARE/UPKEEP OF GROUNDS SRVS - 32,787 32,787 28,193 4,594 2132 MEDICAL SERVICES 75,382 8,480 83,862 76,558 7,304 2333 SUPPORT SRV SCH ADMIN 93,833 7,747 101,580 92,092 9,488 2140 PSYCHOLOGY SERVICES 42,936 9,398 52,334 41,920 10,414 2544 CARE/UPKEEP OF EQUIP SRVS 659,726 5,269 664,995 653,244 11,751 2523 ACCOUNTING SERVICES 638,040 3,775 641,815 625,489 16,326 1325 PRESCHOOL DS ITINERANT 5YR - 62,899 62,899 44,800 18,099 2572 PURCHASING SERVICES 375,243 12,304 387,547 368,419 19,128 2590 INTERNAL AUDITING SERVICES 367,450 - 367,450 346,528 20,922 1233 ORTHOPEDICALLY DISABLED 64,496 - 64,496 41,674 22,822 2513 STUDENT TRANSPORTATION 39,524 (14,784) 24,740 - 24,740 1111 KINDERGARTEN 95,859 175 96,034 69,667 26,367 1720 ELEMENTARY SUMMER SCHOOL - 57,715 57,715 29,063 28,652 2571 INTERNAL SERVICES 139,819 4,599 144,418 114,031 30,387 2211 IMPROVEMENT INST/CURR DVLP 191,963 (88,564) 103,399 72,753 30,646 2552 STUDENT TRANSPORTATION 310,745 39,696 350,441 319,760 30,681 3500 CUSTODY & CARE OF CHILDREN SRV 4,916,763 191,541 5,108,304 5,073,570 34,734 2649 OTHER STAFF SERVICES 522,717 33,531 556,248 521,458 34,790 1731 HIGH SUMMER SCHOOL - 61,755 61,755 26,062 35,693 1901 SATURDAY SCHOOL 61,725 18,494 80,219 41,896 38,323 1250 HEARING DISABLED 1,019,149 (63,017) 956,132 915,807 40,325 2120 GUIDANCE SERVICES 90,331 58,507 148,838 107,186 41,652 1722 ELEMENTARY SUMMER SCHOOL - 63,848 63,848 19,024 44,824 2547 CUSTODIAL SERVICES 1,252,684 (113,718) 1,138,966 1,093,904 45,062 1220 TRAINABLE MENTALLY DISABLED 2,855,775 50,452 2,906,227 2,858,655 47,572 2321 OFFICE OF THE SUPERINTENDENT 1,832,790 (28,067) 1,804,723 1,752,663 52,060 2231 SUPERVISION OF SPECIAL PROJECT 412,311 (78,240) 334,071 280,757 53,314 2573 WAREHOUSING & DISTRIBUTING SRV 335,214 126,214 461,428 407,988 53,440 2633 PUBLIC INFORMATION SERVICES - 112,630 112,630 57,886 54,744 2244 IMP INST SRVS-INSRV/STAFF TRN - 54,837 54,837 - 54,837 2245 IMP INST SRVS-INSRV/STAFF TRN - 54,837 54,837 - 54,837 2111 PUPIL ACCOUNTING 722,460 6,051 728,511 667,547 60,964 2152 SPEECH PATHOLOGY SERVICES 119,184 9,651 128,835 65,881 62,954 2319 OTHER BOARD OF EDUCATION SRVS 1,615,924 - 1,615,924 1,547,762 68,162 2623 EVALUATION SERVICES 359,055 (91,169) 267,886 197,846 70,040 2113 SOCIAL WORK SERVICES 769,509 144,965 914,474 843,656 70,818 1144 INTERNATIONAL BACCALAUREATE - 77,511 77,511 965 76,546 2631 INFORMATION SERVICES 754,924 (61,844) 693,080 598,265 94,815 1181 MONTESSORI LOWER EL 720,658 12,758 733,416 637,532 95,884 2525 FINANCIAL ACCOUNTING SERVICES 633,896 4,628 638,524 541,171 97,353
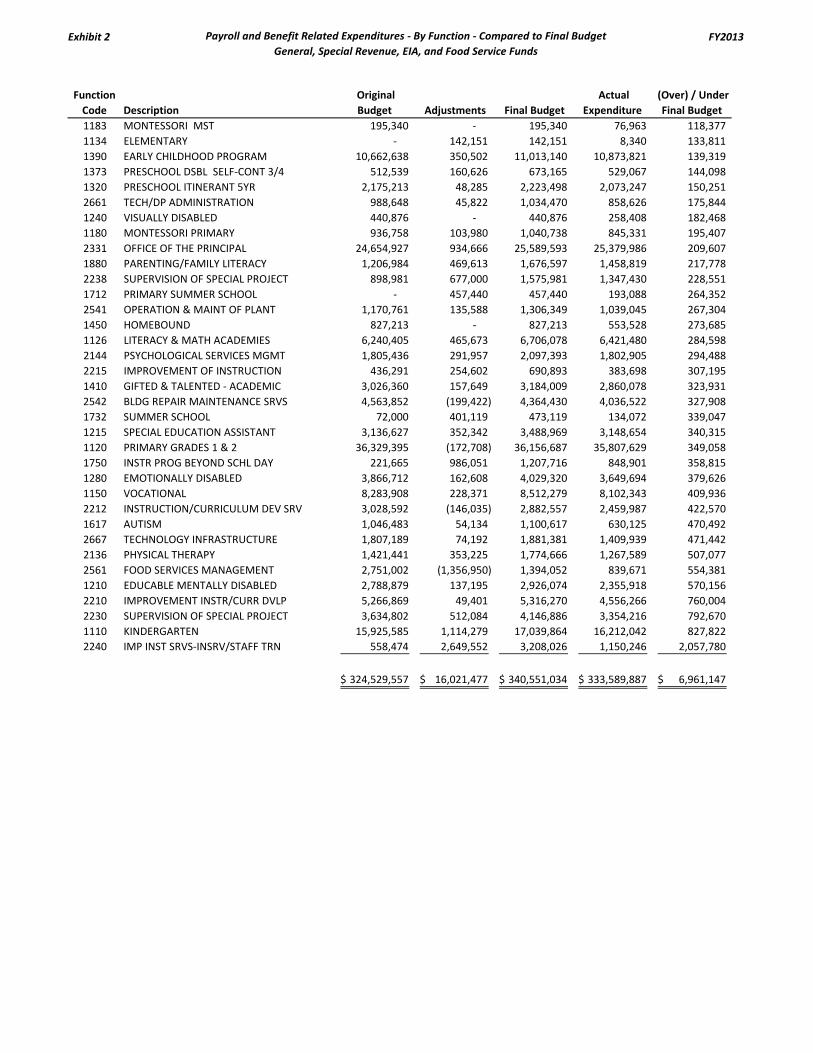
Exhibit 2 Payroll and Benefit Related Expenditures - By Function - Compared to Final BudgetGeneral, Special Revenue, EIA, and Food Service Funds
FY2013
Function Code Description
Original Budget Adjustments Final Budget
Actual Expenditure
(Over) / Under Final Budget
1183 MONTESSORI MST 195,340 - 195,340 76,963 118,377 1134 ELEMENTARY - 142,151 142,151 8,340 133,811 1390 EARLY CHILDHOOD PROGRAM 10,662,638 350,502 11,013,140 10,873,821 139,319 1373 PRESCHOOL DSBL SELF-CONT 3/4 512,539 160,626 673,165 529,067 144,098 1320 PRESCHOOL ITINERANT 5YR 2,175,213 48,285 2,223,498 2,073,247 150,251 2661 TECH/DP ADMINISTRATION 988,648 45,822 1,034,470 858,626 175,844 1240 VISUALLY DISABLED 440,876 - 440,876 258,408 182,468 1180 MONTESSORI PRIMARY 936,758 103,980 1,040,738 845,331 195,407 2331 OFFICE OF THE PRINCIPAL 24,654,927 934,666 25,589,593 25,379,986 209,607 1880 PARENTING/FAMILY LITERACY 1,206,984 469,613 1,676,597 1,458,819 217,778 2238 SUPERVISION OF SPECIAL PROJECT 898,981 677,000 1,575,981 1,347,430 228,551 1712 PRIMARY SUMMER SCHOOL - 457,440 457,440 193,088 264,352 2541 OPERATION & MAINT OF PLANT 1,170,761 135,588 1,306,349 1,039,045 267,304 1450 HOMEBOUND 827,213 - 827,213 553,528 273,685 1126 LITERACY & MATH ACADEMIES 6,240,405 465,673 6,706,078 6,421,480 284,598 2144 PSYCHOLOGICAL SERVICES MGMT 1,805,436 291,957 2,097,393 1,802,905 294,488 2215 IMPROVEMENT OF INSTRUCTION 436,291 254,602 690,893 383,698 307,195 1410 GIFTED & TALENTED - ACADEMIC 3,026,360 157,649 3,184,009 2,860,078 323,931 2542 BLDG REPAIR MAINTENANCE SRVS 4,563,852 (199,422) 4,364,430 4,036,522 327,908 1732 SUMMER SCHOOL 72,000 401,119 473,119 134,072 339,047 1215 SPECIAL EDUCATION ASSISTANT 3,136,627 352,342 3,488,969 3,148,654 340,315 1120 PRIMARY GRADES 1 & 2 36,329,395 (172,708) 36,156,687 35,807,629 349,058 1750 INSTR PROG BEYOND SCHL DAY 221,665 986,051 1,207,716 848,901 358,815 1280 EMOTIONALLY DISABLED 3,866,712 162,608 4,029,320 3,649,694 379,626 1150 VOCATIONAL 8,283,908 228,371 8,512,279 8,102,343 409,936 2212 INSTRUCTION/CURRICULUM DEV SRV 3,028,592 (146,035) 2,882,557 2,459,987 422,570 1617 AUTISM 1,046,483 54,134 1,100,617 630,125 470,492 2667 TECHNOLOGY INFRASTRUCTURE 1,807,189 74,192 1,881,381 1,409,939 471,442 2136 PHYSICAL THERAPY 1,421,441 353,225 1,774,666 1,267,589 507,077 2561 FOOD SERVICES MANAGEMENT 2,751,002 (1,356,950) 1,394,052 839,671 554,381 1210 EDUCABLE MENTALLY DISABLED 2,788,879 137,195 2,926,074 2,355,918 570,156 2210 IMPROVEMENT INSTR/CURR DVLP 5,266,869 49,401 5,316,270 4,556,266 760,004 2230 SUPERVISION OF SPECIAL PROJECT 3,634,802 512,084 4,146,886 3,354,216 792,670 1110 KINDERGARTEN 15,925,585 1,114,279 17,039,864 16,212,042 827,822 2240 IMP INST SRVS-INSRV/STAFF TRN 558,474 2,649,552 3,208,026 1,150,246 2,057,780
324,529,557$ 16,021,477$ 340,551,034$ 333,589,887$ 6,961,147$

Exhibit 3 Payroll and Benefit Related Expenditures - By Object - Compared to Final BudgetGeneral, Special Revenue, EIA, and Food Service Funds
FY2015
Object Code Description
Original Budget Adjustments Final Budget
Actual Expenditure
(Over) / Under Final Budget
110 ADMINISTRATIVE SALARY 18,515,141$ (149,483)$ 18,365,658$ 19,749,948$ (1,384,290)$ 113 PROFESSIONAL OTHER SALARY 12,067,832 (1,637,178) 10,430,654 11,613,647 (1,182,993) 220 EMPLOYEE RETIREMENT 40,645,992 1,783,813 42,429,805 43,240,945 (811,140) 129 TEMPO SALARY - SERVICE WORK 1,627,672 (1,621,791) 5,881 780,400 (774,519) 275 WRKRS' COMP-TTD PAYMENTS 600,000 - 600,000 1,330,340 (730,340) 210 GROUP HEALTH AND LIFE INS 29,483,947 (1,486,691) 27,997,256 28,694,752 (697,496) 119 SERVICE WORK SALARY 5,666,669 (37,474) 5,629,195 6,192,369 (563,174) 112 TEACHER/PROFESSIONAL ED SALARY 167,281,307 8,519,500 175,800,807 176,270,116 (469,309) 139 OVERTIME SALARY - SERVICE WORK 21,600 152,879 174,479 542,966 (368,487) 135 OVERTIME SALARY - T AST/CLER 173,580 331,859 505,439 831,815 (326,376) 273 WRKRS' COMP - MEDICAL PAYMENTS 975,000 - 975,000 1,238,508 (263,508) 140 TERMINAL LEAVE 100,000 6,131 106,131 356,425 (250,294) 115 TEACHER AST/CLERICAL SALARY 31,323,124 1,043,194 32,366,318 32,579,672 (213,354) 114 TECHNICAL SALARY 2,704,503 91,005 2,795,508 3,003,650 (208,142) 142 SUPPLEMENTAL SALARY 3,713,727 318,641 4,032,368 4,158,776 (126,408) 272 WRKRS' COMP - PREMIUMS 239,650 - 239,650 310,399 (70,749) 122 TEMPO SAL - SUBSTITUTE TEACHER 500 3,131 3,631 50,247 (46,616) 137 OVERTIME SALARY - BUS DR/APN - 5,416 5,416 35,581 (30,165) 136 OVERTIME SALARY - WORKER 71,550 101,560 173,110 192,755 (19,645) 120 TEMPO SALARY - ADMIN - 7,808 7,808 27,422 (19,614) 134 OVERTIME SALARY - TECHNICAL - 15,117 15,117 26,785 (11,668) 117 BUS DRIVER/APPRENTICE SALARY 177,325 (11,420) 165,905 176,038 (10,133) 123 TEMPO SALARY - PRO OTHER - 46,127 46,127 55,139 (9,012) 127 TEMPO SALARY - BUS DR/APN 7,300 9,807 17,107 15,880 1,227 240 TEACHER TUITION REIMBURSEMENT - 25,000 25,000 21,166 3,834 125 TEMPO SAL TEACHER AST/CLERICAL 133,012 112,233 245,245 235,877 9,368 290 OTHER BENEFITS 28,081 - 28,081 4,000 24,081 116 CRAFTS AND TRADES SALARY 4,225,179 (93,640) 4,131,539 4,080,616 50,923 271 WKRS' COMP - ASSESSMENTS 400,000 - 400,000 346,778 53,222 260 UNEMPLOYMENT COMPENSATION TAX 511,521 (2,600) 508,921 152,946 355,975 274 WRKRS' COMP-SETTLEMENTS/LEGAL 725,000 - 725,000 311,568 413,432 111 PRINCIPAL/AST PRINCIPAL SAL 15,528,093 1,177,591 16,705,684 16,177,818 527,866 230 SOCIAL SECURITY 20,576,017 562,864 21,138,881 20,316,000 822,881 270 WKRS' COMP - REIMB OTHR FUNDS 558,587 (73,028) 485,559 (607,290) 1,092,849
358,081,909$ 9,200,371$ 367,282,280$ 372,514,054$ (5,231,774)$
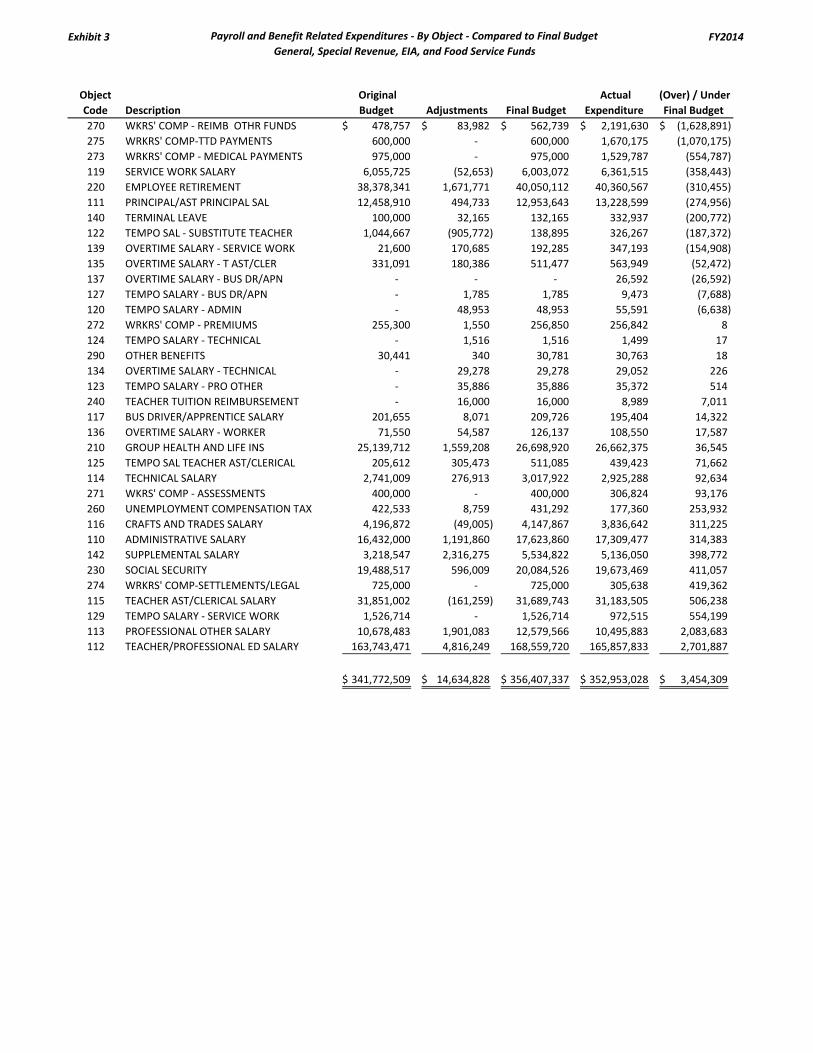
Exhibit 3 Payroll and Benefit Related Expenditures - By Object - Compared to Final BudgetGeneral, Special Revenue, EIA, and Food Service Funds
FY2014
Object Code Description
Original Budget Adjustments Final Budget
Actual Expenditure
(Over) / Under Final Budget
270 WKRS' COMP - REIMB OTHR FUNDS 478,757$ 83,982$ 562,739$ 2,191,630$ (1,628,891)$ 275 WRKRS' COMP-TTD PAYMENTS 600,000 - 600,000 1,670,175 (1,070,175) 273 WRKRS' COMP - MEDICAL PAYMENTS 975,000 - 975,000 1,529,787 (554,787) 119 SERVICE WORK SALARY 6,055,725 (52,653) 6,003,072 6,361,515 (358,443) 220 EMPLOYEE RETIREMENT 38,378,341 1,671,771 40,050,112 40,360,567 (310,455) 111 PRINCIPAL/AST PRINCIPAL SAL 12,458,910 494,733 12,953,643 13,228,599 (274,956) 140 TERMINAL LEAVE 100,000 32,165 132,165 332,937 (200,772) 122 TEMPO SAL - SUBSTITUTE TEACHER 1,044,667 (905,772) 138,895 326,267 (187,372) 139 OVERTIME SALARY - SERVICE WORK 21,600 170,685 192,285 347,193 (154,908) 135 OVERTIME SALARY - T AST/CLER 331,091 180,386 511,477 563,949 (52,472) 137 OVERTIME SALARY - BUS DR/APN - - - 26,592 (26,592) 127 TEMPO SALARY - BUS DR/APN - 1,785 1,785 9,473 (7,688) 120 TEMPO SALARY - ADMIN - 48,953 48,953 55,591 (6,638) 272 WRKRS' COMP - PREMIUMS 255,300 1,550 256,850 256,842 8 124 TEMPO SALARY - TECHNICAL - 1,516 1,516 1,499 17 290 OTHER BENEFITS 30,441 340 30,781 30,763 18 134 OVERTIME SALARY - TECHNICAL - 29,278 29,278 29,052 226 123 TEMPO SALARY - PRO OTHER - 35,886 35,886 35,372 514 240 TEACHER TUITION REIMBURSEMENT - 16,000 16,000 8,989 7,011 117 BUS DRIVER/APPRENTICE SALARY 201,655 8,071 209,726 195,404 14,322 136 OVERTIME SALARY - WORKER 71,550 54,587 126,137 108,550 17,587 210 GROUP HEALTH AND LIFE INS 25,139,712 1,559,208 26,698,920 26,662,375 36,545 125 TEMPO SAL TEACHER AST/CLERICAL 205,612 305,473 511,085 439,423 71,662 114 TECHNICAL SALARY 2,741,009 276,913 3,017,922 2,925,288 92,634 271 WKRS' COMP - ASSESSMENTS 400,000 - 400,000 306,824 93,176 260 UNEMPLOYMENT COMPENSATION TAX 422,533 8,759 431,292 177,360 253,932 116 CRAFTS AND TRADES SALARY 4,196,872 (49,005) 4,147,867 3,836,642 311,225 110 ADMINISTRATIVE SALARY 16,432,000 1,191,860 17,623,860 17,309,477 314,383 142 SUPPLEMENTAL SALARY 3,218,547 2,316,275 5,534,822 5,136,050 398,772 230 SOCIAL SECURITY 19,488,517 596,009 20,084,526 19,673,469 411,057 274 WRKRS' COMP-SETTLEMENTS/LEGAL 725,000 - 725,000 305,638 419,362 115 TEACHER AST/CLERICAL SALARY 31,851,002 (161,259) 31,689,743 31,183,505 506,238 129 TEMPO SALARY - SERVICE WORK 1,526,714 - 1,526,714 972,515 554,199 113 PROFESSIONAL OTHER SALARY 10,678,483 1,901,083 12,579,566 10,495,883 2,083,683 112 TEACHER/PROFESSIONAL ED SALARY 163,743,471 4,816,249 168,559,720 165,857,833 2,701,887
341,772,509$ 14,634,828$ 356,407,337$ 352,953,028$ 3,454,309$
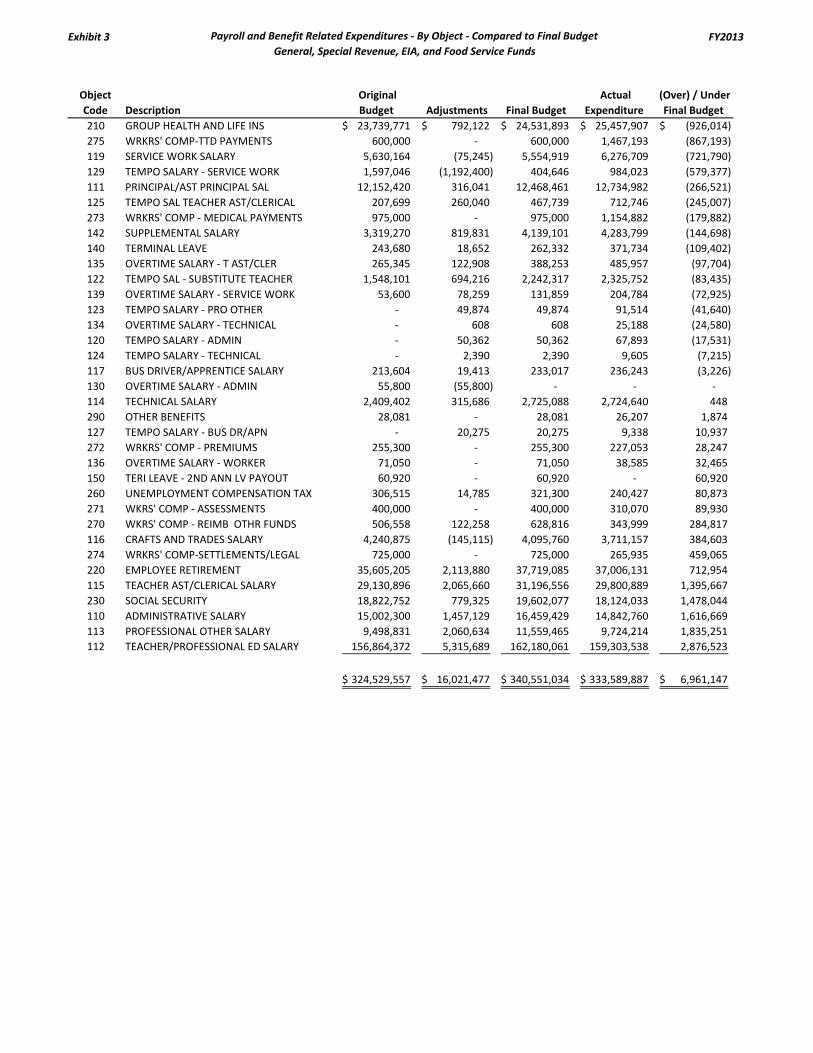
Exhibit 3 Payroll and Benefit Related Expenditures - By Object - Compared to Final BudgetGeneral, Special Revenue, EIA, and Food Service Funds
FY2013
Object Code Description
Original Budget Adjustments Final Budget
Actual Expenditure
(Over) / Under Final Budget
210 GROUP HEALTH AND LIFE INS 23,739,771$ 792,122$ 24,531,893$ 25,457,907$ (926,014)$ 275 WRKRS' COMP-TTD PAYMENTS 600,000 - 600,000 1,467,193 (867,193) 119 SERVICE WORK SALARY 5,630,164 (75,245) 5,554,919 6,276,709 (721,790) 129 TEMPO SALARY - SERVICE WORK 1,597,046 (1,192,400) 404,646 984,023 (579,377) 111 PRINCIPAL/AST PRINCIPAL SAL 12,152,420 316,041 12,468,461 12,734,982 (266,521) 125 TEMPO SAL TEACHER AST/CLERICAL 207,699 260,040 467,739 712,746 (245,007) 273 WRKRS' COMP - MEDICAL PAYMENTS 975,000 - 975,000 1,154,882 (179,882) 142 SUPPLEMENTAL SALARY 3,319,270 819,831 4,139,101 4,283,799 (144,698) 140 TERMINAL LEAVE 243,680 18,652 262,332 371,734 (109,402) 135 OVERTIME SALARY - T AST/CLER 265,345 122,908 388,253 485,957 (97,704) 122 TEMPO SAL - SUBSTITUTE TEACHER 1,548,101 694,216 2,242,317 2,325,752 (83,435) 139 OVERTIME SALARY - SERVICE WORK 53,600 78,259 131,859 204,784 (72,925) 123 TEMPO SALARY - PRO OTHER - 49,874 49,874 91,514 (41,640) 134 OVERTIME SALARY - TECHNICAL - 608 608 25,188 (24,580) 120 TEMPO SALARY - ADMIN - 50,362 50,362 67,893 (17,531) 124 TEMPO SALARY - TECHNICAL - 2,390 2,390 9,605 (7,215) 117 BUS DRIVER/APPRENTICE SALARY 213,604 19,413 233,017 236,243 (3,226) 130 OVERTIME SALARY - ADMIN 55,800 (55,800) - - - 114 TECHNICAL SALARY 2,409,402 315,686 2,725,088 2,724,640 448 290 OTHER BENEFITS 28,081 - 28,081 26,207 1,874 127 TEMPO SALARY - BUS DR/APN - 20,275 20,275 9,338 10,937 272 WRKRS' COMP - PREMIUMS 255,300 - 255,300 227,053 28,247 136 OVERTIME SALARY - WORKER 71,050 - 71,050 38,585 32,465 150 TERI LEAVE - 2ND ANN LV PAYOUT 60,920 - 60,920 - 60,920 260 UNEMPLOYMENT COMPENSATION TAX 306,515 14,785 321,300 240,427 80,873 271 WKRS' COMP - ASSESSMENTS 400,000 - 400,000 310,070 89,930 270 WKRS' COMP - REIMB OTHR FUNDS 506,558 122,258 628,816 343,999 284,817 116 CRAFTS AND TRADES SALARY 4,240,875 (145,115) 4,095,760 3,711,157 384,603 274 WRKRS' COMP-SETTLEMENTS/LEGAL 725,000 - 725,000 265,935 459,065 220 EMPLOYEE RETIREMENT 35,605,205 2,113,880 37,719,085 37,006,131 712,954 115 TEACHER AST/CLERICAL SALARY 29,130,896 2,065,660 31,196,556 29,800,889 1,395,667 230 SOCIAL SECURITY 18,822,752 779,325 19,602,077 18,124,033 1,478,044 110 ADMINISTRATIVE SALARY 15,002,300 1,457,129 16,459,429 14,842,760 1,616,669 113 PROFESSIONAL OTHER SALARY 9,498,831 2,060,634 11,559,465 9,724,214 1,835,251 112 TEACHER/PROFESSIONAL ED SALARY 156,864,372 5,315,689 162,180,061 159,303,538 2,876,523
324,529,557$ 16,021,477$ 340,551,034$ 333,589,887$ 6,961,147$