characterizing tonal amplitude modulation of wind farm noise · amplitude modulation (am) is...
TRANSCRIPT
ACOUSTICS 2018 Page 1 of 10
Characterizing tonal amplitude modulation of wind farm noise Phuc D. Nguyen (1), Kristy L. Hansen (1) and Branko Zajamsek (2)
(1) College of Science and Engineering, Flinders University, Adelaide, South Australia (2) Adelaide Institute for Sleep Health, College of Medicine & Public Health, Flinders University, Adelaide, South Australia
ABSTRACT
In addition to the overall noise level, periodic variations in the loudness of wind turbine noise, known as amplitude modulation (AM), also significantly contribute to the annoyance experienced by residents living near wind farms. Due to the high dependence of AM on meteorological conditions and the type of wind turbines, the level and duration of AM are hard to predict. These characteristics have an important impact on the annoyance response of residents. The level of annoyance is expected to depend on the AM depth, the number of AM occurrences and the AM continuity. The aim of this paper is to investigate AM characteristics in the vicinity of two wind farms in South Australia. It has been found that to successfully quantify tonal AM based on the “Reference Method” pro-posed by the UK Institute of Acoustics, removing the A-weighting, changing the range of band-pass filter frequency and reducing the prominence ratio are also necessary. AM density at night-time is much higher than at day time (25% versus 15%). However, there is not significant difference between AM depth at night-time and day time. Furthermore, AM is more likely to occur when the wind turbines are operating significantly below their maximum rated power.
1 INTRODUCTION Wind energy has contributed significantly to total electricity needs in recent decades, but noise from wind turbines remains a serious issue. In comparison with other sources of noise such as aircraft, road traffic and railway noise, the sound pressure levels (SPL) of wind farm noise (WFN) are much lower. However, due to the low-frequency dominance of wind farm noise at large propagation distances, WFN seems to be more annoying than a more balanced noise spectrum of other noise sources (Pedersen and Persson Waye 2004). The low-frequency noise generated from wind farms can be heard by residents at distances up to 3 km or more from the nearest wind turbine (Hansen, Doolan, and Hansen 2017, Hansen, Zajamsek, and Hansen 2013). Apart from the presence of low-frequency noise, other characteristics of the noise such as tonality, impulsiveness, amplitude modulation and beating make WFN more annoying than other types of noise (Lee et al. 2011, Ioannidou, Santurette, and Jeong 2016, Bowdler 2008). Amplitude modulation (AM) is defined as the periodic variation in amplitude of a signal. Regarding wind farm noise, AM is hence a periodic fluctuation in the amplitude of the noise at the rate of the blade-pass frequency (BPF) of the wind turbine (AMWG 2015). The AM could be separated into two types in terms of the frequency range in which AM occurs. The first type occurs in the frequency range of 400 – 1000 Hz and is referred to as ‘normal AM’ (AMWG 2015, UK 2013a). This type of AM is more apparent close to a turbine which manifests as a “swishing” type of noise. The second type is characterised by the low frequency range which is often described as “thumping” or “whoomping” type of noise. This type of AM is referred as other AM (OAM) or enhanced AM (EAM) and can be heard at large distances from wind farms (Van den Berg 2005). Two types of low frequency AM have been observed; one where a single – frequency sound is modulated and another where broadband sound is modulated by one or several frequencies related to the turbine blade – pass frequency. For AM of broadband sound, the generation mechanism could be transient stall which can be reduced by blade pitch control (Van den Berg 2005, Bowdler 2008). However, for the AM of tonal sound, the mechanism of this phenomenon has not yet been addressed sufficiently in the literature. This makes it difficult to mitigate as well as characterise this type of AM.
Proceedings of ACOUSTICS 2018 7-9 November 2018,
Adelaide, Australia
Page 2 of 10 ACOUSTICS 2018
The effects of various meteorological conditions on AM was carried out by Larsson and Öhlund (2014). By ana-lysing acoustic data measured at two sites in Sweden, the authors concluded that amplitude modulated sound from wind turbines is more common during stable atmospheric conditions, which usually occur during the evening and night-time, and the interaction of sound from several wind turbines also affects AM. Paulraj and Välisuo (2017) demonstrated that while the high dependence of AM depth on wind direction is obvious, there is no relationship between AM depth and wind speed. The noise and weather data were collected by the authors at distances of 1.1 km from the Kirkkokallio wind farm in Finland. Due to the high dependence of AM on meteorological conditions, blade loading changes, noise directivity, and the interaction of sound from several wind turbines, the prediction of AM characteristics is challenging. For AM of tonal sound, it is even more challenging where the mechanism of this phenomenon has not yet been fully under-stood. Therefore, it could be useful and practical to understand this type of AM by looking at statistics related to the characteristics of this phenomenon. By analyzing noise data measured at dwellings at two wind farms with different types of turbines in South Australia, this paper presents some new insights into the character of tonal AM.
2 FIELD MEASUREMENTS
2.1 Wind farm locations
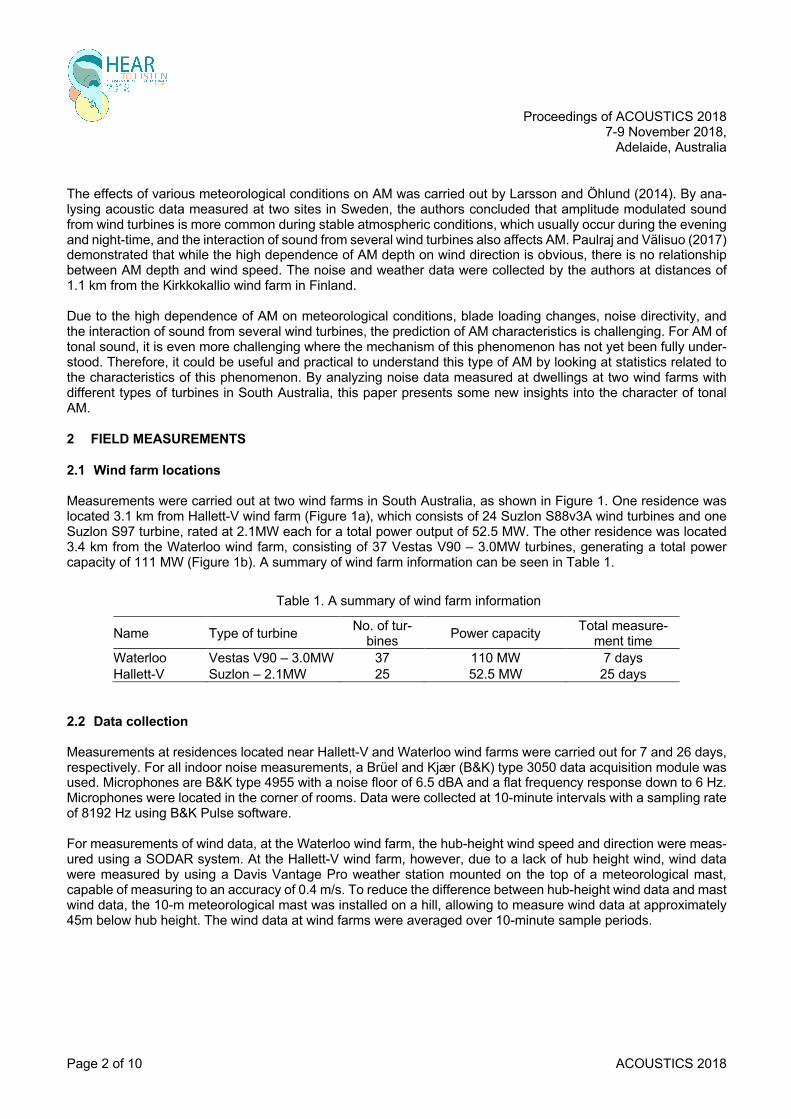
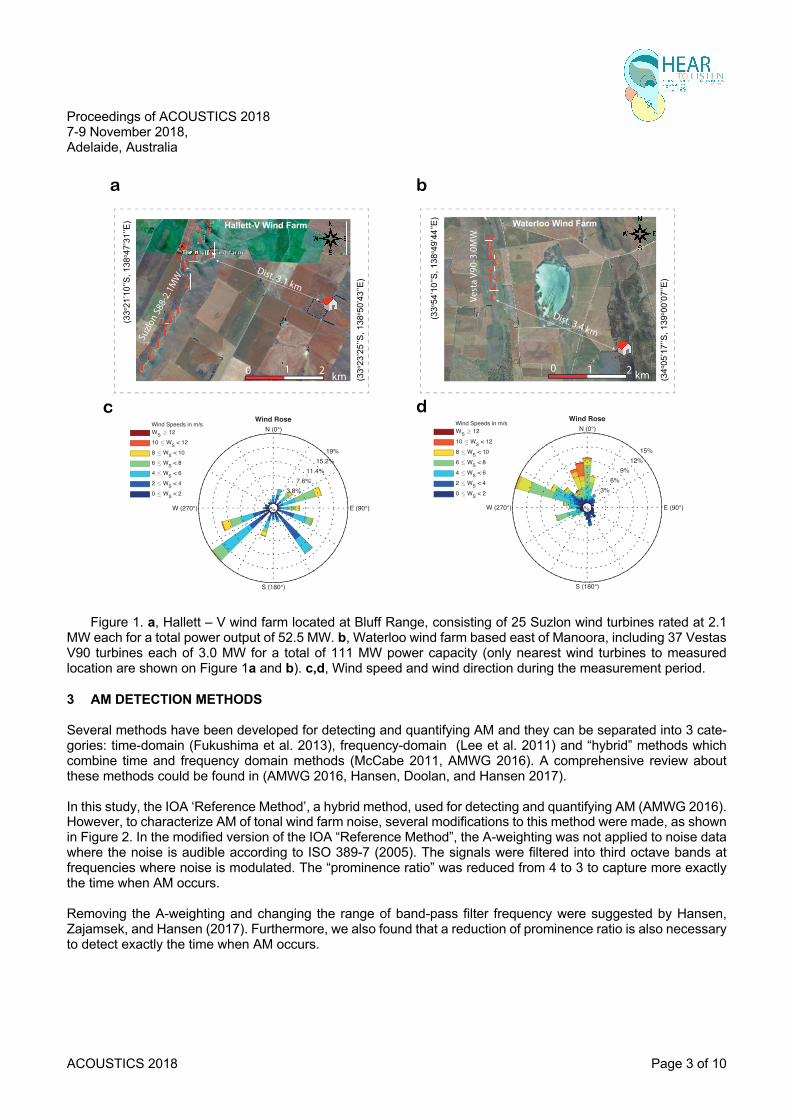
Measurements were carried out at two wind farms in South Australia, as shown in Figure 1. One residence was located 3.1 km from Hallett-V wind farm (Figure 1a), which consists of 24 Suzlon S88v3A wind turbines and one Suzlon S97 turbine, rated at 2.1MW each for a total power output of 52.5 MW. The other residence was located 3.4 km from the Waterloo wind farm, consisting of 37 Vestas V90 – 3.0MW turbines, generating a total power capacity of 111 MW (Figure 1b). A summary of wind farm information can be seen in Table 1.
Table 1. A summary of wind farm information
Name Type of turbine No. of tur-bines Power capacity Total measure-
ment time Waterloo Vestas V90 – 3.0MW 37 110 MW 7 days Hallett-V Suzlon – 2.1MW 25 52.5 MW 25 days
2.2 Data collection
Measurements at residences located near Hallett-V and Waterloo wind farms were carried out for 7 and 26 days, respectively. For all indoor noise measurements, a Brüel and Kjær (B&K) type 3050 data acquisition module was used. Microphones are B&K type 4955 with a noise floor of 6.5 dBA and a flat frequency response down to 6 Hz. Microphones were located in the corner of rooms. Data were collected at 10-minute intervals with a sampling rate of 8192 Hz using B&K Pulse software. For measurements of wind data, at the Waterloo wind farm, the hub-height wind speed and direction were meas-ured using a SODAR system. At the Hallett-V wind farm, however, due to a lack of hub height wind, wind data were measured by using a Davis Vantage Pro weather station mounted on the top of a meteorological mast, capable of measuring to an accuracy of 0.4 m/s. To reduce the difference between hub-height wind data and mast wind data, the 10-m meteorological mast was installed on a hill, allowing to measure wind data at approximately 45m below hub height. The wind data at wind farms were averaged over 10-minute sample periods.
Proceedings of ACOUSTICS 2018 7-9 November 2018, Adelaide, Australia
ACOUSTICS 2018 Page 3 of 10
Figure 1. a, Hallett – V wind farm located at Bluff Range, consisting of 25 Suzlon wind turbines rated at 2.1 MW each for a total power output of 52.5 MW. b, Waterloo wind farm based east of Manoora, including 37 Vestas V90 turbines each of 3.0 MW for a total of 111 MW power capacity (only nearest wind turbines to measured location are shown on Figure 1a and b). c,d, Wind speed and wind direction during the measurement period.
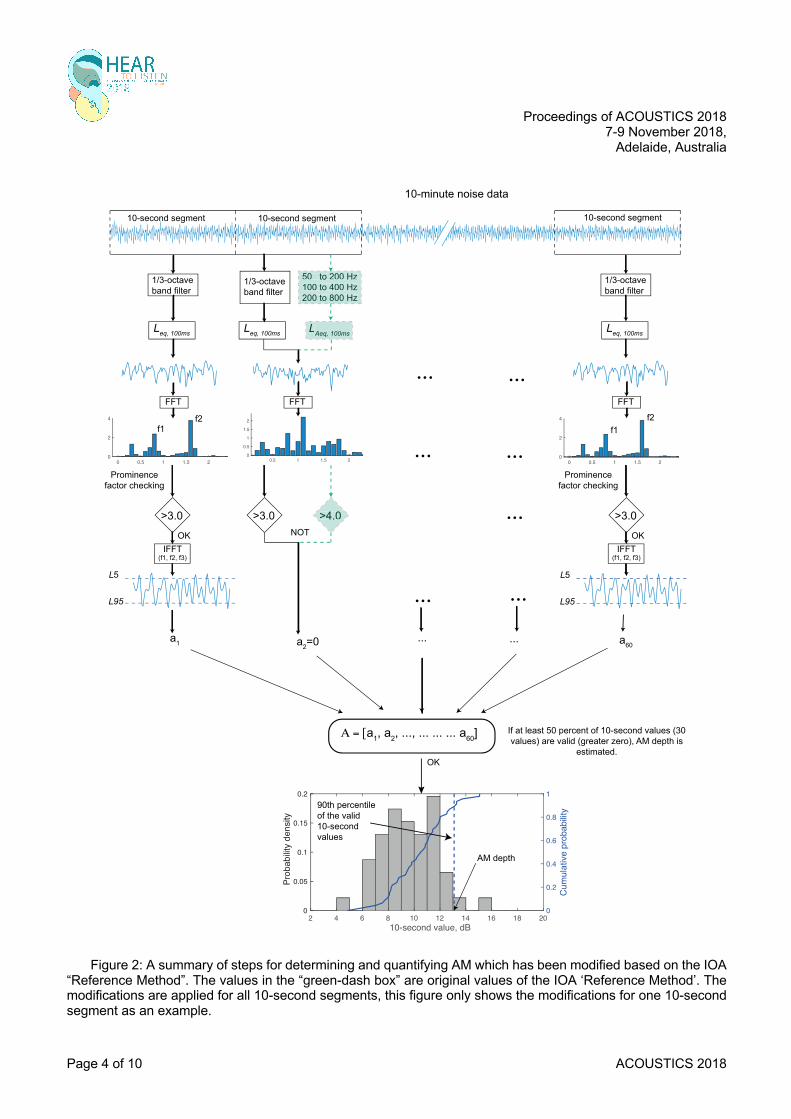
3 AM DETECTION METHODS Several methods have been developed for detecting and quantifying AM and they can be separated into 3 cate-gories: time-domain (Fukushima et al. 2013), frequency-domain (Lee et al. 2011) and “hybrid” methods which combine time and frequency domain methods (McCabe 2011, AMWG 2016). A comprehensive review about these methods could be found in (AMWG 2016, Hansen, Doolan, and Hansen 2017). In this study, the IOA ‘Reference Method’, a hybrid method, used for detecting and quantifying AM (AMWG 2016). However, to characterize AM of tonal wind farm noise, several modifications to this method were made, as shown in Figure 2. In the modified version of the IOA “Reference Method”, the A-weighting was not applied to noise data where the noise is audible according to ISO 389-7 (2005). The signals were filtered into third octave bands at frequencies where noise is modulated. The “prominence ratio” was reduced from 4 to 3 to capture more exactly the time when AM occurs. Removing the A-weighting and changing the range of band-pass filter frequency were suggested by Hansen, Zajamsek, and Hansen (2017). Furthermore, we also found that a reduction of prominence ratio is also necessary to detect exactly the time when AM occurs.
Suzlo
n S8
8-2.1
MW
Vest
a V9
0-3.
0MW
Dist. 3.1 km
Dist. 3.4 km
0 1 2 km0 1 2 km
Hallett-V Wind Farm Waterloo Wind Farm
(33o 2
3’25
’’S, 1
38o 5
0’43
’’E)
(34o 0
5’17
’’S, 1
39o 0
0’07
’’E)
(33o 2
1’10
’’S, 1
38o 4
7’31
’’E)
(33o 5
4’10
’’S, 1
38o 4
9’44
’’E)
Wind Rose
3.8%7.6%
11.4%15.2%
19%
0% E (90°)W (270°)
N (0°)
S (180°)
Wind Speeds in m/sWS 1210 WS < 128 WS < 106 WS < 84 WS < 62 WS < 40 WS < 2
Wind Speeds in m/sWS 1210 WS < 128 WS < 106 WS < 84 WS < 62 WS < 40 WS < 2
Wind Rose
3%6%
9%12%
15%
0% E (90°)W (270°)
N (0°)
S (180°)
a b
dc
Proceedings of ACOUSTICS 2018 7-9 November 2018,
Adelaide, Australia
Page 4 of 10 ACOUSTICS 2018
Figure 2: A summary of steps for determining and quantifying AM which has been modified based on the IOA “Reference Method”. The values in the “green-dash box” are original values of the IOA ‘Reference Method’. The modifications are applied for all 10-second segments, this figure only shows the modifications for one 10-second segment as an example.
Α = [D���D��������������������D��@
D� D� �
If at least 50 percent of 10-second values (30 values) are valid (greater zero), AM depth is
estimated.
10-second segment 10-second segment 10-second segment
L95
L5
10-minute noise data
OK
OK
��� ��� D��
FFT
LAeq, 100ms
... ...
50 to 200 Hz100 to 400 Hz200 to 800 Hz
50 to 200 Hz100 to 400 Hz200 to 800 Hz
... ...
0.5 1 1.5 20
0.51
1.52
0 0.5 1 1.5 20
2
4
f1f2
... ...f1
f2
0 0.5 1 1.5 20
2
4
L95
L5
Prominence factor checking
NOT
0
0.2
0.4
0.6
0.8
1
Cum
ulativ
e pr
obab
ility
2 4 6 8 10 12 14 16 18 2010-second value, dB
0
0.05
0.1
0.15
0.2
Prob
abilit
y den
sity
90th percentile of the valid 10-second values
AM depth
...
FFT FFT
1/3-octave band filter
1/3-octave band filter
Leq, 100ms
1/3-octave band filter
Leq, 100msLeq, 100ms LAeq, 100ms
>3.0 >3.0 >4.0>4.0
IFFT (f1, f2, f3)
OK
Prominence factor checking
>3.0
IFFT (f1, f2, f3)
Proceedings of ACOUSTICS 2018 7-9 November 2018, Adelaide, Australia
ACOUSTICS 2018 Page 5 of 10
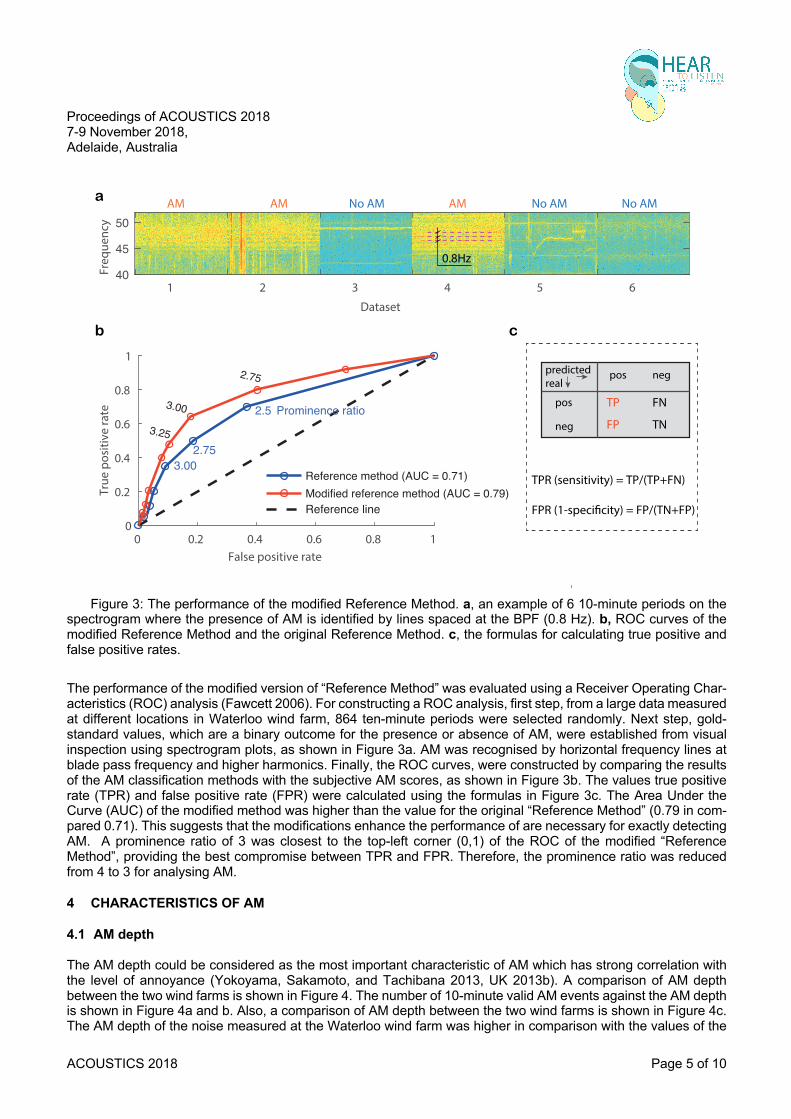
Figure 3: The performance of the modified Reference Method. a, an example of 6 10-minute periods on the
spectrogram where the presence of AM is identified by lines spaced at the BPF (0.8 Hz). b, ROC curves of the modified Reference Method and the original Reference Method. c, the formulas for calculating true positive and false positive rates.
The performance of the modified version of “Reference Method” was evaluated using a Receiver Operating Char-acteristics (ROC) analysis (Fawcett 2006). For constructing a ROC analysis, first step, from a large data measured at different locations in Waterloo wind farm, 864 ten-minute periods were selected randomly. Next step, gold- standard values, which are a binary outcome for the presence or absence of AM, were established from visual inspection using spectrogram plots, as shown in Figure 3a. AM was recognised by horizontal frequency lines at blade pass frequency and higher harmonics. Finally, the ROC curves, were constructed by comparing the results of the AM classification methods with the subjective AM scores, as shown in Figure 3b. The values true positive rate (TPR) and false positive rate (FPR) were calculated using the formulas in Figure 3c. The Area Under the Curve (AUC) of the modified method was higher than the value for the original “Reference Method” (0.79 in com-pared 0.71). This suggests that the modifications enhance the performance of are necessary for exactly detecting AM. A prominence ratio of 3 was closest to the top-left corner (0,1) of the ROC of the modified “Reference Method”, providing the best compromise between TPR and FPR. Therefore, the prominence ratio was reduced from 4 to 3 for analysing AM.
4 CHARACTERISTICS OF AM
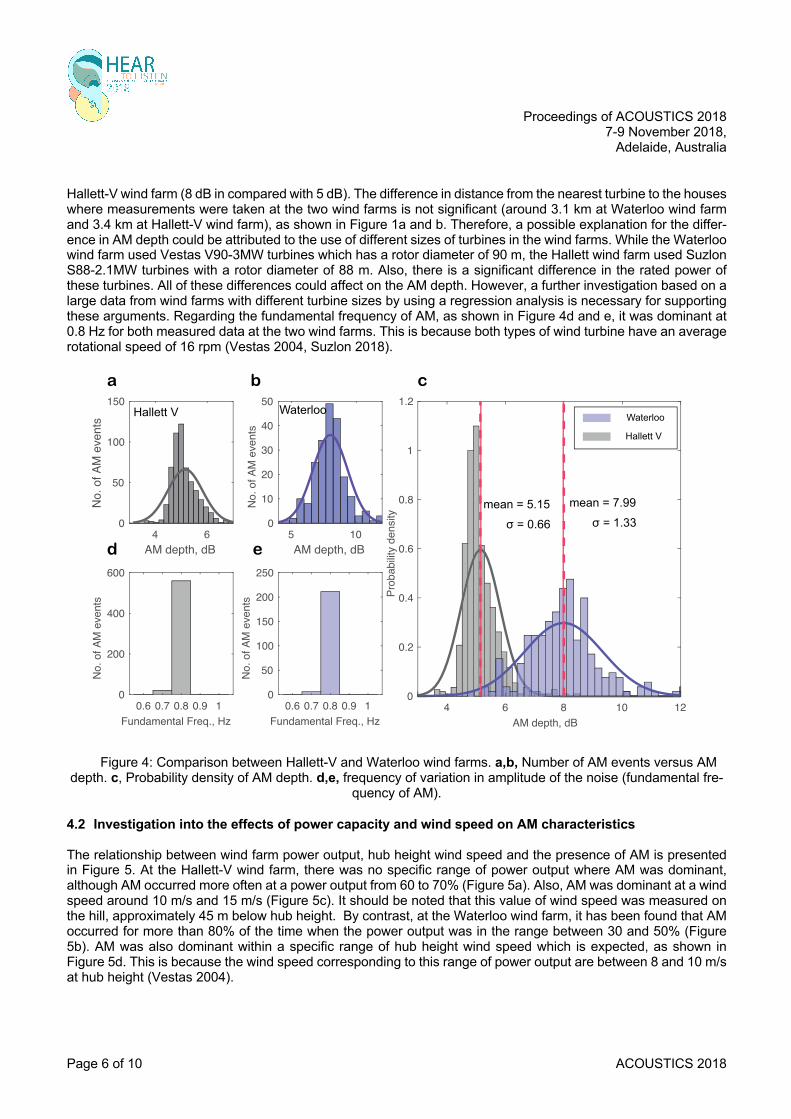
4.1 AM depth The AM depth could be considered as the most important characteristic of AM which has strong correlation with the level of annoyance (Yokoyama, Sakamoto, and Tachibana 2013, UK 2013b). A comparison of AM depth between the two wind farms is shown in Figure 4. The number of 10-minute valid AM events against the AM depth is shown in Figure 4a and b. Also, a comparison of AM depth between the two wind farms is shown in Figure 4c. The AM depth of the noise measured at the Waterloo wind farm was higher in comparison with the values of the
0 0.2 0.4 0.6 0.8 1False positive rate
Dataset
0
0.2
0.4
0.6
0.8
1
True
pos
itive
rate
Freq
uenc
y
2.5
2.753.00
Reference method (AUC = 0.71)Modified reference method (AUC = 0.79) Reference line
predictedreal
pos
pos
neg
neg
TP
FP
FN
TPR (sensitivity) = TP/(TP+FN)
FPR (1-specificity) = FP/(TN+FP)
TN
b
a
c
1 2 3 4 5 640
45
50AM AM No AM AM No AM No AM
0.8Hz
Prominence ratio
2.75
3.003.25
Proceedings of ACOUSTICS 2018 7-9 November 2018,
Adelaide, Australia
Page 6 of 10 ACOUSTICS 2018
Hallett-V wind farm (8 dB in compared with 5 dB). The difference in distance from the nearest turbine to the houses where measurements were taken at the two wind farms is not significant (around 3.1 km at Waterloo wind farm and 3.4 km at Hallett-V wind farm), as shown in Figure 1a and b. Therefore, a possible explanation for the differ-ence in AM depth could be attributed to the use of different sizes of turbines in the wind farms. While the Waterloo wind farm used Vestas V90-3MW turbines which has a rotor diameter of 90 m, the Hallett wind farm used Suzlon S88-2.1MW turbines with a rotor diameter of 88 m. Also, there is a significant difference in the rated power of these turbines. All of these differences could affect on the AM depth. However, a further investigation based on a large data from wind farms with different turbine sizes by using a regression analysis is necessary for supporting these arguments. Regarding the fundamental frequency of AM, as shown in Figure 4d and e, it was dominant at 0.8 Hz for both measured data at the two wind farms. This is because both types of wind turbine have an average rotational speed of 16 rpm (Vestas 2004, Suzlon 2018).
Figure 4: Comparison between Hallett-V and Waterloo wind farms. a,b, Number of AM events versus AM depth. c, Probability density of AM depth. d,e, frequency of variation in amplitude of the noise (fundamental fre-
quency of AM).
4.2 Investigation into the effects of power capacity and wind speed on AM characteristics
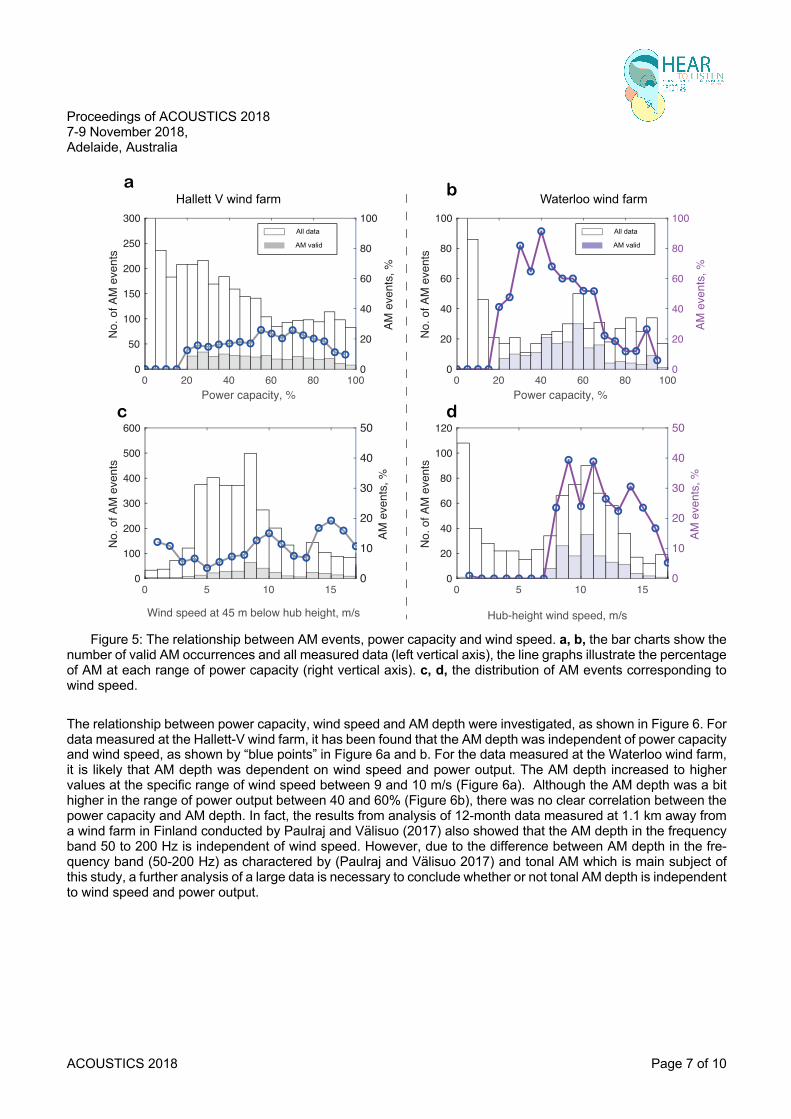
The relationship between wind farm power output, hub height wind speed and the presence of AM is presented in Figure 5. At the Hallett-V wind farm, there was no specific range of power output where AM was dominant, although AM occurred more often at a power output from 60 to 70% (Figure 5a). Also, AM was dominant at a wind speed around 10 m/s and 15 m/s (Figure 5c). It should be noted that this value of wind speed was measured on the hill, approximately 45 m below hub height. By contrast, at the Waterloo wind farm, it has been found that AM occurred for more than 80% of the time when the power output was in the range between 30 and 50% (Figure 5b). AM was also dominant within a specific range of hub height wind speed which is expected, as shown in Figure 5d. This is because the wind speed corresponding to this range of power output are between 8 and 10 m/s at hub height (Vestas 2004).
4 6AM depth, dB
0
50
100
150
No. o
f AM
eve
nts
5 10AM depth, dB
0
10
20
30
40
50
No. o
f AM
eve
nts
0.6 0.7 0.8 0.9 1Fundamental Freq., Hz
0
50
100
150
200
250
No. o
f AM
eve
nts
0.6 0.7 0.8 0.9 1Fundamental Freq., Hz
0
200
400
600
No. o
f AM
eve
nts
4 6 8 10 12AM depth, dB
0
0.2
0.4
0.6
0.8
1
1.2Pr
obab
ility d
ensit
ya b c
d e
mean = 7.99σ = 1.33
mean = 5.15σ = 0.66
Hallett V Waterloo
Hallett V
Waterloo
Proceedings of ACOUSTICS 2018 7-9 November 2018, Adelaide, Australia
ACOUSTICS 2018 Page 7 of 10
Figure 5: The relationship between AM events, power capacity and wind speed. a, b, the bar charts show the
number of valid AM occurrences and all measured data (left vertical axis), the line graphs illustrate the percentage of AM at each range of power capacity (right vertical axis). c, d, the distribution of AM events corresponding to wind speed.
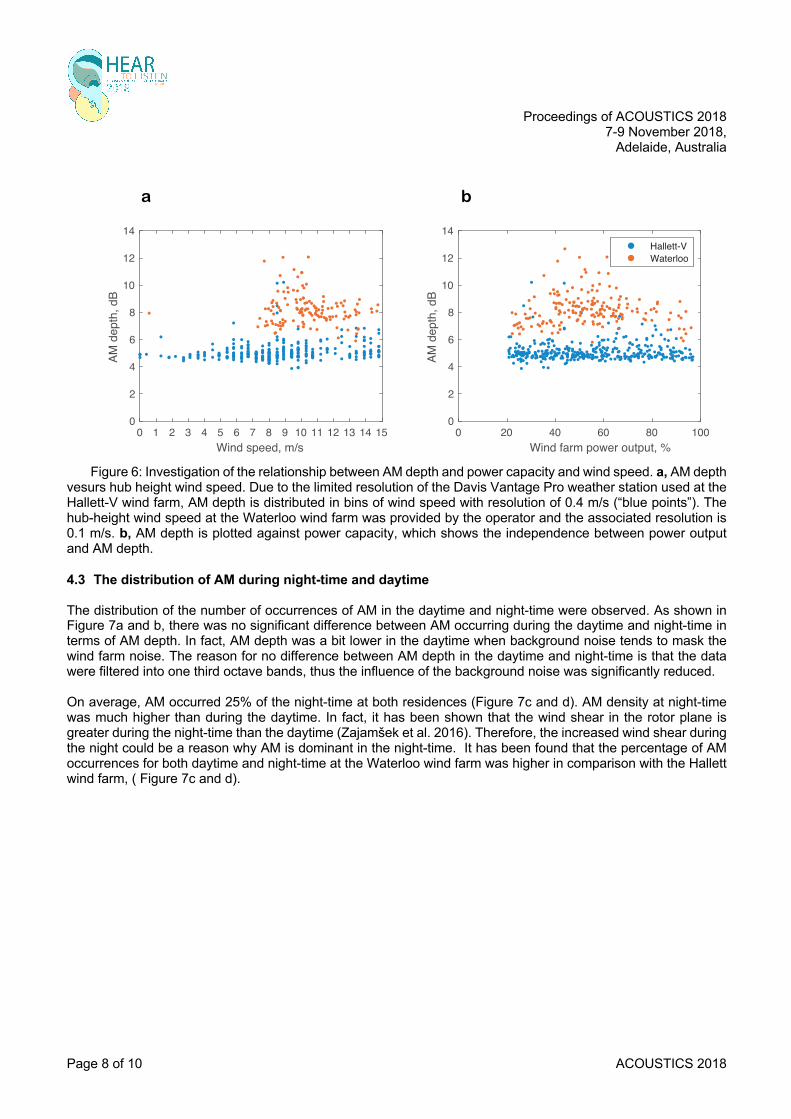
The relationship between power capacity, wind speed and AM depth were investigated, as shown in Figure 6. For data measured at the Hallett-V wind farm, it has been found that the AM depth was independent of power capacity and wind speed, as shown by “blue points” in Figure 6a and b. For the data measured at the Waterloo wind farm, it is likely that AM depth was dependent on wind speed and power output. The AM depth increased to higher values at the specific range of wind speed between 9 and 10 m/s (Figure 6a). Although the AM depth was a bit higher in the range of power output between 40 and 60% (Figure 6b), there was no clear correlation between the power capacity and AM depth. In fact, the results from analysis of 12-month data measured at 1.1 km away from a wind farm in Finland conducted by Paulraj and Välisuo (2017) also showed that the AM depth in the frequency band 50 to 200 Hz is independent of wind speed. However, due to the difference between AM depth in the fre-quency band (50-200 Hz) as charactered by (Paulraj and Välisuo 2017) and tonal AM which is main subject of this study, a further analysis of a large data is necessary to conclude whether or not tonal AM depth is independent to wind speed and power output.
0
10
20
30
40
50
AM e
vent
s, %
0 5 10 150
100
200
300
400
500
600
No. o
f AM
eve
nts
0
20
40
60
80
100
AM e
vent
s, %
0 20 40 60 80 100Power capacity, %
0
50
100
150
200
250
300
No. o
f AM
eve
nts
0
20
40
60
80
100
AM e
vent
s, %
0 20 40 60 80 100Power capacity, %
0
20
40
60
80
100
No. o
f AM
eve
nts
0
10
20
30
40
50
AM e
vent
s, %
0 5 10 150
20
40
60
80
100
120No
. of A
M e
vent
s
Hallett V wind farm Waterloo wind farma b
c d
Wind speed at 45 m below hub height, m/s Hub-height wind speed, m/s
AM valid
All data
AM valid
All data
Proceedings of ACOUSTICS 2018 7-9 November 2018,
Adelaide, Australia
Page 8 of 10 ACOUSTICS 2018
Figure 6: Investigation of the relationship between AM depth and power capacity and wind speed. a, AM depth
vesurs hub height wind speed. Due to the limited resolution of the Davis Vantage Pro weather station used at the Hallett-V wind farm, AM depth is distributed in bins of wind speed with resolution of 0.4 m/s (“blue points”). The hub-height wind speed at the Waterloo wind farm was provided by the operator and the associated resolution is 0.1 m/s. b, AM depth is plotted against power capacity, which shows the independence between power output and AM depth.
4.3 The distribution of AM during night-time and daytime
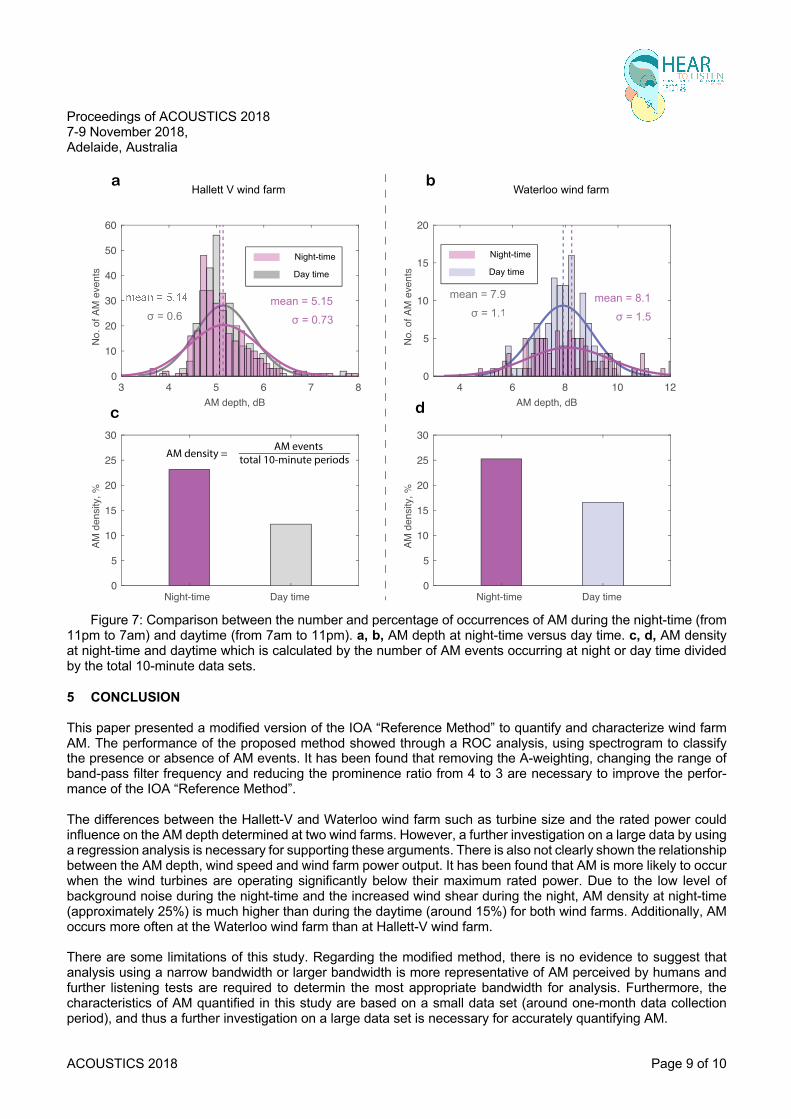
The distribution of the number of occurrences of AM in the daytime and night-time were observed. As shown in Figure 7a and b, there was no significant difference between AM occurring during the daytime and night-time in terms of AM depth. In fact, AM depth was a bit lower in the daytime when background noise tends to mask the wind farm noise. The reason for no difference between AM depth in the daytime and night-time is that the data were filtered into one third octave bands, thus the influence of the background noise was significantly reduced. On average, AM occurred 25% of the night-time at both residences (Figure 7c and d). AM density at night-time was much higher than during the daytime. In fact, it has been shown that the wind shear in the rotor plane is greater during the night-time than the daytime (Zajamšek et al. 2016). Therefore, the increased wind shear during the night could be a reason why AM is dominant in the night-time. It has been found that the percentage of AM occurrences for both daytime and night-time at the Waterloo wind farm was higher in comparison with the Hallett wind farm, ( Figure 7c and d).
0 1 2 3 4 5 6 7 8 9 10 11 12 13 14 15Wind speed, m/s
0
2
4
6
8
10
12
14
AM d
epth
, dB
0 20 40 60 80 100Wind farm power output, %
0
2
4
6
8
10
12
14
AM d
epth
, dB
Hallett-VWaterloo
a b
Proceedings of ACOUSTICS 2018 7-9 November 2018, Adelaide, Australia
ACOUSTICS 2018 Page 9 of 10
Figure 7: Comparison between the number and percentage of occurrences of AM during the night-time (from
11pm to 7am) and daytime (from 7am to 11pm). a, b, AM depth at night-time versus day time. c, d, AM density at night-time and daytime which is calculated by the number of AM events occurring at night or day time divided by the total 10-minute data sets.
5 CONCLUSION This paper presented a modified version of the IOA “Reference Method” to quantify and characterize wind farm AM. The performance of the proposed method showed through a ROC analysis, using spectrogram to classify the presence or absence of AM events. It has been found that removing the A-weighting, changing the range of band-pass filter frequency and reducing the prominence ratio from 4 to 3 are necessary to improve the perfor-mance of the IOA “Reference Method”. The differences between the Hallett-V and Waterloo wind farm such as turbine size and the rated power could influence on the AM depth determined at two wind farms. However, a further investigation on a large data by using a regression analysis is necessary for supporting these arguments. There is also not clearly shown the relationship between the AM depth, wind speed and wind farm power output. It has been found that AM is more likely to occur when the wind turbines are operating significantly below their maximum rated power. Due to the low level of background noise during the night-time and the increased wind shear during the night, AM density at night-time (approximately 25%) is much higher than during the daytime (around 15%) for both wind farms. Additionally, AM occurs more often at the Waterloo wind farm than at Hallett-V wind farm. There are some limitations of this study. Regarding the modified method, there is no evidence to suggest that analysis using a narrow bandwidth or larger bandwidth is more representative of AM perceived by humans and further listening tests are required to determin the most appropriate bandwidth for analysis. Furthermore, the characteristics of AM quantified in this study are based on a small data set (around one-month data collection period), and thus a further investigation on a large data set is necessary for accurately quantifying AM.
3 4 5 6 7 8AM depth, dB
0
10
20
30
40
50
60
No. o
f AM
eve
nts
Night-time Day time0
5
10
15
20
25
30
AM d
ensit
y, %
4 6 8 10 12AM depth, dB
0
5
10
15
20
No. o
f AM
eve
nts
Night-time Day time0
5
10
15
20
25
30
AM d
ensit
y, %
Waterloo wind farmHallett V wind farm
Day time
Night-timeDay time
Night-time
a
c
b
d
σ = 0.6mean = 5.15
σ = 0.73
mean = 7.9σ = 1.1
mean = 8.1σ = 1.5
AM density = AM events total 10-minute periods
Proceedings of ACOUSTICS 2018 7-9 November 2018,
Adelaide, Australia
Page 10 of 10 ACOUSTICS 2018
ACKNOWLEDGEMENTS
Financial support from the Australian Research Council, Project DP120102185, is gratefully acknowledged. The authors also extend their thanks to the mechanical and electrical workshop staff at the University of Adelaide. We are also grateful to the rural residents in South Australia who participated in this study.
REFERENCES 389-7, ISO. 2005. "Acoustics—Reference zero for the calibration of audiometric equipment—Part 7: Reference
threshold of hearing under free-field and diffuse-field listening conditions." Geneva: International Organization for Standardization.
AMWG. 2015. Methods for rating amplitude modulation in wind turbine noise. Institute of Acoustics Noise Working Group (Wind Turbine Noise): Amplitude Modulation Working Group.
AMWG. 2016. A Method for Rating Amplitude Modulation in Wind Turbine Noise. UK Institute of Acoustics. Bowdler, Dick. 2008. "Amplitude modulation of wind turbine noise: a review of the evidence." Institute of Acoustics
Bulletin 33 (4):31-41. Fawcett, Tom. 2006. "An introduction to ROC analysis." Pattern recognition letters 27 (8):861-874. Fukushima, Akinori, Kazuhiro Yamamoto, Hideo Uchida, Shinichi Sueoka, Tomohiro Kobayashi, and Hideki
Tachibana. 2013. "Study on the amplitude modulation of wind turbine noise: Part 1–Physical investigation." Proc. Inter-noise.
Hansen, Colin H, Con J Doolan, and Kristy L Hansen. 2017. Wind farm noise: measurement, assessment, and control: John Wiley & Sons.
Hansen, K. L., B. Zajamsek, and C. H. Hansen. 2017. "The Occurrence of Nocturnal Wind Farm Rumbling Noise." 7th International Conference on Wind Turbine Noise.
Hansen, Kristy, Branko Zajamsek, and Colin Hansen. 2013. "Analysis of unweighted low frequency noise and infrasound measured at a residence in the vicinity of a wind farm." Australian Acoustical Society, Proceedings of Acoustics.
Ioannidou, Christina, Sébastien Santurette, and Cheol-Ho Jeong. 2016. "Effect of modulation depth, frequency, and intermittence on wind turbine noise annoyance." The Journal of the Acoustical Society of America 139 (3):1241-1251.
Larsson, Conny, and Olof Öhlund. 2014. "Amplitude modulation of sound from wind turbines under various meteorological conditions." The Journal of the Acoustical Society of America 135 (1):67-73.
Lee, Seunghoon, Kyutae Kim, Wooyoung Choi, and Soogab Lee. 2011. "Annoyance caused by amplitude modulation of wind turbine noise." Noise Control Engineering Journal 59 (1):38-46.
McCabe, J. 2011. "Detection and quantification of amplitude modulation in wind turbine noise." Fourth International Meeting on Wind Turbine Noise.
Paulraj, Thileepan, and Petri Välisuo. 2017. "Effect of wind speed and wind direction on amplitude modulation of wind turbine noise." INTER-NOISE and NOISE-CON Congress and Conference Proceedings.
Pedersen, Eja, and Kerstin Persson Waye. 2004. "Perception and annoyance due to wind turbine noise—a dose–response relationship." The Journal of the Acoustical Society of America 116 (6):3460-3470.
Suzlon. 2018. "S88 - 2.1 MW TECHNICAL OVERVIEW." https://www.thewindpower.net/turbine_en_222_suzlon_s88-2100.php.
UK, Renewable. 2013a. The development of a penalty scheme for amplitude modulated wind farm noise: description and justification. Renewable UK.
UK, Renewable. 2013b. Wind turbine amplitude modulation: research to improve understanding as to its cause & effect. Renewable UK.
Van den Berg, G. 2005. "Mitigation measures for night-time wind turbine noise." Wind Turbine Noise, Berlin. Vestas. 2004. General Specification for V90 – 3.0 MW. Yokoyama, Sakae, Shinichi Sakamoto, and Hideki Tachibana. 2013. "Study on the amplitude modulation of wind
turbine noise: part 2-Auditory experiments." INTER-NOISE and NOISE-CON Congress and Conference Proceedings.
Zajamšek, Branko, Kristy L Hansen, Con J Doolan, and Colin H Hansen. 2016. "Characterisation of wind farm infrasound and low-frequency noise." Journal of Sound and Vibration 370:176-190.