characterizing land condition variability in northern china from 1982 to 2011
TRANSCRIPT

ORIGINAL ARTICLE
Characterizing land condition variability in Northern Chinafrom 1982 to 2011
Youzhi An • Wei Gao • Zhiqiang Gao
Received: 30 May 2013 / Accepted: 28 November 2013
� Springer-Verlag Berlin Heidelberg 2013
Abstract For the last three decades, Northern China has
been considered as one of the most sensitive areas
regarding global environmental change. The integration of
AVHRR GIMMS and MODIS NDVI data (1982–2011), of
which for the overlapping period of 2000–2006 show good
consistency, were used for characterizing land condition
variability. The trends of standardized annually RNDVI,
temperature, precipitation and PDSI were obtained using a
linear regression model. The results showed that Northern
China has a general increase in greenness for the period
1982–2011 (a = 0.05). Also, annually RNDVI is signifi-
cantly correlated with temperature and precipitation data at
the regional scale (p \ 0.05), implying that temperature
and precipitation are the dominant limiting factors for
vegetation growth. Since the greening is not uniform,
factors other than temperature and precipitation may con-
tribute to greening in some areas, while the grassland and
cropland ecosystem are becoming increasingly vulnerable
to drought. The results of trend analysis indicate that
greenness seems to be evident in most of the study areas.
Keywords NDVI � Land degradation � Linear trend
analysis � Climate change
Introduction
Land degradation and desertification have become
increasingly severe environmental and socio-economic
problems throughout the world. According to the United
Nations Convention to Combat Desertification (UNCCD
1994), desertification is defined as ‘‘land degradation in
arid, semi-arid and dry sub-humid areas resulting from
various factors, including climatic variations and human
activities’’. Two crucial factors related to the cause of land
degradation are water availability and biome availability.
Climate change and other reasons (such as topography) can
lead to precipitation changes which subsequently affect
vegetation productivity which is additionally deteriorated
by human activities such as forestation or deforestation.
Although the causes of land degradation in Northern China
are now nearly consistent, the discussion of the relative
importance of climate change versus human activities
remains a contentious dispute issue (Yang et al. 2005;
Wang et al. 2008).
Problems of land degradation and desertification have
been identified worldwide, e.g. Africa south of the equator,
South-East Asia and south China, north-central Australia,
the Pampas and swaths of the Siberian and North American
taiga (Bai et al. 2008). China is one of the most seriously
affected countries by land degradation and desertification,
as a result of intense meteorological phenomenon such as
sandstorms, especially in Northern China (Wang et al.
2008). So, it is very important to combat desertification in
Northern China. Recent studies have suggested mixed
trends of vegetation in Northern China, in selected case
Y. An � W. Gao
Key Laboratory of Geographic Information Science, Ministry
of Education, East China Normal University, Joint Laboratory
for Environmental Remote Sensing and Data Assimilation,
ECNU and CEODE, CAS, Shanghai 20062, China
e-mail: [email protected]
W. Gao
Natural Resource Ecology Laboratory, Colorado State
University, Fort Collins, CO 80523, USA
Z. Gao (&)
Yantai Institute of Coastal Zone Research, Chinese Academy
of Science, Yantai 264003, China
e-mail: [email protected]
123
Environ Earth Sci
DOI 10.1007/s12665-013-2987-6

studies (Liu et al. 2010; Cao et al. 2011; Zhu et al. 2011;
Mu et al. 2012; Wang et al. 2012), at a national scale (Yang
et al. 2005; Wang et al. 2008; Bai and Dent 2009; Xu et al.
2012) and even at continental to global scale (Bai et al.
2008; Piao et al. 2011; Fensholt et al. 2012). By the end of
2009, China had a total desertification land area of
2,623,700 km2 accounting for 27.33 % of the national
territory and distributed in 508 counties (banners, county-
level cities) of 18 provinces (autonomous regions, munic-
ipalities) of China, i.e. Beijing, Tianjin, Hebei, Shanxi,
Inner Mongolia, Liaoning, Jilin, Shandong, Henan, Hainan,
Sichuan, Yunnan, Tibet, Shaanxi, Gansu, Qinghai, Ningxia
and Xinjiang (State Forestry Administration 2011).
Over the past 30 years, satellite data have been widely
used to characterize the changes in land condition vari-
ability. The normalized difference vegetation index
(NDVI), as a data for assessing spatio-temporal change of
variables related to vegetation greenness and land degra-
dation, has been extensively used at a regional or global
scale (Symeonakis and Drake 2004; Olsson et al. 2005;
Hickler et al. 2005; Fensholt et al. 2012). Remotely sensed
imagery is available in time series with medium to coarse
spatial resolution for vegetation dynamics. So far, some
case studies using NDVI time series data acquired by a
variety of satellite sensors have been conducted for tem-
poral analysis, e.g. Advanced Very High Resolution
Radiometer (AVHRR) Global Inventory Modeling and
Mapping Studies (GIMMS) NDVI dataset (Nemani et al.
2003; de Jong et al. 2011; Huber et al. 2011; Fensholt et al.
2012; Mao et al. 2012), the Spinning Enhanced Visible and
Infrared Imager (SEVIRI) sensor onboard the geostationary
satellite Meteosat Second Generation (MSG) (Fensholt
et al. 2006), VEGETATION sensor onboard the SPOT
satellites (SPOT/VGT) based NDVI (Liu et al. 2010;
Martınez et al. 2011; Yin et al. 2011; Dong et al. 2011;
Zhang et al. 2013), moderate resolution imaging spectro-
radiometer sensor on board the Terra platform (MODIS/
Terra) (Fensholt et al. 2009; Yao et al. 2011; Mu et al.
2012; Tian et al. 2012) and others (e.g. Hyperion) (Zhang
et al. 2012). The AVHRR GIMMS NDVI time series have
dominated the field of large-scale monitoring of vegetation
due to the long time series available (Begue et al. 2011;
Fensholt et al. 2012). For the purposes of this study, time
series of the AVHRR GIMMS NDVI (1982–2006) and
Terra MODIS NDVI (2007–2011) are selected to obtain
the integrated 30 years long time series data.
In this study, we will investigate the land condition
variability in Northern China using annually RNDVI and
climatic data. Our purpose is to: (1) provide satellite-based
observation evidence of recent land condition variability in
semi-arid and arid regions of the Northern China; and (2)
analyze the spatio-temporal relationships between annually
RNDVI and annual climatic data anomalies.
Data and methods
Study area
The study area spans 31�–54�N in latitude and 73�–136�E
in longitude with a total area of 499.5 km2. Administra-
tively, Northern China includes 13 provinces of Hei-
longjiang, Jilin, Liaoning, Inner Mongolia, Beijing,
Tianjin, Hebei, Shanxi, Shaanxi, Ningxia, Gansu, Qinghai
and Xinjiang (Fig. 1). The whole Northern China region is
divided into three zones (Northeast China, North China and
Northwest China) (Fig. 1). The climate is dominantly
semi-arid with annual precipitation ranging from 15 to
1,146 mm (mean annual precipitation of 382 mm) while
most precipitation volume occurs during the months June
to September. The environment in this region is vulnerable
to climate variability due to intense interannual variations
in precipitation.
Satellite data
AVHRR GIMMS 15-day composite NDVI data
The widely used AVHRR GIMMS NDVI data product
with a spatial resolution of 8 9 8 km was selected in this
study from 1982 to 2006. Data were acquired from the
Global Land Cover Facility (http://www.landcover.org/
data/gimms/). The dataset is derived from imagery
obtained from the AVHRR instrument onboard the NOAA
satellite series 7, 9, 11, 14, 16 and 17. The NDVI dataset
has been corrected for calibration, view geometry, volcanic
aerosols, and other effects not related to vegetation change,
as well as, for atmospheric corrections (Tucker et al. 2005).
Only AVHRR GIMMS NDVI pixels with good value
(flag = 0) are included for correlation analysis with MO-
DIS NDVI data to construct a long time series (1982–2011)
for trend analysis.
Terra MODIS monthly composite NDVI data
The MODIS onboard the Earth Observation System (EOS)
Terra satellites were launched on December 1999. Many of
MODIS data products (e.g. NDVI) have a great advantage
in a wide range of scientific research from the medium to
large scale. The MOD13C2 data covering from 2000 to
2011 were downloaded from the USGS Land Processes
Distributed Active Archive Center (LP DAAC, http://lads
web.nascom.nasa.gov/data/search.html). The MOD13C2
(collection 5) data are 0.05� monthly product which is
generated using the gridded monthly 1-km MODIS NDVI
product (MOD13A3), and temporally aggregated using a
weighted average to create a calendar-month composite
(Solano et al. 2010). The MOD13C2 vegetation product
Environ Earth Sci
123

contains a data quality assessment product (QA-data) that
holds information on the overall usefulness and cloud
conditions on a per-pixel basis. More specific explanations
of MOD13C2 VI pixel reliability can be found at
MODIS_UsersGuide (Solano et al. 2010).
Climatic data
The precipitation and temperature data were offered by the
Climate Research Unit (CRU), University of East Anglia,
UK. CRU dataset used an interpolation method based on
the set of stations available for monthly precipitation and
temperature (Mitchell and Jones 2005), which is provided
as a monthly sum at a 0.5� 9 0.5� spatial resolution for the
period 1901–2011. The CRU precipitation and temperature
dataset cover the full period of the integrated 30 years long
time series data. Several global datasets provide spatially
disaggregated estimates of precipitation for Northern
China, e.g. GPCP (Global Precipitation Climatology Pro-
ject) with a 2.5� 9 2.5� coarse spatial resolution. In this
study, monthly accumulated precipitation and temperature
data derived from CRU were used and this dataset has also
been used in many studies (Hellden and Tottrup 2008; Piao
et al. 2011; Xu et al. 2012).
The Palmer Drought Severity Index (PDSI) data are pop-
ular in the meteorological, agricultural and hydrological
drought studies and also include runoff and soil moisture. In
this study, monthly PDSI data at a 2.5� 9 2.5� spatial reso-
lution for the period 1982–2006 were obtained from the
University Corporation for Atmospheric Research (Dai 2011).
Land cover data
Land covers data (MCD12Q1-IGBP 2009) are shown in
Fig. 2 as a reference for further analyzed RNDVI for dif-
ferent land cover classes. Also, land cover data with a
500 m resolution have been resampled into a geographic
type of approximately 8 9 8 km resolution in order to
match with RNDVI.
Data processing methods
Data post-processing
Impacts of land degradation lead to losses in land pro-
ductivity. A simple method uses annually integrated
NDVI (RNDVI) as a proxy for vegetation productivity
(Fensholt and Rasmussen 2011). The greenness indices
(RNDVI) which are one of the major driving forces for
biomass availability can perform adequately well as the
sensitive indicators of land condition variability (green-
ness and land degradation) in arid, semi-arid and dry sub-
humid areas (Prince et al. 1998; Bai et al. 2008; Bai and
Dent 2009; Fensholt and Rasmussen 2011). Also, annu-
ally summed precipitation, annually averaged temperature
and PDSI are used for the 26 years series of data (Xu
et al. 2012).
The analysis were restricted to include only those parts
of the study regions that had a long-term (1982–2011)
mean monthly NDVI value between 0.1 and 0.5 (Hellden
and Tottrup 2008). Because the low NDVI values in our
Fig. 1 Location of the study
area (where, Northeast China—
NE. China, North China—N.
China, Northwest China—NW.
China)
Environ Earth Sci
123

analysis would be uncertain. In order to further reduce the
influence from clouds, the original 15-day temporal reso-
lution AVHRR GIMMS NDVI data were aggregated
monthly by a maximum value composite approach (MVC).
MODIS NDVI products in HDF format were reprojected to
the WGS-84 coordinate system with nearest-neighbor
resampling method by the MODIS Reprojection Tool v4.0
(MRT) and saved as the GeoTIFF format for further ana-
lysis. Per-pixel QA information in both the AVHRR
GIMMS and MODIS NDVI products was used to remove
the NDVI data without confidence (contaminated by cloud
or snow/ice). Then, a simple temporal filter was applied to
gap-fill the missing integrating AVHRR GIMMS and
MODIS NDVI data (Xiao et al. 2003; Fensholt et al. 2009).
Owing to the lack of the first month Terra MODIS data in
the observation year 2000, the average values for the first
month of 2001–2011 are used to replace it. MODIS NDVI
data have been resampled to match the GIMMS NDVI
resolution by spatial averaging for calculating NDVI. For
comparing the trends of RNDVI and climatic data (pre-
cipitation and temperature), monthly NDVI and CRU cli-
matic data are converted into annual time series. Further,
CRU climatic data with a 0.5� resolution have been
resampled into a geographic type of * 8 9 8 km resolu-
tion to match with RNDVI.
Methodology
The time integrated NDVI and climatic data were stan-
dardized with Z-score method, which could be compared
across regions at the same scale (Hellden and Tottrup 2008;
Xu et al. 2012).
z ið Þ ¼ x ið Þ � lr
ð1Þ
where z(i) is the standardized result of NDVI or climatic
data, x(i) is the data to be standardized, l is the mean of the
data, r is the standard deviation of the data.
The trend of annually RNDVI and climatic data was
obtained from the linear regression model with time as the
independent variable while RNDVI and climatic data as the
dependent variable for the period 1982–2011. The linear
regression model is a simple and robust way to analyze
long-term trends in RNDVI and climatic data (Wang et al.
2010; Piao et al. 2011).
y ¼ aþ bt þ e ð2Þ
where y represents annually RNDVI, t is year or climate
variable, a and b are coefficients, and e is the residual error.
The non-parametric Mann–Kendall (MK) significance
method has been commonly applied to the time series trend
test for the vegetation (Fensholt et al. 2009; Tabari et al.
2011), so it was used to test the time series trends in this
study. The MK test statistic S is calculated using the
formula:
S ¼Xn�1
k¼1
Xn
j¼kþ1
sgnðxj � xkÞ ð3Þ
where xj and xk are the annual values in years j and k, j [ k,
respectively. Where sgn is the sign function:
sgn xj � xk
� �¼
þ1 if xj � xk
� �[ 0
0 if xj � xk
� �¼ 0
�1 if xj � xk
� �\0
8<
: ð4Þ
Fig. 2 Land cover map of
Northern China for 2009.
Locations for further analyses
are overlaid
Environ Earth Sci
123

where variance Var(S) is calculated by
Var(SÞ ¼n n� 1ð Þ 2nþ 5ð Þ �
Pqp¼1 tp tp � 1
� �2tp þ 5� �h i
18
ð5Þ
where n is the number of data points, q is the number
of tied groups and tp denotes the number of ties of
extent p. The standard normal test statistic Z is computed
as
Z ¼
S�1ffiffiffiffiffiffiffiffiffiffiVar Sð Þp if S [ 0
0 if S ¼ 0Sþ1ffiffiffiffiffiffiffiffiffiffiVar Sð Þp if S\0
8><
>:ð6Þ
A positive slope (Z C 1.96) represents a significant
increase (a = 0.05) in RNDVI while negative slopes
(Z B -1.96) indicate a significant decrease (a = 0.05).
Results and discussions
Consistency test
On pixel-by-pixel basis, a high correlation between the
GIMMS NDVI dataset and the MODIS NDVI dataset for the
overlapping period 2000–2006 can be observed for most
areas across the study regions (Fig. 3a). Overall, the two data
have a good consistency for the selected region (Fig. 3b).
However, GIMMS NDVI displays higher peaks during the
growing season than MODIS NDVI. A scatterplot of
monthly observations of GIMMS and MODIS NDVI for
2,025 pixels selected randomly in Northern China (Fig. 3c)
shows high correlation (R2 = 0.92) and low RMSE
(RMSE = 0.072). The high positive correlation between the
GIMMS and MODIS NDVI dataset for the overlapping
period 2000–2006 gives confidence that a long time series of
NDVI trend is robust for 30 years (1982–2011).
Fig. 3 Consistency test for GIMMS and MODIS NDVI. a Map of
r values for monthly GIMMS NDVI correlated against monthly
MODIS NDVI (2000–2006). b Time series of monthly GIMMS and
MODIS NDVI (2000–2006) for selected regions (114.8�E, 43.0�N).
c Scatterplot of monthly GIMMS NDVI against monthly MODIS
NDVI (2000–2006) for 2025 pixels randomly selected in Northern
China (114.8�E, 43.0�N)
Environ Earth Sci
123
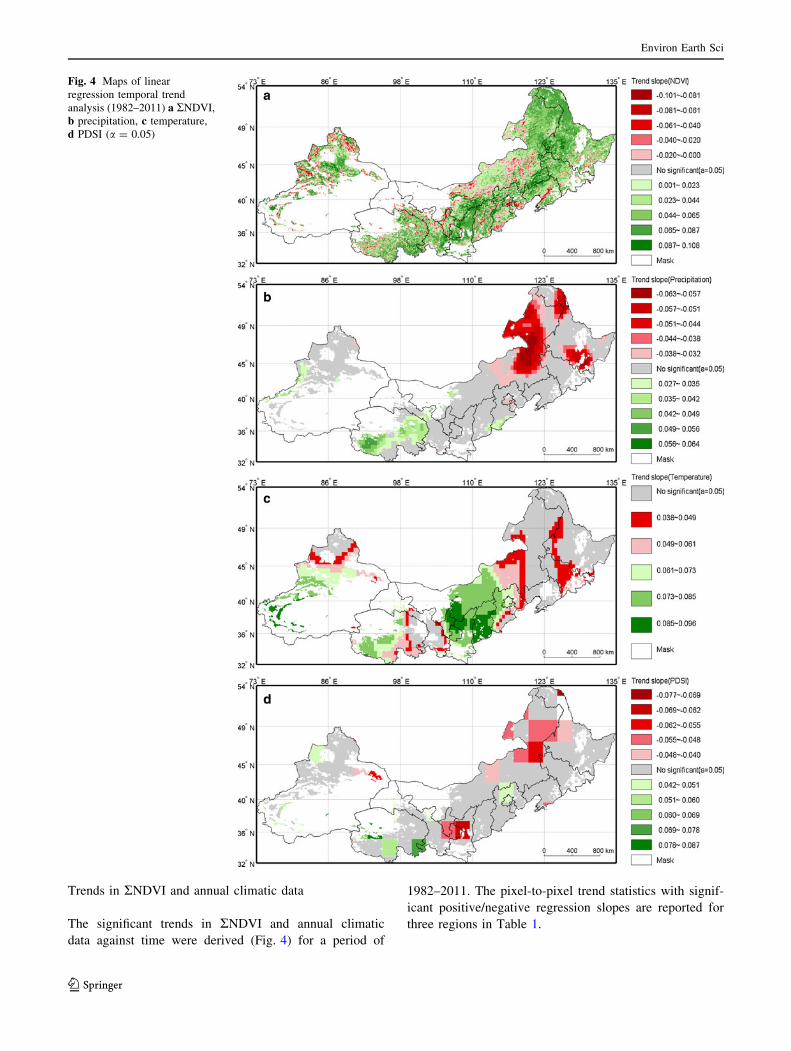
Trends in RNDVI and annual climatic data
The significant trends in RNDVI and annual climatic
data against time were derived (Fig. 4) for a period of
1982–2011. The pixel-to-pixel trend statistics with signif-
icant positive/negative regression slopes are reported for
three regions in Table 1.
Fig. 4 Maps of linear
regression temporal trend
analysis (1982–2011) a RNDVI,
b precipitation, c temperature,
d PDSI (a = 0.05)
Environ Earth Sci
123

Figure 4a shows the RNDVI trend estimated from the
linear regression of the full period (1982–2011) annual
time series in Northern China. A positive trend in RNDVI
indicates greenness, while a negative trend shows land
degradation. More than 42 % of the study area shows a
positive trend in RNDVI, and only 3.7 % of the study
area exhibits a statistically significant negative trend in
Table 1. Across all regions in the study, the significant
positive trend in RNDVI is found in most of the areas; the
greenness with a belt of high positive slope values across
Daxingan Mountains, eastern Liaoning, and the Loess
Plateau extends to the Qilian Mountains and southern
Qinghai, and Xinjiang, Tianshan Mountains. But local
land degradation was found in Liao River Plain, Inner
Mongolia, Beijing, Tianjin, Hebei southern, central
Shanxi, and Xinjiang. So a general ‘‘greening up’’ in
RNDVI can be observed over most of the Northern China
for the period 1982–2011. A similar result is also found
by other studies (de Jong et al. 2011; Fensholt et al. 2012;
Xu et al. 2012).
From the maps of the annual sums of precipitation trend
analysis (Fig. 4b), most of the region does not change
significantly in annual precipitation over most of the
Northern China for the period 1982–2011. A significant
increase in Qinghai Province and a significant reduction in
the northern Inner Mongolia and Heilongjiang Province
can be found. A significant positive trend in the annual
sums of precipitation was found for a total of 3.0 % in the
Northern China with large differences in different regions
(0.3 % in NE China, 0.4 % in N China and 6.9 % in NW
China), whereas 12.8 % (14.2 % in NE China, 25.6 % in N
China and 0.0 % in NW China) of the pixels being char-
acterized by negative significant trends at a 5 % confidence
level. In fact, there is recent evidence of change in pre-
cipitation since the 1960s (Piao et al. 2011; Song et al.
2011).
The spatial distribution of temperature linear regression
temporal trend is presented in Fig. 4c. Most study regions
in Table 1 show greater and statistically significant
increases (53.8 %) in temperature. Particularly, the Loess
Plateau region experiences greater warming than other
regions. The increased greenness feedback is important,
and most studies that discuss these findings are very
important in arid and semi-arid regions (Wang et al. 2010;
Peng et al. 2011). Furthermore, Piao et al. (2011) find that
increasing temperature could enhance spring and autumn
greenness because of the sensitivity of temperature to
vegetation growth in spring and autumn.
Figure 4d displays the linear regression temporal trend
of PDSI. The result in Table 1 shows more areas
decreasing (12.7 %) than increasing (6.6 %), which is
relatively similar to precipitation for most of study areas,
both statistically and spatially. The results described by
Xu et al. (2012) and Mohammat et al. (2012) were asso-
ciated with the PDSI trends in the study areas.
All four indexes show a mixed trend during the study
periods. As shown in Fig. 4b and d, the result leads to
drought trend information in Fig. 4d more consistent with
Fig. 4b. The temperature shows a dramatic increase during
1982–2011. Comparatively, areas of significant changes in
precipitation and PDSI are mainly distributed in Inner
Mongolia and Qinghai Province, which appear to some-
what increase, although the area of the increase is little.
The trend regression slope value statistics calculated per
land cover class for pixels are provided in Table 2. Since
few pixels are in the land cover classes ‘‘evergreen
broadleaf forest’’ and ‘‘savannas’’, so they are incorporated
into the land cover classes ‘‘evergreen forest’’ and ‘‘woody
Table 1 Trend statistics for RNDVI, annual precipitation, tempera-
ture, and PDSI linear trend analysis 1982–2011 (a = 0.05)
Number of observations NE
China
N
China
NW
China
Northern
China
Total pixels (n) RNDVI
mean between 0.1 and 0.5
15,617 26,787 28,638 71,042
RNDVI positive regression
slope (n)
7,225 9,843 13,321 30,389
RNDVI negative regression
slope (n)
486 766 1,392 2,644
RNDVI positive regression
slope (%)
46.3 36.7 46.5 42.8
RNDVI negative regression
slope (%)
3.1 2.9 4.9 3.7
Precipitation positive
regression slope (n)
44 117 1,986 2,147
Precipitation negative
regression slope (n)
2,212 6,860 0 9,072
Precipitation positive
regression slope (%)
0.3 0.4 6.9 3.0
Precipitation negative
regression slope (%)
14.2 25.6 0.0 12.8
Temperature positive
regression slope (n)
1,440 15,898 20,862 38,200
Temperature negative
regression slope (n)
0 0 0 0
Temperature positive
regression slope (%)
9.2 59.3 72.8 53.8
Temperature negative
regression slope (%)
0 0 0 0
PDSI positive regression
slope (n)
0 1,153 3,551 4,704
PDSI negative regression
slope (n)
1,295 4,790 2,924 9,009
PDSI positive regression
slope (%)
0.0 4.3 12.4 6.6
PDSI negative regression
slope (%)
8.3 17.9 10.2 12.7
Environ Earth Sci
123

savannas/savannas’’ in the statistical analysis, respectively.
Different types of land cover classes have an impact on the
linear slope values of RNDVI trends. Overall, the green-
ness in all vegetation types significantly increases
(a = 0.05). Land cover class ‘‘deciduous needleleaf forest’’
has the highest regression slope mean values (0.068) fol-
lowed by ‘‘mixed forest’’ (0.064), ‘‘woody savannas/sav-
annas’’ (0.062), and ‘‘cropland/natural vegetation mosaic’’
(0.062). Land cover class ‘‘barren or sparsely vegetated’’
has the lowest regression slope mean values (0.037). Also,
a regression slope standard deviation value of 0.055 indi-
cates very large interclass variations.
The relationship of RNDVI and annual climatic data
The correlation values between annually RNDVI and pre-
cipitation for the period 1982–2011 are shown in Fig. 5a.
Histogram shows correlation coefficients calculated
between RNDVI and precipitation for Northern China
(Fig. 6a). The Pearson correlation coefficient indicates the
relationship between RNDVI and precipitation for the
studied time period ranged from -0.667 to 0.799. RNDVI
and precipitation were positively correlated, and high
correlation coefficient areas are mainly located in central
Inner Mongolia, central Gansu, and Northern Xinjiang.
Negatively related areas are mainly distributed in parts of
Heilongjiang Province, Inner Mongolia and Qinghai
Province. RNDVI versus precipitation significant r value
only counts for 13.1 % in the whole Northern China
(Figs. 5a, 6a). Several previous studies have shown a
positive relationship between RNDVI and precipitation
(Hellden and Tottrup 2008; Duan et al. 2011; Mu et al.
2012; Bayramov et al. 2012).
The spatial correlation map and histogram between
RNDVI and temperature are shown in Figs. 5b and 6b. The
strongest correlations are obtained between RNDVI and
temperature during the three decades, with the largest
increases found for the Loess Plateau, Qinghai and
Southern Xinjiang. The increased greenness in the Loess
Plateau appears to be influenced more by increases in
temperature. This has been discussed in a number of
studies (Piao et al. 2011; Peng et al. 2011; Duan et al. 2011;
Liu et al. 2011; Mao et al. 2012).
A correlation analysis (Fig. 5c) was conducted to further
examine RNDVI–PDSI relationships. Figure 6c illustrates
the histogram between RNDVI and PDSI for Northern
China. It was found that the positive correlation coeffi-
cients are relatively high at approximately 95 % confidence
level. Evidence has recently indicated that there is land
degradation caused by drought in the study areas (Mo-
hammat et al. 2012; Liu and Wang 2012).
From the correlation analysis in Northern China, it has
been suggested that increase in temperature and precipi-
tation could enhance vegetation growth, especially the
grassland and cropland ecosystem, while PDSI is also an
important limiting factor for vegetation growth.
RNDVI versus climatic data anomaly slope trend
analysis
To further analyze the time series trend consistency of
RNDVI and annual climatic data in different sub-regions,
scatterplots of the regression slope values from annually
RNDVI and climatic data are subdivided into three zones
(Northeast China, North China and Northwest China show
in Fig. 1) (Fig. 7) to investigate the consistency in
regression slope value at regional scale (a = 0.05). The
four quadrangles (from one to four) in each regional plot
represent positive precipitation, temperature, PDSI and
RNDVI z-score slope trend; positive RNDVI but negative
precipitation, temperature, PDSI z-score slope trend; neg-
ative RNDVI and precipitation, temperature, PDSI z-score
Table 2 Trend statistics for RNDVI linear trend analysis 1982–2011 (a = 0.05) for major land cover classes (IGBP)
Land cover class (IGBP) RNDVI
(n) (a = 0.05)
RNDVI
slope [0 (%)
RNDVI
slope \0 (%)
RNDVI slope
value mean
RNDVI standard
deviation
Evergreen forest 270 89.6 10.4 0.058 0.042
Deciduous Needleleaf forest 684 99.9 0.1 0.068 0.007
Deciduous broadleaf forest 618 95.3 4.7 0.061 0.029
Mixed forest 2,534 97.2 2.8 0.064 0.024
Closed shrublands 424 93.9 6.1 0.061 0.035
Open shrublands 1,170 87.4 12.6 0.051 0.045
Woody savannas/savannas 653 94.6 5.4 0.062 0.033
Grasslands 13,983 92.6 7.4 0.058 0.036
Croplands 8,904 94.1 5.9 0.061 0.034
Cropland/natural vegetation mosaic 2,056 95.1 4.9 0.062 0.030
Barren or sparsely vegetated 2,181 77.2 22.8 0.037 0.055
Environ Earth Sci
123

slope trend; positive precipitation, temperature, PDSI but
negative RNDVI z-score slope trend, respectively. For
pixels with good agreement between RNDVI and climatic
data trends of scatterplots should be located in the first and
third quadrants. However, Northern China and the three
sub-regions are characterized by an increase or decrease
from RNDVI, precipitation, temperature and PDSI anom-
aly trends (Fig. 7a–c). Precipitation and PDSI in North
China show a decreasing trend, while RNDVI trends keep
increasing (Fig. 7a, c). The vegetation response to precip-
itation and PDSI in Northwest China is more obvious than
other regions. But for the entire Northern China region, the
vegetation mainly showed positive greening trends. Only in
a small part of the region vegetation decreases with
increasing precipitation and PDSI. This implies that these
areas are subject to land degradation, even desertification.
Figure 7b shows that there are pronounced changes of
positive RNDVI versus temperature in North and Northeast
China. Precipitation decreases in North and Northeast
China while greenness still increases partly due to tem-
perature increase. A large area of vegetation greenness
increase caused by warming and increased precipitation
can be observed in Northwest China; however, warming
contribution to vegetation greenness is larger (Fig. 7a, b).
Though warming plays an important role in increasing
vegetation greenness, the cooling effects of vegetation
were found in few areas. This means that the greening in
some areas can be explained by increasing temperature and
Fig. 5 Correlation coefficients of linear regression trend analysis for annually observations of a RNDVI and precipitation, b RNDVI and
temperature, c RNDVI and PDSI (1982–2011)
Environ Earth Sci
123

precipitation as dominant factors. The results also suggest
that the grassland and cropland ecosystem are becoming
increasingly vulnerable to drought.
Many recent studies have documented a similar green-
ing trend in Northern China since the early 1980s (Duan
et al. 2011; de Jong et al. 2011; Fensholt et al. 2012; Xu
et al. 2012). The results are supported by findings in this
study that the Northern China has been characterized by a
general increase in greenness for the period 1982–2011.
Some other possible factors could be: (1) afforestation e.g.
China has made some effort and launched a series of key
national ecological engineering projects, such as the Three-
North Shelterbelt Project (1978–present), Beijing and
Tianjin Sandstorm Source Treatment Project (2001–2010),
Returning Farmlands to Forest Project (2003–present),
and Returning Grazing Land to Grassland Project (2003–
present) (State Forestry Administration 2011; Wang et al.
2011, 2013). (2) Additional plausible explanations may
include improved soil and water management, expansion of
irrigation, rural exodus, changes in the use of fertilizer in
cultivated areas and land reclamation (State Forestry
Administration 2011; Fensholt et al. 2012).
However, land degradation is caused by different driv-
ing forces such as human activity pressure and adverse
climatic effects. From previous studies, improper agricul-
tural practices, overgrazing, mining, deforestation, and
urbanization are the main human-made causes of land
degradation or desertification (Li et al. 2006; Bai et al.
2008; Bai and Dent 2009; State Forestry Administration
2011).
Comparison of RNDVI versus climatic data anomaly
for selected areas
Annually standardized RNDVI, annual precipitation, tem-
perature, and PDSI (average of a 3 9 3 grid cell window
covering each year) from 1982 to 2011 are shown as time
series in Fig. 8 for four selected locations corresponding to
the four quadrants of Fig. 7. For all four locations the
center coordinates are given. According to the results of the
IGBP, the land cover of the locations 1, 2, 3 and 4 are
cropland, frost, grassland, and grassland, as indicated in
Fig. 2. Location 1 is in the west of Xinjiang Province
(80.8�E, 42.7�N) and shows an increasing RNDVI trend
respond to annual precipitation, temperature, and PDSI.
The land cover of location 1 is ‘‘croplands’’. Although the
location 1 has little precipitation and drought for a long
time, the precipitation increases in recent years and vege-
tation turns green significantly. Location 2 (100.7�E,
36.9�N) is classified as ‘‘mixed forest’’ and characterized
by a significant increase in RNDVI while drought
stress strengthened with warming significantly decreased
Fig. 6 Histograms of correlation coefficients calculated between
a RNDVI and precipitation, b RNDVI and temperature, c RNDVI and
PDSI (p \ 0.05)
Environ Earth Sci
123

precipitation. Location 3 is in a region dominated by
grassland (land cover class ‘‘grasslands’’) in the center of
Inner Mongolia (117.4�E, 45.3�N). There is a good
agreement trend between RNDVI and precipitation. This
indicates that RNDVI change in the location 3 is dominated
by precipitation similar to location 1. The land cover of
location 4 (120.9�E, 47.8�N) in the East of the Qinghai
Lake is same as the location 3. That NDVI decrease with
decreasing temperature in recent years shows that the
location 4 is experiencing cooling effects. This analysis
highlighted that the vegetation greenness change in the
location 4 is dominated by temperature.
Fig. 7 Density scatterplot of a RNDVI versus annual precipitation, b RNDVI versus temperature, c RNDVI versus PDSI linear trend regression
slope values for the period of 1982–2011 (a = 0.05)
Environ Earth Sci
123

Conclusion
Time-integrated NDVI (RNDVI) from the GIMMS and
MODIS NDVI time series data provided a reasonable
estimate of total biomass produced in response to precipi-
tation in Northern China. Based on these data, character-
izing land condition has become complex with regions of
both positive trends and mixed trends in Northern China.
However, strong increase in greenness was observed over
large areas of the Northern China during the period of
1982–2011 from the NDVI data. The significant greenness
with a belt of high positive slope values across Daxingan
Mountains, eastern Liaoning, and the Loess Plateau
extends to the Qilian Mountains and southern Qinghai, and
Xinjiang, Tianshan Mountains. Local land degradation was
found in Liao River Plain, Inner Mongolia, Beijing, Tian-
jin, Hebei southern, central Shanxi, and Xinjiang. This
study shows that the strong increase in greenness trend of
vegetation over the past three decades across the Northern
China could be explained by increasing temperature and
precipitation. However, the grassland and cropland eco-
system are becoming increasingly vulnerable to drought.
The increase or decrease in the RNDVI cannot be
explained by climatic factors may be the consequence of
human activities.
However, the greenness and potential of desertification
are influenced by the synthetic interaction of climate fac-
tors and human activities. Such a coarse resolution remote
sensing imagery like AVHRR GIMMS NDVI is suitable
for monitoring land cover changes at relatively large scales
Fig. 8 Average Z-scores (expressed as standard deviations) of
RNDVI, annual precipitation, temperature, and, PDSI corresponding
to the four quadrants of Fig. 6. The RNDVI, annual precipitation,
temperature, and PDSI values for the selected four locations are the
average of a 3 9 3 grid cell window covering each year
Environ Earth Sci
123
while it has a limited explanatory power for a smaller scale.
High resolution data (e.g. Landsat TM/ETM ? images)
and other factors (e.g. snow, runoff, evapotranspiration,
water shortage, etc.) are needed as auxiliary to enhance our
understanding of these trends.
Acknowledgments This paper was supported by Key Research
Program of the Chinese Academy of Sciences (Grant No. KZZD-EW-
14), National Natural Science Foundation of China (41071278
and 41171334), Ecological Innovation and Breeding Project
(Y254021031, 355031061), USDA NIFA Project (2010-34263-
21075). The authors thank GIMMS (the NASA Global Inventory
Modeling and Mapping Studies) group and NASA/MODIS Land
Discipline Group for sharing the GIMMS NDVI and MODIS LAND
data. We would like to the comments from the anonymous reviewers,
which helped to improve this manuscript.
References
Bai ZG, Dent D (2009) Recent land degradation and improvement in
China. AMBIO 38(3):150–156
Bai ZG, Dent DL, Olsson L, Schaepman ME (2008) Proxy global
assessment of land degradation. Soil Use Manage 24(3):223–234
Bayramov E, Buchroithner MF, McGurty E (2012) Determination of
main climate and ground factors controlling vegetation cover
regrowth along oil and gas pipelines using multiple, spatial and
geographically weighted regression procedures. Environ Earth
Sci 66(7):2047–2062
Begue A, Vintrou E, Ruelland D, Claden M, Dessay N (2011) Can a
25-year trend in Soudano-Sahelian vegetation dynamics be
interpreted in terms of land use change? A remote sensing
approach. Glob Environ Chang 21(2):413–420
Cao XM, Chen X, Bao AM, Q W (2011) Response of vegetation to
temperature and precipitation in Xinjiang during the period of
1998–2009. JAL 3(2):94–103
Dai A (2011) Characteristics and trends in various forms of the
Palmer Drought Severity Index during 1900–2008. J Geophys
Res (1984–2012) 116:D12115
de Jong R, de Bruin S, de Wit A, Schaepman ME, Dent DL (2011)
Analysis of monotonic greening and browning trends from
global NDVI time-series. Remote Sens Environ 115(2):692–702
Dong J, Tao F, Zhang G (2011) Trends and variation in vegetation
greenness related to geographic controls in middle and eastern
Inner Mongolia China. Environ Earth Sci 62(2):245–256
Duan H, Yan C, Tsunekawa A, Song X, Li S, Xie J (2011) Assessing
vegetation dynamics in the three-north shelter forest region of
China using AVHRR NDVI data. Environ Earth Sci 64(4):
1011–1020
Fensholt R, Rasmussen K (2011) Analysis of trends in the Sahelian
‘rain-use efficiency’ using GIMMS NDVI, RFE and GPCP
rainfall data. Remote Sens Environ 115(2):438–451
Fensholt R, Sandholt I, Stisen S, Tucker C (2006) Analysing NDVI
for the African continent using the geostationary meteosat
second generation SEVIRI sensor. Remote Sens Environ
101(2):212–229
Fensholt R, Rasmussen K, Nielsen TT, Mbow C (2009) Evaluation of
earth observation based long term vegetation trends—intercom-
paring NDVI time series trend analysis consistency of Sahel
from AVHRR GIMMS, Terra MODIS and SPOT VGT data.
Remote Sens Environ 113(9):1886–1898
Fensholt R, Langanke T, Rasmussen K, Reenberg A, Prince SD,
Tucker C, Scholes RJ, Le QB, Bondeau A, Eastman R, Epstein
H, Gaughan AE, Hellden U, Mbow C, Olsson L, Paruelo J,
Schweitzer C, Seaquist J, Wessels K (2012) Greenness in semi-
arid areas across the globe 1981–2007—an Earth Observing
Satellite based analysis of trends and drivers. Remote Sens
Environ 121:144–158
Hellden U, Tottrup C (2008) Regional desertification: a global
synthesis. Glob Planet Change 64(3–4):169–176
Hickler T, Eklundh L, Seaquist JW, Smith B, Ardo J, Olsson L, Sykes
MT, Sjostrom M (2005) Precipitation controls Sahel greening
trend. Geophys Res Lett 32(21):L21415
Huber S, Fensholt R, Rasmussen K (2011) Water availability as the
driver of vegetation dynamics in the African Sahel from 1982 to
2007. Glob Planet Change 76(3):186–195
Li YC, Gong P, Liu CX, Chen J, Yu DY (2006) Vegetation cover
changes and correlation with climatic factors in Northern china
during 1982–1999. Resour Sci 28(2):109–117
Liu S, Wang T (2012) Climate change and local adaptation strategies
in the middle Inner Mongolia, Northern China. Environ Earth
Sci 66(5):1449–1458
Liu S, Wang T, Guo J, Qu J, An P (2010) Vegetation change based on
SPOT-VGT data from 1998 to 2007, Northern China. Environ
Earth Sci 60(7):1459–1466
Liu W, Cai T, Ju C, Fu G, Yao Y, Cui X (2011) Assessing vegetation
dynamics and their relationships with climatic variability in
Heilongjiang Province, northeast China. Environ Earth Sci
64(8):2013–2024
Mao DH, Wang ZM, Luo L, Ren CY (2012) Integrating AVHRR and
MODIS data to monitor NDVI changes and their relationships
with climatic parameters in Northeast China. Int J Appl Earth
Obs 18:528–536
Martınez B, Gilabert M, Garcıa-Haro F, Faye A, Melia J (2011)
Characterizing land condition variability in Ferlo, Senegal
(2001–2009) using multi-temporal 1-km apparent green cover
(AGC) SPOT vegetation data. Glob Planet Change 76(3):152–165
Mitchell TD, Jones PD (2005) An improved method of constructing a
database of monthly climate observations and associated high-
resolution grids. Int J Climatol 25(6):693–712
Mohammat A, Wang X, Xu X, Peng L, Yang Y, Zhang X, Myneni
RB, Piao S (2012) Drought and spring cooling induced recent
decrease in vegetation growth in Inner Asia. Agr Forest Meteorol
178–179:21–30
Mu SJ, Li JL, Chen YJ, Gang CC, Zhou W, Ju WM (2012) Spatial
differences of variations of vegetation coverage in Inner
Mongolia during 2001–2010. Acta Geogr Sin 69(9):1255–1268
Nemani RR, Keeling CD, Hashimoto H, Jolly WM, Piper SC, Tucker
CJ, Myneni RB, Running SW (2003) Climate-driven increases in
global terrestrial net primary production from 1982 to 1999.
Science 300(5625):1560–1563
Olsson L, Eklundh L, Ardo J (2005) A recent greening of the Sahel––
trends, patterns and potential causes. J Arid Environ
63(3):556–566
Peng S, Chen A, Xu L, Cao C, Fang J, Myneni RB, Pinzon JE, Tucker
CJ, Piao S (2011) Recent change of vegetation growth trend in
China. Environ Res Lett 6(4):044027
Piao SL, Wang XH, Ciais P, Zhu B, Wang TAO, Liu JIE (2011)
Changes in satellite-derived vegetation growth trend in temper-
ate and boreal Eurasia from 1982 to 2006. Glob Change Biol
17(10):3228–3239
Prince SD, Colstoun D, Brown E, Kravitz L (1998) Evidence from
rain-use efficiencies does not indicate extensive Sahelian
desertification. Glob Change Biol 4(4):359–374
Solano R, Didan K, Jacobson A, Huete A (2010) MODIS vegetation
indices (MOD13) C5 user’s guide. (Available at: http://vip.
arizona.edu/MODIS_UsersGuide.php)
Song Y, Achberger C, Linderholm HW (2011) Rain-season trends in
precipitation and their effect in different climate regions of
China during 1961–2008. Environ Res Lett 6(3):034025
Environ Earth Sci
123

State Forestry Administration (SFA) (2011) A bulletin of status quo
of desertification and sandification in China, p 11
Symeonakis E, Drake N (2004) Monitoring desertification and land
degradation over sub-Saharan Africa. Int J Remote Sens
25(3):573–592
Tabari H, Marofi S, Aeini A, Talaee PH, Mohammadi K (2011) Trend
analysis of reference evapotranspiration in the western half of
Iran. Agr Forest Meteorol 151(2):128–136
Tian H, Wen J, Wang C, Liu R, Lu D (2012) Effect of pixel scale on
evapotranspiration estimation by remote sensing over oasis areas
in north–western China. Environ Earth Sci 67(8):2301–2313
Tucker CJ, Pinzon JE, Brown ME, Slayback DA, Pak EW, Mahoney
R, Vermote EF, El Saleous N (2005) An extended AVHRR 8-km
NDVI dataset compatible with MODIS and SPOT vegetation
NDVI data. Int J Remote Sens 26(20):4485–4498
UNCCD (1994) Elaboration of an international convention to combat
desertification in countries experiencing serious drought and/or
desertification, particularly in Africa. United Nations General
Assembly, 93rd plenary meeting, New York
Wang X, Chen F, Hasi E, Li J (2008) Desertification in China: an
assessment. Earth-Sci Rev 88(3):188–206
Wang S, Wang Z, Piao S, Fang J (2010) Regional differences in the
timing of recent air warming during the past four decades in
China. Chinese Sci Bull 55(19):1968–1973
Wang Q, Zhang B, Dai SP, Zou Y, Ma ZH, Zhang YN (2011)
Dynamic changes in vegetation coverage in the three-north
shelter forest program based on GIMMS AVHRR NDVI. Resour
Sci 33(8):1613–1620
Wang T, J-g Sun, Han H, C-z Yan (2012) The relative role of climate
change and human activities in the desertification process in
Yulin region of northwest China. Environ Monit Assess
184(12):7165–7173
Wang F, Pan X, Wang D, Shen C, Lu Q (2013) Combating
desertification in China: Past, present and future. Land Use
Policy 31:311–313
Xiao XM, Braswell B, Zhang QY, Boles S, Frolking S, Moore Iii B
(2003) Sensitivity of vegetation indices to atmospheric aerosols:
continental-scale observations in Northern Asia. Remote Sens
Environ 84(3):385–392
Xu X, Piao S, Wang X, Chen A, Ciais P, Myneni RB (2012) Spatio-
temporal patterns of the area experiencing negative vegetation
growth anomalies in China over the last three decades. Environ
Res Lett 7(3):035701
Yang X, Zhang K, Jia B, Ci L (2005) Desertification assessment in
China: an overview. J Arid Environ 63(2):517–531
Yao Y, Qin Q, Fadhil AM, Li Y, Zhao S, Liu S, Sui X, Dong H (2011)
Evaluation of EDI derived from the exponential evapotranspi-
ration model for monitoring China’s surface drought. Environ
Earth Sci 63(2):425–436
Yin H, Li ZG, Wang YL, Cai F (2011) Assessment of desertification
using time series analysis of hyper-temporal vegetation indicator
in Inner Mongolia. Acta Geogr Sin 66(5):653–661
Zhang B, Wu D, Zhang L, Jiao Q, Li Q (2012) Application of
hyperspectral remote sensing for environment monitoring in
mining areas. Environ Earth Sci 65(3):649–658
Zhang BQ, Wu P, Zhao X, Wang Y, Gao X (2013) Changes in
vegetation condition in areas with different gradients
(1980–2010) on the Loess Plateau China. Environ Earth Sci
68(8):2427–2438
Zhu W, Lv A, Jia S (2011) Spatial distribution of vegetation and the
influencing factors in Qaidam Basin based on NDVI. JAL
3(2):85–93
Environ Earth Sci
123