characterization of the vitamin d receptor from the caco-2 human colon carcinoma cell line: effect...
TRANSCRIPT

ARCHIVES OF BIOCHEMISTRY AND BIOPHYSICS
Vol. 285, No. 2, March, pp. 261-269, 1991
Characterization of the Vitamin D Receptor from the Caco-2 Human Colon Carcinoma Cell Line: Effect of Cellular Differentiation’
Anna R. Giuliano,*s2 Renny T. Franceschi,? and Richard J. Wood*p3 *USDA Human Nutrition Research Center on Aging at Tufts University, Mineral Bioavailability Laboratory, 711 Washington St., Boston, Massachusetts 02111; and TDepartment of Biological Chemistry, Dental Branch, University of Texas Health Science Center, Houston, Texas 77225
Received May 21, 1990, and in revised form November 5, 1990
The human colon carcinoma cell line, Caco-2, is the only intestinal cell line to spontaneously differentiate in culture to a population exhibiting structural and bio- chemical characteristics of mature enterocytes. We con- ducted studies to establish the presence of the vitamin D receptor (VDR), determine changes in VDR concentra- tion and affinity with differentiation and determine whether la,25-dihydroxyvitamin D3 (1,25(OH),D,) me- diates a functional response in this cell line. We found that Caco-2 cells possess a specific 1,25(OH)zD3 binding protein similar to the mammalian VDR. It has an equi- librium dissociation constant (Kd) of 0.72 nM, binds vi- tamin D analogues in order of their biological activities in Z&JO (1,25(OH)2D3 > 25(OH)D3 > 24,25(OH)2D3), sed- iments as a single peak on sucrose density gradients at 3.7 S, and is eluted from a DNA-cellulose column by 0.16 M KCl. The maximum number of binding sites was 2.6- fold greater in the differentiated cell (Day 15) compared to thepreconfluent, undifferentiated (Day 4) cell (23 fmol/ mg protein us 56 fmol/mg protein). Cell growth was re-
i This project has been funded with Federal funds from the Depart- ment of Agriculture, Agricultural Research Service under Contract 53- 3KO6-5-10. The contents of this publication do not necessarily reflect the views of the U.S. Department of Agriculture, nor does mention of trade names, commercial products, or organizations imply endorsement by the U.S. Government. Additional support was provided by NIH Grant DK 35317 (R.T.F.).
’ This work was performed by Anna R. Giuliano as partial fulfillment for the Ph.D. degree in Nutrition at Tufts University and presented in part at the Seventy-third Annual Meeting of the Federation of American Societies for Experimental Biology, New Orleans, LA, March, 1989 (1989, FASEE J. 3, A1245). Dr. Giuliano’s present address is Department of Biochemistry, Biological Sciences West 436, University of Arizona, Tucson, AZ 85721.
a To whom correspondence and reprint requests should be addressed at Mineral Bioavailability Laboratory, U.S.D.A. Human Nutrition Re- search Center on Aging at Tufts University, 711 Washington Street, Boston, MA 02111.
0003-9861/91$3.00 Copyright 0 1991 by Academic Press, Inc. All rights of reproduction in any form reserved.
duced 59% when exposed to lo-’ M 1,25(OH)zD, for 8 days. Alkaline phosphatase activity significantly in- creased in cultures incubated with 10-e M 1,26(OH)zDs for up to 4 days when treatment was started in both un- differentiated cells (Day 6) and differentiated cells (Day 11). These findings suggest that the VDR present in un- differentiated and differentiated Caco-2 cells is func- tional. Caco-2 cells provide a unique in vitro model to study vitamin D-regulated functions in differentiated mammalian enterocytes. 0 issi Academic Press, he.
The vitamin D metabolite, kq25dihydroxyvitamin D3 (1,25(0H)2D3)4 is a potent stimulator of intestinal calcium transport (1). The mode of action of 1,25(OH)zD3 is sim- ilar to that of other steroid hormones in that, upon en- tering a cell, 1,25(OH)*D3 binds a specific, high affinity receptor. The hormone-receptor complex then binds to chromatin, initiating transcription of mRNA whose translation products bring about the hormone’s biological effects (1). Autoradiographic studies have localized the vitamin D receptor (VDR) to the nuclei of epithelial cells along the villi and crypts of the small intestine and the luminal surfaces and crypts of the colon. The concentra- tion of VDR in the intestine varies by intestinal segment and location along the crypt to villus axis (2-4).
The study of intestinal vitamin D-regulated events at the cellular level has been limited by the poor viability of isolated enterocytes in vitro. Because a method for long term culture of normal enterocytes is not available, in- creasing attention has been given to finding an established cell line of intestinal origin as a substitute. The VDR has been identified in several human intestinal cell lines, e.g.,
’ Abbreviations used: DB, vitamin Da; VDR, vitamin D receptor; FBS, fetal bovine serum; DTT, dithiothreitol; HAP, hydroxylapatite.
261

262 GIULIANO, FRANCESCHI, AND WOOD
HT 29 (5), Lovo (6), and several Co10 cell lines (7). In addition, the VDR has been identified in the rat duodenal crypt cell line IEC-6 (8). However, the colon adenocar- cinema cell lines shown to possess the VDR are all un- differentiated cell lines. Moreover, once HT 29 cells are induced to differentiate, the VDR may be no longer de- tectable (5).
The human colon adenocarcinoma cell line, Caco-2, is the only intestinal cell line which differentiates sponta- neously in culture (9), exhibiting structural and functional differentiation patterns characteristic of mature entero- cytes (10). The differentiated Caco-2 cell is covered by typical brushborder microvilli and, when cultured in monolayer, possesses tight junctions and forms many domes, characteristic of functionally polarized, trans- porting epithelial cells (11). Moreover, Ussing chamber studies of Caco-2 cells grown on permeable supports have demonstrated a positive short circuit current, indicative of net cation absorption or anion secretion (12).
The functional differentiation of the Caco-2 cell is a growth-related phenomena (10). The activity of sucrase- isomaltase, alkaline phosphatase, and aminopeptidase, markers of enterocytic differentiation, is low during the log growth phase in these cells. Following the stationary growth phase the activity of these enzymes increases markedly.
To test whether the Caco-2 cell line is appropriate as an in vitro model to study intestinal vitamin D-regulated events, we conducted studies to establish the presence of the VDR and determine if the VDR mediates a functional response in the Caco-2 cell line. We also assessed the effect of differentiation on VDR concentration.
EXPERIMENTAL PROCEDURES
Materials. 1a,25(0H)z-[26,27-3H]D, (180 Ci/mmol) was obtained from Amersham Corp. (Arlington Heights, IL). Crystalline 1,25(OH)xDr,, 24,25(OH)zD,, and 25(OH)D3 were gifts from Dr. Uskokovic of Hoffmann LaRoche Co. (Nutley, NJ). Fetal bovine serum (FBS) used for culturing cells was purchased from Hyclone (Logan, UT). Culture media ingre- dients were purchased from GIBCO Laboratories (Grand Island, NY). Cellulose (Cellex 410) and hydroxylapatite (Bio-Gel HTP) were pur- chased from Bio-Rad Laboratories (Richmond, CA). Calf thymus DNA and the reagents and enzymes utilized in the brush border hydrolase assays were purchased from Sigma Chemical Co. (St. Louis, MO).
Cell culture. The human colon adenocarcinoma cell line Caco-2 was obtained from the American Type Tissue Collection (passage 21) and studied between the 25th and the 50th passages. Cells were grown in 75-cm2 plastic flasks (Corning) in Dulbecco’s modified Eagle’s medium with 4.5 g/liter glucose supplemented with 1% nonessential amino acids, 20% FBS, penicillin (106 units/ml), streptomycin (100 mg/ml), and gentamycin sulfate (50 mg/ml). Caco-2 cells were maintained at 37°C in a 5% COZ, 95% air atmosphere. Cells were seeded at a density of 2.7 X lO”/cm’ and were passaged at a ratio of 1:4 when 70-80% confluent. Medium was changed every other day prior to confluence and every day once confluence was reached.
Assessment of cell differentiation. The activities of the brushborder hydrolases, sucrase, and alkaline phosphatase were assessed as measures of cell differentiation. On Days 4, 7, 11, and 15 in culture, cells were scraped in 1% Triton X-100, sonicated, and stored at -80°C until enzyme
analysis. The activity of the brush border enzyme sucrase was determined by the method of Dahlquist (13) and alkaline phosphatase activity by the method of Marx et al. (14), using p-nitrophenylphosphate as a sub- strate with a buffer pH of 9.2. Protein was determined by the Lowry method (15). Enzyme data were expressed as milliunits per milligram of protein.
In experiments to test the effect of 1,25(OH)zDs on brushborder hy- drolase activities, cells were grown in the normal growth media con- taining 20% FBS until days 5 or 11. On these respective days, cells were switched to media containing 5% FBS, with either 10 nM 1,25(OH)zD, or ethanol vehicle not exceeding 0.1%. Media was changed daily for a total of 4 days. Cells were harvested on Days 1,2,3, and 4 of incubation.
Cytosol preparation. Monolayers of Caco-2 cells were rinsed and scraped in ice cold Dulbecco’s phosphate-buffered saline containing 2 mM ethyleneglycol-bis-N,N,N:N’-tetraacetic acid. Typically, six 75-cm2 flasks of cells were harvested to yield one cytosolic preparation and all procedures were performed at 4°C. The cell pellet attained after low speed centrifugation was diluted with 4 vol of TKEDM buffer (50 mM
Tris-HCl, 300 mM KCl, 1.5 mM EDTA, 5 mM dithiothreitol (DTT), 10 mM NalMoOl, and 2 mM phenylmethylsulfonyl fluoride, pH 7.4) and disrupted by sonication (2 X 15-s bursts with a Branson Sonifier 450 at a power setting of 2). Aliquots (200 ml) of the cell homogenate were saved for DNA analysis (16). The remaining cell homogenate was sub- jected to centrifugation at 7500 rpm for 10 min (Sorvall RC5C) followed by ultracentrifugation at 100,OOOg for 60 min (Beckman L8-70M ultra- centrifuge) yielding a high salt cytosolic preparation.
Binding assay. Triplicate 200~~1 aliquots of cytosol harvested from cells cultured for 4, 7, 10, and 15 days, were incubated at 4°C for 2 h with 1.0 nM 1,25(OH)2[26,27-3H]D3, in the presence or absence of 200 nM radioinert 1,25(OH)xD3 to measure specific and nonspecific 1,25(OH),Ds binding activity. Following this incubation, 200 pl of a hydroxylapatite (HAP) slurry in TED buffer (50 mM Tris-HCl, 1.5 mM
EDTA, 0.5 mM DTT, pH 7.4) was added to each incubation tube. Assay tubes were washed three times with TED containing 0.5% Triton X- 100, pH 7.4, and centrifuged at 3000 rpm for 5 min following a 15-min incubation with the HAP slurry. HAP pellets were counted with 3.5 ml Optifluor (Packard, IL) and 0.2 ml Hz0 in a Packard 200CA liquid scintillation counter. 1,25(OH)zDs binding activity was expressed per milligram cytosolic protein and per milligram DNA.
Sucrose density sedimentation. Cytosolic fractions (300 ~1) were in- cubated with 1 nM radiolabeled 1,25(OH)*Ds for 2 h, with and without 200 nM radioinert 1,25(OH),D3 or 20 nM 25(OH)Ds, to determine sed- imentation density of the l,25(OH)zD3 binding protein in Caco-2 cells. Cytosol was treated with dextran-coated charcoal to remove free hormone and 200 ~1 of labeled cytosol was layered on a linear 4 to 20% sucrose gradient in TKEDM and centrifuged at 240,OOOg for 16 h (Beckman SW 50.1 rotor). [‘*C]Ovalbumin was sedimented in parallel gradients as a density marker. Gradients were collected in 200-~1 fractions for scintillation counting.
DNA cellulose chromatography. The binding of the 1,25(OH),Ds binding protein from Caco-2 cells to DNA was determined. A l-ml DNA cellulose column was prepared from calf thymus DNA (17). Cytosol was labeled with [3H]1,25(OH)zDs for 2 h, as described above, followed by removal of free hormone with dextran-coated charcoal. The cytosol was diluted fourfold to reduce the KC1 concentration and then layered on the DNA-cellulose column. The column was washed with 20 ml TED buffer and eluted with a 50-ml gradient of 50 to 300 mM KCl. One- milliliter fractions were collected and their radioactivity and conductance determined.
Effect of 1,25(OH)& on cell proliferation. Caco-2 cells were grown in serum free media (18,19) containing Medium 199 supplemented with 10 mg/ml insulin (Sigma), 10 rig/ml epidermal growth factor (Collab- orative Research, Lexington, MA), 1 nM triiodothyronine (Collaborative Research), 10 mg/ml transferrin (Sigma), 1.4 mM hydrocortisone (Cal- biochem, San Diego, CA), 2 mg/ml bovine serum albumin, 10 mg/ml inositol, 10 mg/ml choline chloride, and 1% v/v penicillin/streptomycin with 1O-7 M 1,25(OH),Ds or ethanol vehicle. Cells were seeded at a density

CELL DIFFERENTIATION AND VITAMIN D RECEPTORS IN Caco-2 CELLS 263
of 1.72 X lo5 cells/g.6 cm* well. Fresh medium was added daily. On Days 2,4,6, and 8 in culture cells were harvested by trysinization and counted using a Counter Counter ZM (Coulter Electronics Limited, England).
Statistics. Vitamin D receptor concentration comparisons at different days in culture were made using the Tukey test at P < 0.05. Linear regression analysis or the Student t test was used in all other statistical analyses, as appropriate.
RESULTS
Scatchard analysis. Specific binding of 1,25(OH)zD3 to the high salt cytosolic extract from Day 15 cultures of Caco-2 cells was determined by incubating aliquots of cy- tosol with 0.05 to 2.0 nM tritiated 1,25(OH)zD3 with and without a 200-fold excess of unlabeled hormone. As shown in Fig. lA, [3H]1,25(OH)2D3 binding was a saturable and specific process, saturating at approximately 1.0 to 1.5 nM. Scatchard analysis of these data (Fig. 2B) indicated the presence of a single binding site for 1,25(OH)zD3 with an apparent dissociation constant (Kd) of 0.72 nM.
Competition. The ability of several vitamin D metab- olites to compete with [3H]1,25(OH)zD3 for binding to Caco-2 cell cytosol is shown in Fig. 2. 25(OH)D3 and 24R,25(OH)2D3 were 250 and 750 times less potent than 1,25(OH)zD3 in competing with [3H]1,25(OH)zD3 for binding to the high affinity cytosolic binding site.
Density gradient analysis. Cytosol prepared from Caco-2 cells at Day 15 in culture was examined for the presence of a specific 1,25(OH)zD3 binding protein by su-
1, 25 VIT II CONC (nt-4) BOUND (fI!IOl/0.2Inl)
crose density gradient analysis. As shown in Fig. 3, 1,25(OH)2D3 binding activity was associated with a single peak sedimenting at approximately 3.7 S. This peak rep- resents specific binding of [3H] 1,25(OH)2D3 since it could be displaced when a 200-fold excess of radioinert 1,25(OH)zD3 was added to the incubation mixture. The addition of 25(OH)D3 to the incubation mixture did not significantly reduce the binding activity of this peak, sug- gesting that the serum vitamin D binding protein was not being measured in this system.
DNA binding analysis. Labeled cytosol from Day 15 cultures was subjected to DNA-cellulose chromatography (Fig. 4) to test the capacity of the 1,25(OH&D3 receptor complex of Caco-2 cells to bind DNA. Approximately 71% of the labeled cytosol bound to the DNA column. This bound material eluted from the column as a single peak at approximately 0.16 M KCl. All of the [3H]1,25(OH)2D3 in this peak was specifically bound, since it could be dis- placed by 200 nM cold 1,25(OH)2D3.
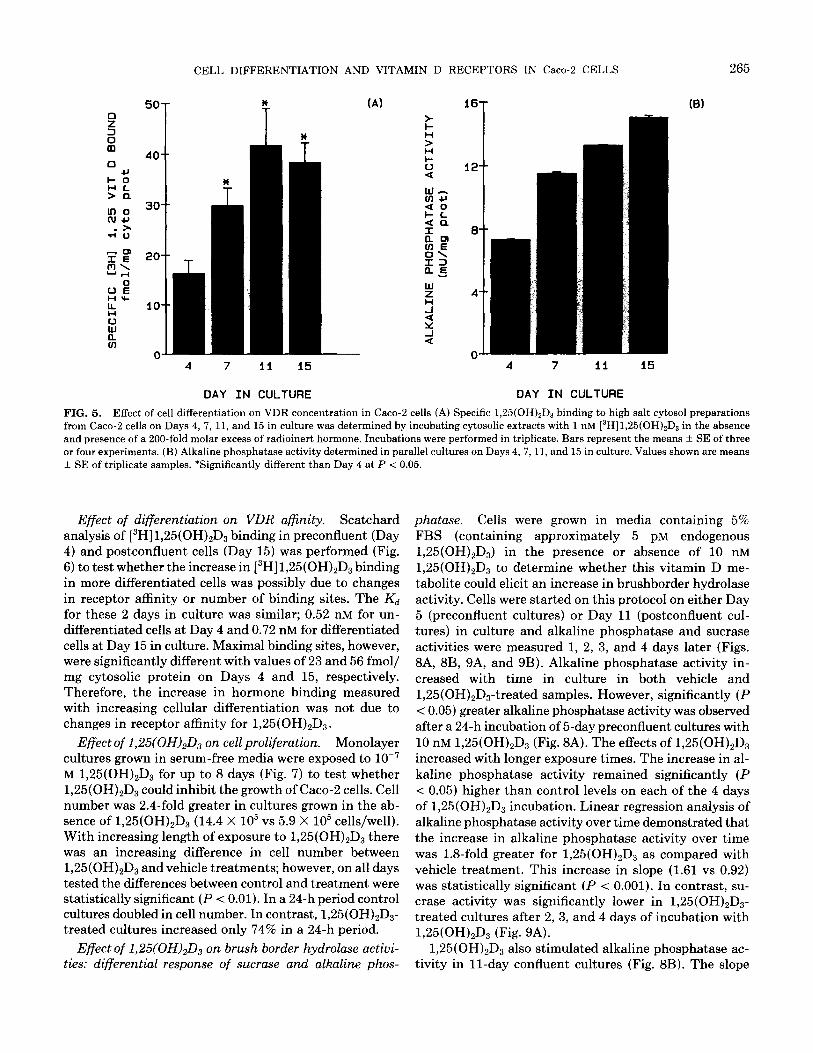
Vitamin D receptor concentration: effect of differentia- tion. Specific [3H]1,25(OH)2D3 binding was measured in cells grown for 4, 7, 11, and 15 days in culture (Fig. 5A) to assess the effect of cell differentiation on the con- centration of vitamin D receptors in Caco-2 cells. The VDR concentration was lowest at Day 4 in preconfluent, undifferentiated cells (16 fmol/mg cytosolic protein). By Day 7, the concentration of VDR had significantly in- creased (P < 0.05) to 30 fmol/mg cytosolic protein. Re-
(B)
0.
0.
FIG. 1. Saturation analysis of [3H]1,25(OH)ZDa binding in Caco-2 cell cytosol (A) and Scatchard plot of specific binding data (B). (A) Cytosol prepared from &day-old cultures was incubated with the indicated concentrations of [3H]1,25(OH) 2 3 s D ( q uares). Nonspecific binding (circles) was determined at each concentration by the inclusion of a 200-fold molar excess of radioinert 1,25(OH),Da. Specific binding (triangles) was calculated by subtracting nonspecific binding from total binding. (B) Least squares analysis of specific binding data that was subjected to Scatchard plot. Apparent Kd was 0.72 nM, N,,,,, was 56.3 fmol/mg cytosolic protein and the r value of the regression line was 0.98. Each point represents the mean of three determinations.

264 GIULIANO, FRANCESCHI, AND WOOD
VIT D ANALDGUE CONCENTRATION (Ml)
FIG. 2. Competition by various vitamin D analogues for specific 1,25(OH)xDs binding sites in Caco-2 cytosol. Cytosol prepared from 15-day- old cultures was incubated with 1.0 nM [3H]1,25(OH)ZDs and the indicated concentrations of radioinert 1,25(OH)2Ds (square), 25(OH)Da (circle), or 24R,25(OH)sD3 (triangle). Specific binding in the absence of competitors was taken as the control or 100% value. Each point represents the mean of two determinations.
ceptor concentration was highest in differentiated cells, reaching 42 and 38 fmol/mg cytosolic protein on Days 11 and 15 respectively. The 2.6-fold greater VDR concen- tration in differentiated compared to undifferentiated Caco-2 cells was statistically significant (P < 0.05). When
0 0 4 0 12 16 20 24
FRACTION NUMBER
FIG. 3. Sucrose gradient analysis of [3H]1,25(OH),D, binding in Caco- 2 cytosol. Aliquots of cytosol prepared from Day 15 cultures were in- cubated with 1 nM [3H]1,25(OH)2Da alone (filled diamond) or in the presence of 200 nM radioinert 1,25(OH)zDs (filled circle) or 20 nM ra- dioinert 25(OH)D3 (open diamond). Free steroid was separated by dex- tran/charcoal. Bound cytosol was layered over a 4 to 20% linear sucrose gradient prepared in hypertonic buffer and centrifuged for 16 h at 240,OOOg. Fractions of 200 al were collected by piercing the bottom of the tubes. Arrow: sedimentation of [i4C]ovalhumin (3.7 S).
the data were expressed per milligram DNA, a similar pattern of increasing VDR concentration with differen- tiation was observed (90.0 + 2.0, 140.0 + 1.0,190.0 + 4.0, and 230.0 -t 1.0 fmol/pg DNA on Days 4, 7, 11, and 15, respectively). A parallel increase in the activity of brush border alkaline phosphatase was observed (Fig. 5B).
-200
E 1500~- --I50 !zl
-300
-50
rg 0 10 20 30 40 50 60 70 80
FRACTION NUMBER
FIG. 4. DNA-cellulose chromatography of [aH]1,25(OH),D, binding to Caco-2 cytosol. High salt cytosolic extracts prepared from 15&y- old cultures were incubated with 1 nM [3H]1,25(OH)2D3 for 2 h at 4’C. Following removal of free hormone with dextran/charcoal, labeled cytosol was applied to a l-ml DNA-cellulose column. The column was washed with 20 ml of TED buffer and eluted with a 50-ml linear KC1 gradient.
CELL DIFFERENTIATION AND VITAMIN D RECEPTORS IN Caco-2 CELLS 265
*
T (A) 16,
: Y l-l
4 7 11 15 4 7 ii 15
DAY IN CULTURE DAY IN CULTURE
FIG. 5. Effect of cell differentiation on VDR concentration in Caco-2 cells (A) Specific 1,25(OH),Da binding to high salt cytosol preparations from Caco-2 cells on Days 4, 7, 11, and 15 in culture was determined by incubating cytosolic extracts with 1 nM [3H]1,25(OH)zD3 in the absence and presence of a 200-fold molar excess of radioinert hormone. Incubations were performed in triplicate. Bars represent the means + SE of three or four experiments. (B) Alkaline phosphatase activity determined in parallel cultures on Days 4,7, 11, and 15 in culture. Values shown are means + SE of triplicate samples. *Significantly different than Day 4 at P < 0.05.
Effect of differentiation on VDR affinity. Scatchard analysis of [3H]1,25(OH)zD3 binding in preconfluent (Day 4) and postconfluent cells (Day 15) was performed (Fig. 6) to test whether the increase in [3H] 1,25(OH)zD3 binding in more differentiated cells was possibly due to changes in receptor affinity or number of binding sites. The Kd for these 2 days in culture was similar; 0.52 nM for un- differentiated cells at Day 4 and 0.72 nM for differentiated cells at Day 15 in culture. Maximal binding sites, however, were significantly different with values of 23 and 56 fmol/ mg cytosolic protein on Days 4 and 15, respectively. Therefore, the increase in hormone binding measured with increasing cellular differentiation was not due to changes in receptor affinity for 1,25(OH)2D3.
Effect of 1,25(OH)2D3 on cell proliferation. Monolayer cultures grown in serum-free media were exposed to 10e7 M 1,25(OH)zD3 for up to 8 days (Fig. 7) to test whether 1,25(OH)zD3 could inhibit the growth of Caco-2 cells. Cell number was 2.4-fold greater in cultures grown in the ab- sence of 1,25(OH)zD3 (14.4 X lo5 vs 5.9 X lo5 cells/well). With increasing length of exposure to 1,25(OH)2D3 there was an increasing difference in cell number between 1,25(OH)zD3 and vehicle treatments; however, on all days tested the differences between control and treatment were statistically significant (P < 0.01). In a 24-h period control cultures doubled in cell number. In contrast, 1,25(OH)zD3- treated cultures increased only 74% in a 24-h period.
Effect of 1,25(OHjzD3 on brush border hydrolase actiui- ties: differential response of sucrase and alkaline phos-
phatme. Cells were grown in media containing 5% FBS (containing approximately 5 pM endogenous 1,25(OH),D,) in the presence or absence of 10 nM 1,25(OH)zD3 to determine whether this vitamin D me- tabolite could elicit an increase in brushborder hydrolase activity. Cells were started on this protocol on either Day 5 (preconfluent cultures) or Day 11 (postconfluent cul- tures) in culture and alkaline phosphatase and sucrase activities were measured 1, 2, 3, and 4 days later (Figs. BA, BB, 9A, and 9B). Alkaline phosphatase activity in- creased with time in culture in both vehicle and 1,25(OH),D,-treated samples. However, significantly (P < 0.05) greater alkaline phosphatase activity was observed after a 24-h incubation of 5-day preconfluent cultures with 10 nM 1,25(OH),D3 (Fig. BA). The effects of 1,25(OH)zD3 increased with longer exposure times. The increase in al- kaline phosphatase activity remained significantly (P < 0.05) higher than control levels on each of the 4 days of 1,25(OH)2D, incubation. Linear regression analysis of alkaline phosphatase activity over time demonstrated that the increase in alkaline phosphatase activity over time was 1.8-fold greater for 1,25(OH)2D3 as compared with vehicle treatment. This increase in slope (1.61 vs 0.92) was statistically significant (P < 0.001). In contrast, su- erase activity was significantly lower in 1,25(OH),D3- treated cultures after 2, 3, and 4 days of incubation with 1,25(OH)zD3 (Fig. 9A).
1,25(OH)zD3 also stimulated alkaline phosphatase ac- tivity in 11-day confluent cultures (Fig. BB). The slope

266 GIULIANO. FRANCESCHI, AND WOOD
0 5 10 15 20 25 30 35
BOUND (fmol/0.2ml)
FIG. 6. Scatchard plot analysis of specific [3H]1,25(OH)zDs binding to Caco-2 cytosol in undifferentiated and differentiated cells. Aliquots of cytosol prepared from undifferentiated cells at Day 4 (square) and differentiated cells at Day 15 (circle) in culture were incubated with 0.05 to 2.0 nM [3H]1,25(OH)2D3 in the presence or absence of 200 nM
radioinert 1,25(OH)zDs. Specific binding, calculated by subtracting nonspecific from total binding, was subjected to Scatchard plot analysis. Apparent Kd was 0.52 nM and 0.72 nM on Days 4 and 15, respectively. N,,,,. was 23.3 and 56.3 fmol/mg cytosolic protein on Days 4 and 15, respectively. The r value of the regression line on Day 4 was 0.95 and 0.98 on Day 15. Each point represents the mean of triplicate samples.
(2.62 vs 1.17) of the increase in alkaline phosphatase ac- tivity over time was 2.2-fold greater in 1,25(OH)2D3 versus vehicle-treated cultures (P < 0.001). In contrast, sucrase activity (Fig. 9B) did not differ with treatment when con- fluent cultures were treated with 1,25(OH)zD3.
DISCUSSION
The data presented in this paper demonstrate that the human colon adenocarcinoma cell line, Caco-2, possesses a receptor-like 1,25(OH)2D3 binding protein that is similar to the mammalian intestinal receptor with respect to sed- imentation, dissociation constant, binding specificity, and DNA binding characteristics (1). The presence of the vi- tamin D receptor in Caco-2 cells is of interest because this cell line is the only one of intestinal origin to spon- taneously differentiate in culture, developing biochemical and morphological characteristics of mature mammalian small intestinal epithelial cells (10). Other established mammalian cell lines of intestinal origin in which the vitamin D receptor has been demonstrated either require carbohydrate substitution for differentiation (i.e., HT 29, Ref. (5)), or are models of crypt-like rather than villus- like cells (i.e., IEC 6, Ref. (8); Lovo, Ref. (6); and the Co10 cell lines, Ref. (7)).
Our studies show the vitamin D receptor to be present in undifferentiated Caco-2 cells (Day 4) and in confluent, differentiated cells (Day 15). The VDR concentration is
2.4-fold greater in Caco-2 cells that are in the differen- tiated state. This increase in specific 1,25(OH)zD3 binding is due to an increase in binding sites, rather than changes in receptor affinity. The recent cloning of the comple- mentary DNA encoding the vitamin D receptor (20) provides an important opportunity to investigate the mechanism underlying these apparent differentiation- dependent increases in VDR expression. The major in- crease in vitamin D receptor concentration in Caco-2 cells occurs as the cells progress from preconfluence at Day 4 to confluence at Day 7 in culture. However, further in- creases in VDR were still observed above this level in more differentiated cells at Days 11 and 15. Interestingly, the rise in VDR concentration paralleled the spontaneous increase in alkaline phosphatase activity (Fig. 5).
In rat jejunum, the concentration of vitamin D receptors along the crypt-villus axis varies as a function of location on the villus (3, 4). The majority of the cells occupying the villus crypt are undifferentiated stem cells that un- dergo mitosis, replenishing cells that are continually shed at the villus tip. As cells migrate from the crypt to the villus tip there is an increase in the activity of the brush- border hydrolases and a decrease in thymidine incorpo- ration (21). In the rat intestine, the concentration of re- ceptors is 2.4-fold greater in the more differentiated, nonproliferating villus cells compared to the undifferen- tiated, proliferating crypt cells (3). Our observations in Caco-2 cells are consistent with this in that we also ob- served a significant increase of VDR concentration as the cells matured from the undifferentiated to the differen- tiated state. The apparent binding affinity (I&) and the receptor number of the VDR in Caco-2 cells is about 0.5-
2 4 6 6
DAYS
FIG. 7. Effect of 1,25(OH)rDs on growth of Caco-2 cells. Caco-2 cells were grown in serum free media in the absence (screened bars) or the presence (filled bars) of 10m7 M 1,25(OH)*De for 8 days. Bars represent the means f SE of four separate cultures. *Significantly different from control at P < 0.01. “Significantly different from control at P < 0.001.

CELL DIFFERENTIATION AND VITAMIN D RECEPTORS IN Caco-2 CELLS 267
(A) 25
DAYS OF INCUBATION DAYS OF INCUBATION
FIG. 8. Effect of 1,25(OH),Da on alkaline phosphatase activity of Caco-2 cells. Caco-2 cells were incubated with vehicle (0.1% ethanol) (screened bars) or lo-* M 1,25(OH)zD3 (filled bars) in media containing 5% FBS starting on Day 5 (A) or Day 11 (B) in culture. Treatment and control media were prepared and replaced daily. Bars represent means ? SE of three separate cultures. *Significantly different from control at P < 0.05. ‘Significantly different from control at P < 0.01.
0.7 nM and 56 fmol/mg protein, respectively. These values Recently, the vitamin D receptor has been identified are similar to reports from other cultured mammalian and characterized in another human colon adenocarci- cell lines; for example, 0.5 nM and 40 fmol/mg protein in noma cell line, HT-29 (5, 24). The VDR in HT-29 cells rat ROS 17/2 osteoblast-like cells (22), 0.3 nM and 22 was found to be present (20 fmol/mg protein) in undif- fmol/mg protein in pig kidney LLC-PK1 cells (23), and ferentiated, rapidly proliferating cells; however, when HT- 0.4 nM and 31 fmol/mg protein in human intestinal LoVo 29 cells were induced to differentiate by growing the cells cells (6). in galactose medium the VDR was no longer detectable
DAYS OF INCUBATION DAYS OF INCUBATION
FIG. 9. Effect of 1,25(OH),D3 on sucrase activity of Caco-2 cells. Caco-2 cells were incubated with vehicle (0.1% ethanol) (screened bars) or 10-s M 1,25(OH)*D, (filled bars) in media containing 5% FBS starting on Day 5 (A) or Day 11 (B) in culture. Treatment and control media were prepared and replaced daily. Bars represent means + SE of three separate cultures. *Significantly different from control at P < 0.05. ‘Significantly different from control at P < 0.01.

268 GIULIANO. FRANCESCHI, AND WOOD
(5), or markedly reduced to about 5 fmol/mg protein (24). Thus, the pattern of differentiation-dependent expression of the VDR in HT-29 cells appears to differ markedly from the normal intestine (3) and the Caco-2 cell line. The VDR has also been identified in the human colon adenocarcinoma cell lines of the Lovo (6) and Co10 series (7) and in the nontransformed rat intestinal cell line IEC- 6 (8). All of these cell lines, however, resemble the un- differentiated crypt-like rather than the differentiated villus-like enterocyte.
The relationship between cellular differentiation and VDR concentration observed in Caco-2 cells has been ob- served in other cell types (25-28). In mouse mammary gland cultures, the induction of differentiation resulted in a sixfold increase in VDR concentration (25). Similarly, the retinoic acid and 1,25(0H)2D3-induced differentiation of the rat osteogenic sarcoma cell line ROS 17/2 resulted in a threefold increase in VDR concentration over un- differentiated levels (26). Activation of normal B and T lymphocytes and tonsillar T-cells with PHA results in the appearance of the vitamin D receptor (27,28). Further study of the Caco-2 cell line is of interest since it is the only established cell line of intestinal origin that resembles the in vivo maturation process of enterocytes with respect to VDR concentration as well as hydrolase activity and cell morphology.
1,25(OH)zD3 has been shown to inhibit cell growth in nontransformed cell lines such as keratinocytes (29) as well as cancer cell lines, e.g., the myeloid leukemia cell line HL-60 (30), the intestinal cell lines Lovo (6) and Co10 206 (31), the malignant melanoma cell line MM96 (32), the monoblastic cell line U937 (33), and others. The ability of 1,25(OH)zD3 to inhibit cell replication is as- sumed to be receptor mediated because no growth inhi- bition is observed in VDR-negative cells (34). Our current finding that culturing Caco-2 cells in the presence of 1,25(OH)zD3 results in a decrease in cell growth (Fig. 7) suggests that the binding protein present in mitotically active Caco-2 cells is a functional receptor capable of me- diating a response to 1,25(OH)2D3.
The activity of alkaline phosphatase in both rat (35) and chick (36, 37) small intestine has been reported to be increased by 1,25(OH)2Ds. In addition to the intestinal response to 1,25(OH),D3 in vivo, other cells have been shown to respond to 1,25(OH)zD3 in vitro with an increase in alkaline phosphatase activity; e.g., the osteosarcoma cell lines MG 63 (38), OS-12 and ROS 17/2 (39), SOAS and TE 85 (40), and the breast cancer cell line MDA- MB157 (41). Our results demonstrating alkaline phos- phatase responsiveness to 1,25(OH)zDs in Caco-2 cells (Figs. 8A and BB) at all stages in the differentiation pro- cess are consistent with the in vivo studies showing an increase in alkaline phosphatase activity in all fractions of enterocytes isolated along the crypt-villus axis (42,43).
Small intestinal sucrase activity has been previously shown to decrease in response to in vivo 1,25(OH)zD3
treatment (36, 44). We found an in vitro decrease in su- erase activity with 1,25(OH)zD3 treatment in undiffer- entiated Caco-2 cells and no effect of 1,25(OH)2D3 on su- erase activity in differentiated cells. In contrast to alkaline phosphatase, this observation suggests that the regulation of sucrase expression by 1,25(OH)2D3 is dependent upon the state of cell differentiation and, importantly, that the observed increases in alkaline phosphatase activity do not reflect a nonspecific increase in all brush border hydro- lases following vitamin D treatment. Collectively, our data suggest that the Caco-2 cells possess a VDR that is func- tional in both the mitotically active cell and the quiescent differentiated cell.
We have demonstrated that the Caco-2 cell line pos- sesses a vitamin D receptor similar to that present in mammalian intestine. The concentration of this receptor is highest in confluent differentiated cells. The finding of 1,25(OH)zD,-induced growth inhibition and changes in alkaline phosphatase and sucrase activity in the Caco-2 cell suggests that these receptors can mediate a biological response. Moreover, we have reported elsewhere (45) that 1,25(OH)2D3 can stimulate transepithelial calcium trans- port in Caco-2 cells. We are currently investigating whether Caco-2 cells possess a vitamin D-dependent cal- bindin D protein. Since Caco-2 cells undergo several im- portant spontaneous biochemical and morphological changes in culture that resemble what occurs in vivo as enterocytes migrate from the crypt to the tip of the villus, we suggest that this cell line provides a unique in vitro model to study 1,25(OH)2D3-mediated gene expression and function in both the undifferentiated and the differ- entiated mammalian enterocyte.
ACKNOWLEDGMENTS
The authors thank Dr. Philip Gordon for his expert guidance during the performance of the growth inhibition studies and Drs. Irwin Ro- senberg and Janet Hock for their helpful suggestions.
REFERENCES 1.
2.
3.
4. 5.
6.
1.
8.
9.
10.
Haussler, M. (1986) Annu. Reu. Nub. 6, 527-562.
Feldman, D., McCain, T. A., Hirst, M. A., Chen, T. L., and Colston, K. W. (1979) J. Biol. Chem. 254, 10,378-10,384.
Chan, S. D. H., Chim, D. K. H., and Atkins, D. (1984) Clin. Sci. 66,745-748. Chan, S. D. H., and Atkins, D. (1984) Clin. Sci. 67, 285-290.
Brehier, A., andThomasset, M. (1988) J. Steroid Biochem. 29,265- 270. Wargovich, M. J., and Lointer, P. H. (1987) Canad. J. Physiol. Pharmacol. 65,472-477.
Frampton, R. J., Suva, L., Eisman, J. A., Findlay, M., Moore, G. E., Mosely, J. M., and Martin, T. J. (1982) Cancer Res. 42, 1116-1119.
Adams, J. S., Clemens, T. L., Horiuchi, N., Quaroni, A., and Holick, M. F. (1982) FEBS Left. 142, 247-250. Chung, Y. S., Song, I. S., Erickson, R. H., Sleisenger, M. H., and Kim, Y. S. (1985) Cancer Res. 45,2976-2982.
Pinto, M., Robine-Leon, S., Tappay, M., Kedinger, M., Triadou, N., Dussaulx, E., Lacroix, B., Simon-Assman, P., Haffner, K., Fogh, J., and Zweibaum, A. (1983) Bid. Cell 47.323-330.

CELL DIFFERENTIATION AND VITAMIN D RECEPTORS IN Caco-2 CELLS 269
11. Gum, J. R., Kam, W. K., Byrd, J. C., Hicks, J. W., Sleistnger, M. H., and Kim, Y. S. (1987) J. Biol. Chem. 262, 1092-1097.
12. Grasset, E., Pinto, M., Dissaulx, E., Zweibaum, A., and Desjeux, J. F. (1984) Amer. J. Physiol. 247, C260-C267.
13. Dahlquist, A. (1968) Anal. Biochem. 23, 99-107.
14. Marx, S. J., Fedak, S. A., and Aurbach, G. D. (1972) J. Biol. Chem. 217,6913-6918.
15. Lowry, 0. H., Roenbrough, N., Farr, A. L., and Randall. R. J. (1951) J. Biol. Chem. 193,265-275.
16. Cessarone, B. F., Bolognesi, C., and Santi, L. (1979) Anal. Biochem. 100, 188-197.
17. Alberts, B., and Herrick, G. (1971) in Methods in Enzymology (Grossman, L., and Moldave, K., Eds.), Vol. 21, pp. 198-217, Aca- demic Press, New York.
18. Gordon, P. R., Mawhenney, T. P., and Gilchrest, B. .4. (1988) J. Cell Physiol. 135, 416-424.
19. Gordon, P. R., Gelman, L. K., and Gilchrest, B. A. (1958) J. Nutr. 118, 1487-1494.
20. McDonnell, D. P., Mangelsdorf, D., Pike, W., Haussler, M. R., and O’Malley, B. W. (1987) Science 235, 1214-1217.
21. Weiser, M. M., Walters, J. F., and Wilson, J. R. (1986) Int. Reu. Cytol. 101, l-57.
22. Manolagas, S. C., Abare, J., and Deftos, L. (1984) Cal&f. Tissue Znt. 36, 153-157.
23. Costa, E. M., and Feldman, D. (1987) Endocrinology 120, 1173- 1178.
24. Harper, K. D., Iozzo, R. V., and Haddad, J. G. (1989) Metabolism 38,1062-1069.
25. Mezzetti, G., Barbirolli, B., and Oka, T. (1987) Endocrinology 120, 2488-2493.
26. Petkovich, P. M., Heersche, J., Tinker, D. O., and Jones, G. (1984) J. Biol. Chem. 269,8274-8280.
27. Provvedini, D. M., Tsoukas, C. D., Deftos, L. J., and Monolagos, S. C. (1983) Science 221, 1181-1183.
28. Nunn, J. D., Katz, D. R., Barker, S., Fraher, L. J., Hewison, M., Hendy, G. N., and O’Riordan, J. H. (1986) Immunology 59, 479- 484.
29. Clemens, T., Adams, J. S., Horiuchi, N., Gilchrest, B., Cho, H., Tsuchuya, Y., Matsuo, N., Suda, T., and Holick, M. (1983) J. Clin. Endocrinol Metab. 56, 824-830.
30. Miyaura, C., Abe, E., Kuribayashi, T., Tanaka, H., Konno, K., Nu- shui, Y., and Suda, T. (1981) Biochem. Biophys. Res. Commun. 102, 937-943.
31. Eisman, J. A., Barkla, D., and Tutton, P. M. (1987) Cancer Res. 47,21-25.
32. Frampton, R. J., Omond, S. A., and Eisman, J. (1983) Cancer Res. 43,4443-4447.
33. Amento, E. P., Bhalla, A. K., Kurnick, J. T., Kradin, R. L., Clemens, T. L., Holick, S. A., and Krane, S. M. (1984) J. Clin. Inuest. 73, 731-739.
34. Dokoh, S., Donaldson, C. A., and Haussler, M. R. (1984) Cancer Res. 44, 2103-2109.
35. Halloran, B. P., and DeLuca, H. F. (1981) Arch. Biochem. Biophys. 208,477-486.
36. Norman, A. W., Mircheff, A. K., Adams, T. H., and Spielvogel, A. (1970) Biochem. Biophys. Acta. 215, 348-359.
37. Haussler, M. R., Nagode, L. A., and Rassmussen, H. (1970) Nature (London) 228,1199-1201.
38. Franchesci, R. T., James, W. M., and Zerlauth, G. (1985) J. Cell Physiol. 123, 401-409.
39. Manolagas, S. C., Burton, D. W., and Deftos, L. J. (1981) J. Biol. Chem. 256, 7115-7117.
40. Mulkins, M. A., Monolagas, S. C., Deftos, L. J., and Sussman, H. H. (1983) J. Biol. Chem. 258,6219-6225.
41. Mulkins, M. A., and Sussman, H. S. (1987) Endocrinology 120, 416-425.
42. Smith, M. W., Bruns, M. E., and Lawson, E. M. (1985) B&hem. J. 225, 127-133.
43. Bikle, D. D., Zolock, D., and Munson, S. (1984) Endocrinology 116, 2077-2084.
44. Nemere, I., Putkey, J. A., and Norman, A. W. (1983) Arch. Biochem. Biophys. 222, 610-620.
45. Giuliano, A. R., and Wood, R. (1990) Amer. Physiol., in press.