characterization of nanoparticles using atomic force microscopy
TRANSCRIPT
This content has been downloaded from IOPscience. Please scroll down to see the full text.
Download details:
IP Address: 208.0.112.30
This content was downloaded on 31/03/2014 at 15:15
Please note that terms and conditions apply.
Characterization of nanoparticles using Atomic Force Microscopy
View the table of contents for this issue, or go to the journal homepage for more
2007 J. Phys.: Conf. Ser. 61 971
(http://iopscience.iop.org/1742-6596/61/1/192)
Home Search Collections Journals About Contact us My IOPscience

Characterization of nanoparticles using Atomic Force Microscopy
A Rao1, M Schoenenberger, E Gnecco, Th Glatzel, E Meyer. Institute of Physik, University of Basel, Klingelbergstrasse 82, 4056Basel, Switzerland.
D. Brändlin. Nanosurf AG, 4410Liestal, Switzerland
L. Scandella. Unterer Rütschetenweg 8A, 4133Pratteln, Switzerland
E-mail:[email protected]
Abstract. Nanoparticles are becoming increasingly important in many areas, including catalysis, biomedical applications, and information storage. Their unique size-dependent properties make these materials superior. Using the Atomic Force Microscope (AFM), individual particles and groups of particles can be resolved and unlike other microscopy techniques, the AFM offers visualization and analysis in three dimensions. We prepared titanium oxide, zirconium oxide and alumina nanoparticles and/or agglomerates on different surfaces and characterized them by AFM in the dynamic mode. The goal was to determine the shape, size and/or size distribution of nanoparticles. Different dilutions of nanoparticles were applied on various substrates e.g. clean silicon, mica and chemically treated silicon and imaged at ambient conditions. Nanoparticles deposited on mica appeared to be coagulated as compared to those on silicon. Whereas, on a chemically treated surface the density of the nanoparticles was very low because of the increased hydrophobicity of the surface.
1. Introduction Particles on the nanometer scale have unique optical, electronic, and structural properties that are not available in either isolated molecules or bulk solids. Nanoparticles are also becoming increasingly important in many areas, including catalysis [1], biological applications [2] and information storage [3]. Their unique size-dependent properties make these materials superior. Titanium oxide (TiO2)nanoparticles are used in pigments, gas and humidity sensors, dielectric ceramics, support of catalysis, solar cells [4-9] and other applications. Zirconium oxide (ZrO2) is widely used as an oxygen sensor in automobile engines or furnaces [10]. In catalytic reactions, ZrO2 can act as a catalyst and as a supporting material [11, 12]. Alumina (Al2O3) nanoparticles are used in a large extent in biomedical applications [13].
Using the atomic force microscope (AFM), individual particles and groups of particles can be visualized and unlike other microscopy techniques, the AFM offers visualization in three dimensions. Here, we characterized TiO2, ZrO2 and Al2O3 nanoparticles using the AFM by depositing them on different substrates, e.g. mica, clean silicon (Si) and chemically treated silicon (Si).
1 Author to whom any correspondence should be addressed.
IOP Publishing Journal of Physics: Conference Series 61 (2007) 971–976doi:10.1088/1742-6596/61/1/192 International Conference on Nanoscience and Technology (ICN&T 2006)
971© 2007 IOP Publishing Ltd

2. Preparation and Experimental set-up All measurements were performed at ambient conditions with commercial instruments (MultiMode, NanoScope IV from Veeco Instruments Inc, USA and Mobile S from Nanosurf AG, Switzerland). As force sensors for imaging, different n-doped silicon cantilevers (NanosensorsTM) with resonance frequencies of f0 = 190 kHz and 330 kHz, and spring constants of k = 48N/m and 42N/m, respectively, were used.
The Nanosurf scan head was enclosed within a box (17 litres minicooler, Intertronic, Switzerland). Humidity was reduced by placing silica gel inside the box. Humidity and Temperature was monitored by lab-view programme. Imaging was done in the non-contact dynamic mode at ambient conditions with humidity of 30 - 40 %. All images have been processed for better quality. The topographic images have been merged with their derivatives.
2.1. NanoparticlesTiO2 and ZrO2 nanoparticles (Bühler AG, Switzerland) were in the form of aqueous suspensions, both at a concentration of 20% (w/w). The average size of TiO2 and ZrO2 particles estimated by optical characterization techniques was 8 ± 3 nm and 11 ± 3 nm, respectively. The surface of these particles was chemically modified2 so as to prevent aggregation.
The Al2O3 nanopowder (Qinetiq nanomaterials, UK) was prepared by vapour phase condensation. This process resulted in spherical particles in the form of agglomerates having a mean size of 100 ± 50 nm and/or soft agglomerates having a size of 5 – 200 m.
2.2. Sample preparation technique The nanoparticles were first diluted in deionized water to an appropriate concentration and then ultrasonicated for 15 - 30 minutes. 50 l of the dilution were put on a cleaned substrate (Si was cleaned with ethanol then dried with a nitrogen steam; mica was freshly cleaved before use), incubated for 5 – 20 minutes depending on the density of particles required, and then the residual solution was blown by a stream of nitrogen. This general method was followed for all samples.
In case of modifying the clean Si surface of the substrate before depositing nanoparticles, APTES (3-Amino Propyl Triethoxy Silane) (Fluka, Switzerland) was used for the silanization process. The untreated Si substrates were cleaned with ethanol in an ultrasonic bath for 10 minutes, dried with nitrogen and then left in an ozone chamber for 5 minutes. The cleaned substrates were then exposed to an APTES atmosphere by suspending them in a glass desiccator which contained a small amount of APTES and toluene in a ratio of 1:10 for 1 hour. [14, 15].
3. Results and Discussion.
3.1. Imaging different dilutions of TiO2 nanoparticles Different dilutions of TiO2 nanoparticles were imaged by AFM on freshly cleaned Si substrates (figure 1). An increase in dilution reduces the density of the nanoparticles on the surface. The lateral sizes of the nanoparticles varied from image to image because of the variation in the tip shape. However, the height was found to be relatively constant 9-11nm.
2 Process patented by Bühler AG, Switzerland.
972

Figure 1: Topography images of TiO2 nanoparticles on Silicon; frame size: 1 m. The deposition of nanoparticles was accomplished by using a dilution of (a) 1:10, (b) 1:40 and (c) 1:50 from a 0.04% aqueous TiO2-suspension. The height of the nanoparticles is in the range of 9-11 nm.
3.2. Imaging ZrO2 nanoparticles on different substratesIn figure 2, ZrO2 nanoparticles were deposited on two different substrates. 50 l of a suspension of ZrO2 nanoparticles was applied on clean Si and mica, incubated for 5 minutes then blown dry with a stream of nitrogen. The nanoparticles on mica (figure 2 (a)) appear coagulated whereas those on Si (figure 2 (b)) appear more separated. Mica which is very hydrophilic may have traces of the solution even after it is blow dried. This may cause the nanoparticles to form agglomerates. Although the density of nanoparticles was the same on both Si and mica. A larger drift was observed while imaging nanoparticles on mica as compared to that on Si.
a
c
300 nm
300nm
b300nm
c
973

Figure 2: Topography images of ZrO2 nanoparticles (0.04%) on (a) silicon and on (b) mica.
3.3. Imaging of Al2O3 nanoparticles Figure 3 shows an AFM image of Al2O3 nanoparticles on a clean Si substrate. It seems that the Al2O3nanoparticles which are bare tend to agglomerate easily as compared to the TiO2 and ZrO2nanoparticles. This may be because the surfaces of the latter are chemically modified so that they remain well separated. Imaging of Al2O3 nanoparticles was relatively difficult because the tip would get blunt very fast during scanning due to the large sizes of these agglomerates.
Figure 3: Al203 (0.02%) nanoparticles deposited on Silicon. Height of the nanoparticles is about 50nm.
3.4. Imaging nanoparticles on chemically treated Si substrateNanoparticles were also imaged on chemically treated substrates. In Figure 4, clean Si was modified with APTES, a silanizing reagent, thereby increasing the hydrophobicity of the surface. The density of TiO2 nanoparticles on clean Si surface (figure 4(a)) is very high as compared to that of chemically treated Si (figure 4(b)). Chemical treatment on a Si surface has increased the hydrophobicity of the surface thereby reducing adhesion of nanoparticles. Despite the same concentration in the solution, figure (a) shows 707 particles and figure (b) shows only 11 particles.
It was seen that chemical treatment (silanization) increases the hydrophobicity of the Si substrate. When an aqueous suspension of nanoparticles is deposited on this substrate, the surface repels the suspension and hence the nanoparticles do not adhere to the surface. This is why there is a reduced density of TiO2 nanoparticles on a chemically treated Si substrate.
300 nm 300nm
200 nm
ba
974
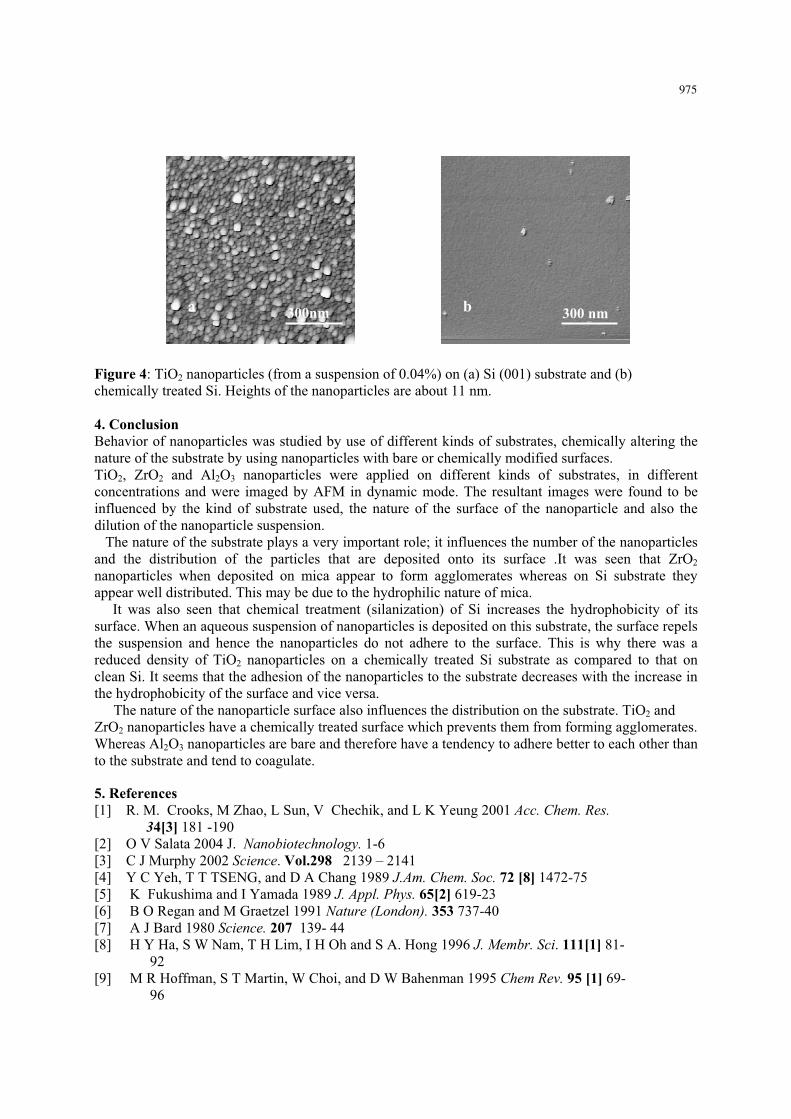
Figure 4: TiO2 nanoparticles (from a suspension of 0.04%) on (a) Si (001) substrate and (b) chemically treated Si. Heights of the nanoparticles are about 11 nm.
4. Conclusion Behavior of nanoparticles was studied by use of different kinds of substrates, chemically altering the nature of the substrate by using nanoparticles with bare or chemically modified surfaces. TiO2, ZrO2 and Al2O3 nanoparticles were applied on different kinds of substrates, in different concentrations and were imaged by AFM in dynamic mode. The resultant images were found to be influenced by the kind of substrate used, the nature of the surface of the nanoparticle and also the dilution of the nanoparticle suspension. The nature of the substrate plays a very important role; it influences the number of the nanoparticles and the distribution of the particles that are deposited onto its surface .It was seen that ZrO2nanoparticles when deposited on mica appear to form agglomerates whereas on Si substrate they appear well distributed. This may be due to the hydrophilic nature of mica. It was also seen that chemical treatment (silanization) of Si increases the hydrophobicity of its surface. When an aqueous suspension of nanoparticles is deposited on this substrate, the surface repels the suspension and hence the nanoparticles do not adhere to the surface. This is why there was a reduced density of TiO2 nanoparticles on a chemically treated Si substrate as compared to that on clean Si. It seems that the adhesion of the nanoparticles to the substrate decreases with the increase in the hydrophobicity of the surface and vice versa.
The nature of the nanoparticle surface also influences the distribution on the substrate. TiO2 and ZrO2 nanoparticles have a chemically treated surface which prevents them from forming agglomerates. Whereas Al2O3 nanoparticles are bare and therefore have a tendency to adhere better to each other than to the substrate and tend to coagulate.
5. References [1] R. M. Crooks, M Zhao, L Sun, V Chechik, and L K Yeung 2001 Acc. Chem. Res.
34[3] 181 -190[2] O V Salata 2004 J. Nanobiotechnology. 1-6[3] C J Murphy 2002 Science. Vol.298 2139 – 2141[4] Y C Yeh, T T TSENG, and D A Chang 1989 J.Am. Chem. Soc. 72 [8] 1472-75 [5] K Fukushima and I Yamada 1989 J. Appl. Phys. 65[2] 619-23 [6] B O Regan and M Graetzel 1991 Nature (London). 353 737-40 [7] A J Bard 1980 Science. 207 139- 44 [8] H Y Ha, S W Nam, T H Lim, I H Oh and S A. Hong 1996 J. Membr. Sci. 111[1] 81-
92 [9] M R Hoffman, S T Martin, W Choi, and D W Bahenman 1995 Chem Rev. 95 [1] 69-
96
300nm 300 nm a b
975
[10] D Yuan and F A Kroger 1969 J. Electrochem. Soc. 116 [5] 594-600 [11] M Amberg and J R. Guenter, 1996 Solid state Ionics. 84 [3-4] 313-21 [12] A. Chatterjee, S K Pradhan, A Datta, M De, and D Chakravorty 1994 J. Mater.
Res. 9[2] 263-65 [13] L G Gutwein, T J Webster Ceramic Engineering and Science Proceedings
(USA). 23 [4] 773-780. [14] P Hoffmann, G Kulik, and L Barbieri, Swiss Patent Applications #DE10248775-
A1 (18 October 2002); WO2004037446-A1 (17 October 2003). [15] Y L LYyubchenko, P I Oden, D Lampner, S M Lindsay and K A Dunker 1993
Nucleic Acids Research 21 [5] 1117-1123
Acknowledgments This work was supported by the Swiss National Science Foundation,, the National Center of Competence in Research on Nanoscale Science, the Kommission zur Förderung von Technologie und Innnovation and the European Science Foundation Nanotribo Program. Discussions with V. Thommen are greatully acknowledged. Nanopowder material was kindly provided by Bühler AG, Switzerland and Qinetiq nanomaterials, UK.
976