characterization of flexible polyurethane foams based on soybean-based polyols
TRANSCRIPT
Characterization of Flexible Polyurethane Foamsbased on Soybean-Based Polyols
Sudipto Das,1 Mahendra Dave,2 G. L. Wilkes1
1Department of Chemical Engineering, Virginia Tech, Blacksburg, Virginia 24061-02112BioBased Technologies, 1315 N 13th Street, Rogers, Arkansas 72756
Received 29 January 2008; accepted 2 June 2008DOI 10.1002/app.29402Published online 29 December 2008 in Wiley InterScience (www.interscience.wiley.com).
ABSTRACT: Two series of flexible polyurethane foamswere fabricated by substituting conventional petroleum-based polyols with increasing amounts of soy-based poly-ols (SBP) having different hydroxyl numbers. The mechan-ical properties of the foams were characterized by stress–strain analysis in the compression mode and DMA in ten-sion mode, the cellular morphology was analyzed by SEMand the microphase-separation of the foams was noted by
SAXS. Our results showed that the cellular morphologyand mechanical properties of the flexible foams wereaffected significantly by the foam fabrication method andSBP hydroxyl numbers. VVC 2008 Wiley Periodicals, Inc. J ApplPolym Sci 112: 299–308, 2009
Key words: polyurethane; renewable resources; micro-structure; morphology; mechanical properties
INTRODUCTION
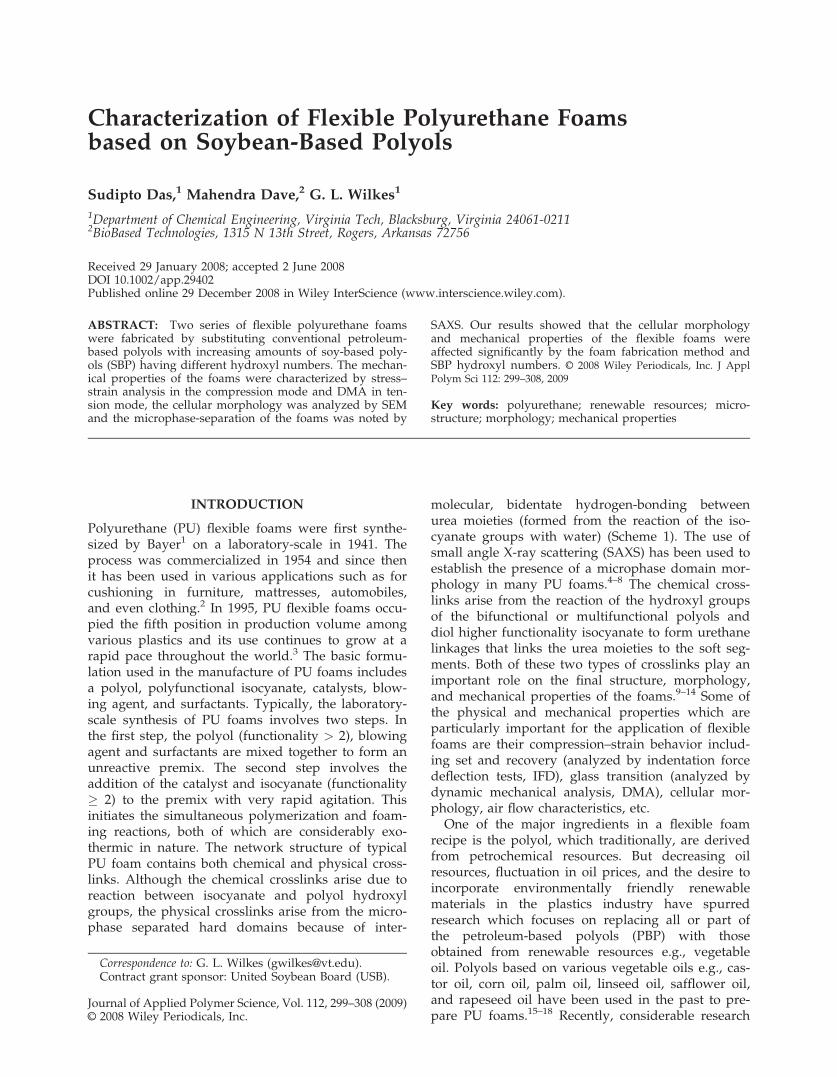
Polyurethane (PU) flexible foams were first synthe-sized by Bayer1 on a laboratory-scale in 1941. Theprocess was commercialized in 1954 and since thenit has been used in various applications such as forcushioning in furniture, mattresses, automobiles,and even clothing.2 In 1995, PU flexible foams occu-pied the fifth position in production volume amongvarious plastics and its use continues to grow at arapid pace throughout the world.3 The basic formu-lation used in the manufacture of PU foams includesa polyol, polyfunctional isocyanate, catalysts, blow-ing agent, and surfactants. Typically, the laboratory-scale synthesis of PU foams involves two steps. Inthe first step, the polyol (functionality > 2), blowingagent and surfactants are mixed together to form anunreactive premix. The second step involves theaddition of the catalyst and isocyanate (functionality� 2) to the premix with very rapid agitation. Thisinitiates the simultaneous polymerization and foam-ing reactions, both of which are considerably exo-thermic in nature. The network structure of typicalPU foam contains both chemical and physical cross-links. Although the chemical crosslinks arise due toreaction between isocyanate and polyol hydroxylgroups, the physical crosslinks arise from the micro-phase separated hard domains because of inter-
molecular, bidentate hydrogen-bonding betweenurea moieties (formed from the reaction of the iso-cyanate groups with water) (Scheme 1). The use ofsmall angle X-ray scattering (SAXS) has been used toestablish the presence of a microphase domain mor-phology in many PU foams.4–8 The chemical cross-links arise from the reaction of the hydroxyl groupsof the bifunctional or multifunctional polyols anddiol higher functionality isocyanate to form urethanelinkages that links the urea moieties to the soft seg-ments. Both of these two types of crosslinks play animportant role on the final structure, morphology,and mechanical properties of the foams.9–14 Some ofthe physical and mechanical properties which areparticularly important for the application of flexiblefoams are their compression–strain behavior includ-ing set and recovery (analyzed by indentation forcedeflection tests, IFD), glass transition (analyzed bydynamic mechanical analysis, DMA), cellular mor-phology, air flow characteristics, etc.One of the major ingredients in a flexible foam
recipe is the polyol, which traditionally, are derivedfrom petrochemical resources. But decreasing oilresources, fluctuation in oil prices, and the desire toincorporate environmentally friendly renewablematerials in the plastics industry have spurredresearch which focuses on replacing all or part ofthe petroleum-based polyols (PBP) with thoseobtained from renewable resources e.g., vegetableoil. Polyols based on various vegetable oils e.g., cas-tor oil, corn oil, palm oil, linseed oil, safflower oil,and rapeseed oil have been used in the past to pre-pare PU foams.15–18 Recently, considerable research
Journal of Applied Polymer Science, Vol. 112, 299–308 (2009)VVC 2008 Wiley Periodicals, Inc.
Correspondence to: G. L. Wilkes ([email protected]).Contract grant sponsor: United Soybean Board (USB).
efforts have been focused on the development ofPU’s from polyols based on soybean oil because thelatter is relatively inexpensive, readily available (it isone of the major crops in North and South America)and research has shown that soybean oil containingPU’s may have quite comparable thermal-, oxida-tive-, and weather-stability relative to PUs com-prised solely of PBP-based PU’s.19
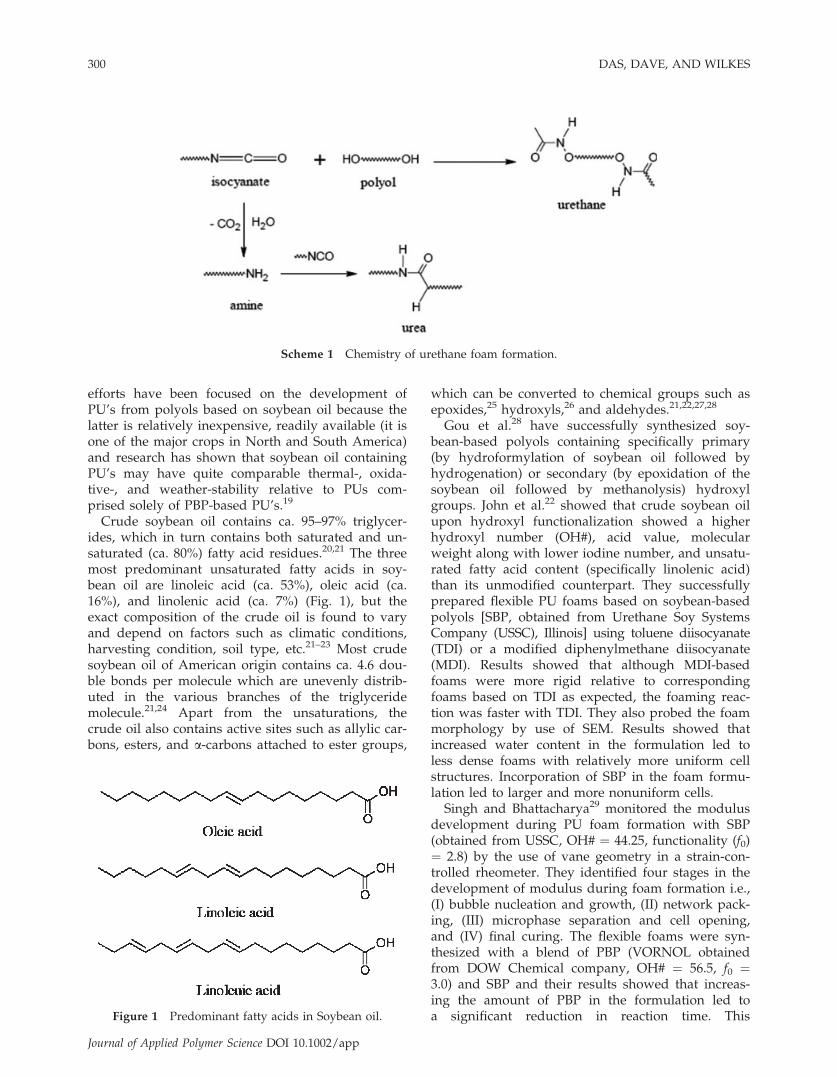
Crude soybean oil contains ca. 95–97% triglycer-ides, which in turn contains both saturated and un-saturated (ca. 80%) fatty acid residues.20,21 The threemost predominant unsaturated fatty acids in soy-bean oil are linoleic acid (ca. 53%), oleic acid (ca.16%), and linolenic acid (ca. 7%) (Fig. 1), but theexact composition of the crude oil is found to varyand depend on factors such as climatic conditions,harvesting condition, soil type, etc.21–23 Most crudesoybean oil of American origin contains ca. 4.6 dou-ble bonds per molecule which are unevenly distrib-uted in the various branches of the triglyceridemolecule.21,24 Apart from the unsaturations, thecrude oil also contains active sites such as allylic car-bons, esters, and a-carbons attached to ester groups,
which can be converted to chemical groups such asepoxides,25 hydroxyls,26 and aldehydes.21,22,27,28
Gou et al.28 have successfully synthesized soy-bean-based polyols containing specifically primary(by hydroformylation of soybean oil followed byhydrogenation) or secondary (by epoxidation of thesoybean oil followed by methanolysis) hydroxylgroups. John et al.22 showed that crude soybean oilupon hydroxyl functionalization showed a higherhydroxyl number (OH#), acid value, molecularweight along with lower iodine number, and unsatu-rated fatty acid content (specifically linolenic acid)than its unmodified counterpart. They successfullyprepared flexible PU foams based on soybean-basedpolyols [SBP, obtained from Urethane Soy SystemsCompany (USSC), Illinois] using toluene diisocyanate(TDI) or a modified diphenylmethane diisocyanate(MDI). Results showed that although MDI-basedfoams were more rigid relative to correspondingfoams based on TDI as expected, the foaming reac-tion was faster with TDI. They also probed the foammorphology by use of SEM. Results showed thatincreased water content in the formulation led toless dense foams with relatively more uniform cellstructures. Incorporation of SBP in the foam formu-lation led to larger and more nonuniform cells.Singh and Bhattacharya29 monitored the modulus
development during PU foam formation with SBP(obtained from USSC, OH# ¼ 44.25, functionality (f0)¼ 2.8) by the use of vane geometry in a strain-con-trolled rheometer. They identified four stages in thedevelopment of modulus during foam formation i.e.,(I) bubble nucleation and growth, (II) network pack-ing, (III) microphase separation and cell opening,and (IV) final curing. The flexible foams were syn-thesized with a blend of PBP (VORNOL obtainedfrom DOW Chemical company, OH# ¼ 56.5, f0 ¼3.0) and SBP and their results showed that increas-ing the amount of PBP in the formulation led toa significant reduction in reaction time. ThisFigure 1 Predominant fatty acids in Soybean oil.
Scheme 1 Chemistry of urethane foam formation.
300 DAS, DAVE, AND WILKES
Journal of Applied Polymer Science DOI 10.1002/app
phenomenon was attributed to the presence of ‘‘pri-mary’’ hydroxyl groups in the PBP, which are signif-icantly more reactive than the ‘‘secondary’’ hydroxylgroups in the SBP. They also synthesized two SBP’sby ozonolysis of soybean oil (which introduced sec-ondary OH groups, OH# ¼ 64 and 78, f0 ¼ 2.3 and2.8, respectively). The use of ozonized soybean oilwas also found to lead to faster urea microphaseseparation and decreased overall reaction time(based on rheological analysis) than other SBPs (i.e.,obtained from USSC), because of higher hydroxylnumber in the former. Further, scanning electron mi-croscopic (SEM) analysis showed that in their SBP-based foams, a coarser texture and more closed cellstructures were produced relative to PBP foams.
Mielewski et al.30 fabricated flexible PU foamscontaining various amounts of SBP’s of an unknownsource with MDI and showed that foams containing40 and 60 wt % SBP’s had comparable density, com-pression-set, tensile strength, and tear-resistance tocompletely PBP-based flexible foams. Herringtonand Malsam31 synthesized flexible foams by substi-tuting 30% of the total polyol with SBP, which wereshown to possess high-load bearing properties with-out any odor or density changes. More recently,Zhang et al.32 studied the foam morphology of flexi-ble PU foams prepared by replacing PBP with a SBP(which was functionalized by epoxidation followedby oxirane ring-opening reaction). Their resultsshowed the presence of a higher Tg SBP-rich phase,higher hard segment ordering and enhanced harddomain ordering in SBP-based foams, which in turnimproved the compressive modulus of the foamscompared to solely PBP-based foams.
This main objective of the work reported here isto probe some of the effects of the systematicreplacement of PBP’s with various SBP’s on the mor-phology and mechanical properties of the PU foams.Two different flexible PU foam series were fabri-cated. The first series (Series A) was synthesized in alarge wooden box (2200 � 2200 � 4200) by systematicreplacement of the PBP (ARCOL F3022 from Bayer)with a SBP (Agrol-A with an OH# 114). The secondfoam series (Series B) was synthesized in 1000 mLpopcorn cups (length ¼ 145 mm, lower diameter ¼85 mm, upper diameter ¼ 105 mm), using a differentPBP (VORNOL 3136 from DOW Chemical Com-pany) and a different SBP (Agrol-B with an OH# of140). Although the properties of the SBP werechanged in the two series, the two PBP’s used in thisstudy (though obtained from different sources) weresimilar to each other (detailed properties of the variouspolyols used in this study are described in Table I).The effect of the polyol OH# and foam fabrication pro-cess on the cellular morphology (by FESEM), presenceof microphase separation of the urea hard domainsfrom the incompatible soft matrix (by SAXS), thermal
transitional behavior (by DMA), overall durability (byperforming compressive mechanical hysteresis tests),and firmness by indentation force deflection (IFD)measurements of the flexible PU foams were deter-mined in this study and will be reported.
EXPERIMENTAL
Materials
As briefly mentioned earlier, the first foam seriesformulation that was prepared in a large woodenbox contained the following ingredients: PBP(ARCOL F3022, obtained from Bayer), SBP (Agrol-Aobtained from BioBased Technology (BBT)), surfac-tant (L-620, obtained from GE Silicone), catalysts (D-19 and C-183, both obtained from GE Silicone), andTDI (80/20 isomer mixture, obtained from Bayer).The second foam formulations which were synthe-sized in 1000 mL plastic foam cups contained the fol-lowing ingredients: PBP (VORNOL 3136, obtainedfrom DOW Chemical Company), SBP (Agrol-Bobtained from BBT), surfactant (DABCO DC198,obtained from Air Products), catalysts (DABCOBL33LVand DABCO T12, both obtained from AirProducts), and TDI was obtained from Aldrich Chemi-cal Company. All the materials were used as received.
Hydroxylation of soybean oil
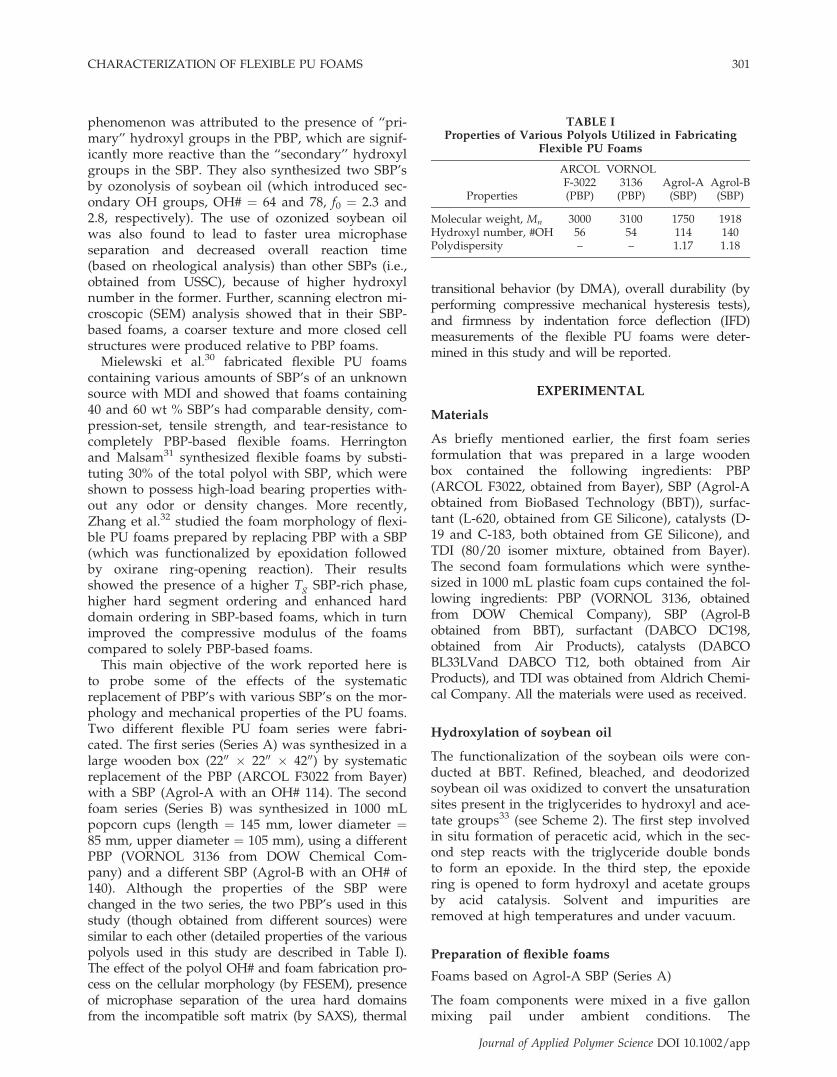
The functionalization of the soybean oils were con-ducted at BBT. Refined, bleached, and deodorizedsoybean oil was oxidized to convert the unsaturationsites present in the triglycerides to hydroxyl and ace-tate groups33 (see Scheme 2). The first step involvedin situ formation of peracetic acid, which in the sec-ond step reacts with the triglyceride double bondsto form an epoxide. In the third step, the epoxidering is opened to form hydroxyl and acetate groupsby acid catalysis. Solvent and impurities areremoved at high temperatures and under vacuum.
Preparation of flexible foams
Foams based on Agrol-A SBP (Series A)
The foam components were mixed in a five gallonmixing pail under ambient conditions. The
TABLE IProperties of Various Polyols Utilized in Fabricating
Flexible PU Foams
Properties
ARCOLF-3022(PBP)
VORNOL3136(PBP)
Agrol-A(SBP)
Agrol-B(SBP)
Molecular weight, Mn 3000 3100 1750 1918Hydroxyl number, #OH 56 54 114 140Polydispersity – – 1.17 1.18
CHARACTERIZATION OF FLEXIBLE PU FOAMS 301
Journal of Applied Polymer Science DOI 10.1002/app
surfactant (L-620), catalysts (D-19 and C-183), anddeionized water were added to the polyols (ARCOL3022 and Agrol-A) mixed at 3500 rpm for 60 s. Thediisocyanate (TDI 80/20) was then added to the pol-yol and additive blends. The formulation blend wasmixed at 3500 rpm for 10 s and immediately trans-ferred to a wooden box lined with polyfilm, where itwas allowed to rise. The foam was allowed to fur-ther cure overnight, under ambient conditions.
Foams based on Agrol-B SBP (Series B)
Foams samples were each synthesized in a 1000 mLpopcorn cup, under ambient conditions. Initially,surfactant (DABCO DC198), catalysts (DABCOBL33LV and T12), and deionized water were addedto the polyol and mixed at 2250 rpm for 15 s (VWRPower Max Elite Dual speed mixer). The diisocya-nate was then added to the formulation (to obtainan isocyanate index of 1.1) and mixed at 2250 rpmfor 10 s. The mixture was then allowed to rise andcure for 24 h, under ambient conditions.
Characterization techniques
Dynamic mechanical analysis (DMA)
Tests were performed on a Seiko DMS 210 tensilemodule with auto-cooler for precise temperaturecontrol. Rectangular foam samples (12 � 4 � 2 mm3)were cut from the core of the foams and deformedalong the blow direction (1 Hz frequency, 10 lm am-plitude) in the tension mode, under a dry nitrogenatmosphere. The temperature was increased from�130 to 150�C, at a heating rate of 2�C/min.
Scanning electron microscopy (SEM)
Crushed foam samples were initially sputter coatedwith Au-Pd to a thickness of ca. 40 nm. The sampleswere then inserted in a Leo 1550 FESEM and micro-
graphs were obtained at a working distance of ca. 26mm and accelerating voltage of 20 kV. Images wereobtained at a direction perpendicular to the blowdirection.Compression mechanical hysteresis. The mechanicalhysteresis (MH) of the samples were measuredusing 30 � 30 � 30 mm3 foam samples in the com-pression mode on an Instron Model 4400 UniversalTesting System controlled by Series IX software.Each sample was preconditioned by deforming ittwice (perpendicular to the blow direction) to 75%of its initial thickness, at a rate of 240 mm/min, afterwhich they were allowed to relax for 6 min, withoutany applied load. The samples were then cyclicallycompressed four times, to 75% of their initial thick-ness at 50 mm/min. Data was collected only duringthe last four cyclic deformation steps.Indentation force deflection test. All the flexible foamswere subjected to the indentation force deflectiontest (IFD) (ASTM D3574 95 B1) on the same INS-TRON machine used in the MH test. Samples (30 �30 � 30 mm3) were preconditioned as mentionedearlier in the hysteresis test. The samples were com-pressed to 25% of its initial thickness at 50 mm/minand held in that deformed state for 1 min. The stresson the sample in this state (i.e., 25% deformation after1 min) was reported as the 25% IFD value. The samplewas then further compressed to 65% of the initial sam-ple thickness and held in that deformed condition for1 min (65% IFD). The sample was then unloaded to25% of the initial thickness, held for 1 min (25% returnIFD) and was then completely unloaded.The support factor (SF) was calculated as the ratio
of 65% IFD to 25% IFD.Small angle X-ray scattering. Small-angle scattering(SAXS) measurements on the silica powders wereperformed using a Bonse-Hart camera covering a q-range of 0.0002–0.4 A�1 (Beam line ID-33, AdvancedPhoton Source, Argonne National Laboratory,Argonne, IL). The X-ray beam was 0.4-mm high and2-mm wide. To assist SAXS measurements, eachfoam sample was compressed between two alumi-num plates to minimize void volume. The aluminumplates contained holes that were 1 cm in diameterfor the X-ray beam to pass through. The foams,when compressed, had thicknesses that ranged from4 to 6 mm. The data were corrected for sampletransmission and for background scattering arisingfrom air. The slit-smeared data were desmearedwith Indra software (available on-line at www.uni.aps.anl.gov) and analyzed with Irena software,also available from Argonne National Laboratory.
RESULTS AND DISCUSSION
As stated earlier, two series of flexible PU foamswere fabricated, where the PBP was increasingly
Scheme 2 Functionalization of soybean oil by epoxida-tion followed by hydroxylation.
302 DAS, DAVE, AND WILKES
Journal of Applied Polymer Science DOI 10.1002/app
replaced by SBP (Agrol-A in Series A and Agrol-B inSeries B) in the foam formulation (0, 10, 20, 30 wt %relative to PBP), while keeping the relative ratio ofthe other ingredients (i.e., surfactant, water, and var-ious catalysts) constant. Thus, this study wouldallow us to analyze the effect of SBP OH#, methodof foam synthesis and incorporation of SBP, on thecellular morphology and mechanical properties offlexible PU foams.
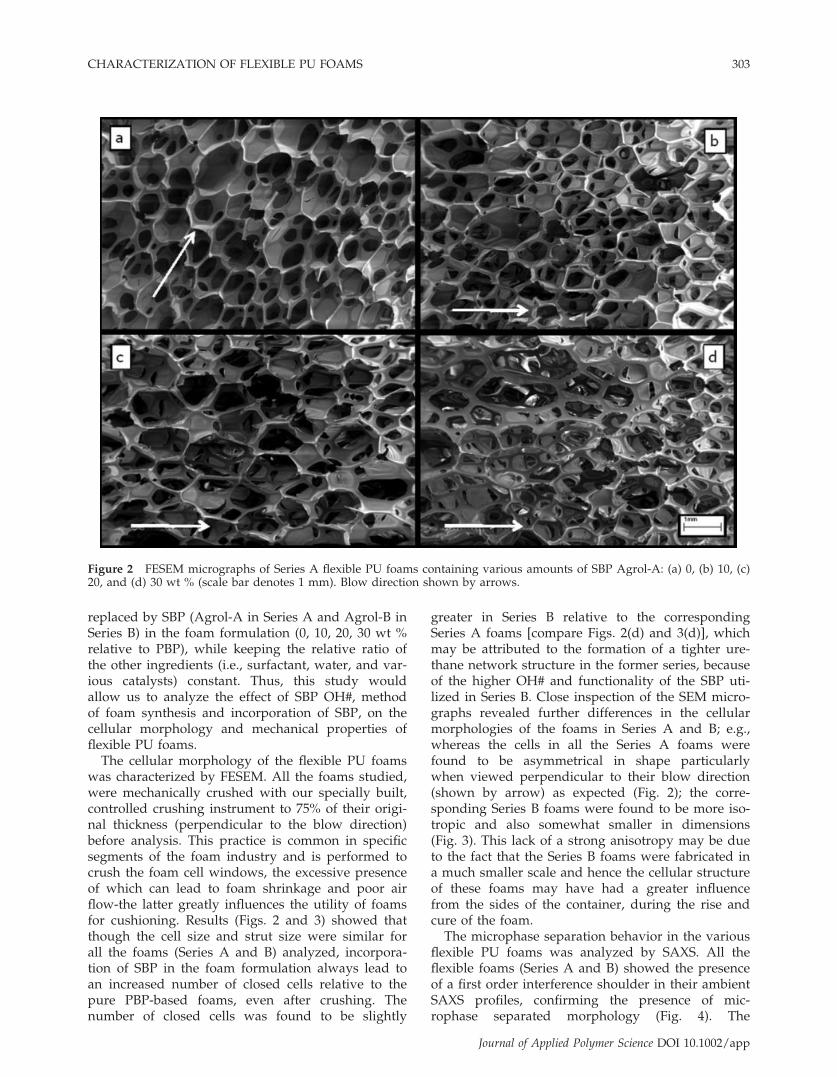
The cellular morphology of the flexible PU foamswas characterized by FESEM. All the foams studied,were mechanically crushed with our specially built,controlled crushing instrument to 75% of their origi-nal thickness (perpendicular to the blow direction)before analysis. This practice is common in specificsegments of the foam industry and is performed tocrush the foam cell windows, the excessive presenceof which can lead to foam shrinkage and poor airflow-the latter greatly influences the utility of foamsfor cushioning. Results (Figs. 2 and 3) showed thatthough the cell size and strut size were similar forall the foams (Series A and B) analyzed, incorpora-tion of SBP in the foam formulation always lead toan increased number of closed cells relative to thepure PBP-based foams, even after crushing. Thenumber of closed cells was found to be slightly
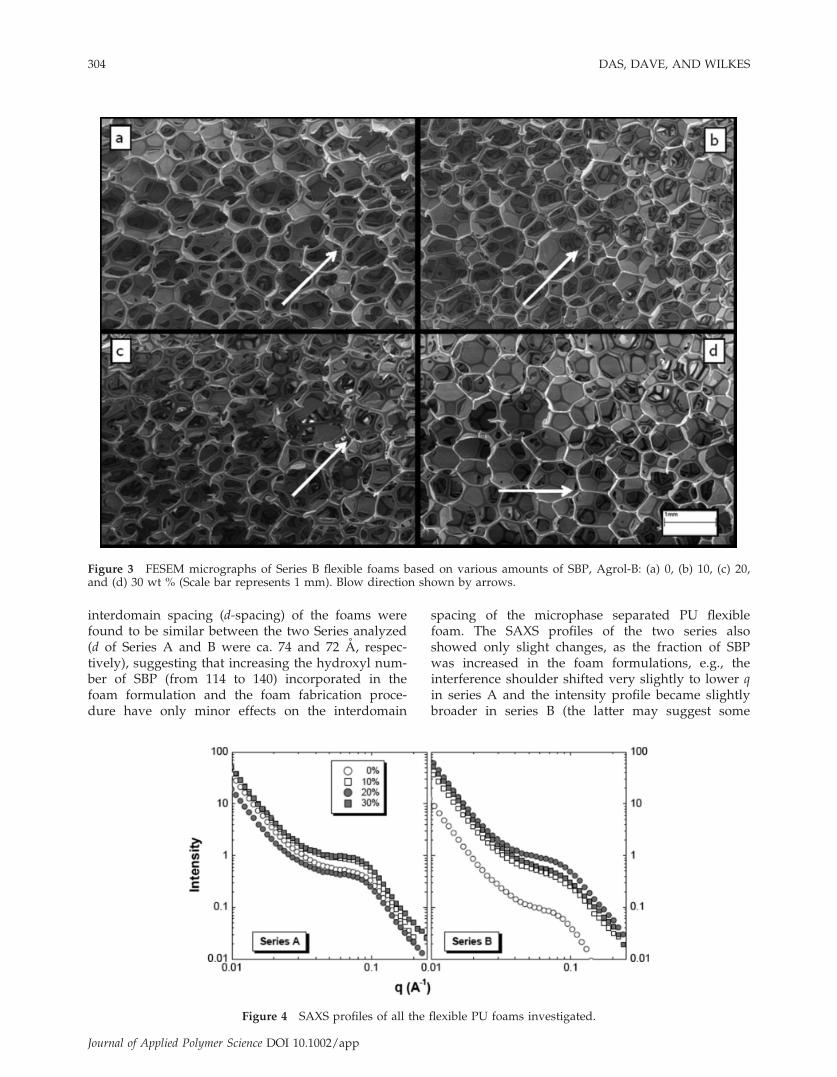
greater in Series B relative to the correspondingSeries A foams [compare Figs. 2(d) and 3(d)], whichmay be attributed to the formation of a tighter ure-thane network structure in the former series, becauseof the higher OH# and functionality of the SBP uti-lized in Series B. Close inspection of the SEM micro-graphs revealed further differences in the cellularmorphologies of the foams in Series A and B; e.g.,whereas the cells in all the Series A foams werefound to be asymmetrical in shape particularlywhen viewed perpendicular to their blow direction(shown by arrow) as expected (Fig. 2); the corre-sponding Series B foams were found to be more iso-tropic and also somewhat smaller in dimensions(Fig. 3). This lack of a strong anisotropy may be dueto the fact that the Series B foams were fabricated ina much smaller scale and hence the cellular structureof these foams may have had a greater influencefrom the sides of the container, during the rise andcure of the foam.The microphase separation behavior in the various
flexible PU foams was analyzed by SAXS. All theflexible foams (Series A and B) showed the presenceof a first order interference shoulder in their ambientSAXS profiles, confirming the presence of mic-rophase separated morphology (Fig. 4). The
Figure 2 FESEM micrographs of Series A flexible PU foams containing various amounts of SBP Agrol-A: (a) 0, (b) 10, (c)20, and (d) 30 wt % (scale bar denotes 1 mm). Blow direction shown by arrows.
CHARACTERIZATION OF FLEXIBLE PU FOAMS 303
Journal of Applied Polymer Science DOI 10.1002/app
interdomain spacing (d-spacing) of the foams werefound to be similar between the two Series analyzed(d of Series A and B were ca. 74 and 72 A, respec-tively), suggesting that increasing the hydroxyl num-ber of SBP (from 114 to 140) incorporated in thefoam formulation and the foam fabrication proce-dure have only minor effects on the interdomain
spacing of the microphase separated PU flexiblefoam. The SAXS profiles of the two series alsoshowed only slight changes, as the fraction of SBPwas increased in the foam formulations, e.g., theinterference shoulder shifted very slightly to lower qin series A and the intensity profile became slightlybroader in series B (the latter may suggest some
Figure 3 FESEM micrographs of Series B flexible foams based on various amounts of SBP, Agrol-B: (a) 0, (b) 10, (c) 20,and (d) 30 wt % (Scale bar represents 1 mm). Blow direction shown by arrows.
Figure 4 SAXS profiles of all the flexible PU foams investigated.
304 DAS, DAVE, AND WILKES
Journal of Applied Polymer Science DOI 10.1002/app
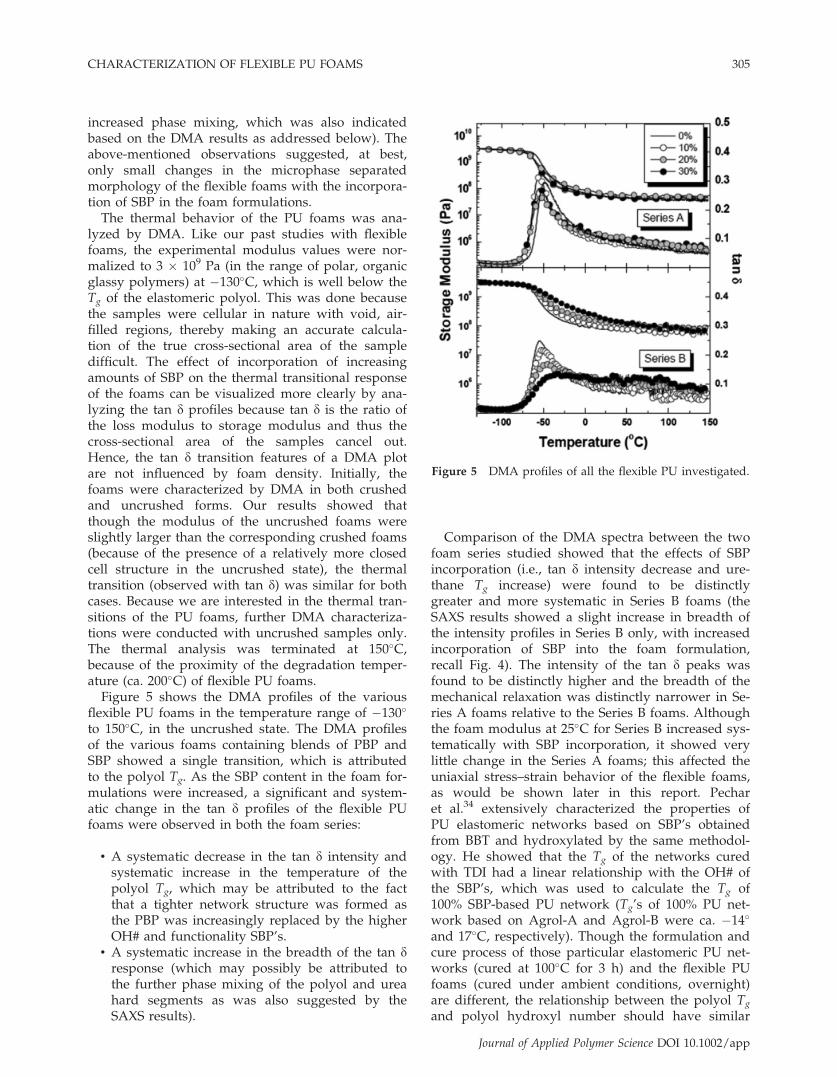
increased phase mixing, which was also indicatedbased on the DMA results as addressed below). Theabove-mentioned observations suggested, at best,only small changes in the microphase separatedmorphology of the flexible foams with the incorpora-tion of SBP in the foam formulations.
The thermal behavior of the PU foams was ana-lyzed by DMA. Like our past studies with flexiblefoams, the experimental modulus values were nor-malized to 3 � 109 Pa (in the range of polar, organicglassy polymers) at �130�C, which is well below theTg of the elastomeric polyol. This was done becausethe samples were cellular in nature with void, air-filled regions, thereby making an accurate calcula-tion of the true cross-sectional area of the sampledifficult. The effect of incorporation of increasingamounts of SBP on the thermal transitional responseof the foams can be visualized more clearly by ana-lyzing the tan d profiles because tan d is the ratio ofthe loss modulus to storage modulus and thus thecross-sectional area of the samples cancel out.Hence, the tan d transition features of a DMA plotare not influenced by foam density. Initially, thefoams were characterized by DMA in both crushedand uncrushed forms. Our results showed thatthough the modulus of the uncrushed foams wereslightly larger than the corresponding crushed foams(because of the presence of a relatively more closedcell structure in the uncrushed state), the thermaltransition (observed with tan d) was similar for bothcases. Because we are interested in the thermal tran-sitions of the PU foams, further DMA characteriza-tions were conducted with uncrushed samples only.The thermal analysis was terminated at 150�C,because of the proximity of the degradation temper-ature (ca. 200�C) of flexible PU foams.
Figure 5 shows the DMA profiles of the variousflexible PU foams in the temperature range of �130�
to 150�C, in the uncrushed state. The DMA profilesof the various foams containing blends of PBP andSBP showed a single transition, which is attributedto the polyol Tg. As the SBP content in the foam for-mulations were increased, a significant and system-atic change in the tan d profiles of the flexible PUfoams were observed in both the foam series:
• A systematic decrease in the tan d intensity andsystematic increase in the temperature of thepolyol Tg, which may be attributed to the factthat a tighter network structure was formed asthe PBP was increasingly replaced by the higherOH# and functionality SBP’s.
• A systematic increase in the breadth of the tan dresponse (which may possibly be attributed tothe further phase mixing of the polyol and ureahard segments as was also suggested by theSAXS results).
Comparison of the DMA spectra between the twofoam series studied showed that the effects of SBPincorporation (i.e., tan d intensity decrease and ure-thane Tg increase) were found to be distinctlygreater and more systematic in Series B foams (theSAXS results showed a slight increase in breadth ofthe intensity profiles in Series B only, with increasedincorporation of SBP into the foam formulation,recall Fig. 4). The intensity of the tan d peaks wasfound to be distinctly higher and the breadth of themechanical relaxation was distinctly narrower in Se-ries A foams relative to the Series B foams. Althoughthe foam modulus at 25�C for Series B increased sys-tematically with SBP incorporation, it showed verylittle change in the Series A foams; this affected theuniaxial stress–strain behavior of the flexible foams,as would be shown later in this report. Pecharet al.34 extensively characterized the properties ofPU elastomeric networks based on SBP’s obtainedfrom BBT and hydroxylated by the same methodol-ogy. He showed that the Tg of the networks curedwith TDI had a linear relationship with the OH# ofthe SBP’s, which was used to calculate the Tg of100% SBP-based PU network (Tg’s of 100% PU net-work based on Agrol-A and Agrol-B were ca. �14�
and 17�C, respectively). Though the formulation andcure process of those particular elastomeric PU net-works (cured at 100�C for 3 h) and the flexible PUfoams (cured under ambient conditions, overnight)are different, the relationship between the polyol Tg
and polyol hydroxyl number should have similar
Figure 5 DMA profiles of all the flexible PU investigated.
CHARACTERIZATION OF FLEXIBLE PU FOAMS 305
Journal of Applied Polymer Science DOI 10.1002/app
trends in both systems. Thus, the relatively greaterSBP effects observed in Series B may be attributed tothe incorporation of the higher Tg SBP which alsoleads to the formation of a relatively tighter networkthan the corresponding Series A foams.
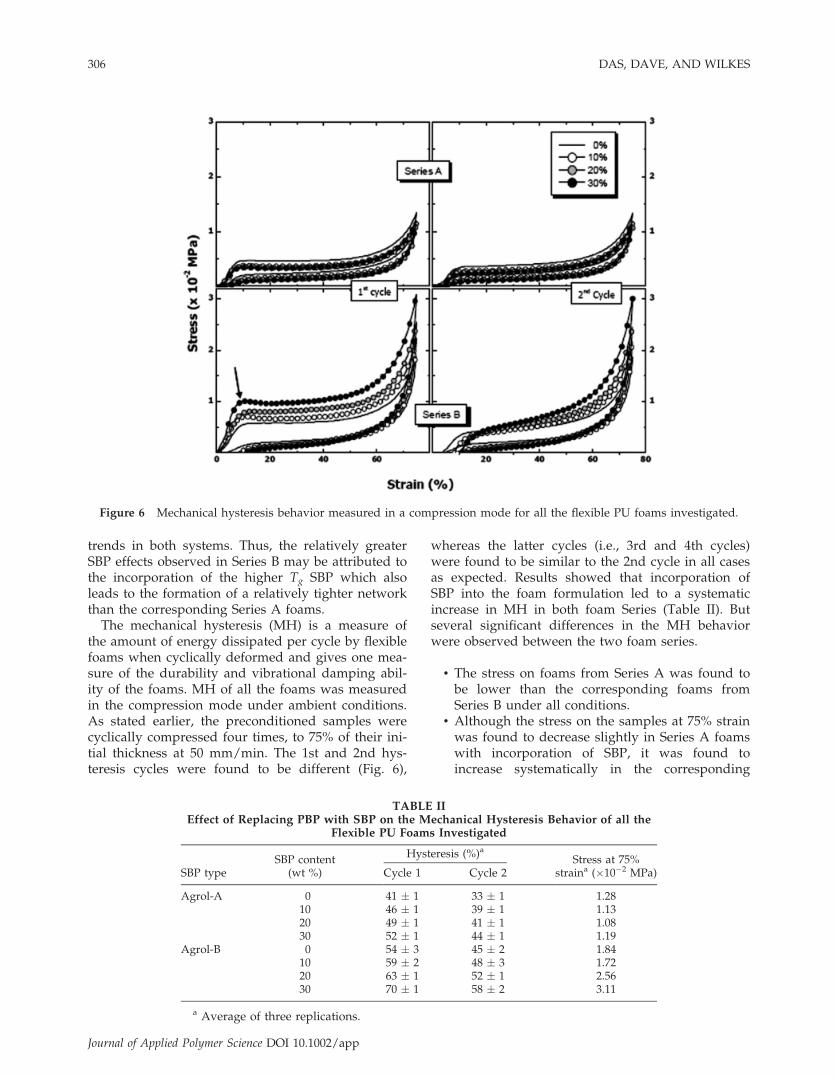
The mechanical hysteresis (MH) is a measure ofthe amount of energy dissipated per cycle by flexiblefoams when cyclically deformed and gives one mea-sure of the durability and vibrational damping abil-ity of the foams. MH of all the foams was measuredin the compression mode under ambient conditions.As stated earlier, the preconditioned samples werecyclically compressed four times, to 75% of their ini-tial thickness at 50 mm/min. The 1st and 2nd hys-teresis cycles were found to be different (Fig. 6),
whereas the latter cycles (i.e., 3rd and 4th cycles)were found to be similar to the 2nd cycle in all casesas expected. Results showed that incorporation ofSBP into the foam formulation led to a systematicincrease in MH in both foam Series (Table II). Butseveral significant differences in the MH behaviorwere observed between the two foam series.
• The stress on foams from Series A was found tobe lower than the corresponding foams fromSeries B under all conditions.
• Although the stress on the samples at 75% strainwas found to decrease slightly in Series A foamswith incorporation of SBP, it was found toincrease systematically in the corresponding
Figure 6 Mechanical hysteresis behavior measured in a compression mode for all the flexible PU foams investigated.
TABLE IIEffect of Replacing PBP with SBP on the Mechanical Hysteresis Behavior of all the
Flexible PU Foams Investigated
SBP typeSBP content
(wt %)
Hysteresis (%)aStress at 75%
straina (�10�2 MPa)Cycle 1 Cycle 2
Agrol-A 0 41 � 1 33 � 1 1.2810 46 � 1 39 � 1 1.1320 49 � 1 41 � 1 1.0830 52 � 1 44 � 1 1.19
Agrol-B 0 54 � 3 45 � 2 1.8410 59 � 2 48 � 3 1.7220 63 � 1 52 � 1 2.5630 70 � 1 58 � 2 3.11
a Average of three replications.
306 DAS, DAVE, AND WILKES
Journal of Applied Polymer Science DOI 10.1002/app
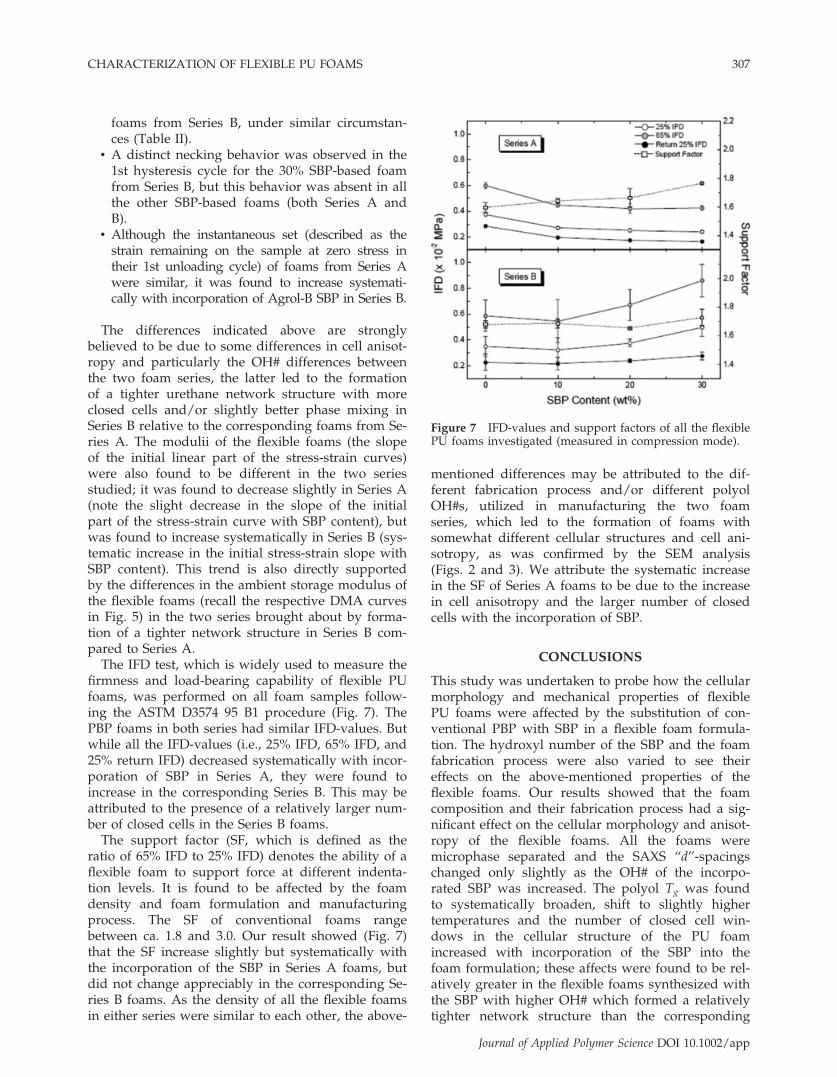
foams from Series B, under similar circumstan-ces (Table II).
• A distinct necking behavior was observed in the1st hysteresis cycle for the 30% SBP-based foamfrom Series B, but this behavior was absent in allthe other SBP-based foams (both Series A andB).
• Although the instantaneous set (described as thestrain remaining on the sample at zero stress intheir 1st unloading cycle) of foams from Series Awere similar, it was found to increase systemati-cally with incorporation of Agrol-B SBP in Series B.
The differences indicated above are stronglybelieved to be due to some differences in cell anisot-ropy and particularly the OH# differences betweenthe two foam series, the latter led to the formationof a tighter urethane network structure with moreclosed cells and/or slightly better phase mixing inSeries B relative to the corresponding foams from Se-ries A. The modulii of the flexible foams (the slopeof the initial linear part of the stress-strain curves)were also found to be different in the two seriesstudied; it was found to decrease slightly in Series A(note the slight decrease in the slope of the initialpart of the stress-strain curve with SBP content), butwas found to increase systematically in Series B (sys-tematic increase in the initial stress-strain slope withSBP content). This trend is also directly supportedby the differences in the ambient storage modulus ofthe flexible foams (recall the respective DMA curvesin Fig. 5) in the two series brought about by forma-tion of a tighter network structure in Series B com-pared to Series A.
The IFD test, which is widely used to measure thefirmness and load-bearing capability of flexible PUfoams, was performed on all foam samples follow-ing the ASTM D3574 95 B1 procedure (Fig. 7). ThePBP foams in both series had similar IFD-values. Butwhile all the IFD-values (i.e., 25% IFD, 65% IFD, and25% return IFD) decreased systematically with incor-poration of SBP in Series A, they were found toincrease in the corresponding Series B. This may beattributed to the presence of a relatively larger num-ber of closed cells in the Series B foams.
The support factor (SF, which is defined as theratio of 65% IFD to 25% IFD) denotes the ability of aflexible foam to support force at different indenta-tion levels. It is found to be affected by the foamdensity and foam formulation and manufacturingprocess. The SF of conventional foams rangebetween ca. 1.8 and 3.0. Our result showed (Fig. 7)that the SF increase slightly but systematically withthe incorporation of the SBP in Series A foams, butdid not change appreciably in the corresponding Se-ries B foams. As the density of all the flexible foamsin either series were similar to each other, the above-
mentioned differences may be attributed to the dif-ferent fabrication process and/or different polyolOH#s, utilized in manufacturing the two foamseries, which led to the formation of foams withsomewhat different cellular structures and cell ani-sotropy, as was confirmed by the SEM analysis(Figs. 2 and 3). We attribute the systematic increasein the SF of Series A foams to be due to the increasein cell anisotropy and the larger number of closedcells with the incorporation of SBP.
CONCLUSIONS
This study was undertaken to probe how the cellularmorphology and mechanical properties of flexiblePU foams were affected by the substitution of con-ventional PBP with SBP in a flexible foam formula-tion. The hydroxyl number of the SBP and the foamfabrication process were also varied to see theireffects on the above-mentioned properties of theflexible foams. Our results showed that the foamcomposition and their fabrication process had a sig-nificant effect on the cellular morphology and anisot-ropy of the flexible foams. All the foams weremicrophase separated and the SAXS ‘‘d’’-spacingschanged only slightly as the OH# of the incorpo-rated SBP was increased. The polyol Tg was foundto systematically broaden, shift to slightly highertemperatures and the number of closed cell win-dows in the cellular structure of the PU foamincreased with incorporation of the SBP into thefoam formulation; these affects were found to be rel-atively greater in the flexible foams synthesized withthe SBP with higher OH# which formed a relativelytighter network structure than the corresponding
Figure 7 IFD-values and support factors of all the flexiblePU foams investigated (measured in compression mode).
CHARACTERIZATION OF FLEXIBLE PU FOAMS 307
Journal of Applied Polymer Science DOI 10.1002/app
lower OH# SBP analogue. The mechanical propertiesof the flexible foams were also found to change sys-tematically with incorporation of the SBP. Thus, ourresults clearly show that SBP can be utilized to pro-duce foams possessing respectable properties.
The authors would like to thank Dow Chemical Companyfor donating the petro-based polyol and Air Products fordonating the various surfactants and catalysts that wereused in this study. The authors would also like to acknowl-edge D. Kohls and Dr. D.W. Schaefer, Department of Chemi-cal and Mechanical Engineering, University of Cincinnati,for performing the USAXS measurements on all the flexiblefoam samples.
References
1. Bayer, O. Angew Chem 1947, 59, 257.2. Herrington, R. In Flexible Polyurethane Foams; Herrington, R.;
Hock, K., Eds.; The Dow Chem Company, 1997.3. Wirpsza, Z. Polyurethanes: Chemistry, Technology and Appli-
cations; Ellis Horwood: New York, 1993.4. Wilkes, G. L.; Abouzahr, S.; Radovich, D. J Cell Plast 1983, 19, 248.5. Armistead, J. P.; Wilkes, G. L. J Appl Polym Sci 1988, 35, 601.6. Elwell, M. J.; Mortimer, S.; Ryan, A. J. Macromolecules 1994,
27, 5428.7. Elwell, M. J.; Ryan, A. J.; Grunbauer, H. J. M.; Lieshout, H. C.
V. Macromolecules 1996, 29, 2960.8. McClusky, J. V.; Priester, R. D. J.; O’Neill, R. E.; Willkomm,
W. R.; Heaney, M. D.; Capel, M. A. J Cell Plast 1994, 30, 338.9. Dounis, D. V.; Wilkes, G. L. J Appl Polym Sci 1997, 66, 2395.10. Dounis, D. V.; Wilkes, G. L. Polymer 1997, 38, 2819.11. Kaushiva, B. D.; Dounis, D. V.; Wilkes, G. L. J Appl Polym Sci
2000, 78, 766.12. Kaushiva, B. D.; McCartney, S. R.; Rossmy, G. R.; Wilkes, G.
L. Polymer 1999, 41, 285.
13. Moreland, J. C.; Wilkes, G. L.; Turner, R. B. J Appl Polym Sci1994, 52, 549.
14. Moreland, J. C.; Wilkes, G. L.; Turner, R. B. J Appl Polym Sci1994, 52, 569.
15. Hoefer, R.; Daute, P.; Grutzmacher, R.; Westfechtel, A. J Coat-ing Technol 1997, 69, 65.
16. Lyon, C. K.; Garrett, V. H.; Frankel, E. N. J Am Oil Chem Soc1974, 51, 331.
17. Reed, D. Ureth Technol 1997, 14, 20.18. Hu, Y. H.; Gao, Y.; Wang, D. N.; Hu, C. P.; Zu, S.; Vanover-
loop, L.; Randall, D. J Appl Polym Sci 2002, 84, 591.19. Javni, I.; Petrovi, Z. S.; Guo, A.; Fuller, R. J Appl Polym Sci
2000, 77, 1723.20. Evans, C. D.; List, G. R.; Beal, R. E. J Am Oil Chem Soc 1974,
51, 444.21. Khot, S. N.; Lascala, J. J.; Can, E.; Morye, S. S.; Williams, G. I.;
Palmese, G. R.; Kusefoglu, S. H.; Wool, R. P. J Appl Polym Sci2001, 82, 703.
22. John, J.; Bhattacharya, M.; Turner, R. B. J Appl Polym Sci2002, 86, 3097.
23. Liu, K. Soybeans: Chemistry, Technology and Utilization;Chapman & Hall: New York, 1997.
24. Gao, A.; Javni, I.; Petrovi, Z. S. J Appl Polym Sci 2000, 77, 467.25. Uyama, H.; Kuwabara, M.; Tsujimota, T.; Nakano, M.; Usuki,
A.; Kobayashi, S. Chem Mater 2003, 15, 249.26. Gao, A.; Cho, Y.; Petrovi, Z. S. J Polym Sci Part A: Polym
Chem 2000, 38, 3900.27. Kandanarachchi, P.; Gao, A.; Petrovi, Z. S. J Mol Catal A
Chem 2002, 184, 65.28. Guo, A.; Zhang, W.; Petrovic, Z. J Mater Sci 2006, 41, 4914.29. Singh, A. P.; Bhattacharya, M. Polym Eng Sci 2004, 1977, 44.30. Mielewski, D. F.; Flanigan, C. M.; Perry, C.; Zaluzec, M. J.;
Killgoar, P. C. Ind Biotechnol 2005, 1, 32.31. Herrington, R.; Malsam, J. U.S. Pat 2005/0070620, 2005.32. Zhang, L.; Jeon, H. K.; Malsam, J.; Herrington, R.; Macosko, C.
W. Polymer 2007, 48, 6656.33. Casper, D. M.; Newbold, T. U.S. Pat. 20,060,041,156, 2006.34. Pechar, T. W.; Wilkes, G. L.; Zhou, B.; Luo, N. J Appl Polym
Sci 2007, 106, 2350.
308 DAS, DAVE, AND WILKES
Journal of Applied Polymer Science DOI 10.1002/app