characterization of dissolved organic matter fractions and its relationship with the disinfection...
TRANSCRIPT
Journal of Environmental Sciences 21(2009) 54–61
Characterization of dissolved organic matter fractions and its relationshipwith the disinfection by-product formation
ZHANG Hua1,2, QU Jiuhui1,∗, LIU Huijuan1, WEI Dongbin1
1. Research Center for Eco-Environmental Sciences, Chinese Academy of Sciences, Beijing 100085, China. E-mail: [email protected]. Graduate University of Chinese Academy of Sciences, Beijing 100039, China
Received 25 February 2008; revised 10 April 2008; accepted 20 April 2008
AbstractDissolved organic matter (DOM) has been identified as precursor for disinfection by-products (DBPs) formation during chlorination.
Recently, it has been demonstrated that the characteristics of DOM influence the DBPs formation mechanism. A study was, therefore,
initiated to investigate the effects of DOM fractions on DBPs formation mechanism. In the chlorination process, organic acids are
dominant precursors of total thihalomethanes (TTHM) because of the νC–O and unsaturated structures. Furthermore, the TTHM
formation of organic acids was affected by pH more greatly. Based on the fluorescence spectroscopy analysis, DOM fractions
contained several fluorescence substances. During chlorination, humic acid-like substances were found to exhibit high chlorine
reactivity and hydrophobic organics decomposed to smaller molecules faster than hydrophilic organics even at lower chlorine dosages.
Unlike hydrophobic fractions, hydrophilic organics showed no toxicity following chlorination, suggesting that the toxic structures in
hydrophilic organics showed high chlorine reactivity during chlorination.
Key words: disinfection by-products; chlorination; characteristics; dissolved organic matter
Introduction
Chlorination has been considered to be a cost-effective
approach for providing both primary disinfection to in-
activate waterborne pathogens and for achieving the
secondary disinfection by providing necessary residuals in
the distribution system (Liu et al., 2006). However, many
halogenated disinfection by-products (DBPs) have been
identified during chlorination, such as thihalomethanes
(THMs) and haloacetonitriles (HANs), which are associ-
ated with increased risk of cancer (Trevizo and Nirmalak,
1999; Monarca et al., 2004; Zha and Wang, 2005). Because
dissolved organic matter (DOM) was regarded as the
major precursor for DBPs, many researchers have focused
their research on exploring the relationship between DOM
and DBPs formation. Sirivedhin and Gray (2005) found
a combination of aromatic and aliphatic structures in-
cluding some substituted with nitrogen and chlorine to
show a linear relationship with DBPs formation potential
(DBPFP). Leenheer et al. (2001) demonstrated that phenol
structures produced significant DBPs, whereas aromatic
sulfonates and fulvic acids in reclaimed water contributed
to minimal DBPs. It appears that the chemical charac-
teristics of DOM influence the chlorine consumption and
the formation of DBPs largely. Marhaba and Van (2000)
isolated DOM from treatment plants and demonstrated
that the hydrophilic acid fraction was the most reactive
* Corresponding author. E-mail: [email protected]
precursor to the THM formation. However, limited re-
search was conducted about the DBPs formation of DOM
fractions under different conditions, and some of the DOM
are toxic by themselves (Ono et al., 1996; Barker and
Stuckey, 1999). Therefore, only measuring typical DBPs
is insufficient to investigate the effect of DOM fractions on
the safety of wastewater.
The aims of this study were to evaluate the chlorination
mechanism of DOM fractions and to compare the toxicity
produced by DOM fractions via chlorination. For these
purposes, DOM from a conventional treatment plant was
isolated using three resins into six fractions. DBPs for-
mation was compared among different DOM fractions by
varying conditions necessary for better performance, and
the toxicity of DOM fractions was also investigated before
and after chlorination.
1 Materials and methods
1.1 Wastewater sampling and characterization
Undisinfected reclaimed water samples were collected
periodically at the sand-filtration site of secondary effluents
from G sewage treatment plant (GSTP), the largest STP
in China with a treatment capacity of 1×10⁶ m3/d. After
being filtered through 0.45 μm cellulose membrane filters,
the DOM samples were stored at 4°C to minimize changes
in the constituents. TOC concentrations of the effluent
No. 1 Characterization of dissolved organic matter fractions and its relationship with the disinfection by-product formation 55
ranged from 7.2 to 8.2 mg/L and the UV254 to DOC ratio
(SUVA) was in the range of 1.5–2.2 (abs·L)/(cm·g).
The freeze-drying DOM fractions was analyzed for the
structural and chemical characteristics of DOM. KBr was
mixed with the DOM powder at the ratio of 100 to 1
and the Fourtier transform infra-red (FT-IR) spectra of the
mixture were obtained by scanning it with IR spectrometer
(Thermo Nicolet 5700, USA).
1.2 Chemicals and materials
Solutions were prepared with ultra-pure water. A free
chlorine (HOCl) stock solution (about 5 g/L) was pre-
pared from 7% sodium hypochlorite (NaClO) and its
concentration was measured prior to use according to DPD
colorimetric method (EPA method 330.5). A 50 mmol/L
sodium phosphate buffer solution was used to maintain
solution at pH 7.
Hexane used to extract DBPs was obtained from
Fisher. THMs standard, i.e., chloroform (CHCl3) and
two HANs standards, i.e., dichloroacenitrile (DCAN)
and trichloroacetonitrile (TCAN), were purchased from
Aldrich (USA).
1.3 Fractionation and collection of DOM fractions
The fractionation of DOM was performed following the
procedure modified from Leenheer (1981), Chefetz et al.(1998), and Imai et al. (2002).
A 0.45-μm filtered reusewater was firstly pumped
through a glass column of Amberlite XAD-8 resin (20–
60 mesh). Hydrophobic bases (HoB) were then desorbed
from the resin with 0.1 mol/L HCl. The sample effluent was
acidified to pH 2 with 6 mol/L HCl and cycled over three
connected Amberlite XAD-8, Dowex Marathon MSC resin
(20–50 mesh), and Duolite A7 (free base). The effluent
from the connected three columns was hydrophilic neutrals
(HiN). Hydrophobic acids (HoA), hydrophilic bases (HiB),
and hydrophilic acids (HiA) were desorbed from XAD-8,
Dowex Marathon MSC, and Duolite A7 with 0.1 mol/L
NaOH, respectively. After HoA was desorbed, the XAD-8
resin was air-dried for about 12 h and was soxhlet-
extracted with methanol to obtain hydrophobic neutrals
(HoN). The excess methanol was removed by vacuum-
rotary evaporation at 40°C.
1.4 Analytical methods
THMs and HANs analyses were conducted according
to EPA method 551.1, using an Agilent 6890N Gas Chro-
matograph (USA) that was equipped with a fused silica
capillary column (HP-5, 30 m, 320 μm×0.25 μm) and a lin-
earized electron capture detector (ECD). For experiments
involving THMs and HANs, a temperature program was
used wherein temperature was held at 35°C for 4 min and
ramped to 60°C at 10°C/min.
Standard curves were obtained by extracting standards
from the aqueous solutions and blank (0 μg/L as DBPs)
of ultra-pure water was also included. In the study, DBPs
of samples without chlorination were measured as the
controls.
Fluorescence spectra were recorded on a fluorescence
spectrophotometer (model F-4500, Hitachi, Japan). Three-
dimensional spectra were obtained by measuring the
emission spectra in the range from 300 to 500 nm repeat-
edly at the excitation wavelengths from 230 to 400 nm.
Spectra were then converted into an excitation emission
matrix (EEM). Blanks of ultra-pure water were included
in the correction of inner filtering and Raman scattering of
the fluorescence spectra.
1.5 Chlorination procedures
To compare the characteristics of DOM fractions, all
samples were conditioned to similar TOC concentrations
about 3 mg/L. Buffer and chlorine were added into the
water samples in sequence. Following incubation in dark at
20°C for 3 d, the chlorination was quenched with sodium
sulfite (Na2SO3) and DBPs were analyzed by GC-ECD
(Agilent, USA). In the experiments, to investigate pH
effect, 2 mol/L HCl or 2 mol/L NaOH solution was used
to adjust the pH of DOM samples. A series of chlorine
dosages (0–25 mg/L as Cl2) was added into the samples to
evaluate the effect of chlorine dosage.
All experiments were performed more than 3 times.
1.6 Toxicity measurement
Photobacterium bioassay method quantifies the de-
crease in light emission from the Photobacterium phospho-reum (P. phosphoreum) bacterium as a result of exposure
to pollutants for 15 min (Wang et al., 2007). The bacteria
were provided as freeze-dried powder by the Institute of
Soil Science, Chinese Academy Sciences, China. The lu-
minescence intensity was determined by a test instrument
(Model toxicity analyzer DXY-2, China).
2 Results and discussion
2.1 DOM-fraction distribution
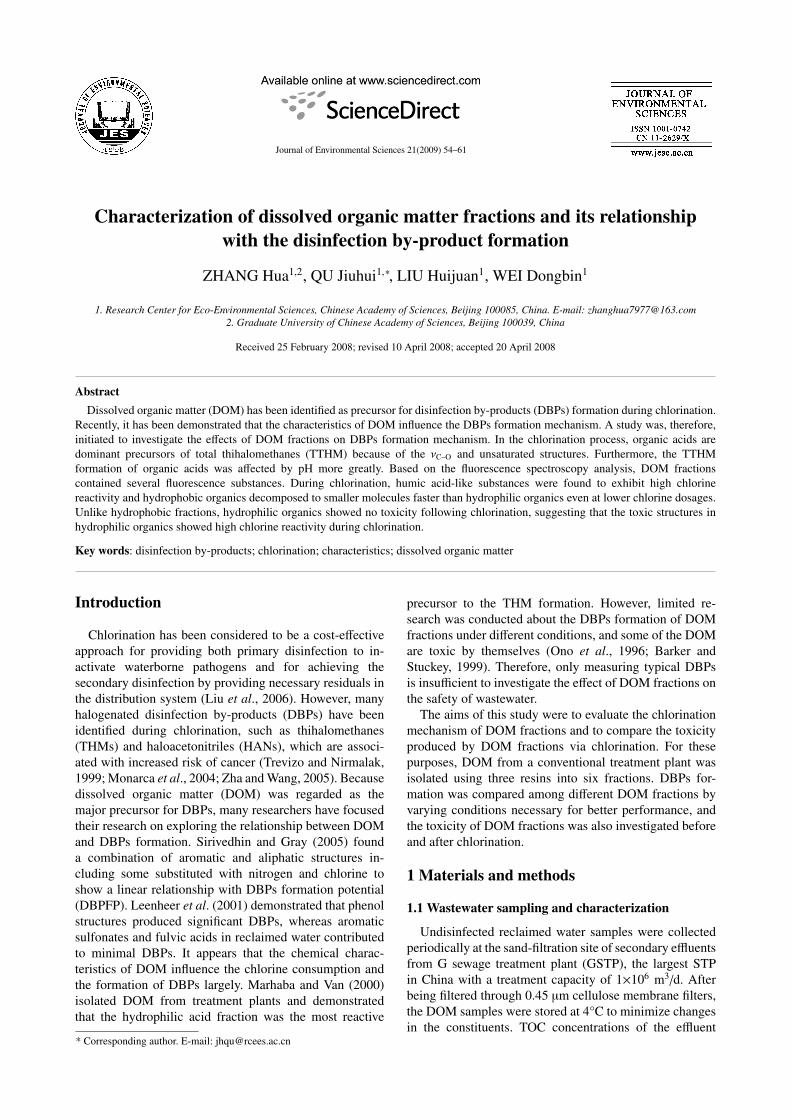
Among the six DOM fractions, HoA dominated in
reclaimed water, accounting for more than 34% of their
DOM as TOC (Fig. 1). HiN was found to be the second
most abundant fraction, constituting more than 20% of
TOC. The HiA and HoN fractions accounted for about
15%, respectively. In all fractions, organic bases, HoB and
HiB, constituted less than 10%. In particular, the HoB
fraction was low enough to be ignored.
Thus, DOM in reclaimed water from GSTP is primarily
composed of organic acids and organic neutrals, which
might serve as dominant DBPs precursors during chlori-
nation.
2.2 Characterization of DOM fractions
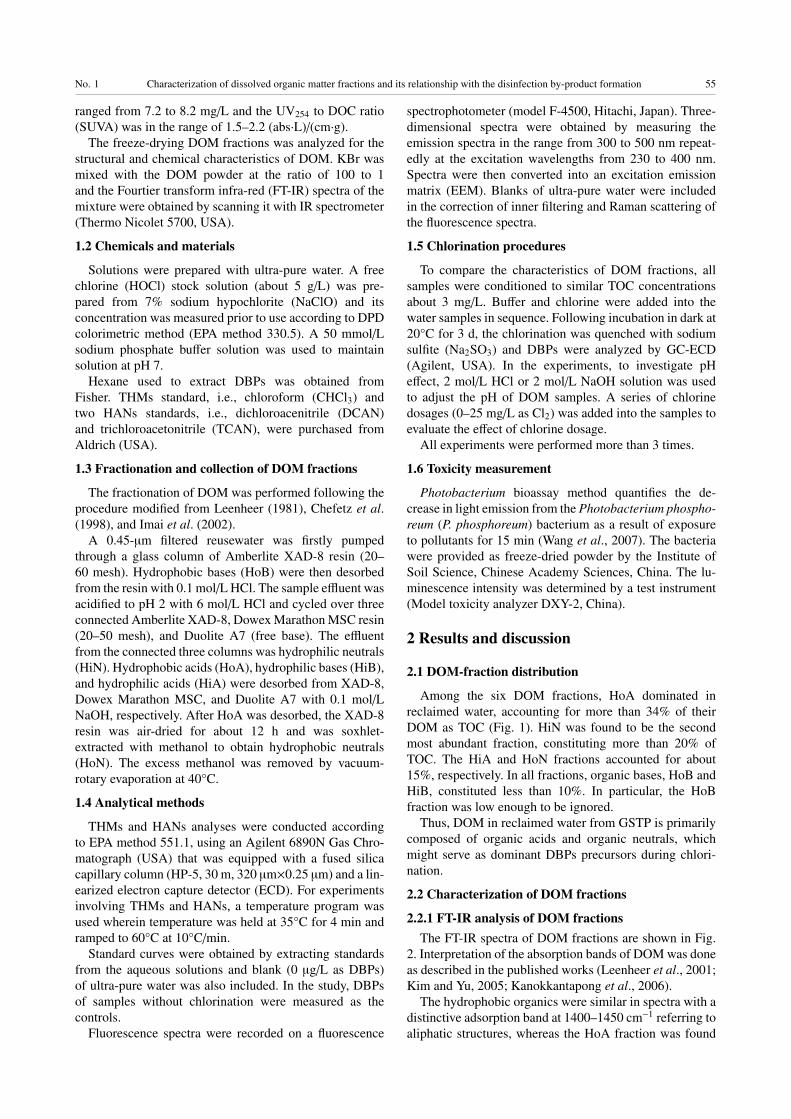
2.2.1 FT-IR analysis of DOM fractionsThe FT-IR spectra of DOM fractions are shown in Fig.
2. Interpretation of the absorption bands of DOM was done
as described in the published works (Leenheer et al., 2001;
Kim and Yu, 2005; Kanokkantapong et al., 2006).
The hydrophobic organics were similar in spectra with a
distinctive adsorption band at 1400–1450 cm−1 referring to
aliphatic structures, whereas the HoA fraction was found
56 ZHANG Hua et al. Vol. 21
Fig. 1 DOC-fraction distribution. HoA: hydrophobic acids; HoB: hy-
drophobic bases; HoN: hydrophobic neutrals: HiA: hydrophilic acids;
HiB: hydrophilic bases; HiN: hydrophilic neutrals.
to contain more C==C or C==O content at approximately
1600 cm−1. Compared with HoA and HoN, the HiA and
HiN fractions contained relatively high C–O content at
approximately 1100 cm−1.
2.2.2 Fluorescence spectroscopy of DOM fractionsIn this study, DOM fractions showed different charac-
teristics even at the same performed conditions. Thus, the
investigation of the chemical structures of DOM fractions
is useful to understand the difference.
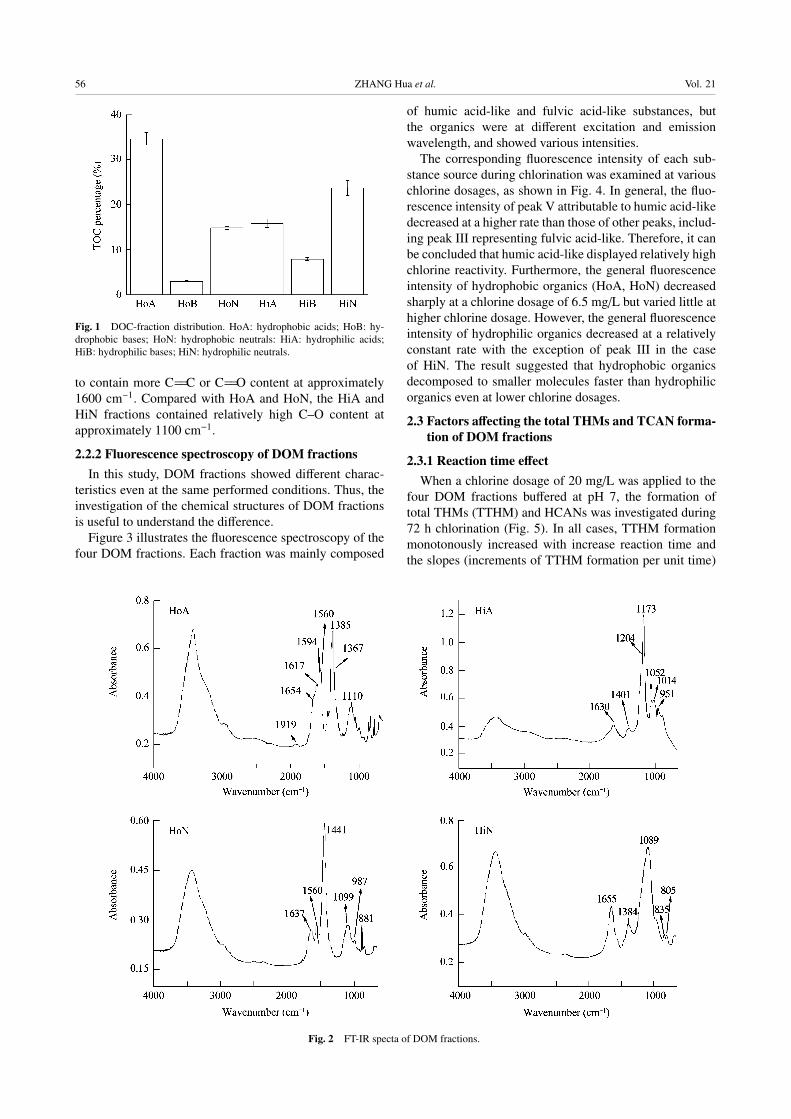
Figure 3 illustrates the fluorescence spectroscopy of the
four DOM fractions. Each fraction was mainly composed
of humic acid-like and fulvic acid-like substances, but
the organics were at different excitation and emission
wavelength, and showed various intensities.
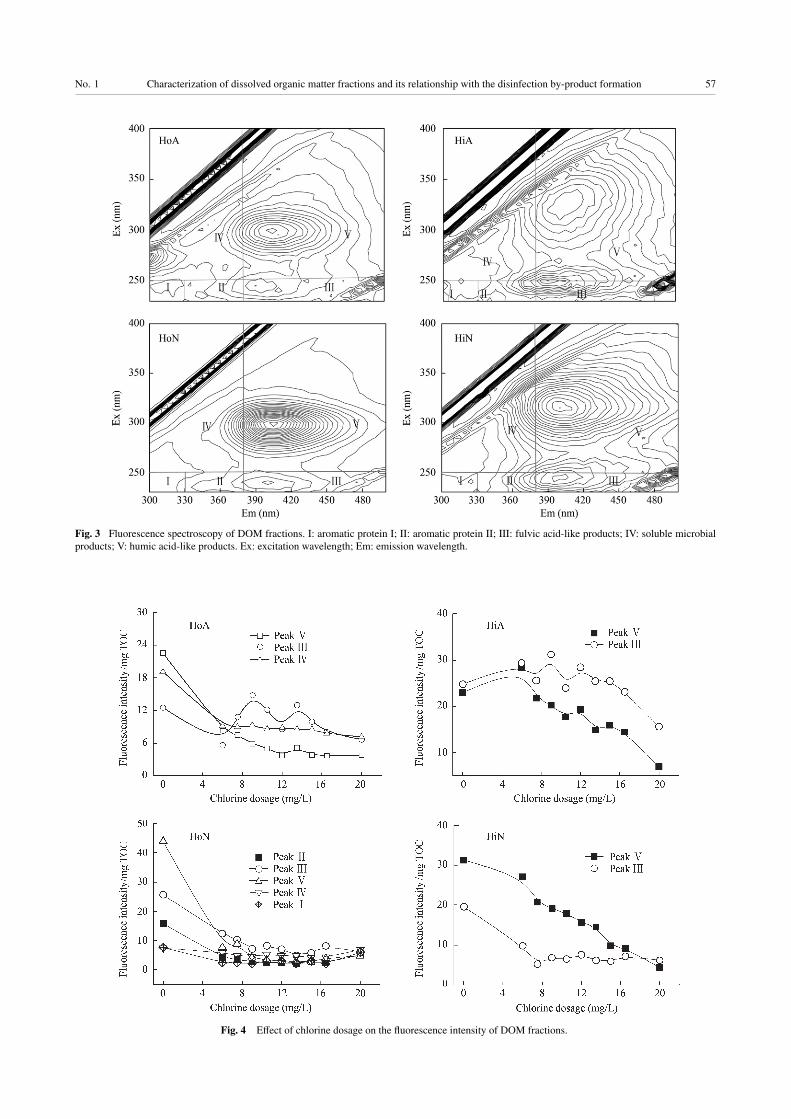
The corresponding fluorescence intensity of each sub-
stance source during chlorination was examined at various
chlorine dosages, as shown in Fig. 4. In general, the fluo-
rescence intensity of peak V attributable to humic acid-like
decreased at a higher rate than those of other peaks, includ-
ing peak III representing fulvic acid-like. Therefore, it can
be concluded that humic acid-like displayed relatively high
chlorine reactivity. Furthermore, the general fluorescence
intensity of hydrophobic organics (HoA, HoN) decreased
sharply at a chlorine dosage of 6.5 mg/L but varied little at
higher chlorine dosage. However, the general fluorescence
intensity of hydrophilic organics decreased at a relatively
constant rate with the exception of peak III in the case
of HiN. The result suggested that hydrophobic organics
decomposed to smaller molecules faster than hydrophilic
organics even at lower chlorine dosages.
2.3 Factors affecting the total THMs and TCAN forma-tion of DOM fractions
2.3.1 Reaction time effectWhen a chlorine dosage of 20 mg/L was applied to the
four DOM fractions buffered at pH 7, the formation of
total THMs (TTHM) and HCANs was investigated during
72 h chlorination (Fig. 5). In all cases, TTHM formation
monotonously increased with increase reaction time and
the slopes (increments of TTHM formation per unit time)
Fig. 2 FT-IR specta of DOM fractions.
No. 1 Characterization of dissolved organic matter fractions and its relationship with the disinfection by-product formation 57
Fig. 3 Fluorescence spectroscopy of DOM fractions. I: aromatic protein I; II: aromatic protein II; III: fulvic acid-like products; IV: soluble microbial
products; V: humic acid-like products. Ex: excitation wavelength; Em: emission wavelength.
Fig. 4 Effect of chlorine dosage on the fluorescence intensity of DOM fractions.
58 ZHANG Hua et al. Vol. 21
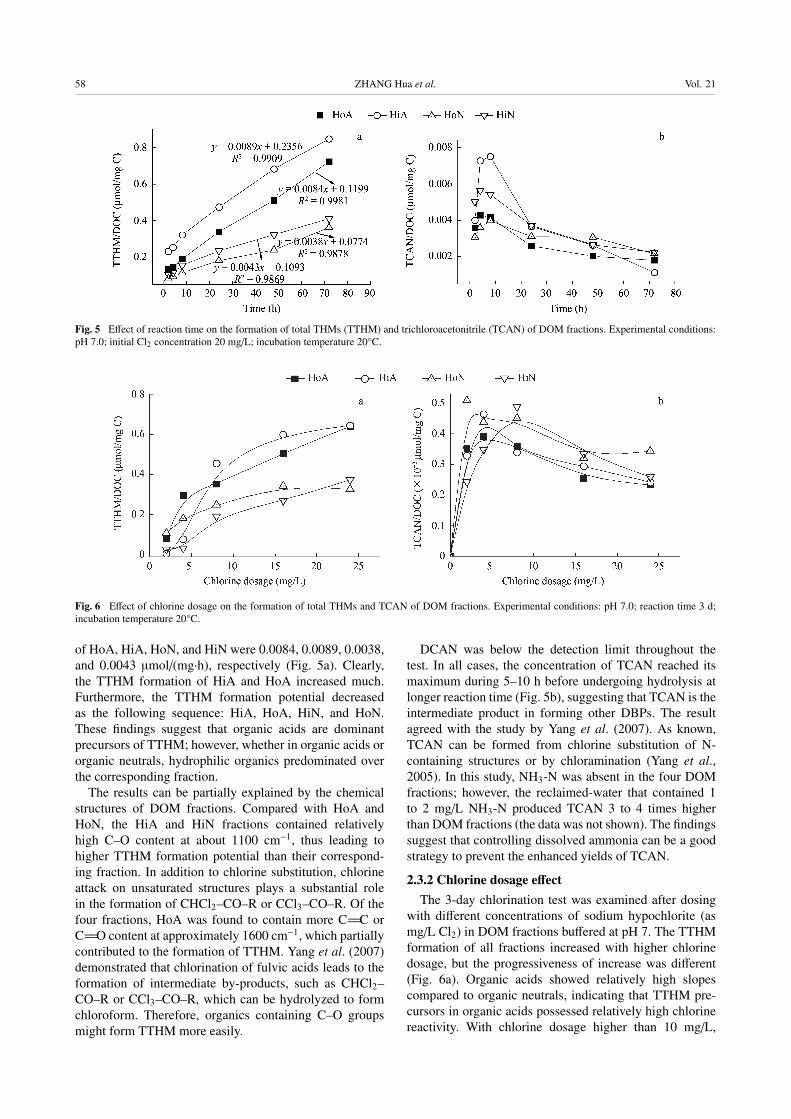
Fig. 5 Effect of reaction time on the formation of total THMs (TTHM) and trichloroacetonitrile (TCAN) of DOM fractions. Experimental conditions:
pH 7.0; initial Cl2 concentration 20 mg/L; incubation temperature 20°C.
Fig. 6 Effect of chlorine dosage on the formation of total THMs and TCAN of DOM fractions. Experimental conditions: pH 7.0; reaction time 3 d;
incubation temperature 20°C.
of HoA, HiA, HoN, and HiN were 0.0084, 0.0089, 0.0038,
and 0.0043 μmol/(mg·h), respectively (Fig. 5a). Clearly,
the TTHM formation of HiA and HoA increased much.
Furthermore, the TTHM formation potential decreased
as the following sequence: HiA, HoA, HiN, and HoN.
These findings suggest that organic acids are dominant
precursors of TTHM; however, whether in organic acids or
organic neutrals, hydrophilic organics predominated over
the corresponding fraction.
The results can be partially explained by the chemical
structures of DOM fractions. Compared with HoA and
HoN, the HiA and HiN fractions contained relatively
high C–O content at about 1100 cm−1, thus leading to
higher TTHM formation potential than their correspond-
ing fraction. In addition to chlorine substitution, chlorine
attack on unsaturated structures plays a substantial role
in the formation of CHCl2–CO–R or CCl3–CO–R. Of the
four fractions, HoA was found to contain more C==C or
C==O content at approximately 1600 cm−1, which partially
contributed to the formation of TTHM. Yang et al. (2007)
demonstrated that chlorination of fulvic acids leads to the
formation of intermediate by-products, such as CHCl2–
CO–R or CCl3–CO–R, which can be hydrolyzed to form
chloroform. Therefore, organics containing C–O groups
might form TTHM more easily.
DCAN was below the detection limit throughout the
test. In all cases, the concentration of TCAN reached its
maximum during 5–10 h before undergoing hydrolysis at
longer reaction time (Fig. 5b), suggesting that TCAN is the
intermediate product in forming other DBPs. The result
agreed with the study by Yang et al. (2007). As known,
TCAN can be formed from chlorine substitution of N-
containing structures or by chloramination (Yang et al.,2005). In this study, NH3-N was absent in the four DOM
fractions; however, the reclaimed-water that contained 1
to 2 mg/L NH3-N produced TCAN 3 to 4 times higher
than DOM fractions (the data was not shown). The findings
suggest that controlling dissolved ammonia can be a good
strategy to prevent the enhanced yields of TCAN.
2.3.2 Chlorine dosage effectThe 3-day chlorination test was examined after dosing
with different concentrations of sodium hypochlorite (as
mg/L Cl2) in DOM fractions buffered at pH 7. The TTHM
formation of all fractions increased with higher chlorine
dosage, but the progressiveness of increase was different
(Fig. 6a). Organic acids showed relatively high slopes
compared to organic neutrals, indicating that TTHM pre-
cursors in organic acids possessed relatively high chlorine
reactivity. With chlorine dosage higher than 10 mg/L,
No. 1 Characterization of dissolved organic matter fractions and its relationship with the disinfection by-product formation 59
the HiA fraction formed the highest TTHM; however,
its TTHM concentration increased more gently than that
of the HoA fraction. It can be explained by the high
content of unsaturated bonds in the HoA fraction, because
it was possible for TTHM to form more with high chlorine
dosage to attack the C==C or C==O groups.
There was a distinctive increasing tendency for the
formation of TCAN with the chlorine dosage increasing
(Fig. 6b). However, the concentration of TCAN achieved
the greatest yields at a chlorine dosage of about 5 mg/L
before decreasing with the increase of chlorine dosage. The
exception was HoN with the maximum TCAN formation
occurring at the chlorine dosage of 10 mg/L.
Because of the absence of NH3-N in DOM fractions, the
formation of TCAN depends on N-containing structures.
Furthermore, the apparent intermediate reactant behavior
of TCAN indicated that the chlorine to nitrogen ratios
greatly affected the formation of TCAN. Although the
results suggest that excessive chlorine will decompose
TCAN, we can not detemine the influence of complex
chemical structures on TCAN formation. A study focused
on the mechanisms of DBPs formation is still in progress.
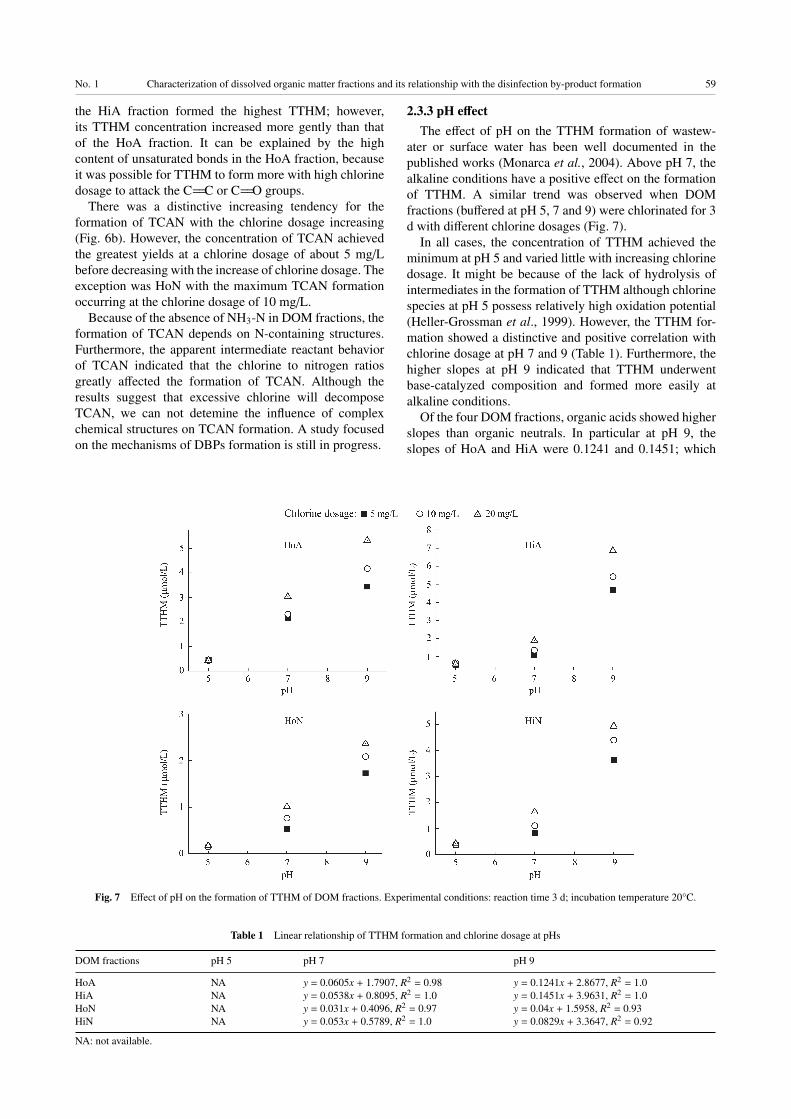
2.3.3 pH effectThe effect of pH on the TTHM formation of wastew-
ater or surface water has been well documented in the
published works (Monarca et al., 2004). Above pH 7, the
alkaline conditions have a positive effect on the formation
of TTHM. A similar trend was observed when DOM
fractions (buffered at pH 5, 7 and 9) were chlorinated for 3
d with different chlorine dosages (Fig. 7).
In all cases, the concentration of TTHM achieved the
minimum at pH 5 and varied little with increasing chlorine
dosage. It might be because of the lack of hydrolysis of
intermediates in the formation of TTHM although chlorine
species at pH 5 possess relatively high oxidation potential
(Heller-Grossman et al., 1999). However, the TTHM for-
mation showed a distinctive and positive correlation with
chlorine dosage at pH 7 and 9 (Table 1). Furthermore, the
higher slopes at pH 9 indicated that TTHM underwent
base-catalyzed composition and formed more easily at
alkaline conditions.
Of the four DOM fractions, organic acids showed higher
slopes than organic neutrals. In particular at pH 9, the
slopes of HoA and HiA were 0.1241 and 0.1451; which
Fig. 7 Effect of pH on the formation of TTHM of DOM fractions. Experimental conditions: reaction time 3 d; incubation temperature 20°C.
Table 1 Linear relationship of TTHM formation and chlorine dosage at pHs
DOM fractions pH 5 pH 7 pH 9
HoA NA y = 0.0605x + 1.7907, R2 = 0.98 y = 0.1241x + 2.8677, R2 = 1.0
HiA NA y = 0.0538x + 0.8095, R2 = 1.0 y = 0.1451x + 3.9631, R2 = 1.0
HoN NA y = 0.031x + 0.4096, R2 = 0.97 y = 0.04x + 1.5958, R2 = 0.93
HiN NA y = 0.053x + 0.5789, R2 = 1.0 y = 0.0829x + 3.3647, R2 = 0.92
NA: not available.
60 ZHANG Hua et al. Vol. 21
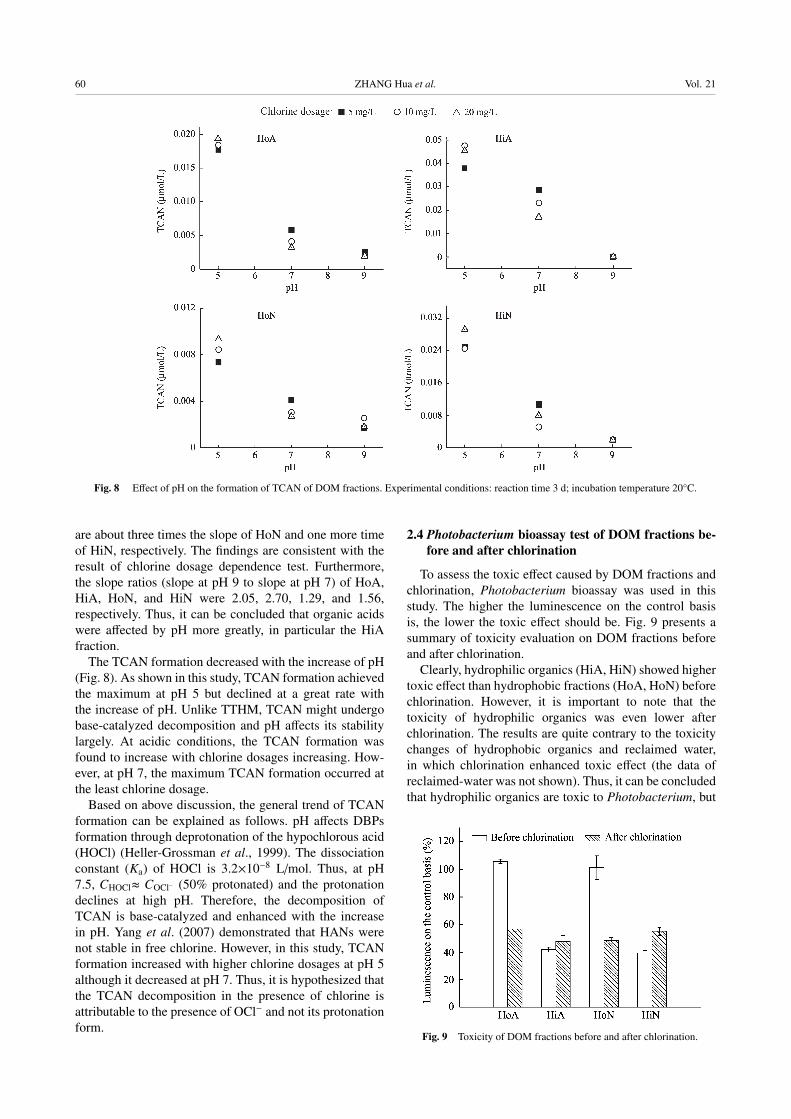
Fig. 8 Effect of pH on the formation of TCAN of DOM fractions. Experimental conditions: reaction time 3 d; incubation temperature 20°C.
are about three times the slope of HoN and one more time
of HiN, respectively. The findings are consistent with the
result of chlorine dosage dependence test. Furthermore,
the slope ratios (slope at pH 9 to slope at pH 7) of HoA,
HiA, HoN, and HiN were 2.05, 2.70, 1.29, and 1.56,
respectively. Thus, it can be concluded that organic acids
were affected by pH more greatly, in particular the HiA
fraction.
The TCAN formation decreased with the increase of pH
(Fig. 8). As shown in this study, TCAN formation achieved
the maximum at pH 5 but declined at a great rate with
the increase of pH. Unlike TTHM, TCAN might undergo
base-catalyzed decomposition and pH affects its stability
largely. At acidic conditions, the TCAN formation was
found to increase with chlorine dosages increasing. How-
ever, at pH 7, the maximum TCAN formation occurred at
the least chlorine dosage.
Based on above discussion, the general trend of TCAN
formation can be explained as follows. pH affects DBPs
formation through deprotonation of the hypochlorous acid
(HOCl) (Heller-Grossman et al., 1999). The dissociation
constant (Ka) of HOCl is 3.2×10⁻⁸ L/mol. Thus, at pH
7.5, CHOCl≈ COCl– (50% protonated) and the protonation
declines at high pH. Therefore, the decomposition of
TCAN is base-catalyzed and enhanced with the increase
in pH. Yang et al. (2007) demonstrated that HANs were
not stable in free chlorine. However, in this study, TCAN
formation increased with higher chlorine dosages at pH 5
although it decreased at pH 7. Thus, it is hypothesized that
the TCAN decomposition in the presence of chlorine is
attributable to the presence of OCl− and not its protonation
form.
2.4 Photobacterium bioassay test of DOM fractions be-fore and after chlorination
To assess the toxic effect caused by DOM fractions and
chlorination, Photobacterium bioassay was used in this
study. The higher the luminescence on the control basis
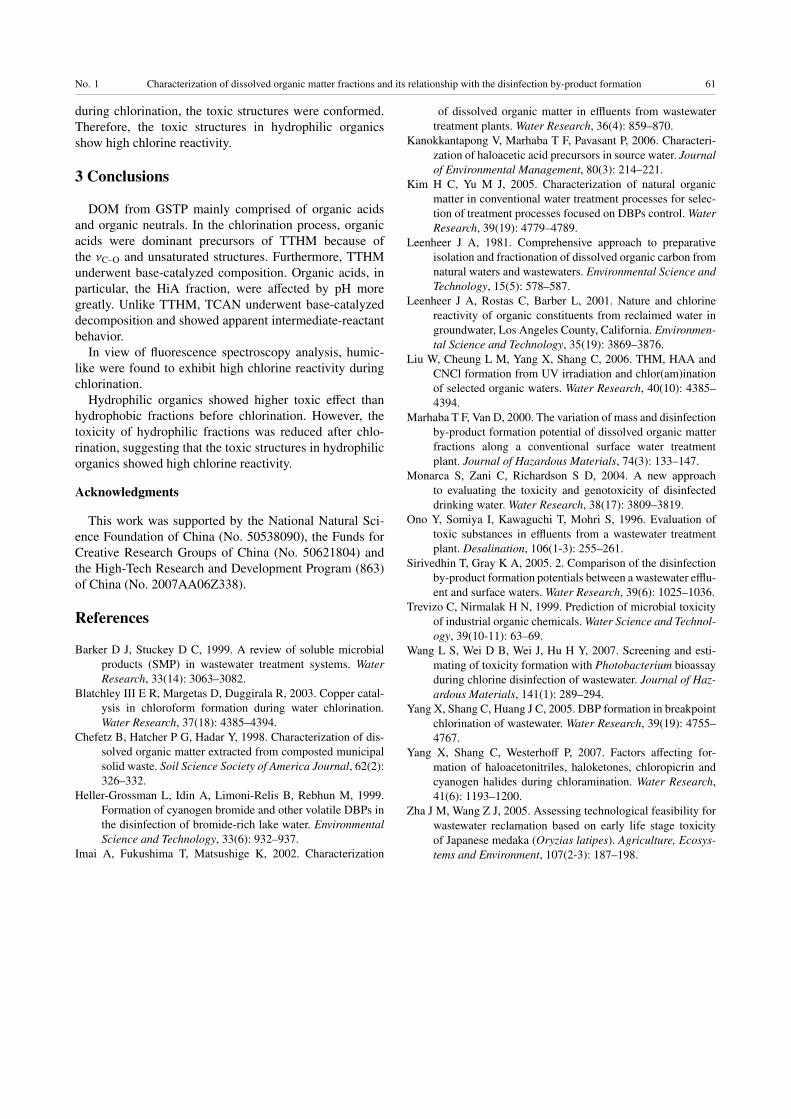
is, the lower the toxic effect should be. Fig. 9 presents a
summary of toxicity evaluation on DOM fractions before
and after chlorination.
Clearly, hydrophilic organics (HiA, HiN) showed higher
toxic effect than hydrophobic fractions (HoA, HoN) before
chlorination. However, it is important to note that the
toxicity of hydrophilic organics was even lower after
chlorination. The results are quite contrary to the toxicity
changes of hydrophobic organics and reclaimed water,
in which chlorination enhanced toxic effect (the data of
reclaimed-water was not shown). Thus, it can be concluded
that hydrophilic organics are toxic to Photobacterium, but
Fig. 9 Toxicity of DOM fractions before and after chlorination.
No. 1 Characterization of dissolved organic matter fractions and its relationship with the disinfection by-product formation 61
during chlorination, the toxic structures were conformed.
Therefore, the toxic structures in hydrophilic organics
show high chlorine reactivity.
3 Conclusions
DOM from GSTP mainly comprised of organic acids
and organic neutrals. In the chlorination process, organic
acids were dominant precursors of TTHM because of
the νC–O and unsaturated structures. Furthermore, TTHM
underwent base-catalyzed composition. Organic acids, in
particular, the HiA fraction, were affected by pH more
greatly. Unlike TTHM, TCAN underwent base-catalyzed
decomposition and showed apparent intermediate-reactant
behavior.
In view of fluorescence spectroscopy analysis, humic-
like were found to exhibit high chlorine reactivity during
chlorination.
Hydrophilic organics showed higher toxic effect than
hydrophobic fractions before chlorination. However, the
toxicity of hydrophilic fractions was reduced after chlo-
rination, suggesting that the toxic structures in hydrophilic
organics showed high chlorine reactivity.
Acknowledgments
This work was supported by the National Natural Sci-
ence Foundation of China (No. 50538090), the Funds for
Creative Research Groups of China (No. 50621804) and
the High-Tech Research and Development Program (863)
of China (No. 2007AA06Z338).
References
Barker D J, Stuckey D C, 1999. A review of soluble microbial
products (SMP) in wastewater treatment systems. WaterResearch, 33(14): 3063–3082.
Blatchley III E R, Margetas D, Duggirala R, 2003. Copper catal-
ysis in chloroform formation during water chlorination.
Water Research, 37(18): 4385–4394.
Chefetz B, Hatcher P G, Hadar Y, 1998. Characterization of dis-
solved organic matter extracted from composted municipal
solid waste. Soil Science Society of America Journal, 62(2):
326–332.
Heller-Grossman L, Idin A, Limoni-Relis B, Rebhun M, 1999.
Formation of cyanogen bromide and other volatile DBPs in
the disinfection of bromide-rich lake water. EnvironmentalScience and Technology, 33(6): 932–937.
Imai A, Fukushima T, Matsushige K, 2002. Characterization
of dissolved organic matter in effluents from wastewater
treatment plants. Water Research, 36(4): 859–870.
Kanokkantapong V, Marhaba T F, Pavasant P, 2006. Characteri-
zation of haloacetic acid precursors in source water. Journalof Environmental Management, 80(3): 214–221.
Kim H C, Yu M J, 2005. Characterization of natural organic
matter in conventional water treatment processes for selec-
tion of treatment processes focused on DBPs control. WaterResearch, 39(19): 4779–4789.
Leenheer J A, 1981. Comprehensive approach to preparative
isolation and fractionation of dissolved organic carbon from
natural waters and wastewaters. Environmental Science andTechnology, 15(5): 578–587.
Leenheer J A, Rostas C, Barber L, 2001. Nature and chlorine
reactivity of organic constituents from reclaimed water in
groundwater, Los Angeles County, California. Environmen-tal Science and Technology, 35(19): 3869–3876.
Liu W, Cheung L M, Yang X, Shang C, 2006. THM, HAA and
CNCl formation from UV irradiation and chlor(am)ination
of selected organic waters. Water Research, 40(10): 4385–
4394.
Marhaba T F, Van D, 2000. The variation of mass and disinfection
by-product formation potential of dissolved organic matter
fractions along a conventional surface water treatment
plant. Journal of Hazardous Materials, 74(3): 133–147.
Monarca S, Zani C, Richardson S D, 2004. A new approach
to evaluating the toxicity and genotoxicity of disinfected
drinking water. Water Research, 38(17): 3809–3819.
Ono Y, Somiya I, Kawaguchi T, Mohri S, 1996. Evaluation of
toxic substances in effluents from a wastewater treatment
plant. Desalination, 106(1-3): 255–261.
Sirivedhin T, Gray K A, 2005. 2. Comparison of the disinfection
by-product formation potentials between a wastewater efflu-
ent and surface waters. Water Research, 39(6): 1025–1036.
Trevizo C, Nirmalak H N, 1999. Prediction of microbial toxicity
of industrial organic chemicals. Water Science and Technol-ogy, 39(10-11): 63–69.
Wang L S, Wei D B, Wei J, Hu H Y, 2007. Screening and esti-
mating of toxicity formation with Photobacterium bioassay
during chlorine disinfection of wastewater. Journal of Haz-ardous Materials, 141(1): 289–294.
Yang X, Shang C, Huang J C, 2005. DBP formation in breakpoint
chlorination of wastewater. Water Research, 39(19): 4755–
4767.
Yang X, Shang C, Westerhoff P, 2007. Factors affecting for-
mation of haloacetonitriles, haloketones, chloropicrin and
cyanogen halides during chloramination. Water Research,
41(6): 1193–1200.
Zha J M, Wang Z J, 2005. Assessing technological feasibility for
wastewater reclamation based on early life stage toxicity
of Japanese medaka (Oryzias latipes). Agriculture, Ecosys-tems and Environment, 107(2-3): 187–198.