characterization of cover gas and byproduct emissions from ... · and occupational exposure...
TRANSCRIPT

Characterization of Cover Gas and Byproduct Emissions from Secondary Magnesium Ingot Casting
Office of Air and Radiation Office of Atmospheric Programs, Climate Change Division EPA 430-R-08-008

Characterization of Cover Gas and Byproduct Emissions from Secondary Magnesium Ingot Casting
Scott C. Bartos U.S. Environmental Protection Agency
Climate Change Division 1200 Pennsylvania Avenue, NW (6202J)
Washington, DC 20460
October 2008
EPA 430-R-08-008

Table of Contents Page
Acknowledgement ........................................................................................................ vi
Executive Summary..................................................................................................... ES-1
1.0 Introduction.................................................................................................................. 1-1
2.0 Methodology ................................................................................................................. 2-1 2.1 Principles of FTIR Monitoring .......................................................................... 2-1
2.2 Principles of RGA Monitoring........................................................................... 2-5
2.3 Ambient Air Dilution Considerations................................................................ 2-7
3.0 Monitoring Results....................................................................................................... 3-1 3.1 Casting Hood Monitoring .................................................................................. 3-1
3.2 Worker Exposure Monitoring ............................................................................ 3-6
4.0 Cover Gas Destruction ................................................................................................ 4-1 4.1 Determining Dilution ........................................................................................ 4-1
4.2 Determining Cover Gas Destruction.................................................................. 4-6
5.0 Discussion...................................................................................................................... 5-1 5.1 Cover Gas Test Observations............................................................................. 5-1
5.2 Climate Change Potential Discussion................................................................ 5-3
5.3 Uncertainty Discussion ...................................................................................... 5-4
Appendix A. Calibration and Diagnostic Checks ................................................................. A-1
Appendix B. Measurement Study Protocol ........................................................................... B-1
iii
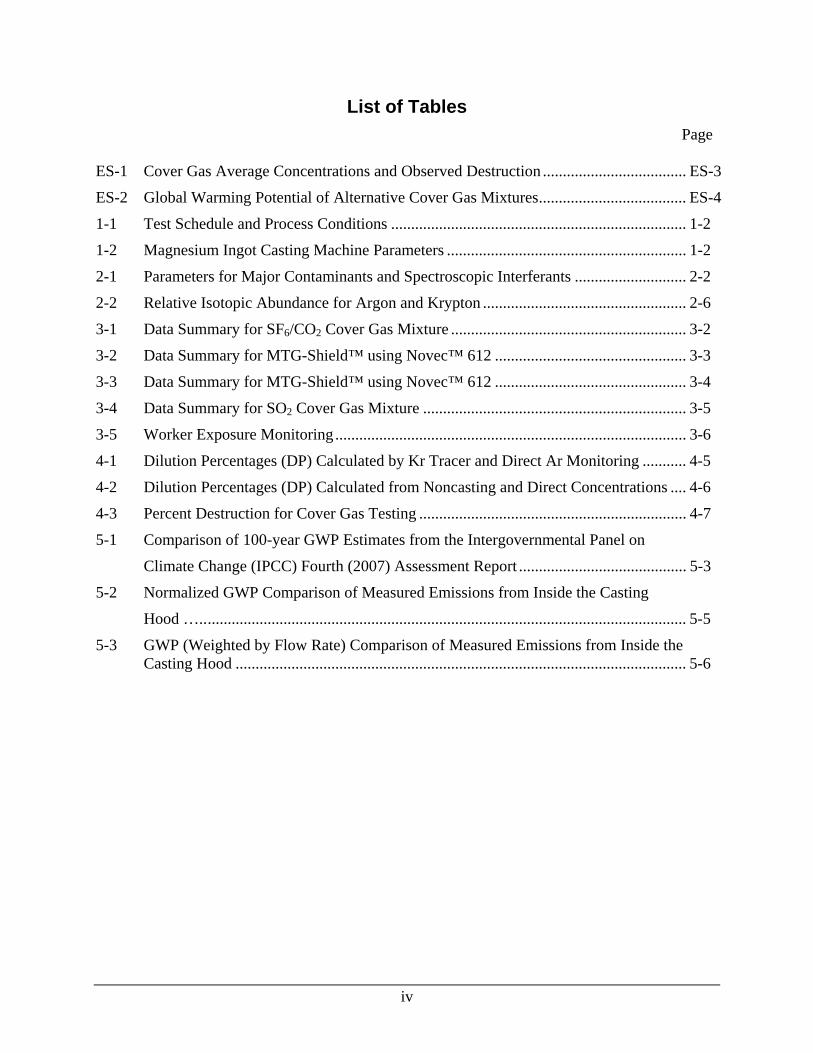
List of Tables Page
ES-1 Cover Gas Average Concentrations and Observed Destruction .................................... ES-3
ES-2 Global Warming Potential of Alternative Cover Gas Mixtures..................................... ES-4
1-1 Test Schedule and Process Conditions .......................................................................... 1-2
1-2 Magnesium Ingot Casting Machine Parameters ............................................................ 1-2
2-1 Parameters for Major Contaminants and Spectroscopic Interferants ............................ 2-2
2-2 Relative Isotopic Abundance for Argon and Krypton ................................................... 2-6
3-1 Data Summary for SF6/CO2 Cover Gas Mixture ........................................................... 3-2
3-2 Data Summary for MTG-Shield™ using Novec™ 612 ................................................ 3-3
3-3 Data Summary for MTG-Shield™ using Novec™ 612 ................................................ 3-4
3-4 Data Summary for SO2 Cover Gas Mixture .................................................................. 3-5
3-5 Worker Exposure Monitoring ........................................................................................ 3-6
4-1 Dilution Percentages (DP) Calculated by Kr Tracer and Direct Ar Monitoring ........... 4-5
4-2 Dilution Percentages (DP) Calculated from Noncasting and Direct Concentrations .... 4-6
4-3 Percent Destruction for Cover Gas Testing ................................................................... 4-7
5-1 Comparison of 100-year GWP Estimates from the Intergovernmental Panel on
Climate Change (IPCC) Fourth (2007) Assessment Report .......................................... 5-3
5-2 Normalized GWP Comparison of Measured Emissions from Inside the Casting
Hood ….......................................................................................................................... 5-5
5-3 GWP (Weighted by Flow Rate) Comparison of Measured Emissions from Inside the Casting Hood ................................................................................................................. 5-6
iv

List of Figures Page
2-1 Casting Hood and Sampling System Schematic............................................................ 2-4
2-2 RGA Component Block Diagram.................................................................................. 2-5
4-1 RGA Dilution Measurements, 11 September 2007 ....................................................... 4-2
4-2 RGA Dilution Measurements, 12 September 2007 ....................................................... 4-3
4-3 RGA Dilution Measurements, 13 September 2007 ....................................................... 4-4
A-1 Calibrated RGA Response for Argon ............................................................................ A-4
A-2 Calibrated RGA Response for Krypton ......................................................................... A-5
v

vi
Acknowledgements The analytical measurements, data interpretation, and report preparations were funded by
the U.S. Environmental Protection Agency under contract GS-10F-0124J to ICF International. The authors wish to express their appreciation and thanks to Magnesium Refining Technologies (MagReTech) and staff, especially Ken Balser, for contributing not only their facilities but also their valuable assistance and advice to this measurement study. The support of Matheson Tri-Gas, Polycontrols Inc., and 3M™ for providing the cover gases, their expertise, and trial staff for this study is also gratefully acknowledged.

ES-1
Executive Summary
This measurement study was conducted to evaluate the greenhouse gas (GHG) emissions and occupational exposure associated with three cover gas technologies used in a magnesium alloy ingot casting machine. Sulfur hexafluoride (SF6) is widely used for the protection from oxidation of molten magnesium; but with the goal of eliminating the use of SF6 in this application by 2010, the magnesium industry and U.S. Environmental Protection Agency (EPA) have been evaluating the use of alternative gases. This study expands upon previous research by continuously monitoring multiple sample points and by testing cover gas mixtures in an ingot casting hood environment – previous research used single sampling points and examined die casting holding furnaces.1 This study examined the use of SF6, pentafluoroethylhepafluoro-isopropylketone (Novec™ 612), and sulfur dioxide (SO2) on an ingot casting machine located at a Magnesium Refining Technologies (MagReTech) facility located in Bellevue, Ohio. Process and machine operating parameters were maintained at similar levels when each cover gas mixture was evaluated. Each cover gas mixture was injected into the ingot casting hood and sampled from the hot and cold zones of the casting hood to characterize emissions and byproducts as the cover gases interact with the magnesium melt surface and undergo thermo-degradation. The results reported are from measurements taken from multiple points inside the casting hood, and from an ambient air sampling point in the casting hood operator room. Results are presented for four sample points: the upstream sampling point in the hot zone (hu), the downstream sampling point in the hot zone (hd), the upstream sampling point in the cold zone (cu), and the downstream sampling point in the cold zone (cd). Table ES-1 summarizes some of the details and results from the ingot casting hood component of the study. Measurements were conducted using slightly varied mixtures of each cover gas. The cover gas destruction rates listed in Table ES-1 have been corrected for dilution effects.2
SF6/SO2 with CDA/CO2 Carrier Gas The only destruction byproduct measured while using SF6/SO2 with clean dry air
(CDA)/CO2 as a cover gas was HF, with concentrations ranging from 0.02 to 0.37 ppmv over three different testing periods. Other byproducts, including COS, CS2, H2S, and H2SO4, (see Table 2-1 for a listing of chemical formulas and compound names) were not analytically detected. CH4 was observed at average concentrations of 2.6 to 82.8 ppmv during the three tests; the normal ambient air concentration of CH4 is ~2 ppmv. The high concentration of CH4 is most likely due to the periodic use of to natural gas burners to preheat the ingot molds, therefore CH4
1 US EPA. Characterization of Emissions and Occupational Exposure Associated with Five Cover Gas Technologies for Magnesium Die Casting, EPA 430-R-07-008, August 2007. 2 The term destruction is utilized throughout the remainder of this report to represent the thermo-degradation and disassociation of the cover gas agent resulting in byproduct formation and melt protection.
measured in the ingot casting hood was assumed to originate from fugitive emissions in the facility rather than process emissions associated with cover gas application.
MTG-Shield™ using Novec™ 612 with CDA/CO2 Carrier Gas The only destruction byproducts measured while running MTG-Shield™ using Novec™
612 with CDA/CO2 as a cover gas were HF and CHF3. COF2, CF4, C2F6, C3F8, OF2, CH2O2, and H2CO were expected byproducts that were not analytically detected. HF was detected at concentrations ranging from 0.05 to 1.5 ppmv for the three Novec™ 612 testing periods. CHF3 was twice detected at the downstream sampling point in the hot zone at concentrations ranging from 0.15 to 0.30 ppmv. Perfluoroisobutylene (PFIB), an occupational hazard and primary byproduct of concern, was monitored for, but not detected during this study.
SO2 with CDA Carrier Gas There were no destruction byproducts detected that could be attributed to the SO2 with
CDA cover gas mixture. The only detectable compounds were ambient air and combustion-related compounds (H2O, CO, CO2, and CH4). Methane was detected at average concentrations ranging from 3.2 to 3.6 ppmv. Sulfuric acid and H2S were not measured at concentrations above their minimum detection limits within the ingot casting hood.
Observed Percent Destruction for Cover Gases Table ES-1 lists the destruction estimates for all cover gases examined. The destruction
estimates, which are corrected for dilution effects (i.e., the effects of air ingression into the ingot casting hood), are calculated as the percent difference between the expected dilution corrected delivery concentration and the measured concentration in the casting area. Average destruction estimates for Novec™ 612 and SF6 were on the order of four percent and three percent, respectively. In comparison, destruction estimates for SO2 were on the order of 39 percent for this study. It should be noted that high levels of dilution found in this study and associated uncertainty resulted in calculated destruction rates for some tests being unreasonable (i.e., negative) and these values were treated as zero destruction results.
The destruction rates estimated for SF6 in this study were significantly lower than what was estimated during previous research evaluating die casting holding furnaces (on the order of 20 to 30 percent). This is likely due to the much higher levels of dilution and reduced thermo-chemical intensity of the casting hood environment.
ES-2
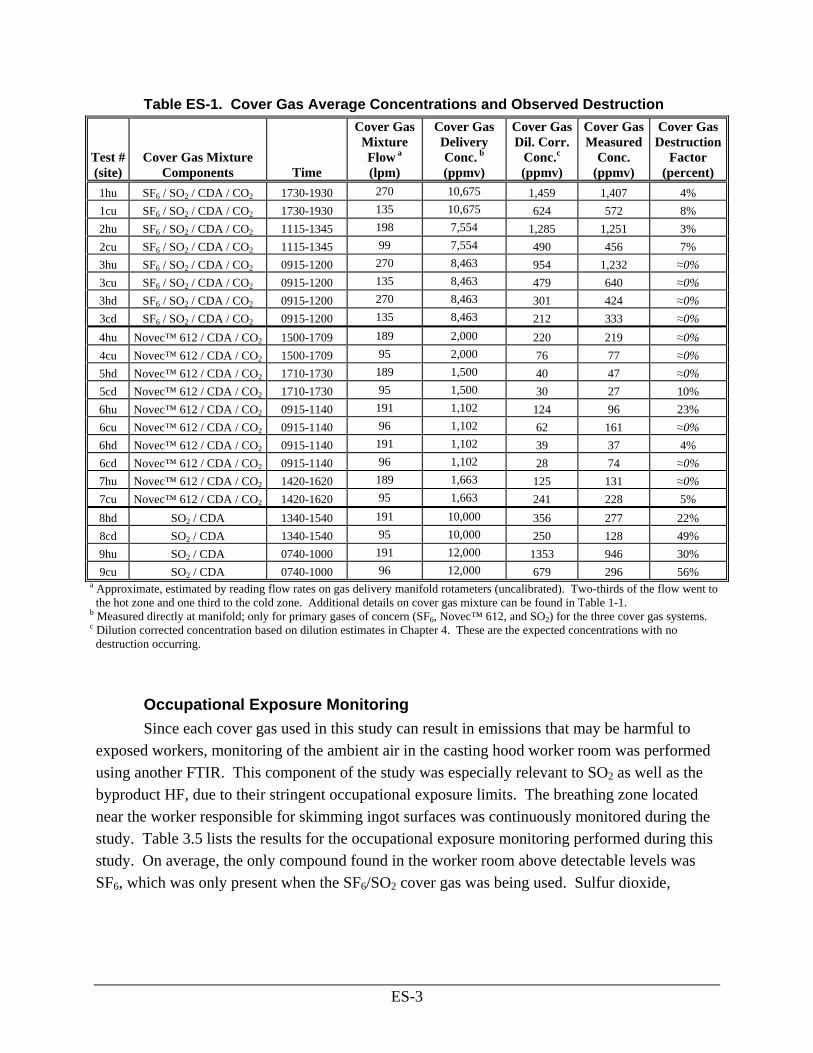
Table ES-1. Cover Gas Average Concentrations and Observed Destruction
Test # (site)
Cover Gas Mixture Components Time
Cover Gas Mixture Flow a (lpm)
Cover Gas Delivery Conc. b (ppmv)
Cover Gas Dil. Corr.
Conc.c
(ppmv)
Cover Gas Measured
Conc. (ppmv)
Cover Gas Destruction
Factor (percent)
1hu SF6 / SO2 / CDA / CO2 1730-1930 270 10,675 1,459 1,407 4% 1cu SF6 / SO2 / CDA / CO2 1730-1930 135 10,675 624 572 8% 2hu SF6 / SO2 / CDA / CO2 1115-1345 198 7,554 1,285 1,251 3% 2cu SF6 / SO2 / CDA / CO2 1115-1345 99 7,554 490 456 7% 3hu SF6 / SO2 / CDA / CO2 0915-1200 270 8,463 954 1,232 ≈0% 3cu SF6 / SO2 / CDA / CO2 0915-1200 135 8,463 479 640 ≈0% 3hd SF6 / SO2 / CDA / CO2 0915-1200 270 8,463 301 424 ≈0% 3cd SF6 / SO2 / CDA / CO2 0915-1200 135 8,463 212 333 ≈0% 4hu Novec™ 612 / CDA / CO2 1500-1709 189 2,000 220 219 ≈0% 4cu Novec™ 612 / CDA / CO2 1500-1709 95 2,000 76 77 ≈0% 5hd Novec™ 612 / CDA / CO2 1710-1730 189 1,500 40 47 ≈0% 5cd Novec™ 612 / CDA / CO2 1710-1730 95 1,500 30 27 10% 6hu Novec™ 612 / CDA / CO2 0915-1140 191 1,102 124 96 23% 6cu Novec™ 612 / CDA / CO2 0915-1140 96 1,102 62 161 ≈0% 6hd Novec™ 612 / CDA / CO2 0915-1140 191 1,102 39 37 4% 6cd Novec™ 612 / CDA / CO2 0915-1140 96 1,102 28 74 ≈0% 7hu Novec™ 612 / CDA / CO2 1420-1620 189 1,663 125 131 ≈0% 7cu Novec™ 612 / CDA / CO2 1420-1620 95 1,663 241 228 5% 8hd SO2 / CDA 1340-1540 191 10,000 356 277 22% 8cd SO2 / CDA 1340-1540 95 10,000 250 128 49% 9hu SO2 / CDA 0740-1000 191 12,000 1353 946 30% 9cu SO2 / CDA 0740-1000 96 12,000 679 296 56%
a Approximate, estimated by reading flow rates on gas delivery manifold rotameters (uncalibrated). Two-thirds of the flow went to the hot zone and one third to the cold zone. Additional details on cover gas mixture can be found in Table 1-1.
b Measured directly at manifold; only for primary gases of concern (SF6, Novec™ 612, and SO2) for the three cover gas systems. c Dilution corrected concentration based on dilution estimates in Chapter 4. These are the expected concentrations with no destruction occurring.
Occupational Exposure Monitoring Since each cover gas used in this study can result in emissions that may be harmful to
exposed workers, monitoring of the ambient air in the casting hood worker room was performed using another FTIR. This component of the study was especially relevant to SO2 as well as the byproduct HF, due to their stringent occupational exposure limits. The breathing zone located near the worker responsible for skimming ingot surfaces was continuously monitored during the study. Table 3.5 lists the results for the occupational exposure monitoring performed during this study. On average, the only compound found in the worker room above detectable levels was SF6, which was only present when the SF6/SO2 cover gas was being used. Sulfur dioxide,
ES-3

ES-4
Novec™ 612, and HF were not present in the worker room above detectable levels for any of the cover gas mixtures and SF6 was not detected during the Novec™ 612 or SO2 tests.3
Potential Climate Impact A key factor in evaluating alternative cover gas compounds was their composite global
warming potentials (GWPs) as compared to SF6. Global warming potentials are based on the heat-absorbing capability and atmospheric lifetime of each gas relative to that of carbon dioxide. The GWP provides a construct for converting emissions of various gases into a common measure, denominated in carbon dioxide equivalents. For each cover gas compound and its applicable destruction byproducts, a composite global warming impact estimate was developed using the IPCC Fourth Assessment Report (AR4) GWP values.4 The overall GWP-weighted gas emission rate for each cover gas regime was estimated using the measured average concentrations of each gas, their molecular weights, and the delivery cover gas flow rates. This resulted in a normalized CO2 emission equivalent for each alternative cover gas that could be directly compared to the CO2 emission equivalent of the existing SF6/SO2 system.
Based on this approach, results indicate that both the Novec™ 612 cover gas mixture and the SO2 cover gas mixture have a GHG emission impact – weighted by cover gas flow – that is at least 99 percent lower than SF6. Table ES-2 presents the results of the global warming potential analysis for the alternative cover gas mixtures examined in this experiment.
Table ES-2. Global Warming Potential of Alternative Cover Gas Mixtures
Cover Gas Mixture
GHG Emissions Relative to Existing SF6 / SO2 system
(percent reduction) Novec™ 612 / CDA / CO2 >99%
SO2 / CDA >99%
3 All applicable safety precautions (e.g., operational procedures) should be followed when using SO2. 4 IPCC, Climate Change 2007: The Scientific Basis. Intergovernmental Panel on Climate Change, 2007, Cambridge University Press. Cambridge, U.K.

1. Introduction
This report presents and interprets the results of a series of emission measurements taken of air-entrained cover gas mixtures at a single magnesium alloy ingot casting machine. The measurements were conducted by URS Corporation (URS) at the Magnesium Refining Technologies (MagReTech) facility located in Bellevue, Ohio, throughout the week of 9 September 2007. Emissions were extracted and continuously analyzed in near real-time with Fourier Transform Infrared (FTIR) spectroscopy and quadrupole mass spectrometry Residual Gas Analysis (RGA). These analysis techniques enabled the simultaneous quantification of multiple concentrations in the cover gas environments at sub-ppmv-level sensitivities.
The three base gases evaluated in this study were sulfur hexafluoride (SF6), pentafluoroethylhepafluoroisopropylketone (known by trade name Novec™ 612), and sulfur dioxide (SO2). The cover gas mixtures are used to protect molten magnesium against surface burning during ingot casting. The primary objectives of this study are listed below.
• Characterize the cover gas destruction at this particular ingot casting tool. Destruction rates impact overall greenhouse gas (GHG) emissions. Destruction is defined as the percentage of base cover gas consumed by the process, whether by breakdown to a magnesium fluoride (MgF2) film and subsequent chemical byproducts, or by direct conversion to byproducts from the thermal conditions and chemistries residing in the casting space environment.
• Characterize the ambient air dilution into the ingot casting and cooling environments. The hot zone and cold zone sections of the casting hood are not sealed, so air intrusion was expected to be significant. Ambient air dilution must be factored into the cover gas consumption considerations so that destruction rates can be properly filtered out from overall concentration reductions.
• Characterize the chemical byproducts produced for each cover gas mixture during ingot casting. The types and relative amounts of byproducts vary greatly depending on the base cover gas and the concentration at which it is used. The chemical byproducts produced also influence the global warming potential of the cover gas mixtures.
• Identify and detect low concentration occupational exposure emissions for each cover gas mixture. Using the most sensitive FTIR system available, monitor a worker area in close proximity to the hot zone for base cover gas and byproduct emissions.
The measurement schedule and test conditions are summarized in Table 1-1. Rather than
being fixed, these conditions were what was encountered during facility operations at the time of
1-1
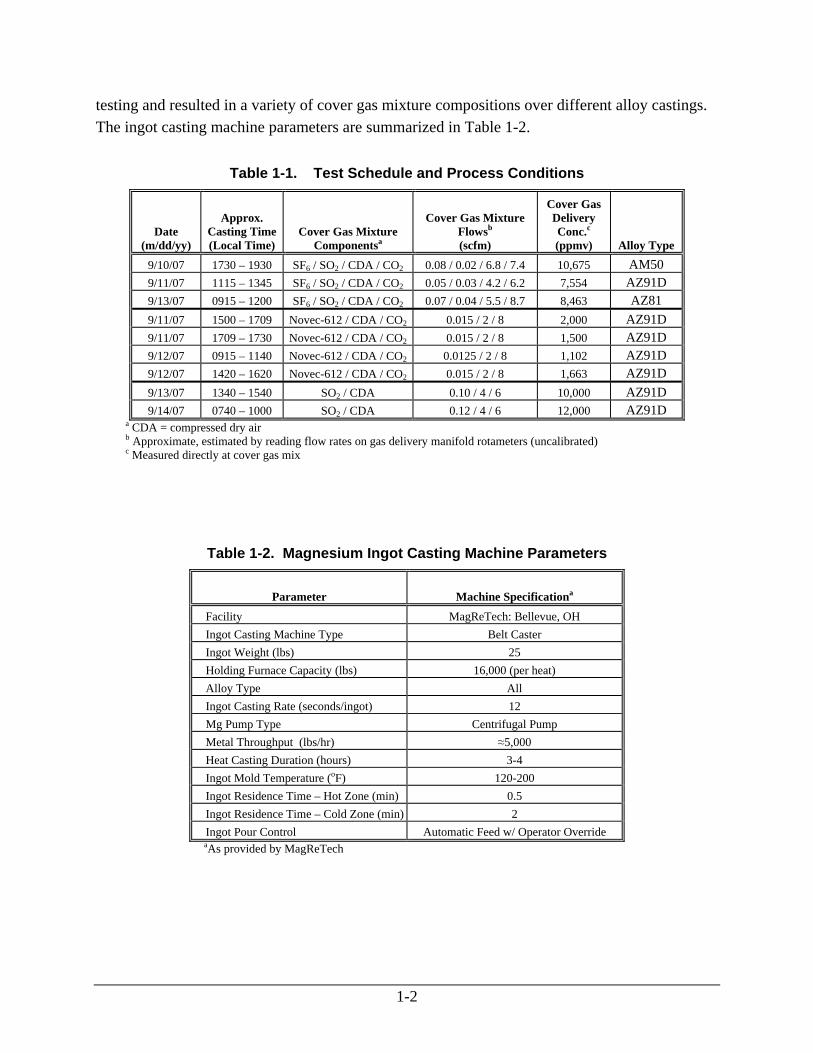
1-2
testing and resulted in a variety of cover gas mixture compositions over different alloy castings. The ingot casting machine parameters are summarized in Table 1-2.
Table 1-1. Test Schedule and Process Conditions
Date (m/dd/yy)
Approx. Casting Time (Local Time)
Cover Gas Mixture Componentsa
Cover Gas Mixture Flowsb (scfm)
Cover Gas Delivery Conc.c (ppmv) Alloy Type
9/10/07 1730 – 1930 SF6 / SO2 / CDA / CO2 0.08 / 0.02 / 6.8 / 7.4 10,675 AM50 9/11/07 1115 – 1345 SF6 / SO2 / CDA / CO2 0.05 / 0.03 / 4.2 / 6.2 7,554 AZ91D 9/13/07 0915 – 1200 SF6 / SO2 / CDA / CO2 0.07 / 0.04 / 5.5 / 8.7 8,463 AZ81 9/11/07 1500 – 1709 Novec-612 / CDA / CO2 0.015 / 2 / 8 2,000 AZ91D 9/11/07 1709 – 1730 Novec-612 / CDA / CO2 0.015 / 2 / 8 1,500 AZ91D 9/12/07 0915 – 1140 Novec-612 / CDA / CO2 0.0125 / 2 / 8 1,102 AZ91D 9/12/07 1420 – 1620 Novec-612 / CDA / CO2 0.015 / 2 / 8 1,663 AZ91D 9/13/07 1340 – 1540 SO2 / CDA 0.10 / 4 / 6 10,000 AZ91D 9/14/07 0740 – 1000 SO2 / CDA 0.12 / 4 / 6 12,000 AZ91D
a CDA = compressed dry air b Approximate, estimated by reading flow rates on gas delivery manifold rotameters (uncalibrated) c Measured directly at cover gas mix
Table 1-2. Magnesium Ingot Casting Machine Parameters
Parameter Machine Specificationa
Facility MagReTech: Bellevue, OH Ingot Casting Machine Type Belt Caster Ingot Weight (lbs) 25 Holding Furnace Capacity (lbs) 16,000 (per heat) Alloy Type All Ingot Casting Rate (seconds/ingot) 12 Mg Pump Type Centrifugal Pump Metal Throughput (lbs/hr) ≈5,000 Heat Casting Duration (hours) 3-4 Ingot Mold Temperature (oF) 120-200 Ingot Residence Time – Hot Zone (min) 0.5 Ingot Residence Time – Cold Zone (min) 2 Ingot Pour Control Automatic Feed w/ Operator Override aAs provided by MagReTech

2. Methodology All gas samples, whether from the casting hood environments or the worker exposure
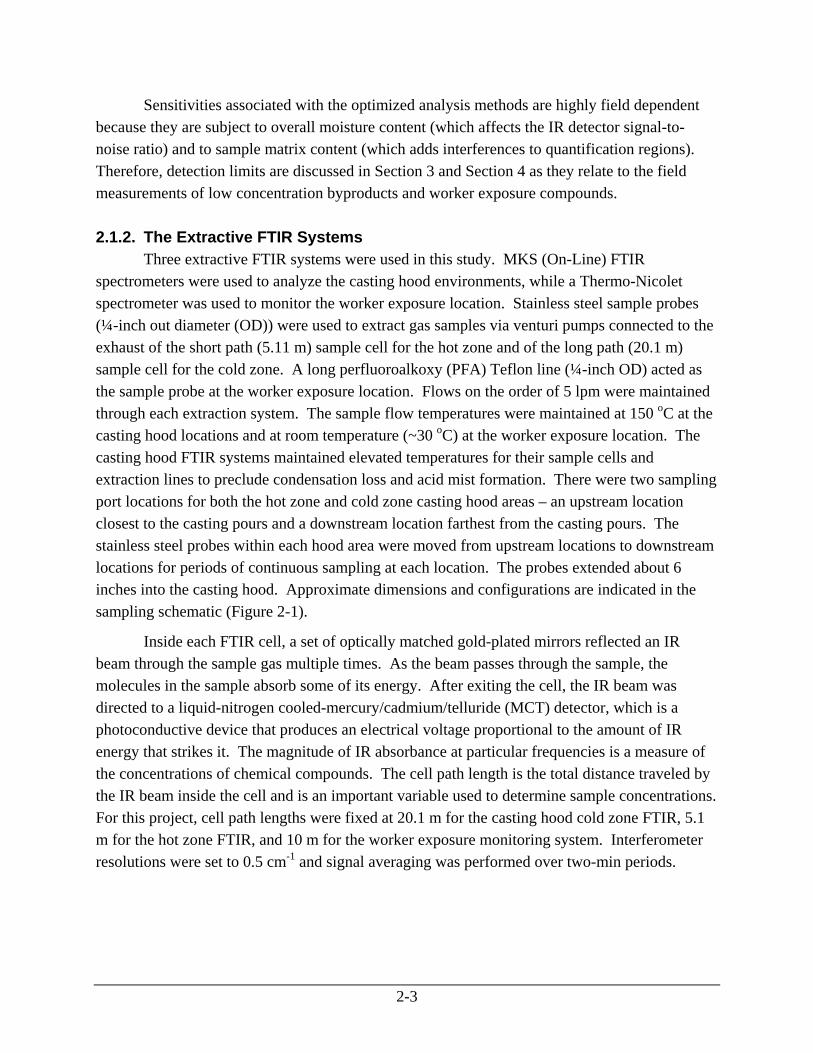
area, were extracted continuously from single points in space. The four sampling points located in the ingot casting area were 1) the upstream sampling point in the hot zone (denoted “hu”), 2) the downstream sampling point in the hot zone (denoted “hd”), 3) the upstream sampling point in the cold zone (denoted “cu”), and 4) the downstream sampling point in the cold zone (denoted “cd”). The sampling system is described in more detail in Section 2.1.2 and the schematic is presented as Figure 2-1.
This section of the report describes the field analytical methods used to probe the gas samples (FTIR and RGA are explained in Sections 2.1 and 2.2, respectively) and how ambient air dilution was determined within the casting hoods (Section 2.3).
2.1. Principles of FTIR Monitoring
Almost every chemical compound absorbs some amount of infrared (IR) light in a particular region of the mid-IR spectrum. These absorption properties can be used to identify and quantify chemical compounds in a complex mixture of gases. Beer’s Law states that the magnitude of IR absorbance by a compound is directly proportional to the product of its concentration in the mixture and the sample cell optical path length. This product is otherwise known as the optical depth of a compound. The extractive FTIR instruments used by URS are able to achieve ppb detection levels because the optical path length within the measurement cell is magnified many times by reflecting the IR beam between a series of mirrors before it reaches the detector. The mirrors provide a fixed optical path length best suited to the gas mixture being sampled. For this study, optical path lengths of 10 m (for worker exposure monitoring), 5.11 m (for hot zone casting head space monitoring), and 20.1 m (for cold zone casting head space monitoring) were utilized. 2.1.1. The FTIR Spectrum Analysis Method
IR spectrum analysis matches the features of an observed spectrum to those of reference gases of known concentration. If more than one feature is present in the same region, then a linear combination of references is used to match the compound feature. The standards are scaled to match the observed band intensities in the sample. This scaling also matches the unknown concentrations. An IR spectrum can be collected and analyzed in approximately one second, but spectra are normally averaged over 1- to 5-min integration periods to produce adequate signal-to-noise limits and ppb detection levels.
The scaled references are added together to produce a composite that represents the best
match with the sample. A classical least squares mathematical function is used to match the
2-1
absorption profiles of the standards with those of the observed spectrum in specified spectral analysis regions. The compounds of interest and the compounds expected to cause spectral interference are included in the analysis region.
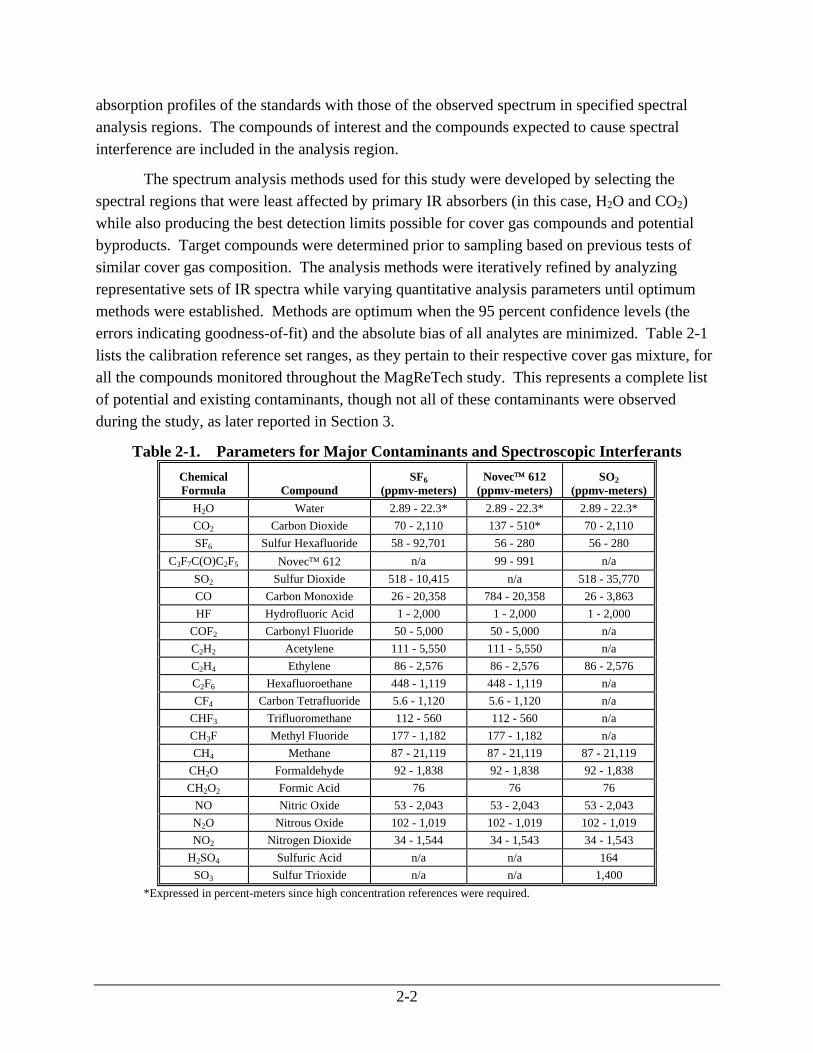
The spectrum analysis methods used for this study were developed by selecting the spectral regions that were least affected by primary IR absorbers (in this case, H2O and CO2) while also producing the best detection limits possible for cover gas compounds and potential byproducts. Target compounds were determined prior to sampling based on previous tests of similar cover gas composition. The analysis methods were iteratively refined by analyzing representative sets of IR spectra while varying quantitative analysis parameters until optimum methods were established. Methods are optimum when the 95 percent confidence levels (the errors indicating goodness-of-fit) and the absolute bias of all analytes are minimized. Table 2-1 lists the calibration reference set ranges, as they pertain to their respective cover gas mixture, for all the compounds monitored throughout the MagReTech study. This represents a complete list of potential and existing contaminants, though not all of these contaminants were observed during the study, as later reported in Section 3.
Table 2-1. Parameters for Major Contaminants and Spectroscopic Interferants Chemical Formula Compound
SF6 (ppmv-meters)
Novec™ 612 (ppmv-meters)
SO2 (ppmv-meters)
H2O Water 2.89 - 22.3* 2.89 - 22.3* 2.89 - 22.3* CO2 Carbon Dioxide 70 - 2,110 137 - 510* 70 - 2,110 SF6 Sulfur Hexafluoride 58 - 92,701 56 - 280 56 - 280
C3F7C(O)C2F5 Novec™ 612 n/a 99 - 991 n/a SO2 Sulfur Dioxide 518 - 10,415 n/a 518 - 35,770 CO Carbon Monoxide 26 - 20,358 784 - 20,358 26 - 3,863 HF Hydrofluoric Acid 1 - 2,000 1 - 2,000 1 - 2,000
COF2 Carbonyl Fluoride 50 - 5,000 50 - 5,000 n/a C2H2 Acetylene 111 - 5,550 111 - 5,550 n/a C2H4 Ethylene 86 - 2,576 86 - 2,576 86 - 2,576 C2F6 Hexafluoroethane 448 - 1,119 448 - 1,119 n/a CF4 Carbon Tetrafluoride 5.6 - 1,120 5.6 - 1,120 n/a
CHF3 Trifluoromethane 112 - 560 112 - 560 n/a CH3F Methyl Fluoride 177 - 1,182 177 - 1,182 n/a CH4 Methane 87 - 21,119 87 - 21,119 87 - 21,119
CH2O Formaldehyde 92 - 1,838 92 - 1,838 92 - 1,838 CH2O2 Formic Acid 76 76 76
NO Nitric Oxide 53 - 2,043 53 - 2,043 53 - 2,043 N2O Nitrous Oxide 102 - 1,019 102 - 1,019 102 - 1,019 NO2 Nitrogen Dioxide 34 - 1,544 34 - 1,543 34 - 1,543
H2SO4 Sulfuric Acid n/a n/a 164 SO3 Sulfur Trioxide n/a n/a 1,400
*Expressed in percent-meters since high concentration references were required.
2-2
2-3
Sensitivities associated with the optimized analysis methods are highly field dependent because they are subject to overall moisture content (which affects the IR detector signal-to-noise ratio) and to sample matrix content (which adds interferences to quantification regions). Therefore, detection limits are discussed in Section 3 and Section 4 as they relate to the field measurements of low concentration byproducts and worker exposure compounds. 2.1.2. The Extractive FTIR Systems
Three extractive FTIR systems were used in this study. MKS (On-Line) FTIR spectrometers were used to analyze the casting hood environments, while a Thermo-Nicolet spectrometer was used to monitor the worker exposure location. Stainless steel sample probes (¼-inch out diameter (OD)) were used to extract gas samples via venturi pumps connected to the exhaust of the short path (5.11 m) sample cell for the hot zone and of the long path (20.1 m) sample cell for the cold zone. A long perfluoroalkoxy (PFA) Teflon line (¼-inch OD) acted as the sample probe at the worker exposure location. Flows on the order of 5 lpm were maintained through each extraction system. The sample flow temperatures were maintained at 150 oC at the casting hood locations and at room temperature (~30 oC) at the worker exposure location. The casting hood FTIR systems maintained elevated temperatures for their sample cells and extraction lines to preclude condensation loss and acid mist formation. There were two sampling port locations for both the hot zone and cold zone casting hood areas – an upstream location closest to the casting pours and a downstream location farthest from the casting pours. The stainless steel probes within each hood area were moved from upstream locations to downstream locations for periods of continuous sampling at each location. The probes extended about 6 inches into the casting hood. Approximate dimensions and configurations are indicated in the sampling schematic (Figure 2-1).
Inside each FTIR cell, a set of optically matched gold-plated mirrors reflected an IR beam through the sample gas multiple times. As the beam passes through the sample, the molecules in the sample absorb some of its energy. After exiting the cell, the IR beam was directed to a liquid-nitrogen cooled-mercury/cadmium/telluride (MCT) detector, which is a photoconductive device that produces an electrical voltage proportional to the amount of IR energy that strikes it. The magnitude of IR absorbance at particular frequencies is a measure of the concentrations of chemical compounds. The cell path length is the total distance traveled by the IR beam inside the cell and is an important variable used to determine sample concentrations. For this project, cell path lengths were fixed at 20.1 m for the casting hood cold zone FTIR, 5.1 m for the hot zone FTIR, and 10 m for the worker exposure monitoring system. Interferometer resolutions were set to 0.5 cm-1 and signal averaging was performed over two-min periods.
2-4
Worker area (enclosed)
worker exposure sampling location
Curing Hood
Casting Hood
Conveyor Belt Conveyor BeltHot Zone
Cold Zone
50-ft Heated Teflon Line
50-ft Heated Teflon Line
FTIR (5.11-m
heated cell)
FTIR (20.1-m
heated cell)
Atmospheric Sampling
RGASlip-stream
Slip-stream
Sample Probes
Sample Probes
Metal pump line
=Approximate casting hood sampling locations(~3 feet apart)
(not to scale)
Figure 2-1. Casting Hood and Sampling System Schematic
hu hd cu cd
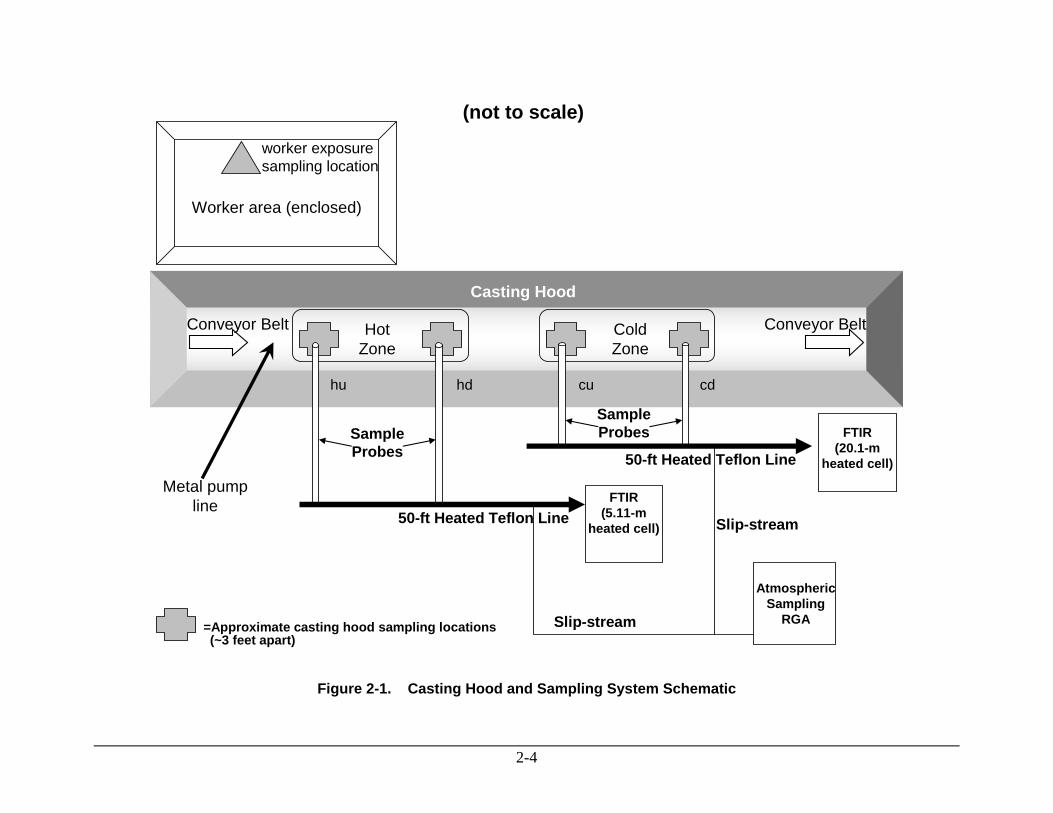
2.2. Principles of RGA Monitoring A mass spectrum is obtained by converting components of a sample into rapidly moving
gaseous ions and resolving them on the basis of their mass-to-charge ratios. The principles of mass spectrometry are straightforward; a block diagram showing the major components of the URS-built RGA is displayed in Figure 2-2.
Inlet System
Ion Source+
Mass Analyzer+
Detector
Signal Processor
Data Archival andControlVacuum
SystemVacuumSystem
Sample
ChamberAperture
Figure 2-2. RGA Component Block Diagram
Descriptions of these components are included in Section 2.2.2. As molecules from the
sample are ionized in the analyzer chamber, the detector registers a response for a given mass-to-charge (m/e) ratio at an intensity proportional to the absolute molecule count. The following section reports the desired m/e ratios for argon and krypton, which were monitored during dilution measurements.
2.2.1. The RGA Spectrum Analysis Method
Since the RGA quadrupole mass analyzer breaks down molecules (or, in this case, the natural atomic species argon or krypton) into fragments of varying m/e ratios, the specific m/e
2-5
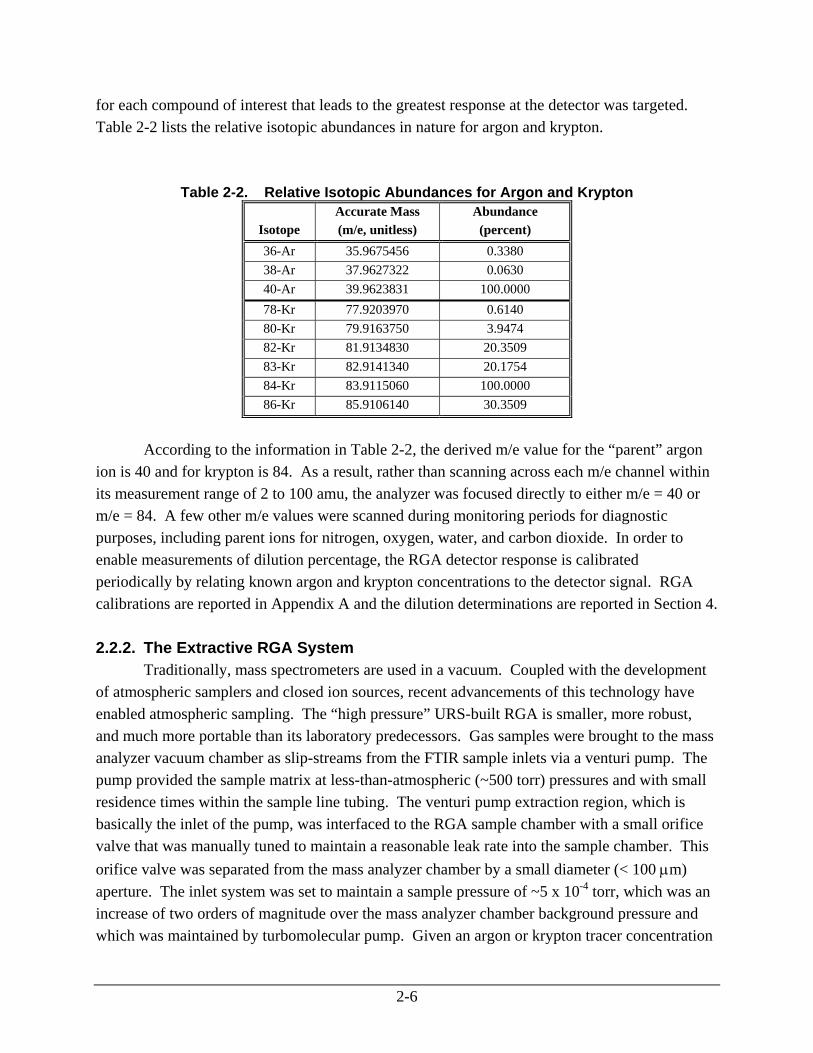
for each compound of interest that leads to the greatest response at the detector was targeted. Table 2-2 lists the relative isotopic abundances in nature for argon and krypton.
Table 2-2. Relative Isotopic Abundances for Argon and Krypton
Isotope Accurate Mass (m/e, unitless)
Abundance (percent)
36-Ar 35.9675456 0.3380 38-Ar 37.9627322 0.0630 40-Ar 39.9623831 100.0000 78-Kr 77.9203970 0.6140 80-Kr 79.9163750 3.9474 82-Kr 81.9134830 20.3509 83-Kr 82.9141340 20.1754 84-Kr 83.9115060 100.0000 86-Kr 85.9106140 30.3509
According to the information in Table 2-2, the derived m/e value for the “parent” argon
ion is 40 and for krypton is 84. As a result, rather than scanning across each m/e channel within its measurement range of 2 to 100 amu, the analyzer was focused directly to either m/e = 40 or m/e = 84. A few other m/e values were scanned during monitoring periods for diagnostic purposes, including parent ions for nitrogen, oxygen, water, and carbon dioxide. In order to enable measurements of dilution percentage, the RGA detector response is calibrated periodically by relating known argon and krypton concentrations to the detector signal. RGA calibrations are reported in Appendix A and the dilution determinations are reported in Section 4.
2.2.2. The Extractive RGA System
Traditionally, mass spectrometers are used in a vacuum. Coupled with the development of atmospheric samplers and closed ion sources, recent advancements of this technology have enabled atmospheric sampling. The “high pressure” URS-built RGA is smaller, more robust, and much more portable than its laboratory predecessors. Gas samples were brought to the mass analyzer vacuum chamber as slip-streams from the FTIR sample inlets via a venturi pump. The pump provided the sample matrix at less-than-atmospheric (~500 torr) pressures and with small residence times within the sample line tubing. The venturi pump extraction region, which is basically the inlet of the pump, was interfaced to the RGA sample chamber with a small orifice valve that was manually tuned to maintain a reasonable leak rate into the sample chamber. This orifice valve was separated from the mass analyzer chamber by a small diameter (< 100 μm) aperture. The inlet system was set to maintain a sample pressure of ~5 x 10⁻⁴ torr, which was an increase of two orders of magnitude over the mass analyzer chamber background pressure and which was maintained by turbomolecular pump. Given an argon or krypton tracer concentration
2-6
of approximately 1 percent (10,000 ppmv), a detection sensitivity of approximately 100 ppmv was achieved. Such a detection sensitivity enabled the accurate measurement of dilution percentage values up to 99 percent (1-[100 ppmv / 10,000 ppmv] * 100).
The RGA detection system housed in the main (mass analyzer) chamber was a Micropole™ mass analyzer manufactured by Horiba. It consisted of an integrated package that operated a tungsten filament (the ionizer) coupled to a series of focusing lenses and a miniature array of quadrupoles (the mass analyzer) that allowed the ions to strike a Faraday Cup (the detector). The mass range for this analyzer was 2 to 100 amu with a resolution of 1 amu. A RS232 digital interface to a laptop and appropriate software allowed continuous operation and data archival.
2.3. Ambient Air Dilution Considerations
Though the ingot casting machine hot and cold zones were somewhat contained in a hooded enclosure, they were not completely sealed. A significant amount of ambient air dilution was anticipated and must be considered when computing destruction rates based on concentration measurements. As a result, the ambient air dilution within the casting hood was experimentally determined using three distinct approaches.
1) Ambient argon intrusion: This was anticipated to provide the most direct and continuous measurement approach because the concentration of argon was tracked in real time via RGA at the same extractive sample locations as the FTIR systems. Ambient levels of argon were assumed to be on the order of 1 percent (10,000 ppmv) and were factored into the dilution calculations when known flow rates of compressed dry air (CDA) from the direct cover gas mixture were considered supplemental to air dilution. Therefore, given the field RGA sensitivity for argon on the order of 100 ppmv, dilution rates up to 99 percent could be tracked. With only one RGA system available for sampling, the hot casting zone was monitored during the first half of each cover gas testing period and the cold casting zone was monitored during the second half of the period.
2) Krypton tracer: A krypton tracer study was intended to further support the direct argon intrusion measurements. An added benefit of this part of the study was that krypton background concentrations and cover gas mixture contributions were negligible, which minimizes dilution rate bias. One point of concern in this analysis was the possibility of krypton interacting with free fluorine in the thermal plasma at the magnesium melt surface. The heavy noble gas xenon will readily form complexes with fluorine and oxygen, while the reactivity of krypton is less known but is expected to be weaker than with xenon.
2-7

2-8
3) Cover gas measurements during non-casting periods: Because casting operations at MagReTech were constant while the cover gas was being applied, measurements taken from the casting hood during normal testing conditions (a moving ingot mold conveyer belt with metal present) could be compared to a situation with a moving belt but no metal present. Since no magnesium was present in the casting hood zones to react with or degrade the cover gas, any reduction in the concentration of the cover gas constituents would be solely attributable to ambient air dilution. This test was run once for each cover gas system examined. A potential anticipated drawback to this procedure was that the ambient air/cover gas dilution dynamics may be different in a casting hood without molten magnesium and its resulting convective effects, though ingot molds are pre-heated. The dilution estimates determined through this approach were then used to determine cover gas destruction.
Injecting argon tracer gas directly into the cover gas mixture manifold at concentrations much greater than ambient levels would further support the results obtained from the ambient argon intrusion monitoring. High tracer concentrations are needed to overcome not only the native amounts of argon present due to significant ambient air dilution but also the argon already present in the CDA. High concentrations of inert tracer gas would potentially have an adverse impact on the cover gas mixture needed for processing ingots by displacing the active cover gas constituents. Therefore, only the three approaches described above were carried out, and the results of these approaches are reported in Section 4.

3-1
3. Monitoring Results 3.1. Casting Hood Monitoring
Each cover gas mixture has the potential to generate a variety of chemical byproducts that are due to local thermal plasma effects near the ingot melt surfaces in conjunction with significant amounts of ambient moisture within the casting hood environment. The amount of air dilution was expected to impact the type and relative amounts of these byproducts, but the extent of this impact is not completely understood. For example, air dilution provides a source of hydrogen as a chemical pathway so that all fluorinated cover gas mixtures (SF6/SO2 and Novec™ 612) were expected to produce a hydrogen fluoride (HF) byproduct. Also, the thermal plasmas within the local volumes around each ingot mold were expected to break down the base cover gas mixture components into reactive atomic and free radical species. These species would then recombine into other byproducts that were mostly fluorinated. This would be especially true for Novec™ 612 mixtures, as perfluorocarbons (PFCs) have previously been observed during tests conducted on magnesium die casting holding furnaces.5
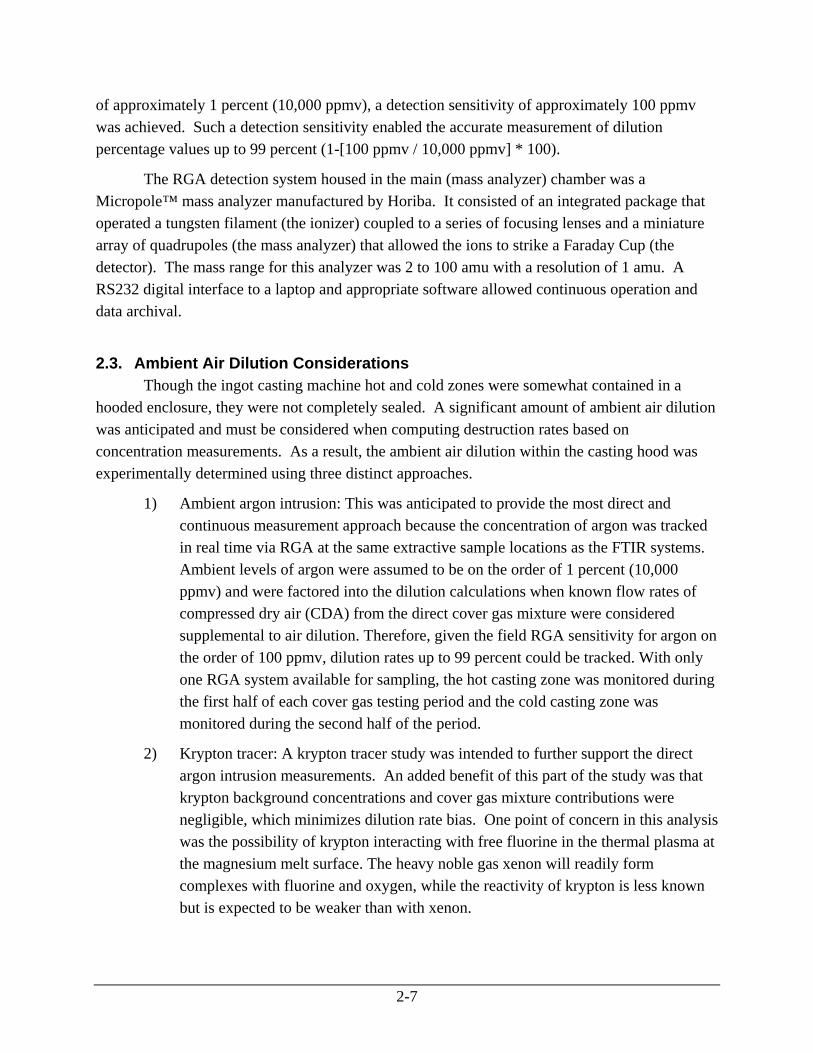
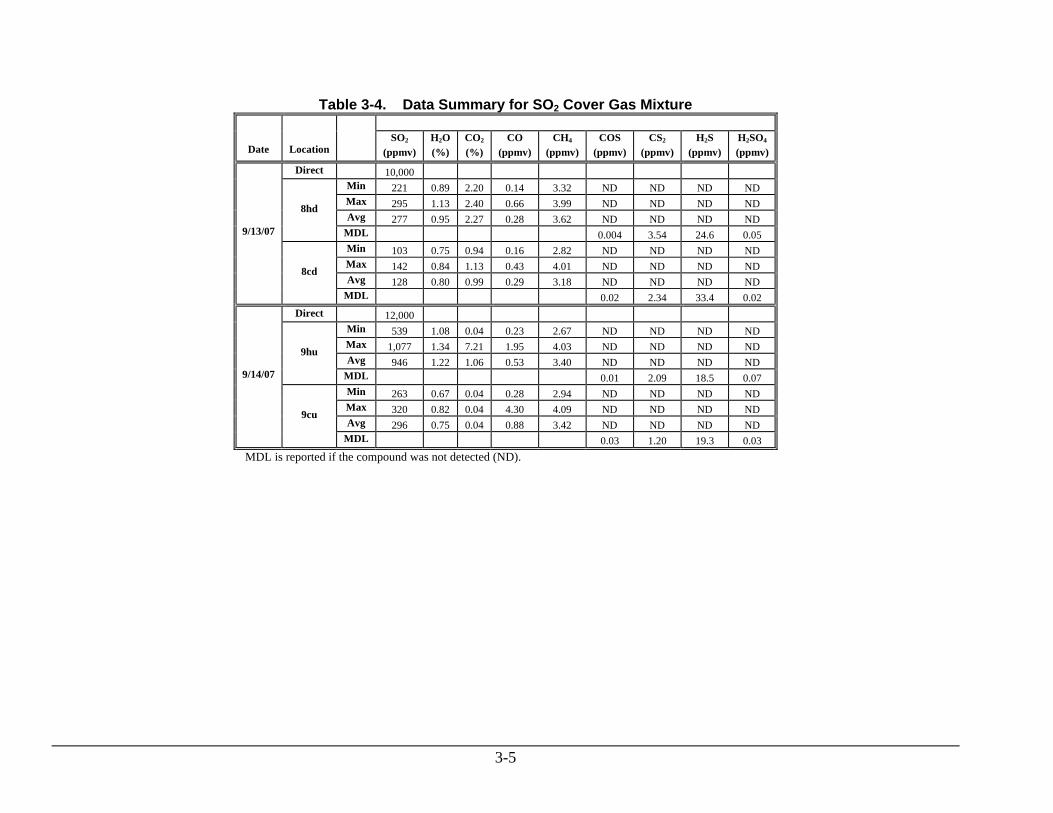
However, for this project, the expected byproducts normally produced at low ppmv levels were not analytically detected because of the small surface areas of the magnesium melts and the high degree of dilution in the ingot casting hood. Table 3-1 summarizes the cover gas, ambient air, and combustion-type compounds and the expected destruction byproducts for the SF6/SO2 cover gas runs. The minimum detection limits (MDLs) for the anticipated byproducts are also reported. These MDLs were considered to be field-representative by taking three times the standard deviation of the quantitative analysis values for each compound that were scattered about zero. The sample spectra data sets were validated by confirming that they contained all the primary infrared absorption interferences (for H2O, CO2, base cover gas compounds, etc.) but none of the byproducts listed as not detected (ND) in the tables below. Tables 3-2 and 3-3 summarize the observable compounds for the Novec™ 612 cover gas runs. In tests 5hd and 6hd, CHF3 was measured at extremely low levels, averaging at or below the MDL. Table 3-4 summarizes the observables for the SO2 cover gas mixture. Sulfuric acid (H2SO4) was anticipated but not detected throughout both sampling periods.
Special attention was paid to perfluoroisobutylene (PFIB) as one potential byproduct of the Novec™ 612 cover gas mixture. It was important to monitor PFIB from an occupational exposure standpoint because it is has extremely low exposure limits. A suitable FTIR spectral reference was unattainable, and the URS laboratory was not able to generate a reference because PFIB is a controlled substance. However, a mass spectrum of this gas has been published and was referenced on-site against a continuous two-hour block of full-spectral RGA scans taken during the Novec™ 612 testing. The appearance of RGA peaks at m/e = 69, 31, and 93 at 5 US EPA. Characterization of Emissions and Occupational Exposure Associated with Five Cover Gas Technologies for Magnesium Die Casting, 2007

3-2
relative abundances of 100 percent, 60 percent, and 30 percent, respectively, would have been an indicator of the presence PFIBs. However, PFIB was not detected during this study because signals at m/e = 69 were never observed to be above noise levels. The estimated detection limit for partial pressures at m/e = 69 was on the order of 10 ppmv.
Table 3-1. Data Summary for SF6 / SO2 Cover Gas Mixture
Date Test
Location SF6
(ppmv) SO2
(ppmv) H2O (%)
CO2 (%)
CO (ppmv)
CH4 (ppmv)
HF (ppmv)
COS (ppmv)
CS2 (ppmv)
H2S (ppmv)
H2SO4 (ppmv)
Direct 10,675 4,039 Min 1,332 502 1.04 6.21 0.41 2.54 0.05 ND ND ND ND Max 1,478 547 1.25 6.56 1.95 10.0 0.17 ND ND ND ND Avg 1,407 530 1.09 6.42 0.83 3.79 0.09 ND ND ND ND
1hu
MDL 0.01 0.44 8.46 0.34 Min 507 210 0.94 2.36 0.50 2.40 0.26 ND ND ND ND Max 646 265 1.07 2.87 2.14 9.63 0.30 ND ND ND ND Avg 572 233 0.97 2.67 0.96 3.81 0.28 ND ND ND ND
9/10/07
1cu
MDL 0.01 1.17 22.5 0.34 Direct 7,554 8,249
Min 1,016 605 1.18 6.18 0.20 2.19 0.02 ND ND ND ND Max 1,418 1,127 1.49 7.52 5.88 3.61 0.07 ND ND ND ND Avg 1,251 724 1.34 7.12 0.56 2.66 0.03 ND ND ND ND
2hu
MDL 0.03 0.61 15.5 0.64 Min 375 199 0.79 1.85 0.17 2.10 0.09 ND ND ND ND Max 537 411 0.96 2.57 4.04 3.41 0.15 ND ND ND ND Avg 456 232 0.88 2.11 0.48 2.61 0.11 ND ND ND ND
9/11/07
2cu
MDL 0.03 2.11 28.8 0.49 Direct 8,463 6,682
Min 648 449 1.07 3.86 0.43 2.54 0.07 ND ND ND ND Max 1,651 1016 1.54 8.32 64.6 371 0.11 ND ND ND ND Avg 1,232 843 1.27 6.81 10.1 56.1 0.09 ND ND ND ND
3hu
MDL 0.03 0.75 19.2 1.08 Min 442 298 0.58 1.72 0.34 1.91 0.08 ND ND ND ND Max 865 557 1.03 3.08 138 354 0.26 ND ND ND ND Avg 639 446 0.75 2.64 32.9 82.8 0.17 ND ND ND ND
3cu
MDL 0.06 0.76 37.2 1.06 Min 283 143 1.11 242 0.27 2.14 0.07 ND ND ND ND Max 565 322 1.48 3.59 1.64 9.87 0.11 ND ND ND ND Avg 424 216 1.28 2.91 0.62 3.24 0.09 ND ND ND ND
3hd
MDL 0.01 1.00 18.6 2.92 Min 236 126 0.73 1.53 0.33 1.49 0.18 ND ND ND ND Max 499 396 0.85 2.58 2.21 4.42 0.37 ND ND ND ND Avg 333 187 0.78 1.92 0.72 2.68 0.26 ND ND ND ND
9/13/07
3cd
MDL 0.04 0.34 46.9 1.30
MDL is reported if the compound was not detected (ND).
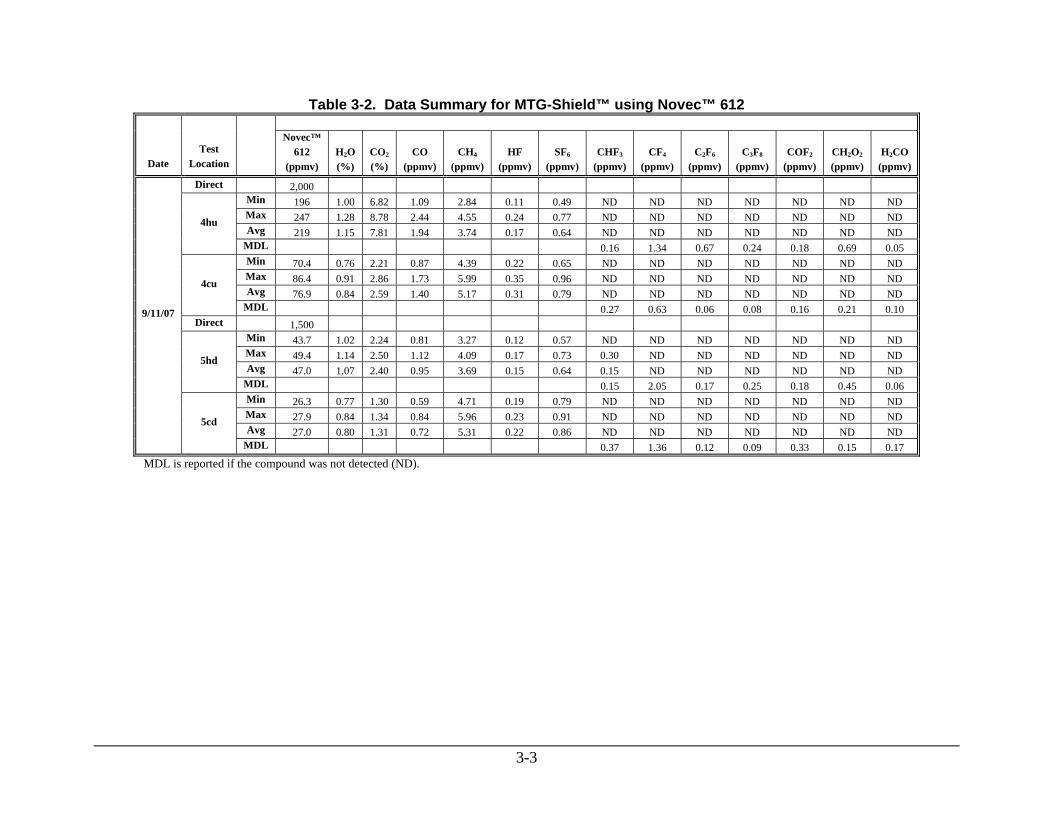
Table 3-2. Data Summary for MTG-Shield™ using Novec™ 612
Date Test
Location
Novec™ 612
(ppmv) H2O (%)
CO2 (%)
CO (ppmv)
CH4 (ppmv)
HF (ppmv)
SF6 (ppmv)
CHF3 (ppmv)
CF4 (ppmv)
C2F6 (ppmv)
C3F8 (ppmv)
COF2 (ppmv)
CH2O2 (ppmv)
H2CO (ppmv)
Direct 2,000 Min 196 1.00 6.82 1.09 2.84 0.11 0.49 ND ND ND ND ND ND ND Max 247 1.28 8.78 2.44 4.55 0.24 0.77 ND ND ND ND ND ND ND Avg 219 1.15 7.81 1.94 3.74 0.17 0.64 ND ND ND ND ND ND ND
4hu
MDL 0.16 1.34 0.67 0.24 0.18 0.69 0.05 Min 70.4 0.76 2.21 0.87 4.39 0.22 0.65 ND ND ND ND ND ND ND Max 86.4 0.91 2.86 1.73 5.99 0.35 0.96 ND ND ND ND ND ND ND Avg 76.9 0.84 2.59 1.40 5.17 0.31 0.79 ND ND ND ND ND ND ND
4cu
MDL 0.27 0.63 0.06 0.08 0.16 0.21 0.10 Direct 1,500
Min 43.7 1.02 2.24 0.81 3.27 0.12 0.57 ND ND ND ND ND ND ND Max 49.4 1.14 2.50 1.12 4.09 0.17 0.73 0.30 ND ND ND ND ND ND Avg 47.0 1.07 2.40 0.95 3.69 0.15 0.64 0.15 ND ND ND ND ND ND
5hd
MDL 0.15 2.05 0.17 0.25 0.18 0.45 0.06 Min 26.3 0.77 1.30 0.59 4.71 0.19 0.79 ND ND ND ND ND ND ND Max 27.9 0.84 1.34 0.84 5.96 0.23 0.91 ND ND ND ND ND ND ND Avg 27.0 0.80 1.31 0.72 5.31 0.22 0.86 ND ND ND ND ND ND ND
9/11/07
5cd
MDL 0.37 1.36 0.12 0.09 0.33 0.15 0.17 MDL is reported if the compound was not detected (ND).
3-3

Table 3-3. Data Summary for MTG-Shield™ using Novec™ 612
Date Test
Location Novec™
612 (ppmv)
H2O (%)
CO2 (%)
CO (ppmv)
CH4 (ppmv)
HF (ppmv)
SF6 (ppmv)
CHF3 (ppmv)
CF4 (ppmv)
C2F6 (ppmv)
C3F8 (ppmv)
COF2 (ppmv)
CH2O2 (ppmv)
H2CO (ppmv)
Direct 1,102 Min 77.5 0.96 4.79 0.45 1.77 0.05 0.07 ND ND ND ND ND ND ND Max 112 1.28 7.16 3.35 2.86 0.16 0.22 ND ND ND ND ND ND ND Avg 95.6 1.12 6.66 1.66 2.12 0.09 0.11 ND ND ND ND ND ND ND
6hu
MDL 0.09 1.58 0.41 0.29 0.16 0.76 0.05 Min 137 2.46 8.33 0.72 3.56 0.35 0.28 ND ND ND ND ND ND ND Max 223 2.97 11.0 9.78 10.7 0.82 1.09 ND ND ND ND ND ND ND Avg 161 2.67 9.17 2.44 7.45 0.61 0.50 ND ND ND ND ND ND ND
6cu
MDL 0.90 5.21 0.81 0.26 0.53 1.17 0.61 Min 34.9 1.15 2.99 0.61 2.09 0.14 0.08 ND ND ND ND ND ND ND Max 41.3 1.58 3.61 105 719 0.18 0.32 0.30 ND ND ND ND ND ND Avg 37.5 1.30 3.22 10.7 71.1 0.17 0.16 0.15 ND ND ND ND ND ND
6hd
MDL 0.22 1.48 1.10 0.64 0.17 1.12 0.05 Min 52.1 2.60 4.79 0.87 10.2 0.73 0.63 ND ND ND ND ND ND ND Max 84.1 3.63 5.24 436.5 1558 1.29 1.75 ND ND ND ND ND ND ND Avg 73.8 2.86 4.99 36.8 139 0.97 0.99 ND ND ND ND ND ND ND
9/12/07
6cd
MDL 1.92 7.95 0.39 0.22 0.53 0.54 0.66 Direct 1,663
Min 85.7 0.98 3.93 0.26 1.32 0.12 0.04 ND ND ND ND ND ND ND Max 158 1.21 6.35 0.93 2.32 0.38 0.13 ND ND ND ND ND ND ND Avg 131 1.10 5.25 0.52 1.82 0.26 0.08 ND ND ND ND ND ND ND
7hu
MDL 0.22 1.48 1.10 0.64 0.17 1.12 0.05 Min 203 2.60 7.30 0.62 4.57 0.85 0.09 ND ND ND ND ND ND ND Max 260 3.31 9.47 2.57 9.85 1.47 0.52 ND ND ND ND ND ND ND Avg 228 2.91 8.44 1.20 6.93 1.16 0.28 ND ND ND ND ND ND ND
9/12/07
7cu
MDL 0.60 3.10 0.40 0.19 0.28 0.71 0.20 MDL is reported if the compound was not detected (ND).
3-4
3-5
Table 3-4. Data Summary for SO2 Cover Gas Mixture
Date Location SO2
(ppmv) H2O (%)
CO2 (%)
CO (ppmv)
CH4 (ppmv)
COS (ppmv)
CS2 (ppmv)
H2S (ppmv)
H2SO4 (ppmv)
Direct 10,000 Min 221 0.89 2.20 0.14 3.32 ND ND ND ND Max 295 1.13 2.40 0.66 3.99 ND ND ND ND Avg 277 0.95 2.27 0.28 3.62 ND ND ND ND
8hd
MDL 0.004 3.54 24.6 0.05 Min 103 0.75 0.94 0.16 2.82 ND ND ND ND Max 142 0.84 1.13 0.43 4.01 ND ND ND ND Avg 128 0.80 0.99 0.29 3.18 ND ND ND ND
9/13/07
8cd
MDL 0.02 2.34 33.4 0.02 Direct 12,000
Min 539 1.08 0.04 0.23 2.67 ND ND ND ND Max 1,077 1.34 7.21 1.95 4.03 ND ND ND ND Avg 946 1.22 1.06 0.53 3.40 ND ND ND ND
9hu
MDL 0.01 2.09 18.5 0.07 Min 263 0.67 0.04 0.28 2.94 ND ND ND ND Max 320 0.82 0.04 4.30 4.09 ND ND ND ND Avg 296 0.75 0.04 0.88 3.42 ND ND ND ND
9/14/07
9cu
MDL 0.03 1.20 19.3 0.03 MDL is reported if the compound was not detected (ND).
3-6
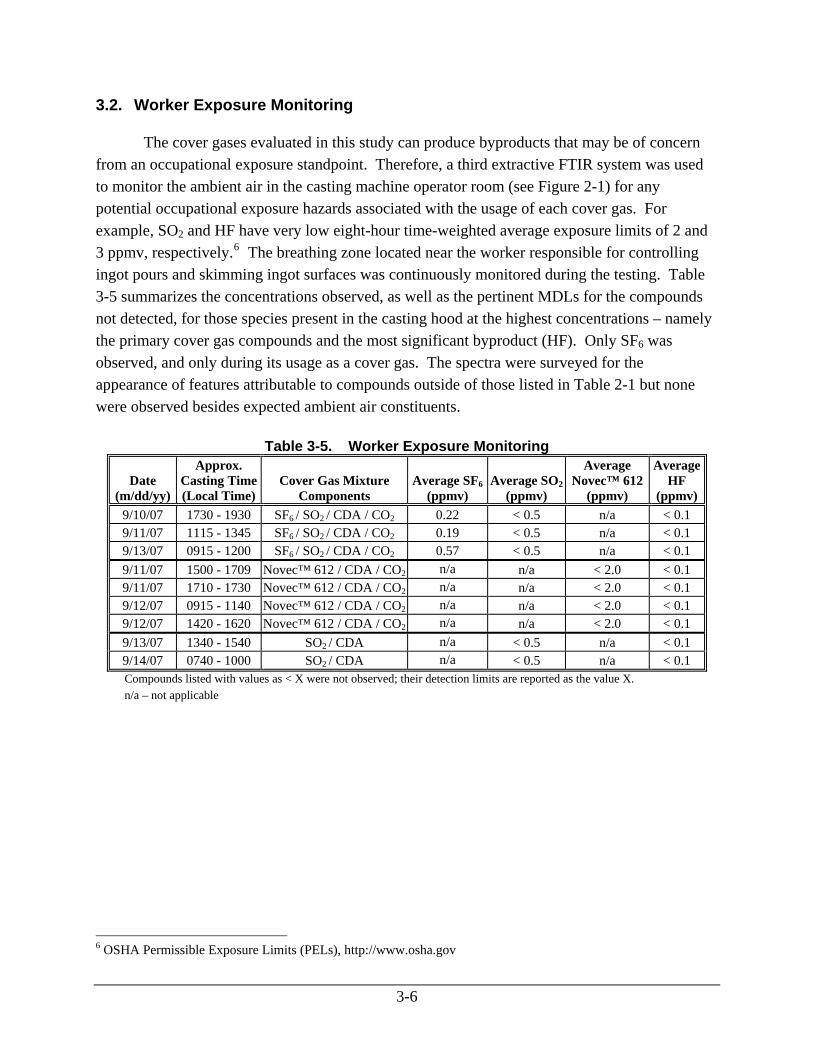
3.2. Worker Exposure Monitoring
The cover gases evaluated in this study can produce byproducts that may be of concern from an occupational exposure standpoint. Therefore, a third extractive FTIR system was used to monitor the ambient air in the casting machine operator room (see Figure 2-1) for any potential occupational exposure hazards associated with the usage of each cover gas. For example, SO2 and HF have very low eight-hour time-weighted average exposure limits of 2 and 3 ppmv, respectively.6 The breathing zone located near the worker responsible for controlling ingot pours and skimming ingot surfaces was continuously monitored during the testing. Table 3-5 summarizes the concentrations observed, as well as the pertinent MDLs for the compounds not detected, for those species present in the casting hood at the highest concentrations – namely the primary cover gas compounds and the most significant byproduct (HF). Only SF6 was observed, and only during its usage as a cover gas. The spectra were surveyed for the appearance of features attributable to compounds outside of those listed in Table 2-1 but none were observed besides expected ambient air constituents.
Table 3-5. Worker Exposure Monitoring
Date (m/dd/yy)
Approx. Casting Time (Local Time)
Cover Gas Mixture Components
Average SF6(ppmv)
Average SO2(ppmv)
Average Novec™ 612
(ppmv)
Average HF
(ppmv)9/10/07 1730 - 1930 SF6 / SO2 / CDA / CO2 0.22 < 0.5 n/a < 0.1 9/11/07 1115 - 1345 SF6 / SO2 / CDA / CO2 0.19 < 0.5 n/a < 0.1 9/13/07 0915 - 1200 SF6 / SO2 / CDA / CO2 0.57 < 0.5 n/a < 0.1 9/11/07 1500 - 1709 Novec™ 612 / CDA / CO2 n/a n/a < 2.0 < 0.1 9/11/07 1710 - 1730 Novec™ 612 / CDA / CO2 n/a n/a < 2.0 < 0.1 9/12/07 0915 - 1140 Novec™ 612 / CDA / CO2 n/a n/a < 2.0 < 0.1 9/12/07 1420 - 1620 Novec™ 612 / CDA / CO2 n/a n/a < 2.0 < 0.1 9/13/07 1340 - 1540 SO2 / CDA n/a < 0.5 n/a < 0.1 9/14/07 0740 - 1000 SO2 / CDA n/a < 0.5 n/a < 0.1 Compounds listed with values as < X were not observed; their detection limits are reported as the value X. n/a – not applicable
6 OSHA Permissible Exposure Limits (PELs), http://www.osha.gov
4. Cover Gas Destruction
Throughout each casting run listed in Table 1-1, the primary cover gas components and byproducts were quantified simultaneously at both the casting hood hot zone and the cold zone (see Figure 2-1). Roughly half of each monitoring period was spent sampling the upstream ports; the other half was spent at the downstream ports. On some occasions, it was possible to monitor at these sampling ports while the ingot casting conveyor was moving and still heated but with no magnesium being poured: this was known as a “noncasting condition”. In addition, on some occasions it was possible to sample the cover gas composition at the outlet of the gas blending manifold before injection into the casting hood. This was known as a “direct” cover gas mixture measurement. Average concentrations over the sampling periods were then used to calculate cover gas destruction percentages via the following approach:
Consider the injection cover gas concentration (after factoring in ambient air dilution) versus the cover gas concentrations at the sampled locations. Calculate the destruction factor (DF) as a percentage using
DFDP
= × − ×−⎛
⎝⎜⎞⎠⎟
⎡
⎣
⎢⎢⎢⎢
⎤
⎦
⎥⎥⎥⎥
100 1 1
1100
sample cover gas conc.(ppm)direct cover gas conc.(ppm)
where DP is the dilution percentage, which is determined experimentally by krypton tracer or argon intrusion and casting vs. noncasting monitoring, as reported in Section 4.1.
The concentration and DF results for each cover gas mixture are reported in section 4.2. 4.1. Determining Dilution
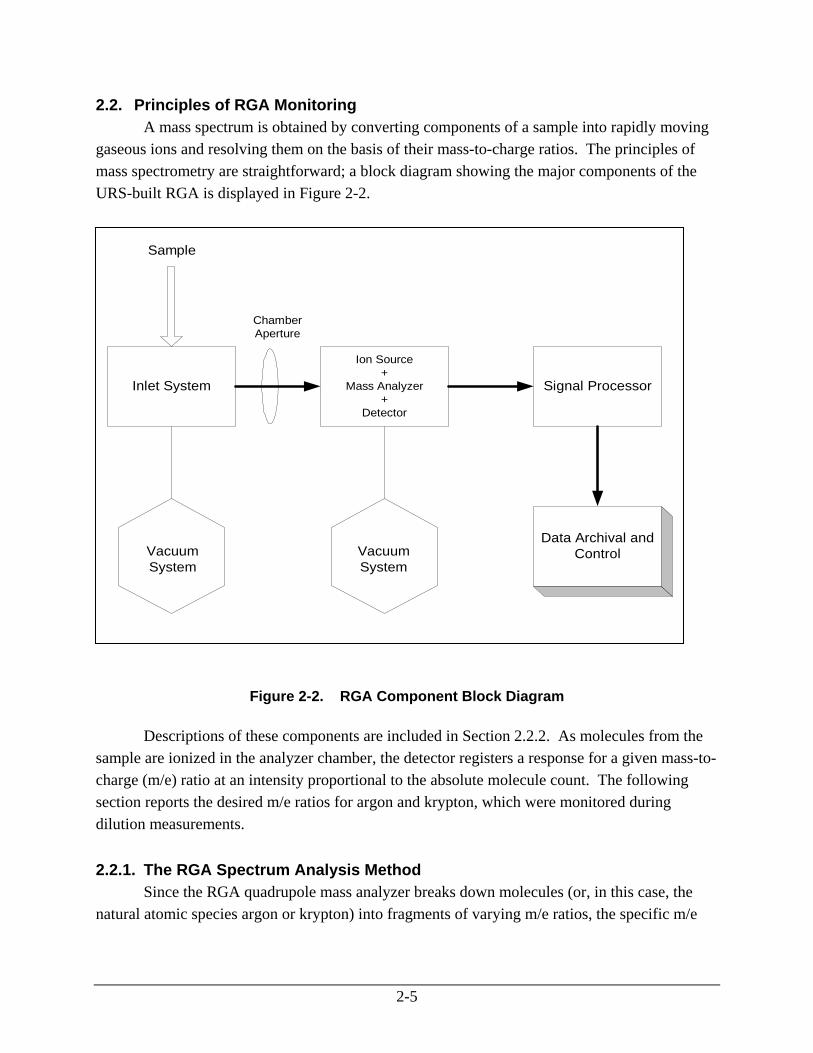
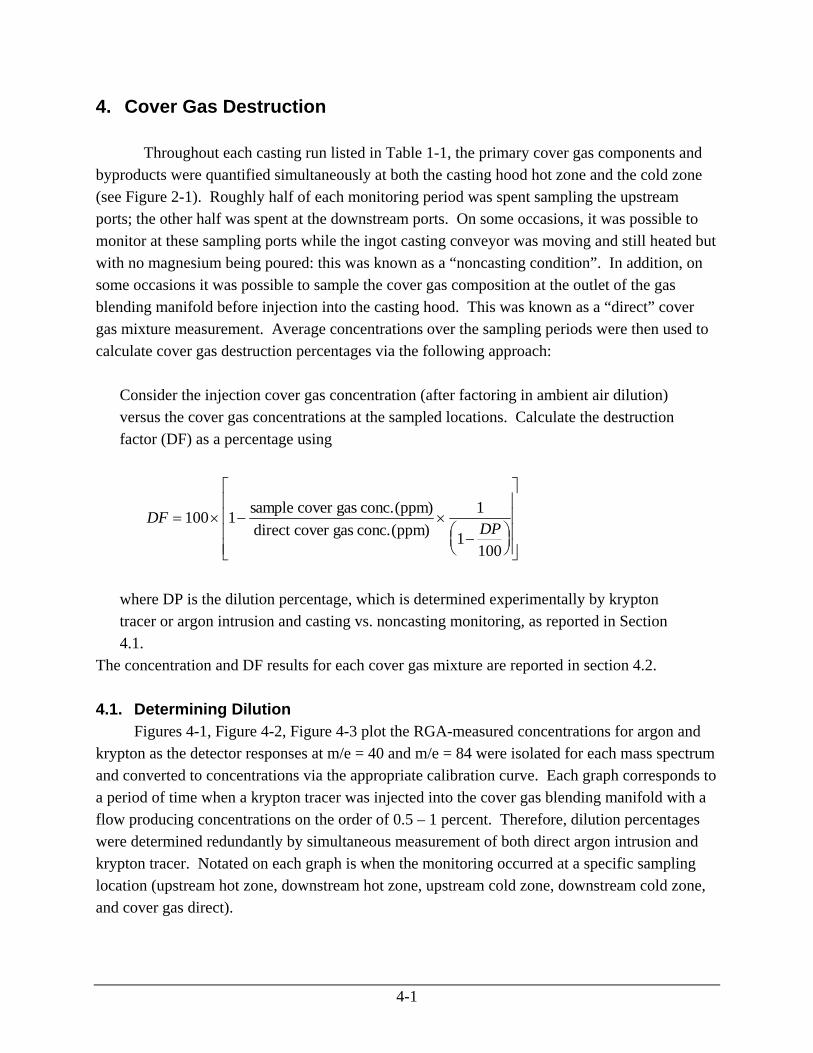
Figures 4-1, Figure 4-2, Figure 4-3 plot the RGA-measured concentrations for argon and krypton as the detector responses at m/e = 40 and m/e = 84 were isolated for each mass spectrum and converted to concentrations via the appropriate calibration curve. Each graph corresponds to a period of time when a krypton tracer was injected into the cover gas blending manifold with a flow producing concentrations on the order of 0.5 – 1 percent. Therefore, dilution percentages were determined redundantly by simultaneous measurement of both direct argon intrusion and krypton tracer. Notated on each graph is when the monitoring occurred at a specific sampling location (upstream hot zone, downstream hot zone, upstream cold zone, downstream cold zone, and cover gas direct).
4-1

0 1000 2000 3000 4000 5000 6000 7000 8000 9000 100000.0
0.2
0.4
0.6
0.8
1.0
1.2
upstream cold zone location:Dilution by direct Ar = 95%Dilution by Kr tracer = 98%
upstream hot zone location:Dilution by direct Ar = 83%Dilution by Kr tracer = 86%
Kr tracer on
Sampling of direct cover gas mix
[SF6 / SO2 mix as cover gas; 9/11/07]RGA Dilution Determination: Kr Tracer and Direct Ar Monitoring
% Ar % Kr
Ar/
Kr C
onc
(%)
Time elapsed (sec)
Figure 4-1. RGA Dilution Measurements, 11 September 2007
4-2
0 2000 4000 6000 8000 100000.0
0.2
0.4
0.6
0.8
1.0
1.2
upstream hot zone location:Dilution by direct Ar = 94%Dilution by Kr tracer = 91%
upstream cold zone location:Dilution by direct Ar = 98%Dilution by Kr tracer = 97%
upstream hot zone location:Dilution by direct Ar = 87%Dilution by Kr tracer = 91%
downstream hot zone location:Dilution by direct Ar = 90%Dilution by Kr tracer = 96%
Sampling of direct cover gas mix
[Novec mix as cover gas; 9/12/07]
RGA Dilution Determination: Kr Tracer and Direct Ar Monitoring
% Ar % Kr
Ar/K
r Con
c (%
)
Time elapsed (sec)
Figure 4-2. RGA Dilution Measurements, 12 September 2007
4-3

0 2000 4000 6000 8000 100000.0
0.2
0.4
0.6
0.8
1.0
1.2
downstream hot zone location:Dilution by direct Ar = 99%Dilution by Kr tracer = 96%
downstream cold zone location:Dilution by direct Ar = 98%Dilution by Kr tracer = 97%
upstream cold zone location:Dilution by direct Ar = 97%Dilution by Kr tracer = 96%
upstream hot zone location:Dilution by direct Ar = 95%Dilution by Kr tracer = 91%
Sampling of direct cover gas mix
[SF6 / SO2 mix as cover gas; 9/13/07]RGA Dilution Determination: Kr Tracer and Direct Ar Monitoring
% Ar % Kr
Ar/K
r Con
c (%
)
Time elapsed (sec)
Figure 4-3. RGA Dilution Measurements, 13 September 2007
DP calculations were carried out accordingly.
• For krypton tracer,
DP = × −⎡
⎣⎢
⎤
⎦⎥100 1 sample krypton (%)
direct krypton in cover gas mixture (%).
• For argon intrusion, the calculations were more complex because the levels of argon
native in the ambient air7 and already present in the cover gas mixture from blended CDA must be considered. The equation below should be solved for DP.
( )⎥⎦
⎤⎢⎣
⎡⎟⎠⎞
⎜⎝⎛ −+= (%)covarg
1001)%9332.0,(arg
100(%)arg 7 gaserfromdirectonxDPairambientinonxDPonsample .
4-4 7 S. Y. Park, et al., Metrologia 41, 387-395 (2004)

The DP values at each location are reported in Table 4-1 along with their measurement uncertainties. Uncertainties were derived based on the measurement standard deviations across each monitoring period, which was assumed to take into account intermediate sampling errors and analytical measurement variability since the casting process was run in a steady state. There may also be inherent sampling variability due to ingot mold movement through the casting hood and interactions with flows from cover gas nozzles. The standard deviations were propagated throughout the DP calculation to produce the absolute measurement uncertainties listed in Table 4-1. The differences between DP values determined by krypton tracer and those determined by argon intrusion were similar to measurement uncertainties.
Table 4-1. Dilution Percentages (DP) Calculated by Kr Tracer and Direct Ar Monitoring
Calculation Method Date hu DP
(percent) cu DP
(percent)hd DP
(percent) cd DP
(percent)
9/11/2007 86%(13) 98%(20)
9/12/2007 91%(16); 91%(17) 97%(21) 96%(24) Kr Tracer
9/13/2007 91%(17) 96%(21) 96%(23) 97%(25)
9/11/2007 83%(16) 95%(18)
9/12/2007 87%(21); 94%(23) 98%(25) 90%(23) Direct Ar
9/13/2007 95%(20) 97%(20) 99%(22) 98%(23) Parenthetical values represent (±) one absolute standard deviation.
Dilution percentages were also calculated using the concentrations measured directly at the cover gas mixing point and the concentrations measured during noncasting conditions. DP values calculated by this method are presented in Table 4-2 and used the following equation:
⎥⎦
⎤⎢⎣
⎡−=
)(.)(.100
ppmvconcgasfeeddirectppmvconcgasfeednoncastingDP .
Dilution estimates obtained using the direct and noncasting approach were used as the
primary factor for estimating dilution. For tests where this approach was not available due to a lack of data, an average DP was created for each sampling point using the noncasting and Kr tracer results. It should be noted that the results across the different dilution estimation approaches are relatively consistent.
4-5
4-6
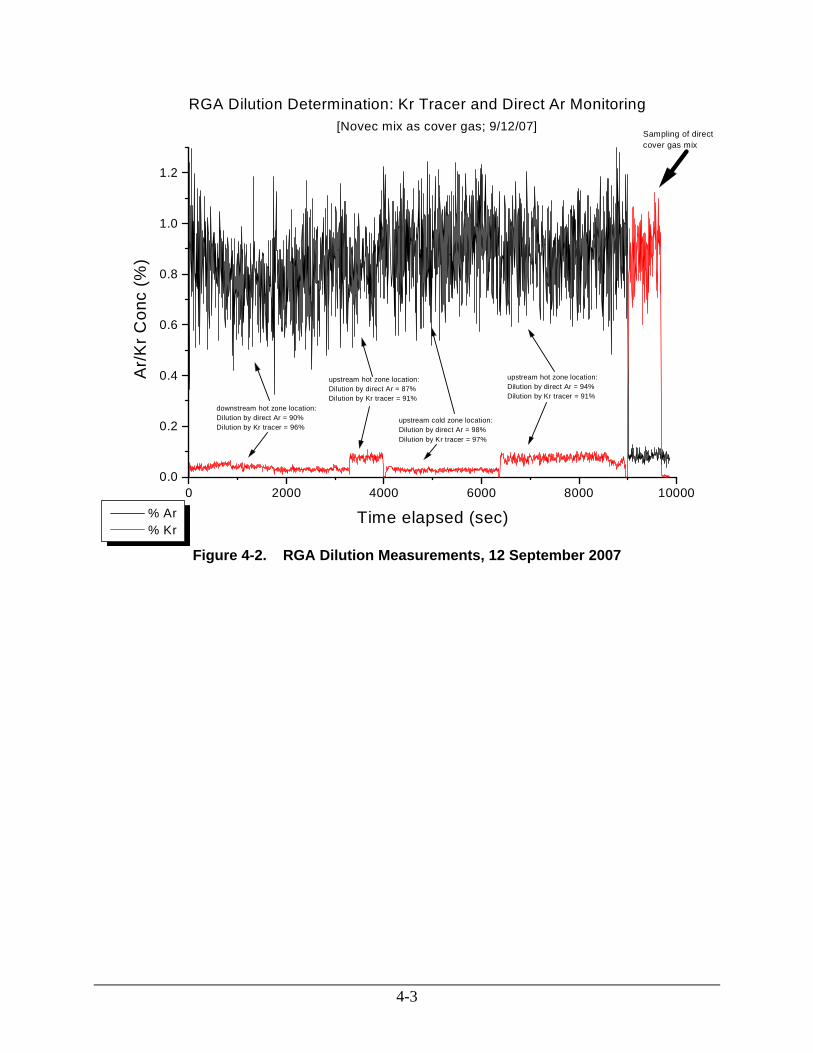
Table 4-2. Dilution Percentages (DP) Calculated from Noncasting and Direct Concentrations
Test hu
(percent) cu
(percent) hd
(percent) cd
(percent) 1 86%(1) 94%(1) - - 2 83%(1) 94%(1) - - 3 - - - - 4 89%(1) 96%(1) - - 5 - - 97%(1) 98%(1) 6 - - - - 7 92%(1) 86%(1) - - 8 - - - - 9 - - - -
“-“ Indicates that either noncasting or direct concentration values are missing for that specific test and sample point. Parenthetical values represent (±) one absolute standard deviation.
4.2. Determining Cover Gas Destruction
Table 4-3 presents the cover gas flow rate, delivery concentration, FTIR measured concentration, dilution factor, and calculated DF value for each available sampling site for each cover gas test. A noncasting run was not possible for one of the Novec™ 612 mixtures runs on 12 September 2007. For SO2, a noncasting run was not conducted because of logistical reasons. A direct sample of the SO2 cover gas composition was also not possible from the temporary setup used during processing, so the direct SO2 concentrations were estimated by calculation from the mass flow controller settings on the gas blending system. Average DF values for the SF6, Novec™ 612, and SO2 cover gas mixtures were 5 percent, 9 percent, and 39 percent, respectively.
Determining DF values involved several experimental measurements to derive concentrations and DP values. Each experimental measurement was subject to indeterminate uncertainty and contributed to the indeterminate error of the final results. The errors were propagated from measurements to final results by common rules that were derived from the total differentiation (by sum of all partials) of the DF equations discussed at the beginning of Section 4.8 As will be discussed in Section 5, the DF values determined by dilution considerations carry significant uncertainties because the DP values are rather large and contain significant variance. This variance resulted in the generation of negative destruction values in some cases because the destruction is very low and approaching zero. For the sake of clarity, the negative destruction values are withheld from this report. The average destruction values presented are therefore only based on the positive results calculated using this methodology.
8 D. Skoog, Principles of Instrumental Analysis, 3rd Ed., CBS College Publishing, 1985

4-7
Table 4-3. Percent Destruction for Cover Gas Testing
Test # (site)
Cover Gas Mixture Components
Flowa (lpm)
Cover Gas Delivery
Conc. (ppmv)
Cover Gas
Measured Conc.
(ppmv)
Dilution Percentagec
(percent)
Estimated Cover Gas Destruction
Factor (percent)
1hu SF6/SO2/CDA/CO2 270 10,675 1,407 86% 4% 1cu SF6/SO2/CDA/CO2 135 10,675 572 94% 8% 2hu SF6/SO2/CDA/CO2 198 7,554 1,251 83% 3% 2cu SF6/SO2/CDA/CO2 99 7,554 456 94% 7% 3hu SF6/SO2/CDA/CO2 270 8,463 1,232 89% ≈0% 3cu SF6/SO2/CDA/CO2 135 8,463 640 94% ≈0% 3hd SF6/SO2/CDA/CO2 270 8,463 424 96% ≈0% 3cd SF6/SO2/CDA/CO2 135 8,463 333 98% ≈0% 4hu Novec™ 612/CDA/CO2 189 2,000 219 89% ≈0% 4cu Novec™ 612/CDA/CO2 95 2,000 77 96% ≈0% 5hd Novec™ 612/CDA/CO2 189 1,500 47 97% ≈0% 5cd Novec™ 612/CDA/CO2 95 1,500 27 98% 10% 6hu Novec™ 612/CDA/CO2 191 1,102 96 89% 23% 6cu Novec™ 612/CDA/CO2 96 1,102 161 94% ≈0% 6hd Novec™ 612/CDA/CO2 191 1,102 37 96% 4% 6cd Novec™ 612/CDA/CO2 96 1,102 74 98% ≈0% 7hu Novec™ 612/CDA/CO2 189 1,663 131 92% ≈0% 7cu Novec™ 612/CDA/CO2 95 1,663 228 86% 5% 8hd SO2/CDA 191 10,000 277 96% 22% 8cd SO2/CDA 95 10,000 128 98% 49% 9hu SO2/CDA 191 12,000 946 89% 30% 9cu SO2/CDA 96 12,000 296 94% 56%
a Approximate, estimated by reading flow rates on gas delivery manifold rotameters (uncalibrated). 2/3 of flow went to the hot zone and 1/3 to the cold zone. c The dilution factor presented here comes from the noncasting/direct DP calculation for each specific test. When this value was unavailable, the averaged value of all DP values (except those determined by the Direct Ar method) for the designated sampling point was used and is presented in italics.

5-1
5. Discussion
5.1. Cover Gas Test Observations Compared to the die casting crucibles previously studied, the design of typical
magnesium ingot casting hoods suggested that the cover gas destruction would be low and difficult to estimate due to increased ambient air dilution and variability. This assumption was made due to the four leading factors listed below.
1. The overall surface area of molten magnesium to be covered in an ingot caster is smaller than typical die casting crucibles. Assuming that about six ingot molds containing molten metal are within the hot zone at the same time, and given that each mold has a surface area of about 800 cm2, the total surface area of the covered molds is about 4,800 cm2. A 1.2 meter diameter die casting crucible has a surface area of about 12,000 cm2. A smaller covered surface area means that less of the cover gas concentrations are being consumed on a percentage basis than with a larger covered surface area.
2. The freshly poured ingots within the hot zone begin cooling immediately after injection of molten magnesium. Alloying crucibles and holding furnaces must keep the metal in a liquid state throughout processing. This implies that less cover gas will interact and break down at the ingot surface as it cools, leading to lower destruction rates.
3. The casting hood volumes are greatly affected by ambient air dilution. Excessive dilution makes differential measurements difficult to carry out because the amount of dilution must be precisely and consistently characterized.
4. The casting hood volumes are quite large and the ingot protection atmosphere is very turbulent due to high cover gas flow rates and movement of the ingot molds. These characteristics create difficulties for continuous real-time extraction of representative gas samples, which makes analytical measurement precision challenging and greatly influences destruction calculations.
These factors were born-out in the actual measurement results. Several reasonable
estimations and observable trends can be gleaned from the results reported in Section 4. These observations would include the following:
• Destruction was generally low under all cases, with the exception of SO2, which exhibited the highest destruction percentages (39 percent).
• The casting-versus-noncasting destruction determinations carry significantly lower measurement uncertainties and better reproducibility at each sampling location than do the destruction values determined by dilution, where some test cases yielded unrealistic negative values.

5-2
• As expected, the most consistently reliable destruction percentages for both measurement methods were calculated at the upstream hot zone sampling location.
For measurements during ingot casting, this study yields the following primary
recommendations for future research: (1) maximize the representativeness of concentration analysis by setting up as many sampling points as possible for simultaneous gas extraction from the casting hood, and then (2) characterize ambient air dilution effects by basing the destruction calculations upon casting-versus-noncasting conditions. The extent to which (1) can be applied is highly dependent upon logistical and process concerns. For this study it was not feasible to set up more than two sampling ports per casting hood zone without interfering with process activities such as metal pouring, ingot skimming, and conveyor belt operation. An additional recommendation is to account for air turbulence effects during monitoring periods. For example, extend casting and noncasting events over longer continuous blocks of time to help smooth out the averaging and subsequent comparison of concentrations during the casting-versus-noncasting conditions.
One benefit of the low destruction values and excessive air dilution is that the concentrations of cover gas byproducts were often negligible within the casting hood and, by extension, also within the operator room environment. The tables in Section 3 indicate that the only measurable byproduct was HF and its average concentrations were almost always under 1 ppmv. As expected, Novec™ 612 usually produced slightly more HF than SF6/SO2, but no other fluorinated species (including PFIB) were detected.
This study also indicates that there is significant uncertainty regarding the exact mixture
of cover gas being applied using the current rotameter-based control system. Measured cover gas mixture concentrations for SF6 and SO2 from direct FTIR sampling at the manifold were significantly higher than what was expected based on rotameter readings that controlled the mixture. Monitoring of the cover gas system currently utilized at the facility indicates that there may be significant over-protection occurring and that optimization to minimize cover gas usage would be achievable if the current rotameter-based control system was replaced.
It should also be noted that the SF6/SO2 cover gas system is unique in that there are two
reactive cover gas constituents present. The exact nature of how this impacts the destruction of SF6 is unclear. It is possible that a SF6-only cover gas system used in this application would produce different results for destruction and byproduct formation.

5-3
5.2. Climate Change Potential Discussion One of the benefits of using Novec™ 612 and SO2 as cover gases for magnesium melt protection is their contribution to global climate change is significantly lower when compared to SF6. This is evident when comparing their estimated global warming potentials (GWPs). Table 5-1 presents GWPs of several compounds detected during this study.
Table 5-1. Comparison of 100-Year GWP Estimates from the
Intergovernmental Panel on Climate Change (IPCC) Fourth (2007) Assessment Report
Gas IPCC GWP Methane 25
Nitrous Oxide 298 Sulfur Hexafluoride (SF6) 22,800
IPCC (2007), Climate Change 2007: The Scientific of Climate Change. Intergovernmental Panel on Climate Change, Cambridge University Press. Cambridge, U.K.
The ingot casting area contains a variety of compounds, but only those with
corresponding GWP values were used in estimating the overall GWP impact of switching to alternate cover gases. This calculation consisted of multiplying the average concentrations (parts per million by volume) for each of the component cover gases and applicable destruction products, by their respective GWP factors (obtained from the Second Assessment Report of the Intergovernmental Panel on Climate Change) to obtain a GWP-weighted value. The summation of all the GWP-weighted values for a particular cover gas resulted in the normalized CO2 equivalent, which was compared to the CO2 equivalent corresponding to SF6.9
Table 5-2 shows that when comparing the normalized CO2 equivalent, or composite GWP, the alternate cover gases have a much lower impact. An obvious source for this reduction can be found in the incredibly high GWP of SF6 shown in Table 5-1. Novec™ 612’s GWP has not been supplied by the IPCC, but is likely to be extremely low (i.e., Novec™ 612 is a fluorinated ketone, which is assumed to have an atmospheric lifetime of approximately 5 days and a GWP on the order of 1).10 SO2 is not an IR absorber and therefore has no global warming potential. Compared to using SF6, switching to Novec™ 612 produces a reduction in overall global warming impact of at least 99.7 percent.11 Changing the cover gas from SF6 to SO2 reduces the global warming impact by at least 99.9 percent but introduces a more complex operational scenario due to toxicity concerns.
The above comparison does not include the specific flow rates for each cover gas. In order to provide a more comprehensive analysis of composite GWP, an additional comparison was conducted. Using the ideal gas law, the molecular weights of each gas and the delivery flow 9 Fugitive SF6 and CH4 concentrations were excluded from the overall GWP calculations for the cover gases. 10 D’Anna B, Sellevag S.R., Wirtz K., and Nielsen C.J. Photolysis Study of Perfluoro-2-methyl-3-pentanone Under Natural Sunlight Conditions Environ Sci and Tech 2005 39(22) 8708-8711
5-4
rate of the cover gas was used to estimate the composite emission rate in grams per hour (g/hr). This equation can be described as follows:
( )610/6.38min60×÷×××=⎟
⎠⎞
⎜⎝⎛ moleliters
hourlpmMWppmv
hourgramsRateEmission
ppm = measured average concentration in parts per million MW = molecular weight in grams per mole lpm = gas flow in liters per minute These values were summed to provide a composite GWP value that was weighted by the
cover gas flow rate. The average flow weighted GWP values were then compared against the corresponding values for the SF6/SO2 system. Based on this approach, both of the cover gas alternatives were observed to reduce GHG emissions by at least 99.9 percent relative to SF6/SO2 system. This result is also bourn out when comparing individual tests, such as Test 3 and 6; averaging the results for the four monitoring points in each test results in a reduction in GHG emissions of more than 99.9 percent. Details of the flow-weighted GHG emission impacts are presented in Table 5-3. 5.3. Uncertainty Discussion
The results of this measurement study should not be interpreted to represent an absolute analysis of GHG emissions associated with Novec™ 612, SO2, and SF6 cover gas usage. While this study does present a relatively accurate measurement analysis and approximate comparison of GHG emissions, there are several areas of uncertainty inherent with this methodology. These areas of uncertainty include FTIR and RGA error, error associated with blending gases, dilution correction, and analytical and operational variation of the ingot casting machine evaluated. The high levels of dilution – on the order of 90 percent – results in significant uncertainty associated with destruction estimates.
Measurements taken by the FTIR and RGA are subject to variability inherent with highly complex analytical equipment. While all prudent steps were taken during the measurement study to minimize this contributor to uncertainty (see Section 2 and Appendix A), a small degree of error is unavoidable.
11 Please refer to Section 5-3 for a discussion regarding the uncertainty associated with this methodology.
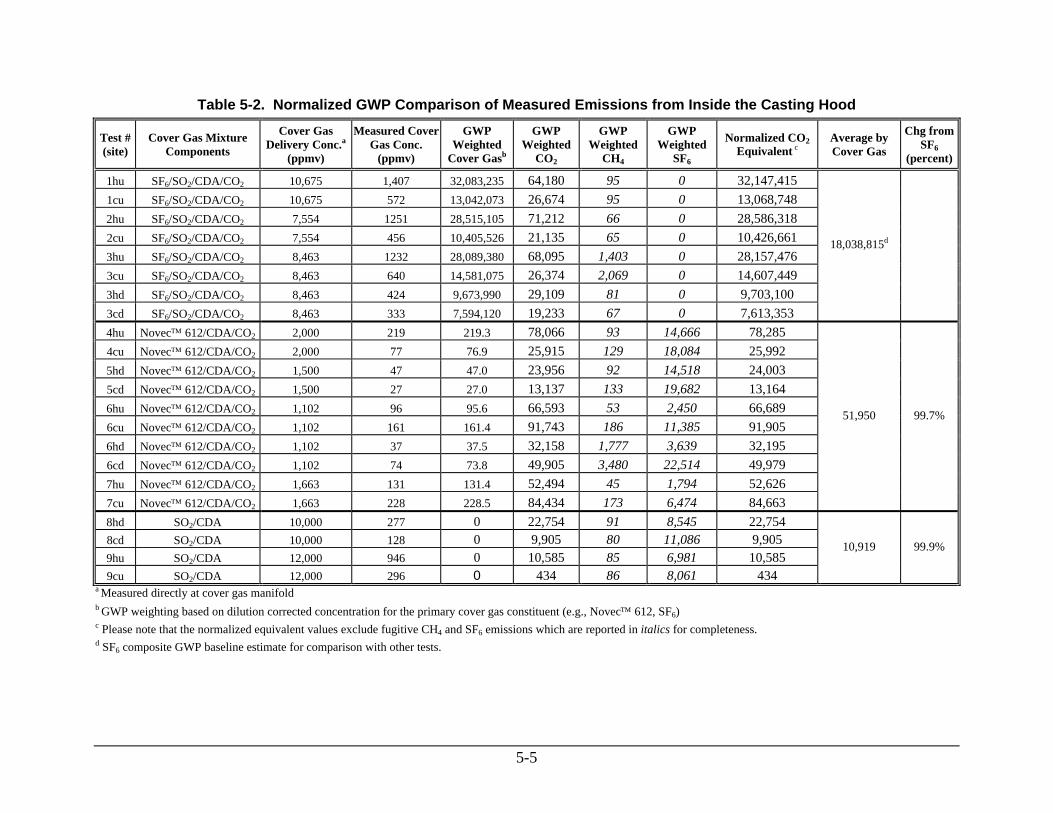
Table 5-2. Normalized GWP Comparison of Measured Emissions from Inside the Casting Hood
Test # (site)
Cover Gas Mixture Components
Cover Gas Delivery Conc.a
(ppmv)
Measured Cover Gas Conc.
(ppmv)
GWP Weighted
Cover Gasb
GWP Weighted
CO2
GWP Weighted
CH4
GWP Weighted
SF6
Normalized CO2 Equivalent c
Average by Cover Gas
Chg from SF6
(percent)
1hu SF6/SO2/CDA/CO2 10,675 1,407 32,083,235 64,180 95 0 32,147,415 1cu SF6/SO2/CDA/CO2 10,675 572 13,042,073 26,674 95 0 13,068,748 2hu SF6/SO2/CDA/CO2 7,554 1251 28,515,105 71,212 66 0 28,586,318 2cu SF6/SO2/CDA/CO2 7,554 456 10,405,526 21,135 65 0 10,426,661 3hu SF6/SO2/CDA/CO2 8,463 1232 28,089,380 68,095 1,403 0 28,157,476 3cu SF6/SO2/CDA/CO2 8,463 640 14,581,075 26,374 2,069 0 14,607,449 3hd SF6/SO2/CDA/CO2 8,463 424 9,673,990 29,109 81 0 9,703,100 3cd SF6/SO2/CDA/CO2 8,463 333 7,594,120 19,233 67 0 7,613,353
18,038,815d
4hu Novec™ 612/CDA/CO2 2,000 219 219.3 78,066 93 14,666 78,285 4cu Novec™ 612/CDA/CO2 2,000 77 76.9 25,915 129 18,084 25,992 5hd Novec™ 612/CDA/CO2 1,500 47 47.0 23,956 92 14,518 24,003 5cd Novec™ 612/CDA/CO2 1,500 27 27.0 13,137 133 19,682 13,164 6hu Novec™ 612/CDA/CO2 1,102 96 95.6 66,593 53 2,450 66,689 6cu Novec™ 612/CDA/CO2 1,102 161 161.4 91,743 186 11,385 91,905 6hd Novec™ 612/CDA/CO2 1,102 37 37.5 32,158 1,777 3,639 32,195 6cd Novec™ 612/CDA/CO2 1,102 74 73.8 49,905 3,480 22,514 49,979 7hu Novec™ 612/CDA/CO2 1,663 131 131.4 52,494 45 1,794 52,626 7cu Novec™ 612/CDA/CO2 1,663 228 228.5 84,434 173 6,474 84,663
51,950 99.7%
8hd SO2/CDA 10,000 277 0 22,754 91 8,545 22,754 8cd SO2/CDA 10,000 128 0 9,905 80 11,086 9,905 9hu SO2/CDA 12,000 946 0 10,585 85 6,981 10,585 9cu SO2/CDA 12,000 296 0 434 86 8,061 434
10,919 99.9%
a Measured directly at cover gas manifold b GWP weighting based on dilution corrected concentration for the primary cover gas constituent (e.g., Novec™ 612, SF6) c Please note that the normalized equivalent values exclude fugitive CH4 and SF6 emissions which are reported in italics for completeness. d SF6 composite GWP baseline estimate for comparison with other tests.
5-5

Table 5-3. GWP (Weighted by Cover Gas Flow) Comparison of Measured Emissions from Inside the Casting Hood
Test # (site)
Cover Gas Mixture Components
Cover Gas Delivery Conc.a (ppmv)
GWP Weighted Cover Gasb
(g/hr)
GWP Weighted CO2
(g/hr)
GWP Weighted CH4
(g/hr)
GWP Weighted SF6
(g/hr)
Normalized CO2 GWP Equivalent c
(g/hr)
Average by Cover Gas
(g/hr)
Chg from SF6 (percent)
1hu SF6/SO2/CDA/CO2 10,675 1,966,281 1,185 1 0 1,967,466 1cu SF6/SO2/CDA/CO2 10,675 399,654 246 0 0 399,900 2hu SF6/SO2/CDA/CO2 7,554 1,280,759 964 0 0 1,281,723 2cu SF6/SO2/CDA/CO2 7,554 233,683 143 0 0 233,826 3hu SF6/SO2/CDA/CO2 8,463 1,722,714 1,259 9 0 1,723,972 3cu SF6/SO2/CDA/CO2 8,463 447,127 244 7 0 447,370 3hd SF6/SO2/CDA/CO2 8,463 593,303 538 1 0 593,841 3cd SF6/SO2/CDA/CO2 8,463 232,873 178 0 0 233,050
860,144d
4hu Novec™ 612/CDA/CO2 2,000 20 1,010 0 629 1,030 4cu Novec™ 612/CDA/CO2 2,000 4 168 0 388 171 5hd Novec™ 612/CDA/CO2 1,500 4 310 0 623 314 5cd Novec™ 612/CDA/CO2 1,500 1 85 0 422 86 6hu Novec™ 612/CDA/CO2 1,102 9 871 0 106 880 6cu Novec™ 612/CDA/CO2 1,102 8 600 0 247 607 6hd Novec™ 612/CDA/CO2 1,102 4 421 8 158 424 6cd Novec™ 612/CDA/CO2 1,102 3 326 8 488 330 7hu Novec™ 612/CDA/CO2 1,663 12 679 0 77 691 7cu Novec™ 612/CDA/CO2 1,663 11 546 0 139 557
480 99.9%
8hd SO2/CDA 10,000 0 297 0 370 297 8cd SO2/CDA 10,000 0 65 0 240 65 9hu SO2/CDA 12,000 0 138 0 303 138 9cu SO2/CDA 12,000 0 3 0 175 3
126 99.9%
a Measured directly at cover gas manifold b GWP weighting based on dilution corrected concentration for the primary cover gas constituent (e.g., Novec™ 612, SF6) c Please note that the normalized equivalent values exclude fugitive CH4 and SF6 emissions which are reported in italics for completeness. d SF6 composite GWP baseline estimate for comparison with other tests.
5-6
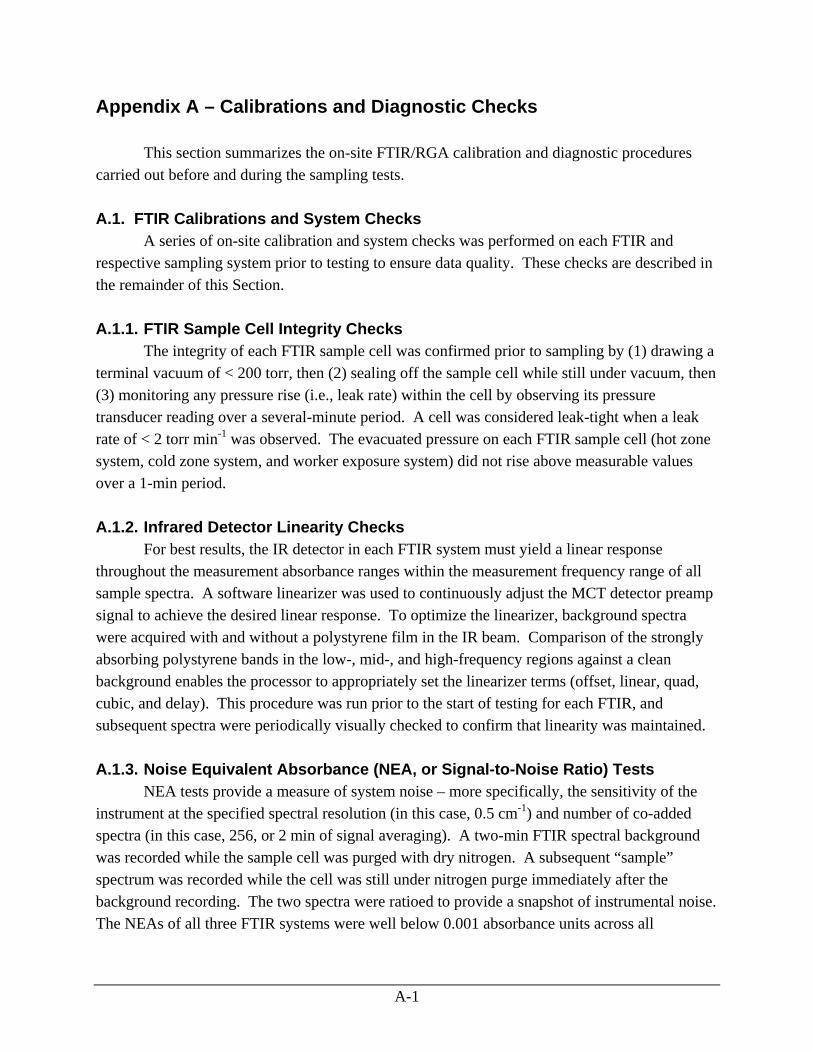
Appendix A – Calibrations and Diagnostic Checks
This section summarizes the on-site FTIR/RGA calibration and diagnostic procedures carried out before and during the sampling tests. A.1. FTIR Calibrations and System Checks
A series of on-site calibration and system checks was performed on each FTIR and respective sampling system prior to testing to ensure data quality. These checks are described in the remainder of this Section.
A.1.1. FTIR Sample Cell Integrity Checks
The integrity of each FTIR sample cell was confirmed prior to sampling by (1) drawing a terminal vacuum of < 200 torr, then (2) sealing off the sample cell while still under vacuum, then (3) monitoring any pressure rise (i.e., leak rate) within the cell by observing its pressure transducer reading over a several-minute period. A cell was considered leak-tight when a leak rate of < 2 torr min-1 was observed. The evacuated pressure on each FTIR sample cell (hot zone system, cold zone system, and worker exposure system) did not rise above measurable values over a 1-min period. A.1.2. Infrared Detector Linearity Checks For best results, the IR detector in each FTIR system must yield a linear response throughout the measurement absorbance ranges within the measurement frequency range of all sample spectra. A software linearizer was used to continuously adjust the MCT detector preamp signal to achieve the desired linear response. To optimize the linearizer, background spectra were acquired with and without a polystyrene film in the IR beam. Comparison of the strongly absorbing polystyrene bands in the low-, mid-, and high-frequency regions against a clean background enables the processor to appropriately set the linearizer terms (offset, linear, quad, cubic, and delay). This procedure was run prior to the start of testing for each FTIR, and subsequent spectra were periodically visually checked to confirm that linearity was maintained. A.1.3. Noise Equivalent Absorbance (NEA, or Signal-to-Noise Ratio) Tests NEA tests provide a measure of system noise – more specifically, the sensitivity of the instrument at the specified spectral resolution (in this case, 0.5 cm-1) and number of co-added spectra (in this case, 256, or 2 min of signal averaging). A two-min FTIR spectral background was recorded while the sample cell was purged with dry nitrogen. A subsequent “sample” spectrum was recorded while the cell was still under nitrogen purge immediately after the background recording. The two spectra were ratioed to provide a snapshot of instrumental noise. The NEAs of all three FTIR systems were well below 0.001 absorbance units across all
A-1
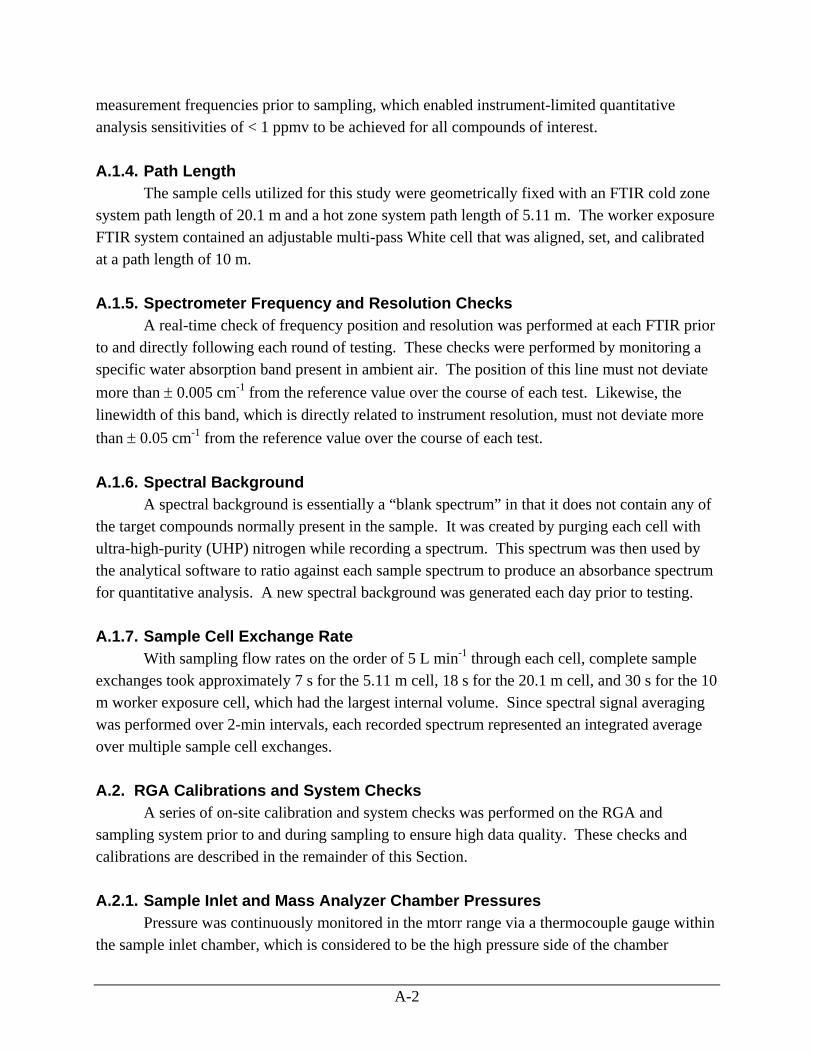
measurement frequencies prior to sampling, which enabled instrument-limited quantitative analysis sensitivities of < 1 ppmv to be achieved for all compounds of interest. A.1.4. Path Length The sample cells utilized for this study were geometrically fixed with an FTIR cold zone system path length of 20.1 m and a hot zone system path length of 5.11 m. The worker exposure FTIR system contained an adjustable multi-pass White cell that was aligned, set, and calibrated at a path length of 10 m. A.1.5. Spectrometer Frequency and Resolution Checks A real-time check of frequency position and resolution was performed at each FTIR prior to and directly following each round of testing. These checks were performed by monitoring a specific water absorption band present in ambient air. The position of this line must not deviate more than ± 0.005 cm-1 from the reference value over the course of each test. Likewise, the linewidth of this band, which is directly related to instrument resolution, must not deviate more than ± 0.05 cm-1 from the reference value over the course of each test.
A.1.6. Spectral Background A spectral background is essentially a “blank spectrum” in that it does not contain any of the target compounds normally present in the sample. It was created by purging each cell with ultra-high-purity (UHP) nitrogen while recording a spectrum. This spectrum was then used by the analytical software to ratio against each sample spectrum to produce an absorbance spectrum for quantitative analysis. A new spectral background was generated each day prior to testing. A.1.7. Sample Cell Exchange Rate With sampling flow rates on the order of 5 L min-1 through each cell, complete sample exchanges took approximately 7 s for the 5.11 m cell, 18 s for the 20.1 m cell, and 30 s for the 10 m worker exposure cell, which had the largest internal volume. Since spectral signal averaging was performed over 2-min intervals, each recorded spectrum represented an integrated average over multiple sample cell exchanges. A.2. RGA Calibrations and System Checks
A series of on-site calibration and system checks was performed on the RGA and sampling system prior to and during sampling to ensure high data quality. These checks and calibrations are described in the remainder of this Section.
A.2.1. Sample Inlet and Mass Analyzer Chamber Pressures
Pressure was continuously monitored in the mtorr range via a thermocouple gauge within the sample inlet chamber, which is considered to be the high pressure side of the chamber
A-2
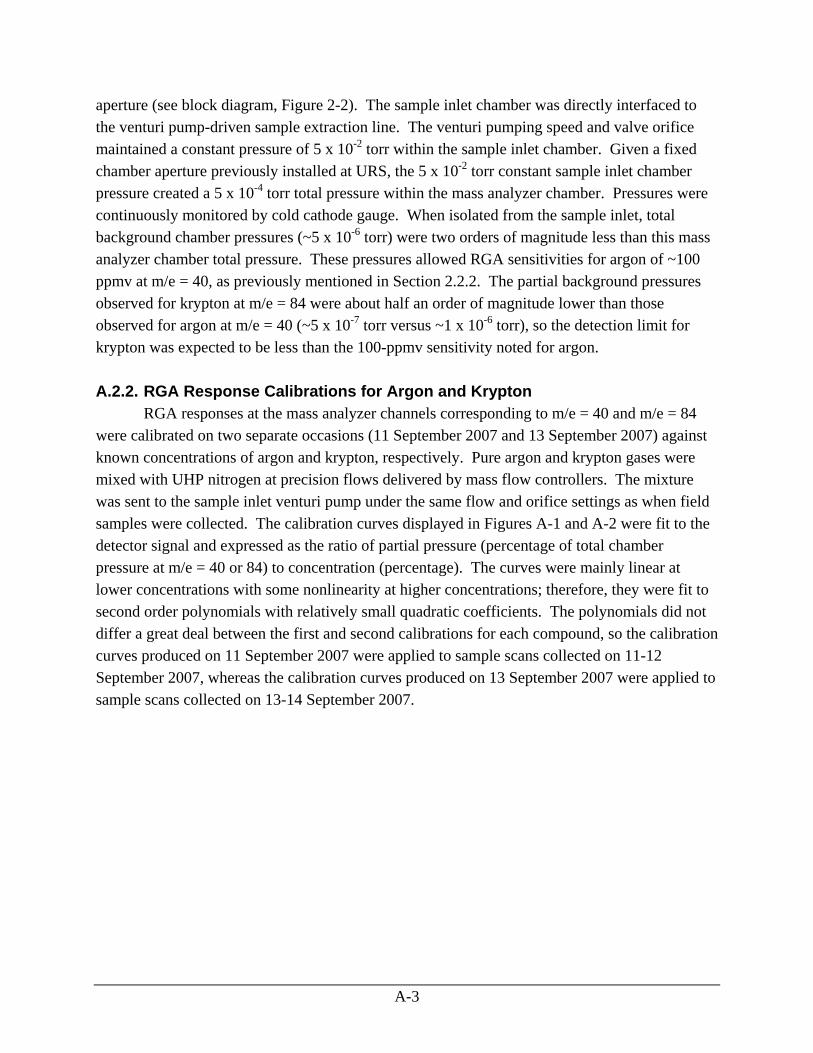
aperture (see block diagram, Figure 2-2). The sample inlet chamber was directly interfaced to the venturi pump-driven sample extraction line. The venturi pumping speed and valve orifice maintained a constant pressure of 5 x 10⁻² torr within the sample inlet chamber. Given a fixed chamber aperture previously installed at URS, the 5 x 10⁻² torr constant sample inlet chamber pressure created a 5 x 10⁻⁴ torr total pressure within the mass analyzer chamber. Pressures were continuously monitored by cold cathode gauge. When isolated from the sample inlet, total background chamber pressures (~5 x 10⁻⁶ torr) were two orders of magnitude less than this mass analyzer chamber total pressure. These pressures allowed RGA sensitivities for argon of ~100 ppmv at m/e = 40, as previously mentioned in Section 2.2.2. The partial background pressures observed for krypton at m/e = 84 were about half an order of magnitude lower than those observed for argon at m/e = 40 (~5 x 10⁻⁷ torr versus ~1 x 10⁻⁶ torr), so the detection limit for krypton was expected to be less than the 100-ppmv sensitivity noted for argon. A.2.2. RGA Response Calibrations for Argon and Krypton
RGA responses at the mass analyzer channels corresponding to m/e = 40 and m/e = 84 were calibrated on two separate occasions (11 September 2007 and 13 September 2007) against known concentrations of argon and krypton, respectively. Pure argon and krypton gases were mixed with UHP nitrogen at precision flows delivered by mass flow controllers. The mixture was sent to the sample inlet venturi pump under the same flow and orifice settings as when field samples were collected. The calibration curves displayed in Figures A-1 and A-2 were fit to the detector signal and expressed as the ratio of partial pressure (percentage of total chamber pressure at m/e = 40 or 84) to concentration (percentage). The curves were mainly linear at lower concentrations with some nonlinearity at higher concentrations; therefore, they were fit to second order polynomials with relatively small quadratic coefficients. The polynomials did not differ a great deal between the first and second calibrations for each compound, so the calibration curves produced on 11 September 2007 were applied to sample scans collected on 11-12 September 2007, whereas the calibration curves produced on 13 September 2007 were applied to sample scans collected on 13-14 September 2007.
A-3

0.0 0.5 1.0 1.5 2.0 2.5
0.0
0.2
0.4
0.6
0.8
1.0
9/11/07 Argon Calibration
Y =-0.03201+0.27458 X+0.07741 X2Cal
ibra
ted
Ar C
onc
(%)
RGA Detector Response (Pm/e=40 / PT*100)
0.0 0.5 1.0 1.5 2.0 2.5
0.0
0.2
0.4
0.6
0.8
1.0
RGA Detector Response (Pm/e=40 / PT*100)
Cal
ibra
ted
Ar C
onc
(%)
9/13/07 Argon Calibration
Y =-0.04764+0.23455 X+0.08031 X2
(a)
(b)
Figure A-1. Calibrated RGA Response for Argon
A-4
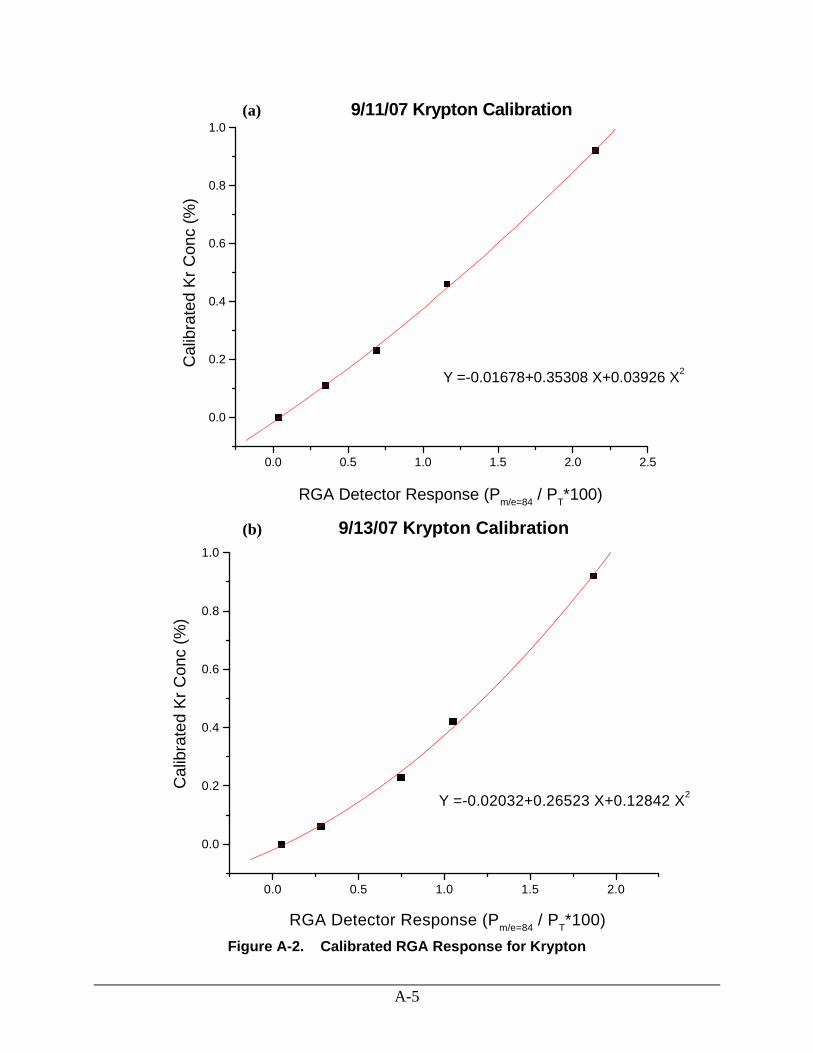
A-5
0.0 0.5 1.0 1.5 2.0 2.5
0.0
0.2
0.4
0.6
0.8
1.0
Y =-0.01678+0.35308 X+0.03926 X2
RGA Detector Response (Pm/e=84 / PT*100)
Cal
ibra
ted
Kr C
onc
(%)
9/11/07 Krypton Calibration
(a)
0.0 0.5 1.0 1.5 2.0
0.0
0.2
0.4
0.6
0.8
1.0
Y =-0.02032+0.26523 X+0.12842 X2
RGA Detector Response (Pm/e=84 / PT*100)
Cal
ibra
ted
Kr C
onc
(%)
9/13/07 Krypton Calibration
(b)
Figure A-2. Calibrated RGA Response for Krypton
Appendix B – Measurement Study Protocol
The analytical measurement and data interpretation approach described herein attempts to
determine, by empirical means, the most conservative cover gas destruction possible for a given
type of magnesium process tool and gas flow ranges used during production. This approach is
based on the experience from the MagReTech study and pertains to only those processes that can
allow typical operation and cover gas flow without molten metal in place, as well as normally
with molten metal. Therefore, ingot casting and chilling machines are prime candidates for this
approach, as opposed to alloying and die casting crucibles which are often kept under constant
high temperatures and filled with metal. The approach encompasses all the measurement
variance brought about by the process gas flows (including turbulence invoked by ambient air
dilution) in conjunction with analytical instrument and sampling variability. The variances
associated with each measurement condition needed in calculating the degradation factor are
then properly propagated through the calculations to the final result. The maximum destruction
factor is thus considered by adding the propagated variance to the final calculation result. If the
process under study is normally run over a range of cover gas concentrations, this measurement
approach is to be conducted at both the lowest concentration and highest concentration of that
range; the reportable maximum destruction factor is then the greater of the two.
The Test Plan outlines how the experimental observables and variances needed to
determine the maximum degradation factors are obtained. The Quantitative Data Analysis
section describes how the measurements are used to estimate destruction factors and how the
variances are propagated. A hypothetical example is provided to help illustrate the measurement
approach.
Test Plan
1. Set up a real-time measurement instrument to continuously extract and analyze a low
volume slipstream of the completely blended cover gas mixture prior to injection into the
melt protection area. The extractive analysis technique should not significantly impact
the overall gas flow within normal process operations, and allow enough consecutively
recorded measurements as to be statistically relevant. For instance, an extractive FTIR
system monitoring SF6 concentrations over one-minute of signal averaging will produce
240 data points within a four-hour continuous sampling period.
B-1

2. Set up a second real-time measurement instrument to continuously extract and analyze a
low volume stream of cover gas within the process environment (i.e., where molten
magnesium is to be covered during casting or chilling). The extractive analysis technique
at this sample location should not significantly impact the overall gas flow throughout the
process environment, should allow the most representative sampling configuration
possible (for instance, equidistant perforated sample probes that traverse the entire width
of process head space a few centimeters from the molten metal surfaces), and also allow
enough consecutively recorded measurements as to be statistically relevant. This
instrument will be sampling coincidentally with the instrument described in step #1, so
the implementation of two identical analysis techniques (for instance, two extractive
FTIR systems) is ideal.
3. With molten magnesium present during production: Simultaneously monitoring both
sampling locations over a sufficiently long time period will produce a mean concentration
during metal production at the point of cover gas injection, MPi, and a mean
concentration during metal production within the process environment, MPe. Also, the
99 percent confidence level of both means, which when expressing as +/- values about
the means would contain virtually all sources of indeterminate measurement error, can be
estimated as 2.58 times the standard deviations (divided by the square root of the number
of measurements) of their respective data sets. Hence, the experimentally determined
MPi / MPe would carry associated σMPi / σMP
e as total measurement uncertainties (the
squares of which being measurement variances) to be considered when calculating
degradation percentages.
4. With molten magnesium not present during mock production: Simultaneously monitoring
both sampling locations under the same configurations and over a similar length of time
as conducted in step #3 will produce, under nonmetal process conditions, an
experimentally determined NPi / NPe pair and associated σNPi / σNP
e measurement
uncertainties. These are needed to effectively estimate the amount of ambient air dilution
present in an open process.
5. Steps #3 and #4 are to be repeated as necessary over the cover gas concentration ranges
utilized during normal production, presumably since the degradations may be
significantly different depending on mixture ratios. This typically means an experimental
B-2
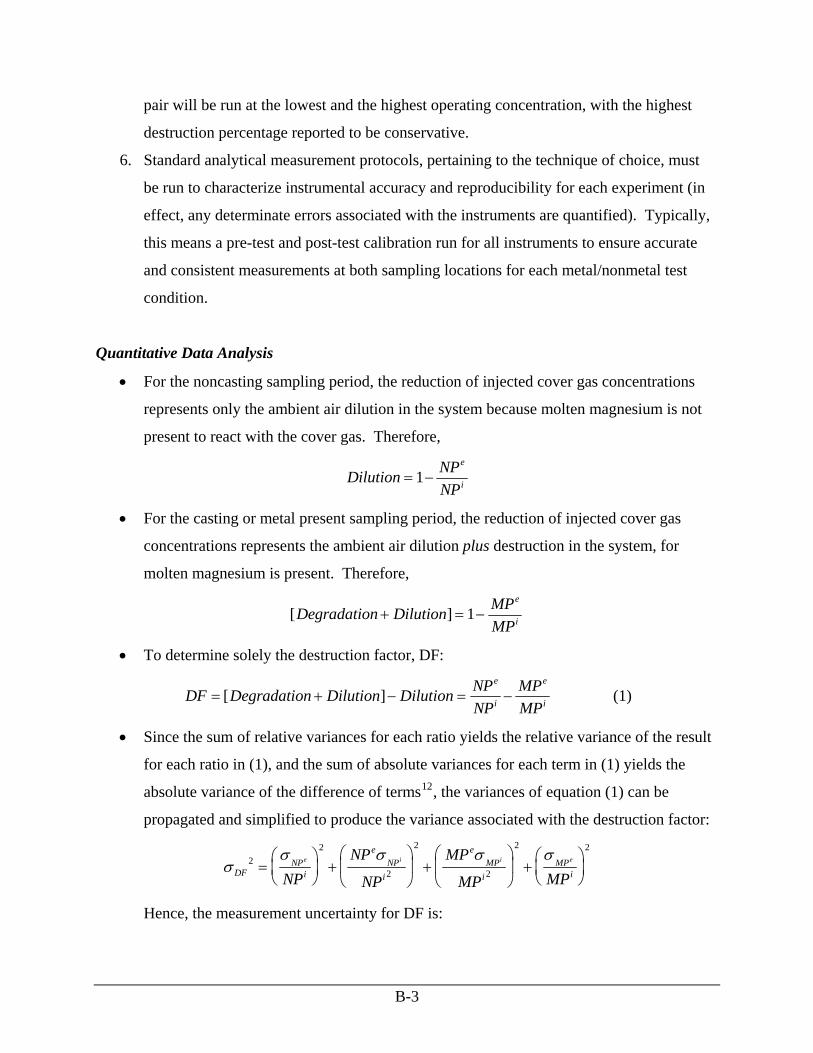
B-3
pair will be run at the lowest and the highest operating concentration, with the highest
destruction percentage reported to be conservative.
6. Standard analytical measurement protocols, pertaining to the technique of choice, must
be run to characterize instrumental accuracy and reproducibility for each experiment (in
effect, any determinate errors associated with the instruments are quantified). Typically,
this means a pre-test and post-test calibration run for all instruments to ensure accurate
and consistent measurements at both sampling locations for each metal/nonmetal test
condition.
Quantitative Data Analysis
• For the noncasting sampling period, the reduction of injected cover gas concentrations
represents only the ambient air dilution in the system because molten magnesium is not
present to react with the cover gas. Therefore,
Dilution NPNP
e
i= −1
• For the casting or metal present sampling period, the reduction of injected cover gas
concentrations represents the ambient air dilution plus destruction in the system, for
molten magnesium is present. Therefore,
[ ]Degradation Dilution MPMP
e
i+ = −1
• To determine solely the destruction factor, DF:
DF Degradation Dilution Dilution NPNP
MPMP
e
i
e
i= + − = −[ ] (1)
• Since the sum of relative variances for each ratio yields the relative variance of the result
for each ratio in (1), and the sum of absolute variances for each term in (1) yields the
absolute variance of the difference of terms12, the variances of equation (1) can be
propagated and simplified to produce the variance associated with the destruction factor:
σσ σ σ σ
DFNP
i
eNP
i
eMP
iMP
i
e i i
NPNP
NP
MP
MP MP2
2
2
2
2
2 2
=⎛⎝⎜
⎞⎠⎟ +
⎛
⎝⎜
⎞
⎠⎟ +
⎛
⎝⎜
⎞
⎠⎟ +
⎛⎝⎜
⎞⎠⎟ e
Hence, the measurement uncertainty for DF is:
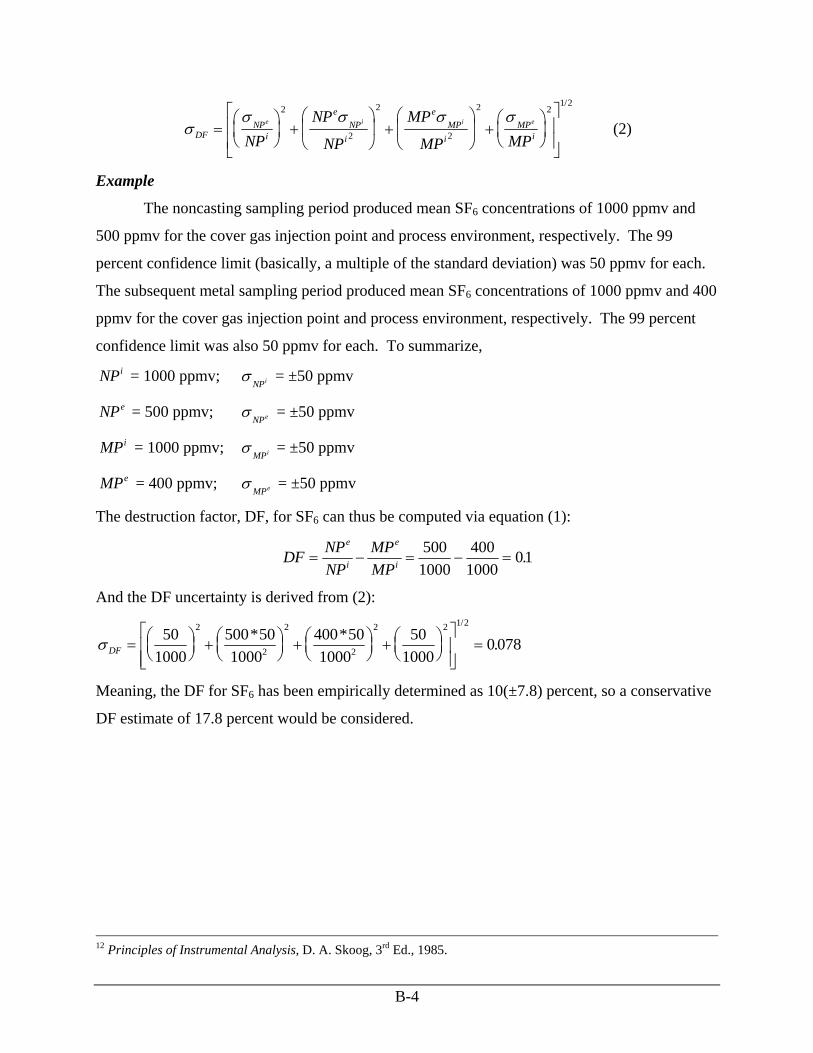
B-4
σσ σ σ σ
DFNP
i
eNP
i
eMP
iMP
i
e i i e
NPNP
NP
MP
MP MP=
⎛⎝⎜
⎞⎠⎟ +
⎛
⎝⎜
⎞
⎠⎟ +
⎛
⎝⎜
⎞
⎠⎟ +
⎛⎝⎜
⎞⎠⎟
⎡
⎣
⎢⎢
⎤
⎦
⎥⎥
2
2
2
2
2 21 2/
(2)
Example
The noncasting sampling period produced mean SF6 concentrations of 1000 ppmv and
500 ppmv for the cover gas injection point and process environment, respectively. The 99
percent confidence limit (basically, a multiple of the standard deviation) was 50 ppmv for each.
The subsequent metal sampling period produced mean SF6 concentrations of 1000 ppmv and 400
ppmv for the cover gas injection point and process environment, respectively. The 99 percent
confidence limit was also 50 ppmv for each. To summarize,
NPi = 1000 ppmv; σNPi = ±50 ppmv
NPe = 500 ppmv; σNPe = ±50 ppmv
MPi = 1000 ppmv; σMPi = ±50 ppmv
MPe = 400 ppmv; σMPe = ±50 ppmv
The destruction factor, DF, for SF6 can thus be computed via equation (1):
DF NPNP
MPMP
e
i
e
i= − = − =500
1000400
100001.
And the DF uncertainty is derived from (2):
σ DF = ⎛⎝⎜
⎞⎠⎟
+ ⎛⎝⎜
⎞⎠⎟
+ ⎛⎝⎜
⎞⎠⎟
+ ⎛⎝⎜
⎞⎠⎟
⎡
⎣⎢⎢
⎤
⎦⎥⎥
=50
1000500 501000
400 501000
501000
0 0782
2
2
2
2 2 1 2* * .
/
Meaning, the DF for SF6 has been empirically determined as 10(±7.8) percent, so a conservative
DF estimate of 17.8 percent would be considered.
12 Principles of Instrumental Analysis, D. A. Skoog, 3rd Ed., 1985.