characterization of a bubbling fluidized bed … · characterization of a bubbling fluidized bed...
TRANSCRIPT

CHARACTERIZATION OF A BUBBLING FLUIDIZED BED BIOMASS GASIFIER
LIM MOOK TZENG
UNIVERSITI SAINS MALAYSIA
2007

CHARACTERIZATION OF A BUBBLING FLUIDIZED BED BIOMASS
GASIFIER
by
LIM MOOK TZENG
Thesis submitted in fulfillment of the requirements for the degree
of Master of Science
MAY 2007

ii
ACKNOWLEDGEMENTS
Many thanks to my supervisor, Associate Professor Dr. Hj. Zainal Alimuddin, for
providing the chance of doing this MSc Degree; to Mr. Yeoh from Visdamax and
Malaysian Technology Development Center (MTDC) for providing the funding for this
project; to the staff in Visdamax (M) Sdn. Bhd., for providing their services and time
during the course of this project especially Bala, Poh and Mr. Choong; and En. Zalmi,
the technician from School of Mechanical Engineering for guidance in operating the
gas chromatograph laboratory; and last but not least to my parents, Lim Yoo Kuang
and Gan Choon who have given their moral support when it was needed most.

iii
TABLE OF CONTENTS
Page ACKNOWLEDGEMENTS ii
TABLE OF CONTENTS iii
APPENDICES v
LIST OF TABLES vi
LIST OF FIGURES viii
LIST OF PLATES xi
LIST OF SYMBOLS xii
LIST OF ABBREVIATION xv
LIST OF PUBLICATIONS & SEMINARS xvi
ABSTRAK xvii
ABSTRACT xix
CHAPTER 1: INTRODUCTION
1.1 Problem Statement 1
1.2 Malaysia’s Biomass Energy Outlook 3
1.3 Development of Biomass Energy 5
1.4 Objective of Project 6
1.5 Scope of Work 6
CHAPTER 2: LITERATURE REVIEW
2.1 Biomass Gasification Process 8
2.2 Types of Gasifiers 10
2.2.1 Fixed Bed Gasifiers 10
2.2.2 Fluidized Bed Gasifiers 12
2.3 Industrial Applications and Experiences on Fluidized Bed
Biomass Gasifiers
15
2.4 Performance Studies of Fluidized Bed Gasifiers 18
2.5 Process Issues 22
2.5.1 Tar 22
2.5.2 Gas Cleaning Methods 24

iv
2.6 Modelling Work on Bubbling Fluidized Beds 25
2.7 Summary 28
CHAPTER 3: PROJECT METHODOLOGY AND SET-UP
3.1 Project Methodology 31
3.1.1 Design Parameters 32
3.2 Bubbling Fluidized Bed Biomass Gasifier 34
3.2.1 Bed Temperature 36
3.2.2 Air Flow Rate 39
3.2.3 Superficial gas velocity 41
3.2.4 Energy Content of Producer Gas 41
3.2.5 Turndown Ratio 42
3.2.6 Bubbling Fluidization Hydrodynamics 42
3.2.6.1 Bed Height 47
3.3 Fuel Transportation System 48
3.4 Gas Cleaning and Cooling (GCC) System 51
3.5 Other Equipments 57
3.5.1 Flare Stack 57
3.5.2 Bomb Calorimeter 57
3.5.3 Gas Chromatograph 59
3.5.4 Condensate Analysis 60
3.5.5 Proximate and Ultimate Analysis 61
3.6 FLUENT Modelling 64
CHAPTER 4: RESULTS AND DISCUSSIONS
4.1 Flow Rates and Equivalence Ratio (ER) 66
4.2 Biomass Properties 68
4.3 Fluidization Hydrodynamics 69
4.4 FLUENT Modelling of Fluidized Bed 74
4.4.1 FLUENT Modelling of Bed Expansion 84
4.5 Temperature Profile 86
4.6 Gas Composition, LCVPG and ηcold 91
4.7 Carbon Conversion Efficiency 99
4.8 Condensate Flow 101
4.8.1 HPLC Analysis of Condensate 105

v
4.9 Energy Analysis 108
4.9.1 Calorific Value of Char 108
4.9.2 Energy and Mass Balance of System 108
4.9.3 Design and Actual Operation: Comparison of Energy
Balance
110
4.10 Turndown Ratio 111
CHAPTER 5: STATISTICAL ANALYSIS
5.1 Analysis of Variance (ANOVA) 114
5.2 Steady State Temperature 114
5.3 Air Flow Rate 115
5.4 Biomass Feed Rate 116
5.5 LCVPG and ηcold 116
5.6 GCC Mass Flow Rates 117
5.7 Fluidization Regime Test 118
CHAPTER 6: CONCLUSION AND RECOMMENDATIONS
6.1 Conclusion 119
6.1.1 Objectives Achieved 121
6.2 Recommendations for Future Work 121
REFERENCES
123
APPENDICES
Appendix A Drawing and Schematics 128
Appendix B Data Of Flow Rate And Gas Chromatograph 130
Appendix C Governing Equations for FLUENT Modelling 134

vi
LIST OF TABLES
Page
1.1 Recent renewable energy potential in Malaysia 5
2.1 Comparison of the Four Gasifiers (Warnecke, 2000) 14
3.1 Design of Operating Parameters for BFBG System 34
4.1 ER Values for Various Flow Rate Combinations 67
4.2 Size Distribution of Wood Chips 68
4.3 Biomass properties 68
4.4 Sieve Analysis of Sand for BFBG 70
4.5 Standard Deviation for ∆Pmax 83
4.6 ∆T1-2 for Hs 88
4.7 Average T1 for Varying ER 91
4.8 Gas Compositions for BFBG with Static bed height of 400mm 92
4.9 Gas Compositions for BFBG with Static bed height of 500mm 92
4.10 Gas Compositions for BFBG with Static bed height of 600mm 93
4.11 Sieve Analysis of Char Particles 100
4.12 Char Yield from BFBG 101
4.13 Average Condensate Flow Rate from Test Runs with and
without Second Condenser
102
4.14 Condensate Flow Rate for 155kg/hrmbiomass 103
4.15 Condensate Flow Rate for 90kg/hrmbiomass 103
4.16 Average Temperatures of GCC 105
5.1 Standard Deviation of T1 114
5.2 airQ and airm from Three Test Runs 115
5.3 biomassm for three test runs 116
5.4 Mass Flow Rates from GCC Components 117
5.5 Standard Error for Pressure Drop with Varying Flow Rates 118
B1 Frequency, Differential Height, Pressure Drop and Flow Rate
of the Air Blower
130
B2 Air Flow Rate Data 130
B3 Area of Chromatogram and Sample Gases 132
B4 Chromatograph Area, Ag for Hs 400mm 133
B5 Chromatograph Area, Ag for Hs 500mm 133
B6 Chromatograph Area, Ag for Hs 600mm 133
B7 CV of Gases 133

vii
LIST OF FIGURES
Page
2.1 Diagram of Updraft and Downdraft Gasifiers 11
2.2 Diagram of Bubbling and Circulating Fluidized Bed Gasifiers 14
2.3 BioCoComb Gasifier and its connection to the boiler, Zeltweg,
Austria (Granastein, 2002).
16
2.4 Schematic of the gasifier system in the Leizhuang Village
(Smeenk et al, 2005)
17
2.5 Diagram of the OLGA Tar Removal System Developed by ECN
(Boerrigter, 2002)
25
2.6 Evolution of solid phase volume fraction of Geldart B system
with time (Air-Sand, 610µm and density of 2500kg/m3)
(Brandani and Zhang, 2006)
27
3.1 Flow chart for methodology of project 31
3.2 Drawing of the BFBG 35
3.3 Drawing of the Ignition Port 37
3.4 Bed Pressure Drop curve against Gas Velocity 43
3.5 Classification of Particles according to Geldart groups (Fan
and Zhu, 1998; Geldart, 1973)
44
3.6 Location of the Pressure Taps for Pressure Drop Test 45
3.7 Drawing of the Fluidization Test Rig 46
3.8 Diagram of the BFBG System with Feeding System 49
3.9 Diagram of the BFBG System with the GCC 51
3.10 Collection Efficiency for Small Cyclones (DOD, 2003) 52
3.11 Meshed Grid of BFBG Model 65
4.1 Air Volume and Mass Flow rate with varying Operating
Frequency
66
4.2 Biomass Feed Rate with Respect to the Screw Feeder
Operating Frequency
67
4.3 Pressure drop across BFBG for Different Bed Height 70
4.4 Contours of volume fraction of sand in BFBG at flow time of
t=1.00s
75
4.5 Contours of volume fraction of sand in BFBG at flow time of
t=2.52s
76

viii
4.6 Contours of volume fraction of sand in BFBG at flow time of
t=3.03s
77
4.7 Contours of volume fraction of sand in BFBG at flow time of
t=3.53s
77
4.8 Volume fraction of sand phase at flow time of 4.00s 78
4.9 Vectors of Velocity Magnitude of Air at time 4.00s 79
4.10 Vectors of Velocity Magnitude of sand at time 4.00s 80
4.11 Pressure drop for bed height of 400mm 81
4.12 Pressure drop for bed height of 500mm 81
4.13 Pressure drop for bed height of 600mm 82
4.14 Pressure drop for bed height of 700mm 82
4.15 Obtained FLUENT and Experimental Pressure drop for
Different Hs
83
4.16 Volume fraction plot of sand at y800 with respect to flow time
with Hs=400mm.
84
4.17 Volume fraction plot of sand y800 with respect to flow time with
Hs=500mm
85
4.18 Volume fraction plot of sand y800 with respect to flow time with
Hs=600mm
85
4.19 Location of T1, T2 and Tfreeboard 86
4.20 Temperature profile of the BFBG during steady state operation 87
4.21 Bed and Freeboard Temperature 88
4.22 Temperature Profile for Hs of 400mm. 89
4.23 Temperature Profile for Hs of 500mm. 89
4.24 Temperature Profile for Hs of 600mm 90
4.25 Bed Temperature Profile for ER of 0.13, 0.17 and 0.21 90
4.26 LCVPG Variation with ER 93
4.27 Cold gas efficiency of BFBG against ER 94
4.28 CO composition 95
4.29 CO2 composition 96
4.30 CH4 composition 97
4.31 H2 composition 98
4.32 O2 composition 99
4.33 N2 composition 99
4.34 Temperature of the gasifier outlet, the primary and secondary
condenser, and the final gas temperature.
104

ix
4.35 Chromatogram of Tar-Water Sample with Phenol Detected.
Wavelength=230nm, flow rate 1.0ml
106
4.36 Chromatogram of Tar-Water Sample with Phenol Detected.
Wavelength=200nm, flow rate 1.0ml
107
4.37 Schematic Diagram of BFBG System with Thermal Output from
Components
108
4.38 Shankey Diagram of Energy Output of System 110
4.39 Diagram of Energy Balance of System Designed for 100kWe 110
4.40 Diagram of Energy Balance of System in Actual Case 111
4.41 Diagram of Energy Balance of System Design for 200kWe 112
4.42 Diagram of Energy Balance of System for biomassm =155kg/hr 113
A1 Drawing of Orifice Meter 128

x
LIST OF PLATES
Page
3.1 Bubbling Fluidized Bed Gasifier (BFBG) 36
3.2 Ignition Port in for BFBG in Visdamax Sdn. Bhd. 38
3.3 Ignition Port in for BFBG in USM 39
3.4 Orifice Meter and Blower 39
3.5 Experimental rig for fluidization test 47
3.6 Belt Conveyor 50
3.7 Screw Feeder 50
3.8 Rotary Valve and Screw Conveyor 51
3.9 Primary condenser 53
3.10 Secondary Condenser 54
3.11 Expansion Tank 55
3.12 Bag Filter 55
3.13 Producer Gas Ignited at Flare Stack 57
3.14 Bomb Calorimeter 58
3.15 Agilent GC 4890D 59
3.16 High Performance Liquid Chromatograph (HPLC) 61
3.17 Thermographic Analyzer (TGA) 61
3.18 Moisture Content Balance 63
3.19 Elemental Analyzer 63
4.1 Bubble formed (blower at 28Hz) 73
4.2 Bubble erupting at bed surface (blower at 28Hz) 73
4.3 Bubble erupting at bed surface (blower at 31Hz) 74
4.4 Bubble erupting at bed surface (blower at 40Hz) 74
4.5 Ignited Flare during test run 112
A1 Electrical Starter for Spark Plug for USM BFBG 129
A2 BFBG in Visdamax (M) Sdn. Bhd. 129

xi
LIST OF SYMBOLS
Page
MJ/Nm3 Mega-Joule per nominal m3, unit for lower calorific
value of gas at normal temperature and pressure
conditions.
16
Pin Thermal input, kW 32
η Engine efficiency 32
LCVPG Lower calorific value of producer gas, MJ/Nm3 32
QPG Volume flow rate of producer gas, Nm3/hr 32
Pin, PG Thermal input from producer gas, kW 32
coldη Cold gas efficiency 33
biomassm Mass flow rate of biomass, kg/hr 33
LCVbiomass Lower calorific value of biomass, MJ/kg 33
airm Mass flow rate of air, kg/hr 34
T1 Temperature of bed zone 400mm above air
distribution plate, ˚C
36
T2 Temperature of bed zone 800mm above air
distribution plate, ˚C
36
Tfreeboard Temperature of freeboard zone, ˚C 36
L Distance of pressure tap from orifice, m 40
D Pipe diameter, mm 40
∆h Differential height of water column in manometer, m 40
K Discharge coefficient 40
∆P Pressure drop across orifice, kPa 40
ρair Density of air, kg/m3 40
ρH2O Density of water, kg/m3 40
Qair Volume flow rate of air, Nm3/hr 40
Rt Turndown ratio 42
Pmax,o Maximum thermal output at maximum cold gas
efficiency, kW
42
Pmin,o Minimum thermal output at maximum cold gas
efficiency, kW
42
Umf Minimum fluidization velocity, m/s 43
dp Particle diameter, μm 44

xii
Ra Aspect Ratio 47
Hs Static Bed Height, m 48
Dr Reactor Diameter, m 48
mchar Amount of char collected, kg 55
ηcarbon Carbon conversion efficiency 55
mfed biomass Amount of biomass fed, kg 56
primm Mass flow rate of condensates from primary
condenser, g/min
56
secm Mass flow rate of condensates from secondary
condenser, g/min
56
expm Mass flow rate of condensates from expansion tank,
g/min
56
condm Total Mass flow rate of condensates, kg/hr 56
Toutlet Temperature of outlet gas from bubbling fluidized bed
gasifier, ˚C
56
Tprim Temperature of at inlet of primary condenser, ˚C 56
Tsec Temperature of at inlet secondary condenser, ˚C 56
Tfinal Temperature of producer gas at stack, ˚C 56
mwater Mass of water, kg 58
∆HH2O Specific heat for water, kJ/kg.K 58
msample Mass of sample, kg 58
hfg,H2O Latent heat of vaporization for water, kJ/kg 58
Ag Area under chromatogram for component g 60
Ag,I Area under chromatogram for pure component g 60
y800 Point with y=800mm, x=200mm in FLUENT model 64
∆Pmax Maximum pressure drop across BFBG, kPa 83
∆Pmax, FLUENT Maximum pressure drop from FLUENT across BFBG,
kPa
83
∆T1-2 Temperature difference between first and second
thermocouple, ˚C
88
Pchar Thermal input from char, kW 109
Ploss Thermal energy loss, kW 109
Pin, diesel Thermal input from diesel, kW 110
Ho Null hypothesis 114
α Level of significance 114
U Velocity vector, m/s 134
xiii
Del operator, m-1 134
e internal energy per unit mass, kJ/kg 134
f Field Force per unit mass, N/m 134
τ shear stress tensor, N/m2 134
μ Bulk Viscosity, Ns/m2 134
eJ Heat Flux Vector, W/m3 134
qJ Heat generation term, W/m2 134
μ Viscosity, Ns/m2 134
δij Kronecker delta 134
kφ Dissipation function, W/m3 135
Vk Volume of phase k, m3 135
αk Volume fraction of phase k 135
Ksl Gidaspow fluid-solid interaction coefficient 135
pk Static pressure of phase k, kPa 136
ρl Density of liquid phase, m3 136
sU Velocity vector of solid phase, m/s 136
lU Velocity vector of liquid phase, m/s 136
αl Volume fraction of liquid phase 136
αs Volume fraction of solid phase 136
μl Viscosity of liquid phase 136
CD Drag coefficient 136
Res Reynolds Number of solid phase 136
xiv
LIST OF ABBREVIATION
AFR Air-fuel Ratio
BFBG Bubbling fluidized bed biomass gasifier
CFBG Circulating fluidized bed biomass gasifier
CFD Computational fluid dynamics
CHP Combined heat and power
ER Equivalence ratio
ESCO Energy service companies
ESP Electrostatic precipitator
GC Gas chromatograph
HPLC High performance liquid chromatograph
IC Internal combustion
IGCC Integrated gasification combined cycle
IPP Independent power producer
LCV Lower calorific value
LPG Liquid petroleum gas
PG Producer gas
TCD Thermal Conductivity detector
TGA Thermographic analyzer
TNB Tenaga Nasional Berhad
VSD Variable speed drive

xv
LIST OF PUBLICATIONS & SEMINARS
1. Lim M.T., Zainal Z.A. (2006) Operational Investigation of a Bubbling Fluidized Bed Biomass Gasification System. Journal of Energy for Sustainable Development. 11(1). pp88-93.
2. Lim M.T., Zainal Z.A. (2006) Experimental Investigation of a Bubbling Fluidized Bed Biomass Gasifier. International Conference on Environment: Knowledge-based Environmental Management and Sustainable Development. Penang, Malaysia.
3. Lim M.T., Zainal Z.A. (2006) Bubbling Fluidized Bed Biomass Gasification – Performance, Process Findings and Energy Analysis. Journal of Renewable Energy (Accepted as technical note, under revision).
4. Lim M.T., Zainal Z.A. (2006)Bubbling Fluidized Bed Gasification System-Findings
and Performance. JSPS-VCC Group Seminar 2006, Natural Resources and Energy Environment. Johor Bahru

xvi
PENCIRIAN PENGGAS BIOMASS LAPISAN TERBENDALIR GELEMBUNG
ABSTRAK
Kenaikan harga minyak dan pencemaran alam sekitar yang semakin
memudaratkan telah menonjolkan tenaga biomass sebagai satu alternatif yang baik.
Sebuah penggas lapisan terbendalir gelembung telah direka disebabkan oleh
keupayaannya untuk mengeluarkan haba yang lebih tinggi dan menerima pelbagai
jenis dan qualiti bahan api. Penggas lapisan terbendalir gelembung ini mempunyai
diameter dalaman 400mm dan disambungkan kepada satu sistem penyejukan dan
pembersihan yang mengeluarkan partikel dan kondensasi daripada gas keluaran.
Penggas lapisan terbendalir gelembung ini mempunyai pasir sebagai bahan lapisan
dan mempunyai diameter partikel sebesar 425 sehingga 600μm, dengan ketumpatan
1520kg/m3, dan mewakili kumpulan B Geldart. Biomass yang digunakan ialah
kepingan kayu yang diperolehi daripada sebuah kilang perabot. Lapisan terbendalir
mula bergelembung apabila aliran udara melebihi 150kg/hr dan lapisan terbendalir
mula terperangkap dalam gas keluaran bila aliran udara melebihi 220kg/hr. Komposisi
gas, nilai kalorific rendah, LCVPG dan kecekapan sejuk, ηcold ditentukan untuk
ketinggian lapisan static, Hs 500mm dan 600mm dengan variasi nisbah penyamaan
(ER). Didapati bahawa untuk Hs 500mm maximum ηcold adalah 71% pada ER 0.25;
untuk Hs 600mm maximum ηcold adalah 81%. LCVPG semakin kurang berbanding
dengan ER, dan nilai tertinggi ada pada ER rendah. Char mempunyai LCV
21.07MJ/kg, manakala kepingan kayu mempunyai LCV 17.40MJ/kg daripada ujian
bomb kalorimeter. Char mempunyai dp 100μm daripada analisis sieve. Analisis
bendalir kondensasi yang dikumpulkan daripada kondenser melalui menunjukkan
bahawa phenol adalah komponen utama, yang merupakan satu komponen yang amat
cair dalam air, dan boleh meyebabkan pencemaran. Penggunaan satu sistem
pembersihan air buangan akan mengurangkan pencemaran. Analisis tenaga

xvii
menunjukkan bahawa tenaga yang terbazir adalah 22.98%, dan kebanyakan tenaga ini
terkandung dalam kondensasi. Untuk mengurangkan kondensasi dari sistem jumlah
biomass yang dibekalkan untuk penggas dihadkan kepada 155kg/hr. Ini mengeluarkan
tenaga haba sebanyak 530kW dan daripada ini jumlah tenaga electrik yang dapat
dijanakan daripada enjin adalah 172.5kW sahaja. Ini mengakibatkan nisbah belokan
turun kepada 1.98 sahaja, berbanding dengan nilai asal iaitu 2.67.

xviii
CHARACTERIZATION OF A BUBBLING FLUIDIZED BED BIOMASS GASIFIER
ABSTRACT
The recent increase in fossil fuel prices and worsening effects of global
warming has prompted the use of biomass as a source of energy. A bubbling fluidized
bed gasifier biomass gasifier (BFBG) was thus selected for energy conversion due to
its high thermal output and ability to accept wide variety of fuels. It was designed with
an internal diameter of 400mm and has a thermal output of 640kW. It is attached to a
gas cleaning and cooling (GCC) that removes particulates and condensates from the
system. The BFBG used silica river sand with a mean particle size, of 425 to 600μm
and has a density of 1520kg/m3, which belongs to Geldart group B particles. The
biomass used was rubber wood chips, obtained from a saw mill. Bubbling fluidization
began once the superficial gas velocity reached 0.24m/s. The gas composition, lower
calorific value of producer gas, LCVPG and cold gas efficiency, ηcold were then
determined for different static bed heights with varying equivalence ratio. It was found
that ηcold increases with increasing equivalence ratio until an optimum value before
decreasing. LCVPG was found to decrease with increasing equivalence ratio. Between
equivalence ratios of 0.177 to 0.452, LCVPG was highest at low 0.177, and was lowest
at 0.452. Char had a LCV of 23.69MJ/kg, while wood chips had a LCV of 17.40MJ/kg
from bomb calorimeter tests. Char had a particle size of 100μm from sieve analysis.
The minimum fluidization velocity for char would be six to eight times of sand, thus
elutriation of char from BFBG would be unavoidable. This caused the carbon
conversion efficiency to be low at 95.40%, with average char collected to be 2.9kg. The
average condensates flow rate was found to be of 9.15% of the biomass fed with low
biomass feed rate. Analysis of the condensates showed that phenol was the main
constituent, which is highly soluble with water and causes pollution. Incorporation of a
wastewater treatment plant would be required to reduce contamination. Energy

xix
analysis of the system showed that heat loss was 21.42%. Most of the energy lost was
contained in the condensates. To reduce condensate flow rates the maximum biomass
feed rate was limited to 155kg/hr, thus the thermal output would be 530kW. From the
internal combustion engines the electricity generated would be 172.5kWe. Thus the
actual turndown ratio was found to be 1.98, compared to the design case of 2.67.
1
CHAPTER 1
INTRODUCTION
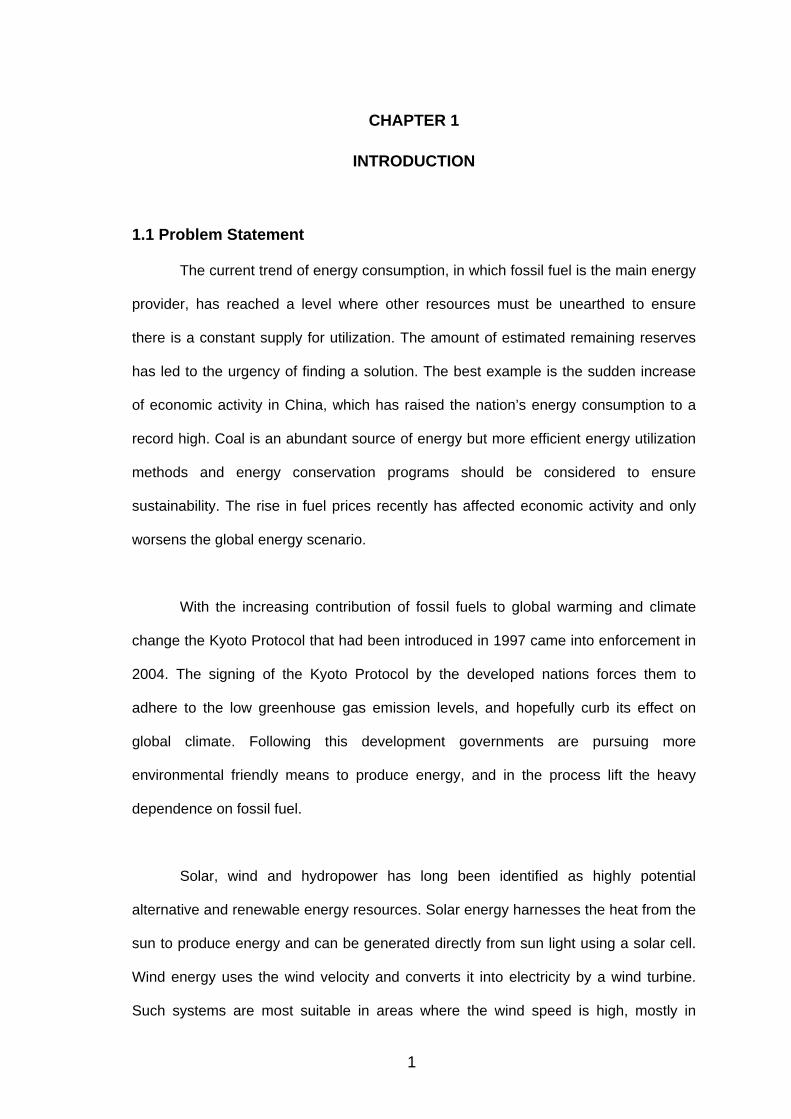
1.1 Problem Statement
The current trend of energy consumption, in which fossil fuel is the main energy
provider, has reached a level where other resources must be unearthed to ensure
there is a constant supply for utilization. The amount of estimated remaining reserves
has led to the urgency of finding a solution. The best example is the sudden increase
of economic activity in China, which has raised the nation’s energy consumption to a
record high. Coal is an abundant source of energy but more efficient energy utilization
methods and energy conservation programs should be considered to ensure
sustainability. The rise in fuel prices recently has affected economic activity and only
worsens the global energy scenario.
With the increasing contribution of fossil fuels to global warming and climate
change the Kyoto Protocol that had been introduced in 1997 came into enforcement in
2004. The signing of the Kyoto Protocol by the developed nations forces them to
adhere to the low greenhouse gas emission levels, and hopefully curb its effect on
global climate. Following this development governments are pursuing more
environmental friendly means to produce energy, and in the process lift the heavy
dependence on fossil fuel.
Solar, wind and hydropower has long been identified as highly potential
alternative and renewable energy resources. Solar energy harnesses the heat from the
sun to produce energy and can be generated directly from sun light using a solar cell.
Wind energy uses the wind velocity and converts it into electricity by a wind turbine.
Such systems are most suitable in areas where the wind speed is high, mostly in

2
Northern America, Eastern Europe and Africa (Breeze, 2005). Hydropower involves
construction of dams to hold large volumes of water with turbines at the discharge to
convert the potential energy into electricity.
The last few decades has seen the introduction of waste to generate power,
whereby waste is incinerated in a furnace to provide gas to a turbine. These wastes
include municipal waste; industrial and chemical products such as car tires, mold
runners, plastic products; biomass waste like palm kernel shell, rice husks, wood chips,
pellets, etc. The combustion of municipal waste in furnaces to produce steam and
generate electricity has reportedly produced pollutants such as dioxins (Breeze, 2005).
These potential environmental impacts makes biomass waste a more preferable
option. Klass mentions that the only natural renewable carbon resource that is large
enough to be used as a substitute for fossil fuels is biomass. The International Energy
Agency (IEA) reports that the energy consumption for renewable energy resources in
year 2000 was 13.8% of total energy consumption, of which 79.8% is combustible
renewable resource and waste, most of them being biomass. (Klass, 2004)
Advantages of biomass energy utilization include ensuring the sustainability of
energy supply in the long term as well as reducing the impact on the environment.
Petroleum fuels, natural gas and coal emit carbon dioxide, nitrogen oxides and sulfur
dioxides that are classified as greenhouse gases. As biomass energy uses agricultural
waste as fuel, it is considered “CO2 neutral” and emissions of sulfur dioxides and
nitrogen oxides are very low, making it a good option as clean fuel for the environment.
Converting these waste into energy reduces pollution of the environment, otherwise
the biomass waste would be left to rot in a clearing or most of the time subjected to
open-burning by farmers to dispose of it. In neighboring Sumatera, Indonesia, large
areas of open burning to clear out bushes for development has caused haze hazards
3
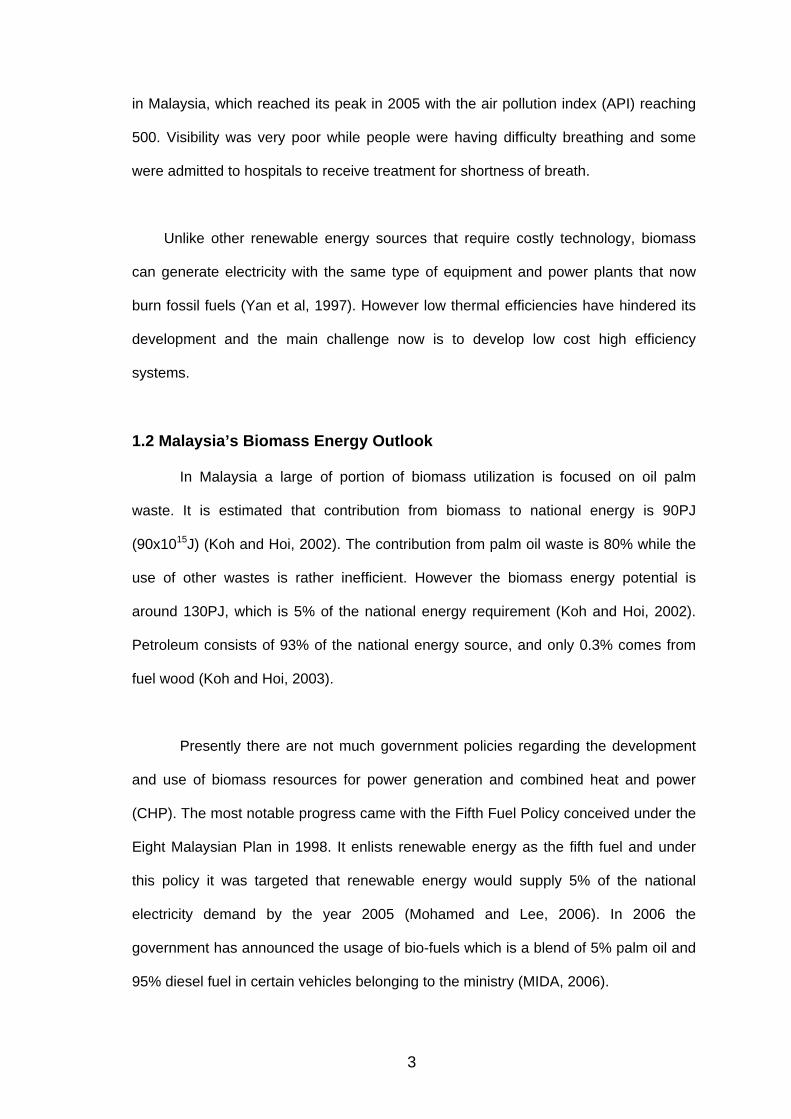
in Malaysia, which reached its peak in 2005 with the air pollution index (API) reaching
500. Visibility was very poor while people were having difficulty breathing and some
were admitted to hospitals to receive treatment for shortness of breath.
Unlike other renewable energy sources that require costly technology, biomass
can generate electricity with the same type of equipment and power plants that now
burn fossil fuels (Yan et al, 1997). However low thermal efficiencies have hindered its
development and the main challenge now is to develop low cost high efficiency
systems.
1.2 Malaysia’s Biomass Energy Outlook
In Malaysia a large of portion of biomass utilization is focused on oil palm
waste. It is estimated that contribution from biomass to national energy is 90PJ
(90x1015J) (Koh and Hoi, 2002). The contribution from palm oil waste is 80% while the
use of other wastes is rather inefficient. However the biomass energy potential is
around 130PJ, which is 5% of the national energy requirement (Koh and Hoi, 2002).
Petroleum consists of 93% of the national energy source, and only 0.3% comes from
fuel wood (Koh and Hoi, 2003).
Presently there are not much government policies regarding the development
and use of biomass resources for power generation and combined heat and power
(CHP). The most notable progress came with the Fifth Fuel Policy conceived under the
Eight Malaysian Plan in 1998. It enlists renewable energy as the fifth fuel and under
this policy it was targeted that renewable energy would supply 5% of the national
electricity demand by the year 2005 (Mohamed and Lee, 2006). In 2006 the
government has announced the usage of bio-fuels which is a blend of 5% palm oil and
95% diesel fuel in certain vehicles belonging to the ministry (MIDA, 2006).

4
Despite this development and the potential of biomass energy there are several
barriers that limit its commercialization and application in the industry. Financially, as
biomass energy projects are capital-intensive, it is difficult to obtain loans from banks
as there are no records of experience to rely upon. Bank loan officers also do not have
the experience to evaluate the loan for the projects which are backed by performance
guarantees. This might be the reason why Energy Service Companies (ESCOs), which
are supposedly companies which develop energy projects, have not been successful.
Independent Power Producers (IPPs) have set up numerous power plants in the
country but no information is available regarding their activities in biomass utilization.
The IPPs mainly rely on natural gas fired power plant technologies (M. Zamzam Jaafar
et al, 2003).
However the onus is still with the major player of the Malaysian energy market.
Currently the power market is monopolized by Tenaga Nasional Berhad (TNB). The
company does not promote biomass as fuel in its power plants and there is no
indication of it doing so. However, the electricity supply market is in the process of
restructuring, and the Ministry of Energy, Communications and Multimedia is
responsible for ensuring a level playing field for renewable energy when the need
arises (Poh and Kong, 2002).
Overall biomass energy utilization is still in its infant stage in Malaysia although
there are abundant potential resources in the country as shown in Table 1.1. It is still
undergoing development towards the goal of technology commercialization.
Cooperation and commitment from parties involved are needed in other to realize the
implementation of biomass energy as a supplementary energy source on national
scale.

5
Table 1.1: Recent renewable energy potential in Malaysia
Renewable Energy Resource Annual Energy Value (RM Million)
Forest residues 11984
Palm oil biomass 6379
Solar thermal 3023
Mill residues 836
Hydro 506
Solar PV 378
Municipal waste 190
Rice husk 77
Landfill gas 4
Source: Ministry of Energy, Communications, and Multimedia, 2006
The above factors prompted Visdamax Sdn. Bhd., a boiler and kiln dryer
manufacturer based in Kulim, to take up the biomass energy project funded by the
Malaysian Technology Development Center (MTDC). Universiti Sains Malaysia was
engaged in a research capacity to help develop the system, in hope that the
demonstration efforts and results pave the way for more experimental work regarding
biomass energy.
1.3 Development of Biomass Energy
Many nations have developed biomass energy conversion technologies to
provide power. Dooley mentioned that in Japan the government has implemented the
New Sun Shine Program, which funds diverse biomass energy projects, from
technologies designed for more efficient use of current biomass resources, to basic
research designed to genetically engineer microorganisms and new plant species for
advanced biomass production. The Japanese government is also funding research for
technologies pertaining conversion of biomass into gaseous and liquid fuels and also
on biomass combustion technologies. There is also sponsor for research on direct
catalytic decomposition of biomass to produce hydrogen (Dooley, 1999).This shows
the increase in interest of Japan in utilization of biomass as a renewable energy

6
source. Finland has also utilized biomass gasification to produce electricity in large
scale applications. The Lahti power plant is rated to generate 1700GWh of energy
(Foster Wheeler, 2005; Nieminen and Kivela, 1998). Mory and Zotter also presented a
case study on the Zeltweg power plant in Austria which used circulating fluidized bed
gasification (Mory and Zotter, 1998; Granastein, 2002)
1.4 Objective of Project
A bubbling fluidized bed biomass gasifier (BFBG) system was constructed for
energy conversion purposes. The objectives of the project would be to:
1. Design a bubbling fluidized bed biomass gasifier
2. Characterize the performance and process of a BFBG system
3. Provide clean producer gas for utilization in an engine.
1.5 Scope of Work
The mass flow rate of air and biomass waste will be measured, varied and
monitored to determine the effect it has on the performance of the bubbling fluidized
bed gasifier. The resulting air-fuel ratio and equivalence ratio will be determined and
compared with results from other researchers. The lower calorific value of the producer
gas will be measured to determine the cold gas efficiency of the gasifier. The effect of
the equivalence ratio on the lower calorific value, the cold gas efficiency and the gas
composition can then be investigated and compared to literature.
The bed height will be varied in order to investigate the effect it has on the
performance of the BFBG. Fluidization dynamics is investigated through computational
fluid dynamics (CFD) analysis for better understanding of the internal working
conditions of the BFBG and will be compared to available literatures regarding
fluidization dynamics for relevance.

7
A mass balance of the system will also be made to check for tar-moisture
condensate in the producer gas and the amount of char collected from the cyclone.
Analysis on the condensates using high performance liquid chromatograph will be
done. An energy analysis of the system will also be carried out.

8
CHAPTER 2
LITERATURE REVIEW
2.1 Biomass Gasification Process
Agricultural or biomass wastes are leftover organic materials from human
activities such as farming, harvesting, foresting or from furniture industries. The
chemical composition of the biomass waste varies but basically consists of
carbohydrates and lignin. The thermal conversion of biomass waste would eventually
produce carbon dioxide and water as the end products. Organic matter then absorbs
carbon dioxide from the atmosphere and converts it to carbohydrates through
photosynthesis, bringing plants back to soil again. This natural process allows the
contribution of carbon dioxide from biomass thermal conversion to be part of the
carbon cycle route. The same case does not apply to utilization of fossil fuels, as the
carbon does not originate from biomass, the combustion of petroleum products adds
more CO2 to the atmosphere.
Other than combustion, thermal conversion of biomass to generate power can
be done through gasification. Gasification produces volatile gases from solid fuels
which can be utilized in internal combustion engines or coupled to turbines to generate
power. It gives high efficiencies to produce electricity, liquid fuels and chemicals.
Integrated gasification combined cycles (IGCC) is by far the most efficient way of
generating electricity for both fossil fuels and biomass (Overend, 2000). The
implementation of a biomass gasification system can lead to the creation of
employment opportunities to local communities where the feedstock is abundant. The
inhabitants in these areas, mostly in the country side, would provide the labor supply
needed to collect and sort the biomass wastes needed for the gasification system.

9
Utilizing agricultural waste to generate power via gasification is therefore an
alternate option to prevent environmental pollution and replace the over reliance on
fossil fuels. Overend stated that gasification provides high efficiency systems, with
outstanding environmental performance at reasonable cost (Overend, 2000).
Gasification converts biomass or organic materials to producer gas via partial
oxidation. It occurs in three stages and begins with drying, where inherent moisture in
the biomass is removed. It is followed by pyrolysis where volatile gases are released.
Then finally gasification process takes place, where partial oxidation of residues and
volatiles occur.
The producer gas consist mainly of volatiles resulting from pyrolysis, which are
carbon monoxide, hydrogen, methane, carbon dioxide, water, nitrogen, some amounts
of tar and hydrocarbons. The producer gas can then be used as gaseous fuel in
internal combustion engines to generate power, but the inert gases are not reactive, so
the benefits of using producer gas is limited to the amount of CO, H2 and CH4 that is
produced. Producer gas has been reported to have a lower calorific value (LCV) of 4.5-
5.0MJ/Nm3 (Rezaiyan and Cheremisinoff, 2005). Beside from producer gas, a solid by
product known as char is produced as well from the gasification process. Char is un-
reacted carbon and is high in carbon content.
The various gasifying mediums used are air, oxygen and steam. In some
applications a combination of air and steam is used. After initial combustion of the
biomass, the flame is shut off with the oxidation medium still flowing through the
reactor. This will start a series of chemical reactions that occur in sub-stoichiometric
conditions. Basically the chemical reactions that take place in the gasifier are divided
into exothermic and endothermic reactions and are listed below (Rezaiyan and
Cheremisinoff, 2005).

10
Exothermic reactions
C + O2 CO2 (Oxidation)
2C+ O2 2CO (Partial oxidation)
C+ 2H2 CH4 (Hydro-gasification)
CO+ 3H2 CH4 + H2O (CO methanation)
Endothermic reactions
CO+ H2O CO2 + H2 (water-gas shift)
C + H2O CO + H2 (water gas reaction)
C + CO2 2CO (Boudourd reaction)
The exothermic reactions provide heat to support the endothermic reactions
through partial combustion. Eventually a steady state will be reached and the gasifier
will maintain its operation at a certain temperature. Researchers have reported varying
values of operating temperature, ranging from 600˚C to 900˚C (Gomez et al, 1995) and
some up to 1000˚C (Boerirgter et al, 2004).
2.2 Types of Gasifiers
There are basically four major types of gasifiers existing in the industry:
downdraft and updraft gasifiers, which are in the fixed bed category; and fluidized bed
gasifiers, which consist of bubbling fluidized bed biomass gasifiers (BFBG) and
circulating fluidized biomass bed gasifiers (CFBG).
2.2.1 Fixed Bed Gasifiers
Fixed bed gasifiers have a grate at the lower section of the reactor that supports
the fuel. Fuel is fed from the top of the reactor and will be stationary on the grate. The
grate is movable by an external handle to ensure that the fuel bed is properly reacted.
Fixed bed gasifiers are characterized by the direction of flow of the producer gas and

11
can be divided into two categories, the downdraft gasifier and the updraft gasifier. It
can be fed with biomass in the form of briquettes or in bulk shapes. However the
moisture content needs to be very low in order for the gasification process to occur. A
diagram of the downdraft and updraft gasifier is shown in Figure 2.1.
Figure 2.1: Diagram of Updraft and Downdraft Gasifiers A downdraft gasifier is a co-current flow gasifier, whereby the produced gas
flows down the reactor, parallel with the flow of biomass, and exits from the bottom.
The gases that flow downward are ignited, leaving charcoal to react with the
combustion gases, producing CO and H2. The advantage of the downdraft gasifier is
that it produces low tar content in the producer gas (Rezaiyan and Cheremisinoff,
2005; Warnecke, 2000). In Dasappa’s open top downdraft gasifiers it was found that
the tar content in the producer gas was in the range of 50~200mg/Nm3.(Dasappa et al,
2004). It is suitable for small scale applications. Sridhar et al (2001) have performed
experimental work into internal combustion engines running in dual fuel mode with
producer gas provided from a downdraft gasifier. An updraft gasifier is a counter-

12
current flow gasifier where by the producer gas exits at the top of the gasifier. Updraft
gasifiers are simple in design and can handle biomass fuels with high ash content.
Despite the simplicity of design and operation of fixed bed gasifiers, fuel
channeling can occur in the reactor, and the temperature distribution is not uniform,
resulting in local hot spots (Warnecke, 2000).
2.2.2 Fluidized Bed Gasifiers
Fluidized bed gasifiers originated from the concept of fluidized bed combustion.
This technology has inert material in the reactor to promote heat transfer efficiency.
The inert material alone will not produce volatile gas and serves as a medium to
increase the rate of reaction with biomass fuels through interaction with the fluidizing
bed material. Some examples of inert bed material used are sand and alumina. The
bed of material is subjected to upward forces of a fluid, normally gases, which will act
against its weight and eventually cause the bed particles to have fluid-like motions,
moving abruptly due to bubbles formed within the bed.
The fluidized bed gasifier has an air distribution plate and has two functions. It
serves as a support to the bed material and also has nozzles or air caps that allow air
to flow into the reactor. Below the air distribution plate is the plenum zone where initial
combustion is performed for gasifier start-up purposes. The by products of combustion
flow through the air distribution plate and into the gasifier, heating up the bed material
and the reactor walls until a certain temperature is reached. Fuel feeding will
commence once the required temperature is reached and the initial combustion
process is halted.

13
Fluidized bed gasifiers are more flexible in the selection of fuel type. It can
gasify various types of biomass without much difficulty and has high carbon conversion
rates as well as high heat transfer rates (Gomez et al, 1995; Murphy, 2001; Warnecke,
2000) which enables this system to handle a larger quantity and lower quality of fuels.
These gasifiers handle smaller fuel particle size compared to the fixed bed gasifiers. A
BFBG utilizes the minimum fluidization velocity of the bed material to achieve
fluidization state. Bubbles are formed within the bed and move upwards toward its
transport disengaging height. The bubbles carry along with it a small portion of bed
material in a portion called ‘wake’, and when it reaches the maximum or transport
disengaging height the bubbles along with the carried material burst through the
surface of the bed and falls downward the gasifier by gravity. When it’s free fall gravity
is balanced by the force of the minimum fluidization velocity, the bed material flow
upwards again along with new bubbles formed. This is a cycle that will happen
throughout the process, thus increasing the mixing efficiency of the bed material, fuel
particles and gasifying agent. This will in turn increase the heat transfer mechanism.
Also due to the fluidization the gasifier is in a ‘boiling’ state, the temperature would be
uniform in the reactor (Cuenca and Anthony, 1995; Warnecke, 2000).
A CFBG uses a velocity higher than the minimum fluidization velocity, and
requires a cyclone separator to transport the elutriated bed material back to the
gasifier. This type of gasifier increases the rate of gasification, has a high conversion
rate of tar and is suitable for large scale power generations. A CFBG system consists
of a gasifier, a cyclone to separate the circulating bed material from the gas, and a
return pipe for circulating the entrained bed material to the bottom part of the gasifier
(Manjunath et al, 2004; Warnecke,2000; Peacocke and Bridgwater, 2000). The gas
velocity is high enough so that the bed particles are conveyed out from the reactor into
the cyclone.

14
The process control mechanism of CFBG is more complex compared to its
bubbling fluidized bed counterpart. However, due to the higher flow rate of air through
the CFBG, it is capable of producing higher amounts of energy compared to the
bubbling fluidized bed. The bubbling fluidized bed’s power output is limited by its
minimum fluidization velocity to maintain the bed in a bubbling fluidization state
(Maniatis, 2005). Figure 2.2 shows the diagram of the BFBG and CFBG. Table 2.1
shows a comparison of the characteristics the four different gasifiers discussed.
Table 2.1: Comparison of the Four Gasifiers (Warnecke, 2000)
Downdraft Updraft BFBG CFBG
Thermal Output Low Low High Higher
Scale-up Potential Low Low High High
Fluidization Agent Velocity N.A. N.A. Low High
Quality of Gas High Low Low Low
Figure 2.2: Diagram of Bubbling and Circulating Fluidized Bed Gasifiers

15
2.3 Industrial Applications and Experiences on Fluidized Bed Biomass
Gasifiers
Commercial scale fluidized bed biomass gasifiers have been built in Finland by
Foster Wheeler. The Lahti power plant built in Finland is an integration of a biomass
gasifier to a coal boiler. It has been in operation since March 1998 and has maintained
stable operation for the main boiler, gas burner and also the gasifier itself. The
maximum power capacity is 167MWe and 240MWth for district heat production. The
circulating fluidized bed biomass gasifier (CFBG) produces up to 70MWth that is co-
fired with coal in the boiler, which gave reduced CO2, SO2 and NOx emissions (Raskin
et al, 1998). The heating value of gas produced is very low especially when the
moisture content of biomass is high. When the moisture content was 50% the heating
value was only 2.2MJ/kg (Nieminen and Kivela, 1998). The energy that the plant has
produced up to the year 2002 is 1700GWh. The average operating temperatures were
between 800˚C-1000˚C. In this system the gas is used back to preheat the fluidization
air to 270°C. The design issues faced by the plant include the fuel feeding method into
the gasifier and also the bed material used. Bed materials and additives used were
sand and limestone (Raskin et al, 1998; Wilén et al, 2004; Hiltunen, 2005).
The Zeltweg power plant is part of the EU-Demonstration Project, BioCoComb,
with a capacity of generating 137MWe stationed in Austria and is surrounded by
sawmills (Granastein, 2002). It has a CFBG with fine sand used as bed material.
Wood chips and bark sawdust were used as biomass feedstock, and the
hydrodynamics of the fluidized bed limits the biomass particles to a maximum size of
30x30x100mm. Although a separator was used it was still unavoidable and oversized
particles were fed as well. The CFBG provides low quality gas to be co-fired with coal
in a boiler and provides 10MW of thermal input. This replaces 3% of coal utilized for
firing the boiler, realizing CO2 emission reduction. No gas cleaning is required for the

16
gas stream as it is passed to the boiler at high temperatures, 850°C, whereby no
hydrocarbons are condensable (Mory and Zotter, 1998). The diagram of the gasifier
and its connection to the boiler is shown in Figure 2.3. Handling of bed material during
the process was incorporated. The system has a water-cooled screw conveyor at the
bottom of the gasifier and was used to handle the discharge of bed and non-
combustible materials to avoid large pressure drop in the gasifier. Ash is transported
with the gas stream out of the gasifier. Sand was not fed into the bed since the
biomass used, bark already contained certain amount of sand.
Figure 2.3: BioCoComb Gasifier and its connection to the boiler, Zeltweg, Austria (Granastein, 2002).
Fluidized bed biomass gasification system has been used to cater cooking gas.
Such implementation is found in rural areas of China (Smeenk et al, 2005). The
fluidized bed gasifier in this project has the blower directly supplying air to the air
distributor, and at the bottom there is a slide gate to collect bed material that passed
through distribution plate and flow to the bottom. The project was based in Leizhuang
village, Henan Province. The schematic of the system is shown in Figure 2.4. The
producer gas calorific value was 5MJ/Nm3, and the reactor is operated one to two

17
hours per day to supply producer gas to 40 households. The gas was stored in a gas
holder. It was reported the gas composition changes over time in the gas holder. Gas
analysis has reported that carbon monoxide increases while hydrogen decreases.
Figure 2.4: Schematic of the gasifier system in the Leizhuang Village (Smeenk et al, 2005)
Pressurized fluidized bed gasifiers can be utilized to drive a gas turbine with
woody biomass as fuel (Kawasaki Heavy Industries, 2004). The gasification process
occurs at a temperature of 650˚C. The generated gas contains combustible gas and tar
and is directed towards a gas turbine combustor while maintaining the temperature and
pressure in order to avoid tar troubles that could occur from solidification and
liquefaction by cooling.
Madsen and Christensen presented results on the Enviropower Pilot Plant in
Tampere, Finland (Madsen and Christensen, 2002) which has a pressurized BFBG
with a nominal input of 15MJ/s and operates up 30bar and temperatures up to 1100˚C.
Tests with straw were carried out in 1994 using 20tonnes of Danish wheat straw and
120tonnes of Colombian coal. The straw particles size range between 30 to 50mm. A
coal-straw ratio of 75/25% was maintained and the bed temperature rose. Bed
instability was observed and at an average bed temperature of 975˚C the temperature
of the lower part of the bed fell rapidly indicating bed sintering. During operation

18
Madsen noted that ash sintering occurs for freeboard temperatures above 850˚C,
followed by a phenomenon where the lower part of the bed suffers rapid bed
temperature decrease. Results have shown that combined straw-coal gasification
process reduces tar content compared to straw gasification only.
The VTT plant in Helsinki (Madsen and Christensen, 2002) consists of a fluidized
bed gasifier with a capacity of 80kg/hr and operating pressure between 3 to 10bar. It
has an inner diameter of 150mm, 250mm inner freeboard diameter, a bed height of
1.2m and a freeboard height of 3.0m. A total of 4600kg of straw and 1350kg of coal
were gasified. Aluminum oxide and dolomite were used as bed material. The
gasification of straw only in the fluidized-bed gasifier is difficult due to sintering. If the
operating temperature were lowered high amounts of tar will be present in the gas.
When coal was added there were no sintering problems as in the Tampere plant,
gasification could be operated with a straw ratio of 50% weight at 940˚C without
sintering. Severe sintering was observed with 25% straw at 30˚C-40˚C higher
gasification temperature.
Coal and catalyst such as dolomite are not added in our study. The sintering and
bed agglomeration problems would be avoided by maintaining the bed temperature
below 900°C.
2.4 Performance Studies of Fluidized Bed Gasifiers
Smeenk and Brown (2005) discussed the results of atmospheric fluidized bed
gasification systems using switch grass. The project involved a bubbling fluidized bed
reactor with 460mm in diameter and 2440mm high built from mild steel, with one inch
of refractory liner that protects the steel and insulates against heat loss. A nominal bed
height of 600mm is used. The material feeding system incorporates a screw conveyor
and a rotary airlock. It has a purge air at the feed end to prevent backflow of producer

19
gases back into the feeding system. Gas analysis was done using a gas
chromatograph (GC) and a Fourier transform infrared spectrometer (FTIR). The
obtained calorific value of for producer gas was 5.22MJ/Nm3.
A study on a fluidized bed in Brazil (Sanchez and Lora, 1994) mentioned the
influence of the bed height on the gasification efficiency, whereby a static bed height of
370-480mm corresponds to an expanded bed height of 600-710mm. The outer
diameter of the gasifier is 250mm and 200mm for internal diameter, and has a height of
2000mm. The brick lining is 25mm thick. Also it was observed that a bed temperature
increase from 740°C to 850°C causes a 3 to 5 fold reduction of tar content. However
the ash content of some biomass types causes low melting points, and therefore it was
necessary to keep the bed temperature between 600°C-800°C to avoid agglomeration
and defluidization. Fine fuel particles are unsuitable for fluidized bed gasifiers as well.
Fine granulometry biomass, such as bagasse, lead to low efficiency values of the
gasifier. This is caused by intensive elutriation and can be mitigated by increasing the
bed height. Also the inconsistency of the fibrous biomass feeder flow capacity affects
the performance of the gasifier adversely.
Performance of fluidized bed gasifiers can be controlled by a parameter known
as air factor or equivalence ratio (ER). A 280kWth fluidized bed gasifier fueled with
bagasse pellets was studied by Gomez et al (Gomez et al, 1999). The gasifier had a
diameter of 417mm and a minimum bed height of 686mm. Air and fuel flow rate was
97.44Nm3/hr and 104.46kg/hr respectively, giving an air-to-fuel ratio of 0.9328. When
the ER was increased the bed temperature increases, while gas sensible heat loss and
heat loss to the environment also increased. Heat loss due to unconverted carbon or
char decreases. Gasifier cold efficiency was highest at 29.2% when the air factor is
0.22. The highest gas to fuel ratio obtained was also at this value of air factor, yielding
1.34kg of gas per kg of fuel showing the highest carbon conversion rate.

20
Another study on fluidized bed gasifiers (Cao et al, 2006) showed that the
maximum cold gas efficiency was obtained at an air-to-wood ratio of 2.557Nm3/kg. The
heating value of gas was 4.911MJ/Nm3 giving a cold gas efficiency of 58%, and
produced 3.266Nm3 of gas per kg of wood. When the air-to-wood ratio was increased
to 3.155 Nm3/kg the LCV decreased to 3.072MJ/m3 with a cold gas efficiency of only
39.1%. The fluidized bed used sand as bed material with an average size of 0.11mm
and a density of approximately 1470kg/m3. Gas compositions and light hydrocarbons
were determined through a gas chromatograph with thermocouple detectors (TCD) and
flame ionization detectors (FID), using Porapak Q, Porapak R and a 5A molecular
sieve column. The maximum concentration of fuel gas was reported to be 9.27%,
9.25%, and 4.21% for H2, CO and CH4 respectively, which gave a heating value of
3.67MJ/m3. The maximum carbon efficiency was 87.1%,
It is apparent from the two studies above that the air flow rate and biomass flow
rate determines the performance of the system. The two parameters are presented by
the ER and the optimum value differs with different gasifiers. It is the interest of this
study to obtain the optimum ER where the gasifier operates at maximum efficiency.
The effect of different types of gasifying agents on the product output of a
BFBG was investigated by Gil et al (1999). Air, steam and O2-steam mixtures were
used in the study. It was found that the use of steam increased the production of
hydrogen and gave a maximum concentration in the range of 53 to 54%. Oxygen-
steam mixture decreased the hydrogen production, but gave maximum concentrations
of carbon monoxide, in the range of 43 to 47%. The lower calorific value (LCV) was
higher for steam and O2-steam mixtures, in the range of 12.5 to 13.3MJ/m3 compared
to air gasification, with the values being in the range of 4.5 to 6.5MJ/m3. However, the
usage of steam and oxygen-steam mixtures increased the tar yield. Char yield was

21
also higher compared to air gasification, indicating inefficient conversion of char into
producer gas.
Another study on BFBG was concentrated on generation and conversion of fine
carbonaceous particles (Miccio et al, 1999). The fuel or biomass particles are
fragmented once it comes in contact with the bed material. Mechanical abrasion and
attrition reduces the fragmented particles further. Finally fines are generated through
percolative formation, caused by internal porosity of the char particles. In biomass
gasification, percolative formation plays an important in fines generation compared to
coal as the char porosity is larger than that of coal (Miccio et al, 1999), giving biomass
char higher reactivity and a shorter reaction time. The BFBG used had a bed zone ID
of 108mm, a freeboard ID of 125mm and a total height of 2.8m. Particles collected from
the freeboard section and reactor exit were examined to have large pores and irregular
shapes, similar to fibrous structure of biomass fuel. At a reactor height of 1.2m the
particles have an average size of 300µm, and it reduces to 200µm above 1.2m. Overall
the size of particles decreases with increasing bed height. This showed that carbon
conversion efficiencies increased with reactor height and ER, mostly through
percolative fragmentation since no bed material is present above the bed section. CO2,
CH4 and H2 concentration was found to increase slightly with reactor height, while CO
maintain fairly constant.
The influence of operating temperature on the dense phase properties of a
bubbling fluidized bed was investigated by Formisani and co workers (2002). It listed
the various parameters that were affected by an elevated temperature ranging from
200 to 800˚C. The dense phase voidage which is the void fraction of the solid phase in
the bed during operation increases with increasing temperature, while the minimum
fluidization velocity decreases till a minimum level before increasing back again. The
increase in these two parameters showed that there is an increase in inter-particle

22
forces, which give the solid the ability to form a progressively looser fixed structure.
The increase in the minimum fluidization velocity is produced by a variation in dense
phase voidage, density and viscosity of the fluidizing gas.
2.5 Process Issues
2.5.1 Tar
Tar is defined as a complex mixture of condensable hydrocarbons by Biomass
Technology Group (BTG, 2004), while Dayton (Dayton, 2002) mentioned that tars are
condensable fractions of the gasification products and consists mostly of polycyclic
aromatic hydrocarbons (PAH), including benzene. Operational issues associated with
tar during operation of fluidized bed gasifiers were highlighted as well (Van Paasen et
al, 2004). It produced “tar-water mixtures” which were difficult to handle besides
causing fouling and plugging in the system. In a separate system developed by Rabou
at the Energy Research Centre of Netherlands (Rabou, 2005) such mixtures were
collected from an electrostatic precipitator (ESP) and was injected into a screw feeder
to recycle the tar back into the CFBG for conversion. The operating temperature of the
CFBG was difficult to maintain following this action.
For thermal cracking of tar the residence time of gas in the reactor played an
important role in ensuring the tar content was lowered. If the residence time is 1.3s the
temperature has to be 900°C; if it is 4s the temperature can be maintained at 850°C
(Van Paasen and Kiel, 2004). Rabou however mentioned that the reactivity differs
according to the tar composition (Rabou, 2005).
Catalytic cracking showed good tar conversion as reported by Zhang et al
(2004) but the cost of replenishing the catalyst, dolomite in the fluidized bed would not
be economical and disposal of the spent catalyst presents another issue (Corella et al,
2006). The system in the Battelle Columbus Laboratory (Craig and Mann, 1996) used a

23
fluidized bed reactor with char from the gasifier as bed material operating at a
temperature of 900°C to convert the tar and uses steam as gasification agent.
Cao (Cao et al, 2006) demonstrated that injecting secondary air with assisting
fuel gas into the freeboard region was able to decompose tar components. The re-
circulated fuel gas would be combusted by secondary air to increase the freeboard
temperature. Tar content was significantly reduced when freeboard temperature was
above 850˚C while the bed temperature was only 650˚C. The injection of secondary air
did not introduce additional nitrogen that would dilute the gas and decrease its calorific
value, which was reported to be about 5MJ/m3 at an air-fuel ratio of 2.4Nm3/kg and
assisting fuel gas-biomass ratio of 0.475Nm3/kg. Injection of steam and carbon dioxide
into the freeboard, aimed to promote production of hydrogen and carbon monoxide
respectively, caused the temperature to drop as it initiates endothermic reactions. This
drop in temperature would increase the tar content and would not be feasible.
A modeling work was done to determine experimental conditions that would
yield clean producer gas from fluidized bed gasifiers (Corella et al, 2006). The authors
targeted 2g/m3 as the limit for the tar content of gases, as only below this limit the coke
formation on catalysts surface can be removed through gasification. The biomass used
was pine wood chips with particle size of 1.0 to 4.0mm. This species of wood contained
low potassium and sodium content (Corella et al, 2006). The bed material consists of
80% silica sand and 20% calcined dolomite, a type of catalyst that converts tar. The
flow used inside the gasifier was modelled to be piston or slugging flow, as bubbling
and channeling flow would cause high tar contents. The parameters varied were
secondary air flow rate and the position of injection. When the secondary air flow was
10 to 30% of the total air flow tar content was below 2g/m3, with the bed temperature at
860-905˚C and the dilute zone at 925-1030˚C. However as the secondary air flow was
increased further the primary air flow decreases, causing the bed temperature to

24
decrease and increase the tar content. The tar content increased when the injection
point height was increased since there is not enough residence time for the tar to react.
2.5.2 Gas Cleaning Methods
The producer gas from the fluidized bed reactor will be laden with particulates,
moisture and tar which needs to be removed for certain applications. Current gas
clean-up technologies used such as in coal power plants or cement plants are able to
perform this duty. Cyclones are the most common particulate collection devices with
removal efficiencies of more than 90% for mean particle sizes of more than 10μm.
Fabric filters can be used to remove particles with diameter less than 10μm. Wet ESP
have the highest removal efficiencies and can operate at high temperatures of 700°C
and are meant to collect aerosols, which has a mean particle size of 0.1 to 1.0μm
(Rezaiyan and Cheremisinoff, 2005). An ESP is a device that uses electrical principles
to remove particles by charging them when they pass through a corona or a flow region
of gaseous ions. The electrical system requires converting industrial alternating
currents to pulsating direct currents at high voltages, ranging from 20kV to 100kV as
required (Rezaiyan and Cheremisinoff, 2005). This method was not considered for
application in this project due to its safety risks.
Some experimental work has been done to cater gas cleaning for application of
producer gas in internal combustion (IC) engines. As the producer gas needs to have
particle content lower than 50mg/m3 and tar content lower than 100mg/m3 for IC engine
applications (Hasler and Nusshaumer, 1999; Rezaiyan and Cheremisinoff, 2005),
several technologies are available to reduce particle and tar content. High particle
removal efficiencies were obtained from wet ESP, rotary atomizers and sand bed
filters. Fabric filters did not perform well and actually increased the tar content at of the
gas at the outlet, possibly due to adsorption from polymerized tar on the filter. Basically
high particle reduction efficiencies utilizing current available technologies could be