characterization and remediation of a brownfield site: the bagnoli … · chapter fifteen...
TRANSCRIPT

C H A P T E R F I F T E E N
Characterization and Remediation
of a Brownfield Site: The Bagnoli
Case in Italy
Benedetto De Vivo* and Annamaria Lima*
Contents
1. Introduction 356
2. Environmental Remediation of the Brownfield Site 357
3. Geological Settings of the Bagnoli–Fuorigrotta Area and Stratigraphy of the
Brownfield Site 358
4. Potential Sources of Anthropogenic Pollution 360
5. Hydrogeological Characteristics of the Bagnoli–Fuorigrotta Plain 361
6. Site Characterization 362
6.1. Monitoring: Phases I and II 362
6.2. Chemical analysis 364
6.3. Statistical analysis 364
6.4. Monitoring of groundwater 368
7. Natural and Anthropogenic Components for the Pollution 373
8. Chemical–Structural Characterization of Waste Material and
Leachability Tests 376
9. Asbestos Characterization and Remediation 377
10. Preliminary Operative Remediation Plan 377
11. Securing the Site 382
Acknowledgments 383
References 384
Abstract
This chapter documents the case history of the Bagnoli brownfield site government
remediation project, which is still in progress, being in the remediation phase. The site
was the second largest integrated steelworks in Italy and is located in the outskirts of
Naples, in an area that is part of the quiescent Campi Flegrei (CF) volcanic caldera.
Hundreds of surficial and deep boreholes have been drilled, with the collection of
about 3000 samples of soils, scums, slags, and landfill materials. In addition, water
samples from underground waters have been collected. The samples have been chemi-
cally analyzed for inorganic and organic elements and compounds, as required by Italian
Environmental Geochemistry # 2008 Elsevier B.V.
DOI: 10.1016/B978-0-444-53159-9.00015-2 All rights reserved.
* Dipartimento di Scienze della Terra, Universita di Napoli, Federico II, 80134 Napoli, Italy
355

Environmental Law DLgs 152/2006. In general, heavy metal enrichments in the cores and
water suggest mixing between natural (geogenic) and anthropogenic components. The
natural contribution of volcanically related hydrothermal fluids to soil pollution, in
addition to the non bioavailability of metal pollutants from industrial materials, indicate
that heavy metal remediation of soils in this area would be of little use, because
continuous discharge from mineralized hydrothermal solutions would cancel out any
remediation effort. The real pollution to be remediated is the occurrence of polycyclic
aromatic hydrocarbons (PAH) distributed in different spots across the brownfield site, but
mostly in the area sited between two piers along the shoreline that is filled with slag,
scum, and landfill material.
1. Introduction
The Campi Flegrei (CF) volcanic system can be considered a part of the city ofNaples. In the CF area and, in particular, in Bagnoli, industrialization and urbaniza-tion processes fostered in the last century by the ILVA, Eternit, Cementir, andFederconsorzi industrial factories and plants boosted social and economic develop-ment. However, the products and by-products of those processes also alteredsensitive natural equilibria and compromised the local environment.
The dismantling of the industrial complexes had a strong social impact on the cityof Naples. After all industrial activities ceased, monitoring the area and assessing therequirements for site remediation became a priority. The Italian government fundedthe remediation plans with two specific Laws (N. 582—18/11/1996 and N. 388—23/12/2000) for the purpose of reusing the areas of ILVA and Eternit for nonindus-trial activities. The area of the Federconsorzi has been acquired by the IDISfoundation to build the ‘‘City of Science,’’ while the area occupied by Cementirhas not been dismantled yet. The work on the brownfield sites concerned both thedismantling of the factories and the environmental remediation of the area, both ofwhich are required before a new future for this site can be planned.
Considering that industries were present in the area for a century, it was reasonableto expect that most of the pollution originated from their activities. The majorpollutants would have been expected to be metals derived from the combustion offossil fuels, industrial waste, dumps, slag, and scum, and similar industrial wastes.However, Bagnoli is located inside an active volcanic field characterized by a stronggeothermal activity that generates ascending hydrothermal fluids rich in heavymetals.Thus, we hypothesize that the brownfield site represents an overlap between twocontamination components, one natural (originating from the CF hydrothermalactivity) and the other anthropogenic (from the industrial activity).
Hydrothermal activity associated with volcanism introduces into the environ-ment high quantities of heavy metals, and in some cases, this activity can evenproduce ore deposits. Classic examples are porphyry copper and epithermal golddeposits (Bodnar, 1995; Hedenquist and Lowenstern, 1994). For the Bagnoli area,this scenario is confirmed both by research carried out on the waters in front ofBagnoli (Damiani et al., 1987; Sharp and Nardi, 1987) and by recent studies
356 Benedetto De Vivo and Annamaria Lima

highlighting the existence in the CF, at Vesuvius, and in the Pontine Islands, ofhydrothermal fluids similar to those found in porphyry copper systems (Belkin et al.,1996; De Vivo et al., 1995, 2006; Fedele et al., 2006; Tarzia et al., 1999, 2002).
2. Environmental Remediation of the Brownfield Site
The aim of the remediation plan launched by the Government (CIPEResolution 20.12.94) was to eliminate the environmental risk due to former indus-trial activity, and to recover the land to make it usable for a new and different use, inaccordance with the new urban development plans of the Naples City Council. Theproject called for dismantling of plants and structures and subsequent removal ofpollutants by means of appropriate actions of environmental recovery.
The reclamation of the industrial area will prepare the Bagnoli area for thebuilding of an urban park (included in the urban development plan for the city’seastern sector), which will represent a tangible sign of the environmental recovery ofthe area. The park will also preserve some structures as a memento of the industrialhistory of the area.
The Naples City Council, in agreement with the Sovrintendenza ai BeniCulturali, will recover and preserve 16 structures to represent the former industrialactivities (Industrial Archaeological Site), while the original CIPE plan would havepreserved only few buildings (up to a volume of 192,000 m3) to be used for townbusiness. The remediated areas will be the ILVA steel plant (1,945,000 m2, produc-tion stopped in 1991) and the Eternit concrete-asbestos factory (157,000 m2, pro-duction stopped in 1985) (Fig. 15.1).
Steel-work
Eternit
S
N
WE
Ilva
Cementir
Idis
Scraparea
Fossilarea
Cokery
Agglomeration areaMineralsarea
Ilva
Figure 15.1 Map of the Bagnoli brownfield site.
Characterization and Remediation of a Brownfield Site 357
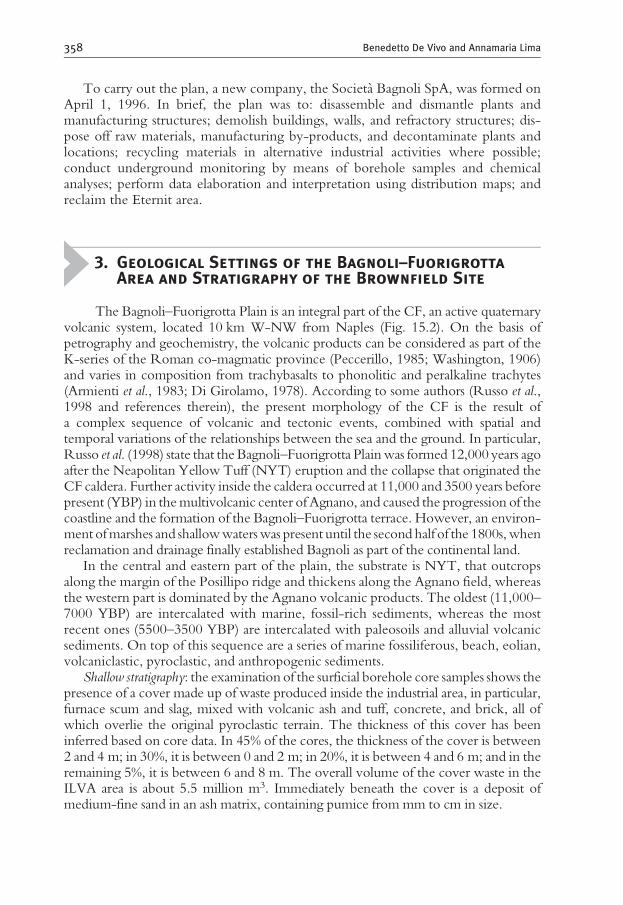
To carry out the plan, a new company, the Societa Bagnoli SpA, was formed onApril 1, 1996. In brief, the plan was to: disassemble and dismantle plants andmanufacturing structures; demolish buildings, walls, and refractory structures; dis-pose off raw materials, manufacturing by-products, and decontaminate plants andlocations; recycling materials in alternative industrial activities where possible;conduct underground monitoring by means of borehole samples and chemicalanalyses; perform data elaboration and interpretation using distribution maps; andreclaim the Eternit area.
3. Geological Settings of the Bagnoli–Fuorigrotta
Area and Stratigraphy of the Brownfield Site
The Bagnoli–Fuorigrotta Plain is an integral part of the CF, an active quaternaryvolcanic system, located 10 km W-NW from Naples (Fig. 15.2). On the basis ofpetrography and geochemistry, the volcanic products can be considered as part of theK-series of the Roman co-magmatic province (Peccerillo, 1985; Washington, 1906)and varies in composition from trachybasalts to phonolitic and peralkaline trachytes(Armienti et al., 1983; Di Girolamo, 1978). According to some authors (Russo et al.,1998 and references therein), the present morphology of the CF is the result ofa complex sequence of volcanic and tectonic events, combined with spatial andtemporal variations of the relationships between the sea and the ground. In particular,Russo et al. (1998) state that the Bagnoli–Fuorigrotta Plainwas formed 12,000 years agoafter the Neapolitan Yellow Tuff (NYT) eruption and the collapse that originated theCF caldera. Further activity inside the caldera occurred at 11,000 and 3500 years beforepresent (YBP) in themultivolcanic center of Agnano, and caused the progression of thecoastline and the formation of the Bagnoli–Fuorigrotta terrace. However, an environ-ment ofmarshes and shallowwaterswas present until the secondhalf of the 1800s,whenreclamation and drainage finally established Bagnoli as part of the continental land.
In the central and eastern part of the plain, the substrate is NYT, that outcropsalong the margin of the Posillipo ridge and thickens along the Agnano field, whereasthe western part is dominated by the Agnano volcanic products. The oldest (11,000–7000 YBP) are intercalated with marine, fossil-rich sediments, whereas the mostrecent ones (5500–3500 YBP) are intercalated with paleosoils and alluvial volcanicsediments. On top of this sequence are a series of marine fossiliferous, beach, eolian,volcaniclastic, pyroclastic, and anthropogenic sediments.
Shallow stratigraphy: the examination of the surficial borehole core samples shows thepresence of a cover made up of waste produced inside the industrial area, in particular,furnace scum and slag, mixed with volcanic ash and tuff, concrete, and brick, all ofwhich overlie the original pyroclastic terrain. The thickness of this cover has beeninferred based on core data. In 45% of the cores, the thickness of the cover is between2 and 4 m; in 30%, it is between 0 and 2 m; in 20%, it is between 4 and 6 m; and in theremaining 5%, it is between 6 and 8 m. The overall volume of the cover waste in theILVA area is about 5.5 million m3. Immediately beneath the cover is a deposit ofmedium-fine sand in an ash matrix, containing pumice frommm to cm in size.
358 Benedetto De Vivo and Annamaria Lima

Deep stratigraphy: Six deep boreholes (down to 50 m below the surface) allowedreconstruction of the deep structure of the area (Fig. 15.3). Four horizons (R, A, B,and C) were identified. Horizon R has a thickness that varies from 3 to 11 m, madeup of a cover of anthropogenic debris and reworked pyroclastics. Horizon A has avariable thickness ranging from 4 to 10 m, made up of a coarse, ash-rich pyroclasticdeposit (with a granulometry of medium- to very fine sand). Horizon B, classified as
Pozzuoli bay
0 1 km
0
Agnano
N
1 2 3 4 5 6 7 8
12 13 14 15 16 17 18 19
9 10 11
N
Astroni
3 km
Posilli
po
Bagno
li
fuorig
rotta
Figure 15.2 Volcanic and tectonic sketch of the Campi Flegrei (CF) and Bagnoli–FuorigrottaPlain and location of fumaroles and hot springs (after Russo et al., 1998, modif.). (1) Post–Romanage lacustrine and palustrine sediments; (2) volcanics and volcaniclastics (2500 YBP-recent);(3) volcanics and volcanoclastics (5500–3500YBP); (4) pyroclastics of Agnano volcanic field (4000–3500YBP); (5) S.Teresavolcanics (5500–3500YBP); (6) pyroclastics andvolcanicbreccias ofMonteSpina-Agnano eruption (ca. 4400 YBP); (7) pyroclastics of Cella-Monte S. Angelo unit (5500–5000YBP); (8) Yellow Tuff of Nisida; (9) Yellow Tuff of La Pietra; (10) volcanics of the NYT (12,000YBP); (11) Neapolitan YellowTuff (NYT) (12,000 YBP); (13) stratified YellowTuffs of Coroglio-Trentaremi (pre-12,000 YBP); (14) recent and historic volcanic debris; (15) volcano-tectonic lines;(16) faults; (17) post-caldera volcano-tectonic collapse; (18) vents (from Tarzia et al., 2002).
Characterization and Remediation of a Brownfield Site 359

a medium to very coarse sand, has an average thickness of 30 m and comprisesdifferent formations. Pumice and lithic lapilli can be found in the matrix, whereasthe basal part contains gravel levels with light and dark clasts. Horizon C is a cineriticbed found at 40 m depth, classified as a fine sand-silt.
4. Potential Sources of Anthropogenic Pollution
Possible pollution sources in the area include dust, ash, scum, slag, carbon cokeresidues, minerals, heavy oils, hydrocarbons, and combustion residues. The mineralsused to produce cast iron and steel were imported mainly from Africa (Liberia andMauritania), Canada, India, the former USSR, and from the American Continent(L’Industria Mineraria, 1979a).
The coal used as source of energy in smelting furnaces was imported mainly frommines of the eastern USA (Appalachian Basin) (L’industria Mineraria, 1979b). Thescum (also known as dross), a by-product of cast iron manufacturing, resulted frommelting of limestone and coke ash with the aluminosilicate gangue left over afteriron reduction and separation. Slag is a by-product of steel manufacturing that resultsfrom oxidation of impurities and compounds generated from inert additives presentin the charges. The use of fossil fuels (gasoline) produces many atmospheric
LegendAnthropogenic debris & reworked pyroclastics
Coarse, ash-rich pyroclastic
Cineritic bed, fine sand & silt
R
121086420
−2
−10
−20
−30
−40
R
A
B
C
A
R
B
B
A
R
B
A
RR
B
A
R
B
B
B
B
B
B
A
R
B
B
B
B
C
B
C
meterss.l.m
Medium to very coarse sand, differentformations
RAB
C
Figure 15.3 Schematic diagram of the stratigraphy of the Bagnoli brownfield site from deepboreholes.
360 Benedetto De Vivo and Annamaria Lima

pollutants, including Pb, which can be found in atmospheric particulates in form ofoxides, carbonates, and sulfides. Most of the Italian production of additives for fuelsis a monopoly of the British Associated Octel (AOC) and its Italian subsidiarySocieta Italiana Additivi Carburanti (SIAC), which use Pb from Broken Hillmines (Australia), and from South Africa, Peru, Mexico, and Italy (Magi et al.,1975; Monna et al., 1999).
5. Hydrogeological Characteristics of
the Bagnoli–Fuorigrotta Plain
In the Bagnoli–Fuorigrotta area, the water table is found slightly above meansea level, and can be intercepted at shallow depths, especially south of the rail-road (Fig. 15.4). The groundwater of the plain, resupplied directly by rainfall, is partof a wider groundwater body which spans the whole CF area and discharges di-rectly to the sea. Detailed hydrogeological investigation carried out by the ‘‘ServizioUrbanistica del Comune diNapoli,’’ in accordance with Italian Law 9/83, showed thatgroundwater composition of the CF system falls in the Na–Cl and Na-bicarbonatefield, while along the coastline, the composition is mainly in the Na–Cl field.
The CF groundwater is affected by anthropogenic pollution from urban andindustrial pollution; urban groundwater pollution typically contains nitrateswhereas industrial groundwater pollution typically contains heavy metals and hydro-carbons. It is important to recognize the contamination produced by the upwelling
0 200 600 1000 m
N
PO
SI
LL
IP
O
Figure 15.4 Morphology of the piezometric surface obtained from both surface and deepboreholes piezometers.
Characterization and Remediation of a Brownfield Site 361
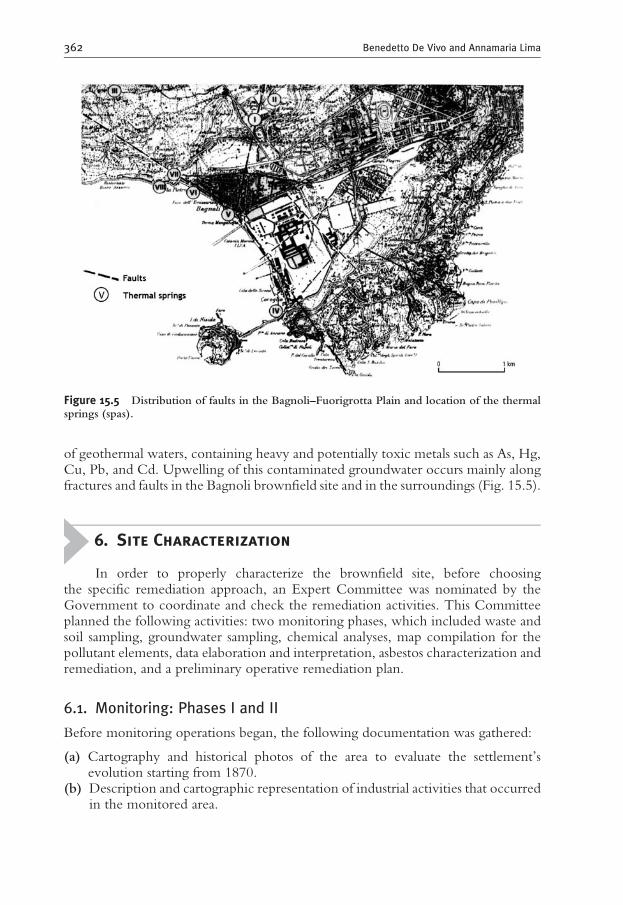
of geothermal waters, containing heavy and potentially toxic metals such as As, Hg,Cu, Pb, and Cd. Upwelling of this contaminated groundwater occurs mainly alongfractures and faults in the Bagnoli brownfield site and in the surroundings (Fig. 15.5).
6. Site Characterization
In order to properly characterize the brownfield site, before choosingthe specific remediation approach, an Expert Committee was nominated by theGovernment to coordinate and check the remediation activities. This Committeeplanned the following activities: two monitoring phases, which included waste andsoil sampling, groundwater sampling, chemical analyses, map compilation for thepollutant elements, data elaboration and interpretation, asbestos characterization andremediation, and a preliminary operative remediation plan.
6.1. Monitoring: Phases I and II
Before monitoring operations began, the following documentation was gathered:
(a) Cartography and historical photos of the area to evaluate the settlement’sevolution starting from 1870.
(b) Description and cartographic representation of industrial activities that occurredin the monitored area.
Figure 15.5 Distribution of faults in the Bagnoli–Fuorigrotta Plain and location of the thermalsprings (spas).
362 Benedetto De Vivo and Annamaria Lima

(c) Maps of the main foundation work.(d) Maps of the sewer system.(e) Results of former environmental investigations carried out in the area (e.g., soil,
groundwater, air analysis).(f ) Geotechnical and stratigraphic reports made during plant construction.(g) Report on raw materials and products still present and stored in the area,
including information about location, quantity, composition, and their likeli-hood of dispersal in the environment.
(h) Results of geological and hydrogeological investigation, with particular atten-tion to shallow and deep groundwater.
After obtaining documentation during the preliminary phase, a full-scale inves-tigation was planned in the entire ILVA and Eternit area to locate and define allpolluted areas. The investigation was divided in two phases: Phase I was a prelimi-nary general survey and Phase II focused on details from the results of Phase I.
During Phase I, data were collected from shallow boreholes to 5 m, the depth ofthe local water table, using a 100 m � 100 m grid and sampling at 0.5, 1.5, 3.0, and5.0 m depths. Six additional deep boreholes were drilled to 50 m, or alternatively tothe deep groundwater table, whichever came first. Activities in Phase II were basedon the results of the chemical analyses collected on Phase I samples. For Phase II, a25 m � 25 m sampling grid was used in the polluted areas, and a 50 m � 50 m gridin all the others. The use of the regular grid method in site characterization isdictated in Italy by Law 152/2006; therefore, it was not possible to use a samplingmethod such as the random stratified sampling method, which would have been moreappropriate.
To establish the values for natural background to be used as reference formaximum natural concentrations, samples were also taken outside the brownfieldsite, including 2 deep boreholes in Agnano and Fuorigrotta areas and shallowboreholes in 10 locations in the CF.
During Phase I, a geological survey was carried out from November 1997 toApril 1998 at the brownfield site (ILVA and Eternit areas). During the survey,shallow and deep cores were collected; reworked and undisturbed soil was sampled;and groundwater samples were collected. In addition, a detailed geophysical surveywas undertaken to establish a terrain lithostratigraphy, to determine the mechanicalproperties of the terrains, and to map the water table.
Specifically, the following investigations were carried out:
(a) Drilled six, piezometer-equipped deep boreholes, up to 50 m below thesurface.
(b) Drilled two deep boreholes, outside the industrial area, up to 50 m below thesurface.
(c) Drilled 207 shallow boreholes down to the water table, with an average depth of3 m. Twenty-four boreholes were equipped with piezometers.
(d) Collected 905 samples (waste and reworked soil), of which 621 were analyzed.(e) Collected 28 undisturbed soil samples, which were probed for geotechnical
properties in laboratory.(f ) Performed 28 standard penetration tests (SPT) during core collection.
Characterization and Remediation of a Brownfield Site 363

(g) Conducted a dipolar geoelectric survey (Eternit area).(h) Performed a Georadar survey (Eternit area).(i) Geographically referenced all surveyed sites.
A total of 20,751 chemical analyses for inorganic and organic elements andorganic compounds were carried out on collected samples.
Based on the analytical results gathered during Phase I, a second survey wasplanned and carried out in the ILVA steel brownfield site. During Phase II,additional cores were collected, with shallow boreholes down to the water table,using a 50 m� 50 m and a 25 m� 25 m grid. The wider grid was used in those areasthat, based on the results of Phase I, proved to be nonpolluted, whereas the 25 m �25 m grid was used in the polluted areas.
Phase II started on May 31, 1999, and was completed by October 15, 1999. Thefollowing activities were carried out:
(a) Collected 2089 core samples.(b) Collected 5976 samples (3586 samples to be analyzed for metals and 2390 for
organic compounds).
A total of 73,219 analyses were carried out on the collected samples.
6.2. Chemical analysis
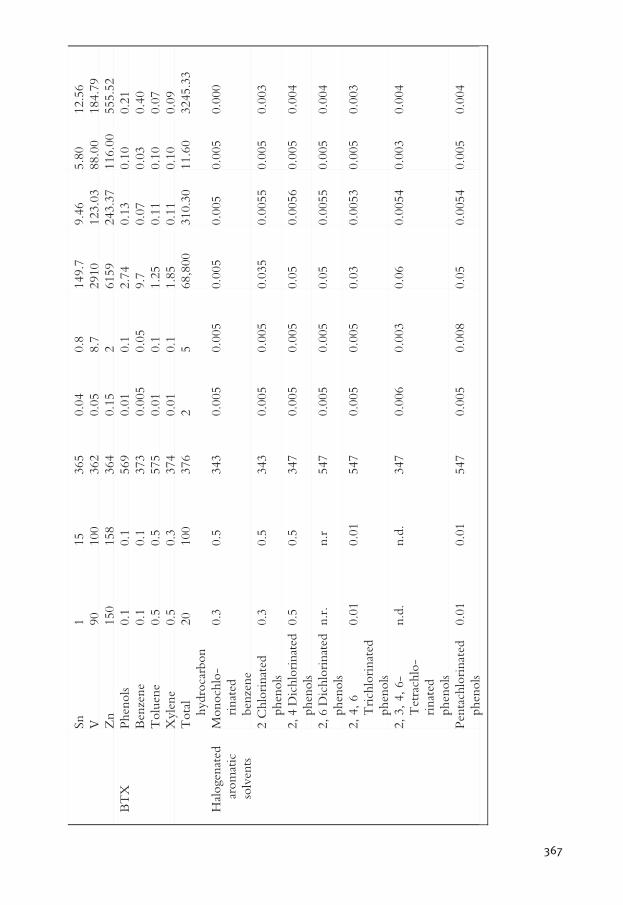
The chemical analyses carried out are indicated in Table 15.1. Analytical resultsproduced by the Bagnoli SpA underwent quality controls through use of interna-tionally recognized control standards and duplicated analysis of 5% of the samples atrandom. Duplicate analysis of 5% of the samples were performed at the BritishGeological Survey Laboratories.
6.3. Statistical analysis
Table 15.2 shows the univariate statistical parameters for all the elements, metallicand organic. Environmental Law DLgs 152/2006 not only sets the trigger andaction limits, but it also states that these limits can (and should) be modified as afunction of local background levels. Accordingly, the Expert Committee recom-mended that sampling be carried out outside the Bagnoli area on sites with the samegeolithological characteristics. The Bagnoli SpA collected these samples insidethe CF volcanic system. Table 15.3 shows the statistical parameters related to thesesamples.
Reference background values were established using cumulative frequencydistribution curves. Following standard recognized procedures, the backgroundlimits were fixed, on a case-by-case basis, on average between the 70th and 90thpercentiles.
Using the limits set using the above mentioned procedures, the Bagnoli SpAcompiled distribution maps of all inorganic and organic chemical analyses. Only thedistributions for some of the chemical parameters, which were found to exceedregulatory limits for a high percentage of the investigated sites, are shown here.
364 Benedetto De Vivo and Annamaria Lima

Figs. 15.6A, 15.6B, 15.7A, and 15.7B show As and polycyclic aromatic hydrocarbon(PAH) distributions detected in Phase II, based on 25 m � 25 m and 50 m � 50 mgrids.
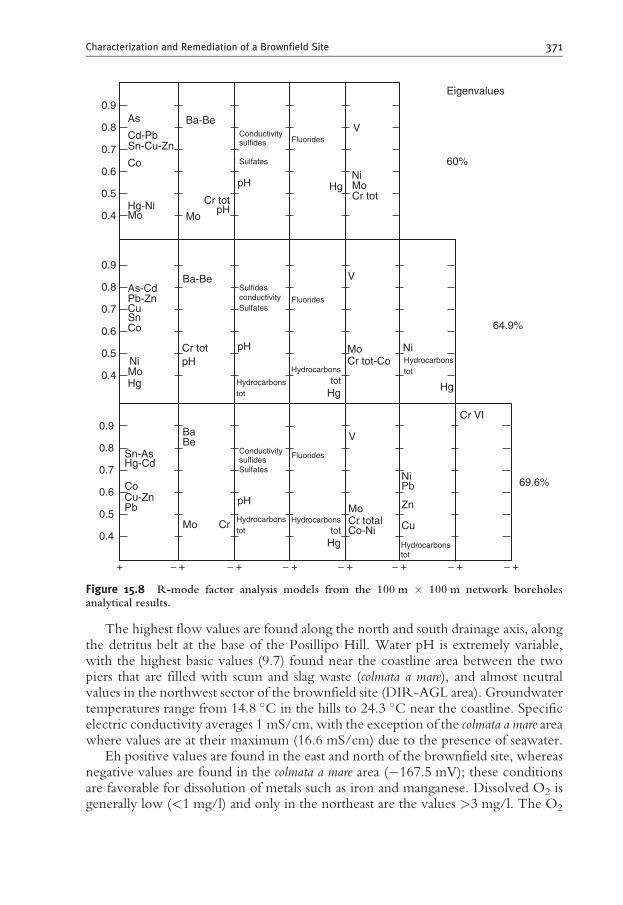
In addition to univariate statistical analysis, the data were also examined bymeans of multivariate statistical techniques. In particular, R-mode factor analysiswas used, which is a very effective tool to interpret anomalies and to help identifytheir sources. Factor analysis allows grouping of anomalies by compatible geochem-ical associations from a geologic-mineralogical point of view, the presence ofmineralizing processes, or processes connected to the surface environment.Based on this analysis, six meaningful chemical associations were identified(Fig. 15.8).
The weight of each single association is quantified for every sampled site usingthe factor scores distribution. By associating the factor score distribution withlithologies, anthropogenic activities, or other characteristics, it is possible to establisha relationship between a particular association and a possible source. However, it isnot useful for defining the trigger and action limits as provided in the guidelinesprovided by the Ministry of Environment (DLgs 152/2006).
Table 15.1 Analyses carried out at Bagnoli brownfield site
General and anions Metals Organics
Conductivity
(mS/cm)
As, Ba, Be, Cd,
Co, CrVI, Cu, Hg,
Mn, Mo, Ni, Pb,
Sn, Th, U, V, Zn
Total hydrocarbons as N-heptane
Sulfides Aliphatic halogenated solvents
(1–2 dichloroethane, 1–1-1
trichloroethane
(trichloroethylene)
Fluorides Nonhalogenated aromatic solvents
(benzene; phenols; BTX)
Free cyanides Aromatic halogenated solvents
(monochlorinated benzene;
chlorinated phenols)
Complex cyanides Polycyclic aromatic hydrocarbons
(PAH) (benzo(a)anthracene,
benzo(a)pyrene, benzo(b)
fluorantene, benzo( j)fluorantene,
benzo(k)fluorantene, pyrene,
naphthalene, anthracene,
fenantrene, fluorantene)
Elemental sulfur Polychlorinated biphenyls (PCB)
Sulfates Dioxins
Asbestos Pesticides and phytopharmaceuticals
(DDT)
Characterization and Remediation of a Brownfield Site 365

Table
15.2
Statisticalparameters
oftheanalyticaldata
from
theborehole
samplesofthephase
Imonitoringusinga100m
�100m
netw
ork
(statistics:
all
lithologies)
Param
eters
D.M
.471/99
residential
use
(mg/kg)
Background
values
(mg/kg)
Analysis
number
Detection
limit
(mg/kg)
Min
(mg/kg)
Max
(mg/kg)
Mean
Median
Standard
deviation
pH
—576
5.5
12.8
9.39
9.15
1.38
EC
—576
3.2
23,500
835.36
366.50
1836.93
Inorganic
compounds
Sulfides
—576
10
4920
95.30
15.00
390.48
Sulfates
—575
522,318
655.65
133.00
1567.19
Fluorides
—575
11
182
11.34
9.75
11.61
Freecyanides
1574
11
31.00
1.00
0.08
Complex
cyanides
—374
11
10.8
1.03
1.00
0.43
Sulfur
—525
100
100
612
103.36
100.00
33.62
Asbestos
100
399
Notpresent
Heavymetals
As
20
36
365
0.04
1.4
292.2
29.28
19.60
32.32
Ba
——
363
0.07
10
1570
674.07
713.00
342.05
Be
212
365
0.03
0.2
12
4.53
4.80
2.07
Cd
22
365
0.02
0.02
12.6
0.57
0.20
1.20
Co
20
35
364
0.05
0.3
102
10.10
720
10.40
Crtotal
150
150
365
0.1
21380
68.88
25.00
134.97
CrVI
2—
365
53
55.00
5.00
0.00
Hg
11
364
0.04
0.02
20
0.54
0.20
1.62
Mo
——
365
0.03
0.1
14.4
3.27
3.20
1.40
Ni
120
120
364
0.1
1.3
904
24.26
12.00
60.43
Pb
100
110
365
0.5
11440
97.79
62.00
154.52
Cu
120
120
365
0.1
4644
56.58
33.00
69.19
366
Sn
115
365
0.04
0.8
149.7
9.46
5.80
12.56
V90
100
362
0.05
8.7
2910
123.03
88.00
184.79
Zn
150
158
364
0.15
26159
243.37
116.00
555.52
BTX
Phenols
0.1
0.1
569
0.01
0.1
2.74
0.13
0.10
0.21
Benzene
0.1
0.1
373
0.005
0.05
9.7
0.07
0.03
0.40
Toluene
0.5
0.5
575
0.01
0.1
1.25
0.11
0.10
0.07
Xylene
0.5
0.3
374
0.01
0.1
1.85
0.11
0.10
0.09
Total
hydrocarbon
20
100
376
25
68,800
310.30
11.60
3245.33
Halogenated
aromatic
solvents
Monochlo-
rinated
benzene
0.3
0.5
343
0.005
0.005
0.005
0.005
0.005
0.000
2Chlorinated
phenols
0.3
0.5
343
0.005
0.005
0.035
0.0055
0.005
0.003
2,4Dichlorinated
phenols
0.5
0.5
347
0.005
0.005
0.05
0.0056
0.005
0.004
2,6Dichlorinated
phenols
n.r.
n.r
547
0.005
0.005
0.05
0.0055
0.005
0.004
2,4,6
Trichlorinated
phenols
0.01
0.01
547
0.005
0.005
0.03
0.0053
0.005
0.003
2,3,4,6-
Tetrachlo-
rinated
phenols
n.d.
n.d.
347
0.006
0.003
0.06
0.0054
0.003
0.004
Pentachlorinated
phenols
0.01
0.01
547
0.005
0.008
0.05
0.0054
0.005
0.004
367

6.4. Monitoring of groundwater
During both Phases I and II, 71 piezometers were installed to monitor groundwater.A total of 221 water samples were collected and 9463 analyses were carried out. Sevenfield surveys sampled shallow and deep groundwater, analyzing various physicochemi-cal parameters (e.g., pH,Eh, dissolvedO2, temperature, conductivity), and the presenceof potentially harmful elements and compounds (e.g., heavy metals, hydrocarbons,PAH). The hydrogeological survey carried out by the Bagnoli SpA, concluded that
(a) The aquifer is made up of different sub-horizontal levels, each with its ownlithology and particle size (resulting in different permeabilities). This produces alayered circulation system, where different groundwater bodies are superimposed.
(b) The water table can be divided in subzones, each with unique characteristics.The northwestern zone has a very evident drainage axis and its waters flowtoward a small part of the coastline nearby Piazza Bagnoli. The southwesternzone is completely inside the industrial complex and its waters flow directly tothe sea along the Via Coroglio coastline. The southeastern zone waters flowtoward south and southeast, following the preferential drainage axis locatedalong the base of the northwestern flank of the Posillipo hill.
(c) The theoretical depth of the water table is about 8.5 m in the PFR area, 55 m inthe COK area, and 65 m in the AFO area (Fig. 15.1). The morphology of thisline is typical, with a slope of about 45 � and a thickness which increases withdistance from the coastline.
(d) Three pumping tests and six Lefranc tests show that permeability values arepreferentially low.
Table 15.3 Statistical parameters of the analytical data from the sampling of sites outside thebagnoli brownfield site
Parameters Mean Median
Geometric
mean Min Max S.D.
Geometric
S.D.
As 33.6 23.6 25.1 14.8 217.3 45.0 0.26
Ba 843.7 821.5 784.6 294.0 1545.0 297.2 0.18
Be 7.2 6.6 6.3 2.4 15.4 3.7 0.23
Cd 0.3 0.3 0.2 0.1 0.5 0.1 0.2
Co 44.9 7.15 14.0 4.0 280.0 73.6 0.63
Cr total 27.6 25 21.0 0.8 89.0 19.1 0.41
Hg 0.4 0.1 0.2 0.04 3.8 0.9 0.55
Mo 26.3 4.45 5.5 2.8 400.0 90.6 0.47
Ni 13.8 10 10.9 5.0 76.0 15.3 0.25
Pb 80.5 68.5 75.9 47.0 181.0 31.0 0.14
Cu 30.3 21 23.7 10.0 90.0 24.1 0.3
Sn 10.2 9.42 9.3 5.0 24.0 5.0 0.19
V 75.4 74.9 72.9 46.3 136.0 20.5 0.11
Zn 118.0 111.5 111.3 63.0 202.0 34.3 0.13
Hydrocarbons 45.4 18 24.3 5 204 56.7 0.47
368 Benedetto De Vivo and Annamaria Lima

N
Local trigger and action limit
500AGeochemical map
As (ppm) in soils (level I)
500 1000 m0
Bagnoli area
<37.037–41.141.1–74.0>74.0No data
90.5%0.9%1.5%7.1%
As ppm
Figure 15.6A Arsenic distribution in the soil (from 25 m � 25 m network boreholes).
Local trigger and action limit
N
As ppm< 37.0
> 74.0
37.0−41.141.1−74.0
69.2%
1000 m500500 0
9.1%
4.3%17.3%
No data
Bagnoli areaGeochemical map
As (ppm) in landfills
B
Figure 15.6B Arsenic distribution in the scum, slag and landfill materials (from 25 m � 25 mnetwork boreholes).
Characterization and Remediation of a Brownfield Site 369

No data
ContaminatedNot contaminated
Bagnoli areaGeochemical mapPAH indexed in soils (level I)
N
A
500 0 500 1000 m
Figure 15.7A Polycyclic aromatic hydrocarbon (PAH) distribution in the soil (from 25 m� 25 mnetwork boreholes).
No dataContaminatedNot contaminated
Bagnoli area
N
B
500 0 500 1000 m
Geochemical mapPAH indexed in landfills
Figure 15.7B Polycyclic aromatic hydrocarbon (PAH) distribution in the scum, slag, and landfillmaterials (from 25 m � 25 m network boreholes).
370 Benedetto De Vivo and Annamaria Lima
The highest flow values are found along the north and south drainage axis, alongthe detritus belt at the base of the Posillipo Hill. Water pH is extremely variable,with the highest basic values (9.7) found near the coastline area between the twopiers that are filled with scum and slag waste (colmata a mare), and almost neutralvalues in the northwest sector of the brownfield site (DIR-AGL area). Groundwatertemperatures range from 14.8 �C in the hills to 24.3 �C near the coastline. Specificelectric conductivity averages 1 mS/cm, with the exception of the colmata a mare areawhere values are at their maximum (16.6 mS/cm) due to the presence of seawater.
Eh positive values are found in the east and north of the brownfield site, whereasnegative values are found in the colmata a mare area (�167.5 mV); these conditionsare favorable for dissolution of metals such as iron and manganese. Dissolved O2 isgenerally low (<1 mg/l) and only in the northeast are the values >3 mg/l. The O2
Eigenvalues
60%
64.9%
69.6%
Cu
Zn
Ni
NiNi
Pb
Hg
Hg
Hg
Hg-Ni
Hg
Fluorides
Fluorides
Fluorides
Cr VI
V
V
V
MopH
pHCr tot
Ba
Ba-Be
Ba-Be
BeSn-As
Sn
Sn-Cu-Zn
0.9
0.8
0.7
0.6
0.5
0.4
0.9
0.8
0.7
0.6
0.5
0.4
0.9
0.8
0.7
0.6
0.5
0.4
+ − + − + − + − + − + − + − +
Hg-Cd
As-Cd
Cd-Pb
As
Co
Co
Co
Cu-Zn
Pb-ZnCu
Pb
Mo
Mo
NiMoCr tot
Mo Mo
Cr
Cr totpH
pH
pH
Conductivity
conductivity
Conductivity
sulfides
Sulfides
sulfides
Sulfates
Sulfates
Sulfates
Cr total
MoCr tot-Co
Co-Nitot
Hgtot
Hydrocarbons
totHydrocarbons
totHydrocarbons
totHydrocarbons
Hydrocarbons
Hydrocarbonstot
Figure 15.8 R-mode factor analysis models from the 100 m � 100 m network boreholesanalytical results.
Characterization and Remediation of a Brownfield Site 371

trend is well correlated with Eh. Water samples reveal high contents of As, Fe, andMn, all above regulatory intervention limits established in DLgs 152/2006.
The investigations led to the following conclusions:
(a) The high Mn content is not due to leaching of the shallow part of the aquifer bypercolating waters. The percolation pathways are too short to explain a Mnenrichment that goes up to 22,500 mg/l. Moreover, there is no correlationbetween the relatively shallow underground hydrodynamics andMn contents inthe water.
(b) The source of Mn is neither point nor diffuse anthropogenic pollution, sinceconcentrations on the surface are always <50 mg/l. Moreover, no correlationwas found between rainfall and variation of Mn concentrations with time.
(c) High Mn content is due to the upwelling of deep fluids characteristic of theBagnoli–Fuorigrotta Plain substructure. This is based on the following evi-dence: (1) Sample sites with high Mn are located along four directions, coin-ciding with faults and fractures found in the tuff bedrock, along the samepathways in which thermal springs and old craters occur. (2) Where sampledensity is higher, it is possible to detect Mn dilution as a function of the distancefrom upwelling sites. Electric conductivity is also related to Mn content.
The investigated site is inside an active volcanic area, where geothermal fluids areenriched in As, Cu, Pb, Zn, and Hg. This is of paramount importance whileinterpreting the geochemical ‘‘anomalies’’ found in Bagnoli. This is also true forFe concentrations, which are clearly related to Mn contents.
Hydrocarbon concentrations are always above the regulatory intervention limitof 10 mg/l established by DLgs 152/2006, both at the piezometers located inside thesite and those located at its margins. External piezometers record high values as well,testifying that these compounds are present in all groundwaters in the Naples area.
PAH distribution patterns are more complex inside the brownfield site. Thepresence of these compounds in surficial waters is irregular and generally does notreach high values, with few exceptions (‘‘hot spots’’) localized at the industrial sitemargins near Via Diocleziano (LAMN4 and PFRN18 areas).
Water surveys and monitoring have revealed the presence of PAH with significantconcentrations in two areas: Colmata a mare and the LAM area (Laminatoi). A morediffuse contamination has been found in the Acciaieria, Cockeria, and Laminatoi areas.
Suitable barriers have been put in place to minimize contaminant migration fromthe brownfield site to the surroundings, in particular, toward the sea (see Section 11).One of the pollution sources is the circulation of hydrothermal fluids from thermalsprings (spas). Studies conducted on CF thermal waters show high As concentrationsin the range 12–5600 ppb. In the Puteolane hot springs (Dazio Bagnoli), located lessthan 1 km from the brownfield site, As concentrations up to 2600 ppb were found.These concentrations present further evidence of metal enrichment caused bythe presence of geothermal fluids. Analytical results also show hydrocarbon contam-ination uphill from the Bagnoli brownfield site. Inside the brownfield site, thesame concentrations were detected as found uphill from the site; therefore, it islikely that this ‘‘contamination’’ is ascribable both to industrial activity and to diffusecontamination from other sources.
372 Benedetto De Vivo and Annamaria Lima

7. Natural and Anthropogenic Components
for the Pollution
As stated in Section 1, the Bagnoli brownfield site contains metallic elementswhose source overlaps a natural component (ascribable to theCFhydrothermal activityconnected to the quiescent volcanism) and an anthropogenic one (due to the industrialactivity). The challenge was demonstrating and separating the contribution of thesetwo components.
Pb isotopes are used to study environmental pollution because of their relativegeochemical immobility and the wide use of Pb in industrial processes. Moreover,Pb isotopes are not fractionated by natural or industrial processes; Pb isotopiccomposition in a material remains constant in time and reflects the nature of thesource (Ault et al., 1970).
Pb used in industrial processes is extracted from sulfide ore deposits of different agesand origins. Once released in the environment from industrial activities, this metalis adsorbed by Fe and Mn oxides, whose formation in turn is fostered by atmosphericagents. Determining the isotopic composition and the chemical composition of soilsallows us to separate anthropogenic Pb from natural sources, helping us to define theorigin and extent of the contribution of anthropogenic sources to pollution.
The use of Pb isotopes in this field dates back to the 1960s (Chow and Johnstone,1965) and it has been employed in numerous studies in European and Mediterra-nean regions (Grousset et al., 1995; Hopper et al., 1991; Maring et al., 1987). Fewerstudies have been conducted in Italy and they have never been applied to industrialsites (Cochran et al., 1998; Colombo et al., 1988; De Vivo et al., 2001; Facchettiet al., 1982, 1989; Garibaldi et al., 1981; Magi et al., 1975; Monna et al., 1999;Tommasini et al., 2000).
At the Bagnoli brownfield site, Tarzia et al. (2002) (as part of his PhD programwith University of Naples Federico II) carried out a study aimed to discriminateanthropogenic pollution sources from natural pollution sources. For this study,heavy metals and Pb isotope data from soils, waste materials, scum, and slag samplesfrom the brownfield site were used.
The samples used for isotopic analysis were collected from 20 boreholes duringthe monitoring activities of Phase I, using a 100 m � 100 m grid. Selected sampleswere dried in air and sieved to extract the <2 mm fraction. This fraction was thenhomogenized, quartered, and sieved again to extract the <177 mm (80 mesh)fraction. After processing, the samples were analyzed as follows: (1) inductivelycoupled plasma-atomic emission spectrometry (ICP-AES) to determine, major,minor, and trace elements; (2) X-ray fluorescence (XRF) to determine mineralogyof scum and slag; and (3) inductively coupled plasma-mass spectrometry (ICP-MS)for Pb isotope analysis. XRF and part of Pb analysis were carried out at the USGSLaboratories (Reston, Virginia), while the remaining Pb isotope analyses werecarried out at the British Geological Survey (Nottingham, UK).
ICP-AES analysis determined concentrations for the following elements: Ag, Al,As, Au, B, Ba, Bi, Ca, Cd, Co, Cr, Cu, Fe, Ga, Hg, K, La, Mg, Mn, Mo, Na, Ni, P,Pb, S, Sb, Se, Sr, Te, Th, Ti, Tl, U, V, W, and Zn.
Characterization and Remediation of a Brownfield Site 373
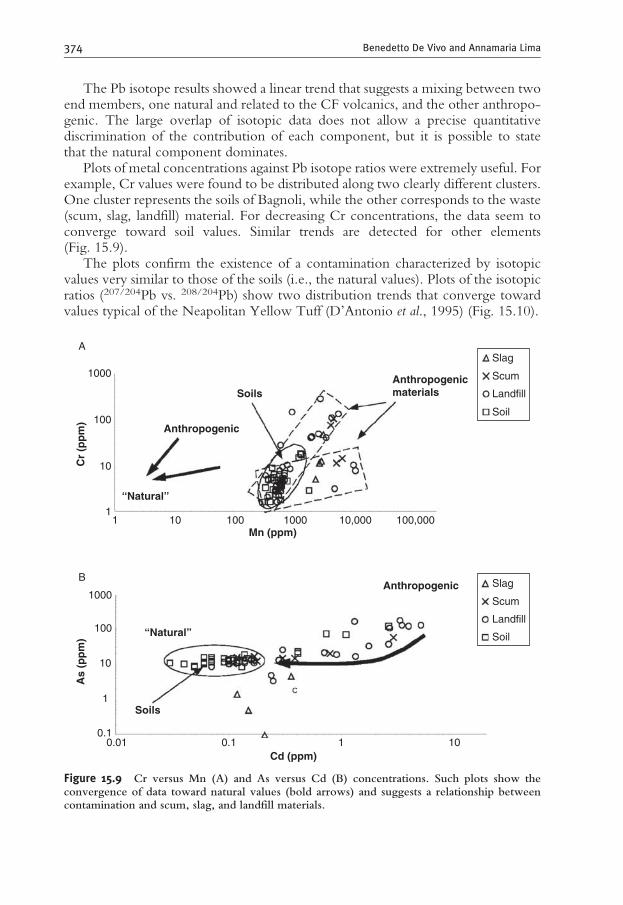
The Pb isotope results showed a linear trend that suggests a mixing between twoend members, one natural and related to the CF volcanics, and the other anthropo-genic. The large overlap of isotopic data does not allow a precise quantitativediscrimination of the contribution of each component, but it is possible to statethat the natural component dominates.
Plots of metal concentrations against Pb isotope ratios were extremely useful. Forexample, Cr values were found to be distributed along two clearly different clusters.One cluster represents the soils of Bagnoli, while the other corresponds to the waste(scum, slag, landfill) material. For decreasing Cr concentrations, the data seem toconverge toward soil values. Similar trends are detected for other elements(Fig. 15.9).
The plots confirm the existence of a contamination characterized by isotopicvalues very similar to those of the soils (i.e., the natural values). Plots of the isotopicratios (207/204Pb vs. 208/204Pb) show two distribution trends that converge towardvalues typical of the Neapolitan Yellow Tuff (D’Antonio et al., 1995) (Fig. 15.10).
1
A
B
1
10
100
1000
10
0.01 0.10.1
1
1
10
10
100
100
1000
1000
Mn (ppm)
“Natural”
“Natural”
Cd (ppm)
Anthropogenic
Soils
Soils
Anthropogenicmaterials
Anthropogenic
Cr
(pp
m)
As
(pp
m)
10,000 100,000
Soil
Landfill
Scum
Slag
Soil
Landfill
Scum
Slag
Figure 15.9 Cr versus Mn (A) and As versus Cd (B) concentrations. Such plots show theconvergence of data toward natural values (bold arrows) and suggests a relationship betweencontamination and scum, slag, and landfill materials.
374 Benedetto De Vivo and Annamaria Lima

Figure 15.11 shows the plot of Pb isotopic ratios for possible end members, suchas gasoline, aerosols (Italian and European), and coal, compared to the ratiosrecorded in Bagnoli. For Italian gasoline, only a few data points (gasoline withadditives from Mexico and Peru) are consistent with Bagnoli. The same is true foraerosols, with the only exception being an aerosol from Senegal.
Isotopic data from coal imported from the Appalachian Basin of the eastern UnitedStates are instead consistent with Bagnoli, since this coal was used at Bagnoli as anadditive in the smelting furnace during the steel manufacturing process. The rawmaterial (i.e., Feminerals)was imported fromLiberia,Canada, India, and other nations;unfortunately, the only isotopic data available in the literature are for Loulo and theNimba shield Fe formations (Liberia, EasternAfrica), and those are not compatiblewithBagnoli data.
Chemical and isotope data clearly show mixing between a major naturalcomponent (e.g., reworked subaerial and marine volcanics), and an anthropogenicone. Hydrothermal fluids associated with the CF-active volcanism, an area wherefumaroles and hydrothermal springs are quite abundant, provide significant contribu-tion to the metals present at this site. The natural contamination due to the upwellingof geothermal fluids (enriched in heavy and potentially toxic metals such as As, Cu,Pb, and Hg) is confirmed by the high concentrations of heavy metals found inthe thermal springs (spas) located at the margins of the brownfield site of Bagnoli(e.g., the Terme di Bagnoli, Dazio, the Terme Puteolane, the Stufe di Nerone) andthe nearby Island of Ischia (Daniele, 2000; Lima et al., 2001, 2003). Values at the Stufedi Nerone reach up to 8000 ppb, while Ischia values are >1500 ppb.
NYT
“Natural”
Anthropogenic
0.791.96
1.98
2.00
2.02
2.04
2.06
2.08
2.10
2.12
0.80 0.81 0.82 0.83207Pb/206Pb
208 P
b/20
6 Pb
0.84 0.85 0.86 0.87
Slag
Scum
Landfill
Soil
Figure 15.10 Plot of 207Pb/206Pb versus 208Pb/206Pb. The dashed area represents the field ofisotopic composition for the NYT (as reported by D’Antonio et al., 1995). The straight arrowsunderline the general trends ofmixing between three potential Pb endmembers (Tarzia et al., 2002).
Characterization and Remediation of a Brownfield Site 375

Isotope values from soils and waste (e.g., scum, slag) are similar, but a largeoverlap in data does not allow precise discrimination of the natural component fromthe anthropogenic one. Isotope ratio trends for soils and waste in Bagnoli is partiallydivergent from the ‘‘classic’’ anthropogenic trend defined by gasoline combustionand aerosols values from other parts of the world. This suggests that for the Bagnoliarea, there is a local source of contamination, likely from fossil fuel use and theemission of industrial fumes. Italian gasoline with additives from Mexico and Peruare partially responsible for contamination, but the major role has surely been playedby the large amounts of coal used in the industrial process. However, other sources,such as paints, mineral oils, and uncontrolled organic and inorganic sewer waste, forwhich data are not available, cannot be ruled out as sources for some contaminants.
The presence of a major natural contribution (i.e., hydrothermal fluids) for themetal contamination makes metal remediation of the Bagnoli area to a level belowlocal background futile. This conclusion is further strengthened by the observationthat scum and slag proved to be geochemically very stable relative to their metalcontents; leachability tests prove that neither scum nor slag releases metals in soilsand groundwater at the pH and local conditions existing in the regional area.
8. Chemical–Structural Characterization of
Waste Material and Leachability Tests
Chemical–structural analysis and leachability tests on scum, slag, and Fe-minerals were carried out to characterize and measure the chemical stability of themetals in waste materials. The investigation was designated to (1) evaluate the
0.90207Pb/206Pb
South Africafuel
Italianfuel
Broken hill fuelTyrrhenian seaCanada fuel
Cerro delPasco (Peru)
Mexico
Sardinia20
8 Pb
/206 P
b
0.950.850.802.00
2.05
2.10
2.15
2.20
2.25
Coal deposit(appalachian)
Aerosol Petrol-lead Pb ore deposits
Bagnoli slagscum and landfill
Bagnoli soils
Figure 15.11 208Pb/206Pb versus 207Pb/206Pb isotopic composition of samples collected in thestudy of Tarzia et al. (2002) and data reported in literature. The compositional ranges of thenatural and anthropogenic Pb sources are reported as dashed and dotted areas, respectively. (Datasources: Elbaz-Poulichet et al., 1984; Grousset et al., 1995; Marcoux and Milesi, 1993; Maringet al., 1987; Monna et al., 1999; Tommasini et al., 2000.).
376 Benedetto De Vivo and Annamaria Lima

environmental issues connected with the industrial waste and (2) define criteria andprocedures aimed at recovering the by-products remaining in the brownfield site.The primary objective was to evaluate the rate of pollutant release in the environ-ment and to determine the risk of contamination of groundwater at the site. For thisreason, different types of leachability tests and analyses of leached material werecarried out on scum, slag, minerals, and steelwork mud.
Microscope analyses and leachability tests showed that the microstructural con-figuration of materials at the site are stable not only relative to the tests andprocedural time frame but also because of the recognition of the absence of isolatedmicrostructures made of heavy elements. Heavy elements are most likely trapped inthe lattice of the detected relatively insoluble microstructure phases, and leaching ofthese elements is highly unlikely. In conclusion, the industrial waste present in thebrownfield site of Bagnoli is unlikely to contribute metallic pollution to localgroundwater, on a reasonable human time scale. Numerous investigations carriedout on industrial steelwork waste in the European Community have reached thesame conclusions.
9. Asbestos Characterization and Remediation
The CIPE plan called for a remediation of asbestos-containing materials in theEternit and in the ILVA steelwork factories. Ninety percent of the buildings, squares,and sites were cleared of asbestos by March 4, 2000. During the remediation activities,and in coordination with the local Health Unities (ASL)), a series of control sampleswere collected. 915 samples were analyzed to evaluate the presence of aerially dispersedasbestos fibers in nearby locations. No values exceeding WHO limits were detected.1044 samples and analyses from the Eternit site and 56 from the ILVA site were alsocollected to monitor fiber dispersion inside the area of the operations.
10. Preliminary Operative Remediation Plan
The Bagnoli SpA drafted a preliminary operative remediation plan on the basisof geological, hydrogeological, and chemophysical investigations carried out on thesite. It also undertook research to verify the effectiveness and feasibility of sometreatments to be applied on underground materials occurring at the Bagnoli site,such as anthropogenic waste covering and natural soils. Effective remediationprocedures must be applied to bring concentrations in soils and underground withinthe limits set by Italian LawDLgs 152/2006. Table 15.1 shows the reported limits setby law, and background levels established during the survey.
The draft reclamation plan adopted the following guidelines:
(a) Minimize the impact of former industrial processes on the natural environment.(b) Maximize material recycling and reuse.(c) Contain the costs within acceptable limits.
Characterization and Remediation of a Brownfield Site 377

The project adopts reclamation methods verified by investigations and experi-mental research, and uses industrial cycles and treatments presently available on anindustrial scale. Treatment cycles will depend on contamination levels and presenceof organic contaminants.
Regarding the heavy metals, the materials with concentrations of a single metalexceeding the limits of Table 15.4, column B (DLgs 152/2006), and the presenceof leachate with concentrations exceeding the limits set for groundwater by Law152/1999, is considered as highly contaminated (‘‘hot spots’’).
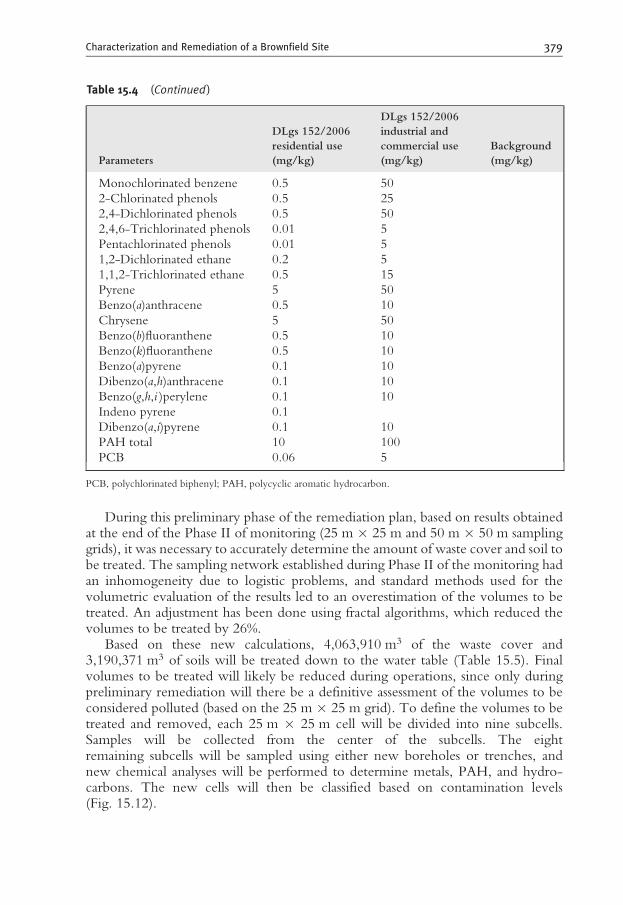
Table 15.4 Intervention limits for residential and commercial/industrial land use according tothe law 152/2006 and background values
Parameters
DLgs 152/2006
residential use
(mg/kg)
DLgs 152/2006
industrial and
commercial use
(mg/kg)
Background
(mg/kg)
pH —
Electrical conductivity
(mS/cm)
— — —
Sulfides — — —
Sulfates — — —
Fluorides — — —
Cyanides 1 100 —
Complex cyanides — — —
S — — —
As 20 50 37
Ba — — —
Be 2 10 12
Cd 2 15 2
Co 20 250 130
Cr total 150 800 150
Cr VI 2 15 —
Hg 1 5 1
Mo — — —
Mn — — v
Ni 120 500 120
Pb 100 1000 112
Cu 120 600 120
Sn 1 350 15
V 90 250 110
Zn 150 1500 158
Phenols 1 60
Benzene 0.1 2
Toluene 0.5 50
Xylene 0.5 50
Total hydrocarbons 50 750 105x
378 Benedetto De Vivo and Annamaria Lima
During this preliminary phase of the remediation plan, based on results obtainedat the end of the Phase II of monitoring (25 m � 25 m and 50 m � 50 m samplinggrids), it was necessary to accurately determine the amount of waste cover and soil tobe treated. The sampling network established during Phase II of the monitoring hadan inhomogeneity due to logistic problems, and standard methods used for thevolumetric evaluation of the results led to an overestimation of the volumes to betreated. An adjustment has been done using fractal algorithms, which reduced thevolumes to be treated by 26%.
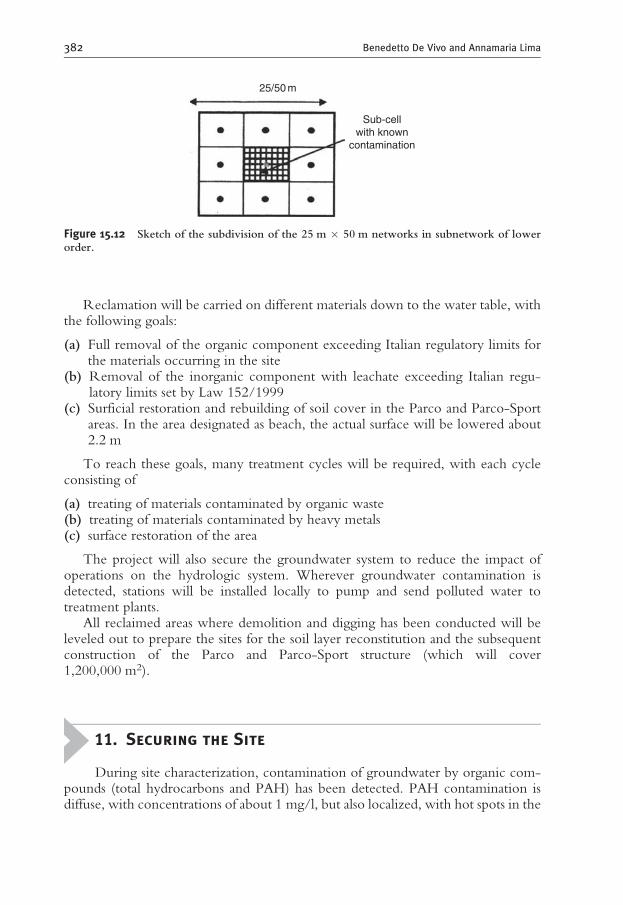
Based on these new calculations, 4,063,910 m3 of the waste cover and3,190,371 m3 of soils will be treated down to the water table (Table 15.5). Finalvolumes to be treated will likely be reduced during operations, since only duringpreliminary remediation will there be a definitive assessment of the volumes to beconsidered polluted (based on the 25 m � 25 m grid). To define the volumes to betreated and removed, each 25 m � 25 m cell will be divided into nine subcells.Samples will be collected from the center of the subcells. The eightremaining subcells will be sampled using either new boreholes or trenches, andnew chemical analyses will be performed to determine metals, PAH, and hydro-carbons. The new cells will then be classified based on contamination levels(Fig. 15.12).
Table 15.4 (Continued)
Parameters
DLgs 152/2006
residential use
(mg/kg)
DLgs 152/2006
industrial and
commercial use
(mg/kg)
Background
(mg/kg)
Monochlorinated benzene 0.5 50
2-Chlorinated phenols 0.5 25
2,4-Dichlorinated phenols 0.5 50
2,4,6-Trichlorinated phenols 0.01 5
Pentachlorinated phenols 0.01 5
1,2-Dichlorinated ethane 0.2 5
1,1,2-Trichlorinated ethane 0.5 15
Pyrene 5 50
Benzo(a)anthracene 0.5 10
Chrysene 5 50
Benzo(b)fluoranthene 0.5 10
Benzo(k)fluoranthene 0.5 10
Benzo(a)pyrene 0.1 10
Dibenzo(a,h)anthracene 0.1 10
Benzo(g,h,i )perylene 0.1 10
Indeno pyrene 0.1
Dibenzo(a,i)pyrene 0.1 10
PAH total 10 100
PCB 0.06 5
PCB, polychlorinated biphenyl; PAH, polycyclic aromatic hydrocarbon.
Characterization and Remediation of a Brownfield Site 379
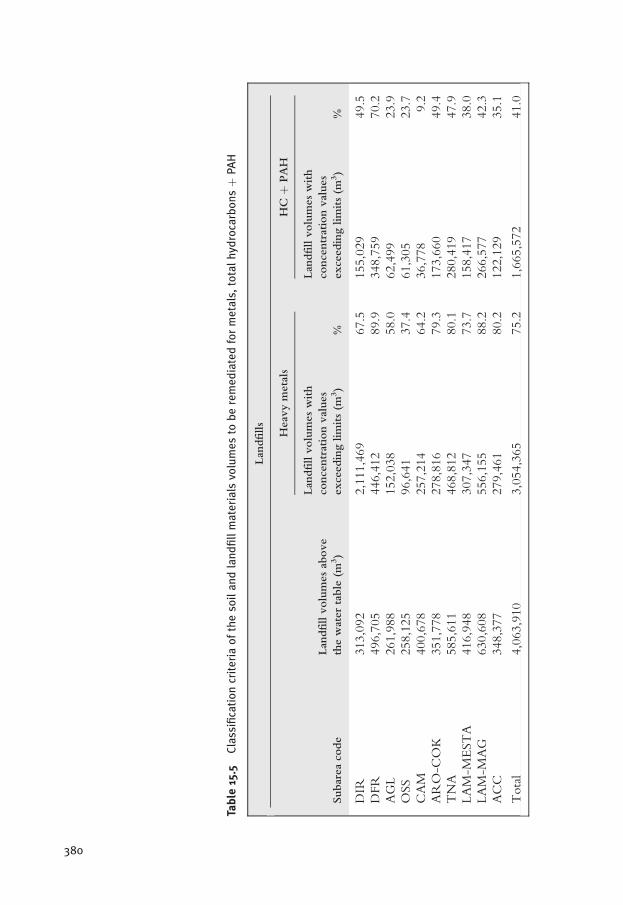
Table
15.5
Classificationcriteriaofthesoilandlandfillmaterials
volumesto
beremediatedformetals,totalhyd
rocarbonsþ
PAH
Landfills
Subareacode
Landfillvolumesabove
thewatertable
(m3)
Heavymetals
HC
þPAH
Landfillvolumeswith
concentrationvalues
exceedinglimits(m
3)
%
Landfillvolumeswith
concentrationvalues
exceedinglimits(m
3)
%
DIR
313,092
2,111,469
67.5
155,029
49.5
DFR
496,705
446,412
89.9
348,759
70.2
AGL
261,988
152,038
58.0
62,499
23.9
OSS
258,125
96,641
37.4
61,305
23.7
CAM
400,678
257,214
64.2
36,778
9.2
ARO-C
OK
351,778
278,816
79.3
173,660
49.4
TNA
585,611
468,812
80.1
280,419
47.9
LAM-M
ESTA
416,948
307,347
73.7
158,417
38.0
LAM-M
AG
630,608
556,155
88.2
266,577
42.3
ACC
348,377
279,461
80.2
122,129
35.1
Total
4,063,910
3,054,365
75.2
1,665,572
41.0
380

Soils
Subareacode
Landfillvolumesabove
thewatertable
(m3)
Heavymetals
HC
þPAH
Soilvolumeswith
concentrationvalues
exceedinglimits(m
3)
%
Soilvolumeswith
concentrationvalues
exceedinglimits(m
3)
%
DIR
407,023
80,703
19.8
22,931
5.6
DFR
48,167
46,431
96.4
8659
18.0
AGL
256,437
62,722
24.5
6069
2.4
OSS
291,317
79,001
27.1
18,795
6.5
CAM
1,545,649
666,634
43.1
69,527
4.5
ARO-C
OK
109,386
29,266
26.8
13,540
12.4
TNA
39,485
13,699
34.7
1974
5.0
LAM-M
ESTA
352,528
69,395
19.7
7697
2.2
LAM-M
AG
28,844
8546
29.6
2747
9.5
ACC
111,536
26,672
23.9
4346
3.9
Total
3,190,372
1,083,079
33.9
156,285
4.9
HC,totalhydrocarbons.
PAH,polycyclicaromatichydrocarbon.
381
Reclamation will be carried on different materials down to the water table, withthe following goals:
(a) Full removal of the organic component exceeding Italian regulatory limits forthe materials occurring in the site
(b) Removal of the inorganic component with leachate exceeding Italian regu-latory limits set by Law 152/1999
(c) Surficial restoration and rebuilding of soil cover in the Parco and Parco-Sportareas. In the area designated as beach, the actual surface will be lowered about2.2 m
To reach these goals, many treatment cycles will be required, with each cycleconsisting of
(a) treating of materials contaminated by organic waste(b) treating of materials contaminated by heavy metals(c) surface restoration of the area
The project will also secure the groundwater system to reduce the impact ofoperations on the hydrologic system. Wherever groundwater contamination isdetected, stations will be installed locally to pump and send polluted water totreatment plants.
All reclaimed areas where demolition and digging has been conducted will beleveled out to prepare the sites for the soil layer reconstitution and the subsequentconstruction of the Parco and Parco-Sport structure (which will cover1,200,000 m2).
11. Securing the Site
During site characterization, contamination of groundwater by organic com-pounds (total hydrocarbons and PAH) has been detected. PAH contamination isdiffuse, with concentrations of about 1 mg/l, but also localized, with hot spots in the
Sub-cellwith known
contamination
25/50 m
Figure 15.12 Sketch of the subdivision of the 25 m � 50 m networks in subnetwork of lowerorder.
382 Benedetto De Vivo and Annamaria Lima
northern (VAR6) and southern sectors (LAM N4), where levels are >1 mg/l. Tosecure the site, three approaches were considered:
(a) Form a hydrologic barrier using pumping stations (i.e., drawing wells).(b) Construct a plastic diaphragm (concrete-bentonite).(c) Create a jet grouting barrier.
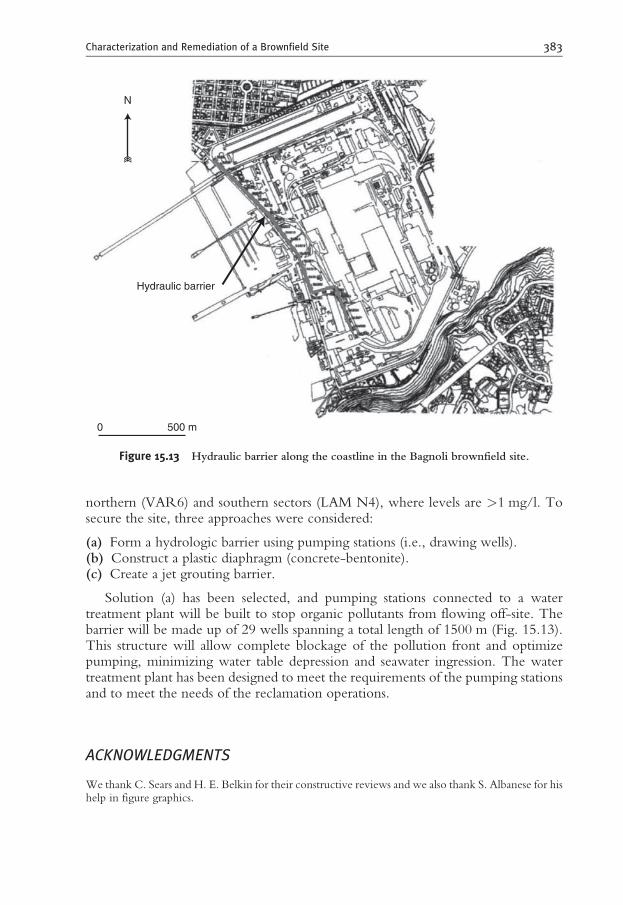
Solution (a) has been selected, and pumping stations connected to a watertreatment plant will be built to stop organic pollutants from flowing off-site. Thebarrier will be made up of 29 wells spanning a total length of 1500 m (Fig. 15.13).This structure will allow complete blockage of the pollution front and optimizepumping, minimizing water table depression and seawater ingression. The watertreatment plant has been designed to meet the requirements of the pumping stationsand to meet the needs of the reclamation operations.
ACKNOWLEDGMENTS
We thank C. Sears and H. E. Belkin for their constructive reviews and we also thank S. Albanese for hishelp in figure graphics.
Hydraulic barrier
0 500 m
N
Figure 15.13 Hydraulic barrier along the coastline in the Bagnoli brownfield site.
Characterization and Remediation of a Brownfield Site 383
REFERENCES
Armienti, P., Barberi, F., Bizouard, H., Clocchiatti, R., Innocenti, F., Metrich, N., Rossi, M., andSbrana, A. (1983). The Phlegraean Fields: Magma evolution within a shallow magma chamber.J. Volcanol. Geotherm. Res. 17, 289–311.
Ault, W. A., Senechal, R. G., and Erlebach, W. E. (1970). Isotopic composition as a natural tracer oflead in the environment. Environ. Sci. Technol. 4, 305–313.
Belkin, H. E., De Vivo, B., Lima, A., and Torok, K. (1996). Magmatic silicate/saline/sulphur rich/CO2 immiscibility and zirconium and REE enrichment from alkaline magma chamber marginsevidence from Ponza island, Pontine archipelago, Italy. Eur. J. Miner. 8, 1401–1420.
Bodnar, R. J. (1995). Fluid inclusion evidence for magmatic source of metals in porphyry copperdeposits. Miner. Assoc. Canada, Short Course Series 23, 139–152.
Chow, T. J., and Johnstone, M. S. (1965). Lead isotopes in gasoline and aerosols of Los Angeles basin,California. Science 147, 502–503.
Cochran, J. K., Frignani, M., Salamanca, M., Bellocci, L. G., and Guerzoni, S. (1998). Lead-210 as atracer of atmospheric input of heavy metals in the northern Venice lagoon. Mar. Chem. 62, 15–29.
Colombo, A., Facchetti, S., Gaglione, P., Geiss, F., Leyendecker, W., Rodari, R., Trincherini, P. R.,Versino, B., and Garibaldi, G. (1988). The isotopic lead experiment: Impact of petrol leadon human blood and air. Final Report Ispra, Commission of the European Communities,EUR 12002.
D’Antonio, M., Tilton, G. R., and Civetta, L. (1995). Petrogenesis of Italian alkaline lavas deducedfrom Pb-Sr-Nd isotope relationships. In ‘‘Isotopic Studies of Crust-Mantle Evolution’’ (A. Basuand S.R Hart, eds.), pp. 253–267. Amer. Geoph. Union Monograph, Washington, USA.
Damiani, V., Baudo, R., De Rosa, S., De Simone, R., Ferretti, O., Izzo, G., and Serena, F. (1987).A case study: Bay of Pozzuoli (Gulf of Naples, Italy). Hydrobiologia 149, 210–211.
Daniele, L. (2000). Geochimica degli elementi metallici nelle acque sotterranee dell’isola d’Ischia:Esempio di prospezione nel settore occidentale : Tesi di Laurea, Universita degli Studi di NapoliFederico II. A.A. 1999/2000.
De Vivo, B., Torok, K., Ayuso, R. A., Lima, A., and Lirer, L. (1995). Fluid inclusion evidence formagmatic silicate/saline/CO2 immiscibility and geochemistry of alkaline xenoliths from Ventoteneisland (Italy). Geochim. Cosmochim. Acta 59, 2941–2953.
De Vivo, B., Somma, R., Ayuso, R. A., Calderoni, G., Lima, A., Pagliuca, S., and Sava, A. (2001). Pbisotopes and toxic metals in floodplain and stream sediments from the Volturno river basin, Italy.Environ. Geol. 41, 101–112.
De Vivo, B., Lima, A., Kamenetsky, V. S., and Danyushevsky, L. V. (2006). Fluid and melt inclusionsin the sub-volcanic environments from volcanic systems: Examples from the Neapolitan area andPontine islands (Italy). In ‘‘Melt Inclusions in Plutonic Rocks’’ ( J. D. Webster, ed.), pp. 211–237.Mineralogical Association of Canada Short Course 36, Montreal, Quebec.
Di Girolamo, P. (1978). Geotectonic setting of Miocene-Quaternary volcanism in and around theeastern Thyrrenian sea border (Italy) as deduced from major element geochemistry. Bull. Volcanol.41, 229–250.
Elbaz-Poulichet, F., Holliger, P., and Huang, W. W. (1984). Lead cycling in estuaries, illustrated bythe Gyronde esuary, France. Nature 308, 409–414.
Facchetti, S. (1989). Lead in petrol. Acc. Chem. Res. 22, 370–374.Facchetti, S., Geiss, F., Gaglione, P., Colombo, A., Garibaldi, G., Spallanzani, G., and Gilli, G. (1982).
Isotopic lead experiment: Status report Luxembourg, Commission of European Communities,EUR 8352 EN.
Fedele, L., Tarzia, M., Belkin, H. E., De Vivo, B., Lima, A., and Lowenstern, J. B. (2006). Magmatic-hydrothermal fluid interaction and mineralization in alkali-syenite nodules from the Breccia Museopyroclastic deposit, Naples, Italy. In ‘‘Volcanism in the Campania Plain: Vesuvius, Campi Flegreiand Ignimbrites’’ (B. De Vivo, ed.). Developments in Volcanology, 9, pp. 125–161. Elsevier,Amsterdam, The Netherlands.
384 Benedetto De Vivo and Annamaria Lima

Garibaldi, P., Vanini, G., and Gilli, G. (1981). Isotopic tracing of lead into children from automobileexhaust. In ‘‘Environmental Lead’’ (D. Lynam, L. Piantanida, and J. Cole, eds.), pp. 9–21.Academic Press, Amsterdam, The Netherlands.
Grousset, F. E., Quetel, C. R., Thomas, B., Lambert, C. E., Guillard, F., Donard, O. F. X., andMonaco, A. (1995). Anthropogenic vs lithologic origins of trace elements (As, Cd, Pb, Sn, Zn) inwater column particles: Northwestern Mediterranean Sea. Mar. Chem. 48, 291–310.
Hedenquist, J. W., and Lowenstern, J. B. (1994). The role of magmas in the formation of hydrothermalore deposits. Nature 370, 519–527.
Hopper, J. F., Ross, H. B., Sturges, W. T., and Barrie, L. A. (1991). Regional source discrimination ofatmospheric aerosols in Europe using the isotopic composition of lead. Tellus 43, 45–60.
L’Industria Mineraria (1979a). Italsider—l’approvvigionamento dei minerali di ferro. Gennaio-Febbraio1, 1–9.
L’industria Mineraria (1979b). Carbon fossile: La realta Italsider. Marzo-Aprile 2, 76–88.Lima, A., Daniele, L., De Vivo, B., and Sava, A. (2001). Minor and trace elements investigation on
thermal groundwaters of Ischia Island (Southern Italy). In ‘‘Proceedings of Water-Rock Interca-tion-10’’ (R. Cidu, ed.), Vol. 2, pp. 981–984. Balkema, Rotterdam, The Netherlands.
Lima, A., Cicchella, D., and Di Francia, S. (2003). Natural contribution of harmful elements in thermalgroundwaters of Ischia Island (Southern Italy). Environ. Geol. 43, 930–940.
Magi, F., Facchetti, S., and Garibaldi, P. (1975). Essences additionnees de plomb isotopiquementdifferencie. In ‘‘Proceedings of United Nations FAO and International Atomic Energy AssociationSymposium,’’ 191, pp. 109–119. Vienna, Austria (IAEA-SM).
Marcoux, E., and Milesi, J. P. (1993). Lead isotope signature of early Proterozoic ore deposits inwestern Africa: Comparison with gold deposits in French Guyana. Econ. Geol. 88, 1862–1879.
Maring, H., Settle, D. M., Buat-Meanard, P., Dulac, F., and Patterson, C. C. (1987). Stable leadisotope tracers of air mass trajectories in the Mediterranean region. Nature 330, 154–156.
Monna, F., Aiuppa, A., Barrica, D., and Dongarra, G. (1999). Pb isotope composition in lichens andaerosols from Eastern Sicily: Insights into the regional impact of volcanoes on the environment.Environ. Sci. Technol. 33, 2517–2523.
Peccerillo, A. (1985). Roman comagmatic province (Central Italy): Evidence for subduction-relatedmagma genesis. Geology 13, 103–106.
Russo, F., Calderoni, G., and Lombardo, M. (1998). Evoluzione geomorfologica della depressioneBagnoli-Fuorigrotta: Periferia urbana della citta di Napoli. Boll. Soc. Geol. It. 116, 21–38.
Sharp, W. E., and Nardi, G. (1987). A study of the heavy metal pollution in the bottom sediments atPorto di Bagnoli (Naples), Italy. J. Geochem. Explor. 29, 49–73.
Tarzia, M., Lima, A., De Vivo, B., and Belkin, H. E. (1999). Uranium, zirconium and rare earthelement enrichment in alkali syenite nodules from the Breccia Museo deposit, Naples, Italy. Geol.Soc. Amer. Annual Meeeting, Abstracts with Programs, Vol. 31, n. 7, p. A-69.
Tarzia, M., De Vivo, B., Somma, R., Ayuso, R. A., McGill, R. A. R., and Parrish, R. R. (2002).Anthropogenic vs. natural pollution: An environmental study of an industrial site under remedia-tion (Naples, Italy). Geochem. Explor. Environ. Anal. 2, 45–56.
Tommasini, S., Davies, G., and Elliott, T. (2000). Lead isotope composition of tree rings as bio-geochemical tracers of heavy metal pollution: A reconnaissance study from Firenze, Italy. Appl.Geochem. 15, 891–900.
Washington, H. S. (1906). ‘‘The Roman Comagmatic Region.’’ Carnegie Inst. of Washington.Vol. 57, p. 199.
Characterization and Remediation of a Brownfield Site 385