characterization and identification of suspected counterfeit miltefosine capsules
TRANSCRIPT
Dynamic Article LinksC<Analyst
Cite this: Analyst, 2012, 137, 1265
www.rsc.org/analyst PAPER
Publ
ishe
d on
18
Janu
ary
2012
. Dow
nloa
ded
by U
nive
rsita
t Pol
itècn
ica
de V
alèn
cia
on 2
6/10
/201
4 07
:25:
19.
View Article Online / Journal Homepage / Table of Contents for this issue
Characterization and identification of suspected counterfeit miltefosinecapsules
Thomas P. C. Dorlo,*ab Teunis A. Eggelte,a Peter J. de Vriesa and Jos H. Beijnenb
Received 25th July 2011, Accepted 9th December 2011
DOI: 10.1039/c2an15641e
Recently, it was revealed that generic miltefosine capsules for the treatment of visceral leishmaniasis,
a fatal parasitic disease, were possibly counterfeit products. Here we report on the methods to
characterize and identify miltefosine in pharmaceutical products and the procedures that were used to
assess the quality of these suspected counterfeit products. Characterization and identification of
miltefosine were done with liquid chromatography coupled to tandem mass spectrometry (LC-MS/
MS), Fourier transform infrared (FT-IR) spectroscopy and near-infrared (NIR) spectroscopy.
Moreover, a simple, rapid and inexpensive colorimetric test was developed and evaluated for the
detection of miltefosine in pharmaceutical products that can be used in the field. The complementary
analytical techniques presented here were able to determine qualitatively or (semi-)quantitatively the
presence or absence of miltefosine in pharmaceutical preparations and could identify suspected
counterfeit miltefosine capsules. This finding of a suspected counterfeit drug intended to treat
a neglected disease in a resource-poor country emphasizes the urgent need to develop more simple
inexpensive assays to evaluate drug quality for use in the field.
1 Introduction
Counterfeit and substandard drugs are an increasing public
health problem worldwide, but appear most prevalent in
resource-poor countries.1,2 Antiparasitics and antibiotics are
amongst the most affected classes of drugs, although accurate
estimations of the prevalence of poor-quality medicines remain
lacking.3–5 Poor-quality anti-infectives containing a subthera-
peutic amount of active compound not only pose a risk to the
individual health of patients but also severely threaten the
control efforts for tropical infectious diseases and may even
contribute to emerging drug resistance.5,6 Therefore, the devel-
opment of (simple) methods to assess the quality of anti-infective
medicines that are being used in resource-poor countries is
urgently needed.5,7,8
Recently, abnormally high failure rates in hundreds of
Bangladeshi visceral leishmaniasis patientswere reported after the
use of a locally procured pharmaceutical product labelled
‘Miltefos’, supposedly containing miltefosine.6,9 Miltefosine
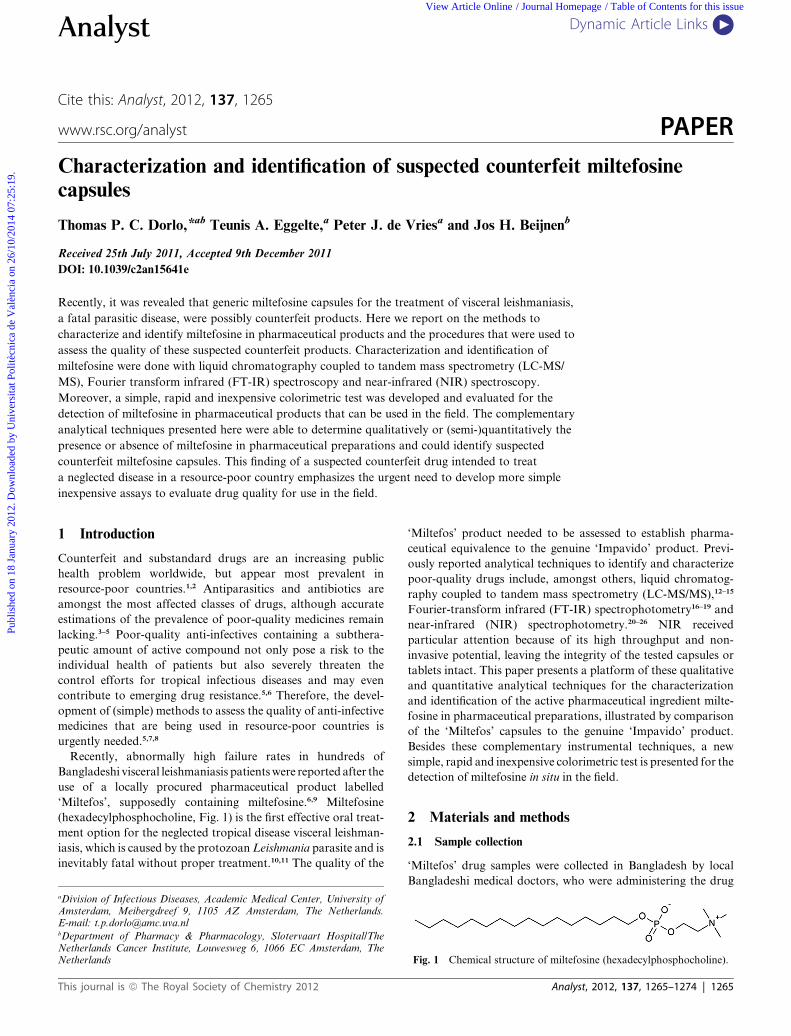
(hexadecylphosphocholine, Fig. 1) is the first effective oral treat-
ment option for the neglected tropical disease visceral leishman-
iasis, which is caused by the protozoan Leishmania parasite and is
inevitably fatal without proper treatment.10,11 The quality of the
aDivision of Infectious Diseases, Academic Medical Center, University ofAmsterdam, Meibergdreef 9, 1105 AZ Amsterdam, The Netherlands.E-mail: [email protected] of Pharmacy & Pharmacology, Slotervaart Hospital/TheNetherlands Cancer Institute, Louwesweg 6, 1066 EC Amsterdam, TheNetherlands
This journal is ª The Royal Society of Chemistry 2012
‘Miltefos’ product needed to be assessed to establish pharma-
ceutical equivalence to the genuine ‘Impavido’ product. Previ-
ously reported analytical techniques to identify and characterize
poor-quality drugs include, amongst others, liquid chromatog-
raphy coupled to tandem mass spectrometry (LC-MS/MS),12–15
Fourier-transform infrared (FT-IR) spectrophotometry16–19 and
near-infrared (NIR) spectrophotometry.20–26 NIR received
particular attention because of its high throughput and non-
invasive potential, leaving the integrity of the tested capsules or
tablets intact. This paper presents a platform of these qualitative
and quantitative analytical techniques for the characterization
and identification of the active pharmaceutical ingredient milte-
fosine in pharmaceutical preparations, illustrated by comparison
of the ‘Miltefos’ capsules to the genuine ‘Impavido’ product.
Besides these complementary instrumental techniques, a new
simple, rapid and inexpensive colorimetric test is presented for the
detection of miltefosine in situ in the field.
2 Materials and methods
2.1 Sample collection
‘Miltefos’ drug samples were collected in Bangladesh by local
Bangladeshi medical doctors, who were administering the drug
Fig. 1 Chemical structure of miltefosine (hexadecylphosphocholine).
Analyst, 2012, 137, 1265–1274 | 1265
Publ
ishe
d on
18
Janu
ary
2012
. Dow
nloa
ded
by U
nive
rsita
t Pol
itècn
ica
de V
alèn
cia
on 2
6/10
/201
4 07
:25:
19.
View Article Online
to patients admitted within the context of the Bangladeshi
visceral leishmaniasis elimination programme, at two different
locations in August and September 2008, respectively. Because
there was no direct suspicion of a poor-quality product, no
randomization or sample size assessment was applied for the
sample collection. The two sets of samples were shipped from
Bangkok, Thailand, and Dhaka, Bangladesh, respectively, at
room temperature to our laboratory located in Amsterdam, The
Netherlands, which received the samples on August 21 and
September 5, 2008, respectively. Both sets of samples were
packed in sealed and signed envelopes, to ensure that they had
not been opened in between sending and receipt of the shipment.
2.2 Chemicals and reference standards
Miltefosine (hexadecylphosphocholine, 99.9% purity) was kindly
provided by Zentaris GmbH, Frankfurt, Germany. Methanol
and acetonitrile, both Supra-Gradient grade, and chloroform,
HPLC grade, were from Biosolve Ltd, Amsterdam, The Neth-
erlands. Triethylamine, acetic acid (100%), hydrochloric acid
(25%), ammonia (25%), and 1,2-dichloroethane (100%), all of
analytical grade, were from Merck, Darmstadt, Germany.
Distilled water was from B. Braun Medical, Emmenbr€ucke,
Switzerland. Ammonium ferrithiocyanate was prepared in our
lab by dissolving ferric chloride hexahydrate (Sigma-Aldrich,
Zwijndrecht, The Netherlands) and ammonium thiocyanate
(Fluka, Buchs, Switzerland) in distilled water.27 Lactose (100%)
was from DMV Pharma, Veghel, The Netherlands. ‘Impavido’
(‘50 mg Kapseln, Wirkstoff: Miltefosine’, batch no. 2649, expiry
date: November 2010) was obtained from Zentaris GmbH,
through Paesel + Lorei Pharma Vertriebs- und Marketing
GmbH, Duisburg, Germany.
2.3 Preparation of reference capsule contents and capsules
A reference standard within the ‘Miltefos’ matrix was prepared,
in order to identify any matrix effects of the ‘Miltefos’ matrix
(e.g. excipients) on the analyses and spectrophotometric identi-
fication of miltefosine. From a ‘Miltefos 50’ capsule with a label
claim of 50 mg miltefosine, the total contents were collected
(about 200 mg), an aliquot of 50 mg was discarded, replaced by
a sample of 50 mg miltefosine reference standard and manually
mixed by using a pestle and mortar. These spiked ‘Miltefos’
capsule contents were either extracted as explained in the
following paragraph (for LC-MS/MS and FT-IR), used in whole
(for FT-IR, NIR and the colorimetric test), or put back in the
‘Miltefos’ capsule case (for NIR). For NIR spectroscopy, addi-
tional ‘Miltefos’ capsule contents were spiked with 10 or 25 mg
miltefosine reference standard.
2.4 Sample preparation and extraction of miltefosine
‘Miltefos’ capsules from two different batches with two different
label claims were available for analysis: ‘Miltefos 50’ and ‘Mil-
tefos 10’ with corresponding label claims of 50 and 10 mg mil-
tefosine, respectively. All extractions and analytical tests
described here were performed on both ‘Miltefos’ batches. For
clarity, when results from both batches were similar, only results
for ‘Miltefos 50’ capsules will be provided and will be referred to
1266 | Analyst, 2012, 137, 1265–1274
as ‘Miltefos’. Only for the NIR analysis, additional results for the
‘Miltefos 10’ capsules will be provided.
‘Impavido’ and ‘Miltefos’ capsules were emptied and the total
content of the capsules was weighed. From the total content of
a capsule (about 200 mg), a portion of 50 mg was separated for
extraction. The 50 mg portion was suspended in 1.25 mL meth-
anol : water (1 : 1, v/v), then the sample was vortexed for 15
seconds and ultrasonicated for 30 min to make sure all miltefo-
sine was extracted. Thereafter the sample was centrifuged
(10 min at 15 000 rpm). The same extraction procedure was also
performed with 1.25 mL of chloroform. For FT-IR spectra, the
extracts in methanol : water (1 : 1, v/v) and chloroform were
subsequently dried under a gentle stream of nitrogen at 40 �C.
2.5 Analysis of samples and equipment
2.5.1 Analysis with FT-IR. Absorbance spectra with a range
of 650 cm�1 to 3700 cm�1 were taken on a FT-IR spectropho-
tometer (FTIR-8400S; Shimadzu, Kyoto, Japan) of the total
capsule contents and their dried extracts in methanol : water
(1 : 1, v/v) and chloroform (Table 1), and were compared to
reference standards of miltefosine, different excipients and an in-
house reference library. The number of scans was set at 16 with
a resolution of 4.0 and a mirror speed of 2.8.
2.5.2 Analysis with LC-MS/MS. Capsule extracts in meth-
anol : water (1 : 1, v/v) (Table 1) were diluted to reach a final
nominal concentration of 10 mg mL�1 in order to avoid
contamination of the apparatus and then 10 mL was directly
injected into a Gemini C18 analytical column (150 mm� 2.0 mm
I.D., 5 mm) within an HP 1100 LC system (Agilent Technologies,
Palo Alto, CA, USA) interfaced to an API2000 triple-quadru-
pole mass spectrometer (Sciex, Thornhill, ON, Canada) by an
electrospray ionization source operated in positive ion mode.
The apparatus was optimized for the detection and quantifica-
tion of miltefosine as previously described.28 The final nominal
concentration in the diluted extracts was either 10 mg mL�1 or
2 mg mL�1 for the capsules with a miltefosine label claim of 50 mg
or 10 mg, respectively. All samples were analyzed in duplicate.
Using the multiple reaction monitoring (MRM) mode the
specific mass transition for miltefosine (Q1:m/z 408.6/Q3:m/z
124.8) was monitored for all diluted extracts. Flow injection
analysis (FIA) was applied to identify any other components in
the extractions: a 10 mL aliquot was directly injected into the
mobile phase and subsequently into the source of the mass
spectrometer without any separation on an analytical column.
Cumulative scans (85 scans in total, MCA mode) in Q1 of the
mass spectrometer were recorded over a mass range of m/z 30–
850 during 1 minute; typically all ions had passed before 0.3 min.
2.5.3 Colorimetric analysis of miltefosine. A colorimetric
assay based on the complexation of the zwitterionic miltefosine
with the anionic ammonium ferrithiocyanate (NH4Fe[NCS]4)
dye was developed.29 The test was derived from an assay devel-
oped for the phosphatidylcholine lecithin, in which it forms
a coloured complex with ammonium ferrithiocyanate, which can
then be extracted in organic solvents.27 This procedure was
modified for miltefosine and 1,2-dichloroethane was used for
extraction of the brown-red coloured complex. Absorption was
This journal is ª The Royal Society of Chemistry 2012
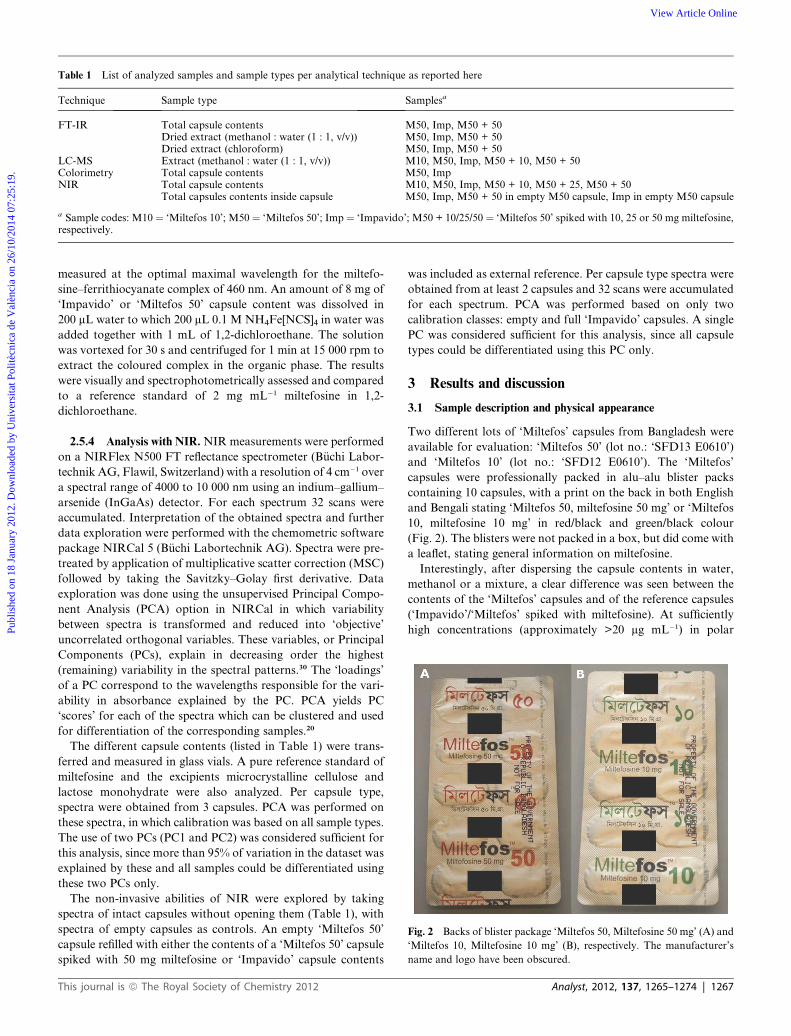
Table 1 List of analyzed samples and sample types per analytical technique as reported here
Technique Sample type Samplesa
FT-IR Total capsule contents M50, Imp, M50 + 50Dried extract (methanol : water (1 : 1, v/v)) M50, Imp, M50 + 50Dried extract (chloroform) M50, Imp, M50 + 50
LC-MS Extract (methanol : water (1 : 1, v/v)) M10, M50, Imp, M50 + 10, M50 + 50Colorimetry Total capsule contents M50, ImpNIR Total capsule contents M10, M50, Imp, M50 + 10, M50 + 25, M50 + 50
Total capsules contents inside capsule M50, Imp, M50 + 50 in empty M50 capsule, Imp in empty M50 capsule
a Sample codes: M10 ¼ ‘Miltefos 10’; M50 ¼ ‘Miltefos 50’; Imp ¼ ‘Impavido’; M50 + 10/25/50 ¼ ‘Miltefos 50’ spiked with 10, 25 or 50 mg miltefosine,respectively.
Fig. 2 Backs of blister package ‘Miltefos 50, Miltefosine 50 mg’ (A) and
‘Miltefos 10, Miltefosine 10 mg’ (B), respectively. The manufacturer’s
name and logo have been obscured.
Publ
ishe
d on
18
Janu
ary
2012
. Dow
nloa
ded
by U
nive
rsita
t Pol
itècn
ica
de V
alèn
cia
on 2
6/10
/201
4 07
:25:
19.
View Article Online
measured at the optimal maximal wavelength for the miltefo-
sine–ferrithiocyanate complex of 460 nm. An amount of 8 mg of
‘Impavido’ or ‘Miltefos 50’ capsule content was dissolved in
200 mL water to which 200 mL 0.1 M NH4Fe[NCS]4 in water was
added together with 1 mL of 1,2-dichloroethane. The solution
was vortexed for 30 s and centrifuged for 1 min at 15 000 rpm to
extract the coloured complex in the organic phase. The results
were visually and spectrophotometrically assessed and compared
to a reference standard of 2 mg mL�1 miltefosine in 1,2-
dichloroethane.
2.5.4 Analysis with NIR.NIR measurements were performed
on a NIRFlex N500 FT reflectance spectrometer (B€uchi Labor-
technik AG, Flawil, Switzerland) with a resolution of 4 cm�1 over
a spectral range of 4000 to 10 000 nm using an indium–gallium–
arsenide (InGaAs) detector. For each spectrum 32 scans were
accumulated. Interpretation of the obtained spectra and further
data exploration were performed with the chemometric software
package NIRCal 5 (B€uchi Labortechnik AG). Spectra were pre-
treated by application of multiplicative scatter correction (MSC)
followed by taking the Savitzky–Golay first derivative. Data
exploration was done using the unsupervised Principal Compo-
nent Analysis (PCA) option in NIRCal in which variability
between spectra is transformed and reduced into ‘objective’
uncorrelated orthogonal variables. These variables, or Principal
Components (PCs), explain in decreasing order the highest
(remaining) variability in the spectral patterns.30 The ‘loadings’
of a PC correspond to the wavelengths responsible for the vari-
ability in absorbance explained by the PC. PCA yields PC
‘scores’ for each of the spectra which can be clustered and used
for differentiation of the corresponding samples.20
The different capsule contents (listed in Table 1) were trans-
ferred and measured in glass vials. A pure reference standard of
miltefosine and the excipients microcrystalline cellulose and
lactose monohydrate were also analyzed. Per capsule type,
spectra were obtained from 3 capsules. PCA was performed on
these spectra, in which calibration was based on all sample types.
The use of two PCs (PC1 and PC2) was considered sufficient for
this analysis, since more than 95% of variation in the dataset was
explained by these and all samples could be differentiated using
these two PCs only.
The non-invasive abilities of NIR were explored by taking
spectra of intact capsules without opening them (Table 1), with
spectra of empty capsules as controls. An empty ‘Miltefos 50’
capsule refilled with either the contents of a ‘Miltefos 50’ capsule
spiked with 50 mg miltefosine or ‘Impavido’ capsule contents
This journal is ª The Royal Society of Chemistry 2012
was included as external reference. Per capsule type spectra were
obtained from at least 2 capsules and 32 scans were accumulated
for each spectrum. PCA was performed based on only two
calibration classes: empty and full ‘Impavido’ capsules. A single
PC was considered sufficient for this analysis, since all capsule
types could be differentiated using this PC only.
3 Results and discussion
3.1 Sample description and physical appearance
Two different lots of ‘Miltefos’ capsules from Bangladesh were
available for evaluation: ‘Miltefos 50’ (lot no.: ‘SFD13 E0610’)
and ‘Miltefos 10’ (lot no.: ‘SFD12 E0610’). The ‘Miltefos’
capsules were professionally packed in alu–alu blister packs
containing 10 capsules, with a print on the back in both English
and Bengali stating ‘Miltefos 50, miltefosine 50 mg’ or ‘Miltefos
10, miltefosine 10 mg’ in red/black and green/black colour
(Fig. 2). The blisters were not packed in a box, but did come with
a leaflet, stating general information on miltefosine.
Interestingly, after dispersing the capsule contents in water,
methanol or a mixture, a clear difference was seen between the
contents of the ‘Miltefos’ capsules and of the reference capsules
(‘Impavido’/‘Miltefos’ spiked with miltefosine). At sufficiently
high concentrations (approximately >20 mg mL�1) in polar
Analyst, 2012, 137, 1265–1274 | 1267
Publ
ishe
d on
18
Janu
ary
2012
. Dow
nloa
ded
by U
nive
rsita
t Pol
itècn
ica
de V
alèn
cia
on 2
6/10
/201
4 07
:25:
19.
View Article Online
solvents, dissolved miltefosine will cause a stable layer of foam
on top of the solution when shaken or stirred. The solutions of
the reference capsules displayed a large layer of foam after vor-
texing, which remained for several hours, indicating the presence
of a surface active compound like miltefosine. However, the
solutions of the dissolved ‘Miltefos’ capsules did not display any
foaming, indicating the absence of a surface active compound in
the solution.
3.2 Identification of miltefosine in the capsule contents
FT-IR, LC-MS/MS, a newly developed colorimetric method and
NIR were used to identify miltefosine in the ‘Miltefos’ capsules.
3.2.1 Identification by FT-IR. FT-IR spectra were taken from
the total contents of the different capsules, reference standard
and excipients, plus dried extracts of the capsule contents
(Table 1). A chloroform extraction of the capsule contents was
attempted as well, because miltefosine is known to be soluble in
chloroform. However, there was no residue after evaporation of
the chloroform phase with the ‘Miltefos’ capsules, indicating that
no miltefosine was present in the chloroform extract of the
‘Miltefos’ capsule contents.
Clearly distinguishable ‘fingerprint’ areas could be identified
for miltefosine from the FT-IR spectra of the pure miltefosine
standard, which are summarized in Table 2. These wavelength
areas are specific for miltefosine and other long-chain phos-
phocholines.31 Representative spectra of ‘Impavido’, ‘Miltefos’
and ‘Miltefos’ spiked with miltefosine are depicted in Fig. 3.
Visual comparison of all spectra revealed that the miltefosine
fingerprint areas are substantially different in all ‘Miltefos’
samples compared to the reference spectra of the pure reference,
‘Impavido’ and ‘Miltefos’ spiked with miltefosine. Only peak
area IV (1100–1050 cm�1) contains a peak both in the spectra of
the ‘Miltefos’ samples and in the reference spectra. However,
closer inspection of this peak reveals a completely different peak
‘profile’.
FT-IR spectra of the dried extracts in methanol : water (1 : 1,
v/v) of the total capsule contents showed that the miltefosine
fingerprints (Table 2) were again clearly recognizable in the
extracts of ‘Impavido’, ‘Miltefos’ spiked with miltefosine
and miltefosine pure reference, but not in the dried extracts of
‘Miltefos’ (spectra not shown).
3.2.2 Identification by LC-MS/MS. The specific mass tran-
sition for miltefosine (Q1: m/z 408.6 / Q3: m/z 124.8) was
monitored for all diluted extracts. In Fig. 4 are shown repre-
sentative chromatograms of extracts of (A) ‘Impavido’, (B)
‘Miltefos’ and (C) ‘Miltefos’ spiked with miltefosine. The milte-
fosine peak present in the chromatograms is depicted in Fig. 4A
Table 2 Miltefosine specific IR-spectral peak areas
Wavenumber (cm�1) Code Description
2950–2850 I High double peak, corresponding1520–1490 II Medium high peak, correspondin1260–1230 III Medium high peak, possibly corr1100–1050 IV High integral broad peak, possibl980–960 V Medium high peak, possibly corr
1268 | Analyst, 2012, 137, 1265–1274
and C, with a typical retention time of 2.8 min and a comparable
peak area (average peak area: 1.1 � 106 cps, with a coefficient of
variation of 11.4%). On the other hand, the chromatograms of
the extracts of ‘Miltefos’ (Fig. 4B) do not show any peak at the
miltefosine mass transition, indicating that miltefosine was not
present in the ‘Miltefos’ capsules.
There was no (additional) ion suppression of matrix compo-
nents in the ‘Miltefos’ capsules spiked with miltefosine compared
to the ‘Impavido’ capsules. Both samples could accurately be
quantified based on a calibration curve of miltefosine in meth-
anol : water (1 : 1, v/v) and their deviation in the calculated
concentration (back-calculated from the analyte peak area) was
within �15%.28
3.2.3 Colorimetric miltefosine test. A colorimetric detection
test was developed to specifically detect and identify miltefosine
using only small amounts of the total capsule contents of an
‘Impavido’ capsule and of a ‘Miltefos’ capsule. The ‘Impavido’
capsule contents showed a deep orange-red colouration of the
lower organic liquid phase, indicating the formation of
a complex between ferrithiocyanate and miltefosine (Fig. 5, vial
3). The dissolved ‘Miltefos’ capsule contents do not yield any red
colouration of the lower organic liquid phase, indicating that
there were no phospholipids or phospholipid derivatives such as
miltefosine present in the ‘Miltefos’ capsule (Fig. 5, vial 4).
However, a very slight purple hue was visible in the ‘Miltefos’
sample corresponding to a complex with maximal absorption at
a wavelength of 490 nm or 510 nm, pointing at the formation of
higher coordination complexes of Fe3+ with thiocyanate. These
types of complexes which typically yield a purple hue were
commonly observed in this test using other detergent-like
compounds, e.g. Tween-20, Triton X-100 or sodium dode-
cylsulfate (results not shown). These other detergent-like
compounds were therefore easily visually differentiated from
miltefosine. The colorimetric assay showed a linear response over
a range of 12.5–800 mg mL�1 miltefosine (R2 ¼ 0.9981) allowing
its semi-quantitative use in combination with a set of miltefosine
standards or possibly even a simple colour chart (results not
shown).
Other additional colorimetric tests were developed in our lab,
making use of either the formation of miltefosine micelles, the
anionic properties of miltefosine, or the specific enzymatic
degradation of miltefosine by phospholipase D (from Strepto-
myces chromofuscus) yielding choline which subsequently can be
detected using choline oxidase (from Alcaligenes sp.) and
horseradish peroxidase (results not shown).29 The latter enzy-
matic test was very sensitive and selective for miltefosine, but is
more expensive and less stable than the tests based on the zwit-
terionic properties of miltefosine and is therefore probably less
suitable for use in resource-poor settings. The ammonium
with CH2 stretching in the long hexadecyl-chaing with CH2 bendingesponding with antisymmetric stretching of the phosphate group (P]O)y corresponding to the phosphate group (PO2 or P–O–C bonds)esponding to the choline group (N–C)
This journal is ª The Royal Society of Chemistry 2012
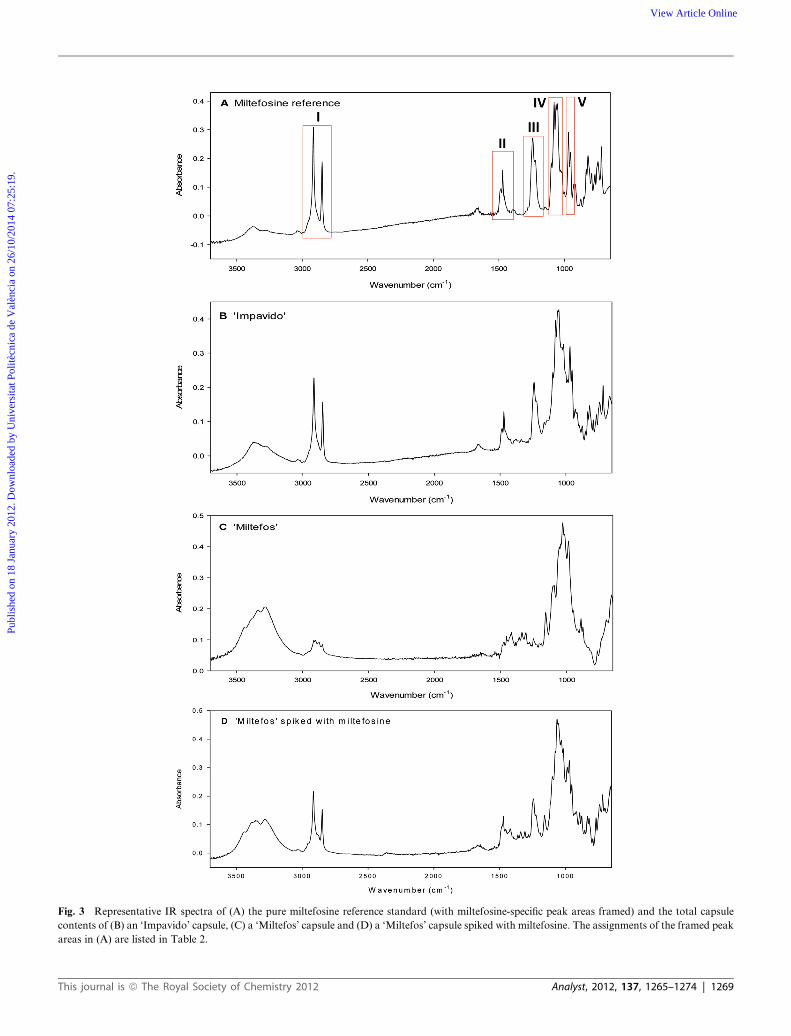
Fig. 3 Representative IR spectra of (A) the pure miltefosine reference standard (with miltefosine-specific peak areas framed) and the total capsule
contents of (B) an ‘Impavido’ capsule, (C) a ‘Miltefos’ capsule and (D) a ‘Miltefos’ capsule spiked with miltefosine. The assignments of the framed peak
areas in (A) are listed in Table 2.
This journal is ª The Royal Society of Chemistry 2012 Analyst, 2012, 137, 1265–1274 | 1269
Publ
ishe
d on
18
Janu
ary
2012
. Dow
nloa
ded
by U
nive
rsita
t Pol
itècn
ica
de V
alèn
cia
on 2
6/10
/201
4 07
:25:
19.
View Article Online
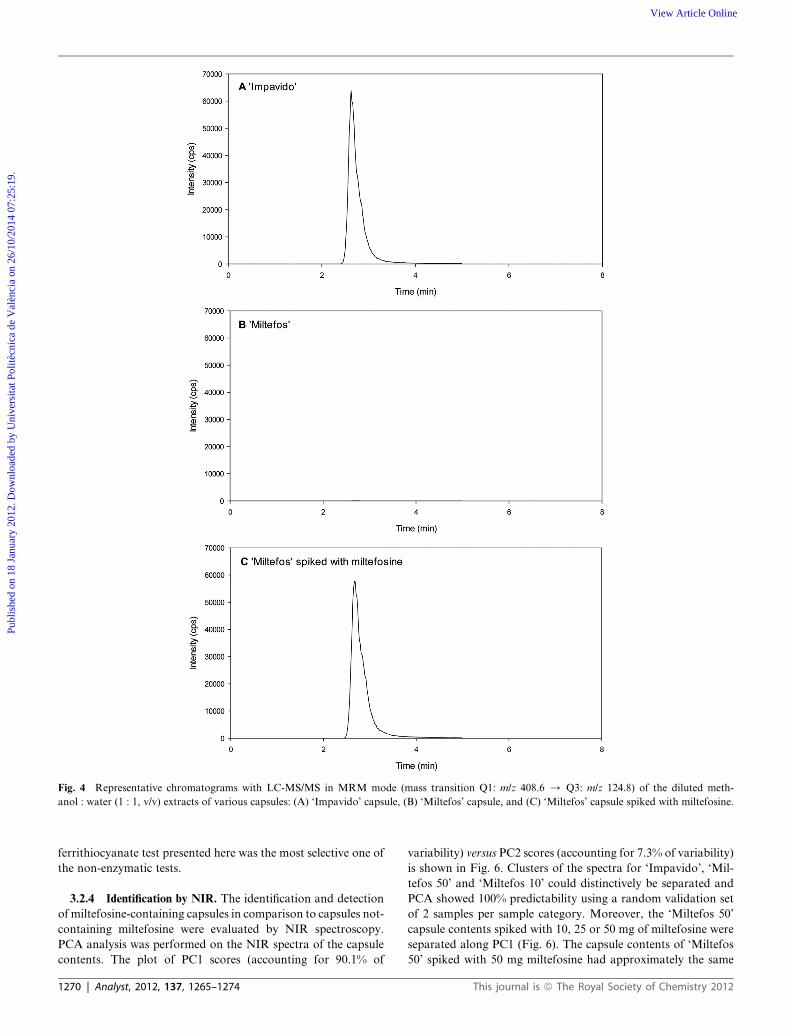
Fig. 4 Representative chromatograms with LC-MS/MS in MRM mode (mass transition Q1: m/z 408.6 / Q3: m/z 124.8) of the diluted meth-
anol : water (1 : 1, v/v) extracts of various capsules: (A) ‘Impavido’ capsule, (B) ‘Miltefos’ capsule, and (C) ‘Miltefos’ capsule spiked with miltefosine.
Publ
ishe
d on
18
Janu
ary
2012
. Dow
nloa
ded
by U
nive
rsita
t Pol
itècn
ica
de V
alèn
cia
on 2
6/10
/201
4 07
:25:
19.
View Article Online
ferrithiocyanate test presented here was the most selective one of
the non-enzymatic tests.
3.2.4 Identification by NIR. The identification and detection
of miltefosine-containing capsules in comparison to capsules not-
containing miltefosine were evaluated by NIR spectroscopy.
PCA analysis was performed on the NIR spectra of the capsule
contents. The plot of PC1 scores (accounting for 90.1% of
1270 | Analyst, 2012, 137, 1265–1274
variability) versus PC2 scores (accounting for 7.3% of variability)
is shown in Fig. 6. Clusters of the spectra for ‘Impavido’, ‘Mil-
tefos 50’ and ‘Miltefos 10’ could distinctively be separated and
PCA showed 100% predictability using a random validation set
of 2 samples per sample category. Moreover, the ‘Miltefos 50’
capsule contents spiked with 10, 25 or 50 mg of miltefosine were
separated along PC1 (Fig. 6). The capsule contents of ‘Miltefos
50’ spiked with 50 mg miltefosine had approximately the same
This journal is ª The Royal Society of Chemistry 2012
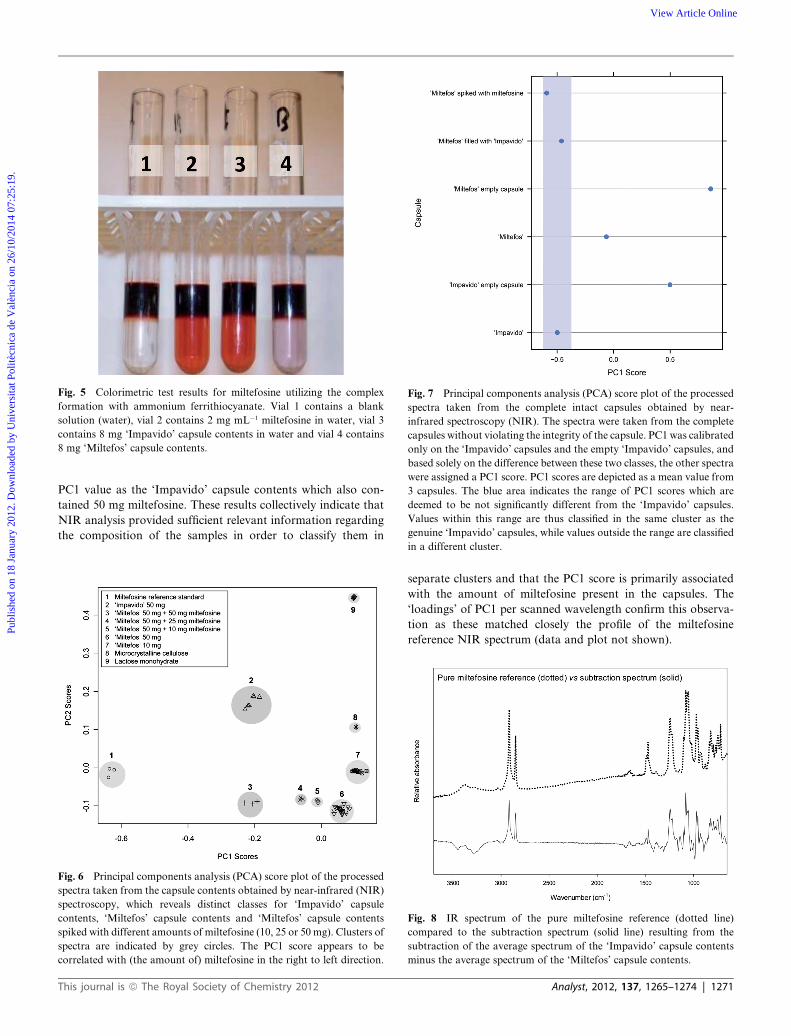
Fig. 5 Colorimetric test results for miltefosine utilizing the complex
formation with ammonium ferrithiocyanate. Vial 1 contains a blank
solution (water), vial 2 contains 2 mg mL�1 miltefosine in water, vial 3
contains 8 mg ‘Impavido’ capsule contents in water and vial 4 contains
8 mg ‘Miltefos’ capsule contents.
Fig. 7 Principal components analysis (PCA) score plot of the processed
spectra taken from the complete intact capsules obtained by near-
infrared spectroscopy (NIR). The spectra were taken from the complete
capsules without violating the integrity of the capsule. PC1 was calibrated
only on the ‘Impavido’ capsules and the empty ‘Impavido’ capsules, and
based solely on the difference between these two classes, the other spectra
were assigned a PC1 score. PC1 scores are depicted as a mean value from
3 capsules. The blue area indicates the range of PC1 scores which are
deemed to be not significantly different from the ‘Impavido’ capsules.
Values within this range are thus classified in the same cluster as the
genuine ‘Impavido’ capsules, while values outside the range are classified
Publ
ishe
d on
18
Janu
ary
2012
. Dow
nloa
ded
by U
nive
rsita
t Pol
itècn
ica
de V
alèn
cia
on 2
6/10
/201
4 07
:25:
19.
View Article Online
PC1 value as the ‘Impavido’ capsule contents which also con-
tained 50 mg miltefosine. These results collectively indicate that
NIR analysis provided sufficient relevant information regarding
the composition of the samples in order to classify them in
Fig. 6 Principal components analysis (PCA) score plot of the processed
spectra taken from the capsule contents obtained by near-infrared (NIR)
spectroscopy, which reveals distinct classes for ‘Impavido’ capsule
contents, ‘Miltefos’ capsule contents and ‘Miltefos’ capsule contents
spiked with different amounts of miltefosine (10, 25 or 50 mg). Clusters of
spectra are indicated by grey circles. The PC1 score appears to be
correlated with (the amount of) miltefosine in the right to left direction.
in a different cluster.
This journal is ª The Royal Society of Chemistry 2012
separate clusters and that the PC1 score is primarily associated
with the amount of miltefosine present in the capsules. The
‘loadings’ of PC1 per scanned wavelength confirm this observa-
tion as these matched closely the profile of the miltefosine
reference NIR spectrum (data and plot not shown).
Fig. 8 IR spectrum of the pure miltefosine reference (dotted line)
compared to the subtraction spectrum (solid line) resulting from the
subtraction of the average spectrum of the ‘Impavido’ capsule contents
minus the average spectrum of the ‘Miltefos’ capsule contents.
Analyst, 2012, 137, 1265–1274 | 1271
Publ
ishe
d on
18
Janu
ary
2012
. Dow
nloa
ded
by U
nive
rsita
t Pol
itècn
ica
de V
alèn
cia
on 2
6/10
/201
4 07
:25:
19.
View Article Online
The excipients lactose and microcrystalline cellulose could be
separated along the PC2 axis (Fig. 6), which was thus informa-
tive about the amount or origin of excipients in the capsule
contents. Based on the PC2 scores, ‘Impavido’ could be differ-
entiated from ‘Miltefos 50’ spiked with 50 mg miltefosine
(Fig. 6), indicating a difference in composition, besides the
miltefosine content. More interestingly, ‘Miltefos 50’ and
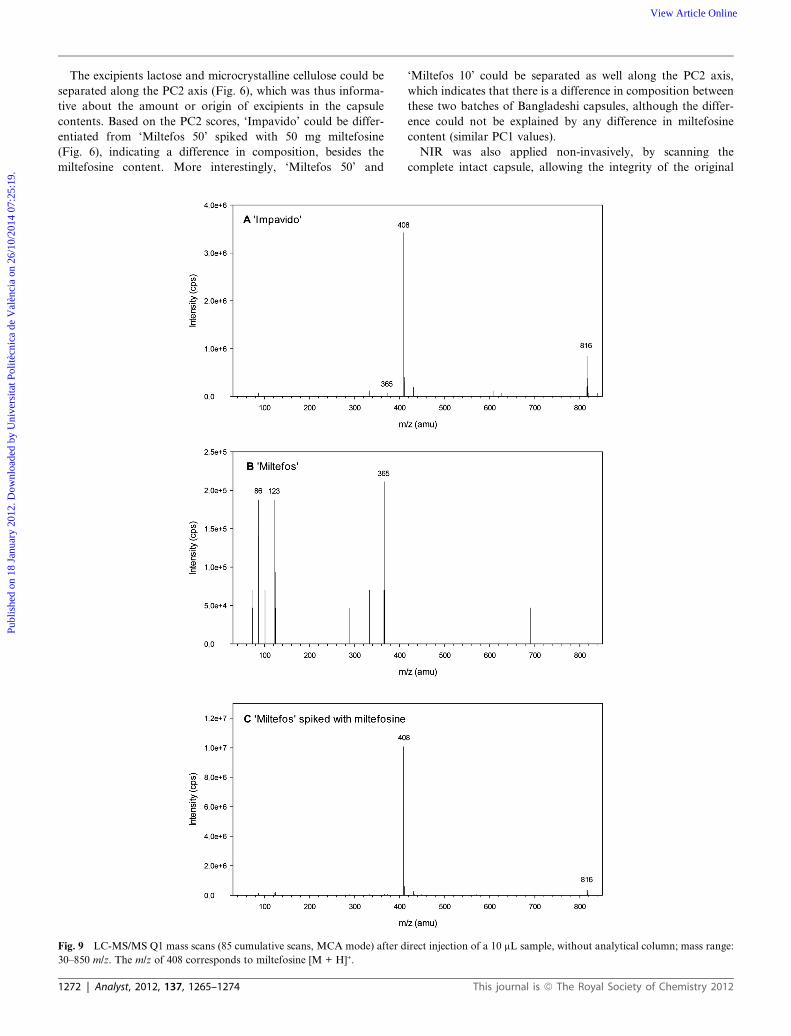
Fig. 9 LC-MS/MS Q1 mass scans (85 cumulative scans, MCA mode) after d
30–850 m/z. The m/z of 408 corresponds to miltefosine [M + H]+.
1272 | Analyst, 2012, 137, 1265–1274
‘Miltefos 10’ could be separated as well along the PC2 axis,
which indicates that there is a difference in composition between
these two batches of Bangladeshi capsules, although the differ-
ence could not be explained by any difference in miltefosine
content (similar PC1 values).
NIR was also applied non-invasively, by scanning the
complete intact capsule, allowing the integrity of the original
irect injection of a 10 mL sample, without analytical column; mass range:
This journal is ª The Royal Society of Chemistry 2012
Publ
ishe
d on
18
Janu
ary
2012
. Dow
nloa
ded
by U
nive
rsita
t Pol
itècn
ica
de V
alèn
cia
on 2
6/10
/201
4 07
:25:
19.
View Article Online
capsules. Based solely on the difference between processed
spectra of full and empty ‘Impavido’ capsules, a single PC
score (PC1) was calibrated and assigned to other processed
spectra of total capsules obtained by NIR (Fig. 7). This yielded
a classification which clustered the ‘Impavido’ capsules
together with ‘Miltefos 50’ capsules spiked with miltefosine and
also with ‘Miltefos 50’ capsules filled with ‘Impavido’ contents,
but more importantly not together with original ‘Miltefos 50’
capsules and empty ‘Miltefos 50’ and ‘Impavido’ capsules
(Fig. 7). This clearly indicates that the classification by NIR
spectroscopy of the complete capsules was based on the pres-
ence or absence of miltefosine, which was again confirmed by
agreement between the ‘loadings’ of the PC1 score per scanned
wavelength with the NIR spectrum of miltefosine (data and
plot not shown).
3.3 Analysis of the ‘Miltefos’ capsules
3.3.1 Comparison of the FT-IR spectra. Comparison of the
obtained FT-IR spectra to our in-house spectral library of
common drugs and excipients revealed that the spectra of the
‘Miltefos’ capsule contents (Fig. 3C) matched most closely with
microcrystalline cellulose (Avicel) and lactose monohydrate
(spectra not shown), which both have similar structural
components and are often used excipients for the filling of
capsules. Comparing these spectra with the spectra obtained
from the ‘Miltefos’ contents revealed no further unexplained
peaks. This led to the conclusion that the main ingredients in the
capsule contents are either lactose, microcrystalline cellulose or
a combination of both. The addition of small amounts of other
excipients cannot be excluded on the basis of this analysis. This is
further explored by subtraction of the spectra, as described in the
following section.
The FT-IR spectra of the dried methanol : water (1 : 1, v/v)
extracts of the ‘Miltefos’ capsules showed clear similarity with
the spectrum of lactose (spectrum not shown). Lactose is partly
soluble in a methanol : water (1 : 1, v/v) mixture, while micro-
crystalline cellulose fails to dissolve. During extraction the
formation of non-soluble sediment was observed, which indeed
could be identified as microcrystalline cellulose with spectral
analysis.
3.3.2 Subtraction of the FT-IR spectra. The components of
the total capsule contents of the ‘Impavido’ capsules were
compared with those of ‘Miltefos’ capsules by subtraction of the
average FT-IR spectra. The resulting subtraction spectrum
(Fig. 8) indicates the differences in chemical bonds of ingredients
in the two formulations: peaks indicate absorbing chemical
bonds that are absent in the ‘Miltefos’ capsule contents, but
present in the contents of the ‘Impavido’ capsule; and troughs
indicate the inverse. The subtraction spectrum corresponds
exactly to the spectrum of the pure miltefosine reference, indi-
cating that the major difference between the two capsules is the
absence of miltefosine in the ‘Miltefos’ capsules.
No other significant, high intensity, identifiable aberrations
were observed in the subtraction spectrum. The broad medium
troughs located at 3200 and 3300 cm�1 (Fig. 8) are probably
caused by the higher relative amount of lactose and microcrys-
talline cellulose in the ‘Miltefos’ capsules.
This journal is ª The Royal Society of Chemistry 2012
3.3.3 LC-MS/MS Q1 mass scans. To characterize the
contents of the ‘Miltefos’ capsules, a Q1 mass spectrum was
obtained of the diluted supernatant of their extracts. In Fig. 9,
representative Q1 mass spectra are depicted of extracts of (A)
‘Impavido’, (B) ‘Miltefos’ and (C) ‘Miltefos’ spiked with milte-
fosine. In Fig. 9A and C, the most abundant ion is miltefosine
[M + H]+ at m/z 408 with a very high intensity, but also visible is
a miltefosine dimer [2M + H]+ at m/z 815. In the mass spectrum
of ‘Miltefos’ (Fig. 9B) no highly ionized masses appear to be
present (all lower than 2.5 � 105 cps). No (either mono- or di-)
miltefosine ions could be detected in any of the Q1 mass spectra
of the ‘Miltefos’ samples. The recurrent masses that are recog-
nizable in the spectra of the extracts of the ‘Miltefos’ capsules are
m/z 365 (lactose, [M + Na]+), m/z 123, m/z 86 and m/z 72 (all
unidentifiable).
4 Conclusion
The diverse set of different analytical chemical techniques pre-
sented here was found to be very useful to detect and identify
miltefosine, both qualitatively and quantitatively, in pharma-
ceutical preparations. Using these complementary techniques it
was possible to conclude that no miltefosine was present in both
batches of ‘Miltefos’ capsules under investigation, in contrast to
the genuine ’Impavido’ product. Characterization of the ‘Milte-
fos’ capsules by FT-IR, LC-MS/MS and NIR could only reveal
the presence of two excipients, i.e. lactose and microcrystalline
cellulose, and no other active pharmaceutical ingredient could be
demonstrated or identified. NIR was applied to differentiate not
only between the capsule contents of the two ‘Miltefos’ batches
but also between capsules without and with (added) miltefosine
while leaving the integrity of the capsules intact.
The application of a simple, rapid, inexpensive colorimetric
test for the demonstration of miltefosine was successfully
demonstrated. The test exhibited a linear response over a range
of 12.5 to 800 mg mL�1 of miltefosine and can thus also be used
semi-quantitatively. This simple test is very useful for application
in the field without the need for extensive laboratory equipment,
which is particularly practical in resource-poor settings.
In conclusion, we present a platform of analytical and chem-
ical techniques that were all able to identify a suspected coun-
terfeit miltefosine product. Most techniques can also be used
(semi-)quantitatively, which enables the identification of drugs
containing subtherapeutic quantities of miltefosine.
Acknowledgements
We would like to thank Johannes Moes for his extensive help
with the NIR spectroscopic analyses.
References
1 International Medical Products Anti-Counterfeiting Taskforce(IMPACT), 2006.
2 J.-M. Caudron, N. Ford, M. Henkens, C. Mac�e, R. Kiddle-Monroeand J. Pinel, Trop. Med. Int. Health, 2008, 13, 1062–1072.
3 P. N. Newton, M. D. Green, F. M. Fern�andez, N. P. J. Day andN. J. White, Lancet Infect. Dis., 2006, 6, 602–613.
4 T. Kelesidis, I. Kelesidis, P. I. Rafailidis and M. E. Falagas,J. Antimicrob. Chemother., 2007, 60, 214–236.
5 P. N. Newton, M. D. Green and F. M. Fern�andez, Trends Pharmacol.Sci., 2010, 31, 99–101.
Analyst, 2012, 137, 1265–1274 | 1273
Publ
ishe
d on
18
Janu
ary
2012
. Dow
nloa
ded
by U
nive
rsita
t Pol
itècn
ica
de V
alèn
cia
on 2
6/10
/201
4 07
:25:
19.
View Article Online
6 K. Senior, Lancet Infect. Dis., 2008, 8, 666.7 P. N. Newton, S. J. Lee, C. Goodman, F. M. Fern�andez, S. Yeung,S. Phanouvong, H. Kaur, A. A. Amin, C. J. M. Whitty,G. O. Kokwaro, N. Lindeg�ardh, P. Lukulay, L. J. White,N. P. J. Day, M. D. Green and N. J. White, PLoS Med., 2009, 6,e1000052.
8 F. M. Fernandez, D. Hostetler, K. Powell, H. Kaur, M. D. Green,D. C. Mildenhall and P. N. Newton, Analyst, 2011, 136, 3073–3082.
9 World Health Organization—Regional Office for South-East Asia,Programme Manager’s Meeting on Elimination of Kala-azar in theSouth-East Asia Region, Faridabad, Haryana, India, 17–19 February2009, World Health Organization, 2010.
10 C. Mathers and World Health Organization, The Global Burden ofDisease: 2004 Update, World Health Organization, Geneva,Switzerland, 2008.
11 P. C. Sengupta, Indian Med. Gaz., 1947, 82, 281–286.12 J.-C. Wolff, L. A. Thomson and C. Eckers, Rapid Commun. Mass
Spectrom., 2003, 17, 215–221.13 K. A. Hall, P. N. Newton,M. D. Green,M. De Veij, P. Vandenabeele,
D. Pizzanelli, M. Mayxay, A. Dondorp and F. M. Fernandez, Am. J.Trop. Med. Hyg., 2006, 75, 804–811.
14 H. Jiang, S.-L. Wu, B. L. Karger and W. S. Hancock, Biotechnol.Prog., 2009, 25, 207–218.
15 K. E. Arthur, J.-C. Wolff and D. J. Carrier, Rapid Commun. MassSpectrom., 2004, 18, 678–684.
16 C. Ricci, L. Nyadong, F. M. Fernandez, P. N. Newton andS. G. Kazarian, Anal. Bioanal. Chem., 2007, 387, 551–559.
17 C. Ricci, C. Eliasson, N. A.Macleod, P. N. Newton, P. Matousek andS. G. Kazarian, Anal. Bioanal. Chem., 2007, 389, 1525–1532.
1274 | Analyst, 2012, 137, 1265–1274
18 P.-Y. Sacr�e, E. Deconinck, T. De Beer, P. Courselle,R. Vancauwenberghe, P. Chiap, J. Crommen and J. O. De Beer,J. Pharm. Biomed. Anal., 2010, 53, 445–453.
19 A. Lanzarotta, K. Lakes, C. A. Marcott, M. R. Witkowski andA. J. Sommer, Anal. Chem., 2011, 83, 5972–5978.
20 I. Storme-Paris, H. Rebiere, M. Matoga, C. Civade, P.-A. Bonnet,M.H.Tissier andP.Chaminade,Anal.Chim.Acta, 2010,658, 163–174.
21 F. E. Dowell, E. B. Maghirang, F. M. Fernandez, P. N. Newton andM. D. Green, J. Pharm. Biomed. Anal., 2008, 48, 1011–1014.
22 M. B. Lopes, J.-C. Wolff, J. M. Bioucas-Dias andM. A. T. Figueiredo, Anal. Chim. Acta, 2009, 641, 46–51.
23 X.-M. Chong, C.-Q. Hu, Y.-C. Feng and H.-H. Pang, Vib. Spectrosc.,2009, 49, 196–203.
24 O. Rodionova, A. Pomerantsev, L. Houmøller, A. Shpak andO. Shpigun, Anal. Bioanal. Chem., 2010, 397, 1927–1935.
25 T.Sakamoto,Y.FujimakiandY.Hiyama,Pharmazie, 2008,63, 628–632.26 S. H. Scafi and C. Pasquini, Analyst, 2001, 126, 2218–2224.27 J. C. Stewart, Anal. Biochem., 1980, 104, 10–14.28 T. P. C. Dorlo, M. J. X. Hillebrand, H. Rosing, T. A. Eggelte, P. J. de
Vries and J. H. Beijnen, J. Chromatogr., B: Anal. Technol. Biomed.Life Sci., 2008, 865, 55–62.
29 T. A. Eggelte, T. P. C. Dorlo and P. J. de Vries, in Abstract book—6thEuropean Conference on Tropical Medicine and International Health,Verona, Italy, 2009, p. 183.
30 D. Massart, B. Vandeginste, L. Buydens, S. De Jong, P. Lewi andJ. Smeyers-Verbeke, Handbook of Chemometrics and Qualimetrics:Part A, Elsevier Science Pub Co, 1997.
31 W. Pohle, D. R. Gauger, H. Fritzsche, B. Rattay, C. Selle, H. Binderand H. B€ohlig, J. Mol. Struct., 2001, 563–564, 463–467.
This journal is ª The Royal Society of Chemistry 2012