characteristics of water, sediment, and benthic communities of the wolf ... · ·...
TRANSCRIPT

U.S. Department of the Interior U.S. Geological Survey
Characteristics of Water, Sediment, and Benthic Communities of the Wolf River, Menominee Indian Reservation, Wisconsin, Water Years 1986-98Water-Resources Investigations Report 01-4019
T\ Prepared in cooperation with the
Menominee Indian Tribe of Wisconsin
science for a changing world


CHARACTERISTICS OF WATER, SEDIMENT, AND BENTHIC COMMUNITIES OF THE WOLF RIVER, MENOMINEE INDIAN RESERVATION, WISCONSIN, WATER YEARS 1986-98By Herbert S. Garn, Barbara C. Scudder, Kevin D. Richards, and Daniel J. Sullivan
U.S. GEOLOGICAL SURVEY Water-Resources Investigations Report 01-4019
Prepared in cooperation with the MENOMINEE INDIAN TRIBE OF WISCONSIN
Middleton, Wisconsin 2001
USGSscience for a changing world

U.S. DEPARTMENT OF THE INTERIOR Gale A. Norton, Secretary
U.S. GEOLOGICAL SURVEY
Charles G. Groat, Director
The use of firm, trade, and brand names in this report is for identification purposes only and does not constitute endorsement by the U.S. Government.
For additional information write to:
District Chief U.S. Geological Survey 8505 Research Way Middleton, Wl 53562-3586
Copies of this report can be purchased from:
U.S. Geological Survey Branch of Information Services Box 25286 Denver, CO 80225-0286

CONTENTS
Abstract .....................................................................................................................................................................^ 1Introduction............................................................................................_^ 1
Purpose and scope....................................................................................................................................................... 3Description of the study area ...................................................................................................................................... 3Acknowledgments........................................................^ 6
Methods of data collection and analysis ............................................................................................................................... 6Water quality and discharge data ................................................................................................................................ 6
Data collection.................................................................................................................................................. 8Laboratory analyses.......................................................................................................................................... 8Data analyses..................................................................................................................................................... 9
Streambed sediment and biological data..................................................................................................................... 9Data collection ................................................................................................................................................. 9Laboratory analyses.......................................................................................................................................... 10Data analyses..................................................................................................................................................... 12
Characteristics of stream water, sediment, and benthic communities................................................................................... 12Chemical characteristics of water............................................................................................................................... 12
Field measurements........................................................................................................................................... 15Major ions......................................................................................................................................................... 15Nutrients...............................................................^ 15
Nitrogen .................................................................................................................................................. 15Phosphorus.............................................................................................................................................. 19
Trace elements .................................................................................................................................................. 19Pesticides..................................................................................................^ 23
Physical and chemical characteristics of sediment..................................................................................................... 23Particle size....................................................................................................................................................... 23Trace elements .................................................................................................................................................. 28
Characteristics of benthic communities...................................................................................................................... 30Trace elements .................................................................................................................................................. 30
Fish tissues.............................................................................................................................................. 30Caddisfly tissues ..................................................................................................................................... 32
Invertebrate communities.................................................................................................................................. 33Algal communities............................................................................................................................................ 34
Summary and conclusions .................................................................................................................................................... 35References..........................................................................................................._ 36Appendixes 1-10:
1. Constituents and minimum reporting levels for U.S. Geological Survey National Water-Quality Laboratory for major ions, chemical oxygen demand, residue, and specific conductance in water samples during 1986-98............................................................................_^ 40
2. Constituents and minimum reporting levels for U.S. Geological Survey National Water-Quality Laboratoryfor nutrients in water samples during 1986-98 ..................................................................................................... 40
3. Constituents and minimum reporting levels for U.S. Geological Survey National Water-Quality Laboratoryfor trace elements in water samples during 1986-98 ............................................................................................ 41
4. Constituents and minimum reporting levels for U.S. Geological Survey National Water-Quality Laboratoryfor pesticides analyzed from 1995-96................................................................................................................... 42
5. Constituents and minimum reporting levels for U.S. Geological Survey National Water-Quality Laboratoryfor pesticides analyzed in water samples during 1997 and 1998 .......................................................................... 43
6. Concentrations of trace elements in fine streambed sediment (less than 0.062 mm) from sites on theWolf River in the vicinity of the Menominee Indian Reservation......................................................................... 44
7. Concentrations of major ions and carbon in fine streambed sediment (less than 0.062 mm) from sites on theWolf River in the vicinity of the Menominee Indian Reservation......................................................................... 45
8. Concentrations of elements in biota from sites on the Wolf River in the vicinity of the MenomineeIndian Reservation................................................................................................................................................. 46
9. Invertebrate taxa of the Wolf River at Keshena and near Langlade, Wis., during 1998........................................... 4810. Algal taxa of the Wolf River near Langlade and at Keshena, Wis., during 1998...................................................... 52
CONTENTS

CONTENTS Continued
FIGURES
1. Study area, location of streamflow-gaging and data-collection stations 04075050 at Highway M near Langlade, 04077100 at Keshena, and 04077400 near Shawano, Menominee Indian Reservation, Wisconsin..................................................................................................................^ 2
2-4. Photos of:2. Wolf River downstream from Highway M near Langlade (A); Wolf River at Keshena (B).......................... 73. Method for collecting caddisfly larvae from woody debris and rocks for trace-element analysis ................. 114. Invertebrate community sampling method using a modified Surber net, Wolf River near Langlade
biological site.............................................................................................................................................. 115-6. Graphs showing:
5. Daily mean discharge of the Wolf River at Langlade 04074950, 1985-98 .................................................... 136. Daily mean discharge of the Wolf River at Shawano 04077400, 1985-98 .................................................... 14
7. Diagram showing proportions of major ions at Wolf River at Keshena, Wis., station 04077100,March 11, 1998 ................................................................................................................................................ 19
TABLES
1. Wisconsin Initiative for Statewide Cooperation on Landscape Analysis and Data (WISCLAND)land use/land cover for the Wolf River near Shawano, Wis. (04077400)........................................................ 4
2. Description of data-collection stations for data discussed in this report.............................................................. 63. Discharge and water-quality data that are present in U.S. Geological Survey AD APS and QWDATA
data bases from the Wolf River near the Menominee Indian Reservation....................................................... 84. Statistical summary of water-quality data, April 1986-September 1998, at the Wolf River at Highway M
near Langlade, Wis., station 04075050............................................................................................................ 165. Statistical summary of water-quality data, May 1995-September 1998, at the Wolf River at Keshena,
Wis., station (M077100........................................................._ 176. Statistical summary of water-quality data, October 1989-September 1996, at the Wolf River near
Shawano, Wis., station 04077400.................................................................................................................... 187. Summary of trace-element data in water, April 1986-September 1998, at the Wolf River at Highway M
near Langlade, Wis., station 04075050............................................................................................................ 218. Summary of trace-element data in water, May 1995-September 1998, at the Wolf River at Keshena, Wis.,
station 04077100.............................................................................................................................................. 229. Summary of trace-element data in water, October 1989-September 1996, at the Wolf River near
Shawano, Wis., station 04077400.................................................................................................................... 2310. Summary of pesticide data (dissolved), 1995-98, for the Wolf River at Highway M near Langlade, Wis.,
station 04075050.............................................................................................................................................. 2411. Summary of pesticide data (dissolved), 1995-98, for the Wolf River at Keshena, Wis., station 04077100....... 2612. Particle-size data for bulk (<2 mm) depositional sediment collected from the Wolf River near Langlade
and at Keshena, 1995-98 ................................................................................................................................. 2813. Statistical summary of trace elements and carbon in fine (<0.062 mm) streambed sediment from the
Wolf River near Langlade and at Keshena, Wis., 1995-98 ............................................................................. 2914. Statistical summary of trace elements in white sucker (Catostomus commersoni) livers from
the Wolf River near Langlade and at Keshena. Wis., 1995-98 ....................................................................... 3015. Statistical summary of trace elements in whole caddisfly larvae (Hydropsyche/Ceratopsyche spp.)
from the Wolf River near Langlade and at Keshena, Wis., 1995-98............................................................... 3216. Benthic macroinvertebrate metrics with respect to relative abundance in richest-targeted habitat for the
Wolf River at Keshena and near Langlade, Wis., 1998 ................................................................................... 3317. Distribution of benthic algal taxa with regard to phylum for the Wolf River near Langlade, and at
Keshena, Wis., 1998......................................................................................................................................... 3418. Benthic algal metrics for diatoms only with respect to relative abundance in richest-targeted habitat for
the Wolf River near Langlade and at Keshena, Wis., 1998 ............................................................................. 35
IV CONTENTS

CONVERSION FACTORS, VERTICAL DATUM, AND ABBREVIATED WATER-QUALITY UNITS
Multiply ___ By _____________To Obtain
millimeter (mm)inch (in.)
foot (ft)meter (m)
square meter (m2)mile (mi)
square mile (mi2)square centimeter (cm2)
0.039425.4
0.30483.281
10.761.6092.5900.1550
inchmillimetermeterfootsquare footkilometersquare kilometersquare inch
Temperature in degrees Celsius (°C) can be converted to degrees Fahrenheit (°F) by use of the following equation:°F= 1.8(°C) + 32.
Vertical Datum: In this report "sea level" refers to the National Geodetic Vertical Datum of 1929 (NGVD of 1929) a geodetic datum derived from a general adjustment of the first-order level of both the United States and Canada, formerly called Sea Level Datum of 1929.
Water year: Water year is defined as the period beginning October 1 and ending September 30, designated by the calendar year in which it ends.
Abbreviated water-quality units used in this report: Chemical concentrations and water temperature are given in metric units. Chemical concentration is given in milligrams per liter (mg/L), micrograms per liter (H-g/L), or nanogram per liter (ng/L). Milligrams per liter is a unit expressing the concentration of chemical constituents in solution as weight (milligrams) of solute per unit volume (liter) of water. One thou sand micrograms per liter is equivalent to one milligram per liter. For concentrations less than 7,000 mg/L, the numerical value is the same as for concentrations in parts per million. Other units of measurement used in this report are microsiemens per centimeter at 25° Celsius (|aS/cm), number of algal cells per square centimeter (cell/cm2), and resistance given in megaohms (Mohm).
Specific conductance of water is expressed in microsiemens per centimeter at 25 degrees Celsius (jaS/cm). This unit is equivalent to micromhos per centimeter at 25 degrees Celsius (|amho/cm), formerly used by the U.S. Geological Survey.
Other Abbreviations Used in this Report:
MCL Maximum Contaminant Level
MDL Minimum Detection Limit
MRL Method Reporting Level
MTV Mean Tolerance Value
NAWQA National Water-Quality Assessment Program
NWQL National Water-Quality Laboratory, U.S. Geological Survey
CONVERSION FACTORS, VERTICAL DATUM, AND ABBREVIATED WATER-QUALITY UNITS V

Printed on recycled paper

Characteristics of Water, Sediment, and Benthic Communities of the Wolf River, Menominee Indian Reservation, Wisconsin, Water Years 1986-98
By Herbert S. Garn, Barbara C. Scudder, Kevin D. Richards, and Daniel J. Sullivan
Abstract
Analyses and interpretation of water quality, sediment, and biological data from water years 1986 through 1998 indicated that land use and other human activities have had only minimal effects on water quality in the Wolf River upstream from and within the Menominee Indian Reserva tion in northeastern Wisconsin. Relatively high concentrations of calcium and magnesium (natural hardness), iron, manganese, and aluminum were measured in Wolf River water samples during water years 1986-98 from the three sampled sites and attributed to presence of highly mineral ized geologic materials in the basin. Average cal cium and magnesium concentrations varied from 22-26 milligrams per liter (mg/L) and 11-13 mg/L, respectively. Average iron concen trations ranged from 290-380 micrograms per liter (u,g/L); average manganese concentrations ranged from 53-56 mg/L. Average aluminum concentra tions ranged from 63-67 (ig/L. Mercury was present in water samples but concentrations were not at levels of concern. Levels of Kjeldahl nitro gen, ammonia, nitrite plus nitrate, total phospho rus, and orthophosphorus in water samples were often low or below detection limits (0.01- 0.10 mg/L). Trace amounts of atrazine (maximum concentration of 0.031 ng/L), deethylatrazine (maximum 0.032 (ig/L), and alachlor (maximum of 0.002 (ig/L) were detected. Low concentrations of most trace elements were found in streambed sediment.
Tissues of fish and aquatic invertebrates col lected once each year from 1995 through 1998 at the Langlade and Keshena sites, near the northern and southern boundaries of the Reservation,
respectively, were low in concentrations of most trace elements. Arsenic and silver in fish livers from both sites were less than or equal to 2 jig/g arsenic and less than 1 (ig/g silver for dry weight analysis, and concentrations of antimony, beryl lium, cadmium, cobalt, lead, nickel, and uranium were all below detection limits (less than 1 (ig/g dry weight). Concentrations of most other trace elements in fish were low, with the exceptions of chromium, copper, mercury, and selenium; how ever, these concentrations are not at levels of con cern. Concentrations of all trace elements analyzed in whole caddisfly larvae also were low compared to those reported in the literature.
During 1998, a total of 48 species of macro- invertebrates were identified at each of two sam pled sites, with similar numbers of genera represented at both: 41 at Keshena and 44 at Lang lade. The percentage EFT (Ephemeroptera, Plecop- tera, and Trichoptera) was 52 at Keshena and 77 at Langlade; these relatively large percentages sug gest very good to excellent water quality at these sites. A total of 52 algal taxa were identified at the Wolf River near Langlade. Diatoms made up 96 percent of the algal biomass. A total of 58 algal taxa were identified at Keshena, including 48 dia tom taxa (83 percent). Although diatoms accounted for just 22 percent of the algal relative abundance, in cells per square centimeter, diatoms contributed 91 percent of the total algal biomass. The overall biological integrity of the Keshena and Langlade sites, based on diversity, siltation, and pollution indexes for diatoms is excellent.
INTRODUCTION
The Menominee Indian Reservation constitutes Menominee County in northern Wisconsin (fig. 1).
Abstract

88°50' 88°30'
45°07'
44°57'
Menominee Indian Reservation
MENOMINEE'COUNTY
SHAWANO. COUNTY
Figure 1. Study area, location of streamflow-gaging and data-collection stations 04075050 at Highway M near Langlade, 04077100 at Keshena, and 04077400 near Shawano, Menominee Indian Reservation, Wisconsin.
2 Characteristics of Water, Sediment, and Benthic Communities of the Wolf River, Menominee Indian Reservation, Wisconsin, Water Years 1986-98

Maintaining the quality and pristine nature of rivers and ground water on the Reservation is extremely important to the Menominee Indian Tribe. Tribal Ordinances have been established to protect the integrity of the Reserva tion waters. Additionally, the Wolf River is a Congres- sionally-designated Wild and Scenic River from the northern boundary of the Reservation to Keshena Falls. For these reasons, the U.S. Geological Survey (USGS), in cooperation with the Menominee Indian Tribe of Wisconsin, conducted a detailed assessment of the qual ity of streamwater on the reservation, including analysis of sediment and selected aquatic organisms. A descrip tion of general surface- and ground-water quality on the Menominee Indian Reservation was previously pub lished in Krohelski and others (1994).
Purpose and Scope
This report documents the quality of water, sedi ment, and selected biological organisms in the Wolf River from water year 1986 through water year 1998 within and near the north and south boundaries of the Menominee Indian Reservation (fig. 1). Data contained in this report, along with the referenced data and reports, provide a historical data base from which any substantial future changes may be determined in water- quality, sediment composition and quality, and biologi cal organism health and species diversity in the Wolf River within the Menominee Reservation boundaries.
Specific objectives for this report are the following:
1. Use discharge and water-quality data collected at Highway M near Langlade, Keshena, and Shawano from 1986 through 1998 to describe and document the current condition of the Wolf River, its bottom sediments, and biota within the boundaries of the Menominee Indian Res ervation.
2. Document the baseline water quality of the Wolf River at the northern boundary where it enters the Reservation and at the southern boundary where it leaves the Reservation.
3. Document concentrations of a broad suite of trace elements and pesticides in water-column samples.
4. Document particle-size fractions and associ ated trace-element concentrations of the fine streambed sediments at Langlade and Keshena.
5. Document concentrations of specific trace ele ments in composite samples of fish livers and caddisfly larvae, and to determine biological indexes of water quality at Langlade and Kesh ena.
Description of the Study Area
The Menominee Indian Reservation occupies all of Menominee County, Wisconsin, an area of approxi mately 346 mi2 in northeastern Wisconsin (fig. 1). The Wolf River flows south through the Reservation. The Wolf River and its tributaries drain all but the eastern quarter of the Reservation, which is drained by the Oconto River.
The Reservation is underlain by igneous and meta- morphic bedrock that is buried beneath loamy and sandy gravelly surficial deposits (Sullivan, 1995). Aver age annual precipitation is approximately 30 in. Land surface elevations on the Reservation range from 1,400 ft above sea level in the northwest to 800 ft in the southeast. The population of the Reservation is approx imately 3,890 (U.S. Army Corps of Engineers, 1995).
The Shawano hydroelectric plant has a dam on the Wolf River near Shawano (near USGS streamgaging station 04077400), approximately 3,700 ft downstream from the Fairgrounds Road Bridge in Keshena. The remnants of the Keshena Falls Dam still remain just upstream from the town of Keshena. Ice-jam-induced flooding has increased in frequency since this dam failed in 1972 (U.S. Army Corps of Engineers, 1995).
Land-use data in table 1 are based on the Wolf River drainage basin above the Shawano Dam to the headwaters. The Level I land-use summary contains the broadest categorizations, and Levels II and III illustrate the same data in component subcategories. Forest is the principal land-use category; 71 percent of the basin above the Shawano Dam is forested, whereas 93 percent of the Menominee Indian Reservation is forested. Lum bering is the major industry on the Reservation and it is closely monitored by the Tribe. The next largest land- use category is wetlands, encompassing 15 percent of the basin. A small percentage (<5) of land use in the drainage basin outside the Reservation is agriculture; most of this use is for hay fields, although small acre ages of row crops and cranberries are cultivated.
Land-use-related activities in the Wolf River Basin, both upstream from and on the Menominee Reserva tion, may influence the water quality of the Wolf River
INTRODUCTION

Table 1. Wisconsin Initiative for Statewide Cooperation on Landscape Analysis and Data (WISCLAND) land use/land cover for the Wolf River near Shawano, Wis. (USGS station 04077400)[Data from Lillesand and others, 1998; CRP, set-aside land in Conservation Reserve Program; mi , square mile]
WISCLAND Land use/land cover for the Wolf River near Shawano, Wl (04077400)
. .; [ i \: ij ji i? ii. i Land Use description, level 1 i .; ' ' : '|| |l I: ;: i «i ? ! | 1 i ! ; : : M. ' | ! : ! ! : ' ! : : : . > | > . : ' : ; ; i i i j'iM jij. 11 '". !
Urban/developed
Agriculture
Grassland
Forest
Open water
Wetland
Barren
Shrubland
^i^jW^^ ;:!.i : I; II H' ii ^
Urban: High intensity
Urban: Low intensity
Agriculture: Crops
Agriculture: Cranberry bog
Grassland (including timothy, rye, pasture, idle, CRP, grass, and volunteer)
Forest: Coniferous
Forest: Broad-leaved deciduous
Forest: Mixed deciduous/coniferous
Open water
Wetland: Emergent/wet meadow
Wetland: Lowland shrub
Wetland: Forested
Barren
Shrubland
- Hj :t: :!} li; ,] ":l-'f- 'i x" i-i-i j). S ; Jjj'! 1 ! T 1 1* JJ. i ip; S-l' j *. ii II I ; : i:i j i i-"-: ' ". : :.
Urban: High intensity
Urban: Low intensity
Agriculture: Herbaceous/field crops
Agriculture: Herbaceous/field crops, corn
100-109
110-148
150
160-190
200
210-234
240
250
Grid-code
101
104
111-124
148
150
161-173
175-187
190
200
211-212
217-220
222-234
240
250
yi!i^iii101
104
111
113
illiiiiil1.62
36.20
34.13
592.41
27.77
126.66
5.45
4.37
828.62
Sum of areas
0.39
1.22
35.96
.24
34.13
36.88
463.46
92.07
27.77
7.47
28.02
91.17
5.45
4.37
828.62
Sum of areas
0.39
1.22
21.84
1.03
Percent of
0.195
4.369
4.119
71.493
3.351
15.286
.658
.527
100.000
total area
0.048
.148
4.340
.029
4.119
4.451
55.931
11.111
3.351
.901
3.382
11.003
.658
.527
100.000
N & AiV*oni f\t - : > I if^ci v*HIi M* ;. : j| i
0.048
.148
2.636
.125
4 Characteristics of Water, Sediment, and Benthic Communities of the Wolf River, Menominee Indian Reservation, Wisconsin, Water Years 1986-98
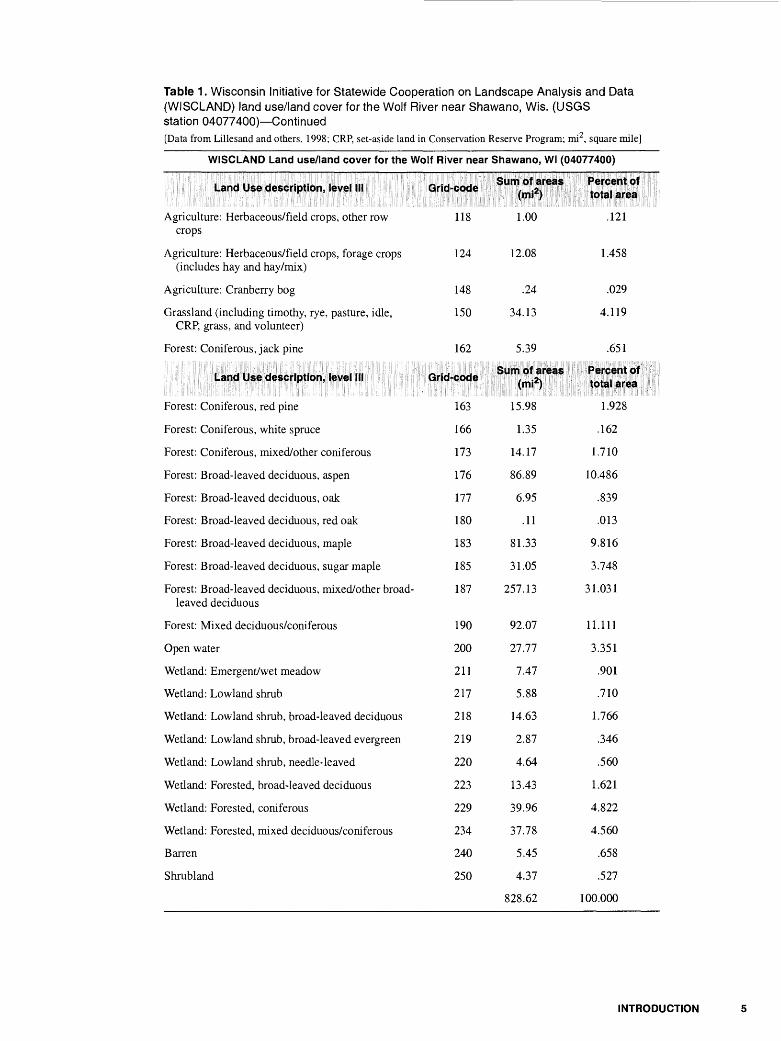
Table 1. Wisconsin Initiative for Statewide Cooperation on Landscape Analysis and Data (WISCLAND) land use/land cover for the Wolf River near Shawano, Wis. (USGS station 04077400) Continued[Data from Lillesand and others, 1998; CRP, set-aside land in Conservation Reserve Program; mi2 , square mile]
WISCLAND Land use/land cover for the Wolf River near Shawano, Wl (04077400)
:. : \i 1 j : Land Use description, level III \\ - ' . ! i i If :i.
Agriculture: Herbaceous/field crops, other row crops
Agriculture: Herbaceous/field crops, forage crops (includes hay and hay/mix)
Agriculture: Cranberry bog
Grassland (including timothy, rye, pasture, idle, CRP, grass, and volunteer)
Forest: Coniferous, jack pine
ii , ,',, J|, l > ! [J^p;i^jji('^^.H^!^^^|iiil!l i|'j ; ; .' '; 'it: 0' ;: '
Forest: Coniferous, red pine
Forest: Coniferous, white spruce
Forest: Coniferous, mixed/other coniferous
Forest: Broad-leaved deciduous, aspen
Forest: Broad-leaved deciduous, oak
Forest: Broad-leaved deciduous, red oak
Forest: Broad-leaved deciduous, maple
Forest: Broad-leaved deciduous, sugar maple
Forest: Broad-leaved deciduous, mixed/other broad- leaved deciduous
Forest: Mixed deciduous/coniferous
Open water
Wetland: Emergent/wet meadow
Wetland: Lowland shrub
Wetland: Lowland shrub, broad-leaved deciduous
Wetland: Lowland shrub, broad-leaved evergreen
Wetland: Lowland shrub, needle-leaved
Wetland: Forested, broad-leaved deciduous
Wetland: Forested, coniferous
Wetland: Forested, mixed deciduous/coniferous
Barren
Shrubland
Grid-code'! h. !:':; ;;;: ~. .' ! !' ! 'I ! j ! j =';;. ;
118
124
148
150
162
;:p<^od<sj!;-
163
166
173
176
177
180
183
185
187
190
200
211
217
218
219
220
223
229
234
240
250
fill!1.00
12.08
.24
34.13
5.39
l^llli15.98
1.35
14.17
86.89
6.95
.11
81.33
31.05
257.13
92.07
27.77
7.47
5.88
14.63
2.87
4.64
13.43
39.96
37.78
5.45
4.37
828.62
liii^ii^.121
1.458
.029
4.119
.651
""Sy^iiHif ;^ ! ^fi!^'^'H\;.f* ji'!iijj;;yW : itptJMji$(£<(s(| -.'1*1 : !
1.928
.162
1.710
10.486
.839
.013
9.816
3.748
31.031
11.111
3.351
.901
.710
1.766
.346
.560
1.621
4.822
4.560
.658
.527
100.000
INTRODUCTION
within the Reservation. Examples of environmental fac tors and land-use activities that could affect water qual ity in the Wolf River include geology and soils; atmospheric deposition of contaminants; agricultural activities, including fertilizer and pesticide applications and water withdrawals for irrigation; forestry; recre ation; impoundments; road construction; wetland drain age; urban development; wastewater treatment, and potential development of a large-scale copper/zinc mine in the headwaters of the Wolf River.
Acknowledgments
The authors gratefully acknowledge the project assistance and report review provided by Doug Cox (Menominee Indian Tribe Environmental Depart ment). We also are indebted to Morgan Schmidt and Brett Esser of the USGS, Jeremy Pyatskowit and Heather Arthur (Menominee Indian Tribe Environ mental Department), and John Koss (formerly of the Menominee Indian Tribe Environmental Department) for assistance with field collection of streambed sedi ment and biota. David W. Hall (USGS) assisted in report preparation; John F. Elder and David C. Heimann (USGS) also provided helpful review comments.
METHODS OF DATA COLLECTION AND ANALYSIS
Water Quality and Discharge Data
Stream discharge data discussed in this report were collected from water year 1986 through water year 1998
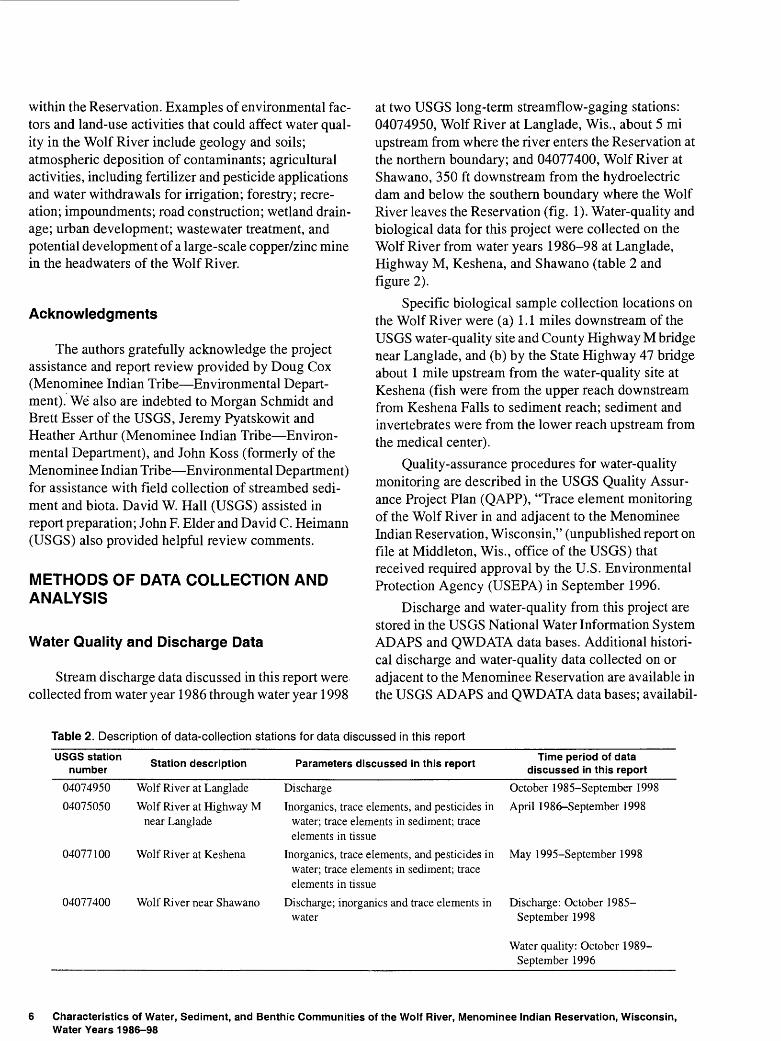
at two USGS long-term streamflow-gaging stations: 04074950, Wolf River at Langlade, Wis., about 5 mi upstream from where the river enters the Reservation at the northern boundary; and 04077400, Wolf River at Shawano, 350 ft downstream from the hydroelectric darn and below the southern boundary where the Wolf River leaves the Reservation (fig. 1). Water-quality and biological data for this project were collected on the Wolf River from water years 1986-98 at Langlade, Highway M, Keshena, and Shawano (table 2 and figure 2).
Specific biological sample collection locations on the Wolf River were (a) 1.1 miles downstream of the USGS water-quality site and County Highway M bridge near Langlade, and (b) by the State Highway 47 bridge about 1 mile upstream from the water-quality site at Keshena (fish were from the upper reach downstream from Keshena Falls to sediment reach; sediment and invertebrates were from the lower reach upstream from the medical center).
Quality-assurance procedures for water-quality monitoring are described in the USGS Quality Assur ance Project Plan (QAPP), "Trace element monitoring of the Wolf River in and adjacent to the Menominee Indian Reservation, Wisconsin," (unpublished report on file at Middleton, Wis., office of the USGS) that received required approval by the U.S. Environmental Protection Agency (USEPA) in September 1996.
Discharge and water-quality from this project are stored in the USGS National Water Information System AD APS and QWDATA data bases. Additional histori cal discharge and water-quality data collected on or adjacent to the Menominee Reservation are available in the USGS AD APS and QWDATA data bases; availabil-
Table 2. Description of data-collection stations for data discussed in this report
USGS station number Station description Parameters discussed in this report Time period of data
discussed in this report
04074950 Wolf River at Langlade
04075050 Wolf River at Highway M near Langlade
04077100 Wolf River at Keshena
04077400 Wolf River near Shawano
Discharge
Inorganics, trace elements, and pesticides in water; trace elements in sediment; trace elements in tissue
Inorganics, trace elements, and pesticides in water; trace elements in sediment; trace elements in tissue
Discharge; inorganics and trace elements in water
October 1985-September 1998
April 1986-September 1998
May 1995-September 1998
Discharge: October 1985- September 1998
Water quality: October 1989- September 1996
Characteristics of Water, Sediment, and Benthic Communities of the Wolf River, Menominee Indian Reservation, Wisconsin, Water Years 1986-98

B
Figure 2. (A) Wolf River downstream from Highway M near Langlade; and (B) Wolf River at Keshena.
METHODS OF DATA COLLECTION AND ANALYSIS 7

ity is summarized in table 3. Streamflow and water- quality data were previously published in the USGS annual report series "Water Resources Data Wiscon sin" for each water year.
Systematic Streamflow gaging began on the Wolf River near Shawano in 1907; however, water quality was not monitored on the Reservation until the 1970's when temperature, specific conductance, and sediment- concentration data were collected at Keshena Falls. During the 1980's, the potential importance of trace ele ments in Wolf River water was recognized, and a lim ited sampling of trace elements was done at Langlade in the early 1980's. Samples of water, sediment, and biota collected at Highway M near Langlade, Highway VV (Kittecon Bridge) at Keshena, and samples of water col lected near Shawano during water years 1986-98 were analyzed for a more complete suite of trace metals, nutrients and pesticides. The results of those analyses are the subject of this report.
Data Collection
Water was sampled according to protocols devel oped by the USGS National Water Quality Assessment (NAWQA) program (Shelton, 1994). Water-quality sampling intervals varied during the study from monthly to seasonally plus high-flow sampling. All
sites were usually sampled the same day, beginning with the most upstream site and proceeding down stream. Sample collection and processing procedures included the use of multi-vertical, depth-integrating sampling, and the use of protocols to produce contami nant-free trace-element data. Field analyses included those for pH, specific conductance, dissolved oxygen, and water temperature as measured using a multiparam- eter water-quality instrument that was calibrated in the field before use, according to standard procedures. Field quality control practices included obtaining at least one field blank per site per year for analysis. Strict chain-of- custody procedures were followed from the time of sample collection and internally through the laboratory until sample disposal.
Laboratory Analyses
USGS National Water Quality Laboratory (NWQL) analytical schedules 2701 (major ions plus total suspended solids and dissolved organic carbon) schedule 1056 for total and dissolved cyanide and chemical oxygen demand, and schedule 878 (nutrients) were used during the study (appendixes 1 and 2). The minimum reporting level (MRL) is the smallest mea sured concentration of a constituent that may be reliably reported by the use of a given analytical method. The
Table 3. Discharge and water-quality data that are in U.S. Geological Survey ADAPS and QWDATA data bases from the Wolf River near the Menominee Indian Reservation
Station number, name
04074950 Wolf River at Langlade
Drainage area, in square miles
463
Data type
Discharge Water quality (limited, but included
some trace elements)
Period of record (water years)
1966-98 1981-86
04075050 Wolf River at Highway M 489 near Langlade
04077000 Wolf River at Keshena Falls Not determined
04077100 Wolf River at Highway VV Not determined (Kittecon Bridge) at Keshena
04077400 Wolf River near Shawano 816
Water quality Sediment quality Biological data
Water quality(limited to temperature, specific con
ductance, sediment concentration)
Water quality Sediment quality Biological data
Discharge
Water quality Sediment quality Biological data
1986-98
1973, 1975, 1981-84
1995-98
1907-09, 1910-present
1989-96
Characteristics of Water, Sediment, and Benthic Communities of the Wolf River, Menominee Indian Reservation, Wisconsin, Water Years 1986-98

method detection limit (MDL) of an analyte is the min imum concentration that can be measured and reported with 99-percent confidence that the concentration is greater than zero (Oblinger Childress and others, 1999).
A problem with incomplete digestion of phospho rus samples was discovered by the NWQL (U.S. Geo logical Survey Office of Water Quality Technical Memorandum 92.10, July 13, 1992) that resulted in a negative bias of historical phosphorus data collected after 1973 to September 1991. The problem was par tially corrected in May 1990 and finally corrected in October 1991 with a new digestion procedure that elim inated the bias. Care must be used when interpreting phosphorus data (both total and dissolved forms) across the time boundaries of May 1990 and October 1991 because this change may have resulted in an artificial upward trend in the data.
For trace elements, NWQL schedules 2215 (USEPA drinking water total trace elements) and 1057 (whole-water recoverable and dissolved trace elements) were used for laboratory analyses (appendix 3). Low- level mercury analyses during 1996-98 (method detec tion limit of less than 0.1 ng/L) were done in the USGS Wisconsin District mercury laboratory. Hexavalent chromium, dissolved (MRL =1.0 Jig/L), was added to the NWQL analyses in 1997 and later that year was replaced by a Hach field test (Method no. 8023, at 10 |Ag/L) when the laboratory test was discontinued. Schedule 1057 consisted of a combination of GFAA (graphite furnace atomic absorption) and ICP (induc tively coupled plasma) analyses. In December 1997, almost all of the dissolved-trace-element GFAA analy ses (except for chromium) were replaced with the ICP/MS (inductively coupled plasma/mass spectrome- try) method to improve efficiency and provide lower method detection limits.
A broad-spectrum, low-level pesticide schedule (2001) was used initially to determine the occurrence and distribution of organic pesticides in the Wolf River (appendix 4). The method detection limits for schedule 2001 were revised in 1996 (U.S. Geological Survey National Water Quality Laboratory Technical Memo randum 96-06, April 15, 1996). Schedule 2001 was replaced with a more specific schedule, 1379, for orga- nonitrogen pesticides (triazines) in March 1997 (appen dix 5).
Data Analyses
Statistical measures used in analysis of water-qual ity data included reporting numbers of samples and minimum, median, and maximum values. Percentiles were computed by use of Water-Quality System (QWDATA) software of the National Water Informa tion System (Maddy and others, 1990). In general, a sta tistical summary for a constituent was not generated if fewer than five observations were above the detection limit. The concentrations of a constituent in more than 50 percent of the samples need to be above the detection limit to compute a meaningful median, and greater than 75 percent of the samples need to be above the detection limit to compute meaningful 25th and 75th percentiles.
Qualitative comparisons of measured data to USEPA Water Quality Standards (U.S. Environmental Protection Agency, 1999) were made when appropriate to assist in identification of potential water-quality problems. Water-quality data for the various constitu ents also may be compared to the latest USEPA ambient water-quality criteria for aquatic life maintained on the USEPA website (http://www.epa. gov/OST/) or Wiscon sin water quality standards for surface waters (Wiscon sin Administrative Code, Chapters NR102-105).
Streambed Sediment and Biological Data
Data Collection
Streambed-sediment data were collected once each year during low flow near Langlade and at Keshena on the Wolf River by use of methods described in Shelton and Capel (1994). Tissues of biota were collected con currently. Sediment samples were composites of sam ples collected by hand with a Teflon scoop from each of 5 to 10 depositional zones (submerged during low streamflow) along a reach of approximately 150 m. Samples were collected from the upper 2 cm (most recent, oxidized layer) and the amount collected depended on the relative size of the depositional zone. Deposits of fine-grained sediment were sought out and sampled; thus, concentrations represent conditions in depositional areas of the streams, not the average con centrations for sediment throughout the stream reach. The composited samples from the reach were homoge nized, and a bulk (<2 mm fraction) sample was removed for particle-size analysis. The rest of the composite sample was wet-sieved in the field, and the fine
METHODS OF DATA COLLECTION AND ANALYSIS

(<0.062 mm) fraction was collected for trace-element analysis.
Methods for collection and processing of biota (Crawford and Luoma, 1994) included use of plastic implements (Teflon, polypropylene, or polyethylene) where appropriate for trace-element sampling. Quality- control procedures for the collection and processing of biota and sediment included collection of approxi mately 15 percent replicate samples and the use of clean techniques to minimize potential contamination.
Fish for tissue analyses were collected by the use of direct-current electrofishing gear. Depending on stream depth, stage, and other factors, either backpack- mounted or towed-barge electrofishing units were used. The target organism for capture was the white sucker (Catostomus commersoni). After capture, the fish were rinsed in native water, weighed, and measured for total length. Scale and spine samples were collected for age determination. Fish livers were removed, placed in pre- cleaned glass jars with teflon-lined lids, and frozen on dry ice and then shipped to the laboratory for analysis.
Caddisfly larvae (Hydropsyche spp. or Ceratop- syche spp.) were collected by handpicking from rocks and woody debris with plastic tweezers and PVC- gloved hands (figure 3). To minimize sediment in then- guts, larvae were allowed to depurate for 4-6 hours in plastic bags containing native water. They were then placed in filtered deionized water (18 Mohm), counted into pre-cleaned glass jars with teflon-lined lids, frozen on dry ice, and shipped to the laboratory for analysis.
Benthic macroinvertebrates and algae in riffle hab itat were sampled by use of methods established for the National Water Quality Assessment program (Porter and others, 1993; Cuffney and others, 1993). Riffle selection was based on the assumption that these areas represented the taxonomically richest habitat for the Wolf River. Cobble was the dominant substrate in both sampled stream reaches.
Benthic macroinvertebrate communities were sam pled semi-quantitatively by use of a modified Surber sampler with 425-fim mesh that was placed securely against the stream bottom, perpendicular to the current (figure 4). All cobble-sized rock in a 0.5-m by 0.5-m area of the stream bottom was scrubbed with a stiff brush. The stream bottom was then disturbed to a depth of approximately 10 cm with a rod and then by vigorous foot motion. During low flow in September 1998, six subsamples were collected from each reach, three in a downstream riffle area and three in an upstream riffle area. Subsamples were field elutriated with a bucket,
picked free of debris, and combined into one sample per reach. Samples were preserved with 70 percent nonde- natured ethanol and shipped to the laboratory for further processing.
Collections of benthic algal communities were made at the same time and in the same general location as the invertebrate-community sampling and consisted of quantitative samples. For each quantitative sample, algae were removed from a circular sampling area (approximately 2 cm in diameter) from five rocks in each of five locations from each site. An SG-92 sam pling device, constructed of a syringe barrel and sealing O-ring, was used with a small brush to remove the algae. The 25 algal surface-area subsamples were then composited into a single quantitative algal sample of approximately 75 cm for each site.
Laboratory Analyses
Sediment and tissues were analyzed for trace elements at the USGS National Water Quality Laboratory in Denver, Colo. The sediment analyses included 46 major and trace elements (including two forms of carbon; inorganic and organic, as well as total carbon; appendixes 6 and 7). Biota were analyzed for a subset of 22 trace elements and for percent moisture (appendix 8). Concentrations of arsenic, cadmium, and selenium in biota were analyzed by ICP/MS; arsenic and selenium concentrations in sediment were analyzed by the use of hydride-generation AAS (atomic absorp tion spectrophotometry) and cadmium was analyzed by GFAA spectrometry. Trace-element analysis involved total digestions, and all concentrations in sediment and biota are given as micrograms per gram (jig/g) dry weight. Quality-control measures at the laboratory included comparisons to standard reference materials, spikes, and duplicates. Sediment particle size was ana lyzed at the USGS Sediment Laboratory in Iowa City, Iowa. Age determinations of fish based on scale and spine samples were done at the USGS Great Lakes Sci ence Center in Ann Arbor, Mich.
The University of Wisconsin Stevens Point, Col lege of Natural Resources, Benthic Macroinvertebrate Laboratory (Dr. Stanley Szczytko), provided the species identification and enumeration and sample statistics for the macroinvertebrate samples. Samples were pro cessed according to a rapid bioassessment protocol as described in Hilsenhoff (1987, 1988). Invertebrates were identified to the lowest practical level (generally species) by use of regional and global keys. At least 250
10 Characteristics of Water, Sediment, and Benthic Communities of the Wolf River, Menominee Indian Reservation, Wisconsin, Water Years 1986-98

Figure 3. Method for collecting caddisfly larvae from woody debris and rocks for trace-element analysis.
Figure 4. Invertebrate community sampling method using a modified Surber net, Wolf River near Langlade biological site.
METHODS OF DATA COLLECTION AND ANALYSIS 11

individuals were counted in each sample by use of a grid system.
Benthic algal samples were identified and enumer ated by The Academy of Natural Sciences Philadel phia, Patrick Center for Environmental Research, under the supervision of Dr. Frank Acker. The algal hierar chies follow those of Bold and Wynne (1985). Taxon omy and methods used were standard protocol used for USGS NAWQA benthic algal samples.
Data Analyses
Invertebrate metrics computed included total taxa richness (species and genera) and percent Ephemeroptera-Plecoptera-Trichoptera (EPT). Percent EPT is the percentage of total EPT individuals to the total numbers of individuals in the sample. EPT taxa are considered to be pollution sensitive (Lenat, 1988). Indexes computed included Hilsenhoff Biotic Index (HBI) and Family Biotic Index (FBI), as described by Hilsenhoff (1987 and 1988), Shannon-Wiener diversity index (Brewer, 1979), and Mean Tolerance Value of all genera present (Lillie and Schlesser, 1994). Increasing HBI and FBI values indicate poorer water quality. The index of similarity (Odum, 1971) was computed to quantify the percentage of similar species at sites.
Analysis of the benthic algal data was threefold and included (1) basic summary descriptions of the algal taxa at sites, (2) comparison among sites, and (3) com parison to established indexes. Percent relative abun dance of algal groups was computed for diatoms (division Bacillariophyta), green algae (division Chlo- rophyta), and euglenoids (division Euglenophyta). For nitrogen-fixers, Cuffney and others (1997), Bold and Wynne (1985), and Fairchild and Lowe (1984) were used for taxonomic reference.
The index of biological integrity for diatoms was computed according to Bahls (1993), using relative abundance data from richest-targeted-habitat samples. This index has three metrics: (1) Shannon-Wiener diversity index (Brewer, 1979), (2) pollution index, and (3) siltation index. The value for each index is given a score, and the lowest of all three scores is used to deter mine the biological integrity rating. The Shannon- Wiener diversity index for diatoms is computed in log base 2. The pollution index is based on the decimal frac tion of diatoms in each of three tolerance groups (most tolerant, less tolerant, and sensitive) of Lange-Bertalot (1979) multiplied by the tolerance group rating. The pollution index therefore ranges from 1 (all most toler
ant) to 3 (all sensitive). Our evaluation of diatom pollu tion index scores is based on Bahl's (1993) categories for Montana streams: <1.50 (severe pollution), 1.50 to 2.00 (moderate pollution), 2.01 to 2.50 (minor pollu tion), and >2.50 (no pollution). The siltation index is the sum of the percent relative abundance of silt-tolerant taxa (Navicula, Nitzschia, Surirella, and Cylindroth- eca), and values range from 0 to 100. The resulting scores for diversity and siltation were calibrated with a method similar to that of Lenat (1993) using the 25th and 75th percentiles of data for 37 sites in the Western Lake Michigan Drainages sampled by the USGS NAWQA program during 1993-95 (B. Scudder, U.S. Geological Survey, Middleton, Wis., unpublished data). This calibration suggests that algal diversity values may indicate community stress as follows: <2.30 (high stress), 2.30 to 3.29 (moderate stress), 3.30 to 4.29 (minor stress), and >4.30 (no stress). Calibrated silt index ratings were: >80 (heavy siltation), 60-80 (mod erate siltation), 40-60 (minor siltation), and <40 (no siltation). These rankings should be interpreted with caution due to the small sample size.
CHARACTERISTICS OF STREAM WATER, SEDIMENT, AND BENTHIC COMMUNITIES
Chemical Characteristics of Water
Water-quality samples were collected from stations on the Wolf River near Langlade, at Keshena, and at Shawano and analyzed for field-measured characteris tics, major ions, nutrients, trace elements, and pesti cides. Water discharge variability at Langlade and downstream at Shawano during 1986-98 are shown in figures 5 and 6. The basin area increases from about 463 mi2 at Langlade to about 816 mi2 at Shawano.
Although the Wolf River is not a major source of drinking water to the Reservation, comparison of Wolf River contaminant concentrations to the USEPA National Primary and Secondary Drinking Water Max imum Contaminant Levels (U.S. Environmental Protec tion Agency, 1999) is provided in several of the following discussions of water quality to assist in eval uations of the magnitude of river contamination. Read ers who wish to understand water quality in greater detail than the discussion presented in this report are referred to the published USEPA (1999) drinking-water standards and ambient water-quality criteria. Also, "Study and Interpretation of the Chemical Characteris-
12 Characteristics of Water, Sediment, and Benthic Communities of the Wolf River, Menominee Indian Reservation, Wisconsin, Water Years 1986-98

ooCT) CT)
r-CT) CT)
coCT) CT)
inCT) CT)
CT)
CO8?cc
Si §CT) >- cc
CT) ^
<
co oo
tn oo CTJ
o oID
o o oOoIT)
O O O
O O ID
QN003S H3d 133d 01900 Nl '39yVHOSIQ NV3IAIA1IVQ
00
S00 O)
§05
en
Ia)
a) E1<co(0
<D
>.
u 0)3 O)
CHARACTERISTICS OF STREAM WATER, SEDIMENT, AND BENTHIC COMMUNITIES 13

4,00
0
I CO <D
O.
<D T*
1907
-98
mea
n an
nual
di
1985
1998
CA
LEN
DA
R Y
EAR
Figu
re 6
. D
aily
mea
n di
scha
rge
of th
e W
olf
Riv
er a
t S
haw
ano,
sta
tion
0407
7400
,198
5-98
.

tics of Natural Water," by Hem (1992) provides addi tional information.
Field Measurements
Multiparameter field instruments were used to measure pH, specific conductance, dissolved oxygen, and water temperature at the time of water-sample collection. The median pH of 104 samples measured at Langlade was 8.0 (table 4), and that of 28 samples measured at Keshena was 8.1 (table 5). These values are within the range of pH values from 6.5 to 8.5 reported by Hem (1992, p. 64) for river water in areas not affected by pollution. These values are not substantially different from the median pH of 7.6 for 47 samples collected at Shawano from 1989 through 1996 (table 6). Because rainfall is more acidic than surface or ground water that has been buffered by contact with more alka line rocks and soil, changes in the pH of the Wolf River may fluctuate with the percentage of more acidic rain- runoff relative to the percentage of base flow that may be present in the river at any time.
Specific conductance, a measure of the ability of water to conduct electricity, is related to the concentra tion of dissolved ions (such as salts) in water. Mean spe cific conductance measured at Langlade (table 4) was 198 p,S/cm, and that downstream at Keshena was 226 |J,S/cm (table 5). Mean specific conductance mea sured at Shawano during 1989 through 1996 was 233 ^iS/cm (table 6). Substances contributing to specific conductance in the Wolf River on the Menominee Res ervation primarily consist of ions derived from geolog ical materials that come in contact with runoff and ground water.
Mean concentrations of dissolved oxygen in the Wolf River were near, at, or above saturation at all times in samples collected at Langlade, Keshena, and Sha wano. Oxygen-saturated waters would be expected in a river such as the Wolf that has an adequate surface-area to volume ratio to provide interaction of water with oxy gen in the atmosphere, and is relatively unaffected by wastes exerting a high biochemical oxygen demand (BOD) or chemical oxygen demand (COD) on the river.
Water temperatures measured upstream at High way M near Langlade had a slightly lower mean and median than those measured at Keshena, which is a reflection of the channel conditions and shading by riparian vegetation.
Major Ions
Water in the Wolf River on the Menominee Reser vation is of a calcium-magnesium bicarbonate type (fig. 7). Concentrations of other commonly found major ions such as sodium, potassium, chloride, fluoride, and sulfate are present only at low concentrations (tables 4, 5, and 6). Total solids (residue) concentrations in the Wolf River were low at the three sampled sites, with mean concentrations ranging from 7 to 9 mg/L.
Water quality in the Wolf River is determined by water entering the Reservation from areas upstream, surface runoff on the Reservation, and also by ground water discharging to the river from the unconfined bed rock and overlying sand and gravel aquifers this con tributing ground water is also of a calcium-magnesium, bicarbonate type with low concentrations of dissolved solids, sulfate, and chloride (Krohelski and others, 1994, p. 10).
Nutrients
Concentrations of nutrients, the various species of nitrogen and phosphorus, were low in samples collected at the three Wolf River sites (tables 4-6). Absence of excessive levels of nutrients indicates that the Wolf River is not substantially affected by sewage or septic- system discharges, runoff or ground water that is con taminated with agricultural fertilizer or animal manure wastes, nutrient-laden industrial discharges, or any other substantial sources.
Nitrogen
Water-quality analyses of nitrogen species in water for this project included "Kjeldahi" nitrogen, which is the sum of organic plus ammonia nitrogen concentra tions, and separate analyses for ammonia and nitrite plus nitrate nitrogen. Total nitrogen is the sum of total Kjeldahi nitrogen plus nitrite and nitrate nitrogen. In general, in well-aerated water such as that in the Wolf River, organic nitrogen contributed by sewage, food or vegetation wastes, farm-animal wastes, or fertilizer run off is converted first to ammonia, which is subsequently oxidized to nitrate. In oxygenated waters, nitrite is a short-lived, intermediate product that is formed during the oxidation of ammonium to nitrate, and virtually all of the nitrite plus nitrate values would actually be present as nitrate in the Wolf River.
CHARACTERISTICS OF STREAM WATER, SEDIMENT, AND BENTHIC COMMUNITIES 15

^ o
n>
3"2*
B)
5 5
-< S
<B
<DD)
2
.M
W 00 <D
M
A
Tabl
e 4.
Sta
tistic
al s
umm
ary
of w
ater
-qua
lity
data
, A
pril
1986
-Sep
tem
ber
1998
, at
the
Wol
f R
iver
at
[*, v
alue
est
imat
ed b
y us
ing
a lo
g-pr
obab
ility
reg
ress
ion
to p
redi
ct th
e va
lues
of
data
bel
ow t
he d
etec
tion
limit;
<,
less
tha
n;
u.g/
L, m
icro
gram
s pe
r lit
er;
u.S/
cm,
mic
rosi
emen
s pe
r ce
ntim
eter
]
Hig
hway
M n
ear
Lang
lade
, W
is.,
stat
ion
0407
5050
, n
ot c
alcu
late
d; °
C, d
egre
es C
elsi
us;
mg/
L,
mill
igra
ms
per
liter
;
Wat
er-q
ualit
y co
nsti
tuen
t S
ampl
e si
ze
Col
or,
plat
inum
cob
alt
scal
e
Spec
ific
con
duct
ance
, fi
S/cm
at
25°C
Wat
er t
empe
ratu
re,
°C
Oxy
gen,
dis
solv
ed,
mg/
L
Che
mic
al o
xyge
n de
man
d, m
g/L
pH,
fiel
d, s
tand
ard
unit
Res
idue
, tot
al, m
g/L
Nitr
ogen
, am
mon
ia d
isso
lved
, m
g/L
as
N
Nitr
ogen
, am
mon
ia,
mg/
L a
s N
Nitr
ogen
, nitr
ite, m
g/L
as
N
Nitr
ogen
, am
mon
ia &
org
anic
, di
ssol
ved,
mg/
L a
s N
Nitr
ogen
, am
mon
ia &
org
anic
, to
tal,
mg/
L a
s N
NO
2 +
NO
3, d
isso
lved
, mg/
L a
s N
Phos
phor
us,
tota
l, m
g/L
as
P
Phos
phor
us,
orth
o, m
g/L
as
P
Car
bon,
org
anic
dis
solv
ed, m
g/L
as
C
Cya
nide
, to
tal,
mg/
L a
s C
N
Cya
nide
, di
ssol
ved,
mg/
L a
s C
N
Har
dnes
s, t
otal
, mg/
L a
s C
aCO
3
Cal
cium
, dis
solv
ed, m
g/L
as
Ca
Chl
orid
e, d
isso
lved
, m
g/L
as
Cl
Fluo
ride
, dis
solv
ed,
mg/
L a
s F
Iron
, to
tal,
fig/
L a
s Fe
Iron
, dis
solv
ed,
u.g/
L as
Fe
Mag
nesi
um,
diss
olve
d, m
g/L
as
Mg
Man
gane
se,
tota
l, ug
/L,
as M
n
Man
gane
se,
diss
olve
d, j
ig/L
as
Mn
Sodi
um,
diss
olve
d, m
g/L
as
Na
Pota
ssiu
m,
diss
olve
d, m
g/L
as
K
Sulf
ate,
dis
solv
ed,
mg/
L a
s SO
4
Silic
a, d
isso
lved
, m
g/L
as
SiO
2
15 103
105 60 16 104 24 61 36 28 35 27 63 61 54 21 50 15 101
101
100 97 95 42 101 95 42 101
101
100 97
Max
imum
64 365 25
.5
15 31 9.4
17
.13
.08
.03
1 .7 .6 .08
.62
10 <.01
<.01
130 30 10
.4
920
300 14 180 19 3 6 26 14
Min
imum
5 73 0 8.2
<10. 6.
2
<1.0 <.01
<.01
<.01
<.20 .2
<.05
<.01
<.01
3.2
<.01
<.01
36 8.2 .4
<.1
0
50 32 3.7
10 4
.1 .1 3.3
3.5
Mea
n
36 198 11 11
.0
*19 7.
9
*6.7 *.04
*.02
*<.0
1
*.45 .4
2
*.17
*.02
*<.0
1
6.6
<.01
<.01
100.
1
22.3 2.8
*.15
312
120 10
.8
53.5 9.6
2.3 .9
4
7.6
8.4
95 64 265 24 14
.7
*31 8.
6
*11 *.
08
*.08
*.03
*.9 .7 Ml
*.06
*.02
10 -- -
130 29 4.
2
*.2
670
278 14 120 15
.7 2.9
1.3
16.0
13.1
75
55 222 19 12
.5
*22 8.
3
*8 *.05
*.03
*<.0
10
*.5 .5 *.28
*.03
*.01
8.25
- -
120 26 3 *.
2
380
162.
5
13 60 11 2.6
1 9.9
10.5
Per
cent
ile
50
(Med
ian)
35 202 11
.1
11
*17 8 *6 *.o *.
01
*<.0
10
*4 .4
*.12
*.02
*<.0
1
6.3
-- --
100 23 2.
6
*.l
280
105 11 50 10 2.
3 .9
6.15
7.9
25
22 165 1.
2
9.2
*11 7.
7
*4 *.02
*<.0
10
*<.0
10
*.3 .3 *.06
*.01
*<.0
1
5.0
- -- 84.5
19 2.4
M
200 71 9.
3
30 7.3
2.1 .7
4.9
6.25
5
5
121 0 8.
2
* <
10.0 6.4
*<1.
0
*<.0
15
*<.0
1
*<.0
1
*<.2
0
.2
*<.0
5
*<.0
1
*<.0
1
3.2
- -- 58.2
13.1 2 *<.1
0
100 35 6.
0
18 5.0
1.7 .6
3.7
4.1

Tabl
e 5.
Sta
tistic
al s
umm
ary
of w
ater
-qua
lity
data
, M
ay 1
995-
Sep
tem
ber
1998
, at
the
Wol
f R
iver
at
Kes
hena
, W
is.
[*,
valu
e es
timat
ed b
y us
ing
a lo
g-pr
obab
ility
reg
ress
ion
to p
redi
ct th
e va
lues
of
data
bel
ow t
he d
etec
tion
limit;
,
not c
alcu
late
d; <
, le
ss t
han;
m
icro
gram
s pe
r lit
er;
uS/c
m,
mic
rosi
emen
s pe
r ce
ntim
eter
]
.sta
tion
040
7710
0°C
, de
gree
s C
elsi
us;
mg/
L,
mill
igra
ms
per
liter
;
Wat
er-q
ualit
y co
nsti
tuen
t S
ampl
e si
ze
O JC 30 O H m CO o CO O TI STREAM
£ H m 30 SEDIM m z. z. D CO m z. JC o o o 3 3 C z. H m CO -j
Spec
ific
con
duct
ance
, uS
/cm
at 2
5°C
Wat
er te
mpe
ratu
re,
°C
Oxy
gen,
dis
solv
ed,
mg/
L
Che
mic
al o
xyge
n de
man
d, m
g/L
pH,
fiel
d, s
tand
ard
unit
Res
idue
, to
tal,
mg/
L
Nitr
ogen
, am
mon
ia,
diss
olve
d, m
g/L
as
N
Nitr
ogen
, am
mon
ia a
nd o
rgan
ic,
tota
l, m
g/L
as
N
NO
2 +
NO
V di
ssol
ved,
mg/
L a
s N
Phos
phor
us,
tota
l, m
g/L
as
P
Phos
phor
us, o
rtho
, m
g/L
as
P
Car
bon,
org
anic
dis
solv
ed.
mg/
L a
s C
Cya
nide
, to
tal,
mg/
L a
s C
N
Cya
nide
, di
ssol
ved,
mg/
L a
s C
N
Cal
cium
, di
ssol
ved,
mg/
L a
s C
a
Chl
orid
e, d
isso
lved
, mg/
L a
s C
L
Fluo
ride
, di
ssol
ved,
mg/
L a
s F
Iron
, to
tal,
p.g/
L a
s Fe
Iron
, di
ssol
ved,
|o.g
/L a
s Fe
Mag
nesi
um,
diss
olve
d, m
g/L
as
Mg
Man
gane
se,
tota
l, u.
g/L
as M
n
Man
gane
se,
diss
olve
d, u
.g/L
as
Mn
Sodi
um,
diss
olve
d, m
g/L
as
Na
Pota
ssiu
m,
diss
olve
d, m
g/L
as
K
Sulf
ate,
dis
solv
ed, m
g/L
as
SO4
Silic
a, d
isso
lved
, m
g/L
as
SiO
2
28 28 28 15 28 22 25 25 25 25 25
20 15 15 25
25 25 24 25 25 24
25 25 25
25 25
Max
imum
305 23
.7
14.9
28 8.6
42
.06
.71
.53
.06
.02
11
.01
<.01
32 4.3 .2
7
860
300 17 160 60
3 1.3
7.7
13
Min
imum
102 0.
1
8.3
<10 6.
8
1 <.01
5
.23
<.05
<.01
3.1
<.01
<.01
12 1.9 .1
100 37 5.
4
30 5 1.6 .8
4.1
4.9
Mea
n
226 12
.9
10.9
*18 8.
0
7 *.02 .4
1
*.19
*.02
6.3
<.01
<.01
25.4
3.0 .1
8
292
110 12
.4
55.8
14.5 2.4 .9
3
5.8
8.4
95
301 23
.7
14.8
*28 8.
6
38 *.05 .7
1
*.51
*.06
10.9
~ - 32 4.2 .2
7
111
297 17 152 49.5 3.0
1.2
7.6
12.7
75
258 21 13
.2
*25 8.
275
8 *.03 .5 *.30
*.02
8.4
- - 29 3.4 .2
347
135 14 67
.5
15.5 2.6
1 6.7
11
Per
cent
ile
50
(Med
ian)
236 13
.7
10.2
*17 8.
1
5 *.02 .4 *.13
*.02
5.6
- - 28 2.9 .2
260 87 14 42.5
13 2.5 .9
5.8
7.9
25
198 1.
2
9.0
*13 7.
9
3.75
*.02 .3 *.08
*.01
4.0
-- - 22.5
2.5 .1
5
202 62
.5
10 30.2
9.4
2.1 .8
4
5 6.4
5
112 0.
1
8.3
*10 6.
8
1.15
*.02 .2 *.06
*.01
3.1
- - 12.6
2.0 .1
102 37 5.
8
30 5.4
1.6 .8
4.1
5.1

Tabl
e 6.
Sta
tistic
al s
umm
ary
of w
ater
-qua
lity
data
, O
ctob
er 1
989-
Sep
tem
ber
1996
, at
the
[*,
valu
e es
timat
ed b
y us
ing
a lo
g-pr
obab
ility
reg
ress
ion
to p
redi
ct th
e va
lues
of d
ata
belo
w t
he d
etec
tion
limit;
lit
er;
jig/L
, mic
rogr
ams
per
liter
; jiS
/cm
, m
icro
siem
ens
per
cent
imet
er]]
Wol
f R
iver
nea
r S
haw
ano,
Wis
., st
atio
n 04
0774
00--
, not
cal
cula
ted;
<,
less
tha
n; °
C, d
egre
es C
elsi
us;
mg/
L,
mill
igra
ms
per
-< 2.
S ?
55 £ O> A 3 o'
O
O 3 c
Wat
er-q
ualit
y co
nsti
tuen
t S
ampl
e si
ze
Max
imum
Col
or, p
latin
um c
obal
t sc
ale
Spec
ific
con
duct
ance
, jiS
/cm
at 2
5°C
Wat
er t
empe
ratu
re,
°C
Oxy
gen,
dis
solv
ed,
mg/
L
pH,
fiel
d, s
tand
ard
unit
Res
idue
, tot
al, m
g/L
Nitr
ogen
, am
mon
ia,
diss
olve
d, m
g/L
as
N
Nitr
ogen
, nitr
ite, m
g/L
as
N
Nitr
ogen
, am
mon
ia a
nd o
rgan
ic, d
isso
lved
, mg/
L a
s N
Nitr
ogen
, am
mon
ia a
nd o
rgan
ic,
tota
l, m
g/L
as
N
NO
2 +
NO
3, d
isso
lved
, m
g/L
as
N
Phos
phor
us, t
otal
, mg/
L a
s P
Phos
phor
us,
orth
o, m
g/L
as
P
Car
bon,
org
anic
dis
solv
ed,
mg/
L a
s C
Cya
nide
, to
tal,
mg/
L a
s C
N
Cal
cium
, di
ssol
ved,
mg/
L a
s C
a
Chl
orid
e, d
isso
lved
, m
g/L
as
Cl
Fluo
ride
, di
ssol
ved,
mg/
L a
s F
Iron
, tot
al,
Hg/
L as
Fe
Iron
, di
ssol
ved,
jag
/L a
s Fe
Mag
nesi
um,
diss
olve
d, m
g/L
as
Mg
Man
gane
se, t
otal
, ja
g/L
as
Mn
Man
gane
se,
diss
olve
d, j
ig/L
as
Mn
Sodi
um,
diss
olve
d, m
g/L
as
Na
Pota
ssiu
m, d
isso
lved
, mg/
L a
s K
Sulf
ate,
dis
solv
ed, m
g/L
as
SO4
Silic
a, d
isso
lved
, mg/
L a
s Si
C>2
14 87 87 38 47 13 46 25 32 14 46 46 39 8 1
47 47 47 46 28 47 46 28 47 47 47 47
60 380 32.5
14.7 8.4
25 0.1 .0
3
.7 .8 .62
.1 .03
9.5
<.01
36 5.6 .5
2,40
0
290 17 170 66 4.
2
9.4
12 14
Min
imum
13 0 0 5.7
6.4
<1 <.01
<.01
<.2
0
.3 .05
<.01
<.01
4.1
- 12 2.1 .1
80 35 5.4
10 7 1.6 .1
4.2
4.5
Mea
n
35 233 10
.6
10.4 7.6
8.9
*.04
<.01
*.41 .4
6
.25
*.03
*<.0
1
7 - 26.4 3.5 .1
8
382
122 12
.7
53 25.6 2.5
1.14
7.0
9.0
95
60 300 24 14
.6 8.3
*25.
0
*.08
-- *.70 .8 .61
*.06
- 9.5
- 35 5.1 .2
6
1,07
0
285 16
.6
133 60 3.
3
1.5
11.6
13.6
75
55 270 19
.6
12.5 8
*10.
5
*.05
- *.50 .5
2
.44
*.03
- 8.7
-- 30 4.2 .2
425
150 15 70 35.5 2.7
1.1
8.2
11
Per
cent
ile
50
(Med
ian)
28 245 10
.7 9.6
7.6
*7.0 *.04
- *.40 .4 .1
8
*.02
-- 7.1
-- 28 3.2 .2
280
105 13 50 24 2.
4
1 6.6
8.5
25
19.5
204 1 8.
3
7.3
*5.0 *.03
-- *.30 .3 .12
*.02
- 5.7
-- 23 3 .1
197.
5
70 11 30 11.5 2.3 .9 5.7
6.8
5
13 146 0 6.
5
6.54
*4.0 *.02
-- *.20 .3 .0
6
*.01
- 4.1
- 18 2.2 .1
134 38 8.
3
10 7 1.7 .7
4.5
5.1

Na+K
Mg
Ca
CI+F
SO,
HC0 3+C0 3
I I I I I I I I I I I 2.5 2.5
MILLEQUIVALENTS PER LITER
Figure?. Proportions of major ions at Wolf River at Keshena, Wis., station 04077100, March 11, 1998.
Mean total nitrogen concentrations near Langlade and at Keshena were 0.59 mg/L, and 0.60 mg/L, respec tively. Concentrations of total Kjeldahl nitrogen at Langlade and Keshena were low: a mean concentration of 0.42 rng/L for 27 samples collected at Langlade and a mean concentration of 0.41 mg/L for 25 samples col lected at Keshena (tables 4 and 5). Concentrations of ammonia and nitrite plus nitrate were slightly higher in samples collected at Shawano 1989 through 1996 than those at Langlade and Keshena 1995 through 1998; however, concentrations of these nitrogen species were still quite low and do not indicate the presence of water- quality problems as compared to a standard such as the USEPA National Drinking Water Maximum Contami nant Level (MCL) of 10 mg/L for nitrite plus nitrate nitrogen.
Phosphorus
Two species of phosphorus were analyzed in the water samples: a "total phosphorus" analysis that is the sum of particulate and dissolved phosphorus, and an analysis of "orthophosphorus," which comprises only
dissolved phosphorus. Sources of phosphorus in water are virtually the same as those reported above for nitro gen, with a possible addition of phosphate-based deter gents or cleaning compounds that may be used and subsequently disposed of in the basin.
As with nitrogen, concentrations of phosphorus in water samples from the Wolf River at the three sites were low, indicating an absence of pollution in the river. The mean total phosphorus concentration for 61 sam ples collected at Langlade was 0.02 mg/L, for 25 sam ples collected at Keshena was also 0.02 mg/L, and for 46 samples collected at Shawano the mean was 0.03 mg/L. Mean orthophosphorus concentrations at all sites were less than the analytical detection limit of 0.01 mg/L.
Trace Elements
Analyses for trace elements in Wolf River water for this project included the most common elements found in the Earth's crustal materials. With the exception of elevated concentrations of iron, manganese, and alumi num, trace elements that are abundant in the geologic
CHARACTERISTICS OF STREAM WATER, SEDIMENT, AND BENTHIC COMMUNITIES 19

materials of the Wolf River Basin are present at only low concentrations in river water. In general, trace ele ments increasingly dissolve in water under increasingly acidic conditions any substantial increase in the acid ity of the Wolf River could cause larger quantities of trace elements that are presently bound in the highly mineralized rocks and sediment of the basin to dissolve and become mobilized.
Despite the low concentrations of most trace ele ments in the Wolf River water, some trace elements that are present may bioaccumulate and could potentially have a negative effect on fish and other animals in the food chain. Bioaccumulation of trace elements in fish is discussed under the heading "Fish Tissues" in the "Characteristics of Benthic Communities" section of this report.
Concentrations of iron and manganese in the Wolf River (tables 4, 5, and 6) are elevated because of disso lution of iron- and manganese-bearing materials associ ated with the igneous granites, syenite, and monzonite of the Precambrian bedrock and of materials in the over lying glacial till in the basin. Krohelski and others (1994, p. 10) reported that water from about three-quar ters of sampled wells on the Reservation had high con centrations of iron and manganese. The iron and manganese in ground water directly contribute to the elevated levels of iron and manganese in Wolf River baseflow. Mean concentration of total iron in 95 Lang- lade samples was 312 ^ig/L (table 4), in 24 Keshena samples was 292 jag/L (table 5), and in 46 Shawano samples was 382 ^ig/L (table 6). These concentrations are near or greater than the USEPA Secondary MCL for iron in public water supplies of 300 jig/L. Elevated iron concentrations in water supplies are undesirable for esthetic reasons (such as color) and also because such water can stain laundry or plumbing fixtures. Mean con centration of total manganese in 95 samples collected from Langlade was 53.5 |ig/L (as Mn), the mean con centration of 24 samples collected at Keshena was 55.8 p.g/L, and the mean concentration of 46 samples collected at Shawano was 53.0, indicating high concen trations when compared to the USEPA Secondary MCL for manganese in public water supplies of 50 |ig/L.
Barium, chromium, boron, zinc and mercury were occasionally detected at very low concentrations in water samples collected at Langlade, Keshena, and Sha wano (tables 7,8, and 9). Barium is a common trace ele ment associated with igneous rocks such as those that form the bedrock under the Menominee Reservation. The most common form of barium is barite (BaSO4),
which has a low to moderate solubility in freshwater. Mean concentrations of dissolved barium were low at the Langlade and Keshena sites, and even the maximum concentration of 14 |ig/L in a sample collected at Kesh ena was substantially below a median concentration of 45 fig/L of barium in larger rivers of the United States (cited by Hem, 1992). The USEPA MCL for barium for public water supplies is 2 mg/L, about 2 orders of mag nitude greater than the barium concentrations measured in the Wolf River. The maximum dissolved chromium concentration measured in Wolf River samples was 0.8 |ig/L (as Cr) in one sample from each of the Lang lade and Keshena sites, in comparison with the USEPA MCL of 100 fig/L. Boron and zinc are present at all three sites but concentrations do not represent a water- supply or human-health concern (Hem, 1992). The USEPA Secondary MCL for zinc in public water sup plies is 5 mg/L. A maximum concentration of mercury of 1 fig/L (as Hg) in each sample collected at Langlade and Shawano is half of the USEPA MCL of 2 jag/L for public water supplies. Low-level mercury sampling techniques and analyses, (at the nanogram per liter level) of 13 samples each at Langlade and Keshena during 1996-98, however, indicated a maximum of 7.4 ng/L (.0074 |ig/L)total mercury near Langlade and 6.7 ng/L (.0067 jig/L) total mercury at Keshena.
Low concentrations of total copper, total lead, and total nickel were generally detected in water samples collected near Langlade and at Keshena and Shawano. These low concentrations generally did not approach any USEPA MCL's for drinking water (U.S. Environ mental Protection Agency, 1999). For example, the USEPA Secondary MCL for copper in public water sup plies is 1,000 n<g/L, and the maximum total copper found was 23 |ig/L in a sample collected at Shawano (table 9). A maximum concentration of 67 fig/L of total lead was observed, however, in a sample near Langlade. The USEPA MCL for lead in public water supplies is 15 |^g/L.
The only other trace element with mean concentra tions above the detection limit was aluminum. Although aluminum is the third most abundant element in the Earth's outer crust, it has a low solubility in most natural waters of near-neutral pH such as the Wolf River. Many of the aquifer and regolith materials on the Reservation are silicate igneous rocks and residual clays that contain aluminum. Most aluminum present in water samples from the Wolf River was in particulates (total alumi num) instead of being dissolved in the water. Mean total aluminum concentration of 17 samples collected near
20 Characteristics of Water, Sediment, and Benthic Communities of the Wolf River, Menominee Indian Reservation, Wisconsin, Water Years 1986-98

Table 7. Summary of trace-element data in water, April 1986-September 1998, at the Wolf River at Highway M near Langlade, Wis., station 04075050
, micrograms per liter; ng/L, nanogram per liter]
Water-quality constituent
Aluminum, dissolved, Hg/L as Al
Aluminum, total, ng/L as Al
Antimony, dissolved, ng/L as Sb
Arsenic, dissolved, ug/L as As
Arsenic, total, \aglL as As
Barium, dissolved, ^ig/L as Ba
Barium, total, ng/L as Ba
Boron, dissolved, ng/L as B
Boron, total, Hg/L as B
Cadmium, dissolved, ng/L as Cd
Cadmium, total, (ig/L as Cd
Chromium, dissolved, ng/L as Cr
Chromium, hexavalent, ng/L as Cr
Chromium, total, ng/L as Cr
Cobalt, dissolved, pig/L as Co
Cobalt, total, ng/L as Co
Copper, dissolved, (ig/L as Cu
Copper, total, ng/L as Cu
Lead, dissolved, ^g/L as Pb
Lead, total, ug/L as Pb
Lithium, dissolved, (ig/L as Li
Lithium, total, \aglL as Li
Mercury, total recoverable, ng/L as Hg
Mercury, dissolved, ng/L as Hg 1
Mercury, total recoverable, ng/L as Hg 1
Molybdenum, dissolved, ng/L as Mo
Nickel, dissolved, \iglL as Ni
Nickel, total, ng/L as Ni
Selenium, dissolved, ^ig/L as Se
Selenium, total, ug/L as Se
Silver, dissolved, ng/L as Ag
Silver, total, ^g/L as Ag
Thallium, dissolved, ng/L as Tl
Thallium, total, \iglL as Tl
Uranium, natural, ng/L as U
Zinc, dissolved, ng/L as Zn
Zinc, total, (ig/L as Zn
Sample size
17
17
5
15
68
17
66
15
17
15
68
15
5
69
15
17
15
70
15
68
17
17
56
13
13
5
15
67
15
41
17
67
17
12
17
15
67
Number of detections
15
17
0
4
22
17
4
10
12
2
4
4
0
31
3
0
1
57
1
40
0
1
6
13
13
0
1
35
0
0
0
6
0
0
2
12
20
Maximum Minimum
34 <10.0
210 20
<1 <1
1 <1
10 <1
13 7.2
200 <100
24 <16
30 <10
0.2 <0.1
4 <1
.8 <.5
<1 <1
22 <1
.6 <.5
<1 <1
2.5 <.5
9 <1
.6 <.5
67 <5, <1
<10 <4
20 <10
1 <.l
4.6 .5
7.4 .8
<1 <1
1 <1
6 <50, <1
<1 <1
<1 <1
<1 <.2
9 <1
<.5 <,5
<1 <1
1 <1
5.5 <.5
120 <10
Mean
11.9
62.9
<1
<1
<1
10.2
<100
13.8
15.3
<1.0
<1
<.5
<1
<1
<1
<1
<.5
2.9
<5
7
<4
<10
<.l
1.7
2.8
<1
<1
1.8
<1
<1
<1
<1
<.5
<1
<1
1.8
<10
1996-98
CHARACTERISTICS OF STREAM WATER, SEDIMENT, AND BENTHIC COMMUNITIES 21

Table 8. Summary of trace-element data in water, May 1995-September 1998, at the Wolf River at Keshena,Wis., station 04077100[ug/L, micrograms per liter; ng/L, nanograms per liter]
Water-quality constituent
Aluminum, dissolved, ug/L as Al
Aluminum, total, ug/L as Al
Antimony, dissolved, ug/L as Sb
Arsenic, dissolved, ug/L as As
Arsenic, total, ug/L as As
Barium, dissolved, ug/L as Ba
Barium, total, ug/L as Ba
Beryllium, dissolved, ug/L as Be
Boron, dissolved, ug/L as B
Boron, total, ug/L as B
Cadmium, dissolved, ug/L as Cd
Cadmium, total, ug/L as Cd
Chromium, dissolved, ug/L as Cr
Chromium, hexavalent, ug/L as Cr
Chromium, total, ug/L as Cr
Cobalt, dissolved, ug/L as Co
Cobalt, total, ug/L as Co
Copper, dissolved, ug/L as Cu
Copper, total, ug/L as Cu
Lead, dissolved, ug/L as Pb
Lead, total, ug/L as Pb
Lithium, dissolved, ug/L as Li
Lithium, total, ug/L as Li
Mercury, dissolved, ng/L as Hg 1
Mercury, total recoverable, ng/L as Hg 1
Molybdenum, dissolved, ug/L as Mo
Nickel, dissolved, ug/L as Ni
Nickel, total, ug/L as Ni
Selenium, dissolved, ug/L as Se
Selenium, total, ug/L as Se
Silver, dissolved, ug/L as Ag
Silver, total, ug/L as Ag
Thallium, dissolved, ug/L as Tl
Thallium, total, ug/L as Tl
Uranium, natural, dissolved
Zinc, dissolved, ug/L as Zn
Zinc, total, ug/L as Zn
Sample size
15
15
5
15
13
15
12
5
15
15
15
13
15
5
13
15
15
15
15
15
13
15
15
13
13
5
15
15
15
4
15
15
15
12
15
15
15
Number of detections
11
15
0
3
2
15
0
0
11
13
1
0
6
0
2
1
0
2
3
1
2
0
0
13
13
0
0
0
0
0
0
0
0
0
9
11
0
Maximum Minimum Mean
26 4.6 10.6
200 20 66.7
<1 <1 <1
1 <1 <1
1 <1 <1
14 7.9 11.2
<100 <100 <100
<1 <1 <1
19 9.3 13.4
20 <10 14.7
.3 <.l <1
<1 <1 <1
.8 <.5 .56
<1 <1 <1
2 <1 <1
.6 <.5 <.5
<1 <1 <1
2.8 <.5 <.5
1 <1 <1
2.4 <.5 <.5
2 <1 <1
<4 <4 <4
<10 <10 <10
3.4 .5 1.7
6.7 .8 2.8
<1 <1 <1
<1 <1 <1
<50 <1 <50
<1 <1 <1
<1 <1 <1
<1 <.2 <.2
<1 <1 <1
<.5 <.5 <.5
<1 <1 <1
1.6 <1 <1
7.9 <.5 1.8
<10 <10 <10
1996-5
22 Characteristics of Water, Sediment, and Benthic Communities of the Wolf River, Menominee Indian Reservation, Wisconsin, Water Years 1986-98

Table 9. Summary of trace-element data in water, October 1989-September 1996, at the Wolf River near Shawano, Wis., station 04077400 [ug/L, micrograms per liter]
Water-quality constituent
Arsenic, total, M-g/L as As
Barium, total, ^ig/L as Ba
Cadmium, total, ^ig/L as Cd
Chromium, total, ng/L as Cr
Copper, total, ug/L as Cu
Lead, total, ug/L as Pb
Nickel, total, ^.g/L as Ni
Mercury, total recoverable, ^ig/L as Hg
Silver, total, (o.g/L as Ag
Zinc, total, (o.g/L as Zn
Sample size
17
18
18
18
18
18
18
18
18
18
Number of detections
4
2
2
7
17
16
13
1
0
6
Maximum Minimum
2 <1
100 <100
3 <1
3 <1
23 <1
5 <1
40 <1
1 <.l
<1 <1
100 <10
Mean
<1
<100
<1<1
4.1
1.6
4.2
<.l
<1
<10
Langlade was 62.9 ^ig/L, with a maximum measured value of 210 |ig/L (table 7). Similar total aluminum concentrations were found in 15 samples collected at Keshena (table 8). The USEPA Secondary Maximum Contaminant Level for aluminum in water delivered from a public water supply is 50 to 200 |ig/L. A com parison of aluminum concentrations in water samples collected from the Wolf River with the USEPA standard indicates that the River contains elevated levels of alu minum relative to most natural waters probably because of the natural erosion and weathering of the aluminum-rich basin materials.
Likely sources of atrazine and alachlor to the Wolf River include leaching of herbicides that may be applied to cropped land upstream from the sampling sites and atmospheric deposition to the basin. No other pesticides were present at concentrations above the analytical detection limits. Very low concentrations or nondetections of pesticides are expected in areas such as the Upper Wolf River Basin that are not intensively farmed.
Physical and Chemical Characteristics of Sediment
Pesticides
Screening-level analysis was done for 61 pesticides and pesticide metabolites in water samples collected near Langlade and at Keshena from 1995 to 1998 (tables 10 and 11). Atrazine and alachlor are widely used for season-long weed control in corn, sorghum, and other crops. Trace amounts of atrazine (maximum concentration of 0.031 |ig/L at Langlade) and a degra dation product deethylatrazine (maximum 0.032 |ig/L at Langlade) were detected in samples collected at Langlade and Keshena during May through September of each year. Alachlor and metolachlor were also detected one time at Langlade. Lindane and metolachlor were detected once at Keshena. The USEPA MCL for atrazine in public water supplies is 3 |ig/L, and that for alachlor is 2 |ig/L.
Particle Size
The percentages of the bulk sediment samples (<2 mm) from the Wolf River near Langlade for 1995-98 that were silt/clay (<0.062 mm) averaged 67.2 percent and ranged from 36.2 to 100 percent; the clay fractions (<0.004 mm) averaged 34.2 percent and ranged from 16.0 to 50.5 percent (table 12). For the Keshena site, particle size analyses indicated that an average of 28.2 percent of the bulk sediment was silt and clay. This is the fraction that was collected for trace element analysis at both sites. Clay made up a smaller part of the depositional sediment, averaging 12.5 per cent. The percentage of clay making up the sample was fairly consistent among years. The silt and clay fraction in depositional sediment from the Wolf River near Langlade was more variable among years than that from
CHARACTERISTICS OF STREAM WATER, SEDIMENT, AND BENTHIC COMMUNITIES 23

Table 10. Summary of pesticide data (dissolved), 1995-98, for the Wolf River at Highway M near Langlade, Wis.,station 04075050[\ig/L, micrograms per liter; <, less than; --, not computed]
Compound name
2,6-Diethylaniline
Acetochlor, (-ig/L
Alachlor, |ig/L
Ametryn, ^.g/L
Atrazine, ^ig/L
Atrazine, deethyl-, ^.g/L
Atrazine, deisopropyl-, (-ig/L
Azinphos, methyl-, (ig/L
Benfluralin, |ig/L
Bromacil, n,g/L
Butachlor, (O-g/L
Butyl ate, ^ig/L
Carbaryl (Sevin), (ig/L
Carbofuran, ^ig/L
Carboxin, ^ig/L
Chlorpyriphos, ^.g/L
Cyanazine, ^ig/L
Cycloate, ^ig/L
DCPA (Dacthal), u.g/L
DDE, u.g/L
Diazinon, |ig/L
Dieldrin, ng/L
Diphenamid, (O-g/L
Disulfoton, (O-g/L
EPTC (Eptam), jig/L
Ethalfluralin, ^.g/L
Ethoprophos, ^ig/L
Fonofos, M-g/L
HCH, alpha-, ^g/L
Hexazinone, ^ig/L
Lindane, ng/L
Linuron, Hg/L
Sample size
4
8
8
4
8
8
4
4
4
4
4
8
4
4
4
4
8
4
4
4
4
4
4
4
4
4
4
4
4
4
4
4
Number of detects
0
0
1
0
6
5
0
0
0
0
0
0
0
0
0
0
0
0
0
0
0
0
0
0
0
0
0
0
0
0
0
0
Maximum
<0.003
<.050
.002
<.050
.031
.032
<.050
<.001
<.002
<.050
<.050
<.050
<.003
<.003
<.050
<.004
<.200
<.050
<.002
<.006
<.002
<.001
<.050
<.017
<.002
<.004
<.003
<.003
<.002
<.050
<.004
<.002
Minimum Mean
<0.003
<.002
<.002
<.050
<.050 0.015
<.050 .008
<.050
<.001
<.002
<.050
<.050
<.002
<.003
<.003
<.050
<.004
<.004
<.050
<.002
<.006
<.002
<.001
<.050
<.017
<.002
<.004
<.003
<.003
<.002
<.050
<.004
<.002
24 Characteristics of Water, Sediment, and Benthic Communities of the Wolf River, Menominee Indian Reservation, Wisconsin, Water Years 1986-98

Table 10. Summary of pesticide data (dissolved), 1995-98, for the Wolf River at Highway M near Langlade, Wis., station 04075050 Continued
, micrograms per liter; <, less than; --, not computed]
Compound name
Malathion, ^ig/L
Metolachlor, ^ig/L
Metribuzin, |ig/L
Molinate, (O-g/L
Napropamide, M-g/L
Parathion, ethyl-, (o.g/L
Parathion, methyl-, ^ig/L
Pebulate, M-g/L
Pendimethalin, (ig/L
Permethrin, cis, |ag/L
Phorate, (o.g/L
Pr on amide, (o.g/L
Prometon, M-g/L
Prometryn, (O-g/L
Propachlor, ^.g/L
Propanil, (O-g/L
Propazine, ^ig/L
Propargite I and II, H-g/L
Simazine, ^ig/L
Simetryn, (O-g/L
Thiobencarb, M-g/L
Tebuthiuron, ^.g/L
Terbufos, (O-g/L
Trial late, ^ig/L
Trifluralin, |ag/L
Terbacil, M-g/L
Vernolate, |J.g/L
Sample size
4
8
8
4
4
4
4
4
4
4
4
4
8
4
8
4
4
4
8
4
4
4
4
4
8
8
4
Number of detects
0
1
0
0
0
0
0
0
0
0
0
0
0
0
0
0
0
0
0
0
0
0
0
0
0
0
0
Maximum
<.005
.004
<.070
<.004
<.003
<.004
<.006
<.004
<.004
<.005
<.002
<.003
<.050
<.050
<.050
<.004
<.050
<.013
<.050
<.050
<.002
<.010
<.013
<.001
<.050
<.050
<.050
Minimum Mean
<.005
<.002
<.004
<.004
<.003
<.004
<.006
<.004
<.004
<.005
<.002
<.003
<.018
<.050
<.007
<.004
<.050
<.013
<.005
<.050
<.002
<.010
<.013
<.001
<.002
<.007
<.050
CHARACTERISTICS OF STREAM WATER, SEDIMENT, AND BENTHIC COMMUNITIES 25

Table 11. Summary of pesticide data (dissolved), 1995-98, for the Wolf River at Keshena ; station 04077100
, micrograms per liter; <, less than; , not computed]
Wis.,
Compound name
2,6-Diethylaniline, (ig/L
Acetochlor, (ig/L
Alachlor, (ig/L
Ametryn, |ig/L
Atrazine, (ig/L
Atrazine, deethyl-, p,g/L
Atrazine, deisopropyl-, Hg/L
Azinphos, methyl-, (ig/L
Benfluralin, (J.g/L
Bromacil, ^.g/L
Butachlor, (ig/L
Butylate, (ig/L
Carbaryl (Sevin), (ig/L
Carbofuran, Hg/L
Carboxin, |ig/L
Chlorpyriphos, (-ig/L
Cyanazine, (ig/L
Cycloate, u,g/L
DCPA (Dacthal), Hg/L
DDE, jig/L
Diazinon, (o.g/L
Dieldrin, u.g/L
Disulfoton, (ig/L
EPTC (Eptam), jig/L
Ethalfluralin, (ig/L
Ethoprophos, (ig/L
Fonofos, (ig/L
HCH, alpha-, ^g/L
Hexazinone, M-g/L
Lindane, (o.g/L
Linuron, (o.g/L
Malathion, ^.g/L
Sample size
3
7
7
4
7
7
4
3
3
4
4
7
3
3
4
3
7
4
3
3
3
3
3
3
3
3
3
3
4
3
3
3
Number of detects
0
0
0
0
5
4
0
0
0
0
0
0
0
0
0
0
0
0
0
0
0
0
0
0
0
0
0
0
0
1
0
0
Maximum
<0.003
<.05
<.05
<.05
.03
.034
<.05
<.001
<.002
<.05
<.05
<.05
<.003
<.003
<.05
<.004
<.20
<.05
<.002
<.006
<.002
<.001
<.017
<.002
<.004
<.003
<.003
<.002
<.05
.008
<.002
<.005
Minimum
<0.003
<.002
<.002
<.05
.007
.003
<.05
<.001
<.002
<.05
<.05
<.002
<.003
<.003
<.05
<.004
<.004
<.05
<.002
<.006
<.002
<.001
<.017
<.002
<.004
<.003
<.003
<.002
<.05
<.004
<.002
<.005
Mean
-
-
~
-
0.017
-
-
-
-
-
-
-
-
-
-
~
-
-
~
-
-
-
-
-
-
-
-
~
-
-
-
-
26 Characteristics of Water, Sediment, and Benthic Communities of the Wolf River, Menominee Indian Reservation, Wisconsin, Water Years 1986-98

Table 11. Summary of pesticide data (dissolved), 1995-98, for the Wolf River at Keshena, Wis., station 04077100 Continuedl^g/L, micrograms per liter; <, less than; --, not computed]
Compound name
Metolachlor, ng/L
Metribuzin, (O-g/L
Molinate, ^.g/L
Napropamide, ^ig/L
Parathion, ethyl-, [ig/L
Parathion, methyl-, (o.g/L
Pebulate, |ig/L
Pendimethalin, ^.g/L
Permethrin, cis, (O-g/L
Phorate, [ig/L
Pronamide, (O-g/L
Prometon, [ig/L
Prometryn, [ig/L
Propachlor, [ig/L
Propanil, [ig/L
Propargite I and II, [ig/L
Propazine, [ig/L
Simetryn, |ig/L
Simazine, [ig/L
Thiobencarb, M-g/L
Tebuthiuron, u,g/L
Terbufos, [ig/L
Triallate, u.g/L
Trifluralin, u,g/L
Terbacil, (.ig/L
Vernolate, u,g/L
Sample size
7
7
3
3
3
3
3
3
3
3
3
7
4
7
3
3
4
4
7
3
3
3
3
7
7
4
Number of detects
1
0
0
0
0
0
0
0
0
0
0
0
0
0
0
0
0
0
0
0
0
0
0
0
0
0
Maximum
<.05
<.05
<.004
<.003
<.004
<.006
<.004
<.004
<.005
<.002
<.003
<.05
<.05
<.05
<.004
<.013
<.05
<.05
<.05
<.002
<.010
<.013
<.001
<.05
<.05
<.05
Minimum Mean
<.002
<.004
<.004
<.003
<.004
<.006
<.004
<.004
<.005
<.002
<.003
<.018
<.05
<.007
<.004
<.013
<.05
<.05
<.005
<.002
<.010
<.013
<.001
<.002
<.007
<.05
CHARACTERISTICS OF STREAM WATER, SEDIMENT, AND BENTHIC COMMUNITIES 27

Table 12. Particle-size data for bulk (<2 mm) depositional sediment collected from the Wolf River near Langlade and at Keshena, 1995-98[mm, millimeter]
Sediment fraction
Site and year
Wolf River near Langlade
1995
1996
1997
1998
Mean value
Wolf River at Keshena
1996
1997
1998
Mean value
Percent silt/clay (<0.062 mm)
83.2
49.5
36.2
100
67.2
23.3
28.7
32.5
28.2
Percent clay (<0.004 mm)
45.1
25.4
16.0
50.5
34.2
9.4
12.9
15.3
12.5
Keshena. An effort was made to sample the same or similar locations at this site among years, and these results indicate more variability in sediment size for certain depositional areas within this reach of the river.
Trace Elements
Concentrations of most trace elements were low in fine streambed sediment from the Wolf River sites at Keshena and near Langlade (table 13; appendix 6 and 7). Concentrations observed were within the ranges found by Scudder and others (1997) for the Western Lake Michigan Drainages and were generally on the lower ends of these ranges. Concentrations of chro mium, copper, nickel, and zinc were similar to or less than the 25th percentile reported for other NAWQA study areas across the Nation by Rice (1999; also see Peters and others, 1998). Arsenic and selenium concen trations found at the Keshena and Langlade sites were higher than those reported for fine sediment from some sites in the Western Lake Michigan Drainages (Scudder and others, 1997), and they were above the 75th percen tile for NAWQA study units (Rice, 1999). The concen trations were still relatively low, however, when compared to other sites with similar land use and bed rock type in the Western Lake Michigan Drainages and likely represent contributions from natural sources. Scudder and others (1997) found that forested land use and igneous/metamorphic bedrock were related to
higher arsenic and selenium concentrations in streambed sediment. Sediment arsenic concentrations, if converted to bulk sediment concentrations using data in table 12, still would not exceed the Canadian Sedi ment Quality Guidelines (Canadian Council of Minis ters of the Environment, 1999) or the Threshold Effects Concentration calculated by McDonald and others (2000). Lead concentrations for the two Wolf River sites would be below these guidelines and were below the 50th percentile of values reported by Rice (1999). These concentrations also were near the median for for- ested-land-use sites and far below ranges found at urban and large mixed-land-use rivers sampled by Scudder and others (1997).
Concentrations of most elements at the down stream Keshena site did not show any significant increase when compared to the upstream site near Lang lade. Exceptions were for lanthanum, lead, neodymium, and manganese concentrations, which were higher at the downstream Keshena site.
No temporal trends were apparent in the data col lected to date. Data available are insufficient for statis tical examination of trends. The data do provide a useful baseline to which future measurements may be com pared.
28 Characteristics of Water, Sediment, and Benthic Communities of the Wolf River, Menominee Indian Reservation, Wisconsin, Water Years 1986-98

Table 13. Statistical summary of trace elements and carbon in fine (<0.062 mm) streambed sediment from the Wolf River near Langlade and at Keshena, Wis., 1995-98[Trace-element concentrations are shown in micrograms per gram, and carbon concentrations are shown in percent. All concentrations are for dry weight. The number of samples, N, was 4 at Langlade and 3 at Keshena; *, one value less than the minimum reporting level was included in computation of the average and standard deviation by substituting a value equal to one-half the minimum detection limit; , not computed]
Element
Antimony
Arsenic
Barium
Beryllium
Bismuth
Cadmium
Cerium
Chromium
Cobalt
Copper
Europium
Gallium
Gold
Holmium
Lanthanum
Lead
Lithium
Manganese
Mercury
Molybdenum
Neodymium
Nickel
Niobium
Scandium
Selenium
Silver
Strontium
Sulfur
Tantalum
Thorium
Tin
Titanium
Uranium
Vanadium
Ytterbium
Yttrium
Zinc
Carbon, organic
Carbon, inorganic
Carbon, Total
Mean
0.3
9.5
342
<1
<10
.7
41
51
6.6
15
<2
*6.2
<8
<4
23
20
10
2,200
.1
<2
19.8
11
6.3
5.7
1.8
.3
77
.3
<40
8.2
<5
.2
4.0
53
1.8
18
87
13.5
2
13.7
Langlade
Standard deviation
0.1
2.3
43.5
-
-
.1
8.4
7.0
1.2
2.8
-
*3.3
--
-
5.9
2.1
1.0
540
0
-
4.5
1.1
2.0
1.0
.1
.3
11
0
4.0
0
.9
7.9
.4
3.5
9.0
.7
.1
.7
Maximum
0.4
12
380
<1
<10
.7
51
57
8.0
19
<2
10
<8
<4
30
22
12
2,900
.1
<2
25.0
12
8.0
7.0
1.9
.7
87
.4
<40
11
<5
.2
4.7
60
2.0
22
99
14.3
.3
14.5
Mean
0.3
13
347
<1
<10
.7
53
53
6.8
15
<2
*5.6
<8
<4
30
24
11
3,200
.1
<2
24.3
11
*5.0
5.6
1.7
.3
77
.3
<40
8.4
<5
.2
3.0
51
1.9
21
85
12.8
.3
13.1
Keshena
Standard deviation
0.1
3.5
5.8
-
--
.1
5.7
7.2
1.3
2.6
-
*3.5
-
-
2.6
1.7
1.5
380
0
-
2.5
1.2
*3.0
.7
.1
.1
5.9
0
-
3.2
-
0
.6
7.4
.2
2.3
3.8
1.0
0
1.0
Maximum
0.4
17
350
<1
<10
.7
58
59
8.0
18
<2
9.0
<8
<4
32
26
13
3,500
.1
<2
27.0
12
8.0
6.0
1.8
.4
81
.4
<40
11
<5
.2
3.6
57
2.0
22
89
13.5
.3
13.8
CHARACTERISTICS OF STREAM WATER, SEDIMENT, AND BENTHIC COMMUNITIES 29

Table 14. Statistical summary of trace elements in white sucker (Catostomus commersoni) livers from the Wolf River near Langlade and at Keshena, Wis., 1995-98[Trace-element concentrations are shown in micrograms per gram dry weight. The number of composite samples, N, was 4 at Langlade and 3 at Keshena; *, one value less than the minimum reporting level was included in computation of the average and standard deviation by substituting a value equal to one-half the minimum detection limit; , not computed]
Element
Water (percent)
Antimony
Arsenic
Barium
Beryllium
Boron
Cadmium
Chromium
Cobalt
Copper
Lead
Manganese
Mercury
Molybdenum
Nickel
Selenium
Silver
Strontium
Uranium
Vanadium
Zinc
Mean
80.4
<.3*.32
*1.28
<.3
.88
<.3
.69
<.3
18.7
<.3
6.43
<.10*.54
<.3
3.3
<.3
<2.00
<.3
<.24
76.3
Langlade
Standard deviation
2.6--
.06
2.02--
.49--
.08--
9.46--
1.26--
.19--
.48--
-
--
--
12.2
Maximum
83.4
<.5
.40
4.77
<.5
1.6
<.5
.80
<.5
28.3
<.5
7.97
<.10
.70
<.5
3.7
.40
8.14
<.5
.41
88.9
Mean
81.5
<.4*.36
1.48
<.4
.63
<.4
.76
<.4
44.7
<.4
19.6*.15
.79
<.4
4.3*.38
3.20
<.4*.44
111
KeshenaStandard deviation
0.7--
.15
1.96--
.15--
.21--
24.2--
11.2
.22
.25--
.81
.16
5.08--
.23
35.3
Maximum
81.9
<.4
.48
3.72
<.4
.80
<.4
1.00
<.4
59.3
<.4
31.4
.4
.96
<.4
5.2
.50
9.06
<.4
.64
145
Characteristics of Benthic Communities
Results of sampling for benthic community charac teristics and trace element concentrations in biota at the Langlade and Keshena sites on the Wolf River indicate that the algal and invertebrate communities are in very good to excellent condition and most trace elements in biota are at low or undetectable concentrations.
Trace Elements
Fish Tissues
Fish collected from the Langlade and Keshena sites on the Wolf River appeared generally healthy with regard to external morphology. No external anomalies were observed in white sucker collected from either site in 1995 through 1998, with the exception of one fish found with anchor worms at the Langlade site in 1997.
Most of the fish collected for trace-element analy sis were 1-3 years old. In 1995, all fish from the Lang lade site were 1 year old, and in 1996 through 1998 most or all fish collected from this site were 1-3 years old. The range and median ages of fish collected from the Keshena site were similar for the 1996 through 1997 collections. Fish collected were generally 2-3 years old, with a median age of 3 years. In 1998, the median age offish from the Keshena site was 4 years for the regular sample and 3 years for the quality-control sample.
Analyses results revealed low concentrations of most trace elements in white sucker livers from the Langlade and Keshena sites (table 14; appendix 8). Total concentrations of arsenic and silver in white sucker livers from both sites were at or near analytical detection limits, and concentrations of antimony, beryl lium, cadmium, cobalt, lead, nickel, and uranium were all below detection limits. The maximum tissue manga nese concentration at the Keshena site was almost four
30 Characteristics of Water, Sediment, and Benthic Communities of the Wolf River, Menominee Indian Reservation, Wisconsin, Water Years 1986-98

times higher than at the Langlade site, possibly reflect ing the higher sediment manganese concentrations at the Keshena site. Concentrations of most other trace elements were similar to the lowest concentrations found by Fitzpatrick and others (1995) and Scudder and others (1997) for livers of white sucker collected from the Upper Illinois River Basin and Western Lake Mich igan Drainages, respectively.
The exceptions to the otherwise low trace-element concentrations found in white sucker livers were for chromium, copper, mercury, and selenium. When con verted to wet weight, all chromium concentrations found at the Langlade and Keshena sites were above the 85th percentile elevated-data level for livers from all freshwater fish collected in California's Toxic Sub stances Monitoring Program (Rasmussen, 1997); how ever, the elevated-data level lumps all freshwater species collected in that program and may not be directly comparable. The maximum concentration of 1.0 |ig/g chromium found at the Keshena site is low compared to concentrations found in white sucker livers collected by Fitzpatrick and others (1995) and Scudder and others (1997). Concentrations of other trace ele ments were below elevated-data levels reported for freshwater fish collected in the Toxic Substances Mon itoring program.
Copper concentrations were higher at the Keshena site in 1997 and 1998 compared with concentrations found in 1996 and all dates from the Langlade site. These concentrations from the Keshena site were higher than some concentrations found by Fitzpatrick and oth ers (1995) and Scudder and others (1997), including a background concentration of 6.6 M-g/g copper found in white sucker livers from the Upper Peninsula of Michi gan by Scudder and others (1997). Copper concentra tions found in white sucker livers from the Wolf River sites are not high compared to concentrations at urban sites sampled by Fitzpatrick and others (1995). Although sediment copper concentrations were similar and low at the Langlade and Keshena sites during 1995- 1998, the fish from Keshena may be accumulating cop per from another nearby source not measured that con tains more biologically available copper. Copper is associated with urban runoff (such as from domestic sewage and land fills), agricultural chemicals, and industrial sources. Fish movement from the Keshena site would be limited to a few miles by Keshena Falls upstream and the dam downstream with 2 small western tributaries in between.
An elevated concentration of 0.4 p,g/g mercury was found in white sucker livers from the Keshena site in 1998, although all other concentrations in samples of white sucker livers from the Keshena and Langlade sites were near or below the detection limits (detection limits ranged from 0.10 to 0.01 ^ig/g mercury) and sed iment concentrations were low (0.08 to 0.10 p,g/g mer cury). In addition, the associated quality control sample contained only 0.17 p,g/g mercury. As noted above, the median age of fish in the regular sample was 4 years, whereas the median age was 3 for the quality control sample; older organisms would be expected to accumu late higher concentrations of certain trace elements such as mercury so this may be why there was more mercury in the regular sample. In addition, the fact that this one value was an anomaly compared with other samples from this site indicates that one or more fish collected in the composite sample may have migrated from another area where the higher mercury concentration was accu mulated such as wetland-drained areas where higher concentrations of biologically available methyl mer cury could occur (Hurley and others, 1995). Atmo spheric deposition is the major source of mercury to aquatic environments (Krabbenhoft and Rickert, 1995). This concentration is higher than that found for white sucker livers at some other sites in the Midwest by Fitz patrick and others (1995), Scudder and others (1997), and Brigham and others (1998).
The average selenium concentration in white sucker livers was higher at the Keshena site (4.3 p,g/g Se) than at the Langlade site. This concentration also was high compared to a concentration at approximately background concentration (2.9 M-g/g) in white sucker livers reported by Scudder and others (1997) but within the midrange of values found by Fitzpatrick and others (1995). The selenium concentrations in fish from the Wolf River may be associated with naturally occurring sources, such as the igneous metamorphic bedrock in the region. Scudder and others (1997) found that higher selenium concentrations in fine streambed sediment were correlated with sandy/sand and gravel surficial deposits, such as those found in the Wolf River drain age, as well as forested land use.
Agreement between trace-element concentrations in the regular sample and the quality-control sample of fish livers was close for the 1997 and 1998 data set, with the exception of the mercury concentrations discussed above. No quality-control samples were collected for fish in 1995 or 1996.
CHARACTERISTICS OF STREAM WATER, SEDIMENT, AND BENTHIC COMMUNITIES 31

Table 15. Statistical summary of trace elements in whole caddisfly larvae (Hydropsyche/Ceratopsyche spp.) from the Wolf River near Langlade and at Keshena, Wis., 1995-98[Trace-element concentrations are shown in micrograms per gram dry weight. The number of composite samples, N, was 4 at Langlade and 3 at Keshena; *, one value less than the minimum reporting level was included in computation of the average and standard deviation by substituting a value equal to one-half the minimum detection limit; --, not computed]
Element
Water (%)
Arsenic
Barium
Boron
Beryllium
Cadmium
Cobalt
Chromium
Copper
Mercury
Manganese
Molybdenum
Nickel
Lead
Antimony
Selenium
Silver
Strontium
Uranium
Vanadium
Zinc
Mean
82.3
1.64
34.8
3.2
<.3
<.3
.42
2.1
11.1
<.l
1,110
1.6
.52
.79
<.3
.76
<.3
1.3
<.3
2.1
108
LangladeStandard deviation
2.09
0.26
14.3
.85--
--
.07
.27
1.38--
501
.22
.11
.19--
.32--
.25--
.38
17.4
Maximum
84.1
2.03
50.6
4.6
<.3
<.3
.50
2.4
13.4
<.l
1,890
1.8
.6
.98
<.3
1.2
<.3
1.6
.31
2.5
135
Mean
84.8
1.45
59.2
3.0
<.5
<.5
.34
2.2
11.4
<.04
1,000
1.6
.46
.84
<.5
.91
<5
1.3
<.5
1.9
126
KeshenaStandard deviation
0.67
.23
12.9
1.0--
--
.06
.30
1.62--
214
.25
.08
.12~
.16--
.17--
.49
15.7
Maximum
85.6
1.65
67.8
3.9
<.8
<.8
.39
2.5
13.0
.04
1,240
1.9
.52
.94
<.8
1.0
<.78
1.4
<.8
2.4
142
Caddisfly Tissues
With the exception of silver, beryllium, cadmium, antimony, and uranium, the remaining trace elements examined were detected in all seven samples of caddis fly larvae from the Langlade and Keshena sites (table 15; appendix 8). Mercury was detected in three samples, but concentrations were low and near the min imum detection limit. For other trace elements, concen trations in caddisfly larvae were low compared to those at other sites sampled by Scudder and others (1997), and these reflect the low trace-element concentrations in water and streambed sediment described elsewhere in this report. Although arsenic concentrations in stre ambed sediment appeared somewhat elevated, likely reflecting the igneous-metamorphic bedrock of the drainage, concentrations were not high (<2 ^ig/g dry weight) in caddisfly larvae from the Wolf River sites compared with other USGS sites sampled in the West
ern Lake Michigan Drainages (Scudder and others, 1997). Scudder and others (1997) found a correlation between total concentrations of arsenic in streambed sediment and caddisfly larvae. In that study, caddisfly larvae from forested sites had significantly higher con centrations of arsenic; however, interpretations may have been influenced by the fact that most forested sites were underlain by igneous-metamorphic bedrock. Cain and others (1992) analyzed cadmium, copper, lead, and zinc in composite samples of the same genus of caddis fly larvae from reference sites minimally affected by human activity in Montana, and concentrations for these trace elements were similar to those found in cad disfly larvae in project samples from the Wolf River.
Concentrations of trace elements in caddisfly lar vae were similar at the Keshena and Langlade sites. Although concentrations of manganese increased from
32 Characteristics of Water, Sediment, and Benthic Communities of the Wolf River, Menominee Indian Reservation, Wisconsin, Water Years 1986-98

Table 16. Benthic macroinvertebrate metrics with respect to relative abundance in richest-targeted habitat for the Wolf River at Keshena and near Langlade, Wis., 1998[EPT, Ephemeroptera-Plecoptera-Trichoptera genera; FBI, Family Biotic Index; HBI, Hilsenhoff Biotic Index using species level identification; total score possible for HBI, FBI, and Mean Tolerance Value is 10]
Benthic macroinvertebrate metric
Number of species
Number of genera
Total number of individuals in sample
Number of Ephemeroptera genera
Number of Plecoptera genera
Number of Trichoptera genera
Percent EPT genera FBI 1
HBI2
Shannon- Wiener Diversity
Mean Tolerance Value3
Metric value
Langlade
48
44
258
9
2
12
52.3
2.76
2.70
4.05
3.15
Keshena
48
41
387
9
2
10
51.2
3.58
3.19
4.41
3.31
'FBI: 0.00-3.75 Excellent, organic pollution unlikely.
~HBI: 0.00-3.50 Excellent, no apparent organic pollution.
3Mean Tolerance Value categories are same as for the HBI.
1995 to 1998 at both sites, data are insufficient to deter mine whether this is a statistically significant trend.
Invertebrate Communities
A total of 48 species of macroinvertebrates were identified at each site (total taxa richness), with similar numbers of genera represented at both sites (appendix 9). Relative abundance of invertebrates was greater at Keshena. Of the EPT taxa, the order Tri choptera was the most abundant at these sites. The order Plecoptera was represented by only 2 genera, and Ephemeroptera and Trichoptera were represented by 9-12 genera. The taxa richness of EPT genera was slightly less at Keshena. The relatively large percent ages (>50 percent) for EPT at Langlade and Keshena (table 16) indicate good water quality at these sites (Lenat, 1988) when compared to percent EPT values reported by Rheaume and others (1996) and Lenz and Rheaume (2000) for tributaries in the Western Lake Michigan drainages with similar environmental setting but some agricultural land use. The index of similarity was 0.71 (71 percent) for the Langlade and Keshena sites. Out of 48 total species at each site, 34 species
were present at both, and this suggests the two sites are fairly similar in their community composition.
The family (FBI) and species (HBI) level biotic indexes also indicated very good to excellent water quality and suggested slightly better water quality at the Langlade site compared to the downstream site at Kesh ena. The computed indexes were smaller at the Lang lade site. The HBI values at Keshena and at Langlade site indicated excellent water quality with no apparent organic (organic matter or nutrient) enrichment (values between 0.00 and 3.50 as defined in Hilsenhoff, 1987). The FBI at Langlade was well within the range (0.00 to 3.75) for excellent water quality as defined by Hilsen hoff (1988). The FBI for the regular sample at Keshena was near the upper end of the range, and the value for the replicate was in the range (3.76-4.25) that indicated very good water quality but possible slight organic pol lution. Mean tolerance values were similar at Keshena and Langlade and indicated excellent water quality; a slightly larger value at the Keshena site indicates that there are more pollution-tolerant species at this site. Shannon-Wiener diversity was relatively high at both sites, and a slightly higher diversity at a downstream river site is to be expected. The replicate value for diver-
CHARACTERISTICS OF STREAM WATER, SEDIMENT, AND BENTHIC COMMUNITIES 33

Table 17. Distribution of benthic algal taxa with regard to phylum for the Wolf River near Langlade, and at Keshena, Wis., 1998
Phylum
Chlorophyta (green algae)
Baclllariophyta (diatoms)
Cyanophyta (blue-green algae)
Rhodophyta (red algae)
Percent relative abundance
Langlade
2.8
19
78
.30
Keshena
3.0
22
75
0
Percent biovolume
Langlade
1.4
96
1.8
.47
Keshena
7.0
91
2.0
0
sity at Keshena was 4.14, indicating little difference in diversity between the two sites. Mean tolerance values and EFT percentages indicated better water-quality at Langlade and Keshena than at a site on the Popple River in Wisconsin; FBI values at Keshena were similar to those at the Popple River (Lenz and Rheaume, 2000). The Popple River drains the same bedrock and surficial deposit types but wet instead of dry forest is the domi nant land use and cover.
In April 1991, Szczytko (1991) sampled the Wolf River 40 yards downstream of the Highway 47 bridge in approximately the same reach as our study. He used methods described by Hilsenhoff (1987, 1988). Any comparisons between the two studies must consider potential differences due to methods and timing of sam pling, even though the same laboratory analyzed Szc- zytko's 1991 and our 1998 data sets. Szczytko found an average of 41 species (range 34 to 59) and 33 genera (range 27 to 48) in his two sets of five replicate samples from this site. These values are similar to what we found in 1998. The percent EPT was 40.9 in his study com pared to 51.2 in our study. Although not directly com parable, the 4.41 Shannon-Wiener diversity index from our study and his mean of 4.42 for Margalef's diversity index both indicate a diverse assemblage of benthic macroinvertebrates at the Keshena site. Szczytko also found a mean HBI value of 4.16, within the "very good" water quality classification, and an FBI of 4.40, indicat ing "good" water quality. These HBI and FBI values from 1991 are higher than those we found in 1998. This suggests that water-quality conditions have improved during this time period.
Algal Communities
For species richness, a total of 58 algal taxa were identified from the Wolf River at Keshena, including 48 diatom taxa representing 83 percent of all algal taxa (appendix 10). Although 22 percent of the algal relative
o
abundance in cells per square centimeter (cells/cm ) was due to diatoms, diatoms contributed 91 percent of the total algal biomass (table 17). In contrast, the per cent relative abundance of blue-green algae was 75 per cent, making up only 2.0 percent of the total algal biomass of the sample. Green algae made up 3.0 percent of the algal relative abundance and 7.0 percent of the biomass. Audouinella violacea, a freshwater red alga, was found in low (0.66 percent) relative abundance in the quality-control replicate sample from this site but was not found in the regular sample. This taxon may have been missed in the regular sample as a conse quence of its small numbers and laboratory subsam- pling during processing. Freshwater red algae are common only in relatively pristine waters (Sheath and Hambrook, 1990). Nitrogen-fixing algae, including cer tain types of both diatoms and blue-green algae, made up 8.5 percent of the relative abundance of all algae. Nitrogen-fixing benthic algae are indicative of low nitrogen concentrations in the water column and although they are favored by nutrient-poor conditions, they may be found in abundance with high phosphorus enrichment (Burkholder, 1996; Cuffney and other, 1997). Nitrogen and phosphorus concentrations were low in our water samples from both sites.
At the Wolf River near Langlade site, 52 algal taxa were identified. A similar percentage (81 percent) of diatom taxa were found at this site compared to the Keshena site, and diatoms made up most (96 percent) of the algal biomass. Although blue-green algal cells were relatively abundant (78 percent) in the sample, their bio mass (<2.0 percent) was insignificant compared to that of diatoms. The freshwater red alga Audouinella viola cea also was found in low (0.30 percent) relative abun dance at this site. Compared to the Keshena site, nitrogen-fixing algae were much more abundant at Langlade, making up 28 percent of the relative abun dance of all algae.
34 Characteristics of Water, Sediment, and Benthic Communities of the Wolf River, Menominee Indian Reservation, Wisconsin, Water Years 1986-98

Table 18. Benthic algal metrics for diatoms with respect to relative abundance in richest-targeted habitat for the Wolf River near Langlade and at Keshena, Wis., 1998[Silt and pollution indexes were determined according to Bahls (1993) and calibrated for Western Lake Michigan tributaries to assign the biological index value. Shannon-Wiener diversity index values are in log base 2]
Benthic algal metric
Percent pollution tolerant
Percent pollution sensitive
Shannon Wiener Diversity Index 1
Silt Index2
Pollution Index 3
Biological index4
Langlade
4.2
78
3.65
7.8
2.63
4 (Excellent)
Keshena
7.2
76
4.38
11
2.54
4 (Excellent)
Diversity Index: <2.30 (high stress), 2.30-3.29 (moderate stress),
3.30-4.29 (minor stress), >4.30 (no stress).
"Silt Index: >80 (heavy siltation), 60-80 (moderate siltation), 40-60 (minor
siltation), <40 (no siltation).
Pollution Index: <1.50 (severe pollution), 1.50-2.00 (moderate pollution),
2.01-2.50 (minor pollution), >2.50 (no pollution).
4 Biological Index: 1 (poor), 2 (fair), 3 (good), 4 (excellent).
Shannon-Wiener diversity values for diatoms dif fered between the two sites (table 18). A high diversity value of 4.38 indicates no stress on the community at Keshena. Lower diatom diversity was found upstream at Langlade, but the value of 3.65 still indicates high diversity and minor or no stress on the community. This increase in diversity downstream may be a result of greater productivity that occurs as a river increases in size. The silt index, or percentage of diatoms that are considered to be silt tolerant, was low at 11 percent rel ative abundance at Keshena and slightly lower at Lang lade, at 7.8 percent. This finding indicates that siltation is not a problem at either site for diatoms. Most of the diatoms at both sites are those considered to be pollu tion intolerant (76 percent of the diatom relative abun dance at Keshena; 78 percent at Langlade). Tolerant diatoms made up only 7 percent and 4 percent, respec tively, of the diatom relative abundance at the two sites. Pollution indexes for both streams were greater than 2.50 and indicate no pollution at these sites. The overall biological integrity of these two sites, based on diver sity, siltation, and pollution indexes for diatoms, is excellent.
SUMMARY AND CONCLUSIONS
Water quality of the Wolf River is largely unaf fected by human activities along the entire reach on the
Menominee Indian Reservation as represented by water samples collected near Langlade and at Keshena. In general, no significant differences in water-quality were found in data collected upstream from the Wolf River near Langlade and downstream at Keshena and Sha- wano during water years 1986 through 1998. Water samples were analyzed for major ions, nutrients, trace elements, and pesticides. Bottom sediments were ana lyzed for trace elements and particle size. Biological organisms were collected and characterized to provide index values used to determine water and habitat qual ity.
High concentrations of calcium, magnesium, and iron were measured, all of which contribute to natural water hardness in the study area. Levels of Kjeldahl (ammonia plus organic) nitrogen detected at Langlade and Keshena were low: a mean concentration of 0.45 mg/L was measured at Langlade, and a mean con centration of 0.41 mg/L was measured at Keshena. Concentrations of phosphorus in water samples from the Wolf River at the three sites also were low. The mean concentration of 61 total phosphorus samples col lected at Langlade was 0.02 mg/L; the mean concentra tion of 25 total phosphorus samples collected at Keshena was 0.02 mg/L; and 46 samples collected at Shawano had a mean concentration of 0.03 mg/L. Mean concentrations for orthophosphorus were below the analytical detection limit (0.01 mg/L) at the three sites.
SUMMARY AND CONCLUSIONS 35

A wide variety of trace elements are present in the Wolf River that originate from geologic materials and natural weathering in the basin. Most concentrations generally do not approach USEPA water-quality stan dards for public water supplies, however, the water had elevated levels of iron and manganese. Trace amounts of atrazine (maximum concentration of 0.031 |ig/L at Langlade), deethylatrazine (maximum 0.032 |ig/L at Langlade), and alachlor (maximum of 0.002 |ig/L) were detected in samples collected at Langlade and Keshena during May through September of each year.
Low concentrations of most trace elements were found in streambed sediment at the Langlade and Kesh ena sites on the Wolf River. Arsenic and selenium con centrations at the sampled sites were high compared to other sites in the Western Lake Michigan Drainages and other NAWQA study units in the Nation; however, these concentrations may be related to the forested land use or igneous-metamorphic bedrock of the drainage. For the Wolf River at Keshena site, particle size analy ses for water years 1996-98 showed that an average of 28.2 percent of the bulk (<2 mm) sediment was <0.062 mm (silt and clay), and this is the fraction that was collected for trace element analysis. Clay (<0.004 mm) made up a smaller part of the depositional sediment, averaging 12.5 percent.
Tissues of fish and aquatic invertebrates collected once each year from 1995 through 1998 at the Langlade and Keshena sites were low in concentrations of most trace elements. Arsenic and silver in fish livers from both sites were at or near analytical detection limits, and concentrations of antimony, beryllium, cadmium, cobalt, lead, nickel, and uranium were all below detec tion limits. Concentrations of most other trace elements in fish were low, as based on comparisons to literature values. The exceptions were for chromium, copper, mercury, and selenium; however, these concentrations are not at levels of concern. Concentrations of all trace elements analyzed in whole caddisfly larvae also were low compared to those reported in the literature.
For the invertebrate and algal community data col lected in 1998, a total of 48 species of macroinverte brates were identified at each site, with similar numbers of genera represented at both: 41 at Keshena and 44 at Langlade. Relative abundance of invertebrates was greater at Keshena. Of the EFT taxa, the order Tri- choptera was the most abundant at these sites. The order Plecoptera was represented by only two genera, and Ephemeroptera and Trichoptera were represented by 9-12 genera. The taxa richness of EFT genera was
slightly less at Keshena. The percentage EFT was 52 at Keshena and 77 at Langlade, and these relatively large percentages suggest very good to excellent water qual ity at these sites. A total of 52 algal taxa identified at the Wolf River near Langlade site. Diatoms made up 96 percent of the algal biomass. A total of 58 algal taxa were identified from the Wolf River at Keshena, includ ing 48 diatom taxa (83 percent). Although diatoms accounted for just 22 percent of the algal relative abun dance, in cells per square centimeter, diatoms contrib uted 91 percent of the total algal biomass. Most of the diatoms at both sites are considered to be pollution intolerant, and the overall biological integrity of the sites, based on diatom metrics, is excellent.
REFERENCES
Bahls, L.C., 1993, Periphyton bioassessment methods for Montana streams: Helena, Mont., Water Quality Bureau, Department of Health and Environmental Sciences, 38 p. [plus appendixes].
Brewer, R., 1979, Principles of ecology: Philadelphia, W.B. Saunders Co., 299 p.
Brigham, M.E., Goldstein, R.M., and Tornes, L.H., 1998, Trace elements and organic chemicals in streambottom sediments and fish tissues, Red River of the North Basin, Minnesota, North Dakota, and South Dakota, 1992-1995: U.S. Geological Survey Water-Resources Investigations Report 97^043, 32 p.
Bold, H.C., and Wynne, M.J., 1985, Introduction to the algae (2 Ed.): Englewood Cliffs, N.J., Prentice-Hall, 720 p.
Burkholder, J.M., 1996, Interactions of Benthic algae with their substrata, chapter 19 in: Steverson, R.J., Bothwell, M.L., and Lowe R.L., eds., Algal Ecology Freshwater Benthic Ecosystems: New York, Academic Press, p. 253-297.
Cain, D.J., Luoma, S.N., Carter, J.L., and Fend, S.V., 1992, Aquatic insects as bioindicators of trace element con centration in cobble-bottom rivers and streams: Cana dian Journal of Fisheries and Aquatic Sciences, v. 49, no. 10, p. 2141-2154.
Canadian Council of Ministers of the Environment, 1999, Canadian sediment quality guidelines for the protection of aquatic life Summary tables, in Canadian environ mental quality guidelines, 1999: Winnipeg, Canada, Canadian Council of Ministers of the Environment p. 1-2.
Crawford, J.K., and Luoma, S.N., 1994, Guidelines for stud ies of contaminants in biological tissues for the National Water-Quality Assessment Program: U.S. Geological Survey Open-File Report 92^94, 69 p.
36 Characteristics of Water, Sediment, and Benthic Communities of the Wolf River, Menominee Indian Reservation, Wisconsin, Water Years 1986-98

Cuffney, T.F., Gurtz, M.E., and Meador, M.R., 1993, Meth ods for collecting benthic invertebrate samples as part of the National Water-Quality Assessment Program: U.S. Geological Survey Open-File Report 93-406, 66 p.
Cuffney, T.F., Meador, M.R., Porter, S.D., and Gurtz, M.E., 1997, Distribution offish, benthic invertebrate, and algal communities in relation to physical and chemical conditions, Yakima River Basin, Washington, 1990: U.S. Geological Survey Water-Resources Investigations Report 96-4280, 94 p.
Fairchild, G.W., and Lowe, R.L., 1984, Artificial substrate which releases nutrients Effects on periphyton and invertebrate succession: Hydrobiologia, v. 114, p. 29-37.
Fitzpatrick, F.A., Scudder, B.C., Crawford, J.K., Schmidt, A.R., Sieverling, J.B., and others, 1995, Water-quality assessment of the Upper Illinois River basin in Illinois, Indiana, and Wisconsin Major and trace elements in water, sediment, and biota, 1978-90: U.S. Geological Survey Water-Resources Investigations Report 95^045, 254 p.
Hem, J.D., 1992, Study and interpretation of the chemical characteristics of natural water: U.S. Geological Survey Water-Supply Paper 2254, 264 p.
Hilspnhoff, W.L., 1987, An improved biotic index of organic stream pollution: The Great Lakes Entomologist, v. 20, no. 1, p. 31-39.
Hilsenhoff, W.L., 1988, Rapid field assessment of organic pollution with a family-level biotic index: Journal of the North American Benthological Society, v. 7, p. 65-68.
Hurley, J.P., Benoit, J.M., Babiarz, C.L., Shafer, M.M.,Andren, A.W., Sullivan, J.R., Hammond, R., and Webb, D.A., 1995, Influences of watershed characteristics on mercury levels in Wisconsin rivers: Environmental Sci ence and Technology, v. 29, p. 1867-1875.
Krabbenhoft, D.P., and Rickert, D.A., 1995, Mercury con tamination of aquatic ecosystems: U.S. Geological Sur vey Fact Sheet FS-216-95, 4 p.
Krohelski, J.T., Kammerer, P.A., Jr., and Conlon, T.D., 1994, Water resources of the Menominee Indian Reservation of Wisconsin: U.S. Geological Survey Water-Resources Investigations Report 93^4053, 54 p.
Lange-Bertalot, H., 1979, Pollution tolerance of diatoms as a criterion for water quality estimation: Nova Hedwigia, Beiheft, no. 64, p. 285-305.
Lenat, D.R., 1988, Water quality assessment of streams using a qualitative collection method for benthic macroinver- tebrates: Journal of the North American Benthological Society, v. 7, p. 222-233.
Lenat, D.R., 1993, A biotic index for the southeastern United States Derivation and list of tolerance values, with cri teria for assigning water-quality ratings: Journal of the
North American Benthological Society, v. 12, no. 3, p. 279-290.
Lenz, B.N., and Rheaume, S.J., 2000, Benthic invertebrates of fixed sites in the Western Lake Michigan Drainages, Wisconsin and Michigan, 1993-95: U.S. Geological Survey Water-Resources Investigations Report 95-4211-D, 30 p.
Lillie, R.A., and Schlesser, R.A., 1994, Extracting additional information from biotic index samples: Journal of the North American Benthological Society, v. 27, no. 3, p. 129-136.
Lillesand, T., Chipman, J., Nagel, D., Reese, H., Bobo, M., and Goldmann, R., 1998, Upper Midwest Gap Analysis Image Processing Protocol: U.S. Geological Survey, Onalaska, Wis., Environmental Management Technical Center, EMTC 98-GOO, 25 p.
Maddy, D.V., Lopp, L.E., Jackson, D.L., Coupe, R.H., and Schertz, T.L., 1990, National Water Information System user's manual, v. 2, chap. 2, Water-quality system: U.S. Geological Survey Open-File Report 89-617, p. 1-1 to D-36.
McDonald, D.D., Ingersoll, C.G., Berger, T.A., 2000, Devel opment and evaluation of consensus-based sediment quality guidelines for freshwater ecosystems: Archives of Environmental Contamination and Toxicology., v. 39, p. 20-31.
Oblinger Childress, C.J., Foreman, W.T., Connor, B.F., and Maloney, T.J., 1999, New reporting procedures based on long-term method detection levels and some consider ations for interpretations of water-quality data provided by the U.S. Geological Survey National Water Quality Laboratory: U.S. Geological Survey Open-File Report 99-193, 19 p.
Odum, E.P., 1971, Fundamentals of ecology, 3rd Ed.: Phila delphia, W.B. Saunders Co., 574 p.
Persaud, D., Jaagumagi, R., and Hayton, A., 1993, Guidelines for the protection and management of aquatic sediment quality in Ontario: Ontario Ministry of Environment and Energy, Water Resources Branch, August 1993, 27 p.
Peters, C.A., Robertson, D.M., Saad, D.A., Sullivan, D.J., Scudder, B.C., Fitzpatrick, FA., Richards, K.D., Stew- art, J.S., Fitzgerald, S.A., and Lenz, B.N., 1998, Water quality in the Western Lake Michigan Drainages, Wis consin and Michigan, 1992-95: U.S. Geological Survey Circular 1156, 40 p.
Porter, S.D., Cuffney, T.E, Gurtz, M.E., and Meador, M.R., 1993, Methods for collecting algal samples as part of the National Water-Quality Assessment Program: U.S. Geo logical Survey Open-File Report 93^09, 39 p.
Rasmussen, Del, 1997, Toxic Substances Monitoring Pro gram 1994-95 data report: Sacramento, Calif., State Water Resources Control Board, variously paged.
REFERENCES 37

Rheaume, S.J., Lenz, B.N., and Scudder, B.C., 1996, Benthic invertebrates of benchmark steams in agricultural area of eastern Wisconsin Western Lake Michigan Drain ages: U.S. Geological Survey Water-Resources Investi gations Report 96-4038-C, 39 p.
Rice, K.C., 1999, Trace-element concentrations in streambed sediment across the conterminous United States: Envi ronmental Science and Technology, v. 33, p. 2499-2504.
Scudder, B.C., Sullivan, D.J., Fitzpatrick, F.A. and Rheaume, SJ. 1997, Trace elements and synthetic organic com pounds in biota and streambed sediment of the Western Lake Michigan Drainages, 1992-1995: U.S. Geological Survey Water- Resources Investigations Report 97-4192, 34 p.
Sheath, R.G., and Hambrook, J.A., 1990, Freshwater ecol ogy, in Cole, K.M. and Sheath, R.G., eds., Biology of the red algae: New York, Cambridge University Press, p. 423-453.
Shelton, L.R., 1994, Field guide for collecting and processing stream-water samples for the National Water-Quality Assessment Program: U.S. Geological Survey Open- File Report 94-455, 42 p.
Shelton, L.R., and Capel, P.O., 1994, Guidelines for collect ing and processing samples of stream bed sediment for
analysis of trace elements and organic contaminants for the National Water-Quality Assessment Program: U.S. Geological Survey Open-File Report 94-458, 20 p.
Sullivan, D.J., Peterson, E.M., and Richards, K.D., 1995, Environmental settings of fixed sites in the Western Lake Michigan Drainages, Michigan and Wisconsin: U.S. Geological Survey Water-Resources Investigations Report 95-4211-A, 30 p.
Szczytko, S.W., 1991, Rapid bioassessment report on the Wolf River at Shawano and Keshena, WI, FERC No. 710, Prepared for the Federal Energy Regulatory Com mission: Stevens Point, Wis., College of Natural Resources, University of Wisconsin, 29 p.
U.S. Army Corps of Engineers and Menominee Indian Tribe of Wisconsin, Environmental Services Department, 1995, Wolf River flood plain delineation, Study Phase I: 20 p.
U.S. Environmental Protection Agency, 1999, National Primary and Secondary Drinking Water Regulations: USEPA Report 40 CFR. Chap. 1, Parts 141-143, p. 331-560.
38 Characteristics of Water, Sediment, and Benthic Communities of the Wolf River, Menominee Indian Reservation, Wisconsin, Water Years 1986-98

APPENDIXES 1-10
APPENDIXES 1-10 39

Appendix 1. Constituents and minimum reporting levels for the U.S. Geological Survey National Water-Quality Laboratory for major ions, chemical oxygen demand, residue, and specific conductance in water samples during 1986-98[uS/cm, microsiemens per centimeter; mg/L, milligrams per liter; u^/L, micrograms per liter]
Constituent Minimum reporting level
Calcium 0.020 mg/L
Chloride .29 mg/L
Fluoride .10 mg/L
Iron 10 ug/L
Magnesium .014 mg/L
Manganese 2.2 ug/L
Potassium .24 mg/L
Silica .09 mg/L
Sodium .09 mg/L
Sulfate .31 mg/L
Chemical oxygen demand 10 mg/L
Residue, suspended, 105 degrees Celsius 1 mg/L
Specific conductance, laboratory 2.
Appendix 2. Constituents and minimum reporting levels for theU.S. Geological Survey National Water-Quality Laboratory for nutrientsin water samples during 1986-98[mg/L, milligrams per liter]
Constituent Minimum reporting level
Ammonia nitrogen (dissolved) 0.02 mg/L
Ammonia plus organic nitrogen, total .10 mg/L
Nitrite plus nitrate (dissolved) .1, .05 mg/L
Orthophosphate (dissolved) .01 mg/L
Phosphorus, total .01 mg/L
40 Characteristics of Water, Sediment, and Benthic Communities of the Wolf River, Menominee Indian Reservation, Wisconsin, Water Years 1986-98

Appendix 3. Constituents and minimum reporting levels for the U.S. Geological Survey National Water-Quality Laboratory for trace elements in water samples during 1986-98[mg/L, milligrams per liter; ng/L, micrograms per liter; ng/L, nanograms per liter]
Constituent
Aluminum, total
Aluminum, dissolved
Antimony, total
Arsenic, total
Arsenic, dissolved
Barium, total
Barium, dissolved
Beryllium, total
Boron, total
Boron (dissolved)
Cadmium, total
Cadmium, dissolved
Chromium, total
Chromium, dissolved
Cobalt, total
Cobalt, dissolved
Copper, total
Copper, dissolved
Cyanide, total
Cyanide, dissolved
Lead, total
Lead, dissolved
Lithium, total
Lithium, dissolved
Mercury, total
Mercury, total by USGS Wisconsin District Laboratory
Nickel, total
Nickel, dissolved
Selenium, total
Selenium, dissolved
Silver, total
Silver, dissolved
Thallium, total
Thallium (dissolved)
Uranium, dissolved
Zinc, total
Zinc, dissolved
Minimum reporting level
10 ng/L10, 5 ng/L
i.o ng/Llu-g/L
i.o ng/L100 ng/L2.0 ng/L
2 ng/L10 ng/L
16 and 4 ng/L
1.0 ng/L
1.0 and 0.1 ng/L
1.0 ng/L
.5 ng/Li.o ng/L
.5 ng/Li.o ng/L1.0 and 0.5 ng/L
.010 mg/L
.010 mg/L
5. ng/L
1.0 and 0.5 ng/L
10 ng/L
4 ng/L.1 ng/L.lng/L
50 and 1.0 ng/L
1.0 ng/L
i.o ng/Li.o ng/Li.o ng/L1.0 and 0.2 ng/L
i.o ng/L.5 ng/L
i.o ng/L10 ng/L
1.0 and 0.5 ng/L
Appendix 3 41

Appendix 4. Constituents and minimum reporting levels for the U.S. Geological Survey National Water-Quality Laboratory for pesticides analyzed from 1995-96 [ug/L, micrograms per liter]
NWQL Schedule 2001 Compound name Minimum reporting level
AcetochlorAlachlorAtrazineAtrazine, deethyl-Azinphos, methyl-BenfluralinButylateCarbaryl (Sevin)CarbofuranChlorpyriphosCyanazineDCPA (Dacthal)DDEDiazinonDieldrinEPTC (Eptam)EthalfluralinEthoprophosFonofosHCH, alpha-LindaneLinuronMalathionMetolachlorMetribuzinMolinateNapropamideParathion, ethyl-Parathion, methyl-PebulatePendimethalinPermethrin, cisPhoratePronamidePrometonPropachlorPropanilPropargite I and IISimazineThiobencarbTebuthiuronTerbufosTriallateTrifluralinTerbacil
0.002 [ig/L.002 ug/L.001 [ig/L.002 [ig/L.001 [ig/L.002 (ig/L.002 [ig/L.003 ug/L.003 [ig/L.004 [ig/L.004 [ig/L.002 [ig/L.006 [ig/L.002 [ig/L.001 [ig/L.002 [ig/L.004 ug/L.003 [ig/L.003 ug/L.002 [ig/L.004 (ig/L.002 (ig/L.005 [ig/L.002 [ig/L.004 [ig/L.004 [ig/L.003 [ig/L.004 [ig/L.006 (ig/L.004 [ig/L.004 [ig/L.005 ug/L.002 ug/L.003 ug/L.018 ug/L.007 ug/L.004 ug/L.013 ug/L.005 ug/L.002 ug/L.010 ug/L.013 ug/L.001 ug/L.002 ug/L.007 ug/L
42 Characteristics of Water, Sediment, and Benthic Communities of the Wolf River, Menominee Indian Reservation, Wisconsin, Water Years 1986-98

Appendix 5. Constituents and minimum reporting levels for the U.S. Geological Survey National Water-Quality Laboratory for pesticides analyzed in water samples during 1997 and 1998 [|ag/L, micrograms per liter]
NWQL Schedule 1379
Constituent Minimum reporting level
Acetochlor
Alachlor
Ametryn
Atrazine
Atrazine, deethyl
Atrazine, deisopropyl
Bromacil
Butachlor
Butylate
Carboxin
Cyanazine
Cycloate
Diphenamid
Hexazinone
Metolachlor
Metribuzin
Prometon
Prometryn
Propachlor
Propazine
Simazine
Simetryn
Terbacil
Tnfluralin
Vernolate
0.050 pig/L
.050 pig/L
.050 ng/L
.050 ng/L
.050 pig/L
.050 |ig/L
.05 |ag/L
.05 ng/L
.05 pig/L
.05 ng/L
.200 pig/L
.05 u-g/L
.05 ng/L
.05 ng/L
.050 |ig/L
.050 pig/L
.050 ng/L
.050 pig/L
.05 |ig/L
.050 pig/L
.050 ng/L
.05 |ag/L
.05 |ig/L
.05 pig/L
.05 pig/L
Appendix 5 43

App
endi
x 6.
Con
cent
ratio
ns o
f tra
ce e
lem
ents
in f
ine
stre
ambe
d se
dim
ent
(less
than
0.0
62 m
m)
from
site
s on
the
Wol
f R
iver
in t
he v
icin
ity o
f the
M
enom
inee
Ind
ian
Res
erva
tion
-i 5 eristics
of
We
ears 1986-98
§ w a 3 3 0) a 00 1 o' O o 3 3 c 3 <0 W fl> o_ 33 1 3 fl> 0 3 3' 5" a 3 33 fl> CO JD 1 o' 3 "^ in o o 3 in
Ele
men
t con
cent
rati
on (
mic
rogr
ams
per
gram
dry
wei
ght)
Dat
eArsenic
E |
fe £
m
&
C
3
I ! 0
E I
*
=
o 1
o
I
o
& 1
E o-
'%
1
O
3
CD
LU
E TJ
.5
LanthanumT
J n 3Lithium
o E
>.
in 3
w
0)
C
3
C
0)
U
(0
TJ
|
?
£
S
1
1
Wol
f R
iver
at
Hig
hway
M n
ear
Lan
glad
e, W
is.,
stat
ion
4075
050
10/2
6/95
9/23
/96
9/11
/97
9/23
/98
6.5
12 9.5
10
380
<1
380
<1
310
<1
300
.75
<10
0.7
<10
.7
<10
.7
<1
.57
39
7 49
51
8 57
44
6 56
31
5.2
42
13
<2
7
19
<2
10
15
<2
<4
13
<1
5.7
<8
<4
<8
<4
<8
<4
<1
<1
18 30 25 18
22 20 19 17
10 10 12 10
0.1
2,10
0 <2
.09
2,90
0 <2
.11
2,30
0 <2
.1 1,
600
.52
Wol
f R
iver
at
Kes
hena
, Wis
., st
atio
n 40
7710
0
9/25
/96
9/11
/97
9/23
/98
11 11 17
350
<1
350
<1
340
.81
<10
.7
<10
.7
<1
.56
55
8 55
58
7 59
47
5.5
45
13
<2
9
18
<2
<4
14
<1
5.8
<8
<4
<8
<4
<1
<1
32 31 27
26 23 23
10 13 11
.08
2,80
0 <2
.09
3,40
0 <2
.1
3,50
0 .5
Ele
men
t con
cent
rati
on (
mic
rogr
ams
per
gram
dry
wei
ght)
Dat
eE 3
1 TJ O 0)
1
11
^
z
z
E E
f
=«
Io
0)w
w
I $
|=
(7
) f <n
| E
E
.3
.5c
« °
»-
t-
»-
E c
-^
I *~
E 'E n 3
E TJ n c >
E »=
0
8 .E
0)
N
>
Wol
f R
iver
at
Hig
hway
M n
ear
Lan
glad
e, W
is.,
stat
ion
4075
050
10/2
6/95
9/23
/96
9/11
/97
9/23
/98
16 25 22 16
12
8
11
8
10
5
9.4
4.2
6 1.
9
7 1.
8
5 1.
7
4.9
1.7
0.3
0.2
87
.4
.2
83
.31
.2
74
.18
.71
63
<40
<5.8
<40
10
<40
11
<1
<1
3.6
<5
0.18
<5
.2
<5
.18
1.4
.13
4.06
4.48
4.71
2.8
52 60 57 42
16 22 19 14
2 99
2 87
2 86
1.3
77
Wol
f R
iver
at
Kes
hena
, W
is.,
stat
ion
4077
100
9/25
/96
9/11
/97
9/23
/98
24 27 22
12
8
11
<4
9.6
4.9
6 1.
6
6 1.
8
4.8
1.8
.4
.2
81
.28
.2
79
.16
.44
70
<40
9.4
<40
11
<1
<1
4.9
<5
.2
<5
.19
1.8
.14
3.55
3.11
2.4
54 57 43
22 22 18
2 83
2 89
1.7
82

TJ
TJ
ft a
x' -J
Ap
pen
dix
7.
Con
cent
ratio
ns o
f m
ajor
ions
and
car
bon
in f
ine
stre
ambe
d se
dim
ent
(less
tha
n 0.
062
mm
) fr
om s
ites
on t
he W
olf
Riv
er in
the
vic
inity
of
the
Men
omin
ee I
ndia
n R
eser
vatio
n
Ele
men
t co
nce
ntr
atio
n (
per
cen
t)
Dat
eA
lum
inum
Cal
cium
Iron
Mag
nesi
umP
ho
sph
oru
sP
otas
sium
Wol
f R
iver
at
Hig
hw
ay M
nea
r La
ngla
de,
Wis
.,
10/2
6/95
9/23
/96
9/11
/97
9/23
/98
3 3 2.6
2.6
1.5
1.9
1.6
1.6
2.6
3.2
2.7
2.3
0.53 .7
4
.57
.58
0.17 .1
9
_2 .17
Wol
f R
iver
at
Kes
hena
,
9/25
/96
9/11
/97
9/23
/98
2.8
2.7
2.3
1.9
1.8
1.9
3 2.9
2.7
.73
.71
.66
.19
.23
.22
0.95 .9
3
.88
.85
So
diu
mS
ulf
ur
Car
bo
n,
org
anic
Car
bo
n,
ino
rgan
ic
Car
bon,
o
rgan
ic a
nd
ino
rgan
ic
stat
ion
407
5050
0.53 .5
9
.48
.43
0.38 .2
8
.31
.34
13.7
13 14.3
12.8
0.1 .2
6
.18
.17
13.8
13.3
14.5
13
Wis
., st
atio
n 40
771
00
.79
.98
.8
.56
.51
.37
.29
.32
.37
11.6
13.2
13.5
.26
.28
.31
11.9
13.5
13.8

Ap
pen
dix
8. C
once
ntra
tions
of
elem
ents
in
biot
a fr
om s
ites
on t
he W
olf
Riv
er in
the
vic
inity
of t
he M
enom
inee
Ind
ian
Res
erva
tion
0) 3 a 00
ft 3
Dat
eB
iota
type
Wat
er
(per
cent
)E
lem
ent c
once
ntra
tion
(m
icro
gram
s pe
r gr
am d
ry w
eigh
t)A
lum
inum
Ant
imon
yW
olf
Riv
er a
t H
ighw
ay M
10/2
5/95
9/23
/96
9/11
/97
9/23
/98
10/2
5/95
9/23
/96
9/11
/97
9/22
/98
Whi
te s
ucke
rW
hite
suc
ker
Whi
te s
ucke
rW
hite
suc
ker
Cad
disf
ly la
rvae
Cad
disf
ly la
rvae
Cad
disf
ly la
rvae
Cad
disf
ly la
rvae
76.4
81.3
83.4
80.4
82.3
84.1
78.9
84.0
<1.0
<1.0 1.10
2.58
257
367
236
249
<0.2
0<.
20<.
48<.
26<.
30<.
20<.
22<.
33
Ars
enic
near
Lan
glad
e, W
is.,
0.40 .3
0<.
48 .35
1.7
1.5
1.34
2.03
Bar
ium
stat
ion
4075
050
0.10
<.10 .2
064.
7724
.050
.617
.447
.1
Ber
ylliu
m
<0.2
0<.
20<.
48<.
26<.
30<.
20<.
22<.
33
Bor
on
1.6 .3
01.
0 .58
3.0
2.2
3.2
4.6
Cad
miu
m
<0.2
0<.
20<.
48<.
26<.
30<.
20.
<.22
<.33
Wol
f R
iver
at
Kes
hena
, Wis
., st
atio
n 40
7710
09/
24/9
69/
10/9
79/
23/9
89/
24/9
69/
11/9
79/
22/9
8
Whi
te s
ucke
rW
hite
suc
ker
Whi
te s
ucke
rC
addi
sfly
larv
aeC
addi
sfly
larv
aeC
addi
sfly
larv
ae
81.9
81.8
80.7
84.4
85.6
84.5
10.6
<.19
<1.0
161
320
283
<.40
<.38
<.27
<.30
<.78
<.32
.4<.
38 .48
1.2
1.51
1.65
.60
.11
3.72
44.3
67.8
65.3
<.40
<.38
<.27
<.30
<.78
<.32
.80
.53
.57
1.9
3.9
3.4
<.40
<.38
<.27
<.30
<.78
<.32
Dat
eB
iota
type
Wat
er
(per
cent
)E
lem
ent c
once
ntra
tion
(m
icro
gram
s pe
r gr
am d
ry w
eigh
t)C
hrom
ium
Cob
alt
Cop
per
Wol
f R
iver
at
Hig
hway
M n
ear
Lan
glad
e, W
is.,
10/2
5/95
9/23
/96
9/11
/97
9/23
/98
10/2
5/95
9/23
/96
9/11
/97
9/22
/98
9/24
/96
9/10
/97
9/23
/98
9/24
/96
9/11
/97
9/22
/98
Whi
te s
ucke
rW
hite
suc
ker
Whi
te s
ucke
rW
hite
suc
ker
Cad
disf
ly la
rvae
Cad
disf
ly la
rvae
Cad
disf
ly la
rvae
Cad
disf
ly l
arva
e
Whi
te s
ucke
rW
hite
suc
ker
Whi
te s
ucke
rC
addi
sfly
lar
vae
Cad
disf
ly la
rvae
Cad
disf
ly l
arva
e
76.4
81.3
83.4
80.4
82.3
84.1
78.9
84.0
81.9
81.8
80.7
84.4
85.6
84.5
0.70 .8
0.6
7.5
91.
82.
4
1.9
2.4
Wol
f R
iver
at
1.0 .67
.61
1.9
2.5
2.3
<0.2
0<.
20<.
48
<.26 .4
0.5
0.3
1.4
7
25.7
28.3 4.11
16.7 9.90
10.5
10.5
13.4
Iron
Lea
dM
anga
nese
Mer
cury
, sta
tion
4075
050
224
460
716
518
1,07
01,
400
1,03
01,
100
<0.2
0<.
20<.
48<.
26 .80
.90
.48
.98
6.70
6.60
4.46
7.97
634
707
1,22
01,
890
<0.1
0<.
08<.
01 .06
<.10
<.04 .0
2.0
7K
eshe
na,
Wis
., st
atio
n 40
7710
0<.
40<.
38<.
27 .30
<.78 .3
9
16.8
59.3
58.0 9.80
13.0
11.5
670
715
887
866
1,29
01,
060
<.40
<.38
<.27 .7
0.8
8.9
4
31.4
18.2 9.08
823
939
1240
<.07 .0
1.4
0<.
04<.
01 .04

T3 o ft
0. x' 00
Ap
pen
dix
8.
Con
cent
ratio
ns o
f el
emen
ts in
bio
ta fr
om s
ites
on t
he W
olf
Riv
er in
the
vic
inity
of t
he M
enom
inee
Ind
ian
Re
serv
atio
n C
on
tinu
ed
Dat
eB
iota
type
Wat
er
(per
cent
)E
lem
ent c
once
ntra
tion
(m
icro
gram
per
gra
m d
ry w
eigh
t)
Mol
ybde
num
Nic
kel
Sel
eniu
m
Sil
ver
Str
onti
umU
rani
umV
anad
ium
Zin
c
Wol
f R
iver
at
Hig
hway
M n
ear
Lan
glad
e, W
is.,
stat
ion
4075
050
10/2
5/95
9/23
/96
9/11
/97
9/23
/98
10/2
5/95
9/23
/96
9/11
/97
9/22
/98
9/24
/96
9/10
/97
9/23
/98
9/24
/96
9/11
/97
9/22
/98
Whi
te s
ucke
r
Whi
te s
ucke
r
Whi
te s
ucke
r
Whi
te s
ucke
r
Cad
disf
ly l
arva
e
Cad
disf
ly l
arva
e
Cad
disf
ly l
arva
e
Cad
disf
ly l
arva
e
Whi
te s
ucke
r
Whi
te s
ucke
r
Whi
te s
ucke
r
Cad
disf
ly l
arva
e
Cad
disf
ly l
arva
e
Cad
disf
ly l
arva
e
76.4
81.3
83.4
80.4
82.3
84.1
78.9
84.0
81.9
81.8
80.7
84.4
85.6
84.5
0.70 .7
0
<.48 .5
0
1.6
1.2
1.6
1.8
Wol
f R
iver
at
.50
.90
.96
1.5
1.9
1.5
<0.2
0
<.20
<.48
<.2
6
.60
.60
.33
.54
Kes
hena
, W
is.,
<.40
<.38
<.27 .4
0
<.78 .5
2
3.5
3.7
2.5
3.4 .9
0
.30
.67
1.2
stat
ion
4077
100
4.0
3.7
5.2 .8
0
<.78
1.0
0.30 .4
0
<.48
<.2
6
<.3
0
<.2
0
<.22
<.33
<.4
0
.50
.44
<.3
0
<.78
<.32
<0.1
0
<.10 .1
55
8.14 .9
0
1.3
1.35
1.59 .40
.123
9.06
1.10
1.41
1.36
<0.2
0
<.20
<.48
<.2
6
<.3
0
<.20 .3
1
<.33
<.40
<.38
<.27
<.3
0
<.78
<.32
<0.
20 .20
<.48 .4
1
2.1
2.5
1.5
2.4 .5
0
<.38 .6
4
1.4
2.0
2.4
71.7
88.9
58.4
86.1
88.3
99.8
108
136 74.3
113
145
111
142
123

X XXX X XX
X X X X X X X X X
X X X X X X
xxxxxxx xx
X X
S £?"3 -S ^^ ^ s > '2 ISC rS S s «Kj ^3
«J _s s ~ -S
t2 ^J p,
roge
C303
3 a5 u
1103
CQ
d, o
Ci^w
48 Characteristics of Water, Sediment, and Benthic Communities of the Wolf River, Menominee Indian Reservation, Wisconsin, Water Years 1986-98

App
endi
x 9.
Inv
erte
brat
e ta
xa o
f the
Wol
f R
iver
at
Kes
hena
and
nea
r La
ngla
de,
Wis
., du
ring
19
98
Co
ntin
ue
d
o (D
Q.
Phyl
um
Cla
ss
Ord
er
Fam
ily
Gen
us
Art
hrop
oda
Inse
cta
(Ins
ects
) O
dona
ta (
Dra
gonf
lies
and
Dam
self
lies)
Gom
phid
ae
** Oph
iogo
mph
us
Tri
chop
tera
(C
addi
sflie
s)
Bra
chyc
entr
idae
B
rach
ycen
trus
Mic
rase
ma
Mic
rase
ma
Glo
ssos
omat
idae
P
roto
ptila
Hel
icop
sych
idae
H
elic
opsy
che
Hyd
rops
ychi
dae
**
Hyd
rops
ychi
dae
Che
umat
opsy
che
Hyd
rops
yche
Hyd
rops
yche
Hyd
rops
yche
Hyd
rops
yche
Mac
rost
emum
Cer
atop
sych
e
Cer
atop
sych
e
Cer
atop
sych
e
Cer
atop
sych
e
Cer
atop
sych
e
Hyd
ropt
ilida
e H
ydro
ptil
a
Leu
cotr
ichi
a
Lep
idos
tom
atid
ae
Lep
isto
stom
a
Lep
toce
rida
e ** C
erac
lea
Oec
etis
Philo
pota
mid
ae
Chi
mar
ra
Chi
mar
ra
Spe
cies
** sp.
num
eros
us
sp.
rust
icum
sp.
bore
alis
** sp.
sp.
phal
erat
a
scal
aris
vala
nis
zebr
atum
sp.
alte
rnan
s
mor
osa
bifi
da
mor
osa
mor
osa
spar
na
sp.
pict
ipes
sp.
** sp.
sp.
sp.
ater
rim
a
Kes
hena
X X X X X X X X X X X X X X X X X X X X
Lan
glad
e
X X X X X X X X X X X X X X X X X X X X

App
endi
x 9.
Inv
erte
brat
e ta
xa o
f the
Wol
f R
iver
at
Kes
hena
and
nea
r La
ngla
de,
Wis
., du
ring
19
98
Co
ntin
ue
d
<: o
Ph
ylum
C
lass
tu
3-
5 3
Art
hrop
oda
Inse
cta
(Ins
ects
)<
gB)
U
.3
£-
1 O
(£
> VI
00 2> 5 oo o
f to to a. B (D 3 fi> a 00 (D I o' O
0 3 3 c 3 <0 2, (D 0 3 (D (0 0 5' (D
fl> 5"
a 5' 3
30 VI flj 5' g vT' o o 3 VI -5'
Ord
er
Tri
chop
tera
(Cad
disf
lies)
Col
eopt
era
(Bee
tles)
Dip
tera
(Tr
ue F
lies)
Fam
ily
Philo
pota
mid
ae
Psyc
hom
yiid
ae
Elm
idae
Psep
heni
dae
Ath
eric
idae
Em
pidi
dae
Sim
uliid
ae
Tip
ulid
ae
Chi
rono
mid
ae
Tan
ypod
inae
Ort
hocl
adiin
ae
Gen
us
Chi
mar
ra
Psy
chom
yia
Opt
iose
rvus
Opt
iose
rvus
Sten
elm
is
Sten
elm
is
Pse
phen
us
Ath
erix
** Hem
erod
rom
ia
Sim
uliu
m
Sim
uliu
m
Ant
ocha
Dic
rano
ta
Pse
udol
imno
phil
a
** ** Con
chap
elop
ia
** pupa
e
Car
dioc
ladi
us
Car
dioc
ladi
us
Cri
coto
pus
Cri
coto
pus
Cri
coto
pus
Euk
ieff
erie
lla
Nan
ocla
dius
Nan
ocla
dius
Spe
cies
sod
a
flav
ida
sp.
triv
ittat
us
sp.
mer
a
herr
icki
vari
egat
a
** sp.
sp.
fibr
infl
atum
sp.
sp.
sp.
** ** sp.
** sp.
pupa
e
sp.
bidn
ctus
gro
up
trifa
scia
gro
up
sp.
sp.
cf.
alte
rnan
ther
ae
Kes
hena
X X X X X X X X X X X X X X X X X X X X X X X X
Lan
glad
e
X X X X X X X X X X X X X X X X

App
endi
x 9.
Inv
erte
brat
e ta
xa o
f the
Wol
f R
iver
at
Kes
hena
and
nea
r La
ngla
de,
Wis
., du
ring
19
98
Co
ntin
ue
d
Phyl
um
Art
hrop
oda
Nem
atod
a
Plat
yhel
min
thes
Mol
lusc
a
Ann
elid
a
Cla
ss
Ord
er
Inse
cta
(Ins
ects
) D
ipte
ra (
Tru
e Fl
ies)
Ara
chno
idea
A
cari
(W
ater
mite
s)
(Rou
ndw
orm
s)
Tur
bella
ria
(Fla
twor
ms)
Gas
trop
oda
Lim
noph
ila (
Lim
pets
)
Pele
cypo
da
Ven
eroi
da
Olig
ocha
eta
Hap
lota
xida
(A
quat
ic e
arth
wor
ms)
Hir
udin
ea (
Lee
ches
) P
hary
ngob
dell
ida
Fam
ily
Chi
rono
mid
ae
Ort
hocl
adiin
ae
Tan
ytar
sini
Chi
rono
min
i
Chi
rono
min
ae
Anc
ylid
ae
Spha
eriid
ae
(Fin
gern
ail c
lam
s)
Nai
dida
e
Erp
obde
llida
e
Gen
us
Ort
hocl
adiu
s
Syno
rtho
clad
ius
Thi
enem
anni
ella
Tve
teni
a
** Par
atan
y tar
sus
Rhe
otan
y tar
sus
Stem
pell
ina
Pol
yped
ilum
** ** ** Lae
vape
x
Spha
eriu
m
** **
Spe
cies
sp.
sp.
sp.
sp.
B
** sp.
A
sp.
mon
tiva
ga g
roup
nr.
conv
ictu
m
** ** ** sp.
sp.
** **
Kes
hena
X X X X X X X X X X X X
Lan
glad
e
X X X X X X X X X X X
TJ o

a>T
O)_cD o
CO
>co"
0
(/)Q}\^
03 occoQ)
coO)c co
CO 0)c
if
1Q)*-"o coXCC
"cO
O)<
6T
X
c0)Q.Q.^
racV
MV
0) oreO)cre
o£3
*
2>
M'oV Q.
3
0
Phylum family
So^A
ophyta (GREEN /
£,ex2o2U
X
ex1/3
acoS o
1°
03
hlamydomonadace
o
X
c
1oK
|3toO
£^->
S3
Gasman
>o
esmidiaceae
Q
X
X
£*o3
Pi
I
6
c/3
"̂3' '- »
35
S
^
ocystaceae
O
XXX
X
-do6
s -X XI 1 I
oph
u
X X X X X X
O
xxxxxxxxxxx
xxxxxxxx X X X X X X X
o
- O
CQ
W)
Jd
O
o
03
Io
rt"ex
C wI 2 * e
"s
13
a ^a
3 ^i
S 3
weolata
<3
g
«j
3
nutissim
£
a a
S5
53 C
1
icentula
&
S a
,«cC3
J O
p SicC3c o
Sic c
^ ~c c s; cCj Cj
-«
ac
Si
a
SicC3 C
aoccone
a -ac c o oCj ^J
S
S
a Q
2 -2
C3
.a
1
a,a
1
«
-2Soa
k, k, k, k,
52 Characteristics of Water, Sediment, and Benthic Communities of the Wolf River, Menominee Indian Reservation, Wisconsin, Water Years 1986-98

App
endi
x 10
. A
lgal
tax
a of
the
Wol
f R
iver
nea
r La
ngla
de a
nd a
t K
eshe
na,
Wis
., du
ring
19
98
Co
ntin
ue
d
TJ
TJ (D Q. x'
Phyl
um f
amily
Chr
ysop
hyco
phyt
a (D
IAT
OM
S)
Dia
tom
acea
e
Mel
osir
acea
e
Nav
icul
acea
e
Gen
us
Fra
g il a
ria
Fra
gila
ria
Fra
g il a
ria
Ope
phor
a
Ope
phor
a
Syne
dra
Syne
dra
Syne
dra
Syne
dra
Mel
osir
a
Am
phor
a
Am
phor
a
Cym
bella
Cym
bella
Cym
bella
Cym
bella
Cym
bella
Cym
bella
Cym
bella
Gom
phon
ema
Gom
phon
ema
Gom
phon
ema
Gom
phon
ema
Nav
icul
a
Nav
icul
a
Nav
icul
a
Nav
icul
a
Spe
cies
pinn
ata
lept
osta
uron
vauc
heri
ae
olse
nii
mar
tyi
rum
pens
para
siti
ca
ulna
ulna
vari
ans
perp
usil
la
oval
is
affin
is
min
uta
pros
trat
a
prox
ima
reic
hard
tii
tum
ida
turg
idul
a
apun
cto
intr
icat
um
parv
ulum
spae
roph
orum
cryp
toce
phal
a
cryp
toce
phal
a
decu
ssis
gast
rum
Var
iety
A
utho
rity
Ehr.
(Ehr
.) H
ust.
(Kut
z.)
Pete
rs.
M M
olle
r
Her
ib.
Kut
z.
subc
onst
rict
a (G
run.
) H
ust.
ram
esi
(Her
ib.)
Hus
t.
(Nitz
.) E
hr.
Ag.
(Gru
n.)
Gru
n.
pedi
culu
s (K
utz.
) V.
H. e
x D
eT.
Kut
z.
Hils
e ex
Rab
h.
auer
swal
dii
(Rab
h.)
Rei
m.
Rei
m.
Kra
m.
(Bre
b. e
x K
utz.
) V.
H.
Gru
n.
Wal
lace
pum
ila
Gru
n. i
n V
.H.
(Kut
z.)
Kut
z.
Ehr.
Kut
z.
vene
ta
(Kut
z.)
Rab
h.
0str
.
(Ehr
.) K
utz.
Lan
glad
e
X X X X X X X X X X X X X X X X X
Kes
hena
X X X X X X X X X X X X X X X X X X X

Ap
pen
dix
10.
Alg
al t
axa
of th
e W
olf
Riv
er n
ear
Lang
lade
and
at
Kes
hena
, W
is.,
durin
g 1
99
8 C
on
tinu
ed
o 31 0) 5 o 55'
o'
w O^ £ f? to (D Q. 3' (D 3 0) 3
Q.
00 (D 3 5 o'
O o 3 3 c 3_ Jo' 5 (D o_ 5 (D s (D 3
O 3 5' (D (D Q.
5'
3 33 (D
(D 1 o' -^ </>'
O O 3
Phyl
um f
amily
Chr
ysop
hyco
phyt
a (D
IAT
OM
S)
Nav
icul
acea
e
Nitz
schi
acea
Tha
lass
iosi
race
ae
Cya
noch
loro
nta
(BL
UE
-GR
EE
N A
LG
AE
)
Chr
ooco
ccac
eae
Nos
toca
ceae
Osc
illat
oria
ceae
Rho
doph
ycop
hyta
(R
ED
AL
GA
E)
Cha
ntra
nsia
cea
Gen
us
Nav
icul
a
Nav
icul
a
Nav
icul
a
Nav
icul
a
Nav
icul
a
Nav
icul
a
Nav
icul
a
Nav
icul
a
Rei
mer
ia
Nitz
schi
a
Nitz
schi
a
Nitz
schi
a
Nitz
schi
a
Nitz
schi
a
Nitz
schi
a
Cyc
lote
lla
Mer
ism
oped
ia
Cal
othr
ix
Hyd
roco
leum
Lyng
bya
Osc
illat
oria
Osc
illat
oria
Osc
illat
oria
Aud
ouin
ella
Spe
cies
V
arie
ty
lanc
eola
ta
men
iscu
lus
min
ima
pupu
la
radi
osa
tene
lla
sali
naru
m
inte
rmed
ia
scut
ello
ides
trip
unct
ata
sinu
ata
amph
ibia
font
icol
a
frus
tulu
m
inco
nspi
cua
line
aris
sigm
oide
a
men
eghi
nian
a
glau
ca
pari
enti
na
breb
isso
nii
sp.
1 A
NS
FWA
sp.
sp.
1 A
NS
FWA
lute
a
viol
acea
Aut
hori
ty
(Ag.
) K
iitz.
Schu
mn.
Gru
n.
Kut
z.
(Bre
b. e
x K
utz.
)G
run.
(Gru
n.)
Cl.
W.
Sm.
ex G
reg.
(O.
F. M
ull.)
Bor
y
(Gre
g.)
Koc
iole
k &
Stoe
rmer
Gru
n.
Gru
n.
(Kut
z.)
Gru
n.
Gru
n.
(Ag.
ex
W.
Sm.)
W.
Sm.
(Nitz
.) W
. Sm
.
Kiit
z.
(Ehr
.) N
aeg.
(Nae
g.)
Thu
ret
Kut
z.
X X Ag.
Kut
z.
Lan
glad
e
X X X X X X X X X X X X X X X
Kes
hena
X X X X X X X X X X X X X X X