chapter-xi - shodhgangashodhganga.inflibnet.ac.in/bitstream/10603/71434/20/20_chapter 11.pdf ·...
TRANSCRIPT
CHAPTER-XI
DEVELOPMENT AND VALIDATION
OF BIOANALYTICAL METHOD
FOR THE DETERMINATION OF
DEFERASIROX IN HUMAN PLASMA
BY LC-MS/MS
Chapter-XI Deferasirox
Page 233
11.1 DRUG PROFILE
Deferasirox is an oral iron chelator widely approved for the treatment of transfusional
chronic iron overload. In patients with transfusion-dependent anemias, toxic and
potentially lethal levels of iron accumulate over time. Humans are unable to actively
eliminate iron from the body, once it has been acquired. Toxic and eventually lethal
levels of iron accumulate as a result of repeated transfusions or because of excessive
dietary iron uptake in anemias and hereditary hemochromatosis. The harmful effects
of chronic iron overload can lead to damage of the liver, heart, and endocrine glands,
resulting in organ compromise and death (Felix Waldmeier et al.). Its main use is to
reduce chronic iron overload in patients who are receiving long term blood
transfusions for conditions such as beta-thalassemia and other chronic anemias
(Choudhry VP et al. and Yang LP et al.). It is the first oral medication approved
for this purpose.
Deferasirox works in treating iron toxicity by binding trivalent (ferric) iron and
forming a stable complex which is eliminated via the kidneys. Two molecules of
deferasirox are capable of binding to 1 atom of iron. Its low molecular weight and
high lipophilicity allows the drug to be taken orally unlike desferoxamine which has
to be administered by intravenous infusion. Deferasirox is highly (~99%) protein
bound almost exclusively to serum albumin. CYP450-catalyzed (oxidative)
metabolism of deferasirox appears to be minor in humans (about 8%).
Glucuronidation is the main metabolic pathway for deferasirox, with subsequent
biliary excretion. Deferasirox and metabolites are primarily (84% of the dose)
excreted in the feces. Renal excretion of deferasirox and metabolites is minimal (8%
of the administered dose). The mean elimination half-life ranged from 8 to 16 hours
following oral administration.
Drug Properties:
Name : Deferasirox
IUPAC name : 4-[3,5-Bis (2-hydroxyphenyl)-1H-1,2,4-triazol-1yl]-
benzoic acid
Chemical formula : C21H15N3O4
Chapter-XI Deferasirox
Page 234
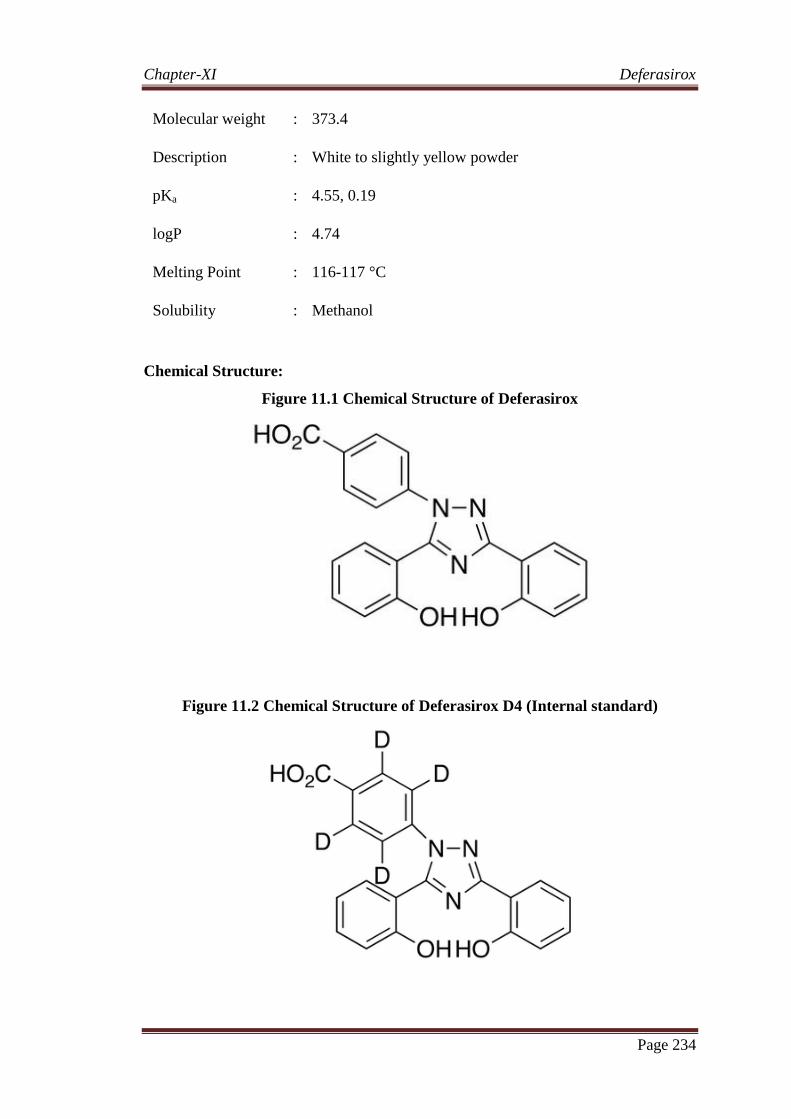
Molecular weight : 373.4
Description : White to slightly yellow powder
pKa : 4.55, 0.19
logP : 4.74
Melting Point : 116-117 °C
Solubility : Methanol
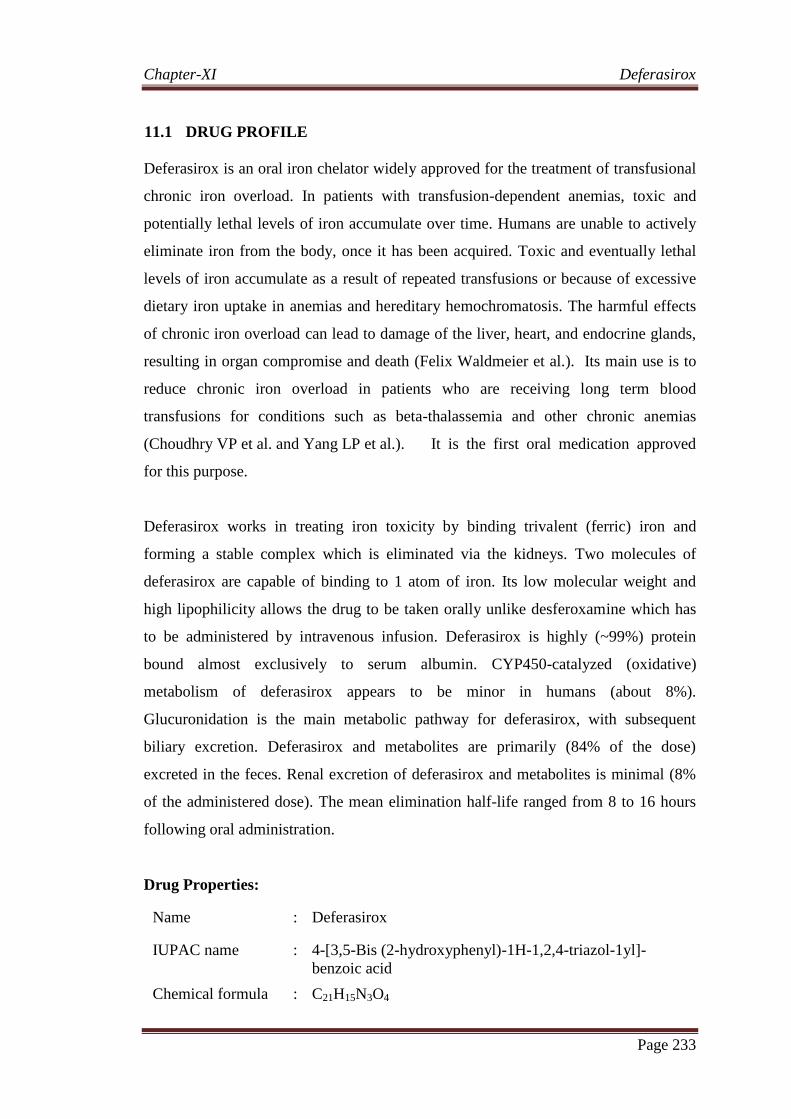
Chemical Structure:
Figure 11.1 Chemical Structure of Deferasirox
Figure 11.2 Chemical Structure of Deferasirox D4 (Internal standard)
Chapter-XI Deferasirox
Page 235
11.2 LITERATURE REVIEW AND AIM OF THE WORK
11.2.1 LITERATURE REVIEW
At the time of initiation of method development, literature survey was performed to
study the reported methods. Few methods are reported using different analytical
techniques. Methods for the determination of deferasirox and its impurities in
pharmaceutical formulations were reported by using HPLC (Kalyana Chakravarthy V
et al., Mubeen Ahmad Khan et al., Padmaja N et al., Sambasivarao Vattikuti et al. and
Sampath Saravanan et al.,).
Bioanalytical methods for the determination of Deferasirox from plasma were
reported by using HPLC (Felix Waldmeier et al. and Silvia De Francia et al.) and
liquid chromatography coupled to mass spectroscopy (Chauzit E et al. and Felix
Waldmeier et al.) and hydrophilic interaction liquid chromatography coupled to mass
spectroscopy (Pligoropoulou H et al.). Deferasirox determination using dried blood
spot analysis using liquid chromatography mass spectroscopy (Ramakrishna Nirogi et
al.) was also reported.
11.2.2 AIM OF THE WORK
As very few bioanalytical methods with LC-MS/MS detection are reported for the
determination of deferasirox in human plasma and even the reported methods
established the higher lower limit of quantifications of 0.5 µg/ml. (Chauzit E et al.,)
There was need to for a simple bioanalytical method with the lower limit of
quantification of about 0.2µg/ml considering the dosage required for the
bioequivalence and pharmacokinetic evaluations. The aim of the work was to develop
and validate an LC-MS/MS method for the determination of deferasirox in human
plasma using labeled internal standard. The method was validated for the linearity
range required for the bioequivalence and pharmacokinetic studies.
11.3 MATERIAL AND METHODS
11.3.1 INSTRUMENTATION
LC-MS/MS system configuration included Shimadzu HPLC coupled with sciex API
3000 mass spectrometer. Discovery C18 (50x4.6mm, 5µm) column was used. The
Chapter-XI Deferasirox
Page 236
instrument was equipped with pump, column oven, degasser and mass spectrometer
with turbo ion spray interface. Auto injector was used for sample injection and data
acquisition was done by using Analyst software version 1.4.2. An Afcoset electronic
balance was used for weighing the materials. Class ‘A’ Borosil glass ware was
employed for volumetric and general purpose in the method development and
validation. All the above instruments including the supporting instruments like deep
freezer, micro pipettes, centrifuge, evaporator, vortexer were appropriately calibrated
for routine usage.
11.3.2 CHEMICALS AND REAGENTS
Following are the list of chemicals and reagents used in the method.
Deferasirox
Deferasirox D4 (Internal standard)
Methanol (HPLC grade)
Ammonium formate
Formic acid
Ethyl acetate (GR grade)
Ammonia (GR grade)
Milli Q water
K2 EDTA plasma
11.3.3 PREPARATION OF SOLUTIONS
Ammonium formate buffer-1 was prepared by dissolving approximately 158 mg of
ammonium formate in 500 ml of milliQ water and the pH of the solution was adjusted
to 5.0 using formic acid. Ammonium formate buffer-2 was prepared by dissolving
approximately 315 mg of ammonium formate in 250 ml of milliQ water and the pH of
the solution was adjusted to 2.5 using formic acid. Ammoniated methanol solution
was prepared by mixing 10 ml of ammonia and 490 ml of methanol. Mobile phase
was prepared by mixing Ammonium formate buffer-1 and methanol in the ratio of
20:80. Autosampler washing solution was prepared by mixing 700 ml of methanol
and 300 ml of milliQ water.
Chapter-XI Deferasirox
Page 237
11.3.4 PREPARATION OF STOCK SOLUTIONS AND SPIKING SOLUTIONS
OF DRUG AND INTERNAL STANDARD
Deferasirox and deferasirox D4 stock solutions were prepared at a concentration of 2
mg/ml by dissolving in ammoniated methanol and the stock solutions were stored in
the refrigerator. Two separate stock solutions of deferasirox were prepared for
preparation of calibration curve standards and quality control samples. Spiking
solutions of deferasirox for the preparation of calibration standards and quality control
samples were prepared in ammoniated methanol solution. Internal standard dilution
was prepared at a concentration of approx. 10 µg/ml by transferring 0.25 ml of
internal standard stock solution to 50 ml volumetric flask and made up the volume
with ammoniated methanol solution.
11.3.5 PREPARATION OF CALIBRATION CURVE STANDARDS AND
QUALITY CONTROL SAMPLES
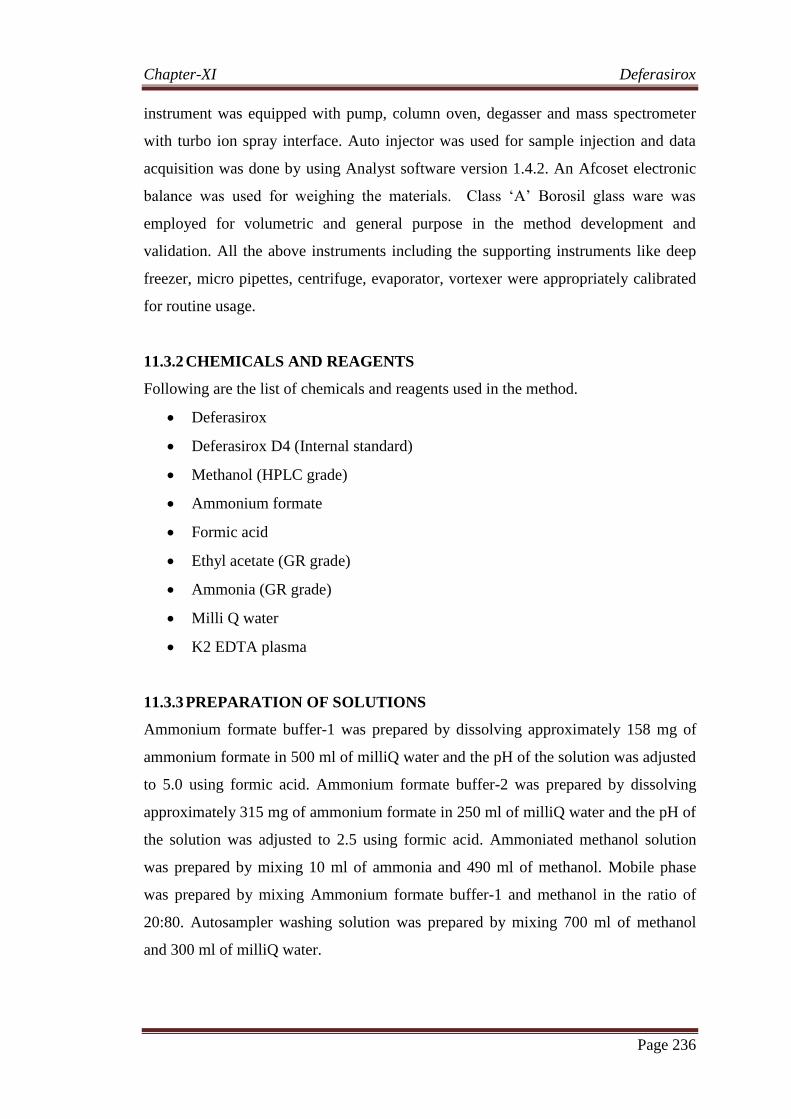
Calibration curve standards preparation:
The spiking solutions for the calibration curve were prepared from deferasirox CC
stock solution as per the table given below in the concentration range of 1261.470
µg/ml to 10.067 µg/ml using ammoniated methanol as diluent.
Stock/Spiking
Solution ID
Stock/Spiking
Solution
Conc.(µg/ml)
Volume
taken (ml)
Made up to
volume
(ml)
Concentration
(µg/ml)
Prepared SS
ID
CC stock
solution 2034.629 6.2000 10 1261.470 STD 8 SS
STD 8 SS 1261.470 8.0000 10 1009.176 STD 7 SS
STD 7 SS 1009.176 6.0000 10 605.506 STD 6 SS
STD 6 SS 605.506 5.0000 10 302.753 STD 5 SS
STD 5 SS 302.753 5.0000 10 151.376 STD 4 SS
STD 4 SS 151.376 3.5000 10 52.982 STD 3 SS
STD 3 SS 52.982 3.8000 10 20.133 STD 2 SS
STD 2 SS 20.133 5.0000 10 10.067 STD 1 SS
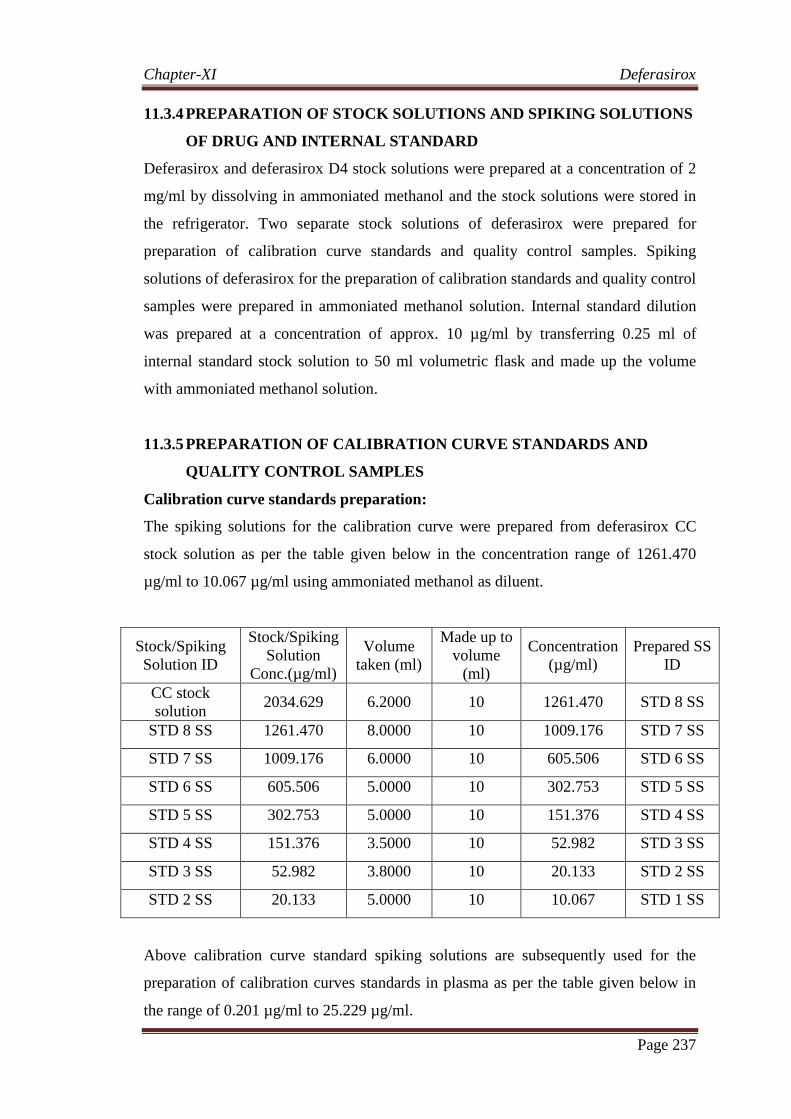
Above calibration curve standard spiking solutions are subsequently used for the
preparation of calibration curves standards in plasma as per the table given below in
the range of 0.201 µg/ml to 25.229 µg/ml.
Chapter-XI Deferasirox
Page 238
Spiking
Solution ID
Spiking
Solution
Conc.(µg/ml)
Volume
taken (ml)
Made up
to volume
(ml)
Final STD
concentration
(µg/ml)
CC STD
ID
STD 8 SS 1261.470 0.2 10 25.229 STD 8
STD 7 SS 1009.176 0.2 10 20.184 STD 7
STD 6 SS 605.506 0.2 10 12.110 STD 6
STD 5 SS 302.753 0.2 10 6.055 STD 5
STD 4 SS 151.376 0.2 10 3.028 STD 4
STD 3 SS 52.982 0.2 10 1.060 STD 3
STD 2 SS 20.133 0.2 10 0.403 STD 2
STD 1 SS 10.067 0.2 10 0.201 STD 1
Quality Control samples preparation:
The spiking solutions for the quality control samples were prepared from deferasirox
QC stock solution as per the table given below in the concentration range of 966.668
µg/ml to 10.104 µg/ml using ammoniated methanol as diluent.
Stock/Spiking
Solution ID
Stock/Spiking
Solution
Conc.(µg/ml)
Volume
taken
(ml)
Made up
to volume
(ml)
Concentration
(µg/ml)
Prepared SS
ID
QC stock
solution 2056.740 4.7000 10 966.668 HQC SS
HQC SS 966.668 6.0000 10 580.001 MQC SS
MQC SS 580.001 0.5200 10 30.160 LQC SS
LQC SS 30.160 3.3500 10 10.104 LLOQQC SS
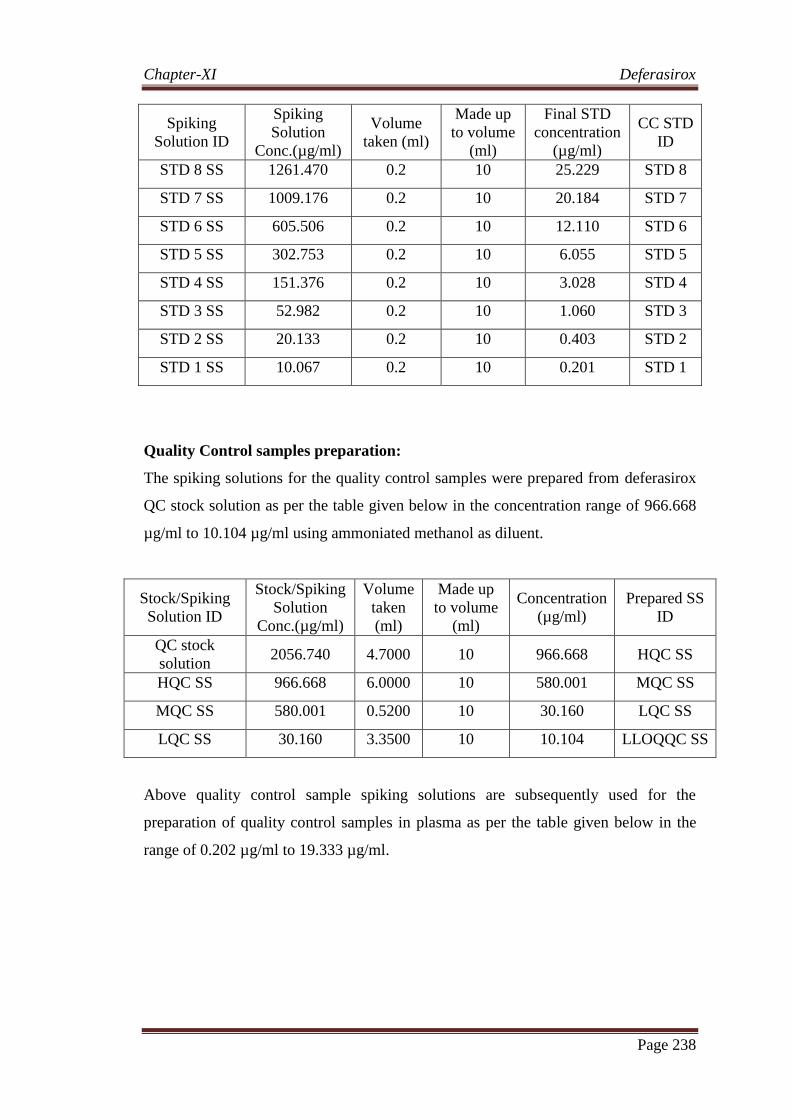
Above quality control sample spiking solutions are subsequently used for the
preparation of quality control samples in plasma as per the table given below in the
range of 0.202 µg/ml to 19.333 µg/ml.
Chapter-XI Deferasirox
Page 239
Spiking
Solution ID
Spiking
Solution
Conc.(µg/ml)
Volume
taken
(ml)
Made up
to volume
(ml)
Final QC
concentration
(µg/ml)
QC STD
ID
HQC SS 966.668 0.2 10 19.333 HQC
MQC SS 580.001 0.2 10 11.600 MQC
LQC SS 30.160 0.2 10 0.603 LQC
LLOQQC SS 10.104 0.2 10 0.202 LLOQQC
The prepared calibration curve standards and quality control samples are aliquoted
(0.3 ml) into individual polypropylene tubes and stored in the deep freezer.
11.3.6 LINEARITY RANGE VERIFICATION
The acceptability of the linearity range of the calibration curve was verified by the Q
test at 95% percent confidence limits for both lower and higher concentration of the
range.
Calibration Standards concentrations
STD 1 0.201
STD 2 0.403
STD 3 1.060
STD 4 3.028
STD 5 6.055
STD 6 12.110
STD 7 20.184
STD 8 25.229
Q Test at lowest concentration:
Range (STD 8-STD 1) 25.028
Module D1 (STD 2-STD 1) 0.201
Q1 Ratio (D1/Range) 0.008
Theoretical value of Q 95%
for 8 standards 0.526
As the Q1 ratio is less than the theoretical value, the lowest concentration of the
calibration curve range is acceptable.
Chapter-XI Deferasirox
Page 240
Q Test at highest concentration:
Range (STD 8-STD 1) 25.028
Module D2 (STD 8-STD 7) 5.046
Q2 Ratio (D2/Range) 0.202
Theoretical value of Q 95%
for 8 standards 0.526
As the Q2 ratio is less than the theoretical value, the highest concentration of the
calibration curve range is acceptable.
11.4 OPTIMIZATION OF THE CHROMATOGRAPHIC CONDITIONS AND
METHOD DEVELOPMENT
As the method development involves both liquid chromatographic separation and
mass spectrometric detection, parameters effecting both the phases were considered
during method development and optimized for consistent response.
Selection of internal standard
During liquid chromatographic and mass spectrometric detection, selection of internal
standard was very important for reliable method. Deferasirox D4 was selected as
internal standard as it was the deuterated form deferasirox. Labeled internal standards
behave similar to the analyte and matrix effects shall be controlled. As the molecular
weight of deferasirox D4 (377.4) was different to deferasirox (373.4), the ions are
easily differentiated during mass spectrometric detection.
Optimization of chromatographic conditions
Chromatographic conditions were optimized for analyte and internal standard using
isocratic flow rate. Initially mobile phase was optimized by using organic solvents
like methanol and acetonitrile and buffers like formic acid and acetic acid. Usage of
phosphate buffers was avoided due to non evaporative nature. Mobile phase
containing mixture of organic solvents and milliQ water does not produced optimum
response due to low ionization. Addition of ammonium buffers like ammonium
formate and ammonium acetate to the organic solvents produced increased and
consistent response due to increased ionization. Mobile phase consisting of 5 mM
ammonium formate buffer and methanol in the ratio of 20:80 was proved to be the
Chapter-XI Deferasirox
Page 241
most suitable of all the combinations. Separation of analyte and internal standard was
achieved on non polar C18 column of Discovery C18 (50x4.6mm, 5µm) column with
the flow rate of 0.9 ml/min.
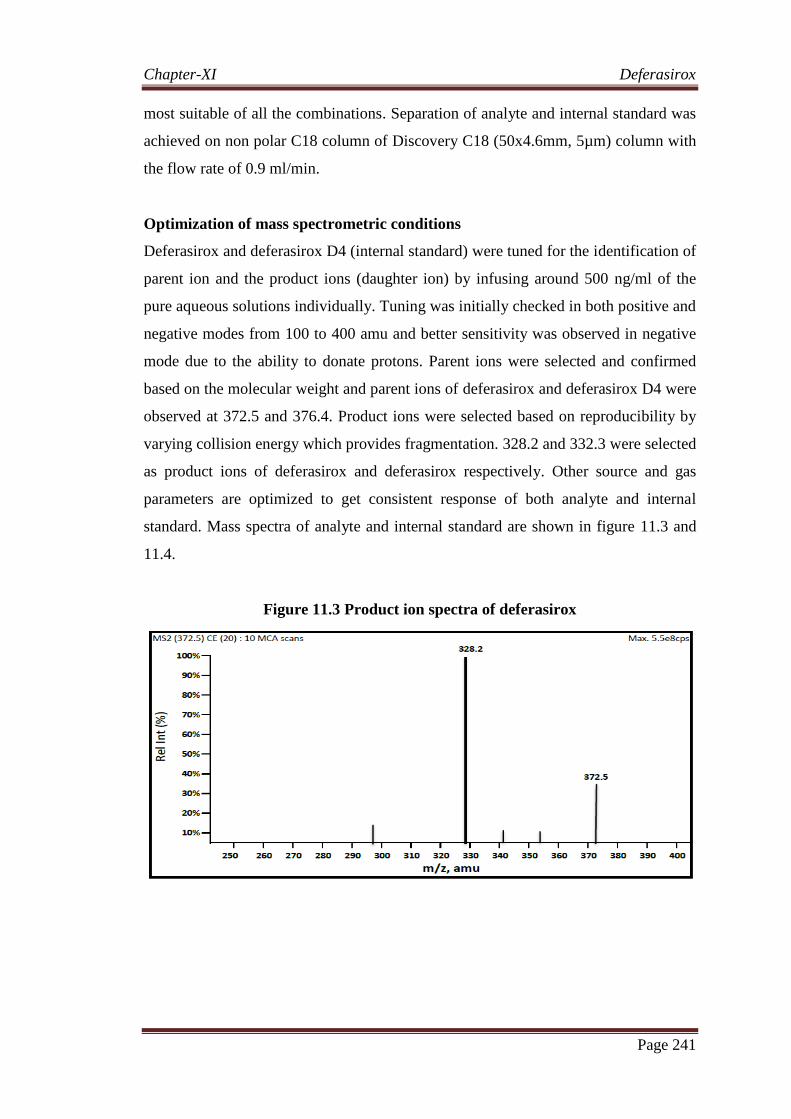
Optimization of mass spectrometric conditions
Deferasirox and deferasirox D4 (internal standard) were tuned for the identification of
parent ion and the product ions (daughter ion) by infusing around 500 ng/ml of the
pure aqueous solutions individually. Tuning was initially checked in both positive and
negative modes from 100 to 400 amu and better sensitivity was observed in negative
mode due to the ability to donate protons. Parent ions were selected and confirmed
based on the molecular weight and parent ions of deferasirox and deferasirox D4 were
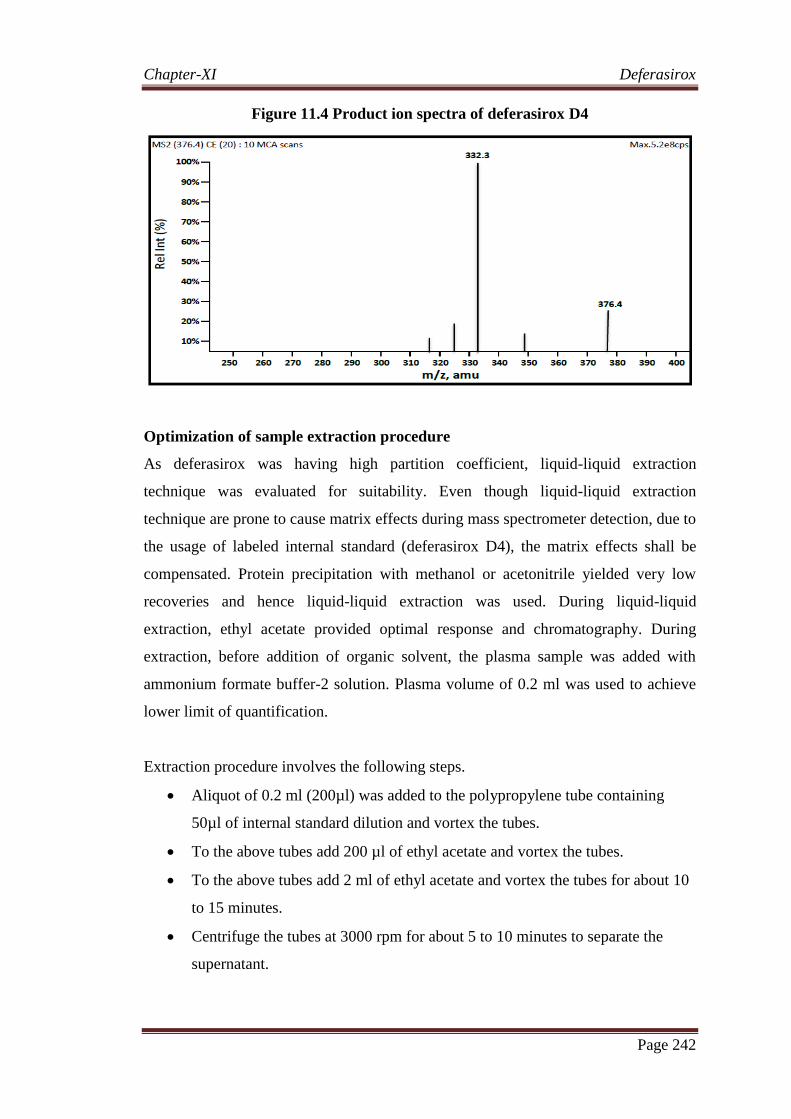
observed at 372.5 and 376.4. Product ions were selected based on reproducibility by
varying collision energy which provides fragmentation. 328.2 and 332.3 were selected
as product ions of deferasirox and deferasirox respectively. Other source and gas
parameters are optimized to get consistent response of both analyte and internal
standard. Mass spectra of analyte and internal standard are shown in figure 11.3 and
11.4.
Figure 11.3 Product ion spectra of deferasirox
Chapter-XI Deferasirox
Page 242
Figure 11.4 Product ion spectra of deferasirox D4
Optimization of sample extraction procedure
As deferasirox was having high partition coefficient, liquid-liquid extraction
technique was evaluated for suitability. Even though liquid-liquid extraction
technique are prone to cause matrix effects during mass spectrometer detection, due to
the usage of labeled internal standard (deferasirox D4), the matrix effects shall be
compensated. Protein precipitation with methanol or acetonitrile yielded very low
recoveries and hence liquid-liquid extraction was used. During liquid-liquid
extraction, ethyl acetate provided optimal response and chromatography. During
extraction, before addition of organic solvent, the plasma sample was added with
ammonium formate buffer-2 solution. Plasma volume of 0.2 ml was used to achieve
lower limit of quantification.
Extraction procedure involves the following steps.
Aliquot of 0.2 ml (200µl) was added to the polypropylene tube containing
50µl of internal standard dilution and vortex the tubes.
To the above tubes add 200 µl of ethyl acetate and vortex the tubes.
To the above tubes add 2 ml of ethyl acetate and vortex the tubes for about 10
to 15 minutes.
Centrifuge the tubes at 3000 rpm for about 5 to 10 minutes to separate the
supernatant.
Chapter-XI Deferasirox
Page 243
Transfer the supernatant into another polypropylene tube and evaporate to
dryness under the stream of nitrogen gas at 50oC.
After evaporation, reconstitute with 0.4 ml of mobile phase and after vortexing
transfer to autosampler vials for injection.
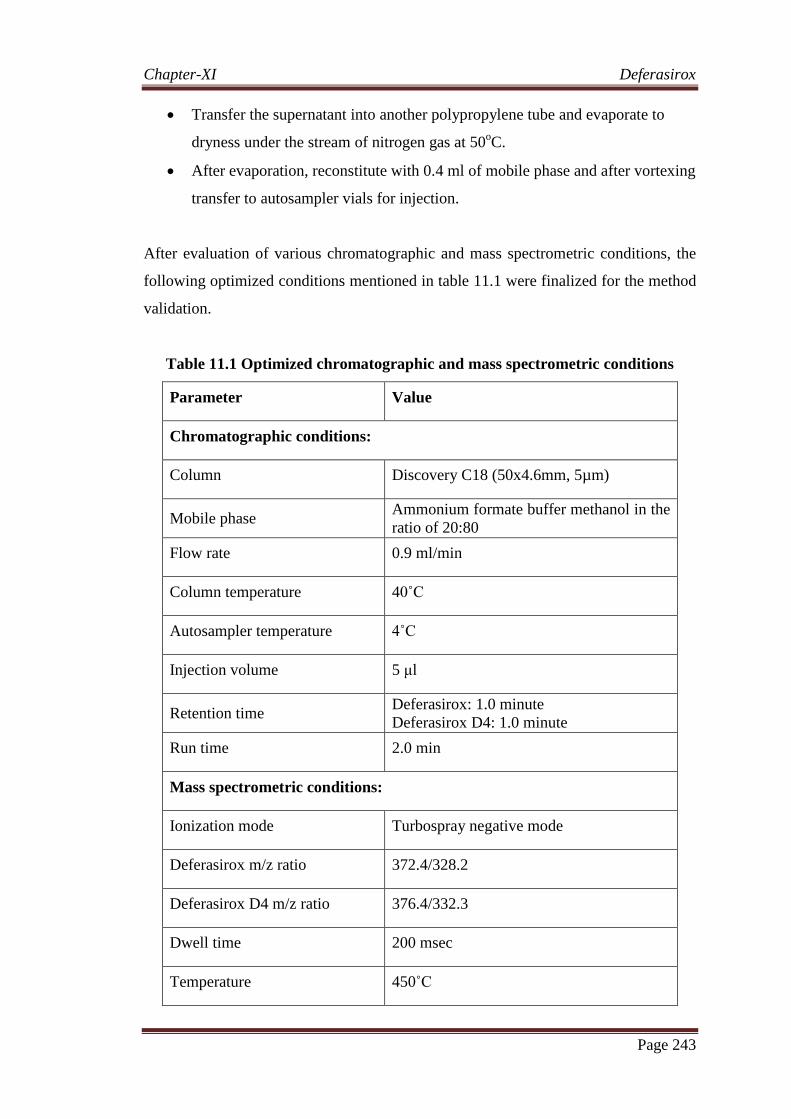
After evaluation of various chromatographic and mass spectrometric conditions, the
following optimized conditions mentioned in table 11.1 were finalized for the method
validation.
Table 11.1 Optimized chromatographic and mass spectrometric conditions
Parameter Value
Chromatographic conditions:
Column Discovery C18 (50x4.6mm, 5µm)
Mobile phase Ammonium formate buffer methanol in the
ratio of 20:80
Flow rate 0.9 ml/min
Column temperature 40˚C
Autosampler temperature 4˚C
Injection volume 5 μl
Retention time Deferasirox: 1.0 minute
Deferasirox D4: 1.0 minute
Run time 2.0 min
Mass spectrometric conditions:
Ionization mode Turbospray negative mode
Deferasirox m/z ratio 372.4/328.2
Deferasirox D4 m/z ratio 376.4/332.3
Dwell time 200 msec
Temperature 450˚C
Chapter-XI Deferasirox
Page 244
Ion Source Gas1 45
Ion Source Gas 2: 45
Curtain gas 35
CAD gas 7
Ion spray voltage -4500
Data acquisition and processing
The chromatographic data was processed by peak area ratio of deferasirox to internal
standard using analyst software. The concentration of the calibration standards and
quality control samples were back calculated using the following equation derived for
each calibration curve. The preparation of calibration curve was prepared using
1/Conc2 as weighting factor.
Y = mX + C
Where, Y = Analyte area / Internal standard area (Area ratio)
X = Analyte concentration
m = Slope of the calibration curve
C = Intercept value
11.5 METHOD VALIDATION
The method was validated in compliance with international regulatory guidelines. The
parameters evaluated during the method validation are selectivity, accuracy, precision,
linearity, robustness, dilution integrity, recovery, carryover and stability during
various stress conditions including bench top stability, freeze thaw stability, auto
sampler stability, stability of stock solutions etc. During method validation,
calibration curve was analysed at the starting of the batch.
11.5.1 SELECTIVITY
Present method utilizing liquid chromatographic separation and detection by mass
spectrometer shown to be selective for the analyte and internal standard. Analyte and
internal standard are selectively extracted from the biological matrix and retention
Chapter-XI Deferasirox
Page 245
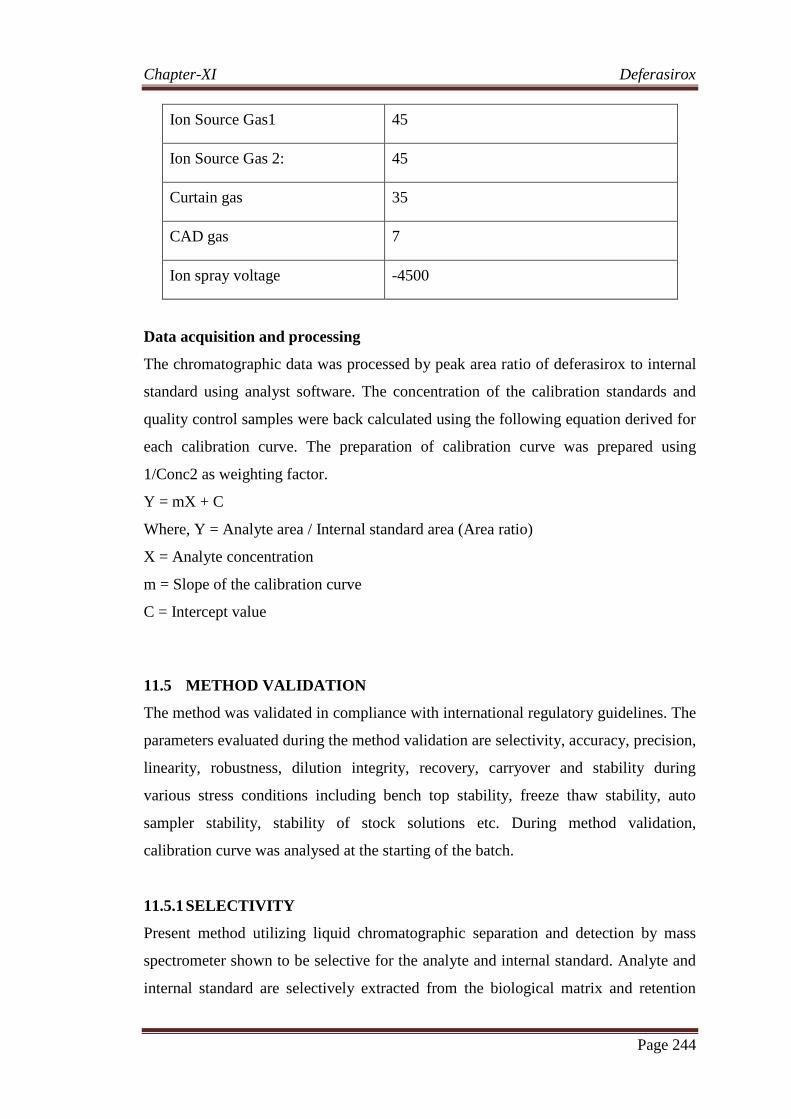
time of both the analyte and internal standard was 1.0 minutes. Mass spectrometric
detection of deferasirox and deferasirox D4 was selective as the parent and product
ion ratio was unique and possibly no other component have the similar ratio. No
interfering peaks were observed with the same retention time of the analyte when
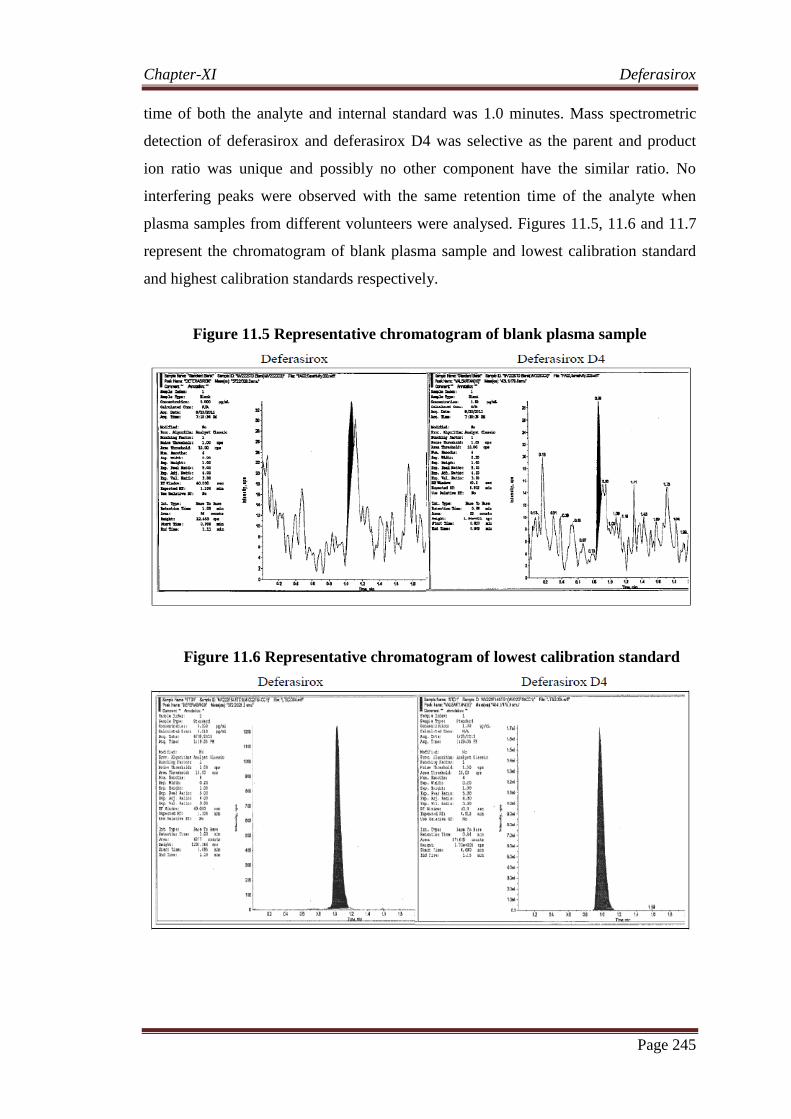
plasma samples from different volunteers were analysed. Figures 11.5, 11.6 and 11.7
represent the chromatogram of blank plasma sample and lowest calibration standard
and highest calibration standards respectively.
Figure 11.5 Representative chromatogram of blank plasma sample
Figure 11.6 Representative chromatogram of lowest calibration standard
Chapter-XI Deferasirox
Page 246
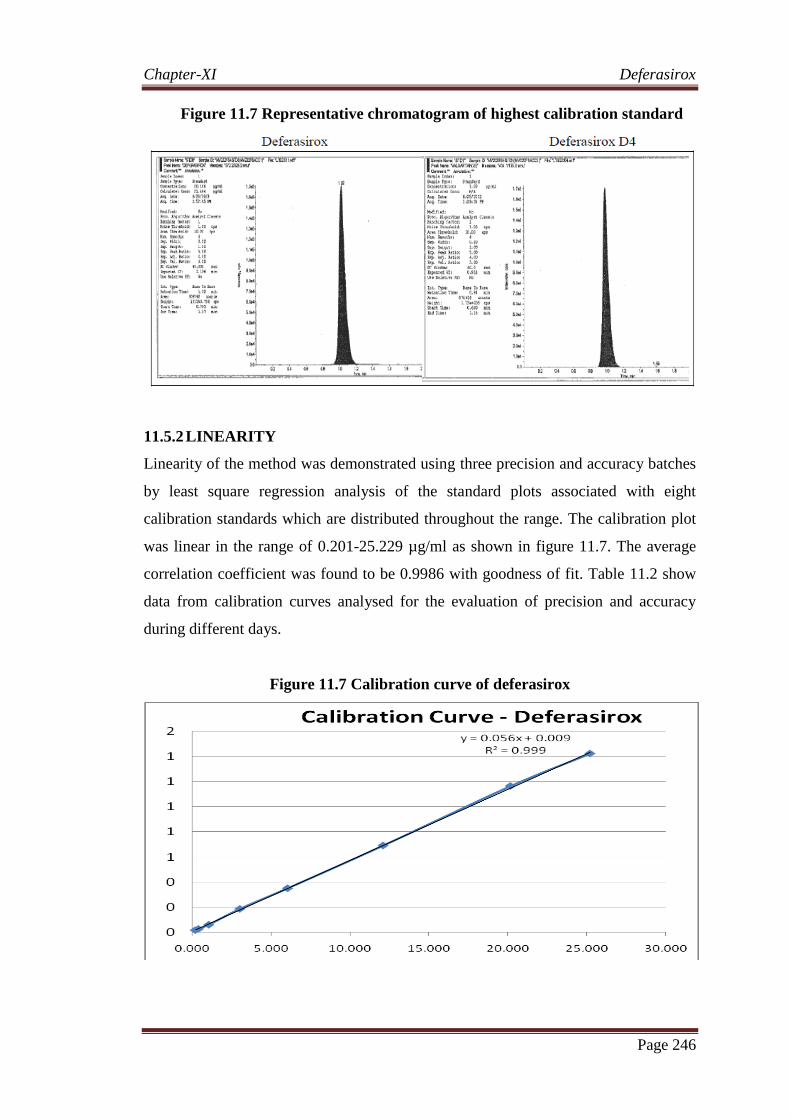
Figure 11.7 Representative chromatogram of highest calibration standard
11.5.2 LINEARITY
Linearity of the method was demonstrated using three precision and accuracy batches
by least square regression analysis of the standard plots associated with eight
calibration standards which are distributed throughout the range. The calibration plot
was linear in the range of 0.201-25.229 µg/ml as shown in figure 11.7. The average
correlation coefficient was found to be 0.9986 with goodness of fit. Table 11.2 show
data from calibration curves analysed for the evaluation of precision and accuracy
during different days.
Figure 11.7 Calibration curve of deferasirox
Chapter-XI Deferasirox
Page 247
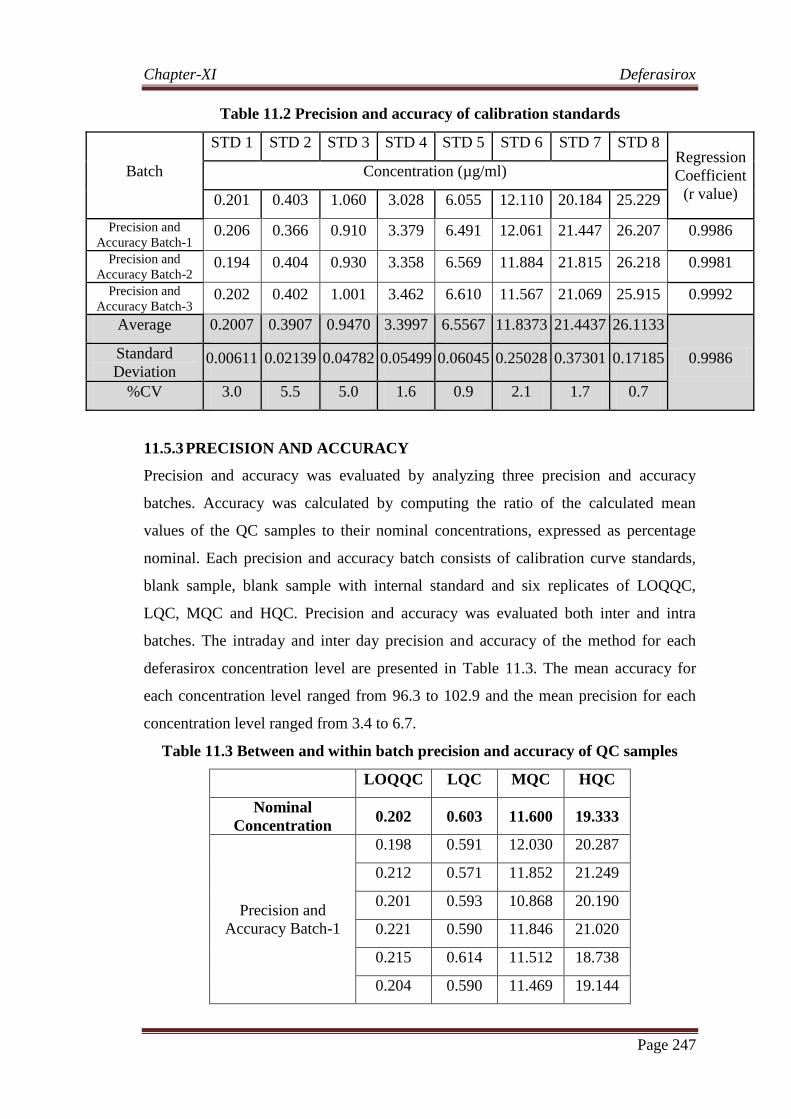
Table 11.2 Precision and accuracy of calibration standards
Batch
STD 1 STD 2 STD 3 STD 4 STD 5 STD 6 STD 7 STD 8 Regression
Coefficient
(r value)
Concentration (µg/ml)
0.201 0.403 1.060 3.028 6.055 12.110 20.184 25.229
Precision and
Accuracy Batch-1 0.206 0.366 0.910 3.379 6.491 12.061 21.447 26.207 0.9986
Precision and
Accuracy Batch-2 0.194 0.404 0.930 3.358 6.569 11.884 21.815 26.218 0.9981
Precision and
Accuracy Batch-3 0.202 0.402 1.001 3.462 6.610 11.567 21.069 25.915 0.9992
Average 0.2007 0.3907 0.9470 3.3997 6.5567 11.8373 21.4437 26.1133
0.9986 Standard
Deviation 0.00611 0.02139 0.04782 0.05499 0.06045 0.25028 0.37301 0.17185
%CV 3.0 5.5 5.0 1.6 0.9 2.1 1.7 0.7
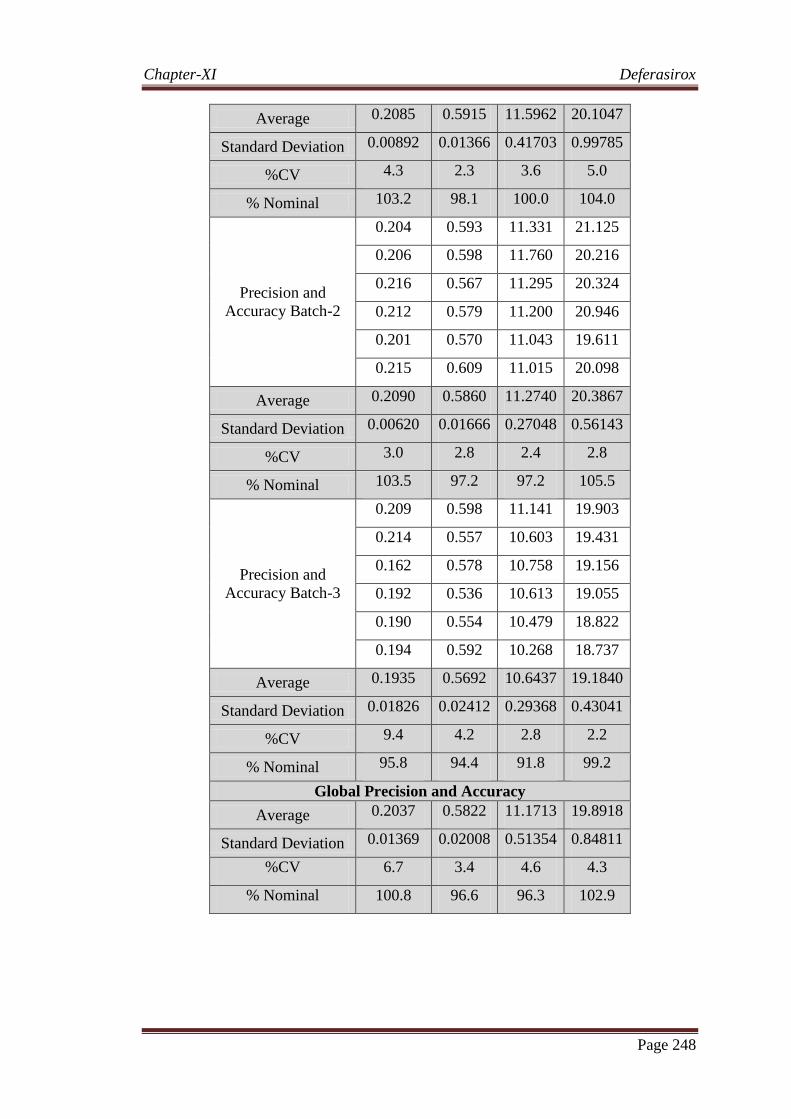
11.5.3 PRECISION AND ACCURACY
Precision and accuracy was evaluated by analyzing three precision and accuracy
batches. Accuracy was calculated by computing the ratio of the calculated mean
values of the QC samples to their nominal concentrations, expressed as percentage
nominal. Each precision and accuracy batch consists of calibration curve standards,
blank sample, blank sample with internal standard and six replicates of LOQQC,
LQC, MQC and HQC. Precision and accuracy was evaluated both inter and intra
batches. The intraday and inter day precision and accuracy of the method for each
deferasirox concentration level are presented in Table 11.3. The mean accuracy for
each concentration level ranged from 96.3 to 102.9 and the mean precision for each
concentration level ranged from 3.4 to 6.7.
Table 11.3 Between and within batch precision and accuracy of QC samples
LOQQC LQC MQC HQC
Nominal
Concentration 0.202 0.603 11.600 19.333
Precision and
Accuracy Batch-1
0.198 0.591 12.030 20.287
0.212 0.571 11.852 21.249
0.201 0.593 10.868 20.190
0.221 0.590 11.846 21.020
0.215 0.614 11.512 18.738
0.204 0.590 11.469 19.144
Chapter-XI Deferasirox
Page 248
Average 0.2085 0.5915 11.5962 20.1047
Standard Deviation 0.00892 0.01366 0.41703 0.99785
%CV 4.3 2.3 3.6 5.0
% Nominal 103.2 98.1 100.0 104.0
Precision and
Accuracy Batch-2
0.204 0.593 11.331 21.125
0.206 0.598 11.760 20.216
0.216 0.567 11.295 20.324
0.212 0.579 11.200 20.946
0.201 0.570 11.043 19.611
0.215 0.609 11.015 20.098
Average 0.2090 0.5860 11.2740 20.3867
Standard Deviation 0.00620 0.01666 0.27048 0.56143
%CV 3.0 2.8 2.4 2.8
% Nominal 103.5 97.2 97.2 105.5
Precision and
Accuracy Batch-3
0.209 0.598 11.141 19.903
0.214 0.557 10.603 19.431
0.162 0.578 10.758 19.156
0.192 0.536 10.613 19.055
0.190 0.554 10.479 18.822
0.194 0.592 10.268 18.737
Average 0.1935 0.5692 10.6437 19.1840
Standard Deviation 0.01826 0.02412 0.29368 0.43041
%CV 9.4 4.2 2.8 2.2
% Nominal 95.8 94.4 91.8 99.2
Global Precision and Accuracy
Average 0.2037 0.5822 11.1713 19.8918
Standard Deviation 0.01369 0.02008 0.51354 0.84811
%CV 6.7 3.4 4.6 4.3
% Nominal 100.8 96.6 96.3 102.9
Chapter-XI Deferasirox
Page 249
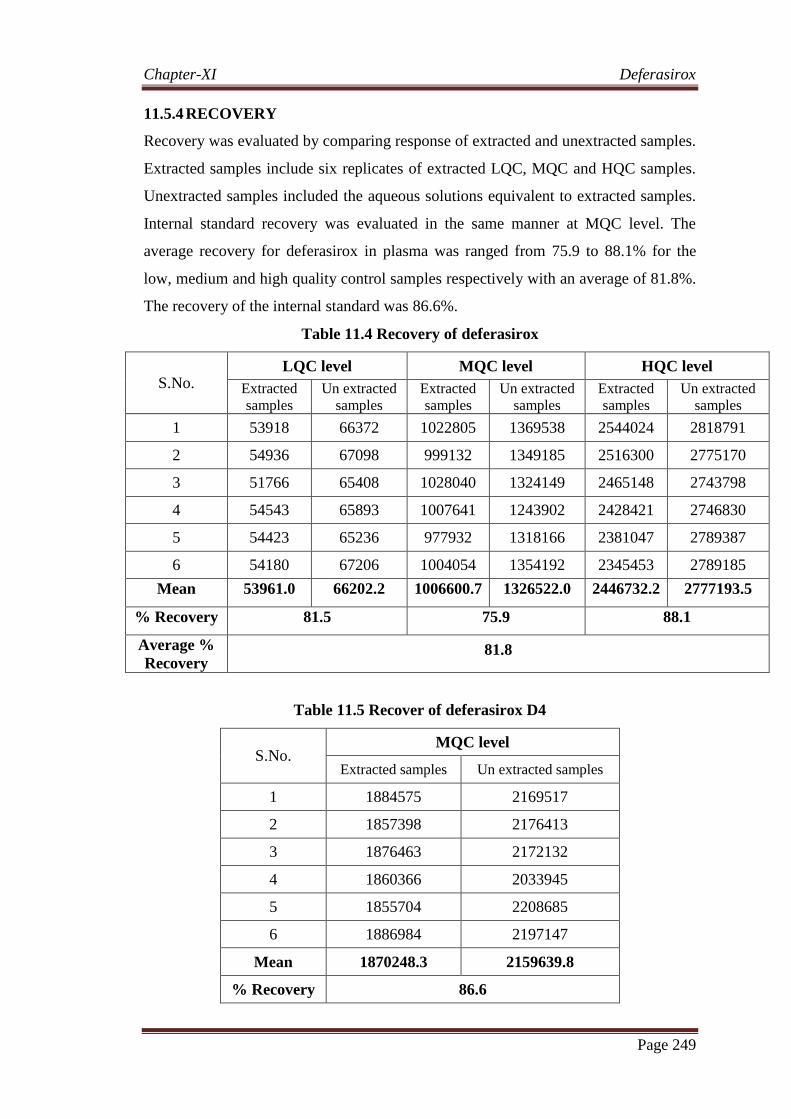
11.5.4 RECOVERY
Recovery was evaluated by comparing response of extracted and unextracted samples.
Extracted samples include six replicates of extracted LQC, MQC and HQC samples.
Unextracted samples included the aqueous solutions equivalent to extracted samples.
Internal standard recovery was evaluated in the same manner at MQC level. The
average recovery for deferasirox in plasma was ranged from 75.9 to 88.1% for the
low, medium and high quality control samples respectively with an average of 81.8%.
The recovery of the internal standard was 86.6%.
Table 11.4 Recovery of deferasirox
S.No. LQC level MQC level HQC level
Extracted
samples
Un extracted
samples
Extracted
samples
Un extracted
samples
Extracted
samples
Un extracted
samples
1 53918 66372 1022805 1369538 2544024 2818791
2 54936 67098 999132 1349185 2516300 2775170
3 51766 65408 1028040 1324149 2465148 2743798
4 54543 65893 1007641 1243902 2428421 2746830
5 54423 65236 977932 1318166 2381047 2789387
6 54180 67206 1004054 1354192 2345453 2789185
Mean 53961.0 66202.2 1006600.7 1326522.0 2446732.2 2777193.5
% Recovery 81.5 75.9 88.1
Average %
Recovery 81.8
Table 11.5 Recover of deferasirox D4
S.No. MQC level
Extracted samples Un extracted samples
1 1884575 2169517
2 1857398 2176413
3 1876463 2172132
4 1860366 2033945
5 1855704 2208685
6 1886984 2197147
Mean 1870248.3 2159639.8
% Recovery 86.6
Chapter-XI Deferasirox
Page 250
11.5.5 MATRIX EFFECT
Matrix effect was evaluated by processing two samples of blank plasma of six
different lots till the extraction and the cartridges were extracted by equivalent
aqueous solution at low (LQC) and high (HQC) quality control levels along with
internal standard. These samples were considered as post extracted samples and are
compared against aqueous solutions. Matrix factor for analyte and internal standard
was calculated by comparing the peak response in presence of matrix ions to that of
peak response in absence of matrix ions. After calculation of analyte and internal
standard matrix factors separately, internal standard normalized matrix factor was
calculated by the ratio of analyte/internal standard matrix factor. The mean internal
standard normalized factor for deferasirox at low (LQC) and high (HQC) quality
control samples ranged from 0.98 to 1.06.
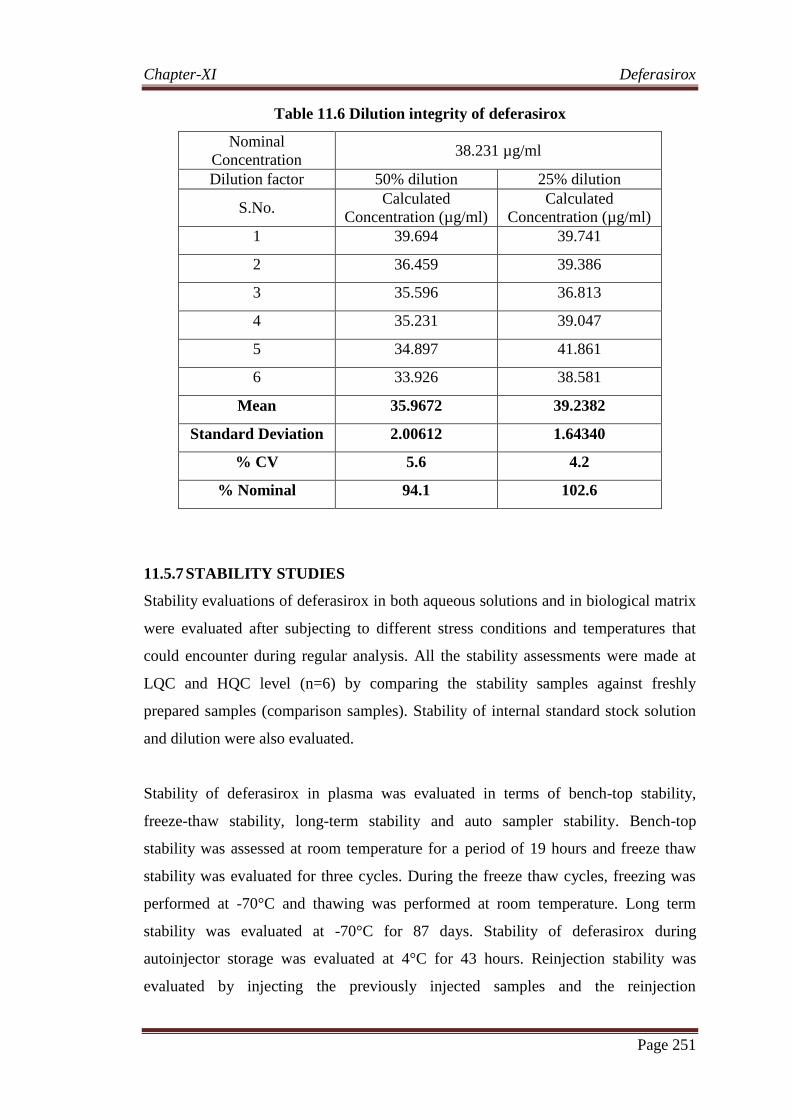
11.5.6 DILUTION INTEGRITY
Dilution integrity at 50% (1/2) and 25%(1/4) was evaluated by preparing a quality
control pool (containing 38.231 µg/ml of deferasirox) at a concentration of
approximately 2 times of HQC concentration to assess the dilution integrity. The
precision and accuracy for dilution integrity at 50% dilution and 25% dilution of the
QC pool sample with screened blank human plasma were determined by using fresh
calibration curve standards. The precision for dilution integrity of deferasirox was
5.6% at 50 percent dilution and 4.2% at 25 percent dilution. The accuracy for dilution
integrity of deferasirox was 94.1% for 50 percent dilution and 102.6% for 25 percent
dilution. Results were shown in the following table 11.6.
Chapter-XI Deferasirox
Page 251
Table 11.6 Dilution integrity of deferasirox
Nominal
Concentration 38.231 µg/ml
Dilution factor 50% dilution 25% dilution
S.No. Calculated
Concentration (µg/ml)
Calculated
Concentration (µg/ml)
1 39.694 39.741
2 36.459 39.386
3 35.596 36.813
4 35.231 39.047
5 34.897 41.861
6 33.926 38.581
Mean 35.9672 39.2382
Standard Deviation 2.00612 1.64340
% CV 5.6 4.2
% Nominal 94.1 102.6
11.5.7 STABILITY STUDIES
Stability evaluations of deferasirox in both aqueous solutions and in biological matrix
were evaluated after subjecting to different stress conditions and temperatures that
could encounter during regular analysis. All the stability assessments were made at
LQC and HQC level (n=6) by comparing the stability samples against freshly
prepared samples (comparison samples). Stability of internal standard stock solution
and dilution were also evaluated.
Stability of deferasirox in plasma was evaluated in terms of bench-top stability,
freeze-thaw stability, long-term stability and auto sampler stability. Bench-top
stability was assessed at room temperature for a period of 19 hours and freeze thaw
stability was evaluated for three cycles. During the freeze thaw cycles, freezing was
performed at -70°C and thawing was performed at room temperature. Long term
stability was evaluated at -70°C for 87 days. Stability of deferasirox during
autoinjector storage was evaluated at 4°C for 43 hours. Reinjection stability was
evaluated by injecting the previously injected samples and the reinjection
Chapter-XI Deferasirox
Page 252
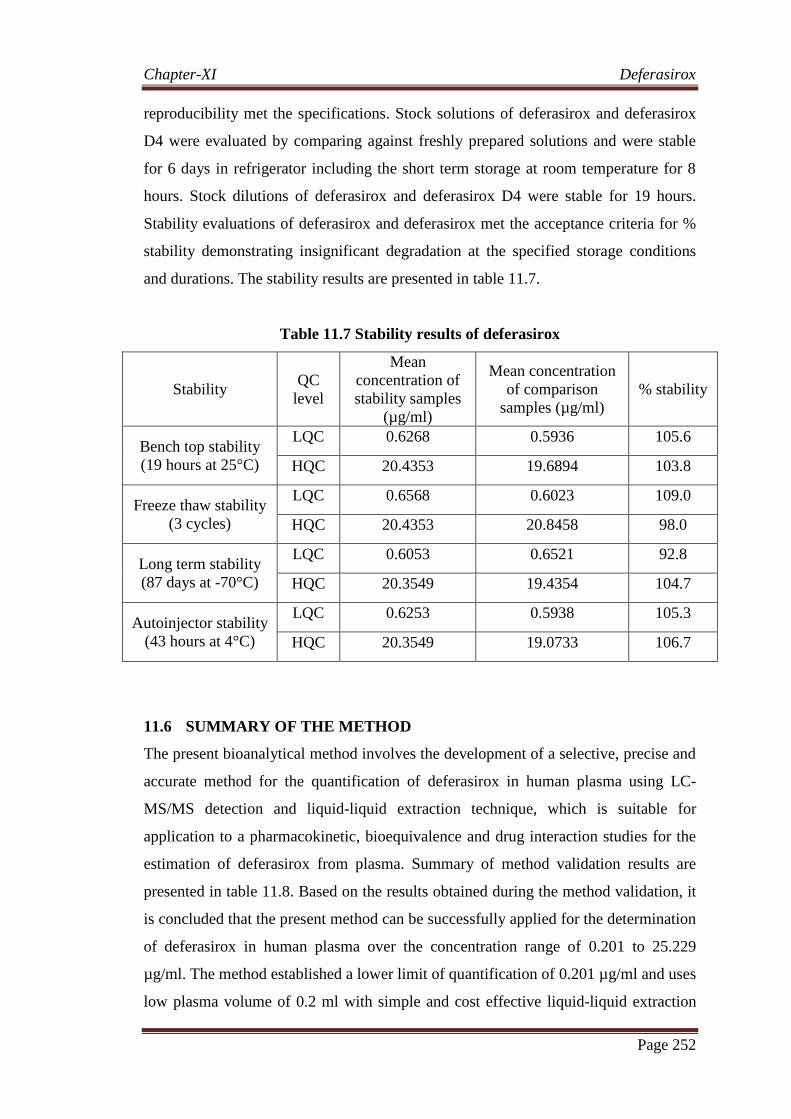
reproducibility met the specifications. Stock solutions of deferasirox and deferasirox
D4 were evaluated by comparing against freshly prepared solutions and were stable
for 6 days in refrigerator including the short term storage at room temperature for 8
hours. Stock dilutions of deferasirox and deferasirox D4 were stable for 19 hours.
Stability evaluations of deferasirox and deferasirox met the acceptance criteria for %
stability demonstrating insignificant degradation at the specified storage conditions
and durations. The stability results are presented in table 11.7.
Table 11.7 Stability results of deferasirox
Stability QC
level
Mean
concentration of
stability samples
(µg/ml)
Mean concentration
of comparison
samples (µg/ml)
% stability
Bench top stability
(19 hours at 25°C)
LQC 0.6268 0.5936 105.6
HQC 20.4353 19.6894 103.8
Freeze thaw stability
(3 cycles)
LQC 0.6568 0.6023 109.0
HQC 20.4353 20.8458 98.0
Long term stability
(87 days at -70°C)
LQC 0.6053 0.6521 92.8
HQC 20.3549 19.4354 104.7
Autoinjector stability
(43 hours at 4°C)
LQC 0.6253 0.5938 105.3
HQC 20.3549 19.0733 106.7
11.6 SUMMARY OF THE METHOD
The present bioanalytical method involves the development of a selective, precise and
accurate method for the quantification of deferasirox in human plasma using LC-
MS/MS detection and liquid-liquid extraction technique, which is suitable for
application to a pharmacokinetic, bioequivalence and drug interaction studies for the
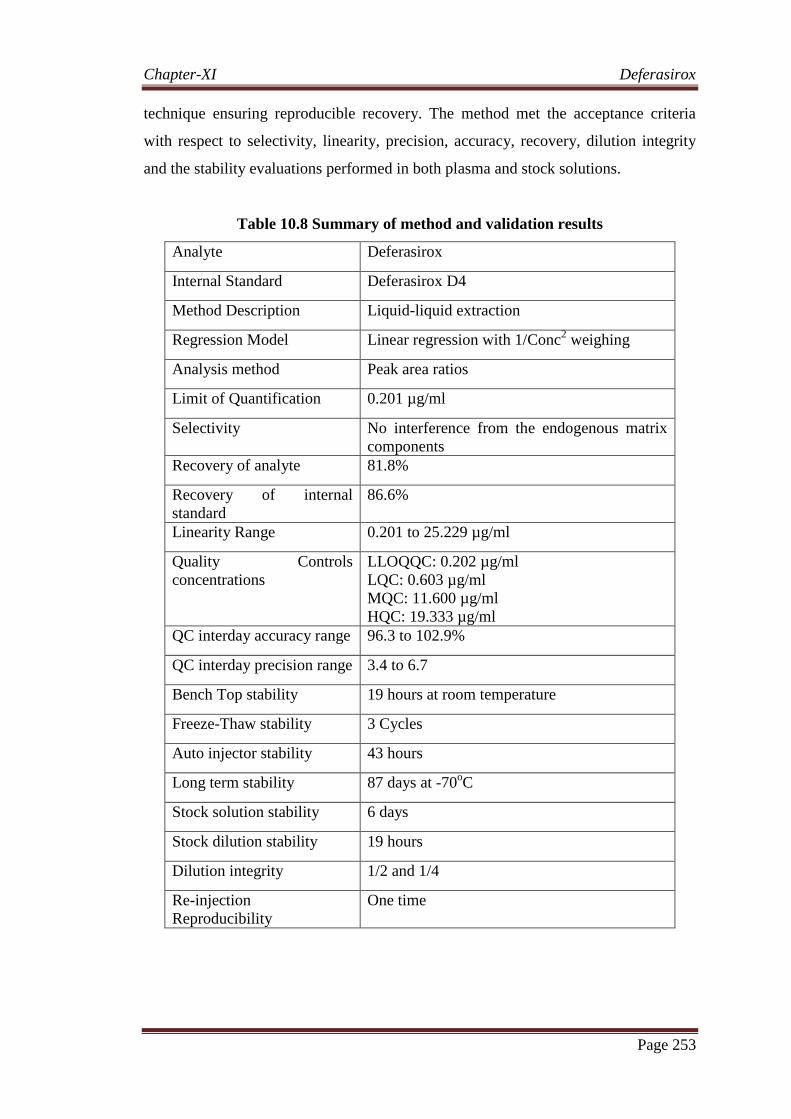
estimation of deferasirox from plasma. Summary of method validation results are
presented in table 11.8. Based on the results obtained during the method validation, it
is concluded that the present method can be successfully applied for the determination
of deferasirox in human plasma over the concentration range of 0.201 to 25.229
µg/ml. The method established a lower limit of quantification of 0.201 µg/ml and uses
low plasma volume of 0.2 ml with simple and cost effective liquid-liquid extraction
Chapter-XI Deferasirox
Page 253
technique ensuring reproducible recovery. The method met the acceptance criteria
with respect to selectivity, linearity, precision, accuracy, recovery, dilution integrity
and the stability evaluations performed in both plasma and stock solutions.
Table 10.8 Summary of method and validation results
Analyte Deferasirox
Internal Standard Deferasirox D4
Method Description Liquid-liquid extraction
Regression Model Linear regression with 1/Conc2 weighing
Analysis method Peak area ratios
Limit of Quantification 0.201 µg/ml
Selectivity No interference from the endogenous matrix
components
Recovery of analyte 81.8%
Recovery of internal
standard
86.6%
Linearity Range 0.201 to 25.229 µg/ml
Quality Controls
concentrations
LLOQQC: 0.202 µg/ml
LQC: 0.603 µg/ml
MQC: 11.600 µg/ml
HQC: 19.333 µg/ml
QC interday accuracy range 96.3 to 102.9%
QC interday precision range 3.4 to 6.7
Bench Top stability 19 hours at room temperature
Freeze-Thaw stability 3 Cycles
Auto injector stability 43 hours
Long term stability 87 days at -70oC
Stock solution stability 6 days
Stock dilution stability 19 hours
Dilution integrity 1/2 and 1/4
Re-injection
Reproducibility
One time
Chapter-XI Deferasirox
Page 254
11.7 REFERENCES
1. Chauzit E, Bouchet S, Micheau M, Mahon FX, Moore N, Titier K and
Molimard M; A method to measure deferasirox in plasma using HPLC coupled
with MS/MS detection and its potential application; The Drug Monitoring,
2010 Aug;32(4):476-81.
2. Choudhry VP and Rahul Naithani; Current status of iron overload and
chelation with Deferasirox; Indian Journal of Pediatrics, 2007, 74 (8), 759-64.
3. Felix Waldmeier, Gerard J Bruin, Ulrike Glaenzel, Katharine Hazell, Romain
Sechaud, Steve Warrington and John B Porter; Pharmacokinetics, Metabolism,
and Disposition of Deferasirox in β-Thalassemic Patients with Transfusion-
Dependent Iron Overload Who Are at Pharmacokinetic Steady State; Drug
Metabolism and Disposition, 2010, 38(5), 808-816.
4. Kalyana Chakravarthy V and Gowri Sankar D; LC Determination of
Deferasirox in Pharmaceutical Formulation; Journal of Global Trends in
Pharmaceutical Sciences, 2010, 1(1), 42-52.
5. Mubeen Ahmad Khan, Sukumar Sinha, Mangesh Todkar, Vikas Parashar,
Swamy Reddy K and Umesh Kulkarni; Validated HPLC-UV method for
simultaneous estimation of Deferasirox and its impurities; International Journal
of Pharmaceutical and Biomedical Research, 2011, 2(2), 128-134.
6. Padmaja N and Ramathilagam N; Method development and validation of RP-
HPLC method for the detremination of Deferasirox in tablets; International
Journal of Pharmacy and Biological Sciences, 2012, 2(4), 338-343.
7. Pligoropoulou H, Vonaparti A, and Panderi I; Hydrophilic interaction liquid
chromatography/positive ion electrospray mass spectrometry for the
quantification of deferasirox, an oral iron chelator, in human plasma; Journal of
Chromatography B, 2012, 893-894, 114-20.
Chapter-XI Deferasirox
Page 255
8. Ramakrishna Nirogi, Devender Reddy Ajjala, Vishwottam Kandikere,
Raghupathi Aleti, SuryaRao Srikakolapu and Himabindu Vurimindi; Dried
blood spot analysis of an iron chelator Deferasirox and its potential application
to therapeutic drug monitoring; Journal of Chromatography B, 907, 2012, 65-
73.
9. Sambasivarao Vattikuti, Phani RSCh, Seetharaman R, Dr. Lakshmi KS; RP-
HPLC Method Development for Analysis of Deferasirox in Formulation; IJPI’s
Journal of Analytical Chemistry, 2011, 1(4), 30-35.
10. Sampath Saravanan and Rama Swetha; Method development and validation for
determination of impurities in Deferasirox by RP-HPLC technique; Journal of
Drug Delivery & Therapeutics; 2012, 2(3), 148-152.
11. Silvia De Francia, Davide Massano, Francesca Maria Piccione, Elisa Pirro,
Silvia Racca, Francesco Di Carlo and Antonio Piga; A new HPLC UV
validated method for therapeutic monitoring of deferasirox in thalassaemic
patients; Journal of chromatography. B, 2012, 893-894, 127-33.
12. Yang LP, Keam SJ, Keating GM; Deferasirox: a review of its use in the
management of transfusional chronic iron overload; Drugs, 2007, 67(15),
2211-30.