chapter 6testbankcollege.eu/sample/solution-manual-operations... · web viewreading: decoding the...
TRANSCRIPT

Full file at http://TestbankCollege.eu/Solution-Manual-Operations-Management-for-MBAs-4th-Edition-Meredith
Chapter 2Process Planning and Design
Chapter Summary
This chapter discusses issues related to the selection of an appropriate transformation system. Thus, the focus in this chapter is on describing the primary transformation system forms, the bases for selecting between them, and the layout of these transformation forms. The main thrust of the chapter is the description of the transformation forms themselves.
Discussion Outline
I. FORMS OF TRANSFORMATION SYSTEMS
A. Continuous Process
1. Characteristicsa. Used to produce highly standardized outputs (usually fluidic) in high
volumesb. Usually run 24 hours a day, seven days a weekc. Uses specialized equipment (pipes, conveyors, vats, etc.)d. Output rate controlled by equipment
2. Advantagesa. Low cost per unit if volumes are high enough to cover fixed costsb. Low labor requirements
3. Disadvantagesa. Initial setup of equipment and procedures is very complexb. Fixed costs are extremely high
B. Flow Shop
1. Characteristicsa. High volume production of standardized, discrete outputs using a line (paced
or unpaced)b. Heavily automated, with large, special-purpose equipmentc. Fixed set of inputsd. Constant throughput timese. Fixed set of outputs f. Flow of work is directg. Uses fewer skilled workers due to standardized operations
2. Advantagesa. Low cost per unit due to high-volume equipment, bulk purchasing, lower
labor rates, efficient utilization, low WIP, simplified managerial control

b. Outputs are produced very quickly—fast response to changing markets is possible
c. Fairly constant processing timesd. Operations can be designed to be compact
3. Disadvantagesa. Variety of output is difficult to attainb. Changes in rate of output are difficult and may require using overtime,
laying off workers, adding shifts, or temporarily closing the plantc. Minor changes in product design require substantial changes in equipment—
this problem leads to infrequent changes in product designd. Less challenging work for labor force—leads to boredom and absenteeisme. Stoppage at any operation can halt productionf. Large support staff requiredg. Large stocks of raw materials requiredh. Complexity of initial setupi. High maintenance costs and possibility of equipment becoming obsolete
4. Layouta. Dividing the work evenly between operationsb. Paced line—moves output along at a continuous rate and operators perform
their work as output passes by themc. Unpaced line—workers build up queues between workstations and can vary
their pace
5. Balancing the production line a. Determine desired cycle timeb. Select heuristic to use to lay out the line, e.g., Longest Operation Timec. Use heuristic to create a layout of line based on desired cycle time
C. Job Shop
1. Characteristicsa. Grouping of staff and equipment according to functionb. Large variety of inputsc. Considerable amount of transport of staff, materials, or recipientsd. Large variations in system flow timese. Each output requires different route through facility, requires different
operations, uses different inputs, and requires a different amount of time
2. Advantagesa. Ability to provide a wide variety of outputs at reasonable costb. Use of general-purpose equipment that is available at lower prices than
special-purpose equipmentc. Used equipment is likely to be available
2

Full file at http://TestbankCollege.eu/Solution-Manual-Operations-Management-for-MBAs-4th-Edition-Meredith
d. Larger base of experience with general-purpose equipment reduces problems with installation and maintenance
e. Equipment obsolescence is minimized f. Resources for a function requiring special staff, materials, or facilities can be
centralized to save expensesg. Distracting or dangerous equipment, supplies, or activities may be
segregatedh. Highly skilled work increases worker morale and reduces boredomi. Ability of workers to learn from other workers in their functional areaj. Ability to use incentive arrangementsk. De-coupling of operations due to work-in-process inventoryl. Ability to substitute one general-purpose resource for another
3. Disadvantagesa. General-purpose equipment is slower than special-purpose equipment,
leading to higher variable cost per unitb. Requires higher skilled, higher paid workersc. Uneconomic for high production volumesd. High work-in-process inventoriese. High cost of handling materialsf. Managerial control is extremely difficult
4. Layouta. Based on historically stable output pattern of the firm and expected changes
in that patternb. Locating departments is based on the relative importance of locating each
department close to or far away from other departments
5. Directly specified closeness preferencesa. Uses closeness ratings that specify the desirability of locating two
departments close to each otherb. Closeness ratings: A = Absolutely necessary, E = Especially important, I =
Important, O = Ordinary closeness, U = Unimportant, X = Undesirablec. Layout process is to locate departments with “A” closeness ratings together,
then “E” ratings, then “I” ratings, and then “O” ratings (while trying to separate departments with “X” ratings)
6. Cost-volume-distance modela. Desirability of closeness is based on total cost of moving materials or people
between departmentsb. Cost of movement between two departments equals cost per unit of moving
materials between the departments x volume moving between the departments x distance between the departments
D. Cellular Production

1. Characteristicsa. Combination of flow shop and job shop—used to produce a family of
outputsb. Based on group technology, which exploits similarities in parts by
classifying parts that have similar processing requirements into part familiesc. Cells include human skills and equipment required to produce a family
2. Advantagesa. Reduced setup times: Lead to increased time available to process parts,
fewer machines needed to produce at a given output level, and the ability to produce smaller batches economically
b. Parts are produced in one cell: Simplifies shop floor control; reduces movement of materials between operations; increases worker accountability, responsibility, and autonomy
c. Maximizes benefits of the team approachd. Minimal cost to move to cellular production
3. Disadvantagesa. Equipment breakdowns can stop production in a cellb. Balancing capacity with demand at a cell can be difficultc. Volumes are too small to allow for purchasing the high-volume, special-
purpose equipment used in flow shopsd. Cells do not provide the extent of customization typical of job shops
4. Layouta. Use of teams of cross-trained workers and equipment that produce families
of outputsb. Virtual cell: Formed by identifying pieces of equipment and dedicating them
to the production of a family without moving the equipment into a cellc. Pilot cell: First cell created by moving workers and equipment d. Hybrid stage: Shop is incrementally converted to cellse. Formation of cells stopped when volume of remaining parts is insufficient to
justify setting up another cell
5. Methods of cell formationa. Using human judgment to sort photographs of parts into families based on
geometry, size, or other visual characteristics of the partsb. Sorting parts based on drawing namec. Production flow analysis: Outputs with the same set of resource needs are
grouped into a single family d. Classification and coding: Assigning an alphanumeric code to each part
based on its design characteristics, processing requirements, or both, and then grouping parts with similar codes together into a family
E. Project Operations
4

Full file at http://TestbankCollege.eu/Solution-Manual-Operations-Management-for-MBAs-4th-Edition-Meredith
1. Characteristicsa. Large scale and have finite durationb. Non-repetitive, consisting of multiple, and often, parallel tasks c. Immobility of physical product during processingd. Resources are brought together from different functional areas for duration
of projecte. Unique output
2. Advantagesa. Ability to perform under time and cost constraintsb. Useful for close coordination of interdependent activities with finite duration
3. Disadvantagesa. Less depth in any one technical area compared to functional organization by
specialtyb. Specialized resources often cannot be justified because of project’s low
utilization of resources
II. SELECTION OF A TRANSFORMATION SYSTEM
A. Considerations of Volume and Variety
1. Make-to-stock vs. make-to-order2. Product-process matrix
B. Product and Process Life Cycle
1. Initiation (design of new output): Project transformation system preferred due to its low fixed costs
2. Expansion (demand grows): Job shop, then cells, are preferred as volume increases
3. Maturity (price competition begins): Flow shop preferred due to its low variable cost
III. SERVICE PROCESSES
A. High vs. Low Customer Contact Operations
1. High contact operations should be designed to be handled by workers skilled in social interaction
2. Low contact operations should be designed to be more efficient 3. Low contact and high contact operations should be decoupled from each other
B. Service Process Design

1. Service matrix used to classify services into four categories based on capital vs. labor intensity and low vs. high customer contact intensity
2. Key challenges for different type of service processesa. Low contact service: Trying to make the service appear friendly so as to
attract high volumesb. High contact service: Trying to be efficient while keeping prices highc. Equipment intensive service: Trying to keep capital investment relatively
lowd. Labor intensive service: Trying to minimize wages and time spent on each
customer
C. Service Gaps
1. Differences between what the customer needs and what the service provider is offering
2. Identifying the gaps helps the service provider control quality, productivity, performance, and cost better
D. Service Guarantees and Fail Safing
1. Service guarantees should be meaningful, unconditional, easy to understand, & easy for the customer to invoke
2. Fail safing: Preventing service providers & customers from making errors by installing preventive measures
Chapter Teaching Tips
Perhaps the best way to illustrate the difference between these forms is a film or video that depicts some of the different forms. This could then be followed by a class discussion of why that is the best form for that type of firm and what changes in the firm's situation (such as volumes or variety) would require a change in the type of transformation system.
Illustrative Answers to Expand Your Understanding Questions
1. One approach frequently used is to rotate people among the workstations so everyone gets a chance to enjoy the less hectic job. Another approach is to add a cleanup or maintenance task to the low task time station.
2. Amazingly, they are, and if management is not careful, they can have a serious morale problem on their hands. The key is to try to use automation to perform the rote tasks and let the humans be the problem solvers rather than a repetitive part of the automation process itself. (Some firms do use humans in the process to watch for quality but their workpace is generally not hectic.)
6

Full file at http://TestbankCollege.eu/Solution-Manual-Operations-Management-for-MBAs-4th-Edition-Meredith
3. The determining factor may well not be the transportation cost but the number of workers required, or conversely, the need for equipment. Thus, if equipment is needed to move product between two departments (e.g., near the completion of a large, heavy product), we might want to place those departments close together. In Japan, space is at a premium so minimizing total space requirements would be the governing factor. The same kinds of considerations would hold for a flow shop in the sense that worker or station idle may not be a critical factor.
4. Companies are usually not aware of the contradictory expectations and requirements they have of their employees when such changes are made. A slower pace of implementation, with careful analysis made of similar changes elsewhere, would alert management to the potential problems it was creating. In addition, management should listen to its workers and their problems when making such changes.
5. There are quite a few. First, one or a few workers can reach all the machines without traveling far. In addition, the product entry and exit points are at the same location and can be inspected easily by the same person. In addition, if the cell is producing parts to feed another cell, it can be positioned at a point to take the previous work, add its operations, and pass it on. If the cell is automated, say by a robot, the robot can reach all the machines from a central position. Finally, workers can move easily monitor the other stations and move to other stations if the need arises.
6. A virtual cell would have the machines already set up and would thus save setup time. However, the time and cost of materials movement would be lost, as would the time saved in overlapping operations (the operator cannot take a piece and put it on the next machine while the first machine is running since the "next" machine may be across the shop). In addition, the positive effects of team operations could be lost if a team were being used in the physical cell.
7. The mini-factory incorporates many of the staff functions as well as other functional areas: engineering, accounting, sales, purchasing, human resources, production planning, materials management, etc. By including all relevant functions, production can be targeted to specific customers with greater customization and faster response. Prices can be more accurate since other overhead charges are not being allocated to each mini-factory.
8. For high-contact services, the important measures are goodwill, customer satisfaction, quality, customization, etc.
9. Many firms have followed either of these paths. Some see their fortunes tied to a particular product and try to stay on the forefront of knowledge about that product, wherever it may lead. Others see their expertise as being at a particular process stage (growth, maturity) and abandon products as they move past this stage. Most important is for a firm to know its strengths.
10. It is usually very expensive for either machines or labor to operate in the upper right corner where high volumes are required with great variety. However, it is often claimed that the new flexible technologies will soon allow firms to produce variety with the ease and the speed of mass production. In the lower left corner we cannot justify using machines to produce just a couple of standard products, so expensive labor would have to be used. However, no one is

willing to pay the cost of manually produced standard items, such as nails. This is why commodity items are often packaged in groups of a few or a dozen, like screws, nuts, and nails.
11. In Figure 2.12, customer contact intensity is essentially degree of variety, more intensity meaning more customization or variety, and hence is equivalent to the vertical axis in Figure 2.9. Capital-intensive means made by machinery, which corresponds to large batches in Fig. 2.9, and labor-intensive means small batches or single items, which translates into batch size, the horizontal axis in Fig. 2.9. Thus, the figures are largely based on the same concept, but expressed a bit differently to apply more clearly to services in Fig. 2.12. Hence, the Professional Service corresponds to the Project form, and the Service Factory corresponds to the Flow form. However, the Service Shop does not have an equivalent in Fig. 2.9 but may correspond to the flexible technologies we hear about in factories. The Mass Service is equivalent to old factories where a standard product was made by masses of laborers turning out standard parts, such as for muskets in the early 1800s.
Apply Your Understanding: Paradise State University
Teaching Tips for Case
This case was designed to help students further reinforce the distinction between the functional and cellular approach by having them think about how the cellular approach could be applied to a service that is functionally organized. In addition, the case provides the students with the opportunity to analyze the pros and cons of adopting a cellular layout from several different perspectives. Finally, tasking the students to develop a cellular organization in this unique but familiar situation provides them with the opportunity to apply and extend their understanding of the cellular production concept. Because of its immediate applicability to students, this case should generate a lively, if not passionate, discussion.
1. The following formula can be used to calculate the number of students each department must teach each semester for the current MBA class:
where:
Nj = the number of students that department j must teach each semester,Si = the number of MBA students in concentration i,Cij = the number of courses students in concentration i take from department j.
For example, the number of students that would be taught by the accounting department each semester is calculated as follows:
Nacct = [100(4) + 40(1) + 70(1) + 150(1) + 50(1) + 30(1)]/2 = 370
8

Full file at http://TestbankCollege.eu/Solution-Manual-Operations-Management-for-MBAs-4th-Edition-Meredith
Note: the sum is divided by two because these course requirements are spread out over two semesters. The table below summarizes these calculations. To calculate the faculty needed, the “total students taught each semester” column was divided by 50 (25 student target class size 2 courses per faculty member per semester). To illustrate its interpretation, the accounting department will need to teach 200 students concentrating in accounting each semester. Likewise, the accounting department will have to accommodate 20 students concentrating in finance, 35 general management students, 75 MIS students, 25 marketing students, and 15 OM students each semester. In total, the accounting department will have to accommodate 370 students in each of the next two semesters. Based on a class size of 25 students and faculty teaching 2 classes per semester, this works out to a requirement for 8 faculty members (370/50).
Number of Students Each Department Must Accommodate Each Semester by Student Concentration
Dept.Faculty
Student Concentrations
Acct. Fin.Gen.Mgt. MIS Mkt. OM
Total Students Taught Each
SemesterFacultyNeeded
Acct. 200 20 35 75 25 15 370 7.4 8Fin. 50 80 35 75 25 15 280 5.6 6Mgt. 50 20 140 75 25 15 325 6.5 7MIS 50 20 35 300 25 15 445 8.9 9Mkt. 50 20 35 75 100 15 295 5.9 6OM 100 40 70 150 50 75 485 9.7
10
Since the number of faculty available in each department (see first table in case) is at least as large as the faculty needed in the above table, there appears to be plenty of faculty available. In fact, there is actually one extra MIS faculty member. As a side issue, the instructor may want to have the students recalculate the faculty needed for alternative target class sizes.
2. In the cellular production approach, equipment and labor are dedicated to specific products. In the case of the Business School, the products produced are the students who graduate with the various concentrations. Therefore, one way to apply the cellular production approach to the Business School would be to set up departments (cells) that contained faculty from the different functional departments and dedicate them to the instruction of a particular concentration. Thus, if an accounting professor were assigned to the cell responsible for instructing the OM students, the accounting classes this professor taught would have only OM majors in it making it possible to tailor this class specifically to the needs of the OM majors. In the present approach, students from all concentrations sign up for the same course making it difficult to tailor the material to the specific needs of a particular concentration.
3. Advantages of the cellular approach include:

Faculty would be better positioned to coordinate material covered across courses since they would only have to coordinate with other faculty in their particular cell and not faculty in other departments.
Faculty would get to know students better since they would be responsible for only a subset of the students.
Classes could be better tailored to the needs of the specific majors. Cross-disciplinary research among faculty would be fostered. Professors would have the opportunity to teach a wider variety of courses.
Disadvantages of the cellular approach include:
Students could be stuck with professors they do not care for. Students could be limited in the variety of points of view to which they are exposed. Faculty might resent the amount of time they would have to spend coordinating with other
faculty within their cell. Faculty and students might resist the change. Some faculty may have to prep more courses than others (see below).
Rather than speculate here on what the students’ preferences would be, it is suggested that this issue be a point of discussion during class. In terms of faculty preferences, it is likely that this kind of change would be strongly resisted by many faculty members. One issue of concern to them would be how promotion and tenure decisions would be made. In addition, the number of preps and amount of time required to coordinate with other faculty would be issues of concern. Clearly, significant changes to the current reward system would be required for this type of change to be accepted by professors and to succeed ultimately.
4. One way to apply the cellular approach to the Business School is to set up a cell for each concentration. The table below illustrates one way the faculty could be allocated to cells.
FacultySpecialty
Faculty Available
Number of Faculty Assigned to CellsAcct.Cell
Fin.Cell
Mgt.Cell
MISCell
Mkt.Cell
OMCell
Acct. 8 4 ½ 1 1 1 ½Fin. 6 1 2 1 1 ½ ½Mgt. 7 1 ½ 3 1 1 ½MIS 10 1 ½ 1 6 1 ½Mkt. 6 1 ½ 1 1 2 ½OM 10 2 1 1½ 3 1 1½
These faculty allocations were based on the table presented in the answer to Question 1 above. Beginning with the assignment of the accounting professors, we note from the table that the 200 students concentrating in accounting will take accounting classes each semester. Thus, four accounting professors will be needed in the accounting cell (200/50). This leaves four accounting professors to be assigned and five cells, so one or more of the cells will need to share a professor. The sharing of a professor can be accomplished in one of two ways: 1) the shared professor offers separate courses in two cells, or 2) the professor
10

Full file at http://TestbankCollege.eu/Solution-Manual-Operations-Management-for-MBAs-4th-Edition-Meredith
teaches a single course that is open to multiple majors. For example if it is decided that an accounting professor is to be shared between the finance cell and the OM cell, then the professor could either: 1) teach separate courses for both finance and OM majors or 2) could teach joint courses that both finance and OM majors could enroll in, perhaps because of the similarity of their needs in this area. In the assignment shown in the table above, the general management, MIS, and marketing cells were allocated one accounting professor, and the finance and OM cells shared one due the their small student numbers. The other functional faculty members were assigned in a similar fashion. A couple of points to note about this assignment. First, the number of courses a faculty member will have to prepare for may depend on whether the faculty member is assigned to the cell corresponding to his or her specialty or assigned to support a cell dedicated to another specialty. For example, consider a marketing faculty member. If this faculty member is assigned to the marketing cell, he or she will potentially have to prep and teach four different marketing courses. On the other hand, if assigned to any of the other cells, this professor would only be responsible for the same, single introductory marketing course. In actuality, since there are two marketing professors assigned to the marketing cell, on average each would only have to prep and teach two unique courses. This, however, is still twice as many as the other marketing professors. Of course, some professors may prefer teaching a wider variety of courses and more specialized elective courses. Another approach is to change professor assignments periodically.
Another issue relates to the class sizes in the MIS cell. Specifically, since only one faculty member from each of the other functional specialties is assigned to the MIS cell, these professors will have to teach classes with an average of 37.5 students, which is larger than the target class size of 25. It is interesting that in the functional arrangement it might have made sense to have extra faculty in the area with the highest number students concentrating in the area, while in the cellular approach additional faculty are needed in all the other areas. This demonstrates the reduction in flexibility resulting from dedicating faculty to specific areas of concentration, the same effect that occurs in manufacturing when machine are dedicated to specific part-families.
Discussion Outline for Case
I. Number of Students Each Department Must TeachA. Logic of CalculationsB. Compare Calculations to Available Staff
II. Application of Cells to Business SchoolA. Define and Contrast Functional and Cellular ApproachesB. Discuss What Business School’s Product IsC. Discuss Organizing Faculty on Basis of Product
III. Detailed Discussion of Applicability of Cells to Business SchoolA. Advantages/DisadvantagesB. Students’ Preferences

C. Professors’ Likely PreferencesD. What is Needed to Make the Cellular Approach Work
1. Changes to reward system
IV. Assignment of Faculty to Cells
Apply Your Understanding: X-Opoly Inc.
Teaching Tips for Case
This case illustrates a number of issues related to transformation system design and facility layout. First, the case illustrates that a particular plant can use multiple types of transformation systems simultaneously. Second, in addition to reinforcing the standard types of assembly line analyses including line balancing, determination of cycle times, and calculating efficiency, the case illustrates the connection between cycle time and capacity. Based on this, the student is provided with the opportunity to discover how cycle time, capacity, and product demand are interrelated. Finally, the case tests the students’ understanding of the process by asking them to consider how the line could accommodate the switch over from one product to another.
1. X-Opoly uses both a job-shop (functional) and a flow-shop layout. The job-shop layout includes the art department, printing department, and the cutting department. The assembly line is a flow-shop.
2. Switching the assembly line over from the production of one game to another game would involve only delivering new property cards and game board decals to stations 5 and 17, respectively. The tasks at these two stations, however, would not change. All the other components of the game including game cards, game pieces, and money are not customized and therefore would not require a change.
3. The cycle time of the assembly line is equal to the time it takes the longest station to complete its task(s). In this case, station 17 has the longest task time, so the cycle time for the line is 90 seconds. The total task time for a game box is 650 seconds. The efficiency of the line is thus calculated as:
4. 4 hours less the two 15 minute breaks leaves 7.5 hours or 450 minutes/day. 90 second cycle time = 1.5 minute cycle time.
Daily capacity can thus be calculated as:
Annual capacity = 300 games/day × 200 days/year = 60,000 games/year.
12

Full file at http://TestbankCollege.eu/Solution-Manual-Operations-Management-for-MBAs-4th-Edition-Meredith
Demand is projected to grow 25% annually for the next five years as shown in the Table below.
Year Projected DemandCurrent Year 50,000
Next Year 62,500Two Years in Future 78,125Three Years in Future 97,656Four Years in Future 122,070Five Years in Future 152,599
Based on the above table, projected demand will exceed the current capacity of the assembly line next year by 2,500 units.

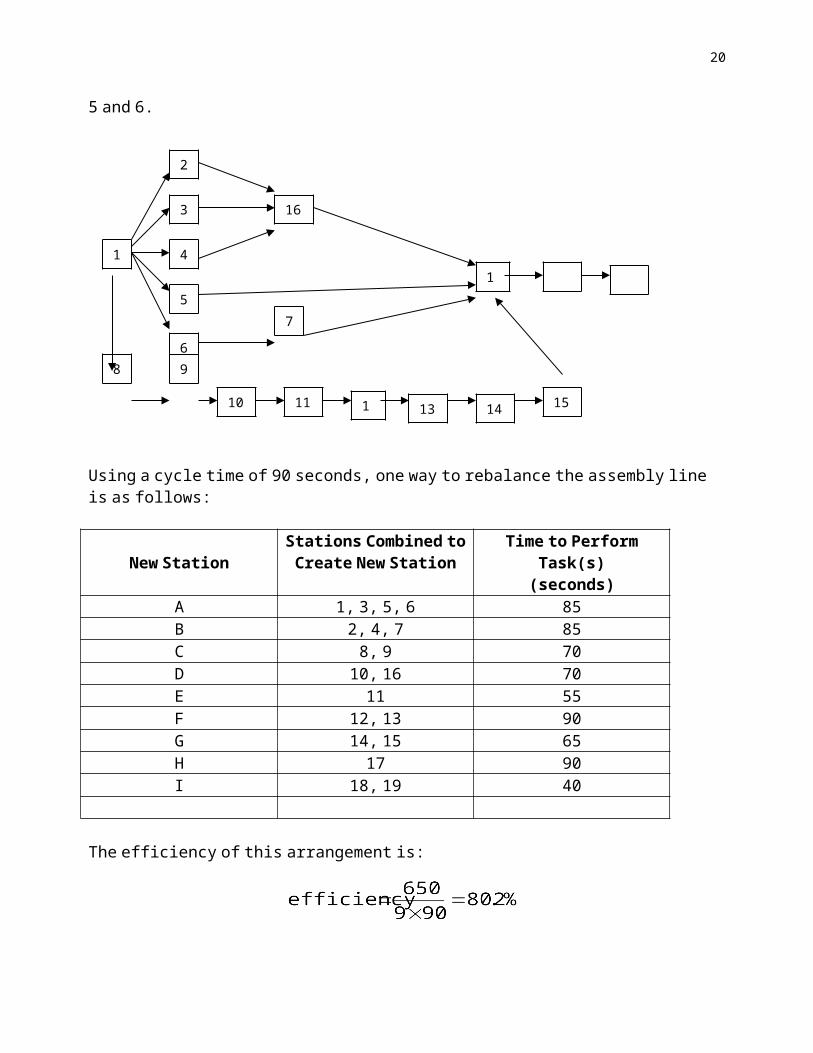
5 and 6.
Using a cycle time of 90 seconds, one way to rebalance the assembly line is as follows:
New StationStations Combined toCreate New Station
Time to Perform Task(s)(seconds)
A 1, 3, 5, 6 85B 2, 4, 7 85C 8, 9 70D 10, 16 70E 11 55F 12, 13 90G 14, 15 65H 17 90I 18, 19 40
The efficiency of this arrangement is:
This represents a 90% improvement in efficiency (i.e., an increase from 38% to 72.2%). The increase in efficiency stems from the fact that 9 fewer workers are used to produce the same 300 games per day.
Another option for rebalancing the line is to reduce the cycle time and have two parallel stations perform the work at station 17. Using this arrangement, each of the parallel stations would complete a unit every other cycle. Since station 11 has the next largest task time, its task time of 55 seconds will be used as the new cycle time.
14
2
1
6
5
4
3
8 9
16
7
10 11 12 13 14 15
17 18 19

Full file at http://TestbankCollege.eu/Solution-Manual-Operations-Management-for-MBAs-4th-Edition-Meredith
New StationStations Combined toCreate New Station
Time to Perform Task(s)(seconds)
A 1, 5 50B 2, 3 50C 4, 8 45D 6, 7 55E 9 40F 10 40G 11 55H 12 45I 13 45J 14 45K 15, 16 50L 17 45M 17 45N 18, 19 40
The efficiency of this arrangement is:
The capacity of the line based on a cycle time of 55 seconds increases to 490 games/day. Thus, compared to X-Opoly's original line, this arrangement represents a 122% increase in efficiency and a 63% increase in capacity with a 26.3% reduction in workers. On an annual basis, this arrangement has the capacity to produce 98,000 units, which would provide X-Opoly with enough capacity for the next three years. After that, X-Opoly could investigate options such as adding another line, adding a second shift or perhaps using overtime.
Discussion Outline
I. X-Opoly uses a Variety of LayoutsA. Art Department, Printing Department and Cutting Department are FunctionalB. Assembly Line is Flow Shop
II. Switching Line to Produce Another GameA. Only Property Cards and Board Decals ChangeB. No Tasks are Changed
III. Cycle Time and Efficiency of Assembly Line

IV. CapacityA. Calculating Daily CapacityB. Calculating Annual CapacityC. Capacity Compared to Demand
V. Improving the Performance of the Line
Videotapes
Videotapes can be purchased through Blockbuster, etc. We like to start the course with these when possible but not use videos too often. BE SURE you first preview the short portion of the tape you wish to show. Some of these have scenes that might be less socially acceptable now than they were at the time.
Modern Times (Charlie Chaplin, CBS/Fox #3007) Charlie on the assembly line and the problems with a paced line. Getting stuck in the machinery (safety). (A bit risqué in parts—check and edit first.)
Job Switching/Fashion Show (I Love Lucy, Vol. 2, CBS/Fox #2302)Lucy and Ethyl on a chocolates packaging line (Job Switching segment) as it speeds up and they cannot cope.
Santa’s Workshop (Disney, 1930s?) Starts off with an overview of Santa’s elves working on Christmas toys. Illustrates a job shop, flow line, functional department, etc. Excellent “pop quiz” (ungraded) for first night if you stop the video after each production process to set the tone of the course. (Stop in middle of doll assembly line segment!)
How a Car is Built (31 minutes; Think Media 212/752-2470) How a Ford Mustang is manufactured, starting from sheet steel and ending 9 miles later as the Mustang is driven away from the line. Good introduction to the assembly line process for those with little experience.
Suggested Cases/Readings
Case: E.G. & G. Sealol (A) (Hvd 9-686-045)This situation involves a job shop considering a variety of alternatives to increase their productivity: holding
more inventory, subcontracting, or forming some manufacturing cells. Case is rich in data for analyzing each of the three alternatives but strategic and tactical factors must also be considered (capacity, union reaction, competition, etc.) An excellent case for understanding the tradeoffs between different transformation systems and approaches.
Case: Mirassou Vineyards (A) (Hvd 9-673-105, TN 5-683-036)The Mirassou family is opening up a new vineyard and attempting to establish their private label wine. In the
midst of this, they are approached by an inventor of a newfangled grape-picking machine in the midst of labor troubles among their grape pickers. Involves prediction of yields, analysis of risk, cost-volume-profit analysis, advanced technology.
Case: Doré-Doré (Hvd 9-692-028, TN 5-696-045)Case concerns a French firm that is considering the move to cellular manufacturing in two of its clothing
plants. Lots of data to analyze to determine the advantages and disadvantages of cellular manufacturing. Superior case in cellular manufacturing aspect of group technology.
Case: CIGNA Corporation, Inc.: Managing and Institutionalizing Business Reengineering (Hvd 9-195-097, TN 5-396-113)
16

Full file at http://TestbankCollege.eu/Solution-Manual-Operations-Management-for-MBAs-4th-Edition-Meredith
Nice case to introduce topic of Business Process Design (reengineering) as case illustrates company that did many things right including starting small, implementing gradually, having top management support, and the use of internal consultants and so on.
Case: Pacific Bell: Centrex Reengineering (Hvd 9-195-098, TN 5-196-076)Purpose of this case is to help students better understand Business Process Design (reengineering) and
highlight key organizational enablers and inhibitors associated with these types of changes.
Case: Vandelay Industries, Inc. (9-697-037, TN 5-697-063)Case can be used to introduce students to ERP systems, evaluate the strategic implications of these systems,
and contrast two approaches for Business Process Design.
Reading: Breaking the Functional Mind-Set in Process Organizations (A. Majchrzak and Q. Wang, Harvard Business Review, Reprint 96505)
Excellent article highlighting that Business Process Design success requires more than simply reorganizing workers into process complete departments.
Reading: How to Make Reengineering Really Work (G. Hall, J. Rosenthal, and J. Wade, Harvard Business Review, Reprint 93604)
Article emphasizes that Business Process Design initiatives have to have both sufficient depth and breadth to succeed.
Reading: Reengineering Work: Don’t Automate, Obliterate (M. Hammer, Harvard Business Review, July-August 1990, pp. 104-112)
The classic reading on reengineering.
Reading: Leveraging Processes for Strategic Advantage (D.A. Garvin, Harvard Business Review, Reprint 95502)Roundtable discussion with CEO’s from Xerox, USAA, SmithKline Beecham and Pepsi. Issues addressed
include need for Business Process Design (reengineering), core competencies/capabilities, need for change in culture, employee training, the use of pilots, process owners, and so on.
Reading: Link Manufacturing Process and Product Life Cycles (R.H. Hayes et al., Harvard Business Review, Jan.-Feb. 1979, pp. 133-140, Reprint # 79107)
THE classic article on the product-process matrix and the theoretical guideline for determining how to organize the production process.
Reading: Simple and Effective Cellular Approach to a Job Machine Shop (D.L. Stoner, et al., Manufacturing Review, June 1989, pp. 119-128)
This article clearly and articulately goes through the process Schlumberger used to install cellular manufacturing in their shop. Details the implementation successes and pitfalls, and identifies the benefits of the conversion.
Reading: Managing Complex Production Processes, (A. Khurana, Sloan Management Review, Winter 1999, pp. 85-98)
Reviews the standard production approaches and gives guidance for more complex situations.
Reading: Decoding the DNA of the Toyota Production System (S. Spear and H. K. Bowen, Harvard Business Review, Sept.-Oct. 1999, pp. 95-106, Reprint # 99509)
In spite of the numerous detailed descriptions of the supremely successful Toyota Production System in the media, manufacturers still have trouble duplicating it and getting the benefits that Toyota seems to get. This article gives some reasons for this and advice to would-be imitators.

Answers to Exercises
Exercise 1
ComponentsMachines 7 5 1 2 3 6 4
4 1 1 15 1 11 1 13 1 12 1 1
Cell 1: Machines 4, 5, & 1; Components 7, 5, 1, & 2
Cell 2: Machines 3 & 2; Components 3, 6, & 4
18

Full file at http://TestbankCollege.eu/Solution-Manual-Operations-Management-for-MBAs-4th-Edition-Meredith
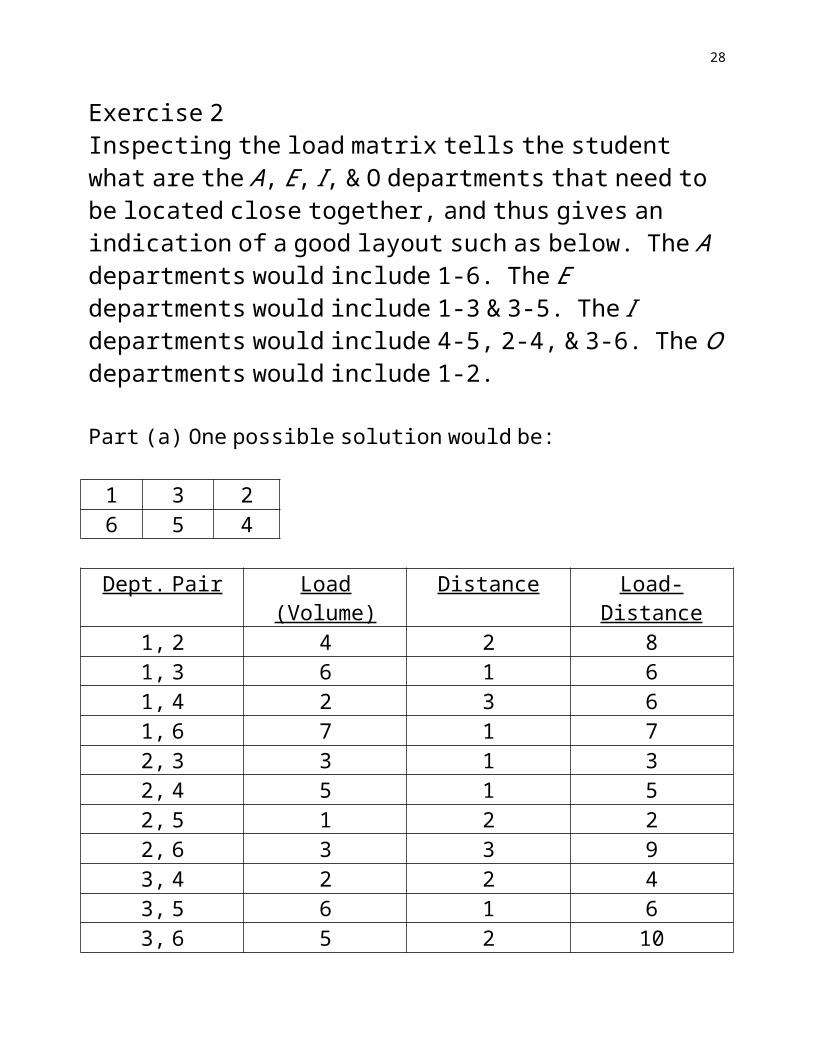
Exercise 2 Inspecting the load matrix tells the student what are the A, E, I, & O departments that need to be located close together, and thus gives an indication of a good layout such as below. The A departments would include 1-6. The E departments would include 1-3 & 3-5. The I departments would include 4-5, 2-4, & 3-6. The O departments would include 1-2.
Part (a) One possible solution would be:
1 3 26 5 4
Dept. Pair Load (Volume) Distance Load-Distance1, 2 4 2 81, 3 6 1 61, 4 2 3 61, 6 7 1 72, 3 3 1 32, 4 5 1 52, 5 1 2 22, 6 3 3 93, 4 2 2 43, 5 6 1 63, 6 5 2 104, 5 5 1 54, 6 2 2 45, 6 3 1 3
Total = 78
Part (b)
Cost-Volume Matrix: Combine costs and loads (cost x load) to determine priorities for laying out departments.
1 2 3 4 5 61 (4 x 4)
16(6 x 6)
36(4 x 2)
8(6 x 0)
0(4 x 7)
282 (5 x 3)
15(7 x 5)
35(5 x 1)
5(7 x 3)
213 (4 x 2)
8(6 x 6)
36(4 x 5)
204 (5 x 5)
25(7 x 2)
145 (4 x 3)
12
Again, identifying the A, E, I, & O departments would help the student come up with a good layout. The A departments would include 1-3, 3-5, & 2-4. The E departments would include 1-6 & 4-5. The I departments would include 2-6 & 3-6. The O departments would include 1-2, 2-3, 4-6, & 5-6. One possible solution would be:
1 3 56 2 4
20

Full file at http://TestbankCollege.eu/Solution-Manual-Operations-Management-for-MBAs-4th-Edition-Meredith
Dept. Pair CostLoad
(Volume) DistanceCost-Volume-
Distance1, 2 4 4 2 321, 3 6 6 1 361, 4 4 2 3 241, 6 4 7 1 282, 3 5 3 1 152, 4 7 5 1 352, 5 5 1 2 102, 6 7 3 3 633, 4 4 2 2 163, 5 6 6 1 363, 6 4 5 2 404, 5 5 5 1 254, 6 7 2 2 285, 6 4 3 1 12
Total = 400

Exercise 3
Current Layout
1 2 34 5 6
Distance Matrix for Current Layout
1 2 3 4 5 61 10 20 10 20 302 10 20 10 203 30 20 104 10 205 10
Proposed Layout (with departments 2 & 6 switched)
1 6 34 5 2
Distance Matrix for Proposed Layout
1 2 3 4 5 61 30 20 10 20 102 10 20 10 203 30 20 104 10 205 10
Note: Only 2 values changed (noted in bold).
22

Full file at http://TestbankCollege.eu/Solution-Manual-Operations-Management-for-MBAs-4th-Edition-Meredith
Analysis of Cost Differences – Looking at Departments 1-2 & 1-6 only
Current Layout Cost:
Departments Cost Calculation Cost1-2 40 trips * $0.02/ft. * 10 ft. = $82-1 30 trips * $0.03/ft * 10 ft. = $91-6 40 trips * $0.02/ft. * 30 ft. = $246-1 40 trips * $0.02/ft. * 30 ft. = $24
Total = $65/day
Proposed Layout Cost:
Departments Cost Calculation Cost1-2 40 trips * $0.02/ft. * 30 ft. = $242-1 30 trips * $0.03/ft * 30 ft. = $271-6 40 trips * $0.02/ft. * 10 ft. = $86-1 40 trips * $0.02/ft. * 10 ft. = $8
Total = $67/day
The proposed layout costs $2/day ($500/year) more and should not be used.

Exercise 4
• The important information in the table is:– departments 1-3 should be very close– departments 5-6 should be very close– departments 1-4 should be very far– departments 2-3 should be very far– departments 3-5 should be very far– departments 2-4 should be close– departments 4-6 should be close
24

Full file at http://TestbankCollege.eu/Solution-Manual-Operations-Management-for-MBAs-4th-Edition-Meredith
Exercise 5
Precedence Diagram:
Required Cycle Time: Σ Task Times: 20 minutesTheoretical Min. # of Workstations:
Workstation Time Available Eligible Tasks Task Assigned1 5 a a (4)
1 b, c None will fit.
2 5 b, c b (5)1 c, d None will fit.
3 5 c, d c (3)2 d, e d (2)0
4 5 e e (1)4 f None will fit.
5 5 f f (5)0 Done
Efficiency: Exercise 6

Part (a)Required Cycle Time:
Part (b) Use the LOT Rule & break ties alphabetically
Workstation Time Available Eligible Tasks Task Assigned1 10 a, b, g, h a (7)
3 b, c, g, h c (2)1 b, g, h None will fit.
2 10 b, g, h b (4)6 d, e, g, h h (4)2 d, e, g g (2)0
3 10 d, e d (8)2 e None will fit.
4 10 e e (3)7 f f (2)5 i None will fit.
5 10 i i (9)1 Done
Efficiency:
Part (c) In this example, the time for task e = 1 minute.
26

Full file at http://TestbankCollege.eu/Solution-Manual-Operations-Management-for-MBAs-4th-Edition-Meredith
Workstation Time Available Eligible Tasks Task Assigned1 10 a, b, g, h b (4)
6 a, e, g, h h (4)2 a, e, g g (2)0
2 10 a, e a (7)3 c, d, e c (2)1 d, e e (1)0
3 10 d d (8)2 f f (2)0
4 10 i i (9)1
Efficiency:
Exercise 7
ComponentsMachines 1 2 3 4 5
3 1 18 17 15 1 14 1 12 11 1 16 1
Cell 1: Machines 3, 8, & 7; Components 1 & 2
Cell 2: Machines 5, 4, 2, 1, & 6; Components 3, 4, & 5
28

Full file at http://TestbankCollege.eu/Solution-Manual-Operations-Management-for-MBAs-4th-Edition-Meredith
Exercise 8
Precedence Diagram:
Part (a)Required Cycle Time: Σ Task Times: 4.0 minutes
Theoretical Min. # of Workstations:
Task 10.4
Task 31.1
Task 40.2
Task 20.3
Task 60.3
Task 50.5
Task 70.6
Task 80.6

Use the LOT Rule:
Workstation Time Available Eligible Tasks Task Assigned1 2 1 1 (0.4)
1.6 2, 3 3 (1.1)0.5 2, 4, 6 2 (0.3)0.2 4, 5, 6 4 (0.2)0
2 2 5, 6 5 (0.5)1.5 6, 7 7 (0.6)0.9 6 6 (0.3)0.6 8 8 (0.6)0 Done
Efficiency:
30

Full file at http://TestbankCollege.eu/Solution-Manual-Operations-Management-for-MBAs-4th-Edition-Meredith
Part (b) Task 8 now requires 0.7 minutes
Workstation Time Available Eligible Tasks Task Assigned1 2 1 1 (0.4)
1.6 2, 3 3 (1.1)0.5 2, 4, 6 2 (0.3)0.2 4, 5, 6 4 (0.2)0
2 2 5, 6 5 (0.5)1.5 6, 7 7 (0.6)0.9 6 6 (0.3)0.6 8 None
3 2.0 8 8 (0.7)1.3 Done
Exercise 9
We could use Crystal Ball to simulate the times based on the normal distribution, employ the stations we determined based on the average values as above, and then see how often the task times exceeded the cycle time. We might then want to give ourselves more slack/idle time in the stations, possibly requiring more stations, in case some stations ran over the cycle time too often. Alternatively, we might move tasks around among the stations to distribute the slack/idle times that were available better and thus again minimize the frequency of stations exceeding the cycle time.