chapter – v determinants of customer...
TRANSCRIPT

150
Chapter – V
DETERMINANTS OF CUSTOMER SATISFACTION IN BANK: APPLICATION OF FACTOR ANALYSIS
5.1. INTRODUCTION
Satisfaction is an attitude or evaluation that is formed by the customer comparing
their pre-purchase expectations of what they would receive from the product to
their subjective perceptions of the performance they actually did receive. Several
authors have defined satisfaction in a different way. Satisfaction is a person’s
feeling of pleasure or disappointment resulting from comparing a product’s
perceived performance (or outcome) in relation to his or her expectations. It is a
function of consumer’s belief that he or she was treated fairly. Satisfaction is
determined by the discrepancy between perceived performance and cognitive
standards such as expectations and desires. Customers’ expectation can be defined
as customer’s pretrial beliefs about a product. Expectations are viewed as
predictions made by consumers about what is likely to happen during impending
transaction or exchange. Perceiver performance is defined as customer’s
perception of how product performance fulfills their needs, wants and desire.
Customer satisfaction is a function of perceived quality and disconfirmation – the
extent to which perceived quality fails to match repurchase expectations.
Customers compare the perceived performance of a product (service, goods) with
some performance standard. Customers are satisfied when the perceived

151
performance is greater than the standard (positively disconfirmed), whereas
dissatisfaction occurs when the performance falls short of the standard (negatively
disconfirmed). It is a collective outcome of perception, evaluation and
psychological reactions to the consumption experience with a product/service. It is
a measure of how products and services supplied by a company to meet or surpass
customer expectation. It is the provision or transfer of goods, services and ideas in
return for something of value.
Customer Satisfaction is the gratification or the state of feeling pleasure or the act
of fulfilling a need or desire of customers. It is the degree to which there is match
between the customer's expectations and the actual performance. Satisfying
customer means (i) knowing the customers, their needs, testes and preferences (ii)
delivering services as per their requirements with a view to minimize actual and
expectation gap for changing their perception towards the services, which will
pave the way to enhanced customer satisfaction level.
It is considered to be one of the most important competitive factors for the future,
and is the best indicator of a bank’s profitability, which drives a firm to improve
their reputation and image, to reduce customer turnover, and to increase attention
to customer needs. For a banking industry, the whole spectrum of activity and
income generation revolves round the customer. Customer service is of paramount
importance if banks have to survive and thrive in the present competitive
environment. The dynamic nature of the market, coupled with an increased
number of more demanding and affluent consumers, brought greater challenges to
bankers in retaining their customers.
Customer satisfaction is the only ‘mantra’ for banks for its sustainable growth and
152
development. In today’s competitive marketing environment, when customers
have many alternatives to choose from to better satisfy their needs, customer
loyalty is crucial for banks. Customers who are just satisfied find it easy to switch
service provider when a better offer comes along. As a result, the significance of
customer satisfaction is emphasized in markets where competition is intense. A
dissatisfied or merely satisfied customer is likely to switch over but highly
satisfied customer is likely to stay on due to brand loyalty. Customer satisfaction is
considered to affect customer retention and, therefore, competitiveness in banks.
Complete customer satisfaction is the key to securing customer loyalty and
generating superior long-term banking performance. It is also apparent that high
customer satisfaction leads to the strengthening of the relationship between a
customer and a bank, and this deep sense of collaboration has been found to be
profitable. The biggest challenge to Indian banks comes not from trade unions or
foreign banks but from customers who are demanding more. Rising expectations
from the customers and narrow margins of profit are challenges before the banking
industry as a whole.
There are overwhelming arguments that it is more expensive to win new
customers than to keep existing ones. Customer satisfaction is the base for
business expansion of the stiff competition prevalent in the banking industry. With
the advent of new banks in 1995, the concept of customer service has become an
important and pivotal issue in banks irrespective of public sector or private sector.
The survival of banking business is dependent on customer satisfaction. The focal
point of any service organization is customer satisfaction, more so in the banking
sector. The phrases such as ‘customer is the king of the businesses, ‘service to
customer is service to god’ is no more myth but turned out to reality for banking

153
sector. There are some controllable and uncontrollable factors directly or
indirectly affecting the level of customer satisfaction from the services rendered
by the banks.
Against this backdrop, the present chapter is exclusively aimed at identifying the
determinants of customer satisfaction from the services offered by the banks in the
area under study.
5.2. OBJECTIVE
The objective of the present chapter is –
To identify the factors responsible for determining the customer
satisfaction in respect of banking services.
5.3. METHODOLOGY: TOOL AND TECHNIQUES USED In order to determine the number of factors influencing customer satisfaction in
banks under the study and to know the relative strength of the each factor in
influencing the customer’s satisfaction level, the Factor Analysis (FA) was
performed with the help of SPSS software (version-15). To identify the common
dimensions of the variables, factor analysis technique has been applied. Factor
Analysis was used to identify the underlying dimensions or factors that actually
contribute to a number of observed attributes. It is a statistical approach that can
be used to analyze interrelationships among a large number of variables and to
explain these variables in terms of their common underlying dimensions (factors).
The statistical approach involves finding a way of condensing the information
contained in a number of original variables into a smaller set of dimensions
(factors) with a minimum loss of information.

154
5.4. FACTOR ANALYSIS The first step involves calculation of correlation matrix which exhibited the
interrelationship among the observed variables. To extract minimum number
of factors, Principal Component Analysis (PCA) with varimax rotation was
used. A Principal Component Analysis is a factor model in which the factors
are based upon the total variance. In addition to selecting the factor model, we
have specified how the factors are to be extracted in such a way that each factor
is independent of all other factors. Therefore, the correlation between the
factors is arbitrarily determined to be zero.
Further, to decide the number of factors to be extracted, the most commonly
used technique is referred as the latent root (eigen values) representing the
extent of variance in data. Now we have to interpret the factors, i.e., with
factor loading which were greater then 0.30 (ignoring the negative sings) and
loaded them in the extracted factors (Hair et. al, 2008). A factor loading is the
correlation between the original variables and the factors squared factor loading
indicate what percentage of the variance in an original variable is explained by
a factor. Finally, the factors based on appropriateness for representing the
underlying dimensions of a particular interpretation were suitably named. They
strongly influence the name or level selected to represent a factor. The 25
variables used for the factor analysis were coded. Moreover, to study the
appropriateness of factor analysis Kaiser-Meyer-Olkin (KMO) and Bartlett's
test statistic was used. If, the KMO value is greater than 0.6 is considered as
adequate (Kaiser and Rice, 1974).

155
Further, KMO measures the magnitude of observed correlation coefficients. A
value of greater then 0.5 is desirable. Bartlett's test measures the correlation of
variables. A probability of less than 0.5 is acceptable (Singh and Jain, 2009).
Table - 5.1: KMO and Bartlett's Test Result for Customer Satisfaction
Kaiser-Meyer-Olkin Measure of Sampling Adequacy .861
Bartlett's Test of Sphericity Approx. Chi-Square 4044.193
df 300
Sig. .000
Source: Computed from Primary Data.
From the table, it can be seen that KMO value is acceptable. Bartlett’s test result
also showed that the values were significant and thus acceptable. The items in the
respective category were individually subjected to Principal Component Analysis
(PCA) with varimax rotation and Kaiser Normalization using SPSS (version 15).
The items having factor loading less than 0.30 were eliminated (Hair et. al., 1995).
Finally, 7 factors comprising 25 items, all having eigen values of unity and above
were extracted and the results are shown. Further, in order to assess the
appropriateness of the data for factor analysis, the commonalities derived from the
factor analysis were reviewed. These were relatively larger (greater than 0.5),
suggesting that the data were appropriate (Stewart, 1981). The individual
dimensions of proposed instruments explained total variance exceeding 60 per
cent, suggesting the appropriateness of the process.
We have also tested the reliability of items by computing the coefficient alpha
(Cronbach, 1951), measuring the internal consistency of the items.
156
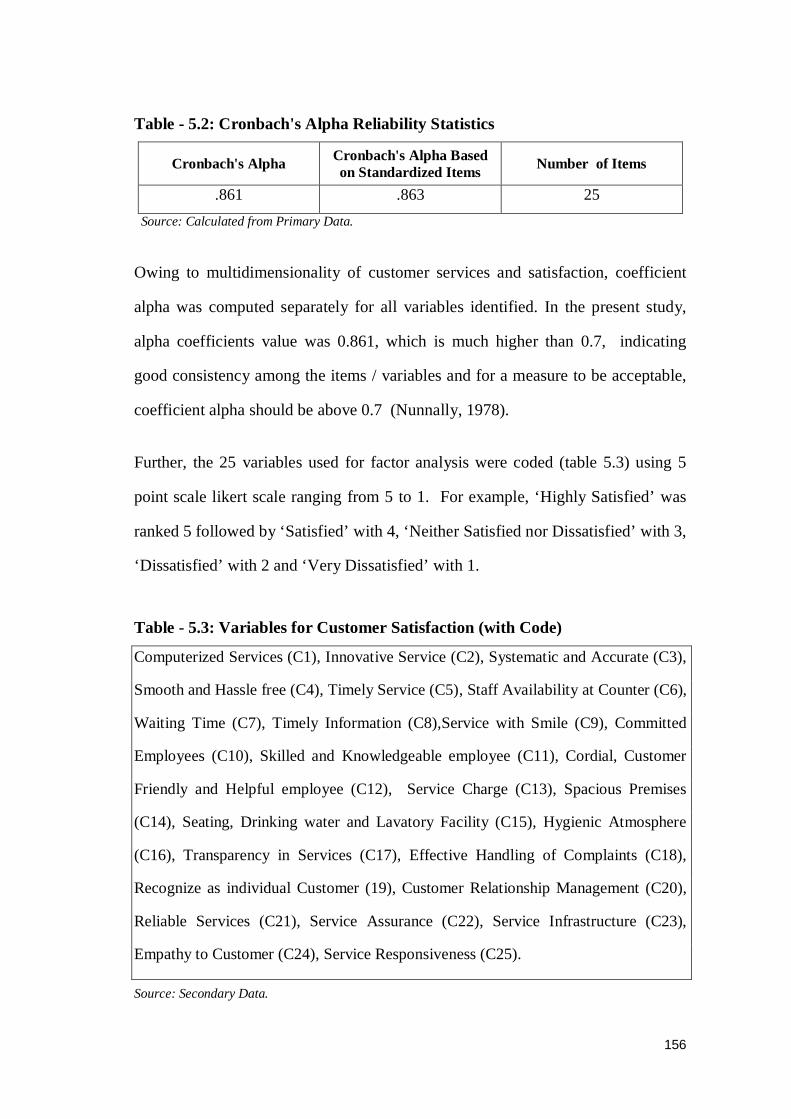
Table - 5.2: Cronbach's Alpha Reliability Statistics
Cronbach's Alpha Cronbach's Alpha Based on Standardized Items Number of Items
.861 .863 25 Source: Calculated from Primary Data.
Owing to multidimensionality of customer services and satisfaction, coefficient
alpha was computed separately for all variables identified. In the present study,
alpha coefficients value was 0.861, which is much higher than 0.7, indicating
good consistency among the items / variables and for a measure to be acceptable,
coefficient alpha should be above 0.7 (Nunnally, 1978).
Further, the 25 variables used for factor analysis were coded (table 5.3) using 5
point scale likert scale ranging from 5 to 1. For example, ‘Highly Satisfied’ was
ranked 5 followed by ‘Satisfied’ with 4, ‘Neither Satisfied nor Dissatisfied’ with 3,
‘Dissatisfied’ with 2 and ‘Very Dissatisfied’ with 1.
Table - 5.3: Variables for Customer Satisfaction (with Code)
Computerized Services (C1), Innovative Service (C2), Systematic and Accurate (C3),
Smooth and Hassle free (C4), Timely Service (C5), Staff Availability at Counter (C6),
Waiting Time (C7), Timely Information (C8),Service with Smile (C9), Committed
Employees (C10), Skilled and Knowledgeable employee (C11), Cordial, Customer
Friendly and Helpful employee (C12), Service Charge (C13), Spacious Premises
(C14), Seating, Drinking water and Lavatory Facility (C15), Hygienic Atmosphere
(C16), Transparency in Services (C17), Effective Handling of Complaints (C18),
Recognize as individual Customer (19), Customer Relationship Management (C20),
Reliable Services (C21), Service Assurance (C22), Service Infrastructure (C23),
Empathy to Customer (C24), Service Responsiveness (C25).
Source: Secondary Data.

157
5.4.1. Inter-correlation Matrix
The results of factor analysis are shown here and initially the inter-correlation
among the variables were calculated and presented in the table (table 5.4). Almost
all the cases, correlation coefficient of variables were found statistically
significant, hence included as the factor influencing the level of customer
satisfaction in respect of banking services.
Further, the table (table 5.5) exhibited the variable of column 1, which was not
correlated with or negatively correlated with the specific variable(s) of column 2.
Table - 5.5: Variables not Correlated with
Variables Not correlated with the variable(s) Computerized services (C1) (C19), Innovative service (C2) (C11), (C13)*, (C17), (C18), (C21)*, (C22) Systematic and Accurate services (C3) (C11), (C13), (C17), (C18), Smooth, hassle free (C4) (C17), (C21) Timely services (C5) (C7) Staff availability at counter (C6) (C20) Waiting time (C7) (C11), (C13) Timely information (C8) (C11)*, (C13), (C17), (C21) Service with smile (C9) (C17)* Commitment of Employee (C10) (C24) Skilled, Knowledgeable Employee (C11) (C16)*, (C19)*, (C20)*, (C23) Cordial, customer friendly, helpful employee (C12) (C20) Service charge (C13) (C19), (C20) Hygienic atmosphere (C16) (C17), (C21)* Transparency in services (C17) (C20)* Effective handling of complaint (C18) (C19), (C20) Recognize as individual customer (C19) (C21) CRM (C20) (C21)*
Figures in parentheses showing code number of variable. * Negatively correlated variable. Source: Computed from Primary Data.

158
Figure - 5.1: Scree Plot showing the Eigen Values
The scree test was used to identify the optimum number of factors that can be
extracted before the amount of unique variance begins to dominate the common
variance structure. The scree test was derived by plotting the latent roots against
the number of factors in their order of extraction, and the shape of the resulting
curve was used to evaluate the cutoff point (Cattel, 1966). The scree plot
demonstrated (Figure 5.1) the eigen values for initial 25 components or factors
extracted in the study. Starting with the first factor, the plot slopes steeply
downward initially and then slowly became an approximately horizontal line. The
point at which the curve first begins to straighten out was considered to indicate
the number of factors to extract. In the present case, as we have the eigen value
more than 1, hence, 7 factors have been considered. All factors beyond 1 for
which these eigen value level off were excluded from consideration (Cattel and
Vogelman, 1977).

159
Table - 5.4: Inter-Correlation of Variables C1 C2 C3 C4 C5 C6 C7 C8 C9 C10 C11 C12 C13 C14 C15 C16 C17 C18 C19 C20 C21 C22 C23 C24 C25
C1 1
C2 .47* 1
C3 .36* .39* 1
C4 .31* .34* .25* 1
C5 .20* .22* .24* .16* 1
C6 .18* .11* .16* .26* .21* 1
C7 .28* .24* .29* .16* .25 .01* 1
C8 .30* .34* .26* .22* .19* .08* .42* 1
C9 .25* .32* .37* .26* .20* .21* .30* .26* 1
C10 .16* .13* .18* .16* .30* .26* .21* .18* .25* 1
C11 .16* .04 .01 .23* .21* .34* .07 -.02 .17* .18* 1
C12 .18* .13* .09* .10* .20* .28* .10* .10* .13* .18* .32* 1
C13 .08* -.01 .01 .16* .18* .21* .08 .04 .13* .12* .40* .24* 1
C14 .23* .14* .23* .20* .13* .17* .16* .19* .24* .14* .12* .15* .08* 1
C15 .35* .30* .24* .28* .21* .17* .18* .46* .20* .26* .16* .23* .14* .18* 1
C16 .40* .32* .31* .36* .20* .08* .21* .34* .32* .12* -.02 .14* .10* .36* .28* 1
C17 .15* .01 .06 .06 .21* .27* .13* .02 -.0 .10* .28* .37* .31* .11* .11* .08 1
C18 .18* .06 .08 .15* .12* .16* .11* .11* .14* .21* .36* .30* .44* .13* .25* .09* .28* 1
C19 .06 .21* .18* .22* .20* .11* .20* .28* .29* .27* -.01 .15* .02 .19* .17* .25* .02* .04 1
C20 .28* .38* .27* .27* .11* .06 .26* .49* .32* .11* -.04 .03 .00 .23* .30* .37* -.05 .01 .34* 1
C21 .10* -.00 .09* .07 .15* .29* .11* .06 .09* .23* .25* .26* .29* .11* .15* -.03 .41* .35* .00 -.03 1
C22 .12* .08 .21* .09* .30* .18* .26* .21* .15* .19* .14* .12* .24* .22* .25* .14* .21* .24* .19* .16* .27* 1
C23 .38* .31* .24* .29* .26* .25* .17* .31* .22* .24* .05 .18* .13* .23* .38* .37* .13* .11* .24* .36* .12* .14* 1
C24 .14* .15* .20* 0.20* .12* .25* .26* .35* .23* .07 .15* .21* .12* .18* .28* .19* .22* .28* .19* .19* .18* .29* .24* 1
C25 .33* .24* .26* .30* .27* .22* .27* .37* .29* .24* .13* .35* .20* .25* .38* .35* .23* .22* .27* .28* .21* .25* .41* .41* 1
*Correlation is significant at the 0.05 level (2-tailed). N=612. Source: Calculated from Primary Data.
160
5.4.2. Principal Factors
The inter-correlation analysis suggests that out of 25 variables 7 were closely
related as the values of correlation co-efficient were relatively high in their cases.
This indicated that all these variables could be reduced to 7 factors. These
variables demonstrated higher correlation coefficients and were statistically
significant at 5 percent level. The meaningful way was to look for substantive
significance by deciding on the minimum contribution a factor should make 5
percent (Cattel, and Vogelman, 1977).
The table (table 5.6) represents the results of factor analysis performed to the set
of data by principal component analysis with varimax rotation – a method which
is very frequently used in factor analysis. One frequently used procedure is
factoring the original correlation to determine the number of factors for which the
sum of squares (eigen value) of loading for all variables on each factor exceeds 1.0
separately. This was an eigen value specification, which sets a minimum. A factor
explains at least the amount of variance that a truly independent variable could
contribute, and then each variable would be a factor (Kaiser, 1958).
Further, most commonly used technique is the latent root criterion. This technique
is simple to apply to either component analysis or common factor analysis. The
rational for the latent root criteria is that any individual factor should account for
the variance of at least a single variable if it is to be retained for interpretation.
With component analysis each variable contributes a value of 1 to the total eigen
value. Thus, only the factors having latent roots or eigen value greater than 1 were
considered significant; all factors with latent roots less than 1 were considered
insignificant and hence disregarded. Using the eigen value for establishing a cutoff
is most reliable when the number of variables is between 20 and 50 (Hair et. al,
2008).

161
In the present study 25 variables were considered. Hence, based on the eigen value
(above 1), 7 factors were identified (table 5.6). The output of the factor analysis
was obtained by requesting principal component analysis and specifying rotation.
The table gives eigen values, variance explained, and cumulative variance
explained for our factor solution. The Extraction Sums of Squared Loadings group
gives information regarding the extracted factors or components. Again, we have
requested a factor rotation; therefore we see the results in the “Rotation Sums of
Squared Loadings” group.
Table - 5.6: Total Variance Explained
Component Initial Eigen values Extraction Sums of
Squared Loadings Rotation Sums of Squared Loadings
Total % of Variance
Cumulative % Total % of
Variance Cumulative
% Total % of Variance
Cumulative %
1 5.958 23.831 23.831 5.958 23.831 23.831 2.757 11.029 11.029
2 2.658 10.630 34.461 2.658 10.630 34.461 2.340 9.359 20.388
3 1.306 5.223 39.684 1.306 5.223 39.684 2.135 8.540 28.929
4 1.187 4.746 44.430 1.187 4.746 44.430 2.087 8.347 37.276
5 1.084 4.338 48.768 1.084 4.338 48.768 1.727 6.910 44.186
6 1.045 4.181 52.949 1.045 4.181 52.949 1.674 6.697 50.883
7 1.010 4.042 56.990 1.010 4.042 56.990 1.527 6.108 56.990 8 .925 3.701 60.691
9 .882 3.529 64.220
10 .841 3.363 67.583
11 .763 3.051 70.634
12 .733 2.933 73.567
13 .710 2.841 76.408
14 .672 2.689 79.098
15 .592 2.368 81.466
16 .560 2.241 83.707
17 .552 2.208 85.915
18 .529 2.117 88.032
19 .507 2.028 90.059
20 .475 1.900 91.960
21 .464 1.858 93.817
22 .457 1.829 95.647
23 .405 1.618 97.265
24 .346 1.383 98.648
25 .338 1.352 100.000
Extraction Method: Principal Component Analysis. Source: Calculated from Primary Data.

162
The first step in interpreting the output was to look at the factors extracted, their
eigen values and the cumulative percentage of variance. We could see from the
cumulative percentage column that the importance of the attributes (i.e. 7 factors)
extracted together account for 57 % of the total variance (information contained in
the original 25 variables). This indicates that we lost only 43% of the information
contained into the original variable. Now, the most important thing was that of
interpreting what these 7 extracted factors represent.
In a sample of 100 respondents, factor loading of 0.55 and above are significant.
However, in a sample of 50, a factor loading of 0.75 is required for significance.
In comparison with the prior rule of thumb, which denoted all loadings of 0.30 and
above as having practical significance, this approach would consider loadings of
0.30 significant only for sample sizes of 350 or greater (Hair et. al, 2008).
In the present context, since 612 numbers of respondents from banks were
considered, hence all loadings (ignoring sign) of 0.30 and above were having
practical significance and relevance. But, in a given row, against a specific
variable, the highest value has been considered as per the rule of thumb (table 5.7).
Table - 5.7: Factor Loadings along with Eigen Values
Code Variables Factor (F)
F1 F2 F3 F4 F5 F6 F7
C8 Timely Information 0.711 0.209 -0.074 0.004 0.03 0.06 0.324
C15 Seating, Drinking water, Lavatory facility 0.641 0.287 0.148 0.192 -0.133 0.143 0.036
C20 Customer Relationship Management 0.584 0.241 -0.222 -0.038 0.276 0.084 0.114
C25 Service Responsiveness 0.544 0.162 0.374 0.075 0.236 0.127 0.093
C23 Service Infrastructure 0.514 0.344 0.268 -0.061 0.133 0.242 -0.16
C24 Empathy to Customer 0.504 -0.097 0.256 0.196 0.286 -0.115 0.267
C1 Computerized Services 0.206 0.775 0.19 0.086 0.057 -0.019 0.054
C2 Innovative Service 0.266 0.686 -0.094 0.022 0.083 0.141 0.048
C3 Systematic and Accurate Service 0.02 0.554 0.036 -0.055 0.315 0.167 0.362
C4 Smooth and Hassle free Service 0.269 0.381 -0.098 0.353 0.347 0.145 -0.206
C17 Transparency in Services -0.01 0.041 0.739 0.19 0.039 -0.022 0.129
C12 Cordial, Customer Friendly Helpful Employee 0.193 0.066 0.565 0.223 0.081 0.163 -0.11
C21 Reliable Services -0.013 -0.03 0.56 0.294 -0.024 0.139 0.233

163
C6 Staff Availability at Counter 0.018 0.077 0.402 0.258 0.306 0.384 -0.212
C11 Skilled and Knowledgeable Employee -0.101 0.093 0.191 0.734 0.064 0.183 -0.069
C13 Service Charge 0.052 -0.03 0.201 0.709 0.037 0.027 0.086
C18 Effective Handling of Complaints 0.186 0.014 0.239 0.683 -0.044 -0.043 0.18
C14 Spacious Premises 0.08 0.134 0.209 0.006 0.698 -0.036 0.126
C16 Hygienic Atmosphere 0.354 0.431 0.059 -0.043 0.483 -0.039 0.009
C9 Service with Smile 0.122 0.279 -0.204 0.265 0.474 0.294 0.236
C10 Committed Employees 0.136 0.078 0.096 0.131 -0.037 0.751 0.112
C5 Timely Service 0.031 0.263 0.265 0.029 -0.007 0.558 0.267
C19 Recognize as individual Customer 0.415 -0.154 -0.12 -0.065 0.399 0.497 0.07
C7 Waiting Time 0.222 0.261 -0.017 0.051 0.055 0.115 0.676
C22 Service Assurance 0.161 -0.08 0.259 0.148 0.168 0.177 0.577
Extraction Method: Principal Component Analysis. Rotation Method: Varimax with Kaiser Normalization. Source: Computed from Primary Data.
It is noticed from the above table that timely information; seating, drinking
water and lavatory facility; CRM; service responsiveness; service
infrastructure; and empathy to customer; had loadings 0.711, 0.641, 0.584,
0.544, 0.514 and 0.504 respectively on factor 1 (F1) which suggested that
factor 1 was a combination of these six variables.
Again, factor 2 (F2) is a group of 4 variables include computerized
services; innovative service; systematic and accurate service; and smooth
and hassle free service; with loadings 0.775, 0.686, 0.554, and 0.381
respectively.
The 3rd factor (F3) constitutes of transparency in services; cordial customer
friendly and helpful employee; reliable services; and staff availability at
counter; had loads 0.739, 0.565, 0.560 and 0.402 respectively.
In factor 4 (F4) we find that it is a blending of skilled and knowledgeable
employee; service charge; and effective handling of complaints; had loads
0.734, 0.709 and 0.683 respectively.
Again, factor 5 (F5) is a combination of spacious premises; hygienic
atmosphere; and service with smile; had loads 0.698, 0.483, and 0.474
respectively.

164
For factor 6 (F6) we find that it is grouping of committed employees;
timely service; and recognize as individual customer; had loadings 0.751,
0.558 and 0.497 respectively.
In factor 7 (F7) we see that it is a combination of waiting time; and service
assurance; had loads 0.676 and 0.577 respectively.
5.5. DETERMINANTS OF CUSTOMER SATISFACTION The table (table 5.7) exhibited the factor loadings along with eigen values. It
confirmed close relationship of all variables with 7 underlined factors. These are
clustered as under (table 5.8).
Table - 5.8: Influencing Factors of Bank Customer Satisfaction
Factor – 1 Factor – 2 Factor – 3 Factor – 4 Factor – 5 Factor – 6 Factor – 7 Routine
Operation factor
Technology Factor
Human Factor
Management Factor
Environmental Factor
Behavioral Factor
Interactive Factor
C8. Timely information
C1. Computerized services
C17. Transparenc
y in services
C11. Skilled and knowledgeable people
C14. Spacious premises
C10. Committed employees
C7. Waiting time
C15. Seating, drinking water,
lavatory facility
C2. Innovative
services
C12. Cordial, customer friendly helpful
employee
C13. Service charge
C16. Hygienic
atmosphere
C5. Timely service
C22. Service
assurance
C20. Customer
relationship management
C3. Systematic
and accurate service
C21. Reliable services
C18. Effective
handling of complaints
C9. Service with smile
C19. Recognize
as individual customer
C25. Service
responsive ness
C4. Smooth and hassle free service
C6. Staff availability at counter
C23. Service
infrastructure
C24. Empathy to customer
Source: Determined from Primary Data.
165
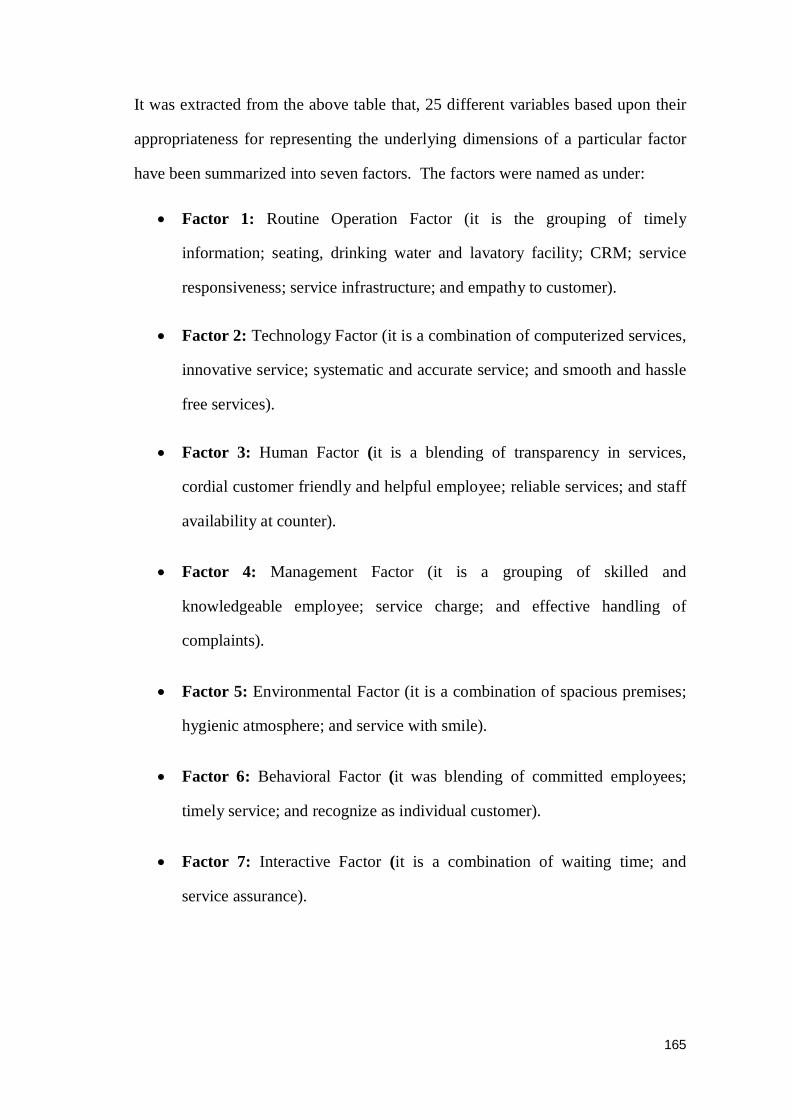
It was extracted from the above table that, 25 different variables based upon their
appropriateness for representing the underlying dimensions of a particular factor
have been summarized into seven factors. The factors were named as under:
Factor 1: Routine Operation Factor (it is the grouping of timely
information; seating, drinking water and lavatory facility; CRM; service
responsiveness; service infrastructure; and empathy to customer).
Factor 2: Technology Factor (it is a combination of computerized services,
innovative service; systematic and accurate service; and smooth and hassle
free services).
Factor 3: Human Factor (it is a blending of transparency in services,
cordial customer friendly and helpful employee; reliable services; and staff
availability at counter).
Factor 4: Management Factor (it is a grouping of skilled and
knowledgeable employee; service charge; and effective handling of
complaints).
Factor 5: Environmental Factor (it is a combination of spacious premises;
hygienic atmosphere; and service with smile).
Factor 6: Behavioral Factor (it was blending of committed employees;
timely service; and recognize as individual customer).
Factor 7: Interactive Factor (it is a combination of waiting time; and
service assurance).
166
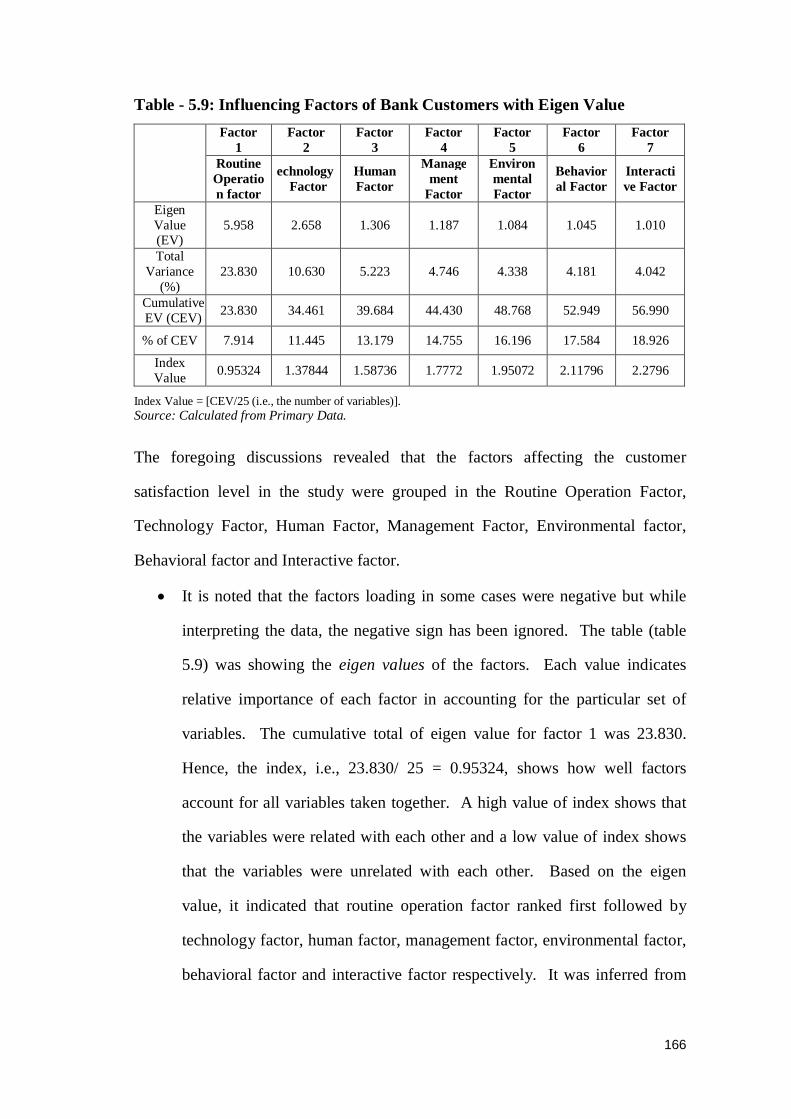
Table - 5.9: Influencing Factors of Bank Customers with Eigen Value
Factor 1
Factor 2
Factor 3
Factor 4
Factor 5
Factor 6
Factor 7
Routine Operation factor
echnology Factor
Human Factor
Management
Factor
Environmental Factor
Behavioral Factor
Interactive Factor
Eigen Value (EV)
5.958 2.658 1.306 1.187 1.084 1.045 1.010
Total Variance
(%) 23.830 10.630 5.223 4.746 4.338 4.181 4.042
Cumulative EV (CEV) 23.830 34.461 39.684 44.430 48.768 52.949 56.990
% of CEV 7.914 11.445 13.179 14.755 16.196 17.584 18.926
Index Value 0.95324 1.37844 1.58736 1.7772 1.95072 2.11796 2.2796
Index Value = [CEV/25 (i.e., the number of variables)]. Source: Calculated from Primary Data.
The foregoing discussions revealed that the factors affecting the customer
satisfaction level in the study were grouped in the Routine Operation Factor,
Technology Factor, Human Factor, Management Factor, Environmental factor,
Behavioral factor and Interactive factor.
It is noted that the factors loading in some cases were negative but while
interpreting the data, the negative sign has been ignored. The table (table
5.9) was showing the eigen values of the factors. Each value indicates
relative importance of each factor in accounting for the particular set of
variables. The cumulative total of eigen value for factor 1 was 23.830.
Hence, the index, i.e., 23.830/ 25 = 0.95324, shows how well factors
account for all variables taken together. A high value of index shows that
the variables were related with each other and a low value of index shows
that the variables were unrelated with each other. Based on the eigen
value, it indicated that routine operation factor ranked first followed by
technology factor, human factor, management factor, environmental factor,
behavioral factor and interactive factor respectively. It was inferred from

167
the analysis that the respondents were emphasizing more on Routine
Operations of banks offering services in the area under study.
The eigen value of Routine Operation Factor ranked the highest (eigen
value = 5.958) indicating the satisfactions level of the customers. In regard
to timely information; seating, drinking water and lavatory facility; CRM;
service responsiveness; service infrastructure; and empathy to customer etc.
were not appreciable.
The Technology Factor which was second in the list (eigen value = 2.658)
generates slight satisfaction because the customers feel that they were not
getting enough through computerized services. Innovative services were
not offered them frequently and banking services were not very systematic
and accurate in true sense. Services rendered by the banks were not very
smooth and hassle free. In connection with the technology factor, much had
not been done and banks in the area under study are yet to step forward in
adopting modern technology up-gradation in the bank branches like full-
computerization, innovativeness in offering new services etc. to survive in
the present day world of competition. Innovativeness and mechanization is
the need of the hour, but banks in the districts under study was showing a
dismal service performance in this respect. All the branches of all the
banks had not fully computerized their operations and were stuck on to
manual computations and calculations which increased the work load and
reduced the efficiency of the staff. The technology up-gradation,
innovativeness of new services etc. were essential in this respect.
In the context of Human Factor (eigen value = 1.306), again the satisfaction
level was slight. It included transparency in services; cordial, customer
friendly and helpful employees; reliable services and staff availability at
counter. It means that, banks in the area under study were not making an
168
extra effort to ensure transparency in services. The employees were not
very cordial, customer friendly and helpful. The banks could not offer
reliable services in actual sense. Availability of staff at the counter was not
very satisfactory. So, the customers were slightly satisfied as far as human
factor of the bank came into picture.
The Management Factor (eigen value = 1.187), which included skilled and
knowledgeable employees; service charge and effective handling of
complaints. In this context it can be stated that, the skill and knowledge
level of the service provider was not up to the customer’s expectation. In
connection with the service charge, in some cases it was relatively higher.
Sometimes, the banks fail to handle the customer’s complaints effectively
and efficiently.
The other factor which yields poor satisfaction was Environmental Factor
(eigen value = 1.084). It was observed that the banks operating in the area
under the study are yet to make full efforts to improve the environmental
factors which included spacious premises; hygienic atmosphere; and
service rendered with smile by the bank employees etc. The bank’s
condition with regard to the environmental factors which are well within
the control of the banks. But, necessary steps have not been taken to
improve the environmental condition of banks in general.
Behavioral Factor (eigen value= 1.045) is the combinations of variables
like committed employees; timely service; and recognize as individual
customer. As far as the behavioral factor of employees is concerned, the
commitment level of employees in rendering services and with a view to
satisfy customer, more efforts are needed to put. Services must be rendered
without wasting the valuable time of customers. Bank employee should try

169
to recognize the individual customer which was not prominently visible in
the bank.
The Interactive Factor (eigen value = 1.010) pertaining to waiting time and
service assurance by the bank employees indicating moderate level of
satisfaction. It revealed that waiting time for having services in the banks is
more than expected and service assurance from the employees is less than
customer’s expectation.
5.6. FACTOR WISE CUSTOMER SATISFACTION LEVEL
Factor wise satisfaction level of customers is calculated using mean/average score,
which reflected that in some cases customers are modestly satisfied and some
cases they are slightly satisfied from the services delivered by the bank in the area
under the study. Following table (table 5.10) exhibited the mean value/average
score of all the underlying factors. It also highlighted the level of satisfaction
(LOS) and factor ranking based on mean value.
Table - 5.10: Factor Ranking
Factor Name of the Factor Mean Value LOS Factor Ranking
Factor – 1 Routine Operation Factor 2.81 Slight 1
Factor – 2 Technology Factor 2.82 Slight 2 Factor – 3 Human Factor 3.28 Modest 7 Factor – 4 Management Factor 3.24 Modest 6 Factor – 5 Environmental Factor 2.9 Slight 3 Factor – 6 Behavioral Factor 3.02 Modest 4 Factor – 7 Interactive Factor 3.03 Moderate 5
Mean value is calculated against all the variables under a particular factor. Factor ranking is based on mean value of all the variables under a particular factor. Source: Calculated from Primary Data.
Mean value of each factor is calculated based on the average/mean value of all
variables included under a particular factor. Further, factor ranking has been done

170
based on lowest mean value. More emphasis should be given on the factor having
relatively low mean value when strategies would be adopted.
The factor wise average score revealed that none of the variables ranked 4.00 and
above which indicates that the customers of banks in regard to the service
rendered was quite dismal. They are either modestly satisfied or slightly satisfied
from the services. The routine operation factor indicates the daily functional
processes that the banks failed to serve the customers fully. The factor wise
average scores in respect of technology factors and environmental factors revealed
that the customers are turned to be dissatisfied lot. It is because of the fact that,
banks are unable to improve the quality standards. In technology front, banks in
the area under the study are lagging behind. The rural areas of the districts under
study are still un-varied for by the banks and rural masses are yet to enjoy modern
banking facilities. From the above analysis it is evident that banks in the districts
need to adopt certain specific marketing strategies in order to survive in the
present globalization environment and in the world of competition.
5.7. CONCLUSION
Majority of the service variables are correlated with each other in connection with
the banking services. But, some of the specific variables are not correlated with
each other and some of them are negatively correlated. All 25 service variables are
categorized under 7 major factors responsible for customer satisfaction from the
banking services. These factors are named as routine operation factor (factor 1);
technology factor (factor 2); human factor (factor 3); management factor (factor
4); environment factor (factor 5); behavioral factor (factor 6); and interactive
factor (factor 7). Further, based on mean value of all the variables under a
particular factor, factor ranking has been made. Factor with lowest mean value is

171
given the first priority as far as strategic issues of banks are concerned.
Accordingly, the routine operation factor ranked first out of 7 factors. So, more
emphasis should be given to routine operation factor followed by technology
factor, environmental factor, behavioral factor, interactive factor, management
factor and human factor of the bank respectively.
From the foregoing analysis it is inferred that 7 factors or determinants give the
shape to the customer satisfaction in respect of services rendered by the banks
operating in the area under the study. This indicates, in the hypercompetitive
environment, survival of banks depends on to what extent they are adapted to
these changing environment and emphasized on the principal factors that
determine the plight of banking operations. The strategy therefore would be to
immediately address the issue.
REFERENCES
Cattel, R. B. (1966). The Scree Test for the Number of Factors.
Multivariate Behavioral Research, April, 1, 245-276.
Cattel, R. B. & Vogelman, S. (1977). A Comprehensive trial of the Scree
and the K G Criteria for Determining the Number of Factors. Multivariate
Behavioral Research, 289-325.
Cronbach, L. J. (1951). Coeffiecient Alpha and the Internal Structures of
Tests. Psychrometrika, 16 (3), 297-333.
Hair, J. F. Jr.; Anderson, R. E.; Tatham, R. L. & Black, W. C. (1995).
Multivariate Data Analysis. NJ: Printice-Hall, Engelwood Cliffs, 4th
edition.

172
Hair, J. F. Jr.; Anderson, R. E.; Tatham, R. L.; Black, W. C. & Babin, B. J.
(2008). Multivariate Data Analysis. New Delhi: Pearson Education, 6th
edition.
Kaiser, H. F. (1958). Varimax Criterion for Analytical Rotation in Factor
Analysis. Psychrometrica, 23, 187-200.
Kaiser, H. F. and Rice, J. (1974). Little Jiffy Mark IV. Educational and
Psychological Measurement, 34(1), 111-17.
Nunnally, J. C. (1978). Psychometric Theory. New York: McGraw-Hill.
Singh, R. and Jain, M. (2009). Metro Trains and Customer Satisfaction- an
Empirical Study in Delhi. Cabell’s Management Directory, USA, 6(2).
Stewart, D. W. (1981). The Application and Misapplication of Factor
Analysis in Marketing Research. Journal of Marketing Research, February,
38, 51-56.