chapter iii growth and development of dairy industry...
TRANSCRIPT
CHAPTER – III
GROWTH AND DEVELOPMENT OF
DAIRY INDUSTRY IN INDIA
CHAPTER – III
GROWTH AND DEVELOPMENT OF DAIRY INDUSTRY IN INDIA
3.1 WORLD SCENARIO OF DAIRYING
The livestock sector plays a vital role in the economies of many developing
countries. It provides food (specifically, animal protein) to human beings, income,
employment and possibly foreign exchange to the nation. For low income
producers, livestock also serves as a store of wealth, provides organic fertilizer
for crop production and can even be a means of transport. More than 2,445 million
people economically active in agriculture in the world, probably 2/3 or even more
¾ of them are wholly or partly dependent on livestock farming. Consumption of
livestock products in developing countries, though starting from a low base, is
growing rapidly.
Milk provides relatively quick returns for small-scale livestock keepers. It
is a balanced nutritious food and is a key element in household food security.
Smallholders produce the vast majority of milk in developing countries where the
demand is expected to increase by 25 per cent by 2025. Over 80 per cent of milk
consumed in developing countries (200 billion litres annually) is handled by
informal market traders with inadequate regulation.
Globally, the dairy sector is probably one of the most distorted agricultural
sectors: producer subsidies are in place in many developed countries, encouraging
surplus production, export subsidies are paid by governments to place the excess
production on the world markets, and tariff and non-tariff barriers are erected both
by developed and developing countries to protect their dairy sector from ‘unfair’
competition.

These market distortions are having significant and different impacts on
producers and consumers in developing and developed countries, which are
however extremely difficult to quantify.
3.2 WORLD MILK PRODUCTION
Milk has certain features that distinguish it from other agricultural products
and shape its production, processing and trade. Milk is a bulky and heavy
commodity which requires high-cost storage and transportation as it gets spoiled
quickly without cooling. Due to this fact even the largest dairy farms cannot supply
adequate quantities to a processing plant. Each single dairy farm supplies only a
small share of the total milk processed. The dairy industries in many countries are
organized along co-operative lines. Milk producing cooperatives bundle the
interest and supply of a large number of dairy farmers and strengthen their
bargaining power towards processors or even run their own processing plants.
Over the last 24 years, total world milk production has increased by 32 per cent
whereas per capita world milk production has declined by nine per cent which
indicates that world milk production has not kept pace with the increase in world
population. The decline in global milk production per capita can be attributed to
falling production in the developed countries whereas per capita milk production in
the developing countries has slightly risen over the last 24 years. As opposed to the
trend towards intensification of milk production in developed countries, production
growth in developing countries is to a large part due to increasing numbers of milk
animals (and dairy farms) and only to a small part due to productivity gains.
India is the largest producer of dairy products in the world. There is a great
deal of variation in the pattern of dairy production worldwide. Many countries
which are large producers, consume this internally, while others — in particular
New Zealand — export a large percentage of their production. Internal
consumption is often in the form of liquid milk, while the bulk of international
trade is in processed dairy products such as milk powder. The world's largest
exporter of dairy products is New Zealand and dairy products are the largest export
earner for the country. Fonterra is the fifth-largest dairy company in the world and
New Zealand's largest company by turnover. Japan is the world's largest importer
of dairy products. Two thirds of total world milk is produced by Brazil, India,
Pakistan, Poland, the Russian Federation, the USA, and 15 EU member states.
Table 3.1 shows world milk production during 2001 to 2009.
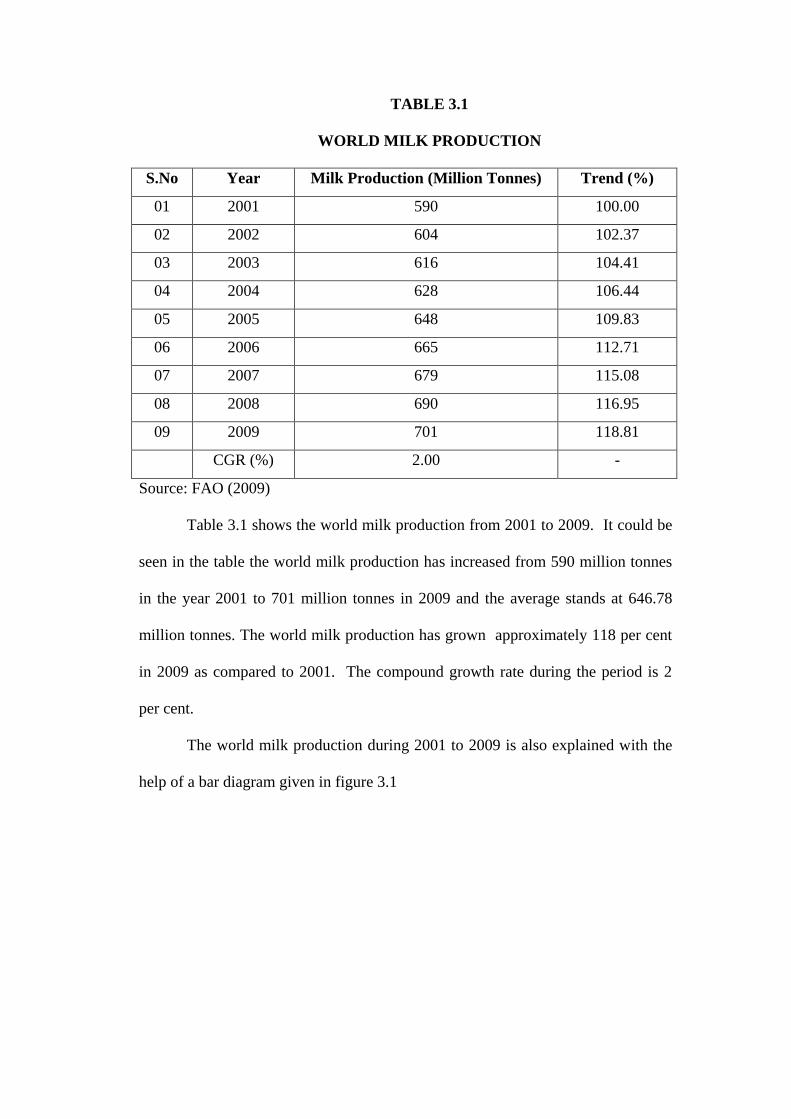
TABLE 3.1
WORLD MILK PRODUCTION
S.No Year Milk Production (Million Tonnes) Trend (%)
01 2001 590 100.00
02 2002 604 102.37
03 2003 616 104.41
04 2004 628 106.44
05 2005 648 109.83
06 2006 665 112.71
07 2007 679 115.08
08 2008 690 116.95
09 2009 701 118.81
CGR (%) 2.00 -
Source: FAO (2009)
Table 3.1 shows the world milk production from 2001 to 2009. It could be
seen in the table the world milk production has increased from 590 million tonnes
in the year 2001 to 701 million tonnes in 2009 and the average stands at 646.78
million tonnes. The world milk production has grown approximately 118 per cent
in 2009 as compared to 2001. The compound growth rate during the period is 2
per cent.
The world milk production during 2001 to 2009 is also explained with the
help of a bar diagram given in figure 3.1
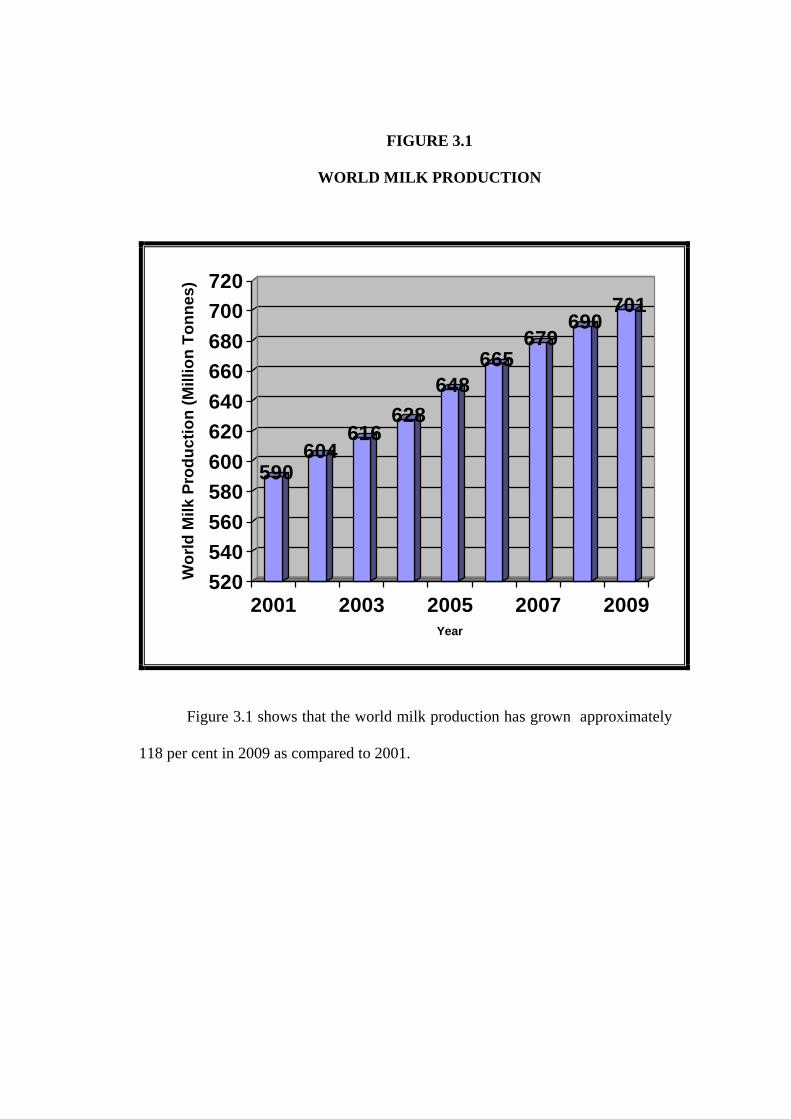
FIGURE 3.1
WORLD MILK PRODUCTION
590604
616628
648
665679
690701
520
540
560
580
600
620
640
660
680
700
720
Wo
rld
Mil
k P
rod
uc
tio
n (
Mil
lio
n T
on
ne
s)
2001 2003 2005 2007 2009Year
Figure 3.1 shows that the world milk production has grown approximately
118 per cent in 2009 as compared to 2001.
3.3 COW MILK PRODUCTION IN SELECTED COUNTRIES IN THE
WORLD
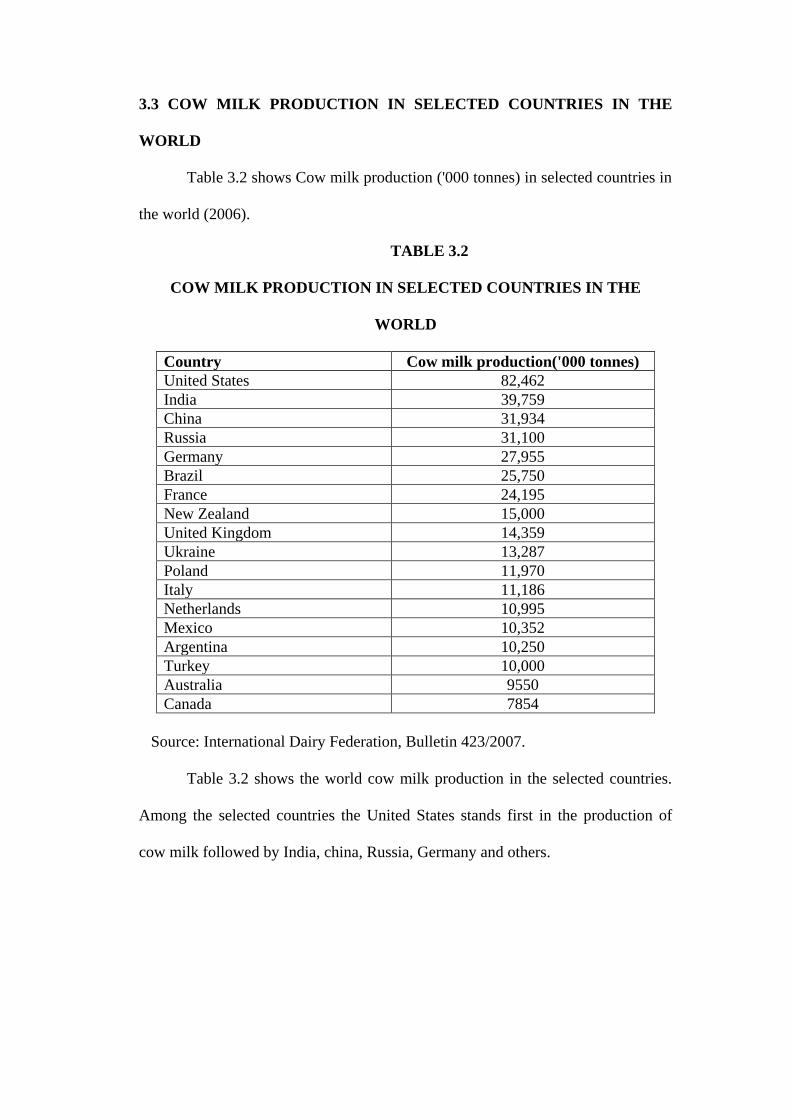
Table 3.2 shows Cow milk production ('000 tonnes) in selected countries in
the world (2006).
TABLE 3.2
COW MILK PRODUCTION IN SELECTED COUNTRIES IN THE
WORLD
Country Cow milk production('000 tonnes)
United States 82,462
India 39,759
China 31,934
Russia 31,100
Germany 27,955
Brazil 25,750
France 24,195
New Zealand 15,000
United Kingdom 14,359
Ukraine 13,287
Poland 11,970
Italy 11,186
Netherlands 10,995
Mexico 10,352
Argentina 10,250
Turkey 10,000
Australia 9550
Canada 7854
Source: International Dairy Federation, Bulletin 423/2007.
Table 3.2 shows the world cow milk production in the selected countries.
Among the selected countries the United States stands first in the production of
cow milk followed by India, china, Russia, Germany and others.
3.4 WORLD MILK CONSUMPTION
Total milk consumption in developed countries stayed more or less
constant over the last twenty years, significant increase in global milk consumption
is due to population growth and per capita income growth in developing countries.
The latter has led to the emergence of an affluent middle-class in many low and
middle income countries in Southeast Asia, Latin America and Central and Eastern
Europe.
Additional “westernization” trends leading to increasing preferences for
new value-added products in many of these economies generate additional dairy
market growth. The composition of dairy product consumption varies across
different regions with liquid milk as the overall most important product by volume.
However, processed dairy products become more important with increasing
incomes and living standards, and in developed countries the trend goes more and
more towards high value functional foods that require considerable research
investments and sophisticated processing.
After years of relatively stable development of global supply and demand
on milk, the unexpected price fluctuations in 2007 and 2008 caused sufficient
changes both in the world demand and in the production of milk, creating big gaps,
which, in their turn, increased price instability. Since mid- 1990 the world milk
consumption is growing at an average of 10-15 million tones of milk per year,
based on the population growth and increasing income in many countries (IFCN,
2008). Since 1980 the demand for the dairy products grew especially in Asian
region from 32 kg per capita in 1981 to 64 kg per capita in 2007, the Asian
consumers presented almost a half of the world demand for milk and milk
products.
Growing income and change in food composition in China, India and other
Asian countries are the factors responsible for the increasing demand. The
governmental support of milk consumption like school milk programmes and new
dairyproducts supported this expansion (FAO, 2009). This growing demand and
higher prices created market opportunities for the local producers and in 2005 Asia
became the world’s largest milk producer with a growth of 35% in 1997-2007.
The total milk consumption (as fluid milk and processed products) per
person varies widely from highs in Europe and North America to lows in Asia.
However, as the various regions of the world become more integrated through
travel and migration, these trends are changing, a factor which needs to be
considered by product developers and marketers of milk and milk products in
various countries of the world.
Even within regions such as Europe, the custom of milk consumption has
varied greatly. Consider for example the high consumption of fluid milk in
countries like Finland, Norway and Sweden compared to France and Italy where
cheeses have tended to dominate milk consumption. Table 3.3 illustrates milk per
capita consumption information from various countries of the world.
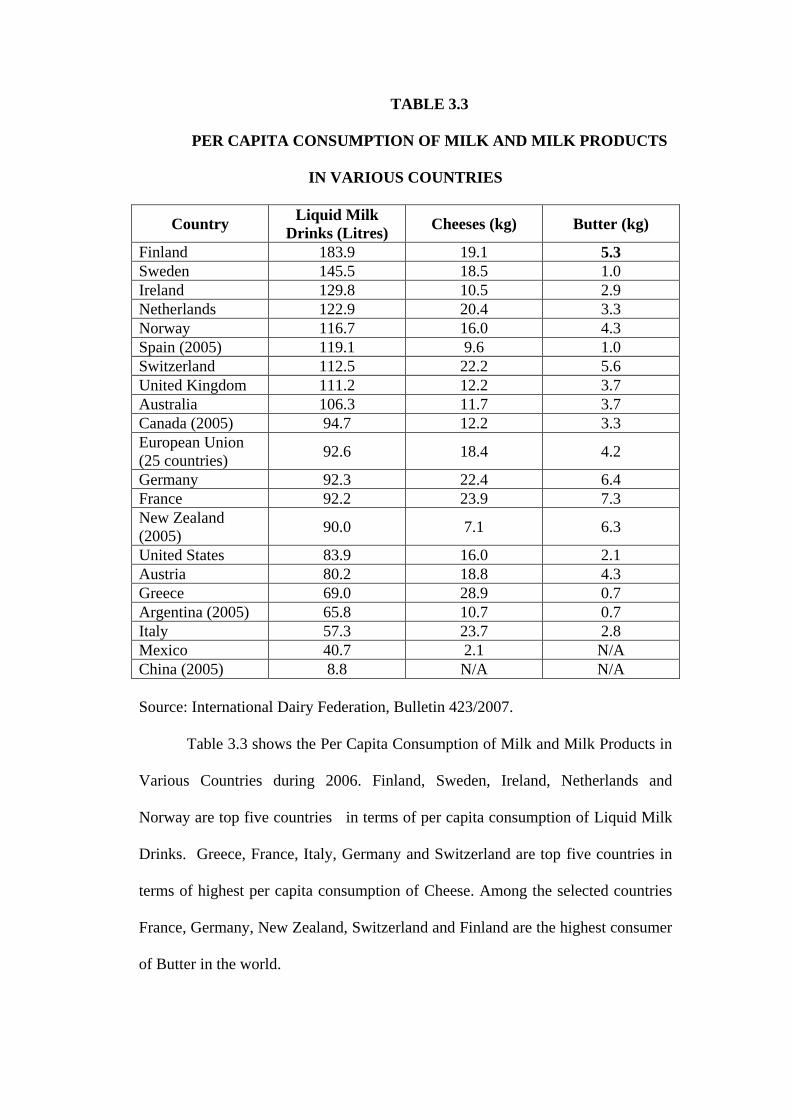
TABLE 3.3
PER CAPITA CONSUMPTION OF MILK AND MILK PRODUCTS
IN VARIOUS COUNTRIES
Country Liquid Milk
Drinks (Litres) Cheeses (kg) Butter (kg)
Finland 183.9 19.1 5.3
Sweden 145.5 18.5 1.0
Ireland 129.8 10.5 2.9
Netherlands 122.9 20.4 3.3
Norway 116.7 16.0 4.3
Spain (2005) 119.1 9.6 1.0
Switzerland 112.5 22.2 5.6
United Kingdom 111.2 12.2 3.7
Australia 106.3 11.7 3.7
Canada (2005) 94.7 12.2 3.3
European Union
(25 countries) 92.6 18.4 4.2
Germany 92.3 22.4 6.4
France 92.2 23.9 7.3
New Zealand
(2005) 90.0 7.1 6.3
United States 83.9 16.0 2.1
Austria 80.2 18.8 4.3
Greece 69.0 28.9 0.7
Argentina (2005) 65.8 10.7 0.7
Italy 57.3 23.7 2.8
Mexico 40.7 2.1 N/A
China (2005) 8.8 N/A N/A
Source: International Dairy Federation, Bulletin 423/2007.
Table 3.3 shows the Per Capita Consumption of Milk and Milk Products in
Various Countries during 2006. Finland, Sweden, Ireland, Netherlands and
Norway are top five countries in terms of per capita consumption of Liquid Milk
Drinks. Greece, France, Italy, Germany and Switzerland are top five countries in
terms of highest per capita consumption of Cheese. Among the selected countries
France, Germany, New Zealand, Switzerland and Finland are the highest consumer
of Butter in the world.
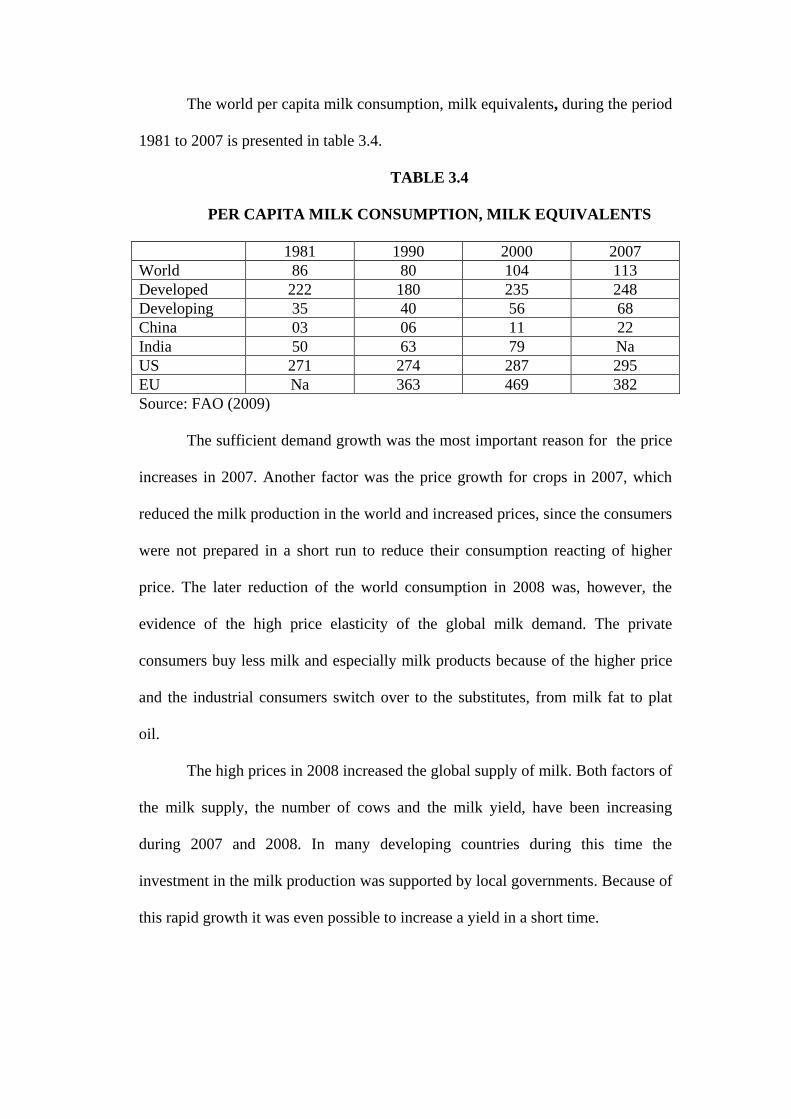
The world per capita milk consumption, milk equivalents, during the period
1981 to 2007 is presented in table 3.4.
TABLE 3.4
PER CAPITA MILK CONSUMPTION, MILK EQUIVALENTS
1981 1990 2000 2007
World 86 80 104 113
Developed 222 180 235 248
Developing 35 40 56 68
China 03 06 11 22
India 50 63 79 Na
US 271 274 287 295
EU Na 363 469 382
Source: FAO (2009)
The sufficient demand growth was the most important reason for the price
increases in 2007. Another factor was the price growth for crops in 2007, which
reduced the milk production in the world and increased prices, since the consumers
were not prepared in a short run to reduce their consumption reacting of higher
price. The later reduction of the world consumption in 2008 was, however, the
evidence of the high price elasticity of the global milk demand. The private
consumers buy less milk and especially milk products because of the higher price
and the industrial consumers switch over to the substitutes, from milk fat to plat
oil.
The high prices in 2008 increased the global supply of milk. Both factors of
the milk supply, the number of cows and the milk yield, have been increasing
during 2007 and 2008. In many developing countries during this time the
investment in the milk production was supported by local governments. Because of
this rapid growth it was even possible to increase a yield in a short time.
One important reason for the supply growth in late 2007 and the beginning
of 2008 was the export of the European intervention funds for milk and butter,
which increased supply on the world market. In terms of the liberalization of the
world milk market it appears that the price elasticity of milk supply in the short-run
is very high.
Reduction of global demand and growing supply of milk in 2008 created a
sufficient gap between production and consumption and therefore led to decreasing
of prices for milk since summer 2008. During the period of higher prices in 2007
many countries used the new built capacities in dairy production especially for the
export. With lower prices it became less attractive in 2008 to export. A part of the
production went down on the domestic markets and additionally lowered the
prices.
In 2008 the positions of the major exporters have been returned to the
traditional exporters like Australia, New Zeeland and USA. Asian market has
imported in 2008 about 19 million tonnes of dairy products, which amounts to half
of the global milk trade. The net export position of Oceania is 14 million tonnes
and of the EU is 7.8 million tonnes (FAO, 2009), which shows the dependency of
the EU from the consumption and import demand in the Asian countries.
In spite of the temporary supply overhang, the world market is still not able
to cover the growing demand for milk and dairy products because of low
productivity. For example, the average yield in Asia is still 0.91 tonnes per animal
per year, while in North America in 2007 it was 9,01 tonnes. Asia has 52% of
global livestock, but only 34% of the world production. Nearly 80 per cent of
overall milk production over the past decade were supplied by producers with two
to five cows (FAO, 2009).

Therefore it is expected that the middle and big sized farms would have the
cost advantages for the next years and would be the major exporters of milk. The
costs of milk production differ within regions and between regions. The last
research of IFCN shows significant cost advantages of larger dairy farms compared
to smaller ones (IFCN, 2008). However, the crop and energy price growth in 2007
and 2008 contributes more to the costs of the larger farms than that in smaller
farms and in some developing and transitional countries the smaller farms with self
- production of feed became more attractive. This could decline the amount of milk
production in the future in these regions and increase export chances for dairy
producers in developed countries.
The political protection of the milk producers during the past five years in
the EU and the USA kept domestic prices on a high level in 1990 and increased
production in these regions. The liberalization of the milk market according to
WTO agreements since 2000 increased the instability of prices, and pressure from
imported milk and dairy products. The milk production quote with guarantee price
in the EU will end in the EU by 2015, continuously growing in the previous years
in order to adjust the producers to the new market conditions. The result is
sufficient production in all EU-countries, because especially big companies tried to
use the new expanded production rights, hoping on the high market prices for milk.
The constant or in some of EU countries declining demand for milk is the reason
for the fast growing over production and decreasing price.
The higher prices in 2007 allowed the EU to cut the export subsidies for
milk, which was planned according to WTO obligations. As a result the European
milk producers were facing the problem of excess production and decrease in
demand in 2008 stronger over production and demand cutting, having no
possibility to sell this over production on the world markets, because the world
prices were still lower than that in the EU.
At the moment the marginal price covering the costs in the EU is about 25
Ct/kg, while in South America, Oceania, Poland it is below 17 US-$/100 kg milk,
in Argentina, India and Poland the larger farms can produce milk below 15 US-$
per 100 kg milk (IFCN, 2009). The milk prices in the EU in 2001-2007 had
seasonal fluctuations with the general declining trend. Since mid 2007 the EU
prices grew steadily and in August 2008 declined considerably in two other milk
producing countries. So the price instability seems to be higher in the EU than in
other producing countries.
The bad economical situation due to lower prices for milk in 2008/2009
affected primarily the small producers. The European politicians decided in 2009
after the protests of milk farmers in many EU countries to increase the direct
support of the production, which obviously will increase the milk prices in the EU
market. This would have similar effect as the protection policy in 1990th, when the
overproduction was sold on the world markets with export subsidy. The possible
scenario for milk production in the EU is that under increased price uncertainly the
investor’s confidence in the milk production will be lower and that the smaller
farmers, having lower yield and fewer chances for the reduction of cost production
will disappear from the market.
At the same time, it is expected that the import would grow, the investment
in milk production made during the price shock of 2007 will allow the developing
countries to produce more milk for export. The EU had lost already some positions
in export in 2004 – 2008.
German milk producers in February 2009 got only 24,4 Ct/kg, it was the
lowest price since 1980. The world finance crisis weakens the milk product sector
in the EU, because consumers in especially developing countries were not able to
pay for the relative expensive European dairy products. The forecast of Zentrale
Markt and Preisberichtstelle (ZMP) is that the milk production in 2009 would not
grow, even if the producers’ quotas will expand (ZMP, 2009). However, in the
long run the growing demand for the dairy products would be the major factor for
the price increase; the Food and Agriculture Organization of the United Nations
(FAO) and the Organization for Economic Co-operation and Development
(OECD) estimated that prices of skim and whole milk powder between US$3 000
and $3 700 per tone over the next decade, which is 50- 90 percent higher than the
previous five years’ average (FAO, 2009).
It is to expect that the quality of milk in combination with low prices will
be the most important factors of the global competitiveness of milk producers. The
differences in the technology and market infrastructure in the EU countries will be
critical for covering the milk demand with domestic supply and for the possibility
to gain from the milk export.
3.5 THE DAIRY INDUSTRY
Dairy companies all over the world face a number of changes and
challenges which are forcing them to reconsider their strategies. The most
important challenges are a growing demand for dairy products, with world demand
growing by 2 per cent a year or a quantity equal to the entire annual production of
Australia, coupled with concerns about the milk supply growing at a slower pace
than demand. Furthermore, dairy companies face an increasing number of
consumer requirements in combination with increasing customer power. Food
retailers, the foodservice industry and the food processing industry are the key
customers for dairy products. The leading companies in this sector tend to be
significantly larger than the players in the dairy industry and the on-going global
consolidation process is further increasing their market power. Consequently, the
concentration process by means of mergers, acquisitions and strategic alliances in
the dairy industry has been very pronounced and is expected to continue. As
demand in dairy products is not rising at equal rates all over the world but hardly at
all in developed and strongly in some developing regions the challenges dairy
companies face vary depending on the market they operate in. Companies
operating in the big but mature dairy markets of Europe and the US face limited
market growth opportunities in terms volume as per capita consumption levels are
among the highest in the world and growth can only occur by increasing market
shares or switching to higher value-added products. Due to these limited market
opportunities in developed countries, multinational dairy companies are often
attracted by strong growth markets in developing countries. To benefit from the
growth of their own domestic markets, local companies will have to raise product
quality and efficiency to be able to withstand foreign competition.
3.6 DAIRY TRADE
The dairy sector is highly localized, as milk is a bulky and perishable
product, and dairy products are mostly consumed in the country or region where
they are produced. Only a small fraction of global production is traded
internationally. Despite the technological developments in refrigeration and
transportation only 7 per cent of the milk produced is traded internationally if intra-
EU trade is excluded.
Trade in dairy products is very volatile, as dairy trade flows can be affected
by (a) overall economic situation in a country, (b) fluctuations in supply and
demand, (c) changing exchange rates and (d) political measures. Additional
volatility is introduced by the fact that the global dairy market is extremely
concentrated in terms of buyers and sellers; hence, supply or demand shocks are
not easily absorbed. With demand for dairy products most rapidly rising in regions
that are not self-sufficient in milk production, volumes of dairy trade are growing.
Also the share of global dairy production that is traded will increase as trade will
grow at a faster pace than milk production. Since 1990, a shift in world dairy
exports from high export subsidizing countries, e.g. EU and US towards non-
subsidizing countries, e.g. New Zealand and Australia has been taking place. The
developed countries account for 62 per cent of the world’s dairy imports (measured
in milk equivalents) and 93 per cent of the exports, show clearly that the major part
of the global dairy trade takes place among developed countries.
3.7 DAIRY POLICIES
In many, and predominantly in developed countries, the dairy market is one
of the most heavily regulated agricultural markets. Government interventions in the
domestic dairy market are most commonly aimed at controlling quantities of
production, establishing minimum prices and guaranteeing farmers’ incomes.
Frequently, governments also intervene through public purchases and storage of
oversupply or apply policies to foster dairy consumption. In countries where
domestic prices for dairy products are supported well above world market prices,
as a consequence, the domestic market has to be protected against foreign
competition in order to ensure the market outlet for domestic farmers who would
otherwise have difficulties to sell their overpriced products. The major policies
countries put in place to limit imports are tariffs and tariff rate quotas (TRQs) and
other non-tariff barriers. Globally dairy products are among the agricultural
commodities with the highest tariff protection with an average protection level of
over 80 per cent (the average over all agricultural commodities being 62 percent).
The most important measure promoting exports are export subsidies. Under the
WTO Agreement on Agriculture, countries that used export subsidies on
agricultural products were required to set commitment levels on the volume and
value of export subsidies that could be provided. The most significant user of
export subsidies on dairy is the European Union, accounting for over 80 per cent of
the total value of export subsidies on dairy granted during the period 1995-2001.
Over the same period values of export subsidies have been reduced considerably,
and in the case of the EU, subsidies for dairy exports in 2001 were only slightly
more than 40 per cent of those in 1995.
3.8 INTERNATIONAL STANDARDS FOR DAIRY PRODUCTS
Though standards were initially developed by the public sector to reduce
transaction costs and ensure product quality and safety, they have become a
strategic instrument of competition of differentiated product markets, especially in
developing countries. It can be very difficult for farmers to meet private standards
for milk quality and safety which might require investment in mechanical milking,
on farm cooling, new feeds and genetic improvement. Apart from the initial
investment cost a dairy farmer faces to meet those standards, high operating costs
might render small and even medium-scale units unprofitable in the long run.
Different developments are occurring in the global dairy sector at the
moment: Production in developed countries is falling (together with the number of
dairy cows and farms), while productivity is rising. Simultaneously milk
production in developing countries is growing strongly and the number of cows are
increasing. This development is mirrored in consumption. Dairy consumption
levels in developed countries are constant or falling, whereas in many developing
countries, particularly in East and Southeast Asia and driven by population growth
and growing per capita incomes, dairy consumption is rapidly increasing. With
consumer demand in developing countries rising faster than domestic production,
global dairy trade volumes are increasing as well with import demand of
developing countries being the major driver. OECD dairy policies mainly result in
a financial transfer from consumers in OECD countries to producer and processors.
Actually, some benefits of the OECD dairy policies, through the depressed
world market prices to which they lead, probably also accrue to consumers in
developing countries in terms of increased supply of dairy products predominantly
in urban centres – especially considering that many developing countries are not
expected to be self-sufficient in dairy production in the future and therefore will
have to import increasing amounts of dairy products. However, the artificially low
world market price for dairy products, and here especially milk powder, might
have negative impacts on dairy farmers in developing countries who have to
compete on their local markets with imported milk powder.
3.9 DAIRYING IN INDIA
Dairy development in India has been acclaimed as one of modern India’s
most accomplished development programmes. The State like Gujarat,
Maharashtra, Uttar Pradesh, Haryana, Rajasthan, Andhra Pradesh, Karnataka and
Tamil Nadu are surplus in milk production. The consumption pattern indicates
that 45 per cent of milk is consumed in liquid form, while butter milk/separated
milk (butter and ghee) constitutes 34 per cent. The balance is in the form of milk
powder, ice creams, cheese and other products.
Indian dairying is emerging as a sunrise industry. India represents one of
the world’s largest and fastest growing markets for milk products due to the
increasing disposable incomes among the 250 million strong middle class.
The world dairy is zooming on India for its rapidly growing markets that
promise the ‘moon’. The changing international dairy trade pattern, following
General Agreement on Tariffs and Trade (GATT) and the emergence of the World
Trade Organisation (WTO), offer to the Indian dairy industry an opportunity to
take its bow as an exporter. India’s enthusiasm to integrate with the world
economy is reflected in technological upgradition, professional excellence and
cost-effective approach.
Today, Indian dairy co-operative network is very wide and large. Total 170
milk unions are operated in 346 districts in India and nearly about, 1,22,534 village
level dairy co-operative societies are working under this union. In India 12.96
million farmers are the members of Dairy Co-operative Societies of which 3.4
million are women. The dairy sector provides 70 million farm families triple
benefits of nutritive food, supplementary income and employment for family
labours who are mainly women.
Indian dairy industry is one of the fastest growing sectors in India. It has
seen incredible growth for the last several years. India holds number one position
in the world in milk production – 88 MT (2003-2004). The global milk production
in the year 2003 was reported at 600 million tonnes (FAO, 2003).
Indian dairy industry is growing very rapidly at 4.5 per cent per annum.
The world milk production by 2020 is expected to rise to 350-700 million tonnes.
India’s share to world milk production at that time would substantially increase to
175 MT and 200 MT of milk by the year 2015 and 2020 respectively.
From the present production figure of 108 MT, India’s dairy sector is
expected to triple its production in the next 10 years in view of expanding potential
for export to Europe, Middle East and South East. India’s dairy export share is
less than one per cent. The cost of production of milk per litre in India is the lowest
in the world. In order to take the advantage of lowest cost and increasing
production of milk in India, MNC’s are planning to expand their activities in India.
3.10 DAIRYING BEFORE INDEPENDENCE
Dairying before independence was in a very primitive and old form.
Private persons collected milk from the rural farmers twice a day and sold it door
to door in cities and towns by bicycle in raw conditions. This business was
generally practised around the city at a walkable distance, so that fresh milk would
reach within two to three hours of milking. Village grazers collect the animals,
cows and buffaloes from the backyards, take them out for the whole day for
grazing and bring them back in the evening. A member of the family may do the
feeding and milking. The farmers bring milk to the milk shop by carrying it on
head and shoulder. “A concept of movement of milk for long distance started in
India in 1945. Before 1947, there were some 60 dairy farms with thousands of
crossbred cows in them. The female ones were the best North Indian breed viz.,
the Sahiwal, Siondhi and Tharparker. India had a large number of Princely States,
known as native states, ruled over by the Rajas, Maharajas and Nawabs. Some of
these had state dairies called Palace Dairies and as a hobby, the princes maintained
excellent herd of Indian cows and buffaloes. The Hindus, the Jains and the
Persians’ are strictly against the killing of old animals like cows.
Government of India has established ‘Indian Agricultural Research
Institute’ at Delhi. The cooperative sector is involved in dairy farming activity
along with the private and public sector. The Cooperative Credit Society’s Act
was passed in 1912 and first cooperative dairy society was established at
Allahabad (U.P) in 1913.
Till 1938, there were 19 union societies with 264 primary societies of
11,600 producer members. Only one cooperative dairy in Calcutta was
pasteurizing small quantity of milk for local distribution around in 1925.
Initially people were unaware of purity, hygiene and quality of milk. In
1916, Bombay Municipality’s analyst Dr. L. Joshi for the first time exposed
publicly about unsatisfactory conditions of quality (Purity and hygiene). The
Government of Bombay was the first in the country to take steps to prevent
adulteration of food and by early 1930 every province had food adulteration laws,
analytical laboratories, standardized system of testing, sampling and punishing
offenders. During the Second World War, rationing of food grains had become
very critical and vague for the citizens of Bombay. Milk had also become scarce
and expensive for them. Then the government introduced in the city of Bombay a
subsidized milk distribution scheme from 17th
August 1944. The registered
customers had to fetch milk in their own vessels from the milk center in the
morning and afternoons. This was the starting point of public milk distribution
under a Milk Commissioner from 1st April 1945 who coordinated various activities
under the new department.
3.11 POST INDEPENDENCE DAIRY DEVELOPMENT
From the beginning of the first plan on 1st April 1951, there was cattle
colonization project for removal of 15,000 buffaloes with their owners and
attendants from Bombay city stable to Aarey milk colony. The largest processing
and bottling plant with 25,000 liters per day capacity was erected at Aarey milk
colony, which went into operation on 15th
December 1950.
Dairy cooperatives are in existence in the country since 1913; Most of them
are collecting and selling raw milk to the local consumers. But the first large scale
and systematic break-through in dairy cooperatives in India was made in 1948 by
Kaira Distict Cooperative Milk Producers Union, Anand, initially it was processing
and dispatching milk for distribution in loose form in Bombay. Later, it built its
own new dairy at Anand in which it was processing, manufacturing and packaging
milk products in its own brand name “Amul”.
During the first five years plan, the Milk Schemes at Bombay, Calcutta and
Delhi were on the way. Projects for collecting milk from villages, processing and
distribution were started in other states like Andhra Pradesh, Bihar, Madyha
Pradesh, Orissa, Tamil Nadu and Uttar Pradesh. In 1945 Dr. H.D. Kay of the
Dairy Research Institute, Shinfield (England) visited India to advise the
Government of India on dairy research. On his recommendation the National
Dairy Research Institute (NDRI) was set up at Karnal (then in Punjab, now in
Haryana). During the first five year plan, an allotment of Rs. 78 million was made
for dairy development. In second five-year plan, dairy development began to take
shape on an organized basis. The expenditure during this plan amounted to Rs.120
million.
A number of states created separate dairy development departments to give
exclusive attention to development of dairying. The programme envisaged
establishment of Thirty six fluid milk handling plants at large consuming centers,
six milk product factories and expansion of facilities for salvage of dry animals
from city stables. In addition to the existing one at Bangalore, two additional
Regional Dairy Research Stations were established at the Aaery Milk Colony,
Bombay and Kalyani near Calcutta.
Training to personnel in quality control issues was also undertaken. Seven
additional fluid milk handling plants were set up as pilot milk projects. It was
during this period that a gift of rail and road milk tankers from New Zealand was
received under Bombay Milk Scheme for transportation of milk between Anand
and Bombay. This was for the first time that bulk transport of milk was started in
India. The setting up of fifty five fluid milk projects for the cities having
population of 1,00,000 each, eight rural creameries, six milk product factories, two
cheese factories and four cattle feed compounding factories were taken in hand
during third five year plan. A Modern feed compounding mill was set up in
Anand area from the funds gifted by the United Kingdom. Some more states
established separate dairy departments. The National Dairy Development Board
(NDDB) was set up in September 1965 with headquarters in Anand in Gujarat
State. The major milk product manufacturing factories in India during the post
independence period is given in table 3.5.
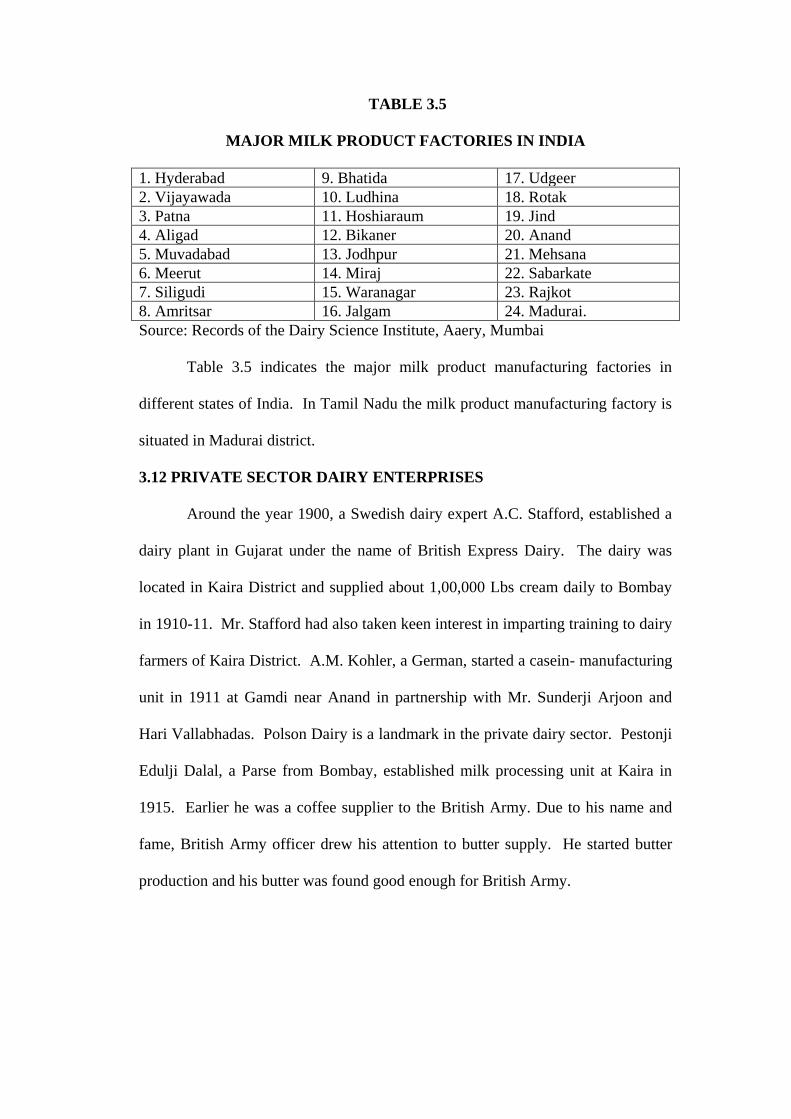
TABLE 3.5
MAJOR MILK PRODUCT FACTORIES IN INDIA
1. Hyderabad 9. Bhatida 17. Udgeer
2. Vijayawada 10. Ludhina 18. Rotak
3. Patna 11. Hoshiaraum 19. Jind
4. Aligad 12. Bikaner 20. Anand
5. Muvadabad 13. Jodhpur 21. Mehsana
6. Meerut 14. Miraj 22. Sabarkate
7. Siligudi 15. Waranagar 23. Rajkot
8. Amritsar 16. Jalgam 24. Madurai.
Source: Records of the Dairy Science Institute, Aaery, Mumbai
Table 3.5 indicates the major milk product manufacturing factories in
different states of India. In Tamil Nadu the milk product manufacturing factory is
situated in Madurai district.
3.12 PRIVATE SECTOR DAIRY ENTERPRISES
Around the year 1900, a Swedish dairy expert A.C. Stafford, established a
dairy plant in Gujarat under the name of British Express Dairy. The dairy was
located in Kaira District and supplied about 1,00,000 Lbs cream daily to Bombay
in 1910-11. Mr. Stafford had also taken keen interest in imparting training to dairy
farmers of Kaira District. A.M. Kohler, a German, started a casein- manufacturing
unit in 1911 at Gamdi near Anand in partnership with Mr. Sunderji Arjoon and
Hari Vallabhadas. Polson Dairy is a landmark in the private dairy sector. Pestonji
Edulji Dalal, a Parse from Bombay, established milk processing unit at Kaira in
1915. Earlier he was a coffee supplier to the British Army. Due to his name and
fame, British Army officer drew his attention to butter supply. He started butter
production and his butter was found good enough for British Army.
3.13 PERFORMANCE OF INDIAN DAIRY SECTOR OVER THE YEARS
During the early decade of 50s and 60s, milk production in India was
stagnant and the scarcities of resources in terms of livestock led to the need for
major policy reforms in the dairy sector. The strategy for organized dairy
development in India was actually conceived in the late 1960s, within a few years
after the National Dairy Development Board (NDDB) was founded in 1965.
NDDB began its operation with an objective of making dairying a means for a
better future for the millions of milk producers at the grass root level with its
consistent efforts. It rested on the Operation Flood Programme (OFP). The OFP
was a major policy development designed to develop dairying by replicating the
Anand Model for dairy development so as to provide the missing market link in the
formal milk sector between the urban milk consumer and the rural producer
through a network of cooperatives. The OFP was instrumental in creating strong
linkages among millions of smallholders producers and urban consumers. Prior
to OFP, the link between the producer and consumer was completely missing.
OFP in India helped to bridge the gap between formal dairy sector and rural
producers by developing gradual and concrete slabs of co-operatives and plants in
India. It was the first ever step being taken toward dairy infrastructure
development in India. OFP for the first time recognized the need of the rural milk
producers and paid attention towards their thorough development.
It played the key role in bringing about the transformation in dairy
development in the country. The OFP established milk producers’ cooperatives in
villages and made modern technology available to them. The broad objectives
were to increase milk production, augment rural incomes, and transfer to milk
producers, the profits of milk marketing.
The performance of Indian dairy sector during the 50s and 60s was not
remarkable. However with the successful implementation of OFP during the 70s,
the dairy sector achieved four fold growths rate by touching the mark of 4.51
during a single decade from 1971-81. Since then a gradual increase in growth rate
has been observed with 5.21 till 1996 in an era which acknowledged the
emergence of more globalized and liberalized policies in world trade. Soon after
this, growth of Indian dairy sector declined by the end of the year 2005 and moved
down to the mark of 4.42. To sum up, it may be inferred that the Indian dairy
sector during the past 6 decades has shown consistent growth trends which in turn
resulted in the best ranking in world dairy scenario. Moreover, after globalization,
the milk production in India has increased but even then it is yet waiting for land
mark achievement in world milk trade which could only be possible with balanced
growth of livestock and proper dairy infrastructure development throughout India.
India has a sound base for infrastructure development with an existing 1.9 lakh of
dairy plants and co-operatives. In spite of all hypes and publicity being projected
towards two vital segments of Indian dairy sector viz., organized and unorganized,
the contribution of both is 14:45 per cent respectively. This clearly shows an
increase of three folds in productivity by the latter segment. What is needed at this
stage is to bridge the gap between these two sectors on a moderate basis in order to
get the desired output.
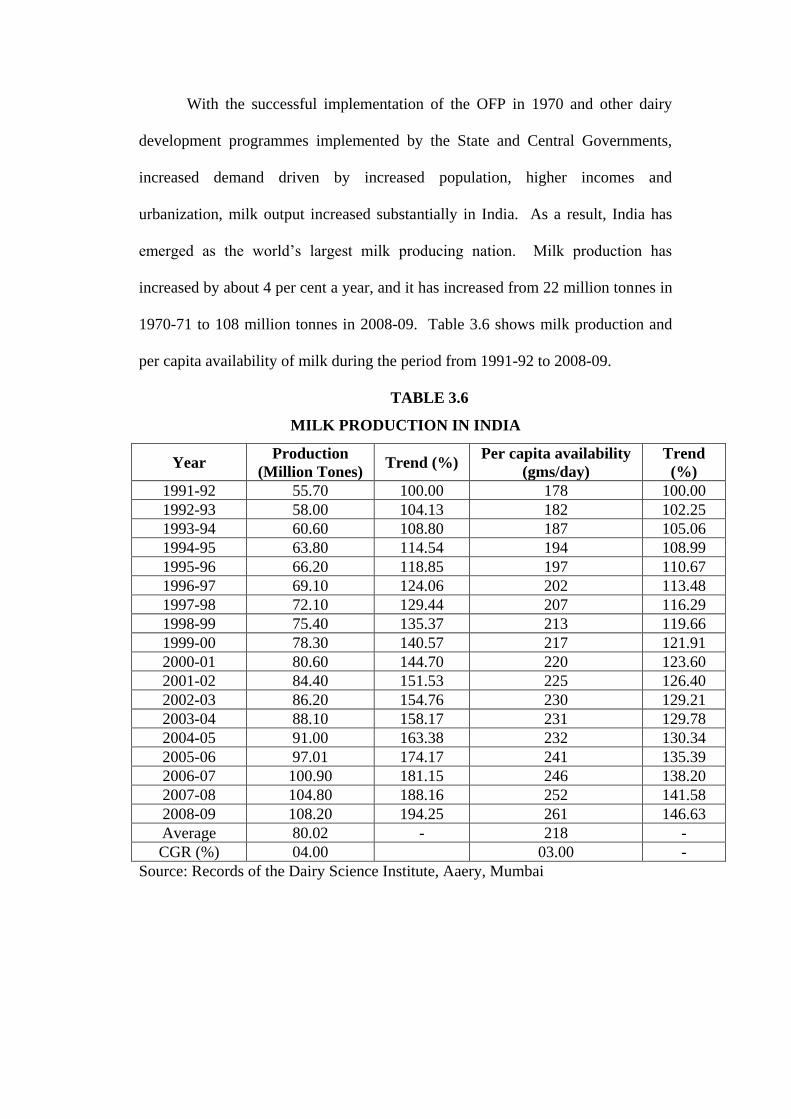
With the successful implementation of the OFP in 1970 and other dairy
development programmes implemented by the State and Central Governments,
increased demand driven by increased population, higher incomes and
urbanization, milk output increased substantially in India. As a result, India has
emerged as the world’s largest milk producing nation. Milk production has
increased by about 4 per cent a year, and it has increased from 22 million tonnes in
1970-71 to 108 million tonnes in 2008-09. Table 3.6 shows milk production and
per capita availability of milk during the period from 1991-92 to 2008-09.
TABLE 3.6
MILK PRODUCTION IN INDIA
Year Production
(Million Tones) Trend (%)
Per capita availability
(gms/day)
Trend
(%)
1991-92 55.70 100.00 178 100.00
1992-93 58.00 104.13 182 102.25
1993-94 60.60 108.80 187 105.06
1994-95 63.80 114.54 194 108.99
1995-96 66.20 118.85 197 110.67
1996-97 69.10 124.06 202 113.48
1997-98 72.10 129.44 207 116.29
1998-99 75.40 135.37 213 119.66
1999-00 78.30 140.57 217 121.91
2000-01 80.60 144.70 220 123.60
2001-02 84.40 151.53 225 126.40
2002-03 86.20 154.76 230 129.21
2003-04 88.10 158.17 231 129.78
2004-05 91.00 163.38 232 130.34
2005-06 97.01 174.17 241 135.39
2006-07 100.90 181.15 246 138.20
2007-08 104.80 188.16 252 141.58
2008-09 108.20 194.25 261 146.63
Average 80.02 - 218 -
CGR (%) 04.00 03.00 -
Source: Records of the Dairy Science Institute, Aaery, Mumbai
As per table 3.6 the milk production in India has increased to 108.20 per cent
in 2008-09 as compared to 1991-92. The per capita availability of milk has increased
to 146.63 per cent during the same period. The compound growth rate milk
production is 4 per cent and per capita availability of milk is 3 per cent during the
period.
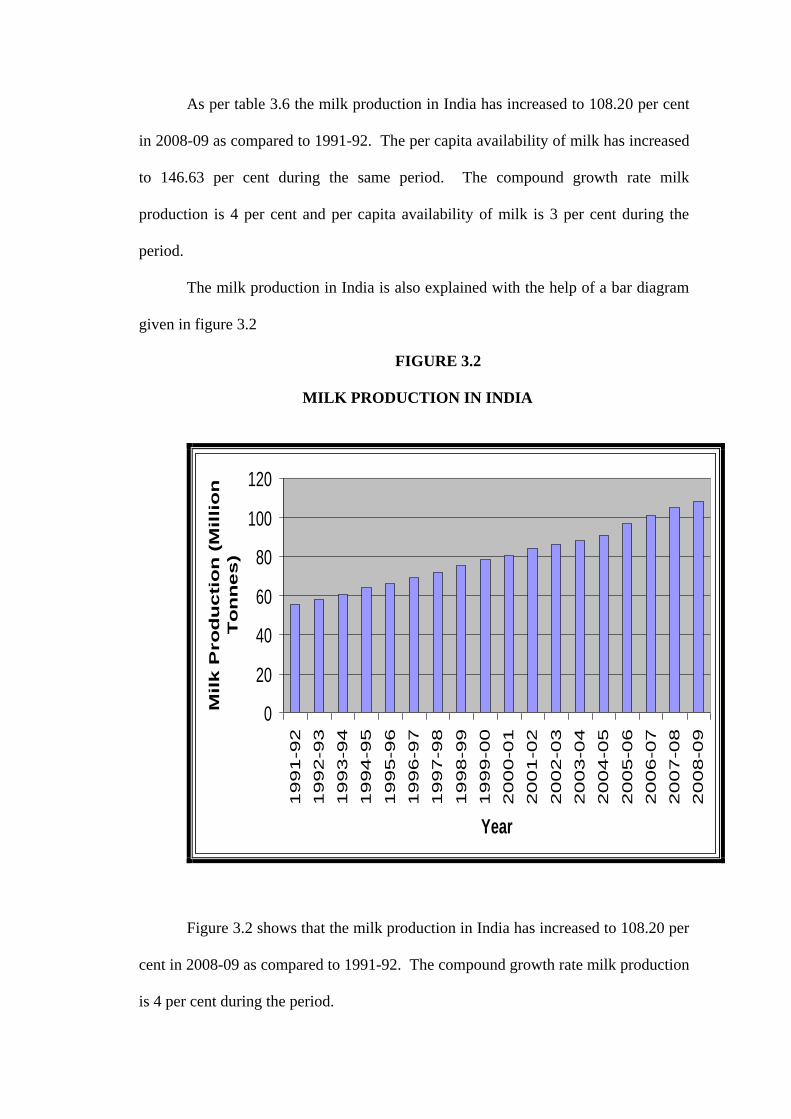
The milk production in India is also explained with the help of a bar diagram
given in figure 3.2
FIGURE 3.2
MILK PRODUCTION IN INDIA
0
20
40
60
80
100
120
19
91
-92
19
92
-93
19
93
-94
19
94
-95
19
95
-96
19
96
-97
19
97
-98
19
98
-99
19
99
-00
20
00
-01
20
01
-02
20
02
-03
20
03
-04
20
04
-05
20
05
-06
20
06
-07
20
07
-08
20
08
-09
Year
Mil
k P
ro
du
cti
on
(M
illi
on
To
nn
es
)
Figure 3.2 shows that the milk production in India has increased to 108.20 per
cent in 2008-09 as compared to 1991-92. The compound growth rate milk production
is 4 per cent during the period.
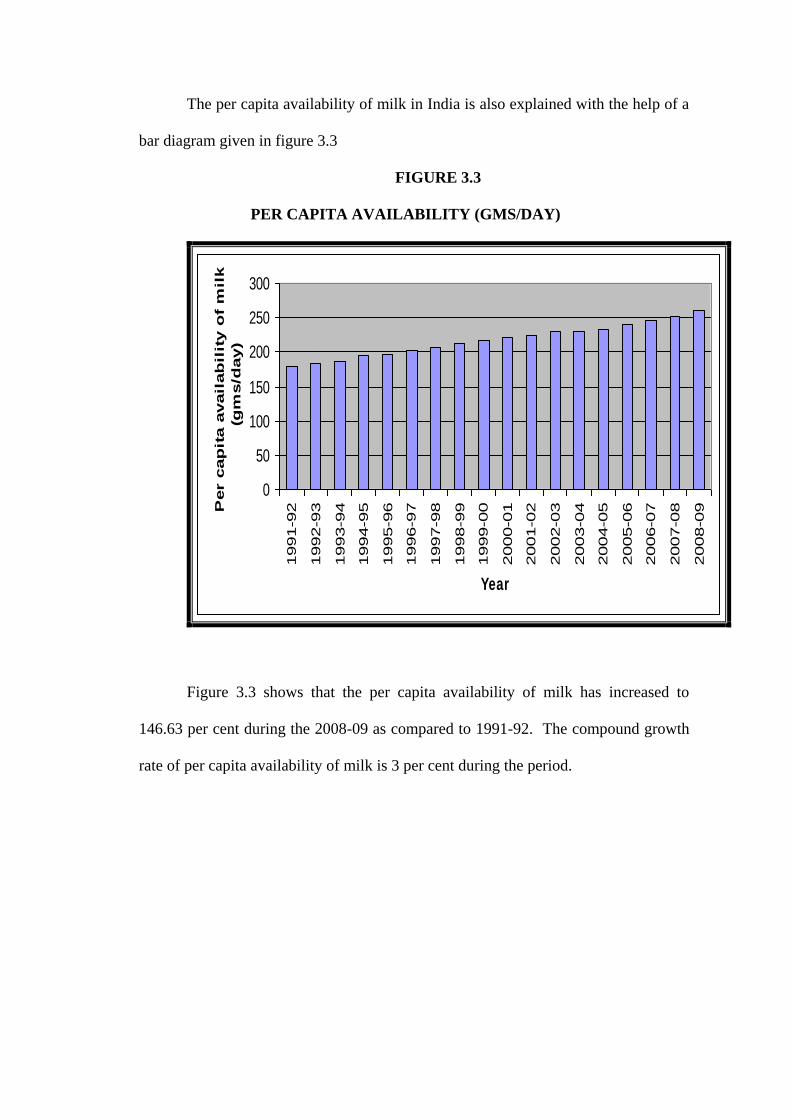
The per capita availability of milk in India is also explained with the help of a
bar diagram given in figure 3.3
FIGURE 3.3
PER CAPITA AVAILABILITY (GMS/DAY)
0
50
100
150
200
250
3001991-9
2
1992-9
3
1993-9
4
1994-9
5
1995-9
6
1996-9
7
1997-9
8
1998-9
9
1999-0
0
2000-0
1
2001-0
2
2002-0
3
2003-0
4
2004-0
5
2005-0
6
2006-0
7
2007-0
8
2008-0
9
Year
Per c
ap
ita a
vail
ab
ilit
y o
f m
ilk
(gm
s/d
ay)
Figure 3.3 shows that the per capita availability of milk has increased to
146.63 per cent during the 2008-09 as compared to 1991-92. The compound growth
rate of per capita availability of milk is 3 per cent during the period.
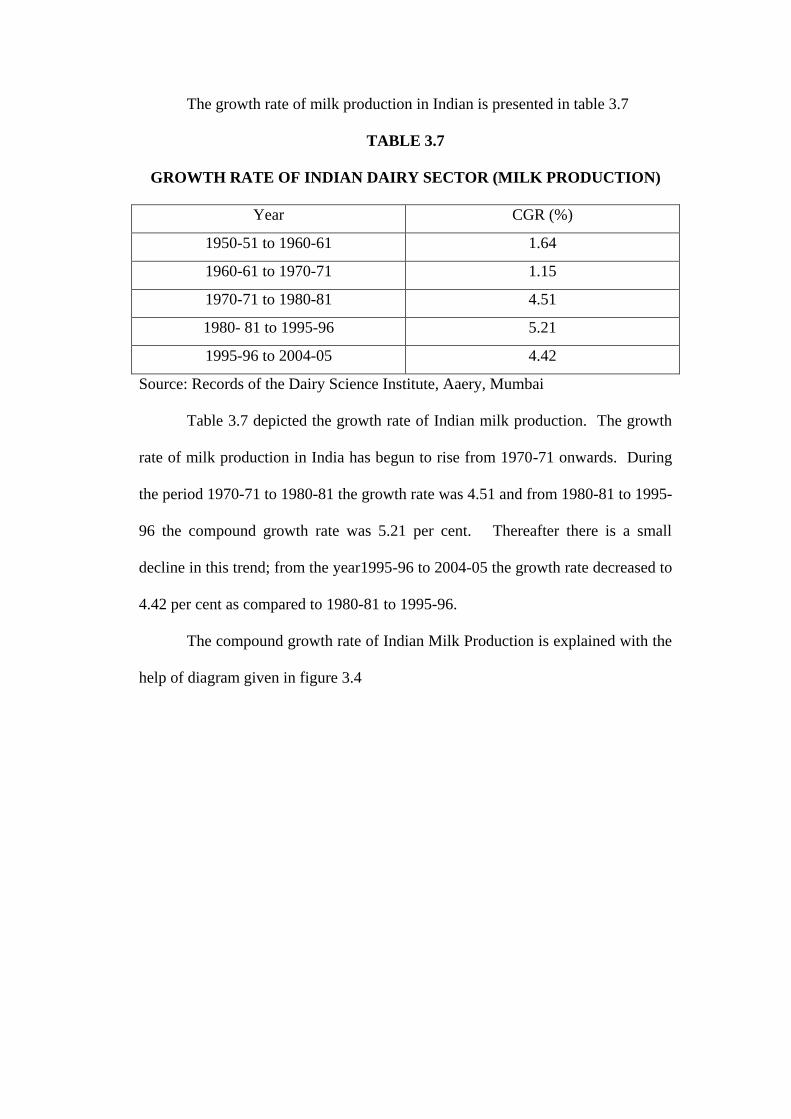
The growth rate of milk production in Indian is presented in table 3.7
TABLE 3.7
GROWTH RATE OF INDIAN DAIRY SECTOR (MILK PRODUCTION)
Year CGR (%)
1950-51 to 1960-61 1.64
1960-61 to 1970-71 1.15
1970-71 to 1980-81 4.51
1980- 81 to 1995-96 5.21
1995-96 to 2004-05 4.42
Source: Records of the Dairy Science Institute, Aaery, Mumbai
Table 3.7 depicted the growth rate of Indian milk production. The growth
rate of milk production in India has begun to rise from 1970-71 onwards. During
the period 1970-71 to 1980-81 the growth rate was 4.51 and from 1980-81 to 1995-
96 the compound growth rate was 5.21 per cent. Thereafter there is a small
decline in this trend; from the year1995-96 to 2004-05 the growth rate decreased to
4.42 per cent as compared to 1980-81 to 1995-96.
The compound growth rate of Indian Milk Production is explained with the
help of diagram given in figure 3.4

FIGURE 3.4
GROWTH RATE OF INDIAN DAIRY SECTOR (MILK PRODUCTION)
1.641.15
4.51
5.21
4.42
0
1
2
3
4
5
6
1950-51 to
1960-61
1960-61 to
1970-71
1970-71 to
1980-81
1980- 81 to
1995-96
1995-96 to
2004-05
Year
Gro
wth
rate
of
Ind
ian
Dair
y
Secto
r -
Mil
k P
ro
du
cti
on
Figure shows that during the period 1950-51 to 1960-61 the compound
growth rate of milk production was 1.64 per cent and during 1960-61 to 1970-71
the growth rate was 1.15. From the year1995-96 to 2004-05 the growth rate
decreased to 4.42 per cent as compared to 1980-81 to 1995-96.
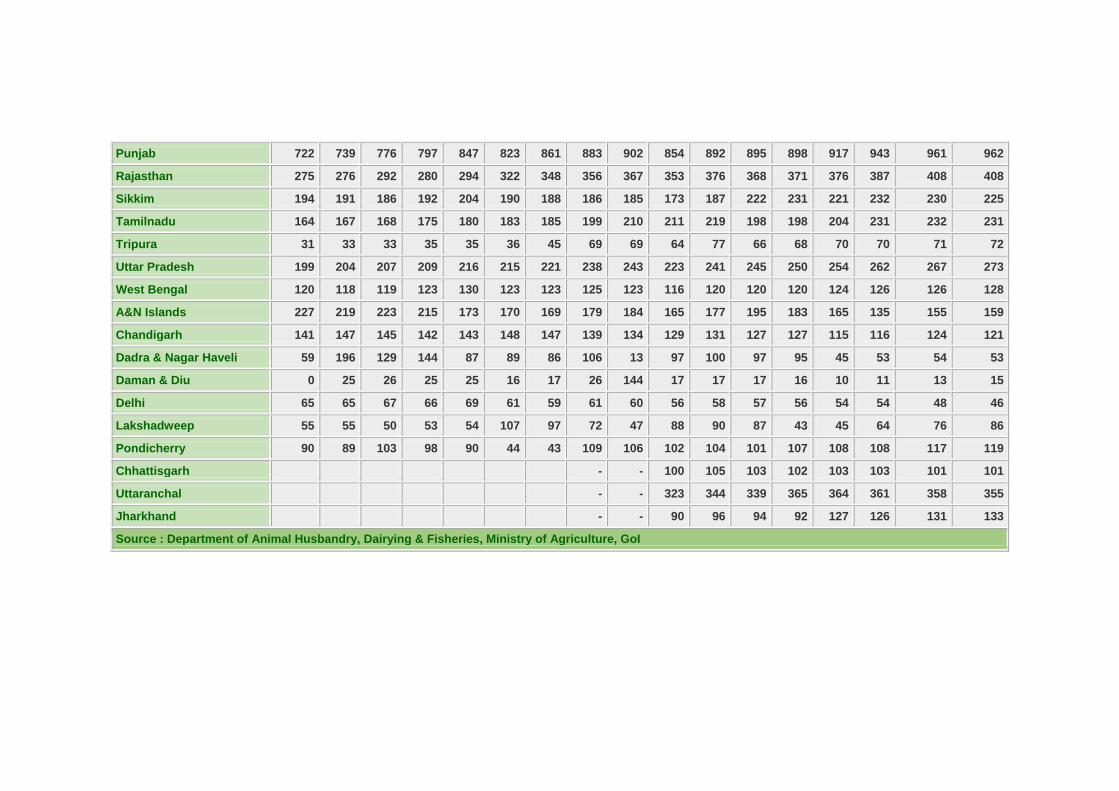
3.14 PER CAPITA AVAILABILITY OF MILK BY STATES
The per capita availability of milk in Indian states is given in table 3.8
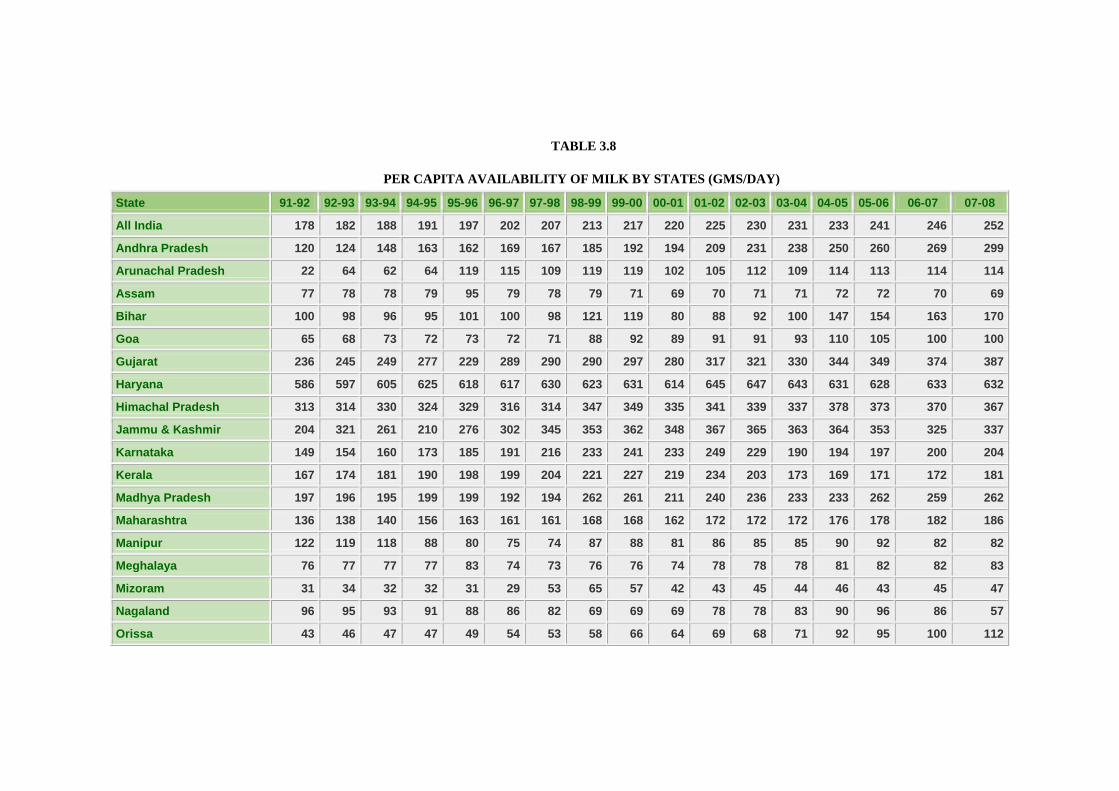
TABLE 3.8
PER CAPITA AVAILABILITY OF MILK BY STATES (GMS/DAY)
State 91-92 92-93 93-94 94-95 95-96 96-97 97-98 98-99 99-00 00-01 01-02 02-03 03-04 04-05 05-06 06-07 07-08
All India 178 182 188 191 197 202 207 213 217 220 225 230 231 233 241 246 252
Andhra Pradesh 120 124 148 163 162 169 167 185 192 194 209 231 238 250 260 269 299
Arunachal Pradesh 22 64 62 64 119 115 109 119 119 102 105 112 109 114 113 114 114
Assam 77 78 78 79 95 79 78 79 71 69 70 71 71 72 72 70 69
Bihar 100 98 96 95 101 100 98 121 119 80 88 92 100 147 154 163 170
Goa 65 68 73 72 73 72 71 88 92 89 91 91 93 110 105 100 100
Gujarat 236 245 249 277 229 289 290 290 297 280 317 321 330 344 349 374 387
Haryana 586 597 605 625 618 617 630 623 631 614 645 647 643 631 628 633 632
Himachal Pradesh 313 314 330 324 329 316 314 347 349 335 341 339 337 378 373 370 367
Jammu & Kashmir 204 321 261 210 276 302 345 353 362 348 367 365 363 364 353 325 337
Karnataka 149 154 160 173 185 191 216 233 241 233 249 229 190 194 197 200 204
Kerala 167 174 181 190 198 199 204 221 227 219 234 203 173 169 171 172 181
Madhya Pradesh 197 196 195 199 199 192 194 262 261 211 240 236 233 233 262 259 262
Maharashtra 136 138 140 156 163 161 161 168 168 162 172 172 172 176 178 182 186
Manipur 122 119 118 88 80 75 74 87 88 81 86 85 85 90 92 82 82
Meghalaya 76 77 77 77 83 74 73 76 76 74 78 78 78 81 82 82 83
Mizoram 31 34 32 32 31 29 53 65 57 42 43 45 44 46 43 45 47
Nagaland 96 95 93 91 88 86 82 69 69 69 78 78 83 90 96 86 57
Orissa 43 46 47 47 49 54 53 58 66 64 69 68 71 92 95 100 112
Punjab 722 739 776 797 847 823 861 883 902 854 892 895 898 917 943 961 962
Rajasthan 275 276 292 280 294 322 348 356 367 353 376 368 371 376 387 408 408
Sikkim 194 191 186 192 204 190 188 186 185 173 187 222 231 221 232 230 225
Tamilnadu 164 167 168 175 180 183 185 199 210 211 219 198 198 204 231 232 231
Tripura 31 33 33 35 35 36 45 69 69 64 77 66 68 70 70 71 72
Uttar Pradesh 199 204 207 209 216 215 221 238 243 223 241 245 250 254 262 267 273
West Bengal 120 118 119 123 130 123 123 125 123 116 120 120 120 124 126 126 128
A&N Islands 227 219 223 215 173 170 169 179 184 165 177 195 183 165 135 155 159
Chandigarh 141 147 145 142 143 148 147 139 134 129 131 127 127 115 116 124 121
Dadra & Nagar Haveli 59 196 129 144 87 89 86 106 13 97 100 97 95 45 53 54 53
Daman & Diu 0 25 26 25 25 16 17 26 144 17 17 17 16 10 11 13 15
Delhi 65 65 67 66 69 61 59 61 60 56 58 57 56 54 54 48 46
Lakshadweep 55 55 50 53 54 107 97 72 47 88 90 87 43 45 64 76 86
Pondicherry 90 89 103 98 90 44 43 109 106 102 104 101 107 108 108 117 119
Chhattisgarh - - 100 105 103 102 103 103 101 101
Uttaranchal - - 323 344 339 365 364 361 358 355
Jharkhand - - 90 96 94 92 127 126 131 133
Source : Department of Animal Husbandry, Dairying & Fisheries, Ministry of Agriculture, GoI
97
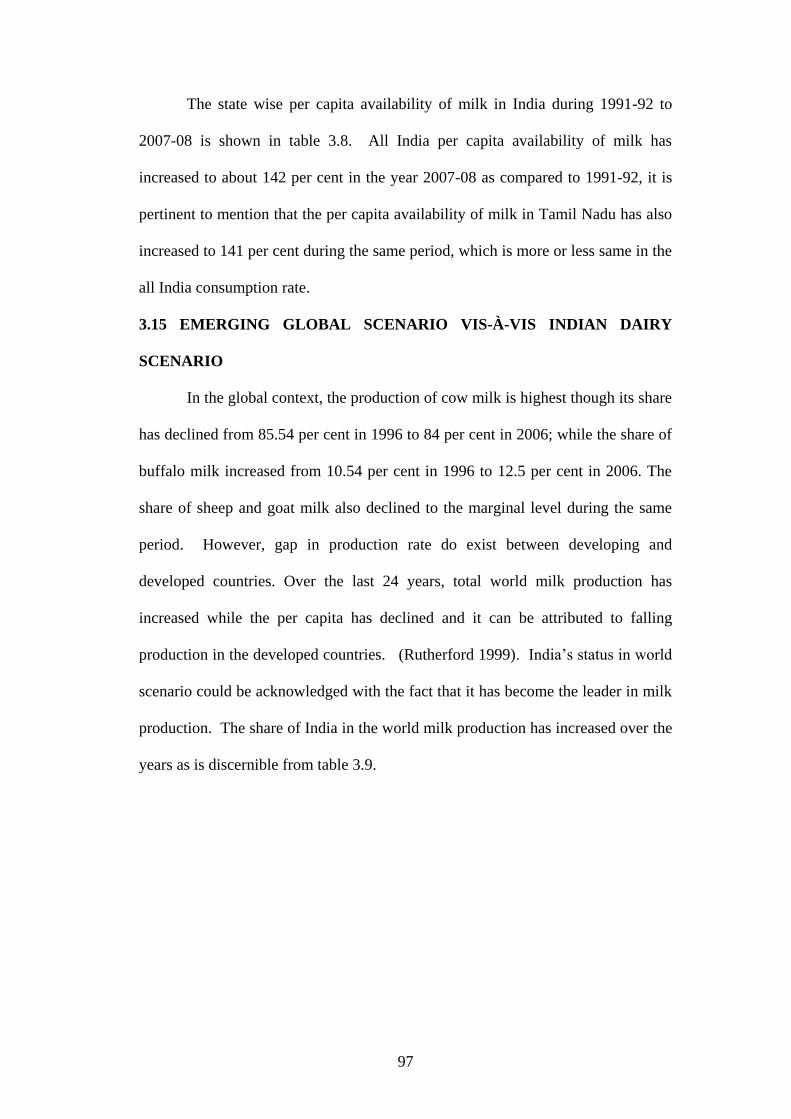
The state wise per capita availability of milk in India during 1991-92 to
2007-08 is shown in table 3.8. All India per capita availability of milk has
increased to about 142 per cent in the year 2007-08 as compared to 1991-92, it is
pertinent to mention that the per capita availability of milk in Tamil Nadu has also
increased to 141 per cent during the same period, which is more or less same in the
all India consumption rate.
3.15 EMERGING GLOBAL SCENARIO VIS-À-VIS INDIAN DAIRY
SCENARIO
In the global context, the production of cow milk is highest though its share
has declined from 85.54 per cent in 1996 to 84 per cent in 2006; while the share of
buffalo milk increased from 10.54 per cent in 1996 to 12.5 per cent in 2006. The
share of sheep and goat milk also declined to the marginal level during the same
period. However, gap in production rate do exist between developing and
developed countries. Over the last 24 years, total world milk production has
increased while the per capita has declined and it can be attributed to falling
production in the developed countries. (Rutherford 1999). India’s status in world
scenario could be acknowledged with the fact that it has become the leader in milk
production. The share of India in the world milk production has increased over the
years as is discernible from table 3.9.
98
TABLE 3.9
SHARE OF INDIA IN THE WORLD MILK PRODUCTION
(MILLION TONES)
Year World Milk
Production
Developed
countries
Developing
countries India
1981 470 (100.00) 352.(74.89) 118 (22.11) 34.30 (7.30)
1991 533 (100.00) 369 (69.23) 164 (30.77) 55.7 (10.45)
2001 590 (100.00) 346 (58.64) 244 (41.00) 80.60 (13.66)
2002 604 (100.00) 353 (58.44) 251 (41.56) 84.40 (13.97)
2003 616 (100.00) 366 (59.42) 250 (40.58) 86.20 (13.99)
2004 628 (100.00) 374 (59.55) 254 (40.44) 88.10 (14.03)
2005 648 (100.00) 372 (57.41) 259 (39.97) 91.00 (14.04)
2006 665 (100.00) 380 (57.14) 265 (39.85) 97.01 (14.59)
CGR (%)
(1981-2006) 3.2918 0.7022 9.2075 11.6710
Source: Faostat & Indiastat.Com
Figures in the brackets indicate the percentage to the world milk production
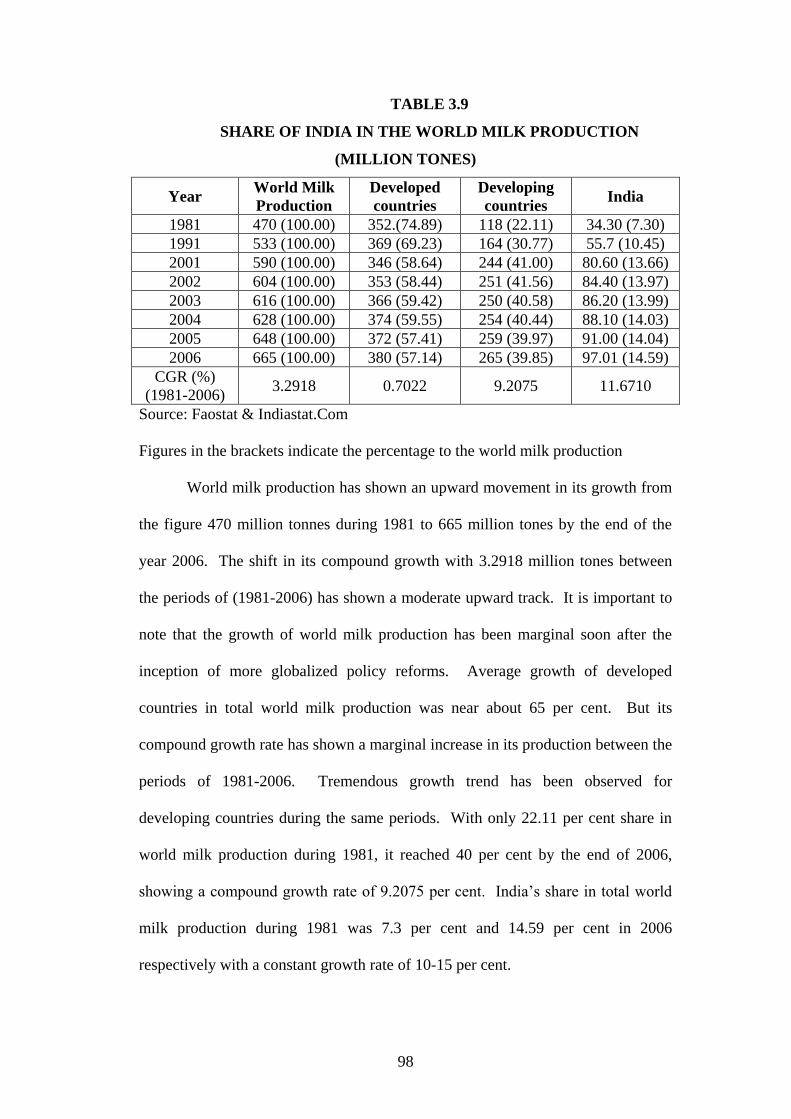
World milk production has shown an upward movement in its growth from
the figure 470 million tonnes during 1981 to 665 million tones by the end of the
year 2006. The shift in its compound growth with 3.2918 million tones between
the periods of (1981-2006) has shown a moderate upward track. It is important to
note that the growth of world milk production has been marginal soon after the
inception of more globalized policy reforms. Average growth of developed
countries in total world milk production was near about 65 per cent. But its
compound growth rate has shown a marginal increase in its production between the
periods of 1981-2006. Tremendous growth trend has been observed for
developing countries during the same periods. With only 22.11 per cent share in
world milk production during 1981, it reached 40 per cent by the end of 2006,
showing a compound growth rate of 9.2075 per cent. India’s share in total world
milk production during 1981 was 7.3 per cent and 14.59 per cent in 2006
respectively with a constant growth rate of 10-15 per cent.
99
Its compound growth has touched the mark of 11.6710 per cent. From the
above table it has been observed that in the past three decades, the percentage share
of developed countries in world milk production has gone down while the
percentage share of developing countries has shown positive results. However, the
Indian dairy sector has shown marginal shift in its production during the same
period. The six major milk producers of the world are India, EU, Russian
Federation, Pakistan and Brazil. Major thrust in production has been seen during
1980-2003 with remarkable growth of 176 per cent in India. In 1980, the share of
six biggest milk producers was 57 per cent of global market and reached 63 per
cent in 2003. It is interesting to note that during the past three decades, the total
milk production has increased but per capita milk production declined from 105 kg
in 1980 to 96 kg in 2004 showing the decline rate of 9 per cent.
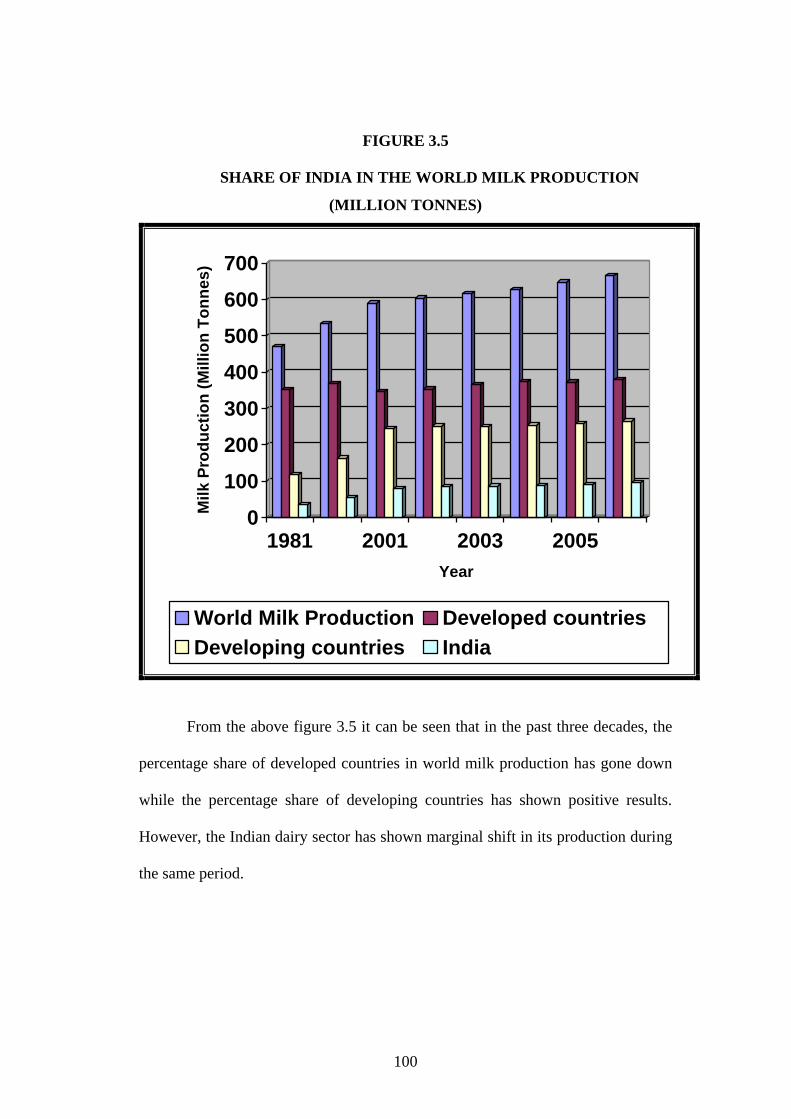
The share of India in the world milk production (million tones) is also
explained with the help of a bar diagram given in figure 3.5
100
FIGURE 3.5
SHARE OF INDIA IN THE WORLD MILK PRODUCTION
(MILLION TONNES)
0
100
200
300
400
500
600
700
Mil
k P
rod
uc
tio
n (
Mil
lio
n T
on
ne
s)
1981 2001 2003 2005
Year
World Milk Production Developed countries
Developing countries India
From the above figure 3.5 it can be seen that in the past three decades, the
percentage share of developed countries in world milk production has gone down
while the percentage share of developing countries has shown positive results.
However, the Indian dairy sector has shown marginal shift in its production during
the same period.
101
3.16 ACHIEVEMENT BY DAIRY COOPERATIVES:
The progress of dairy cooperatives in India is given in table 3.10
TABLE 3.10
ACHIEVEMENT BY DAIRY COOPERATIVES
State / UT No. of DCS
Organized
(Cumulative)
Farmer
Members
('000)
Women
Members
('000)
Milk
Procurement
(TKgPD
Milk
Marketing
@ (TLPD)
ALL - INDIA 133349 13893 3916 25089 20041
Andhra Pradesh 4656 825 167 1337 1395
Assam 66 3 0 3 3
Bihar 7320 373 57 413 395
Chhattisgarh 746 30 7 20 36
Delhi 0 0 2763
Goa 177 19 3 39 75
Gujarat 13646 2839 784 8726 2931
Haryana 6668 309 73 534 332
Himachal
Pradesh 739 32 11 46 19
Jammu &
Kashmir ** ** ** ** **
Jharkhand 44 1 0 3 205
Karnataka 11432 2024 638 3248 2267
Kerala # 3582 745 159 758 979
Madhya
Pradesh 5615 265 46 526 408
Maharashtra 21492 1761 430 3292 2892
Nagaland 46 2 0 2 4
Orissa 3111 175 74 296 274
Puducherry 101 39 18 62 88
Punjab 6711 387 53 925 656
Rajasthan 13681 678 199 1655 1191
Sikkim 272 9 1 12 12
Tamil Nadu# 9900 2203 863 2246 1986
Tripura 84 5 1 2 12
Uttar Pradesh 20473 966 264 713 455
West Bengal 2787 203 68 232 663
Source: National dairy development board
Note: (1) * refers to provisional, ** for not reported and NA for not applicable
(2) # includes conventional societies and Taluka unions formed earlier
(3) @ Cooperatives (state) and metro dairies
102
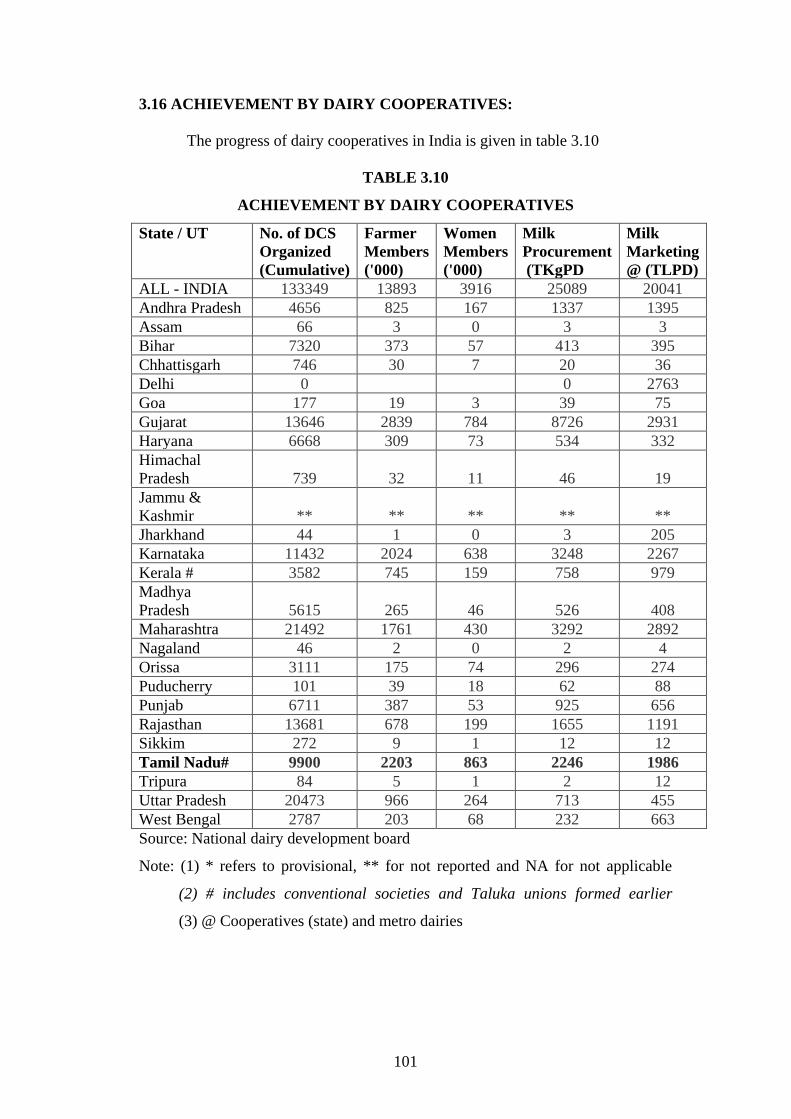
Table 3.10 shows the progress of Indian dairy co-operatives. There are
133349 dairy cooperatives, 13893000 Farmer Members of which 3916000 are
Women Members in India. On an average the Indian co-operatives procured 25089
Tonne Kg per Day and marketed 20041Tonne Liters per Day. In Tamil Nadu,
there are 9900 dairy cooperatives including conventional societies and Taluka
unions formed earlier, 2203000 farmer members of which 863000 are women
members. The average milk procured by dairy co-operatives in Tamil Nadu is 2246
Tonne Kg per day and the average milk marketed is 1986 Tonne Liters per day.
The production of milk by dairy co-operatives in Tamil Nadu is approximately 9
per cent of milk procured by the dairy co-operatives in India.
3.17 MILK CONSUMING PATTERN IN INDIA
In India about 46 % of the total milk produced is consumed in liquid form
and 47 % is converted into traditional products like cottage butter, ghee, paneer,
khoya, curd, malai, etc. Only 7 % of the milk goes into the production of western
products like milk powders, processed butter and processed cheese. Among the
milk products manufactured by the organized sector some of the prominent ones
are ghee, butter, cheese, ice creams, milk powders, malted milk food, condensed
milk infants foods etc. Of these ghee alone accounts for 85%. It is estimated that
around 20% of the total milk produced in the country is consumed at producer-
household level and the remaining is marketed through various cooperatives,
private dairies and vendors.
103
Also of the total produce more than 50 per cent is procured by cooperatives
and other private dairies. 60 per cent of the total milk procured by co-operatives is
consumed in fluid form and the rest is used for manufacturing processed value
added dairy products; As far as private dairies are concerned only 45 per cent is
marketed in fluid form and the rest is processed into value added dairy products
like ghee, makhan etc.
Still, several consumers in urban areas prefer to buy loose milk from
vendors due to the strong perception that loose milk is fresh. Also, the current level
of processing and packaging capacity limits the availability of packaged milk. As
high as 98 per cent of milk is produced in rural India and it caters to 72 per cent of
the total population. In the urban sector 28 per cent population consumes 56 per
cent of total milk produced. Even in urban India, as high as 83 per cent of the
consumed milk comes from the unorganized traditional sector. Presently only 12
per cent of the milk market is represented by packaged and branded pasteurised
milk, valued at about Rs. 8,000 crores. Quality of milk sold by the unorganized
sector, however, is inconsistent and so is the price across the season in local areas.
Adulteration of milk with water, caustic soda, and some whitening agents is a
common complaint.
India's dairy market is multi-layered. It's shaped like a pyramid with a vast
market for low-cost milk. The bulk of the demand for milk is from the poor in
urban areas whose individual requirement is small, maybe a glassful for use as
whitener for their tea and coffee. Nevertheless, it adds up to a sizable volume -
millions of litres per day.
104
In the major cities lies an immense growth potential for the modern sector.
Presently, barely 778 out of 3,700 cities and towns are served by its milk
distribution network, dispensing hygienically packed wholesome, quality
pasteurised milk. According to one estimate, the packed milk segment would
double in the next five years, giving both strength and volume to the modern
sector. The narrow tip at the top is a small but affluent market for western type
milk products.
3.18 EXPORT POTENTIAL
India has the potential to become one of the leading players in milk and
milk product exports because of its location. India is located amidst major milk
deficit countries in Asia and Africa. Major importers of milk and milk products are
Bangladesh, China, Hong Kong, Singapore, Thailand, Malaysia, Philippines,
Japan, UAE, Oman and other gulf countries, all located close to India.
India's exports of milk and milk-based products showed a significant drop
of nearly 55% during the past year and was estimated at Rs 436 crore in 2006-07.
Concentrated milk and cream products such as skimmed milk powder continues to
be the largest item of export, which together accounts for nearly 78% of net milk
and milk products exports during the year 2006-07. The exports of skimmed milk
power reached Rs 343 crore in 2006-07 as against Rs 78 crore in 2001-02. On the
other hand butter, butter oil, ghee and other milk fat together accounted for just
over 10% of the net milk and milk product exports from India during 2006-07.
105
3.19 DAIRYING IN TAMIL NADU
Dairying, by playing a significant role in strengthening rural economy has
brought about socio-economic transformation in Tamil Nadu. Small farmers,
marginal farmers and downtrodden constitute majority of milk producers. Dairying
has vast potential to generate employment and has helped in poverty alleviation in
the rural belt. Dairying provides definite and regular income and employment to
millions of rural families throughout the year, especially to women thereby
improving the quality of their life. The milk producers in the State in the Co-
operative sector on an average get daily income of Rs.329.00 lakhs collectively
(Rs.1,20,085 lakhs annually) for the milk they pour to the dairy societies which
indicate the importance of this sector in the rural economy. While India is the
largest milk producing country in the world, Tamil Nadu is one of the frontline
States in milk production and ranks as number one in the country in the coverage
of more than 50% of revenue villages under Co-operative ambit. There are 8012
functional primary milk societies with 22.09 lakhs members.
During 2008-09, average milk procurement by Dairy Co-operatives was
26.30 lakhs litres per day (LLPD). On 12.02.2009, a record milk sale of 11.03
lakhs litres was achieved in the history of Chennai Metro Dairies. The market
shares of Dairy Co-operatives have increased considerably and aavin brand holds
the major market share in Tamil Nadu.
106
3.20 DAIRY DEVELOPMENT DEPARTMENT
The growth of dairying in Tamil Nadu is laudable ever since the Dairy
Development Department was established in 1958 in Tamil Nadu. The
administrative and statutory control of all the dairy cooperatives in the State was
transferred to this department on 01.08.1965. The Commissioner for Milk
Production and Dairy Development is the Head of the Department and also
officiates as the Functional Registrar of Dairy Co-operatives. He also functions as
the Managing Director of the Tamil Nadu Co-operative Milk Producers’
Federation Limited and State Registering authority under Milk and Milk Products
Order, 1992 for the State of Tamil Nadu.
Under the relevant provisions of the Tamil Nadu Co-operative Societies
Act, 1983 and Tamil Nadu Co-operative Societies Rules, 1988, he exercises
statutory functions like registration of new societies, revival of dormant societies,
inspection of societies, settlement of disputes, conduct of election to the boards of
management, constitution of boards, issue of direction to societies in the interest of
public etc., The Commissioner for Milk Production and Dairy Development is
assisted by Deputy Milk Commissioner (Co-operation) and 23 Deputy Registrars
(Dairying) at the regional level for discharging the statutory and administrative
functions.
107
3.21 PRIMARY MILK CO-OPERATIVE SOCIETIES
There are 8012 Milk Producers’ Societies including 1408 Milk Producers
Co-operatives exclusively for women and 61 Primary Milk Consumer Co-
operative societies in Tamil Nadu. During 2008-09, 208 societies were newly
registered, including 48 milk Co-operative societies exclusively managed by
women. Apart from this, 153 dormant societies were also revived.
For the benefit of the members, farmer induction programmes are
conducted on modern animal husbandry practices for upgrading milch animals and
their productivity. Since members of the milk producers’ Co-operative societies are
stakeholders, when the society earns profit, the member producers are paid
dividend on share capital, patronage rebate and bonus for the services rendered by
them to the society .This ploughing back of profit for the benefit of producers is
unique in the dairy co-operative sector and this has created a close bond between
the producers and the co-operative societies.
3.22 DISTRICT CO-OPERATIVE MILK PRODUCERS’ UNION LIMITED
There are 17 District Co-operative Milk Producers' Unions are functioning
covering all the districts of Tamil Nadu with primary milk co-operatives as
affiliated members to the district unions. The District Collectors are the Special
Officers of the Unions. The main functions of these Unions are procurement of
milk from primary societies by ensuring clean milk production, quality based milk
cost payment, supply of input services, animal health coverage, development and
supply of feed and fodder, implementation of State and Central Government
schemes at District level, marketing of liquid milk locally and through metro
dairies and conversion of surplus milk into traditional and value added products.
108
3.23 FUNCTIONS OF MILK PRODUCERS UNIONS
The milk producers unions have the following functionalities:
Establishing chilling centers.
Finding new milk routes for collecting milk produced by the members.
Collecting milk from societies and then processing and packing those in
modern dairy plants.
Determining the procurement and selling price of milk.
Increasing the liquid milk sales by undertaking innovative promotional
activities.
Supplying inputs to the members.
Providing veterinary health services and emergency services to the
members' cattle.
Providing Artificial Insemination services to the members' cattle.
Supplying quality milk to Chennai Metro.
3.24 TAMIL NADU CO-OPERATIVE MILK PRODUCERS’ FEDERATION
The Tamil Nadu Co-operative Milk Producers' Federation Limited, the
Apex body of 17 District Co-operative Milk Producers' Unions, was established on
1st February of 1981. The Federation has 3 dairy plants in Chennai which collect
milk from District Unions, process and pack in sachets and send for sale to
consumers in and around Chennai City. Ambathur product dairy is engaged in the
manufacturing of milk products. Recently, closed circuit T.V monitoring system
has been installed at Ambattur Metro Dairy for effective supervision. Further, 5
numbers of new Road Milk Tankers were purchased at an estimated cost of
Rs.71.60 lakhs by Tamil Nadu Cooperative Milk Producers’ Federation Limited to
maintain cold chain of transportation of milk.
109
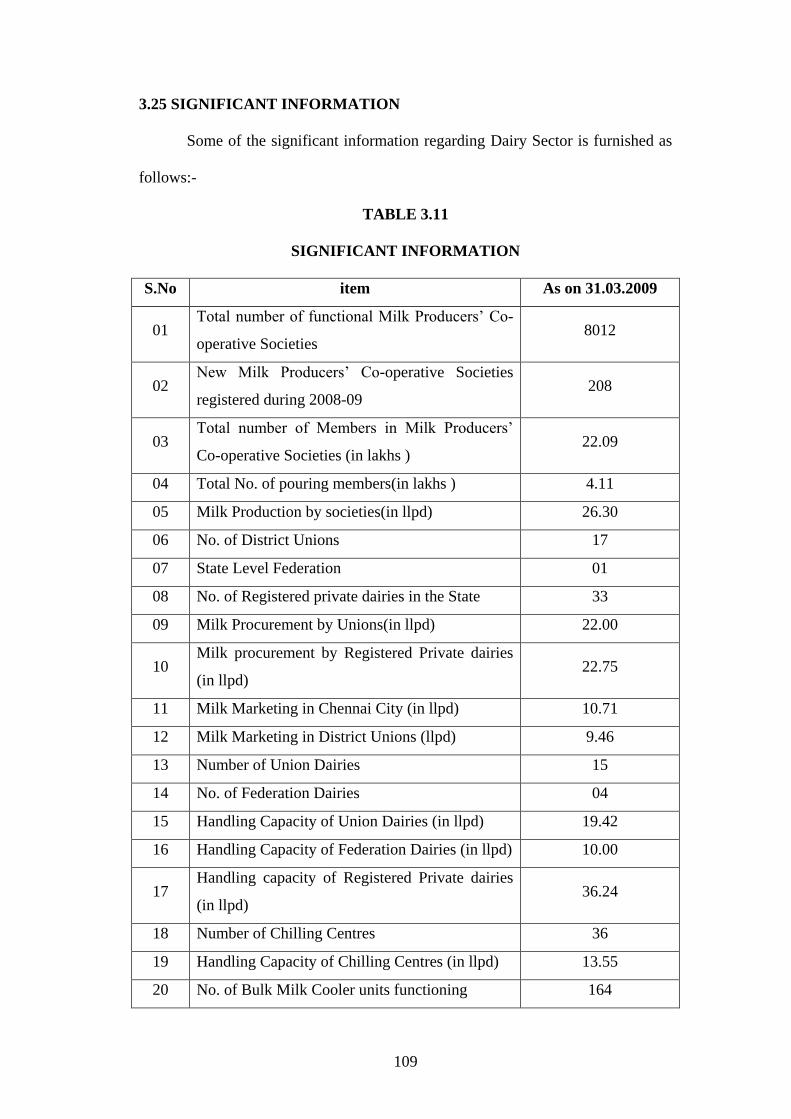
3.25 SIGNIFICANT INFORMATION
Some of the significant information regarding Dairy Sector is furnished as
follows:-
TABLE 3.11
SIGNIFICANT INFORMATION
S.No item As on 31.03.2009
01 Total number of functional Milk Producers’ Co-
operative Societies 8012
02 New Milk Producers’ Co-operative Societies
registered during 2008-09 208
03 Total number of Members in Milk Producers’
Co-operative Societies (in lakhs ) 22.09
04 Total No. of pouring members(in lakhs ) 4.11
05 Milk Production by societies(in llpd) 26.30
06 No. of District Unions 17
07 State Level Federation 01
08 No. of Registered private dairies in the State 33
09 Milk Procurement by Unions(in llpd) 22.00
10 Milk procurement by Registered Private dairies
(in llpd) 22.75
11 Milk Marketing in Chennai City (in llpd) 10.71
12 Milk Marketing in District Unions (llpd) 9.46
13 Number of Union Dairies 15
14 No. of Federation Dairies 04
15 Handling Capacity of Union Dairies (in llpd) 19.42
16 Handling Capacity of Federation Dairies (in llpd) 10.00
17 Handling capacity of Registered Private dairies
(in llpd) 36.24
18 Number of Chilling Centres 36
19 Handling Capacity of Chilling Centres (in llpd) 13.55
20 No. of Bulk Milk Cooler units functioning 164
110
21 Handling capacity of Bulk Milk Cooler (in llpd) 6.45
22 No. of rural milk collection routes 507
23 No. of milk distribution routes at District level 230
24 No. of milk distribution routes at Chennai Metro 103
25 No. of Powder Plants 04
26 Capacity of powder plants for drying milk 70 MT / day
27 No. of Automatic Vending Machine Units in
Chennai metro 189
Source: Animal Husbandry Department, Tamil Nadu
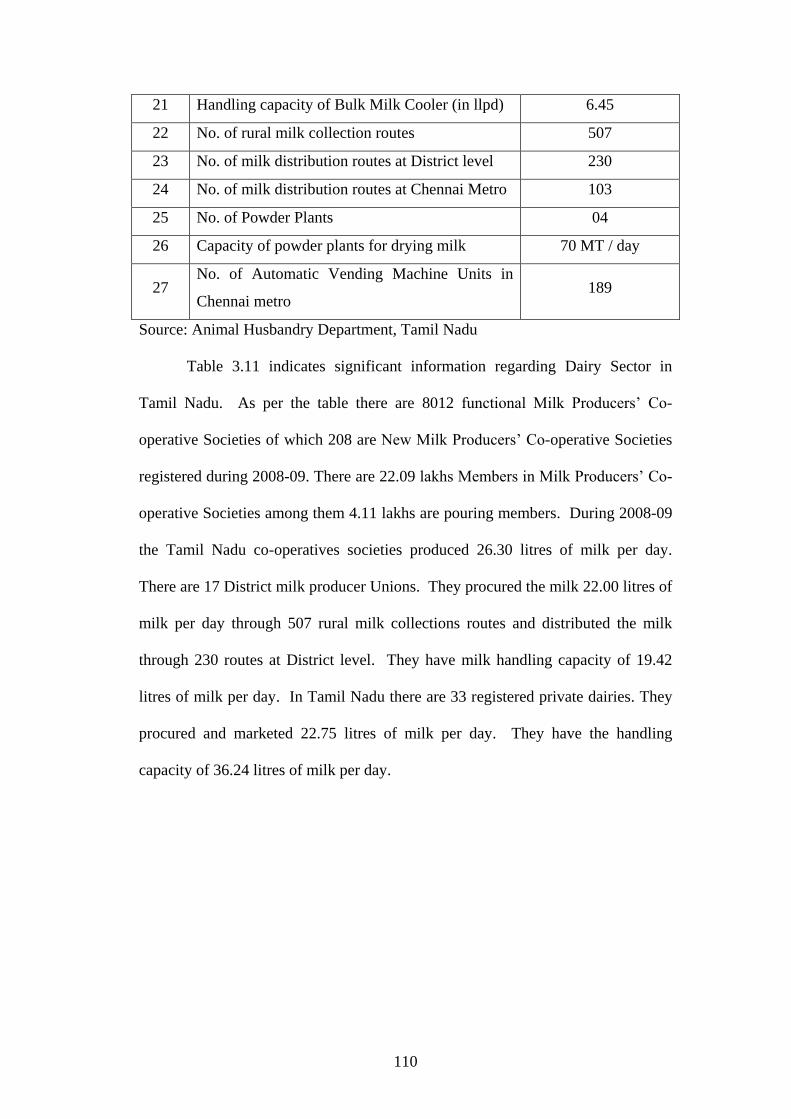
Table 3.11 indicates significant information regarding Dairy Sector in
Tamil Nadu. As per the table there are 8012 functional Milk Producers’ Co-
operative Societies of which 208 are New Milk Producers’ Co-operative Societies
registered during 2008-09. There are 22.09 lakhs Members in Milk Producers’ Co-
operative Societies among them 4.11 lakhs are pouring members. During 2008-09
the Tamil Nadu co-operatives societies produced 26.30 litres of milk per day.
There are 17 District milk producer Unions. They procured the milk 22.00 litres of
milk per day through 507 rural milk collections routes and distributed the milk
through 230 routes at District level. They have milk handling capacity of 19.42
litres of milk per day. In Tamil Nadu there are 33 registered private dairies. They
procured and marketed 22.75 litres of milk per day. They have the handling
capacity of 36.24 litres of milk per day.
111
3.26 PERFORMANCE OF TAMIL NADU MILK COOPERATIVES
Tamil Nadu, with a daily milk production of 145.88 lakh litres,
is one of the leading states in milk production in India and the Tamil Nadu milk
cooperatives play a major role in the development of dairy within the state. The
milk cooperatives of Tamil Nadu, with the help from the government and National
Dairy Development Board (NDDB), have played substantial roles in taking the
state to the current position. Besides, NDDB also undertakes methodical approach
and appropriate strategy for the upliftment of Tamil Nadu milk cooperatives.
3.26.1 The Model
The dairy development programmes in Tamil Nadu have been implemented
through a wide network of co-operatives, which follow the ‘Anand Model’ of the
state of Gujarat. The model follows three-tier structure where primary milk
producers' co-operative societies remain at the base level. In the district level, there
is a union of producers' co-operative societies, whereas, Federation of District Co-
operative Milk Producers' Union remains at the top (state) level of the structure.
In Tamil Nadu, Milk Producers' Cooperative Societies function at the village level,
where milk producers get enrolled as members. The members get animal health
cover for their animals; breed improvement is also carried out. District unions
collect the milk produced at the village societies.
3.26.2 List of Tamil Nadu Milk Co-operatives
There are 17 district co-operative milk producer's unions in Tamil Nadu.
These milk co-operatives cover 32 districts across the state. There are also 15
diaries with a processing capacity of 19.42 LPD and 36 chilling centers with
chilling capacities of 13.55 LPD. The milk procurement by district Co-operative
milk producers’ unions in Tamil Nadu is presented in table 3.12
112
TABLE 3.12
MILK PROCUREMENT BY DISTRICT CO-OPERATIVE MILK
PRODUCERS’ UNIONS
(As on 31.03.2009)
S.No Name of the Union 2007-08 2008-09 Change (%)
(In thousand litres per day)
01 Kancheepuram-Tiruvallur 48 43 -10.42
02 Villupuram 165 164 -0.61
03 Vellore 276 291 -05.43
04 Dharmapuri 139 143 02.88
05 Salem 407 436 07.13
06 Erode 193 203 05.18
07 Coimbatore 208 203 -02.40
08 The Nilgiris 22 21 -04.55
09 Madurai 227 222 -02.20
10 Dindigul 40 42 05.00
11 Tiruchirapalli 286 279 -02.45
12 Thanjavur 34 30 -11.76
13 Pudukottai 11 13 18.18
14 Sivagangai 30 30 -
15 Virudhunagar 11 09 18.18
16 Tirunelveli 61 64 04.92
17 Kanyakumari 06 07 16.67
Total 2164 2200 01.66
Source: Animal Husbandry Department, Tamil Nadu
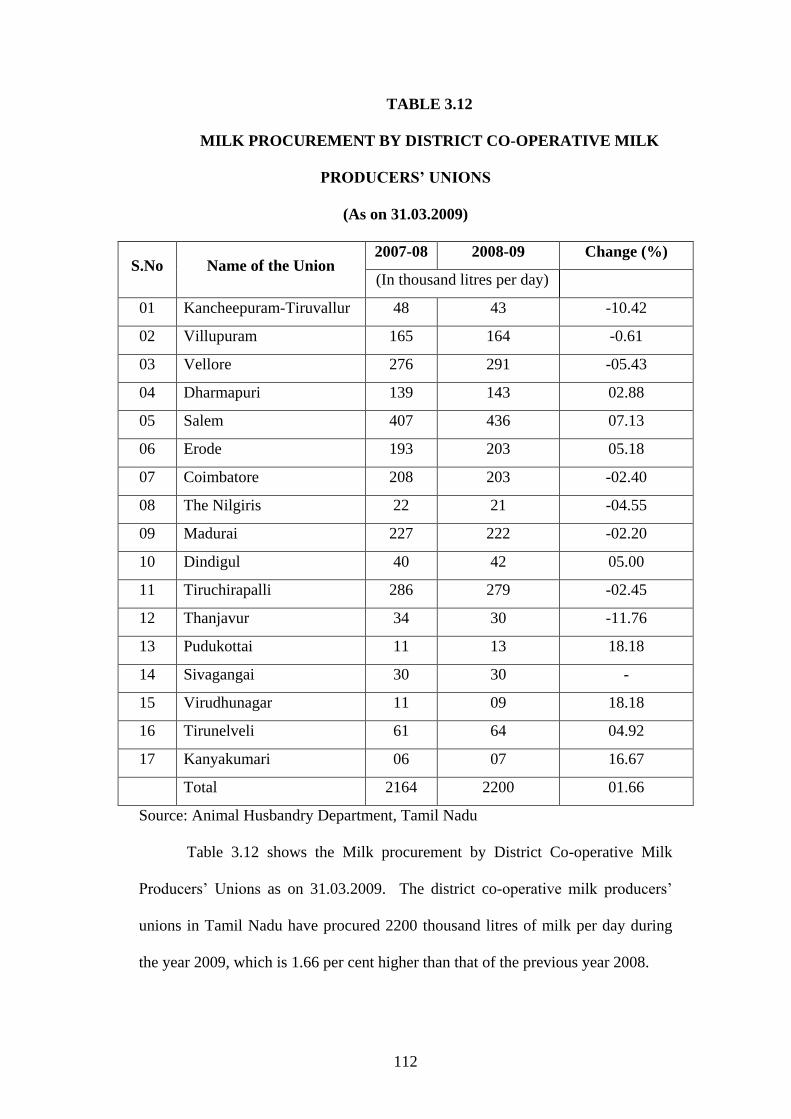
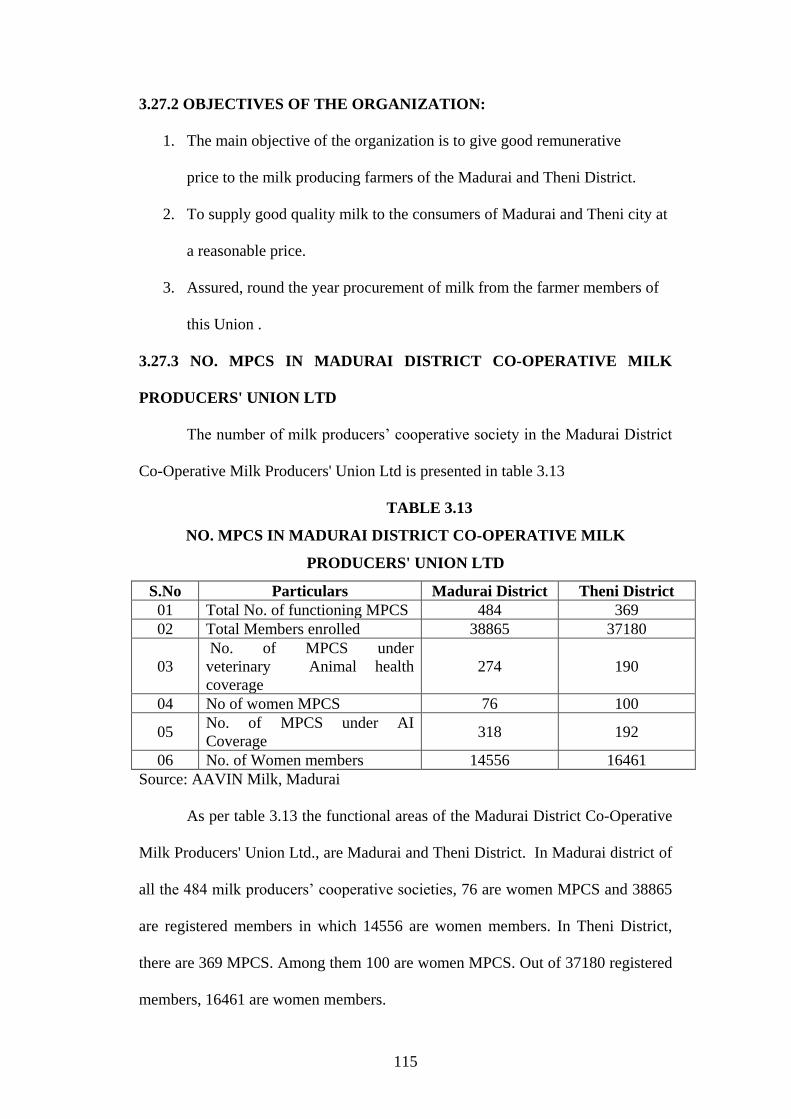
Table 3.12 shows the Milk procurement by District Co-operative Milk
Producers’ Unions as on 31.03.2009. The district co-operative milk producers’
unions in Tamil Nadu have procured 2200 thousand litres of milk per day during
the year 2009, which is 1.66 per cent higher than that of the previous year 2008.
113
Among the 17 district co-operative milk producers’ union, eight unions
namely Kancheepuram-Tiruvallur, Villupuram, Vellore, Coimbatore, The Nilgiris,
Madurai, Tiruchirapalli, and Thanjavur have negative growth for procurement of
milk per day during 2009 as compared to 2008.
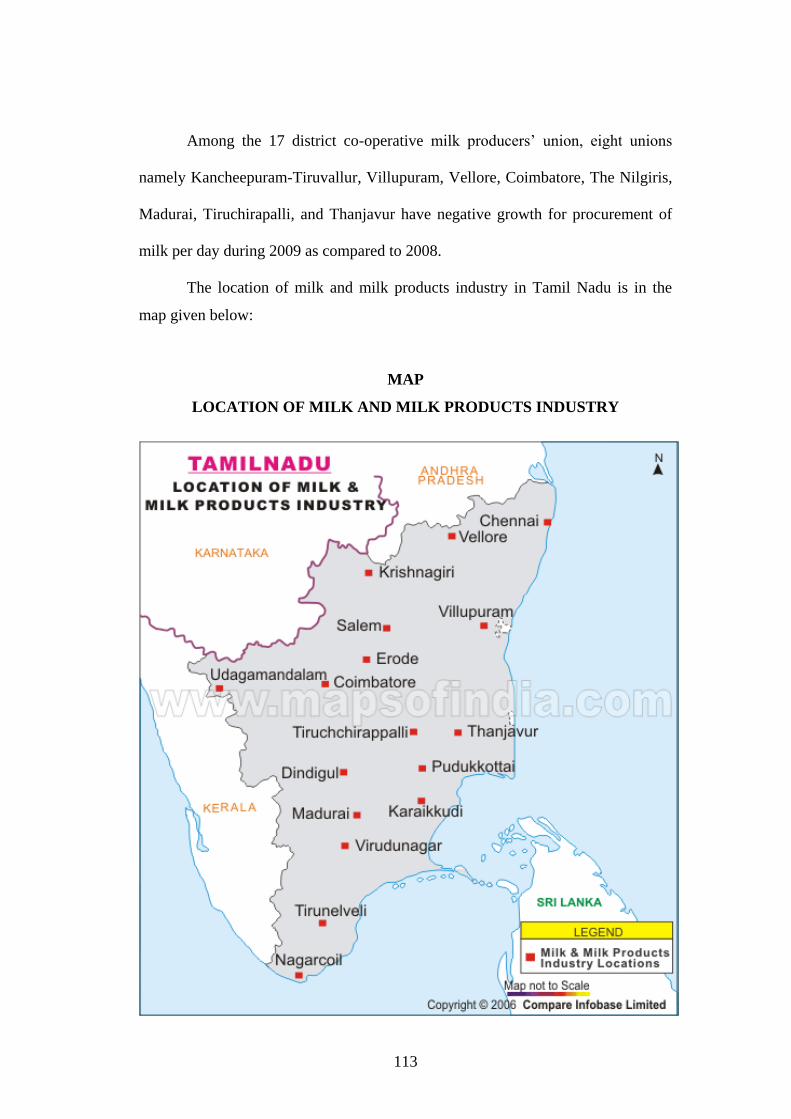
The location of milk and milk products industry in Tamil Nadu is in the
map given below:
MAP
LOCATION OF MILK AND MILK PRODUCTS INDUSTRY
114
3.27 PROFILE OF THE MADURAI DISTRICT CO-OPERATIVE MILK
PRODUCERS' UNION LTD
The Madurai District Co-operative Milk Producers’ Union Ltd, is popularly
known as Madurai Aavin. This is one of the largest dairies in the southern part of
Tamilnadu. Madurai Aavin was started in the year 1967 as Madurai Milk Project.
The project and the dairy machinery were funded by the UNICEF under New
Zealand free from Hunger Campaign Committee.
From 01.01.1974 Madurai Aavin brought under the control of Tamilnadu
Dairy Development Corporation Ltd, Chennai. From 1982 onwards Madurai
Aavin was converted in to and functioning as a District Co-operative Unit. The
members of this Co-operative unit are the Milk Producers’ Coop society at the
village level in both Madurai and Theni Districts.
Madurai Aavin is a Co-operative organization statutorily controlled by the
Commissioner for Milk Production and Dairy Development, Government of
Tamilnnadu. The apex body for this unit is the Tamilnadu Co-operative Milk
Producers’ Federation Ltd, Chennai.
3.27.1 LOCATION
The Madurai Aavin is located in an area of 39.42 acres of land at the
junction of the K. K. Nagar and Annanagar in the Madurai-Sivagangai Highways,
nearer to the Office of the Madurai District Collector.
115
3.27.2 OBJECTIVES OF THE ORGANIZATION:
1. The main objective of the organization is to give good remunerative
price to the milk producing farmers of the Madurai and Theni District.
2. To supply good quality milk to the consumers of Madurai and Theni city at
a reasonable price.
3. Assured, round the year procurement of milk from the farmer members of
this Union .
3.27.3 NO. MPCS IN MADURAI DISTRICT CO-OPERATIVE MILK
PRODUCERS' UNION LTD
The number of milk producers’ cooperative society in the Madurai District
Co-Operative Milk Producers' Union Ltd is presented in table 3.13
TABLE 3.13
NO. MPCS IN MADURAI DISTRICT CO-OPERATIVE MILK
PRODUCERS' UNION LTD
S.No Particulars Madurai District Theni District
01 Total No. of functioning MPCS 484 369
02 Total Members enrolled 38865 37180
03
No. of MPCS under
veterinary Animal health
coverage
274 190
04 No of women MPCS 76 100
05 No. of MPCS under AI
Coverage 318 192
06 No. of Women members 14556 16461
Source: AAVIN Milk, Madurai
As per table 3.13 the functional areas of the Madurai District Co-Operative
Milk Producers' Union Ltd., are Madurai and Theni District. In Madurai district of
all the 484 milk producers’ cooperative societies, 76 are women MPCS and 38865
are registered members in which 14556 are women members. In Theni District,
there are 369 MPCS. Among them 100 are women MPCS. Out of 37180 registered
members, 16461 are women members.
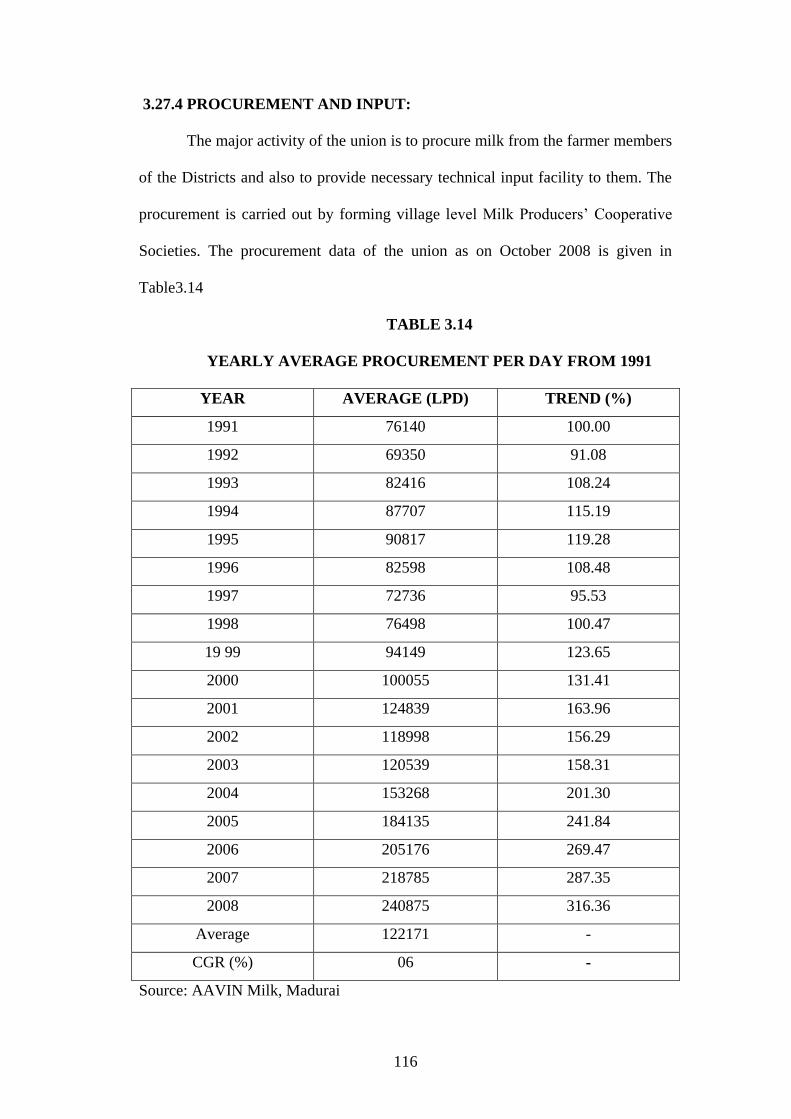
116
3.27.4 PROCUREMENT AND INPUT:
The major activity of the union is to procure milk from the farmer members
of the Districts and also to provide necessary technical input facility to them. The
procurement is carried out by forming village level Milk Producers’ Cooperative
Societies. The procurement data of the union as on October 2008 is given in
Table3.14
TABLE 3.14
YEARLY AVERAGE PROCUREMENT PER DAY FROM 1991
YEAR AVERAGE (LPD) TREND (%)
1991 76140 100.00
1992 69350 91.08
1993 82416 108.24
1994 87707 115.19
1995 90817 119.28
1996 82598 108.48
1997 72736 95.53
1998 76498 100.47
19 99 94149 123.65
2000 100055 131.41
2001 124839 163.96
2002 118998 156.29
2003 120539 158.31
2004 153268 201.30
2005 184135 241.84
2006 205176 269.47
2007 218785 287.35
2008 240875 316.36
Average 122171 -
CGR (%) 06 -
Source: AAVIN Milk, Madurai
117
Table 3.14 revealed the procurement of milk per day from 1991to 2008 by
Madurai District Co-operative Milk Producers' Union Ltd. As per table there is no
significant improvement in the procurement of milk by the union till 1998.
Thereafter the procurement of milk per day considerably increased, it has grown to
nearly 3 times in the year 2008 as compared to 1991. The average procurement of
milk per day during this period is 122171 Liters per day and the compound growth
rate is about 06 per cent.
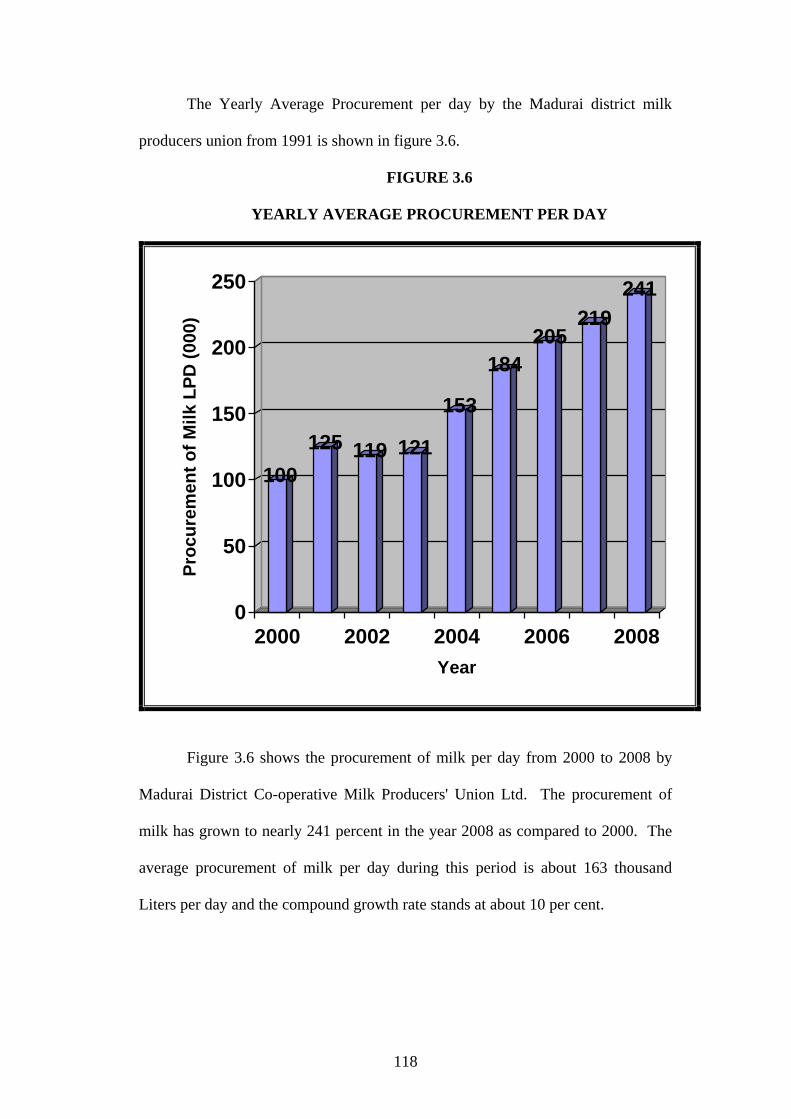
118
The Yearly Average Procurement per day by the Madurai district milk
producers union from 1991 is shown in figure 3.6.
FIGURE 3.6
YEARLY AVERAGE PROCUREMENT PER DAY
100
125 119 121
153
184
205219
241
0
50
100
150
200
250
Pro
cu
rem
en
t o
f M
ilk
LP
D (
000
)
2000 2002 2004 2006 2008
Year
Figure 3.6 shows the procurement of milk per day from 2000 to 2008 by
Madurai District Co-operative Milk Producers' Union Ltd. The procurement of
milk has grown to nearly 241 percent in the year 2008 as compared to 2000. The
average procurement of milk per day during this period is about 163 thousand
Liters per day and the compound growth rate stands at about 10 per cent.