chapter four - makerere universitydocs.mak.ac.ug/sites/default/files/dissertation sept2011.doc ·...
TRANSCRIPT
COUNTRY OF ORIGIN EFFECTS AND LOYALTY FOR CEMENT BRANDS
IN UGANDA
THURANIRA THIMANGU
REG NO. 2006/HD10/8233K
A RESEARCH REPORT SUBMITED IN PARTIAL FULFILLMENT OF
REQUIREMENT FOR THE DEGREE OF MASTER OF SCIENCE
IN MARKETING OF MAKERERE UNIVERSITY
DECEMBER 2010

DECLARATION
I declare that the work presented and submitted is original and has never been done for any
other degree award in any other university before.
Signature ………………………………………………………….
Thuranira Thimangu
[Student]
Signature …………………………………………………………….
Dr. Joseph Ntayi
[Supervisor]
Signature …………………………………………
Charles Omagor
[Supervisor]
ii

DEDICATION
This research is heartedly dedicated to my parents(Mzee M’thimangu and Martha Mwonjiru)
who struggled to raise and educate us through difficulties and especially my late father Mzee
Andrew M’thimangu who at one time had to chose not to pay court fine and opted to go to
jail during the colonial era so that he could pay fees for his children(RIP).
iii

ACKNOWLEDGEMENT
Though I did this research report single handedly, I was socially and technically offered
support by a number of individuals and parties that I feel indebted to mention.
I hereby acknowledge my supervisors, Dr Joseph Ntayi and Mr. Charles Omagor who
critically guided me throughout the entire research project. Encouragement also from my
wife Damaris who mentally inspired me cannot go unmentioned and my children also
Kithinji, Karei and Mwendwa who always kept on asking me when I was going to graduate.
Also to all friends who assisted and encouraged me in any way are highly acknowledged.
iv

TABLE OF CONTENTS
DECLARATION.......................................................................................................................iiDEDICATION..........................................................................................................................iiiACKNOWLEDGEMENT........................................................................................................ivABSTRACT.............................................................................................................................viiCHAPTER ONE........................................................................................................................11.0 Background..........................................................................................................................11.1 Statement of the problem.....................................................................................................21.4 Research hypotheses............................................................................................................31.5 Significance of the study......................................................................................................31.6 Conceptual framework.........................................................................................................41.7 Scope of the study................................................................................................................5CHAPTER TWO: LITERATURE REVIEW...........................................................................62.1 Country of Origin and brand loyalty....................................................................................62.2 Perceived quality and brand loyalty.....................................................................................82.3 Perceived Value and brand loyalty......................................................................................92.4 Brand loyalty......................................................................................................................10CHAPTER THREE: RESEARCH METHODOLOGY...........................................................123.1 Research Design.................................................................................................................123.2 Population and Sampling design........................................................................................123.3 Data Collection...................................................................................................................133.4 Research instrument...........................................................................................................133.5 Data collection Method......................................................................................................133.6 Research Procedure............................................................................................................143.7 Data quality control............................................................................................................153.8 Measurements of variables.................................................................................................153.9 Data analysis methods......................................................................................................16CHAPTER FOUR: RESULTS AND FINDINGS OF THE STUDY......................................174.0 Introduction........................................................................................................................174.1 Sample characteristics........................................................................................................184.2 The level of Country of Origin Effects, Brand Loyalty, Perceived Value and Perceived Quality among Cement users in Uganda..................................................................................244.3 Relationships between Variables.......................................................................................264.4 Regression Analysis...........................................................................................................28
v

4.5 Further Findings.................................................................................................................29CHAPTER FIVE: DISCUSSION, RECOMMENDATIONS AND CONCLUSIONS...........315.1 Introduction..................................................................................................................315.2 The level of Country of Origin Effects, Brand Loyalty, Perceived Value and Perceived Quality among Cement users in Uganda.................................................................315.3 Country of Origin effects and Brand Loyalty..............................................................325.4 Country of Origin Effects, Perceived Value and Brand Loyalty.................................335.5 Country Of Origin Effects, Perceived Quality, Perceived Value And Brand Loyalty.345.6 Conclusions..................................................................................................................345.7 Recommendations........................................................................................................355.8 Areas for further research.............................................................................................36REFERENCES.......................................................................................................................38
vi

ABSTRACT
This study was aimed at examination of the level of the Country of Origin effects, Perceived
Value, Perceived Quality among the Cement users, and examine how these variables are
related to the Brand Loyalty element. To efficiently conduct the study, the researcher targeted
108 Hardware dealers located in Kampala who sell cement as per the rationale of Krejcie and
Morgan (1970) to make a more scientifically justifiable sampling frame. The results indicated
positive relationships between the variables which, were Country of Origin effects, Perceived
value and quality and Brand loyalty. The regression model shows that the various
independent and intervening variables are able to explain 35.1% of Brand Loyalty. After
these findings, various recommendations were raised and these included; To attract more
demand as regards the country of origin, manufacturers who import to Uganda and don’t
have plants in Uganda should rethink putting up factories here. This will have more appeal to
the citizens as they feel it belongs to them. This has been reflected in the results whereby
most of the respondent preferred the brands from Uganda. Manufacturers of these brands
ought to communicate the value of their cement brands to key parties in their markets for
instance the opinion leaders in the construction industry and this will help form the necessary
attitudes toward brands. This can be done through advertisements in both electronic and print
media, through sponsorships, seminars.
vii

viii

CHAPTER ONE
1.0 Background
The Uganda market has continued to attract more cement imports despite surplus production of
cement by two local cement manufacturers (Tororo and Hima cements). The Ugandan cement
market has an annual consumption capacity of more than 1,100 metric tons of cement
(www.ubos.org).This is a market which has mostly been dominated by Rock and Multipurpose
brands from Tororo and Hima respectively. Other players are mostly imports from Kenya, China,
Egypt, South Africa, Turkey, Pakistan etc. The increase in imports despite the availability of
local cement brands is an indication that there is brand switching from local to imported brands.
The imported brands account for more than 47% of the total domestic consumption and their
demand is on the rise (See appendix 1). This increment in imports has been intensified by
competition on the local market. Due to this competition from imports, the local manufacturers
have embarked on exploring export markets for the surplus and they are realizing positive results
(see appendix). The period 2004 to 2008, the cement Imports increased by 146% while on the
other hand, the Local Production in the country increased by 29%. This could be attributed to
increased demand in the Ugandan market. However the big increase for the imports is a
reflection of consumer’s preference for imported cement
The total production in Uganda is more than 1,500mt annually against a demand of 1,100mt.
(www.tororocement.com and daily monitor of 17/07/2009). This means there is surplus and
consumers are still buying imports and this can be attributed to quality issues because there has
been fake cement in the market due to adulteration and this has made the consumer perceive
imported cement as better in terms of quality and value (Conan Businge, New Vision of

1/07/2009, and Godfrey Kimono, New Vision of 10/01/2010). With this in mind, it is no surprise
that exports increased by 994% and the Net Domestic Consumption increased by 48% between
2004-2008 (www.ubos.org). In addition, the Uganda manufacturers association has advocated
Ugandans to buy Ugandan product as a way of promoting brand loyalty amongst Ugandans due
to competition from imports (www.ubos.org).
It is against this background that this study seeks to establish the relationship between Coo
effects and brand loyalty, Perceived value and perceived quality.
Uganda consumption of imported cement brands has been observed to be on the rise despite
abundance of local brands (2009 UBOS Import Records). There is a growing interest and
demand among Ugandan consumers for imported brands for foreign brands this could be
attributed to Country of Origin effects, negative effects associated with the Perceived Quality
and Perceived Value of these local brands which have consequently improved the Loyalty for
imported cement brands.
1.1 Statement of the problem
Uganda usage and transactions of imported cement brands among the Hardware dealers has been
observed to be on the rise despite abundance of local brands (2009, UBOS Import Records). This
growing interest and demand for imported brands for foreign brands could be attributed to
Country of Origin effects, negative effects associated with the Perceived Quality and Perceived
Value of these local brands which have consequently improved the Loyalty for imported cement
brands.

1.2 Purpose of the study
The purpose of the study was examine the level of the Country of Origin effects, Perceived
Value, Perceived Quality among the Cement users, and examine how these variables are related
to the Brand Loyalty element.
1.3 Research Objectives
i. To examine the level of Country of Origin Effects, Brand Loyalty, Perceived Value and
Perceived Quality among Cement users in Uganda.
ii. To establish the relationship between country of Origin effects and brand loyalty.
iii. To establish the relationship between country of origin effects, perceived value and brand
loyalty
iv. To establish the relationship between country of origin effects, perceived quality, perceived
value and brand loyalty.
1.4 Research hypotheses
i. What is the level of Country of Origin Effects, Brand Loyalty, Perceived Value and
Perceived Quality among Cement users in Uganda?
ii. What is the relationship between country of Origin effects and brand loyalty?
iii. What is the relationship between country of origin effects, perceived value and brand
loyalty?
iv. What is the relationship between country of origin effects, perceived quality, perceived
value and brand loyalty?

1.5 Significance of the study
Findings of this study will help the manufacturers of Cement in understanding how the country
of origin effect, affects their export market. This will help them in laying down fundamental
competitive strategies for share of mind, survival, market share expansion, customer retention,
building on customer loyalty etc.
The study will also help marketers’ especially in export markets in understanding the importance
of country of origin and will use the marketing tools of marketing mix at their disposal to capture
either consumer’s positive/negative perception about their respective brands. This will lead to
increased market share.
Consumers will also benefit in understanding their own behavior. With such knowledge,
consumers will be able to make fast viable decisions. For academicians, various proposals will
be suggested for further research. The research will also be of fundamental importance to both
future researchers and academicians in pursuing this subject further.
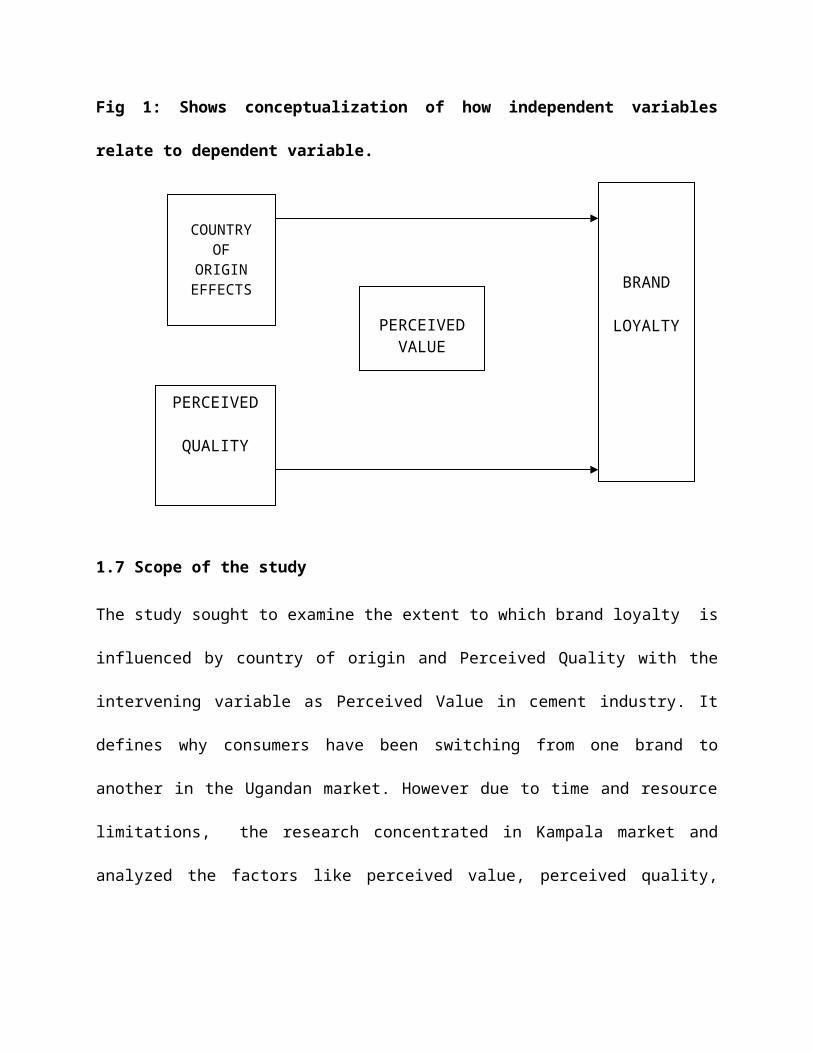
1.6 Conceptual framework
The conceptual framework will be based on three independent variables viz: country of origin,
perceived quality and perceived value. However, there are other variables like word of mouth,
price, promotion, packaging etc which also have effects on country of origin and brand loyalty.
There are also other moderating variables like government policies and various associations
which also have effects on coo and brand loyalty. The conceptual frame work was mostly
influenced by the following scholars’ works; Carmina and Carlos Flavian (Intrinsic and extrinsic
quality attributes, loyalty and buying intention: an analysis for a PDO product).
Fig 1: Shows conceptualization of how independent variables relate to dependent variable.
1.7 Scope of the study
The study sought to examine the extent to which brand loyalty is influenced by country of origin
and Perceived Quality with the intervening variable as Perceived Value in cement industry. It
defines why consumers have been switching from one brand to another in the Ugandan market.
However due to time and resource limitations, the research concentrated in Kampala market and
analyzed the factors like perceived value, perceived quality, price, packaging, word of mouth,
promotions etc that affect the country of origin in regard to brand loyalty.
COUNTRYOF
ORIGINEFFECTS
PERCEIVED
QUALITY
BRAND
LOYALTYPERCEIVED
VALUE

CHAPTER TWO: LITERATURE REVIEW
2.0 Introduction
This section presents a review on the related literature on the subject under study. It
encompasses, review on various studies presented by various scholars, researchers, analysts and
the authors. Materials will be drawn from various sources closely related to the objectives of the
study. Where appropriate, models will be used to demonstrate the various subtopics mentioned in
the objectives.
2.1 Country of Origin and brand loyalty.
Country of origin is defined as the country with which a particular product or service is
associated. The Country of manufacture (COM), in the case of products, or the Country where
the headquarters are located, in the case of both products and services. Country of origin effect
(COE) can be defined as any influence that the Country of manufacture, assembly or design has
on a consumer’s positive or negative perception of a product (McKenzie-Minifie, 2007).
According to Usunier (2006), country of origin effect poses a barrier to enter new markets in the
form of negative consumer bias toward imported products.
The country of origin as the country where corporate headquarters’ of the company marketing
the product or brand is located. This is the home country for the company (Usunier ,2006).
Country of origin (COO) perceptions is the mental associations and beliefs triggered by a
Country. Country image may be an asset when it is positive and a liability when it is negative. A
positive image is important to strengthen a Country’s image and help domestic marketers who

export and to attract foreign firms and investors (Ahmed et al., 2004). Marketers want to use
country of origin perceptions in the most advantageous way possible to sell their products and
services
Liberalization and deregulation of world markets have driven many companies to
internationalize their marketing activities to survive and grow. Success internationally clearly
depends on the acceptability of products by consumers in different countries (Kaynak, 2000).
During the past several decades, country-of-origin research has attracted significant attention
from researchers and practitioners alike around the globe (Erickson, 1984; Lusk et al., 2006).
Part of the reason for this continuous interest in the subject area is attributable to increased global
competition among foreign firms operating in different parts of the globe. These firms, in most
cases, are not only offering more variety and assortment of products but also offering them at
very competitive prices. This, coupled with the increased standards of living and improved
lifestyles of consumers around the world, and improved global communication and increased use
of Internet-based communication means, target customers in markets worldwide are exposed to
and are selecting from a wider range of foreign products/brands than ever before. From a
marketing standpoint, Companies that are operating in competitive domestic and foreign markets
need to understand consumers’ perceptions and evaluations of foreign made products more than
ever before (Lusk et al., 2006). Accordingly, marketers have shown a growing interest in
understanding the factors that affect consumers’ evaluations of foreign products against domestic
ones.
Therefore, researchers in marketing started investigating the marketplace behavior of consumers
in cross-cultural/national settings more than before. Despite this increased interest, studies that

investigate the product perceptions and judgments of consumers in developing countries and
newly emerging economies are relatively low (Golan et al., 2007). This scarcity exists even
though multinational companies around the world have expanded their operations in many
developing countries of Latin America, Africa, the Middle East and Asia-Pacific region, and
have faced significant challenges (Roth and Romeo, 1992; Bhaskaran and Sukumaran, 2007).
Also, a significant population growth and increased consumer wealth and purchasing power in
advanced developing countries offer greater market opportunities to western companies whose
domestic markets, in most cases, have already reached maturity stage and/or are highly
competitive due to significant numbers of foreign competitors in those markets and saturated
home market demand.
Country of origin effects are of particular interest to international marketing researchers because
of their impact on the evaluations that help to influence customers’ purchase decisions. We often
hear comments like ‘Japanese cars are reliable’, and that Germany leads the world in engineering
technology. Hence we can conclude that country of origin perceptions help to form overall
attitudes on certain product attributes and also have some impact on customers.
2.2 Perceived quality and brand loyalty
According to business dictionary, perceived quality is the Consumer's opinion of a product's (or a
brand) ability to fulfill his or her expectations. It may have little or nothing to do with the actual
excellence of the product, and is based on the firms (or brand's) current public image.
Consumer’s experience with the firm's other products, and the influence of the opinion leaders,
consumer's peer group, and others. Olshavsky (1985, in Rowley, 1998) views quality views as a
form of overall evaluation of a product. Similarly, Holbrook and corfman (1981, in Rowley,

1998) suggested that quality acts as a relatively global value judgment which is created in
relationship between customers and suppliers. Coo and its level of development and brand
familiarity leads to positive brand evaluation and hence brand loyalty.
2.3 Perceived Value and brand loyalty
According to different authors, customer perceived value is a multidimensional concept, which
presents a trade-off between benefits and sacrifices perceived by customers in a supplier’s
offering (e.g.Woodruff et al., 1993; Zeithaml et al., 1996; Snoj and Gabrijan, 2000; Slater and
Narver, 2000; Ulaga and Chacour, 2001) Perceived benefits are a combination of different
attributes of products (tangible and intangible intrinsic and extrinsic etc.), available in relation to
a particular buy and use situation. Perceived sacrifice are a combination of a nominal price and
all other costs of product acquisition and its use (e.g. Zeithaml, 1988; Monroe, 1990; Pisnik,
2000; Slater and Narver, 2000; Ulaga and Chacour, 2001).
The utility theory, which lies at the foundation of the modern microeconomic theory, provides a
theoretical underpinning for the value concept Lanchester, 1971, in Caruana et al., 2000). This
approach stresses that very often customers do not buy products (i.e. goods, services) for their
own sake. They buy bundles of attributes which derive value according to the utility (benefits)
provided by the combination of attributes less the disutility represented by their sacrifices in
obtaining the product. In other words, the value is conceptualized as a customer’s perceived net
trade-off received from all relevant benefits and costs or sacrifices delivered by a product or
service or supplier and its use. This platform is also used in most discussions of customer value
research (e.g. Raghubir, 1998; Sinha and DeSarbo, 1998; Flint and Woodruff, 2001).

2.4 Brand loyalty
One of the definitions of brand loyalty that has made the greatest impact in the specialist
proposes that loyalty reflects: a deeply held commitment to rebuy or repatronize a preferred
product/service consistently in the future, thereby causing repetitive same-brand or same brand
buying, despite situational influences and marketing efforts having the potential to cause
switching behaviour (Oliver, 1999; Erdem et al., 2006).
This definition brings out the differences between the two analytic perspectives considered in the
majority of recent papers (Barroso and Martin, 1999; Caruana, 2002):
I. From a behavioral standpoint, loyalty is seen as effective consumer behavior toward a
specific product, brand or establishment over time. In this approach, loyalty is analyzed on
the basis of repeat purchase or relative purchase volume patterns for the same brands or
establishments (Dunn and Wrigley, 1984; Sniehotta et al., 2005).
II. From the attitudinal standpoint, the behavioral approach is considered insufficient to
explain how and why true loyalty develops and is maintained (Dick and Basu, 1994;
Sniehotta et al., 2005). These authors argue that loyalty can only be viewed as an attitude
when positive affects and feelings toward a product or brands are involved.
Similarly, the concept of buying intentions reflects consumers' foreseeable behavior in short-
term future buying decisions (e.g. what product or brand the consumer will buy when he visits
the supermarket next.
More specifically, we would point out that buying intention is a future projection of consumer
behavior that will significantly contribute to the configuration of attitudes. Indeed, if we examine
the basic components of the attitudes model, we find that attitudes in fact develop due to a
combination of three basic elements associated with beliefs, emotional responses and the
foreseeable actions of the consumer (Asael, 1995; Snoj et al., 2004).
Specifically, the cognitive component reflects individuals' knowledge of and beliefs about a
given product or service (Wood, 2004), while the affective component arises as a result of a
person's emotions or feelings toward a product or service. Finally, the conative or behavioral
component would be the expression of the consumer's buying intention (Shukla, 2009)
Meanwhile, attitudes develop over time via a process of learning and are affected by family
influences, the social groups to which the individual belongs or aspires to belong, the
information received, experience and personality.

CHAPTER THREE: RESEARCH METHODOLOGY.
3.0 Introduction
This is a chapter that describes the Methodology that was used as an aid to carrying out the
research study. It is a plan for selecting the sources and types of information used to answer the
research question. It provides answers for such questions as; what techniques will be used to
gather data? What population will be studied? What kind of sampling will be used? How will
data be collected? And how will data be analyzed.
3.1 Research Design.
The study took on the form of a cross-sectional survey to effect the study. This survey approach
allowed the researcher to collect the information and conduct the study over a short period of
time as opposed to a longitudinal approach which involves studies over longer periods, normally
in years.. This was coupled with a quantitative approach to analyzing the research data. This
research used quantitative design and a field survey was conducted as well. The survey design
was based on the use of questionnaires that were used as data collection instruments. This study
focused only on the Kampala based firms.
3.2 Population and Sampling design.
3.2.1 Population and sample size
The population was 150 Hardware dealers who are operating in Kampala (Mugenyi, 2010), The
sample frame comprised 108 Hardware dealers located in Kampala who sell cement as per the
rationale of Krejcie and Morgan (1970).

3.2.2 Sampling Techniques.
The researcher used convenient sampling until the desired number of respondents had been
attained.
3.3 Data Collection.
3.3.1 Type of Data;
Data used can be divided into two categories; primary and secondary data. Primary data sources
included data acquired using questionnaires while the secondary data sources included journals,
websites and other relevant publications.
3.4 Research instrument
The Primary data was gathered using a pre-tested and structured questionnaire. The
questionnaire was delivered physically to the potential respondents participating in the study for
the purpose of ensuring that a high response rate is attained (Kothari 2005). The questionnaire
Was designed using items for each of the variables which were tapped using a 5 point likert scale
such that 1 represents Strongly Agree, 2 – Disagree, 3 – Uncertain, 4- Disagree and 5- Strongly
Agree.
3.5 Data collection Method.
Survey method of data collection was used for collecting the primary data for this research. The
survey method involved questioning people and recording their responses for analysis. Since the
research was about country of origin and the factors that influence brand loyalty, the survey
method was the most appropriate data collection methods since it was to enable the researcher
collect primary data on opinions and attitudes towards each brand of cement.

3.6 Research Procedure.
The procedure that was followed in data collection was as follows;
(a) Four research assistants were recruited by the researcher two weeks prior to
commencement of the survey. They were trained on how to administer the questionnaires, and to
understand the research problems and objectives at hand.
(c) On a random basis, research assistants interviewed any Hardware dealer who was availed
information and also consumers who came to the hardware to buy cement.
(d) All the filled questionnaires were brought to a central place as they were completed and
were edited and coded as soon as a satisfactory number had been received. Full analysis of the
raw data was done using computer package SPSS to make statistical inferences. The researcher
oversaw the entire process of data collection and was personally monitored the analysis of data.

3.7 Data quality control
3.7.1 Reliability and Validity
The purpose of reliability was to examine the level of consistence among the questionnaire
items. This study employed the Cronbach alpha value as a tool for reliability examination, the
bigger the Cronbach's alpha value, the higher internal consistency was. Validity has to do with
ensuring that the items measure what they are supposed to. The validity was a measured using
the Content Validity Index.
Table 3.7.1 Reliability and Validity
Variable Anchor Cronbach Alpha ContentValidity Index
Country of Origin 5 Point 0.860 0.786
Perceived Quality 5 Point 0.835 0.778
Perceived Value 5 Point 0.888 0.824
Brand Loyalty 5 Point 0.799 0.833
Source : Primary Data
From the table above, the results indicated that the Cronbach Alpha, the Content Validity Index
were both bigger than 0.60, showing acceptable levels of validity and reliability..
3.8 Measurements of variables
3.8.1 Country of origin
This variable was measured with reference to the work of Fazio (1987, 1990). Their method for
measuring the country of origin involves the “naming method” which involves presenting
consumers with the brand name of a product and evaluation of the attitudes towards these brands.

3.8.2 Perceived Value
The multi-dimensional measure developed by Sweenay and Soutar (2001) was used to measure
perceived value.
3.8.3 Perceived Quality
To measure perceptions of overall quality, a two-item, semantic differential scale was used,
patterned after scales used in previous studies (Han, 1986., 1994).
3.8.4 Brand loyalty
This variable was measured with reference to the scale developed by Beatty and Kahle (1988).
3.9 Data analysis methods.
The researcher generated information by analyzing data after collection. The data analyzed using
statistical procedures. The data was analyzed through the use of descriptive and inferential
statistics. Cross tabulations, Chi-square, correlation and regression among others, were employed
to adequately address the research requirements. Further, the researcher interpreted these
findings in the light of the research questions. The researcher mainly used the SPSS (Statistical
Package for the Social Scientist) computer package to analyze the data in this study.
CHAPTER FOUR: RESULTS AND FINDINGS OF THE STUDY
4.0 Introduction
The results from the analysis of the data were presented in this chapter using statistical tables
such as the cross tabulations, Correlations and regressions. The results were presented as per the
following research objectives;
i. To examine the level of Country of Origin Effects, Brand Loyalty, Perceived Value and
Perceived Quality among Cement users in Uganda.
ii. To establish the relationship between country of Origin effects and brand loyalty.
iii. To establish the relationship between country of origin effects, perceived value and brand
loyalty
iv. To establish the relationship between countries of origin effects, perceived quality,
perceived value and brand loyalty.

a. Sample characteristics
4.1.1 Age Group and Gender Distribution
The results in the table below show the age group and the gender of the individuals that were
interviewed.
Table 4.1.1 Age Group and Gender Distribution
GenderTotal
Male Female
Age of the respondent
18 - 30 yrsCount 22 15 37Row % 59.5% 40.5% 100.0%
31 - 40 yrsCount 27 17 44Row % 61.4% 38.6% 100.0%
41 - 50 yrsCount 14 2 16Row % 87.5% 12.5% 100.0%
Over 50 yrsCount 4 1 5Row % 80.0% 20.0% 100.0%
TotalCount 67 35 102Sample % 65.7% 34.3% 100.0%
Source : Primary Data
Results in table 4.1.1 show that 65.7% are male and 34.3% of the respondents are female. Most
of the hardware dealers were in the 31- 40 year age group and 61.4% of these were Male and
38.6% of them were female. In the 18 – 30 year age bracket, 59.5% were male and 40,5% were
female. It should be noted that overall, there were more males than females and this was
observed to apply for all the age group categories,. The over 50 year age bracket had females
constituting only 20.0% and the dominant gender were the male dealers.

4.1.2 Highest level of education and Gender Distribution
Results for the highest level of education and the gender of the respondents were as indicated
below:
Table 4.1.2 Highest level of education and Gender Distribution
GenderTotal
Male Female
Highest level of education
O levelCount 9 9
Row % 100.0% 100.0%
A levelCount 14 12 26
Row % 53.8% 46.2% 100.0%
DiplomaCount 29 14 43
Row % 67.4% 32.6% 100.0%
DegreeCount 8 8 16
Row % 50.0% 50.0% 100.0%
Post GraduateCount 3 1 4
Row % 75.0% 25.0% 100.0%
OthersCount 4 4
Row % 100.0% 100.0%
TotalCount 67 35 102
Sample % 65.7% 34.3% 100.0%Source : Primary Data
Among females, there were no dealers holding only the O level certificate. With Post Graduate
qualifications, the majority of the respondents were Male (75.0%) and only 25.0% were female.
With the Bachelors degree, the researcher noted that there was an equal proportion for both male
and female dealers, each category taking up 50.0% of the respondents.

4.1.3 Period the business been operating and Nature of your business Distribution
The results the business nature and the number of years it has been operating.
Table 4.1.3 Period of business operation and Nature of business
Nature of your businessTotal
Wholesaler Retailer Others
Period the business been operating
1 - 5 yrsCount 6 29 2 37
Row % 16.2% 78.4% 5.4% 100.0%
6 - 10 yrsCount 19 28 47
Row % 40.4% 59.6% 100.0%
11 - 15 yrsCount 4 8 12
Row % 33.3% 66.7% 100.0%
Over 15 yrsCount 3 2 1 6
Row % 50.0% 33.3% 16.7% 100.0%
TotalCount 32 67 3 102
Sample % 31.4% 65.7% 2.9% 100.0%Source : Primary Data
Most of the firms are retailers with 65.7% followed by wholesalers with 31.4% and finally others
with 2.9%. It should be noted that most of the business which is 1-5years, 6-10yrs and 11-15yrs
old are retailers (78.4%, 59.6% and 66.7% respectively). Firms over 15yrs are mostly
wholesalers (50.0).
4.1.4 Number of employees the business has got and Business category Distribution
Results for the number of employees in different business categories.
Table 4.1.4 Number of employees in the business and Business category Distribution
Business category
TotalSole Proprietorship Partnership
Limited Liability Company
Number of employees the business has got
0 - 4Count 46 11 57
Row % 80.7% 19.3% 100.0%
5 - 49Count 12 15 15 42
Row % 28.6% 35.7% 35.7% 100.0%
50 - 99Count 2 1 3
Row % 66.7% 33.3% 100.0%
TotalCount 60 27 15 102
Sample % 58.8% 26.5% 14.7% 100.0%
Source : Primary Data
Sole proprietorship had the highest number of employee’s (58.8%) followed by
Partnership (26.5%) and then Ltd Liability Company (14.7%). Most firms also have some 5-49
employees and also a small proportion had 50- 99 employees.

4.1.5 Most preferred cement brand and the amount of capital that the business is
operating with Distribution.
Results for the amount of capital the firms are operating with and their preferred brands.
Table 4.1.5 Most preferred cement brand and Operational capital
The amount of capital that the business is operating with Total
1 - 4 5 - 9 10 - 14 15 & Above
Most preferred cement brand
BamburiCount 7 1 8
Row % 87.5% 12.5% 100.0%
HimaCount 5 11 12 12 40Row % 12.5% 27.5% 30.0% 30.0% 100.0%
Blue TriangleCount 2 2
Row % 100.0% 100.0%
TororoCount 6 17 11 17 51Row % 11.8% 33.3% 21.6% 33.3% 100.0%
OthersCount 1 1
Row % 100.0% 100.0%
TotalCount 11 35 23 33 102Sample % 10.8% 34.3% 22.5% 32.4% 100.0%
Source : Primary Data
Majority of the business operated with capital between 5-9 millions (34.3%).Hima and Tororo
cement were preferred by all firms with different operating capital. It should be noted that among
businesses operating with more than 15 millions, most had preference for all brands.

4.1.6 Period the business been operating and Countries whose brands are preferred
Distribution
Results for the country of origin preference as per the number of years it has been in business.
Table 4.1.6 Period of business operating and Countries whose brands are preferred
Countries whose brands are preferred Total
Kenya Uganda Dubai Pakistan
Period the business been operating
1 - 5 yrsCount 36 1 37
Row % 97.3% 2.7% 100.0%
6 - 10 yrsCount 1 46 47
Row % 2.1% 97.9% 100.0%
11 - 15 yrsCount 12 12
Row % 100.0% 100.0%
Over 15 yrsCount 2 3 1 6
Row % 33.3% 50.0% 16.7% 100.0%
TotalCount 3 97 1 1 102Sample % 2.9% 95.1% 1.0% 1.0% 100.0%
Source : Primary Data
Brands from Uganda are the most preferred (95.1%), followed by Kenyan brands with 2.9% and
then Pakistan and Dubai with 1% each. The firms which have operated for 11-15yrs have
preference for mainly Ugandan brands. This indicates the challenge faced by importers of
foreign brands and gives a hint for the marketing communication that should be employed.

4.2 The level of Country of Origin Effects, Brand Loyalty, Perceived Value and
Perceived Quality among Cement users in Uganda.
The results in the table below were presented to explore the level of Country of Origin Effects,
Brand Loyalty, Perceived Value and Perceived Quality among Cement users in Uganda. The
questionnaire had options such that 1 represents Strongly Disagree, 2 – Disagree, 3-Not Sure, 4 –
Agree, and 5 – Strongly Agree.
Table 4.21 The level of Country of Origin Effects, Brand Loyalty, Perceived Value and
Perceived Quality among Cement users in Uganda.
Descriptives for study variables
N Min Max Mean Std. DeviationCountry of Origin 102 1.00 5.00 3.74 1.01Perceived Quality 102 2.11 5.00 4.15 0.51Perceived Value 102 2.59 5.00 4.08 0.50Brand Loyalty 102 2.67 5.00 3.90 0.53
Source : Primary Data
The results in the table indicated that the Country of Origin effects, Perceived Quality, Perceived
Value and Brand Loyalty all need Improvement by the Product Dealers (Mean ≈ 4.00). These
results in the table above indicate the level of the variables as rated by the respondents which
were the hardware dealers.

Table 4.2.2 Attribute considered by the Cement Dealers
Attributes Percentage Cumulative Percentage
Cement Appearance 35.71 35.71
Cheap Brands 46.43 82.14
Setting Time 10.71 92.86
Source of the cement 7.14 100.00
Total 100.00
Source : Primary Data
For the case of perceived value, enhancement by both manufacturers and promoters should be
done with the following attributes in mind.
A). Cement Appearance. Some brands are darker and others brighter than others depending on
the raw materials they use especially limestone whereby coral limestone is darker. Some
consumers perceive dark cement is good for the floor and bright cement is good for plastering
because you use less soda ash and paint.
b). Setting time. Some cement brands sets fast than others. The perception is that if it sets fast
then you can build fast. However there is the notion that if it sets slowly it gives the mason more
time to work. However we also have cement type or ordinary Portland cement which sets fast
and pozzolanic Portland cement which sets slowly. However it does not matter much because at
the end of 28 days the strength is the same. All in all, besides perceptions, cements are binding
pastes and if they meet the specifications, the desired results will be achieved.

4.3 Relationships between Variables
Pearson (r) correlation Coefficient helped the researcher to understand the nature of the
relationships between the variables.
Table 4.3 Relationships between Variables
Country of Origin
Perceived Quality
Perceived Value
Brand Loyalty
Country of Origin 1.000
Perceived Quality .282** 1.000
Perceived Value .329** .644** 1.000
Brand Loyalty .448** .390** .532** 1.000
** Correlation is significant at the 0.01 level (2-tailed). Source : Primary Data
4.3.1 Country of Origin effects and brand loyalty.
A positive relationship was observed between the Country of Origin effects and the Brand
loyalty (r = .448**, p<.01). These results show that the greater the perception among the dealers
that cement brands from a particular country are superior, the more these dealers will be loyal to
purchasing these products from that particular country.
4.3.2 Country of origin effects, perceived value and brand loyalty
The Country of Origin effects variable was significantly and positively related to perceived value
(r = .329**, p<.01). Perceived value was also positively related to Brand loyalty (r =.532**,
p<.01). When cement buyers believe that a particular country has a history or good reputation in

manufacturing certain products, they will be associated with value for money. In other words,
these buyers will attach value to the cement brands from that particular statement.
4.3.3 Countries of origin effects, perceived quality, perceived value and brand loyalty.
The country of origin effects and perceived quality were positively and significantly related
(r=.282**, p<0.01). This means if consumers believe that cement from a certain country is of
good quality, they will continue buying cement brand.
Perceived quality and brand loyalty.
Perceived quality and brand loyalty are positively and significantly related (r =.390**, p<0.01).
This implies that that if buyers perceive that the cement brand is of good quality they will
continue being loyal to the cement brand.
4.4 Regression Analysis
Regression helped determine the degree to which the Country of Origin, Perceived Quality
And Perceived Value influence the dependent variable.
Table 4.4 Regression Analysis
Unstandardized Coefficients
Standardized Coefficients t Sig.
Model B Std. Error Beta
(Constant) 1.418 .389 3.640 .000
Country of Origin .163 .046 .311 3.569 .001
Perceived Quality .002 .117 .002 .013 .989
Perceived Value .461 .120 .436 3.844 .000
Dependent Variable: Brand Loyalty
R Square .371 F Statistic 18.318
Adjusted R Square .351 Sig. .000
Source : Primary Data

Country of Origin, Perceived Quality and Perceived value have the potential to explain 35.1% of
Variances in Brand Loyalty (Adjusted R Square value = .351). The Perceived Value of the
cement emerged as the best at explaining Brand Loyalty for Cement Customers. The regression
model was also significant (sig. < .05.).
4.5 Further Findings
4.5.1 Analysis of variance (ANOVA) results
The results for ANOVA of the firms on the variables are shown below
Table 4.5.1 Analysis of variance (ANOVA) results
N Mean Std. Deviation Std. Error F Sig.
Country of Origin
Sole Proprietorship 59 3.763 1.006 0.131
.467 .628Partnership 26 3.808 0.849 0.167Limited Liability Company 14 3.500 1.286 0.344
Perceived QualitySole Proprietorship 59 4.281 0.381 0.050
5.263 .007Partnership 27 3.950 0.565 0.109Limited Liability Company 14 3.981 0.694 0.185
Perceived ValueSole Proprietorship 60 4.207 0.414 0.053
5.966 .004Partnership 27 3.830 0.576 0.111Limited Liability Company 14 4.029 0.509 0.136
Brand LoyaltySole Proprietorship 58 4.055 0.513 0.067
7.664 .001Partnership 27 3.735 0.416 0.080
Limited Liability Company 13 3.550 0.547 0.152Source : Primary Data
These businesses were noted to differ significantly on Perceived Quality, Perceived Value and
Brand Loyalty (sig. <.05). It is only on the Country of Origin effects that these firms did not
differ significantly as far as ownership is concerned.

4.5.2 Analysis of variance results for Number of employees by variable.
The results for the variance in the number of employees for the firms.
Table 4.5.2 Analysis of variance results for Number of employees by variable.
N Mean Std. Deviation Std. Error F Sig.
Country of Origin0 – 4 55 3.7455 1.05792 .14265
.247 .7825 – 49 41 3.7561 .94288 .1472550 – 99 3 3.3333 1.15470 .66667
Perceived Quality0 – 4 56 4.1930 .45295 .06053
1.823 .1675 – 49 41 4.0608 .56563 .0883450 – 99 3 4.5556 .48432 .27962
Perceived Value0 – 4 57 4.1267 .49270 .06526
.534 .5885 – 49 41 4.0257 .51063 .0797550 – 99 3 3.9935 .50615 .29222
Brand Loyalty0 – 4 56 4.0302 .51537 .06887
6.031 .0035 – 49 39 3.7630 .49032 .07851
50 – 99 3 3.2323 .11372 .06566Source : Primary Data
The hardware dealers differed significantly on brand loyalty in light of the number of employees
(sig. <.05) as opposed to perceptions of country of origin, perceived value and perceived quality.

CHAPTER FIVE: DISCUSSION, RECOMMENDATIONS AND CONCLUSIONS
5.1 Introduction
This chapter contains the discussion, recommendation, conclusions and areas of future research
that should be pursued by the scholars in time to come to add to the knowledge base relating to
the variables. The discussion was done as per the research objectives, contrasting the findings
with what other scholars have been able to discover in the same field. Recommendations which
indicate the actual course of action that should be taken by the Cement manufacturers are also
contained in this chapter.
5.2 The level of Country of Origin Effects, Brand Loyalty, Perceived Value and
Perceived Quality among Cement users in Uganda.
Findings indicated that the cement manufacturers have a lot to do to make sure that the Country
of Origin effects of the various cement brands, appeal to the consumers so that they may remain
loyal to their cement brands. They too need to improve the perceptions of value and quality of
their respective cement brands if they are to sustain business operations in the country. In an
effort to enhance the country of origin effects so that consumers perceive the cement brands
more favourably, researchers have pointed out the need to precisely determine whether to
standardise or localise the marketing communications. This dilemma, research indicates, is a
major challenge for companies that operate at levels beyond their borders (Minbaeva et al.,
2007). This becomes a challenge given that there are normally vast cultural and geographical
differences between the different markets or countries. In addition, depending on the differences
and the way the marketing communications are designed, it could altogether have a positive or

negative impact on the perceptions of the target market regarding both value and quality of the
product from the foreign country. This notion is shared by other writers like Powers and Loyka
(2007).
Researchers have pointed out a difference between product knowledge levels about brands from
particular countries, their value and quality and the consequent perceptions among the consumers
(Pecotich and Ward, 2007). When consumers are highly knowledgeable about a certain product,
they are bound to rate it the same way even when the manufacturer sets up a plant in a different
country for the brand. On the other hand, when consumers have little or limited knowledge about
the product, they are more likely to rate its value and quality as per the country or origin
(Hamzaoui and Merunka, 2006). This calls for a critical review and knowledge of the market
before the sellers decide on the kind of marketing campaign they are to use.
5.3 Country of Origin effects and Brand Loyalty
The results in the previous chapter showed a positive and significant relationship between the
country of Origin effects and the nature of brand loyalty among the cement buyers. These results
tell us that if the customers attach certain quality attributes, to cement brands from a certain
country for instance, going ahead to relate brands from a particular country with reliability, these
customers are also likely. This can further be understood when we consider the research work of
Holland (2007) which shows that when manufacturers switch the country from which they are
producing their products, it has a significant impact on the Loyalty towards their brands. This is
because these customers often feel comfortable when these products are produced from specific

countries. These findings are also supported by Gurhan-Canli and Maheswaran (2000).
Researchers now contend that the country of origin affect the image portrayed by a certain
product or service to the consumers, and consequently, their willingness to purchase or not
Purchase the product (Ouellet, 2007).
5.4 Country of Origin Effects, Perceived Value and Brand Loyalty
Country of Origin effects were positively related to Perceived Value and Brand Loyalty. This
link between Perceived value and the country of origin indicate that if the consumer believes
cement brands from a particular country are of better monetary value, then the consumer will
continue buying cement brands from that particular country. Also perceived value and brand
loyalty were positively and significantly related. This means that if the buyers believe the worth
of their money is good, then they will continue being loyal to that particular cement brand. This
is further supported by the work of Singh and Sirdeshmukh (2000) who argue that some
antecedes like investment in assets , price and post purchase evaluation leads to perceived value
of a product either positively or negatively.
Marketing activities have a direct link with perceived value as The marketers try to woo buyers
on their product so that they can by them as has been advocated by oh, (2003) and msi (2004) in
their work.
5.5 Country Of Origin Effects, Perceived Quality, Perceived Value And Brand Loyalty.
The results in the previous chapter showed that perceived quality and country of origin were
positively and significantly related. The same too applied to perceived quality and brand loyalty.
The results shows that when customers attach certain quality attributes to a certain country, the
will continue buying cement brands from that specific country. Also the results tell us that if the

customers quality attributes to the cement brand, then they will remain and continue being loyal
to the brand. This is supported supported by the research work of Dawar and Parker (1994)
whereby it’s has been argued that success goes with quality and marketers
should promote strategies that will promote consumers perception on
product quality.
According to work of Duong et al (2004), Perceived quality is related to the
level of service satisfaction. Further, Haddad et al says that perceived quality
is a product of ratings accorded as per the specific aspects of services. It is
therefore prudent that the level of quality perception is determined by some
attributes associated with that service.
5.6 Conclusions
The country of origin effects for a certain cement brand, affect the loyalty towards the brand
among the customers. This implies that cement manufacturers have to make it a point to develop
the right attitude about their countries among their clients.
The Country of origin effects, the Perceived loyalty and the Perceived Quality and Brand
Loyalty have not been well addressed by the cement dealers in Uganda. This leaves a gap for
example with communication; consumers are left to rely on word of mouth for information about
the quality and value of the various brands like Hima, Blue Triangle and Tororo cement.
5.7 Recommendations
The manufacturers of these brands should ensure that they communicate the value of the cement
from those particular countries to key parties in the destination country for instance the opinion

leaders in the construction industry and this will help form the necessary attitudes toward brands
from those countries.
Cement manufacturers should avoid standardised communications because they don’t have the
same impacts in different markets or regions. This calls for localised communication strategies
which will suit that specific market or region so that clients can understand the value of cement.
Also different markets have their diversified cultures and appeals which might call for different
communication strategies.
Cement manufacturers/ players should get locals to market their products because the consumers
feel its one of their own. Also it is important because the locals can speak the local languages
when trying to convince their prospective buyers and clearly bring out the value or advantages of
their cement attributes.
CSR (Corporate Social Responsibility) In order for cement manufacturers /dealers to identify
with the locals and create a conducive relationship with the communities, they should come up
with corporate social responsibility programmes like building schools by donating cement,
reclaiming the quarries by planting trees, sponsoring sports etc.
Also i would advise the players who don’t have plants in Uganda to evaluate putting up factories
here. This will have more appeal to the citizens as they feel it belongs to them.

Cement manufacturers should promote the country of manufacture image through their
governments’ bilateral relationships; advertisements etc to create perception amongst the
consumers those products from specific country are of high value.
Information from the country of manufacture reflecting the product heritage should be clearly
displayed and visible. Labelling should be mandatory for the country of manufacture.
Comments of consumers who have used the cement before should be on the company’s website
testifying on the value and quality of their brands. This will help the prospective buyers to
perceive that the cement is of good quality and value and will be encouraged to buy it.
5.8 Areas for further research
Future researchers are encouraged to investigate the relationship between the Country of
Origin effects and the profitability of the brand. This will highlight which attributes the
companies should focus upon if they are to realise their set profitability targets. I would also
encourage further researchers to investigate other relationship between the country of origin and
price, promotions.
Also future researchers can explore on the relationship between country of origin Effects and
Consumer ethnocentrism.

REFERENCES
Assael, H. (1995). Consumer Behavior and Marketing Action, 4th ed., PWS- Kent
publishing company, Boston, MA.
Barroso, C.C., Martin, A.E. (1999). Marketing Relational, Ed. ESIC, Madrid.
Bhaskaran, S. and Sukumaran, N. (2007). Contextual and methodological issues in COO studies.
Marketing Intelligence & Planning, Vol. 25 No. 1, pp. 66-81.
Caruana, A.( 2002). Service loyalty. The effects of service quality and the mediating
role of customer satisfaction. European Journal of Marketing, Vol. 36 No.7/8,
pp. 811-28.
Cunningham, R. (1961). Customer loyalty to store and brand. Harvard Business Review, Vol. 39
pp.127-37.
Fandos, C. and Rlavlan, C. (2006). Intrinsic and Extrinsic quality attributes, loyalty and buying
intention are analysis for a PDO product. British Food Journal, Vol. 108 (8), pp.646 - 662
Balestrini, P., and Camble, P. (1987). Country of origin effects on Chinese wine consumers.
British Food Journal Vol. 108 No. 5, 2006 pp 396-472.
Dawar, N. and Parker. P. (1994). Marketing universals: consumers’ use of brand name, price.
physical appearance, and retailer reputation as signals of product quality. Journal of
Marketing, Vol. 58 No. 2, pp. 81-95.
Dick, A., and Basu, K. (1994). Customer loyalty: toward an integrated conceptual framework.
Journal of the Academy of marketing Science, Vol.22 No. 2, pp.99-113

Dunn, R., and Wrigley, N. (1984). Store loyalty for grocery products: an empirical study. Area,
Vol. Vol. 16 No. 4, pp. 307-14
Duong, D.V., Binns, C.W., Lee, A.H. and Hipgrave, D.B. (2004). Measuring client-perceived
quality of maternity services in rural Vietnam. International Journal of Quality Health
Care, Vol. 16 No. 6, pp. 447-52.
Eagly, A.H., and Chaiken, S. (1993). The Psychology of Attitudes, Harcourt Brace College
Publishers, Orlando, FL,
Erdem, T., Swait, J. and Valenzuela, A. (2006). Brands as signals: a cross-country validation
Study. Journal of Marketing, Vol. 70, January, pp. 34-49.
Fishbein, M., Ajzen, I. (1975), Belief, Attitude, intention, and Behavior: An Introduction of
Theory and Research, Addison- Wesley, reading, MA,.
Frank, R. (1967). Correlates of buying behavior for grocery products. Journal of Marketing, Vol.
31 pp.48-53.
Golan, E., Kuchler, F. and Krissoff, B. (2007), “Do food labels make a difference? . . .
sometimes”, Amber Waves, November, Online Magazine, USDA, available at:
www.ers.usda.gov/ AmberWaves/November07/Features/FoodLabels.htm (accessed on 30
November 2007).
Gurhan-Canli, Z. and Maheswaran, D. (2000). Cultural variations in country of origin
Effects. Journal of Marketing Research, Vol. 37 No. 3, pp. 309-31.
Han, C.M., Terpstra, V. (1988), Country of origin effect for uni-national and bi-national
products”, Journal Of International Business Studies, Vol. 19 , pp. 235-56.

Hamin Greg Eliot. A less developed country respective of consumer ethnocentrism and “country
of origin” effects: Indonesia- evidence.
Hamzaoui, L. and Merunka, D. (2006).The impact of country of design and country of
manufacture on consumer perceptions of bi-national products’ quality: an empirical
model based on the concept of fit. Journal of Consumer Marketing, Vol. 23 No. 3, pp.
145-55.
Holland, L. (2007).Now Smarties leave UK to be made in Germany. Daily Express, London.
Johansson, J.K., Douglas,S., Nonaka, I. (1985).Assessing the impact f country of origin on
product evaluations: a new methodological perspective. Journal of Marketing Research,
Vol. 22, pp 388-96.
Kayak, E., Kucukemiroglu, O., Hyder, A.S. (2000). Consumers country or origin (COO)
perceptions of imported products in a homogenous less- developed country. European
Journal of Marketing, Vol. 34 No.9/10, pp.12-21.
Minbaeva, D., Hutchings, K. and Thomson, S.B. (2007). Developing hybrid human resource
management in post-Soviet Kazakhstan. European Journal of International Management,
Vol. 1 No. 4, pp. 350-71.
McKenzie-Minifie, M. (2007). Checking the shelves for the state of origin”, New Zealand
Herald,3 March, available at: www.nzherald.co.nz/topic/story.cfm?
c_id¼206&objectid¼104
26756 (accessed on 5 April 2007).
MSI (2004), 2004-2006 Research Priorities. A Guide to MSI Research Programs and Procedures,
Marketing Science Institute, Cambridge, MA.

Mugenyi, R. (2010). Kampala City Council (KCC) Interview.
Lusk, J.L., Brown, J., Mark, T., Proseku, I., Thompson, R. and Welsh, J. (2006). Consumer
behavior, public policy, and country-of-origin labeling. Review of Agricultural
Economics, Vol. 28 No. 2, pp. 284-92.
Schiffman, L.G. and Kanuk, L. L.(2000). Consumer behavior, Prentice Hall.
Oh, H. (2003). Price fairness and its assymmetric effects on overall price, quality, and value
judgements: the case of an upscale hotel. Tourism Management, Vol. 24, pp. 241-9.
Oliver, R.L (1999). Whence consumer loyalty. Journal of Marketing, Vol. 63 pp.33-44
Ozsomer, A., Cavusgil, S.t. (1991). Country of origin effects on product evaluations: a sequel to
Bilkey and Nes’ review”, in Gilly, M.C., Dwyer, F.R. (Eds), Proceedings of the
American Marketing Association, Chicago, IL, pp.269-77.
Phillip K. (2001). Marketing management, prentice-Hall of India private limited.
Powers, T.L. and Loyka, J.J. (2007). Market, industry, and company influences on global
product standardization. International Marketing Review, Vol. 24 No. 6, pp. 678-94.
Roscoe, J.T. (1975) Fundamental Research Statistics for the Behavioural Sciences, 2nd edition.
New York: Holt Rinehart & Winston
Roth, M.S., Romeo, J.B. (1992). Matching product category and country image perceptions: a
framework for managing country of origin effects, Journal of International Business
Studies, Vol.23 No.3, pp.477-97.
Shukla, P. (2009). Impact of contextual factors, brand loyalty and brand switching on
purchase decisions. Journal of Consumer Marketing, 26/5 348–357.

Sniehotta, F.F., Scholz, U. and Schwarzer, R. (2005). Bridging the intention-behaviour gap:
planning, self efficacy, and action control in the adoption and maintenance of physical
exercise. Psychology and Health, Vol. 20 No. 2, pp. 143-60.
Snoj, B., Korda, A.P. and Mumel, D. (2004). The relationships among perceived quality,
perceived risk and perceived product value. Journal of Product & Brand Management,
Vol. 13 No. 3, pp. 156-67.
Tse, d.K Gorn, G.J. (1992), An experiment on the salience of country of origin in the era of
global brands. Journal of International Marketing. Vol. 1 No. 1, pp 57-76
Wang, C., and Lamb, C (1983). The impact of selected environmental forces upon consumers’
willingness to buy foreign products. Journal of the Academy of Marketing Science, Vol.
11 No. 2 71-8.
Wood, L. (2004). Dimensions of brand purchasing behaviour: consumers in the 18-24 age
Group. Journal of Consumer Behaviour, Vol. 4 No. 1, pp. 9-24.
Zeithaml, V. (1998). Consumer perceptions of the price, quality and value: a means- end model
and synthesis of evidence. Journal of Marketing, Vol. 52 pp. 2-22.

Appendix I: Production, Imports and Net Domestic Cement Consumption in Tones for
the period 2004 to 2008
Table 1: Production, Imports and Net Domestic Cement Consumption in Tones for the
period 2004 to 2008
Item 2004 2005 2006 2007 2008
Imports 125,578 316,735 266,986 295,863 309,365
Local Prod 653,426 692,710 840,000 840,000 840,000
Exports. 1,889 7,131 15,457 15,489 20,659
Net Domestic
Consumption 763,455 988,786 1,091,529 1,120,374 1,128,706
Source; UBOS (www.ubos.org )

Appendix II Research Instrument MAKERERE UNIVERSITY BUSINESS SCHOOL
Dear Respondent,This questionnaire is intended to facilitate the study on Country of Origin. The purpose of the study is purely academic and your responses will be treated with utmost confidentiality. Kindly spare some time and answer the following questions as candidly as possible. Your name (Company Name) is Optional.Section A: Background Information
1. Gender Male Female
2. Age of the respondent
Age (Years)18 - 30 31 - 40 41 - 50 Over 50
1 2 3 4
3. Highest level of education
QualificationOrdinary
LevelAdvanced
Level Diploma Degree PostGraduate
Others(Please specify)
1 2 3 4 5 6
4. Nature of your business
Business TypeManufacturer Wholesale Retailer Others
1 2 3 4
5. How long has the business been operating or What is your business age?Period Running
Business1-5 yrs 6-10 yrs 11-15 yrs Over 15 yrs
1 2 3 4
6. To which of these categories does your business belong
Business CategorySole
Proprietorship PartnershipLimited
Liability Company1 2 3
Please indicate the number of Partners in the Business…………………..
7. How many employees has your business?
No of Employees
0 - 4 5 - 49 50 - 99 100 & Above
1 2 3 4
21

8. Please state the amount of capital that the business is operating with
9. i.) Please state your most preferred cement brand (Give only one)
Most preffered
brand
Bamburi Hima Portland Tororo Others ( Please Specify)
1 2 3 4
ii.) Kindly state why you prefer that brand
…………………………….……………………………………..
iii.) Which of these countries produces cement brands you prefer above all the rest?
iv.) Why do you prefer cement brands from that particular country?
…………………………….……………………………………..
For the items in the table below, kindly indicate your level of agreement for each with your most preferred Cement brand in mind .
Country of Origin
Stro
ngly
D
isag
ree
Dis
agre
e
Unc
erta
in
Agre
e
Stro
ngly
Ag
ree
1 When buying cement, I always seek to find out what country it was made in. 1 2 3 4 5
2 I feel that it is important to look for a country of origin information when deciding which cement to buy.
1 2 3 4 5
3 To make sure that I buy the highest quality cement, I look to see what country it was manufactured in
1 2 3 4 5
4 If I have a little experience with a certain cement brand, I search for country of origin information about it to help me make a more informed decision.
1 2 3 4 5
5 I refuse to purchase cement without knowing its country of origin. 1 2 3 4 5
6 When purchasing cement, I believe country of origin will determine the reliability of the brand
1 2 3 4 5
Starting Capital
(Millions)
1 – 4 5 – 9 10 – 14 15 & Above
1 2 3 4
Preferred Cement Brand
Produces)
Ken
ya
Tanz
ania
Uga
nda
Portu
gal
Paki
stan
Oth
ers
( Ple
ase
Spec
ify)
1 2 3 4 5

7 When I am buying cement, the country of origin is the first piece of information that I consider.
1 2 3 4 5
8 Cement’s country of origin does determine the quality of the product. 1 2 3 4 5
Stro
ngly
D
isag
ree
Dis
agre
e
Unc
erta
in
Agre
e
Stro
ngly
Ag
ree
9 When buying Cement that has a high risk of underperforming, a person should always look for the country of origin
1 2 3 4 5
10 It is less important to look for country of origin when buying cement that is less expensive.
1 2 3 4 5
11 Seeking country of origin information is less important for inexpensive cement brands than for expensive cement.
1 2 3 4 5
12 I find out cement’s country of origin to determine its quality. 1 2 3 4 5
13 To purchase cement that is acceptable to my family and my friends, I look for its country of origin.
1 2 3 4 5
14 I look for country of origin information to choose the best brand available in a product class.
1 2 3 4 5
Perceived Quality
PQ1 The quality of cement from my current supplier is good 1 2 3 4 5
PQ2 Cement from my supplier is always pure and not tampered with. 1 2 3 4 5
PQ3 Comparing my current supplier with others on the market, I am satisfied with the quality of Cement
1 2 3 4 5
PQ4 My supplier keeps me informed of all cement quality and safety related
information.
1 2 3 4 5
PQ5 My supplier is the best in terms of cement quality. 1 2 3 4 5
PQ6 The quality of cement from my supplier is environmentally friendly 1 2 3 4 5
PQ7 The cement from my supplier is manufactured using the best technology 1 2 3 4 5
PQ8 The buildings structures made with the cement I use are widely known to last
long
1 2 3 4 5
PQ9 The Cement from my supplier has generally a more user friendly composition than that from other suppliers.
1 2 3 4 5
For the items in the table below, kindly indicate your level of agreement for each with your most preferred Cement brand in mind . St
rong
ly
Dis
agre
e
Dis
agre
e
Unc
erta
in
Agre
e
Stro
ngly
Ag
ree
Perceived Value: Functional Value of Cement FV1 The cement brand I use as a whole has been so helpful to my building
structures1 2 3 4 5

FV2 The benefits of the cement have been maintained all of the time 1 2 3 4 5FV3 The level of benefits derived from this brand I use are acceptable compared
with other cement brands1 2 3 4 5
For the items in the table below, kindly indicate your level of agreement for each with your most preferred Cement brand in mind .
Stro
ngly
D
isag
ree
Dis
agre
e
Unc
erta
in
Agre
e
Stro
ngly
Ag
ree
FV4 The benefits of the cement I use are as expected 1 2 3 4 5FV5 The cement brand I use has always been appropriate for my business 1 2 3 4 5
Functional PriceFP1 The payment of interest is fully justified and acceptable 1 2 3 4 5
FP2 The benefit derived form the loan outweigh the expenses associated with it. 1 2 3 4 5
FP3 The total cost that it causes me is reasonable 1 2 3 4 5
FP4 The waiting time until I receive the loan is comfortable 1 2 3 4 5
Emotional Value
EM1 I am happy with the cement brand I use 1 2 3 4 5
EM2 I feel relaxed when purchasing this brand of cement 1 2 3 4 5
EM3 The salesperson give me a positive feeling associated with the cement 1 2 3 4 5
EM4 Cement persons don’t hassle me during all processing of purchasing the cement.
1 2 3 4 5
EM5 In general I feel at ease using this cement brand 1 2 3 4 5
Social ValueSV1 I have come to associate with important people as a result of purchasing
this cement
1 2 3 4 5
SV2 Using this cement brand has improved my importance in my locality 1 2 3 4 5SV3 Many people I know use the same brand of cement 1 2 3 4 5
For the items in the table below, kindly indicate your level of agreement for each with your most preferred Cement brand in mind .
Brand Loyalty
Stro
ngly
D
isag
ree
Dis
agre
e
Unc
erta
in
Agre
e
Stro
ngly
Ag
ree
BR1 I say positive things about my cement brand to other potential customers 1 2 3 4 5BR2 I recommend my current cement brand to someone who seeks my advice. 1 2 3 4 5BR3 I will change to another cement brand as soon as I can 1 2 3 4 5BR4 I have considered using another brand of cement another supplier in the recent
past.
1 2 3 4 5BR5 I would still pay a higher price than to change to another cement brand 1 2 3 4 5BR6 I will continue to purchase this brand of cement as long as I can 1 2 3 4 5BR7 My cement brand gives me the best possible value for money 1 2 3 4 5BR8 I have no complaints regarding my cement brand 1 2 3 4 5
BR9 I intend to continue with my current cement brand in the foreseeable future. 1 2 3 4 5BR10 I adore my Cement (current supplier) 1 2 3 4 5BR11 I would provide referrals to other customers to be supplied by my current
supplier.
1 2 3 4 5BR12 I will change to another supplier if I experience any slight difference in
product and service delivery.1 2 3 4 5