chapter 9 intelligence and its proxy measure: international assessments
TRANSCRIPT

Chapter 9
Intelligence and its proxy measure:
International Assessments

National intelligence and
well-being
• In theory we refuse to let IQ dominate our agenda; in practice we take it seriously.
• Rindermann (2008): National intelligence is considered a crucial predictor of national wealth
• Hanushek & Woessmann (2008): cognitive skills of the population are strongly associated with individual earnings and economic growth.


International test scores as a proxy measure of national IQ
• Lynn and Mikk (2007): Trends in International Mathematics and Science Studies (TIMSS) test scores for 8th graders and GDP per capita had a moderate correlation (0.55) whereas national IQ estimates and GDP per capita were correlated at 0.62.
• Hunt and Wittmann (2008): Program for International Student Assessment (PISA) test scores provides an even better prediction of national wealth than TIMSS.
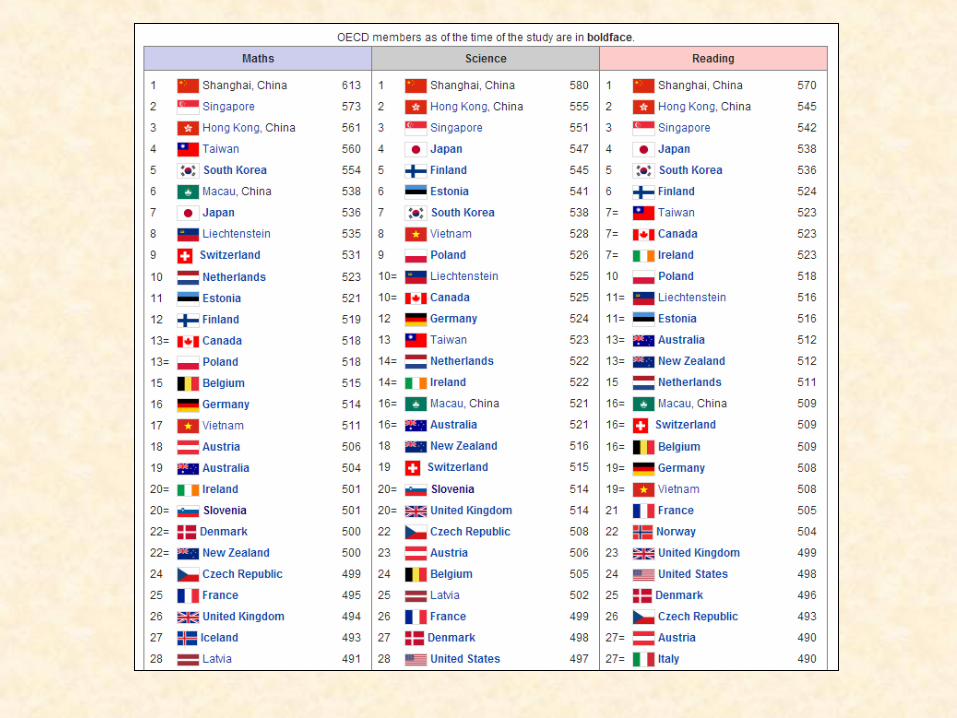


IQ, PISA, and wealth
• If all 30 members of the OECD raise their average scores on PISA by 25 points, in the next 20 years it would lead to an aggregate gain of $115 trillion in GDP over the lifetime of the generation born in 2010.
• For the US a modest improvement in PISA could result in $41 trillion gain in US’s GDP over 80 years.

Obama’s response
In 2011 President Obama and Secretary advocated for the American Recovery and Reinvestment Act.

• Martin Caroy and Richard Rothstein (2013): Disadvantaged students are oversampled in the US.
• David Berliner: Manufactured crisis• If we remove the US students from the lowest SES, the US
students are the best in PISA.


• Contrary to the popular belief that Asian students are good at rote learning, these Asian countries/regions had the highest percentages of students reaching the Advanced International Benchmark for science.
• At Grade 4– Singapore: 36%
– Taiwan: 19%
– Median: 7%
• At Grade 8– Singapore: 32%
– Taiwan: 25%
– Median: 3%


2014 OECD skill studies
• Adults: age 16-25• Three categories:
– Numeracy– technological proficiency– literacy
• 5 levels• US ranks at the bottom in numeracy and technological
proficiency• Thirty-six million American adults have low skills.

OECD skill studies
• Numeracy: – 8% US adults achieve at Level 4/5, – OECD average: 13% – Japan and Finland: 19% – A third of adults in the U.S. scored below Level 2
• Problem solving in technology– About one-third (31%) of US adults score at least at
Level 2 – OECD average: 34%

OECD skill studies
• The tests show that a universal pattern:– develop skills and knowledge at
young ages– peak in proficiency at 30– decline afterwards.
• If people start out with poor foundation, those disadvantages will persist throughout their lives.

USSR is gone!
• Ravitch said, “The Soviet Union launched its Sputnik satellite in 1957. We did not respond by raising our test scores on international assessments… something is wrong with those international assessments, if our allegedly terrible public schools continue to produce the greatest workers, thinkers, leaders, and innovators that created the greatest economy in the world. The Soviet Union is gone, but we are still here!”

“US continue to dominate”• Since the 1960s US students have
never been doing well in international math and science tests
• But “US continues to dominate in these fields”
• Don’t push people to learn math and science.
• Liberal education is the key to inventiveness.

US domination relies on immigrants
• In 2003, of the 21.6 million scientists and engineers in the US, 16% (3,352,000) were immigrants (Kannankutty & Burrelli, 2007).
• Foreign-born doctorate holders in workforce: – Engineering and computer science: 50%– Physical sciences: 37%– Mathematics: 43% (National Science Board,
2010)
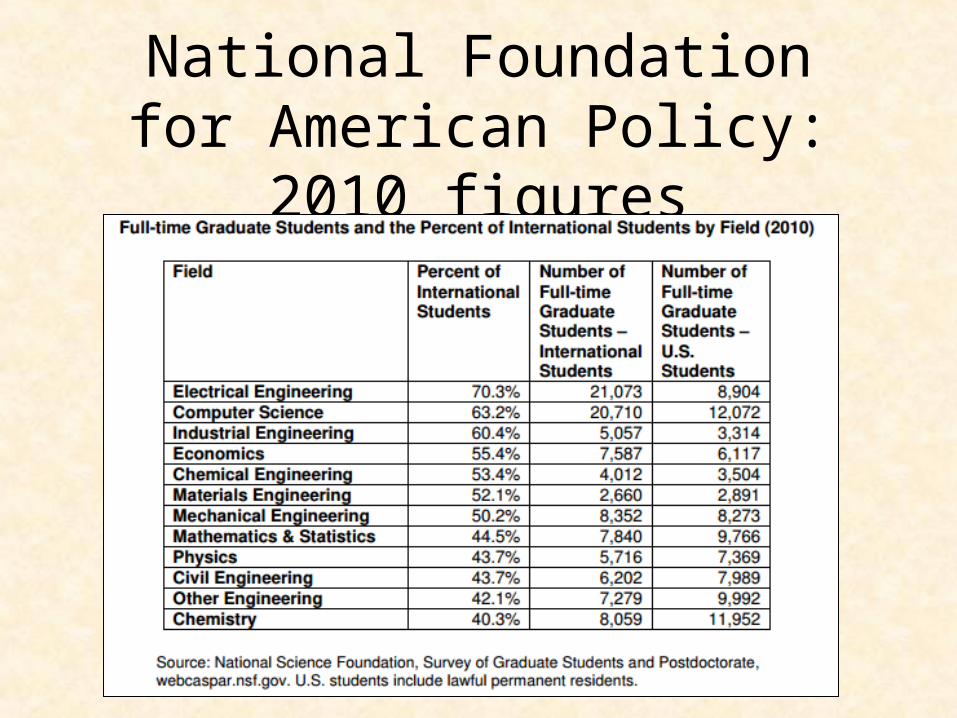
National Foundation for American Policy: 2010 figures

Nobel prizes
• Between 1950 and 2005, 27 of the 87 American Nobel Prize winners were born outside the US (Vilcek & Cronstein, 2006).
• Counting from 1990, about half of the US Nobel laureates in the scientific and technical disciplines were foreign-born.

For more information, please read (optional):
• Yu, C. H., Wu, F. S., & Magan, C. (in press). Identifying crucial and malleable factors of successful science learning from the 2012 PISA. In Myint Swe Khine (Ed.), Science Education in East Asia: Pedagogical Innovations and Best Practices.
• Yu, C. H. (2012). Beyond Gross National Product: An exploratory study of the relationship between Program for International Student Assessment Scores and well-being indices. Review of European Studies, 4. doi:10.5539/res.v4n5p119 Retrieved from http://www.ccsenet.org/journal/index.php/res/article/view/20478/14159

For more information, please read (optional):
• Yu, C. H. (2012). Examining the relationships among academic self-concept, instrumental motivation, and TIMSS 2007 science scores: A cross-cultural comparison of five East Asian countries/regions and the United States. Educational Research and Evaluation, 18, 713-731. DOI:10.1080/13803611.2012.718511. Retrieved from http://www.tandfonline.com/doi/full/10.1080/13803611.2012.718511
• Yu, C. H., Kaprolet, C., Jannasch-Pennell, A., & DiGangi, S. (2012). A data mining approach to compare American and Canadian Grade 10 students in PISA 2006 Science test performance. Journal of Data Science, 10, 441-464. Retrieved from http://www.jds-online.com/file_download/362/JDS-1064.pdf
• Yu, C. H., DiGangi, S., & Jannasch-Pennell, A. (2012). A time-lag analysis of the relationships among PISA scores, scientific research publication, and economic performance. Social Indicators Research, 107, 317-330. doi: 10.1007/s11205-011-9850-5.

Assignment• Form a group of 3-4 people to discuss the following issue:
• Multiple international assessments, such as PISA and TIMSS, indicate that test performance in math, science, and reading of American students is behind to that of European and Asian students. OECD skill study report also warns that the skill level of American adults is below the OECD average. Is the performance gap indicated by OECD and TIMSS a “sputnik moment” (Obama’s phrase) or just a “manufactured crisis” (David Berliner’s phrase)? What lessons can we learn from OECD and TIMSS?
• Please take different arguments and counter-arguments into account. Read the PowerPoint carefully. You are welcome to search for additional information related to this topic.
• Post an individual report on Sakai (0.5-1 page)