chapter 8: pediatric esrd - usrds home page · pdf filechapter 8: pediatric esrd ... •...
TRANSCRIPT
USRDSUNITED STATES RENAL DATA SYSTEM
2015 USRDS Annual Data Report | Volume 2 - ESRD in the United States 239
Chapter 8: Pediatric ESRD
• 1,462 children in the United States began end-stage renal disease (ESRD) care in 2013.• 9,921 children were being treated for ESRD on December 31, 2013.• The most common initial ESRD treatment modality among children overall is hemodialysis (56%).• Peritoneal dialysis is the most common initial treatment modality in children younger than 9 years and those who weigh less than 20 kg. • 37% of children received a kidney transplant within the first year of ESRD care during 2009-2013.• All-cause hospitalization rates are 2 per patient year among children with ESRD.• The number of children listed for incident and repeat kidney transplant was 1,277 in 2013.• As of 2006, deceased donor transplants were more common than living donor transplants.• The five-year patient survival probability was 0.89 for children initiating ESRD care between 2004-2008.• Since 2006, 81% of incident pediatric ESRD patients have started hemodialysis with a central venous catheter.• The five-year survival probability of young adults aged 22 to 29 years is 0.95 for transplant and 0.74 for hemodialysis dependent patients.
Introduction
Pediatric end-stage renal disease (ESRD) affects children of all ages. The majority of these children will depend on renal replacement therapies over many decades. Consequently, children with incident ESRD often traverse the entire ESRD modality continuum of hemodialysis, peritoneal dialysis, and transplantation. These children are subjected to frequent hospitalizations and have a risk of mortality far exceeding the general pediatric population in the United States Children with ESRD are quite different in disease etiology, transplant opportunities, morbidity and mortality when compared to adults with ESRD. The chapter has been expanded to include information about vascular access in children as this can have far reaching implications into adulthood. Also, this year for the first time, the USRDS Annual Data Report pediatric chapter includes a section on young adults. This provides an opportunity to improve our understanding of the issues surrounding transitional ages and outcomes in these patients. In the 2015 issue of the United States Renal Data System (USRDS) Annual Data Report, we continue to describe the full spectrum of renal replacement therapy from dialysis to transplant.
Analytical Methods
See the ESRD Analytical Methods chapter for an explanation of analytical methods used to generate the figures and tables in this chapter, including a listing of ICD-9 codes used for classification of hospital and mortality associated events.
Epidemiology of End-Stage Renal Disease in Children
The incidence of ESRD in children has been decreasing annually in the United States between 2008 and 2012 (Figure 8.1.a). Between 2012 and 2013, a total of 1,462 children had new onset ESRD, which was only 7 fewer than the previous year. Similarly, as of December 31, 2013, the point prevalence of children with ESRD was 9,921, which represents a less than 1% decrease from the previous year (Figure 8.1.b).
Incidence and Prevalence by ESRD Modality
From the earliest reporting year, in aggregate, children have initiated ESRD therapy with hemodialysis more
240
Chapter 8: Pediatric ESRD
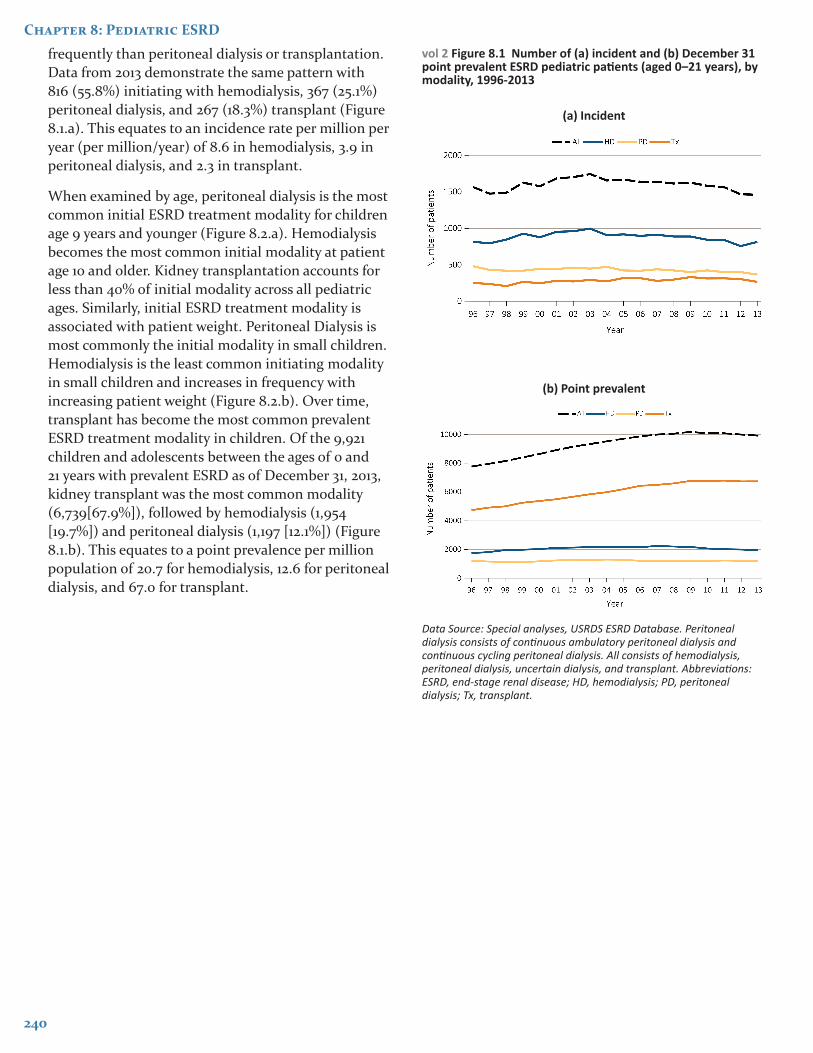
frequently than peritoneal dialysis or transplantation. Data from 2013 demonstrate the same pattern with 816 (55.8%) initiating with hemodialysis, 367 (25.1%) peritoneal dialysis, and 267 (18.3%) transplant (Figure 8.1.a). This equates to an incidence rate per million per year (per million/year) of 8.6 in hemodialysis, 3.9 in peritoneal dialysis, and 2.3 in transplant.
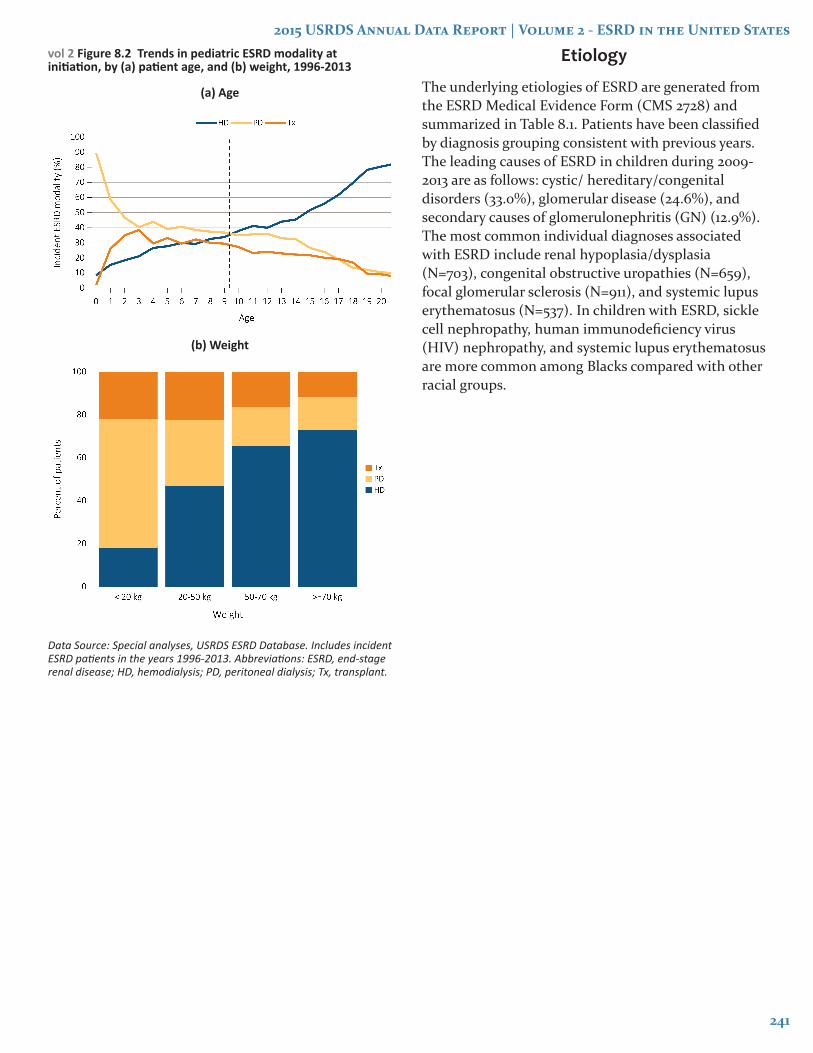
When examined by age, peritoneal dialysis is the most common initial ESRD treatment modality for children age 9 years and younger (Figure 8.2.a). Hemodialysis becomes the most common initial modality at patient age 10 and older. Kidney transplantation accounts for less than 40% of initial modality across all pediatric ages. Similarly, initial ESRD treatment modality is associated with patient weight. Peritoneal Dialysis is most commonly the initial modality in small children. Hemodialysis is the least common initiating modality in small children and increases in frequency with increasing patient weight (Figure 8.2.b). Over time, transplant has become the most common prevalent ESRD treatment modality in children. Of the 9,921 children and adolescents between the ages of 0 and 21 years with prevalent ESRD as of December 31, 2013, kidney transplant was the most common modality (6,739[67.9%]), followed by hemodialysis (1,954 [19.7%]) and peritoneal dialysis (1,197 [12.1%]) (Figure 8.1.b). This equates to a point prevalence per million population of 20.7 for hemodialysis, 12.6 for peritoneal dialysis, and 67.0 for transplant.
vol 2 Figure 8.1 Number of (a) incident and (b) December 31 point prevalent ESRD pediatric patients (aged 0–21 years), by modality, 1996-2013
(a) Incident
(b) Point prevalent
Data Source: Special analyses, USRDS ESRD Database. Peritoneal dialysis consists of continuous ambulatory peritoneal dialysis and continuous cycling peritoneal dialysis. All consists of hemodialysis, peritoneal dialysis, uncertain dialysis, and transplant. Abbreviations: ESRD, end-stage renal disease; HD, hemodialysis; PD, peritoneal dialysis; Tx, transplant.
2015 USRDS Annual Data Report | Volume 2 - ESRD in the United States
241
vol 2 Figure 8.2 Trends in pediatric ESRD modality at initiation, by (a) patient age, and (b) weight, 1996-2013
(a) Age
(b) Weight
Data Source: Special analyses, USRDS ESRD Database. Includes incident ESRD patients in the years 1996-2013. Abbreviations: ESRD, end-stage renal disease; HD, hemodialysis; PD, peritoneal dialysis; Tx, transplant.
Etiology
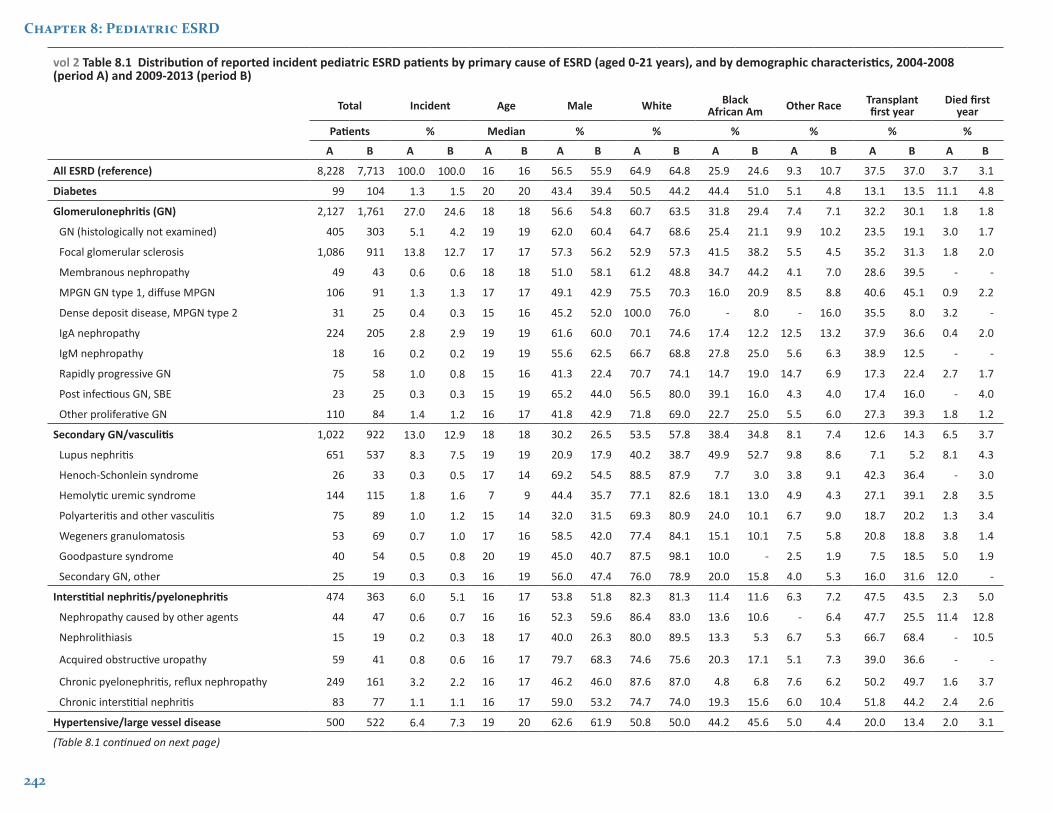
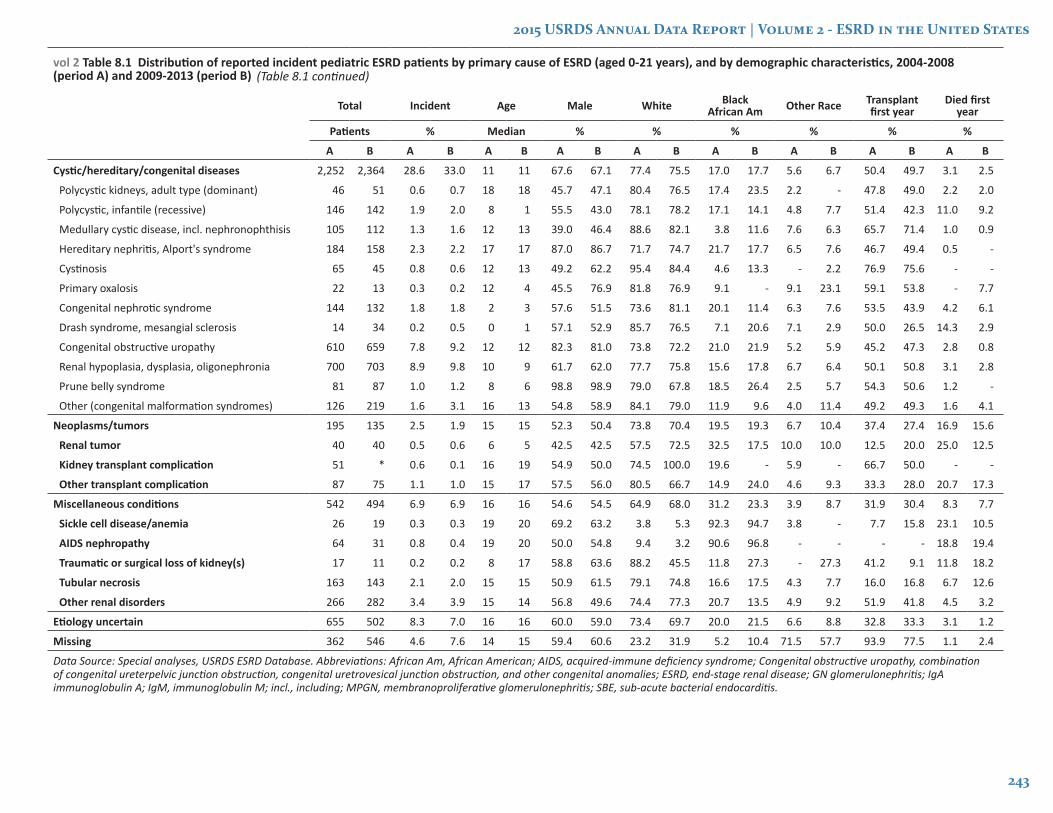
The underlying etiologies of ESRD are generated from the ESRD Medical Evidence Form (CMS 2728) and summarized in Table 8.1. Patients have been classified by diagnosis grouping consistent with previous years. The leading causes of ESRD in children during 2009-2013 are as follows: cystic/ hereditary/congenital disorders (33.0%), glomerular disease (24.6%), and secondary causes of glomerulonephritis (GN) (12.9%). The most common individual diagnoses associated with ESRD include renal hypoplasia/dysplasia (N=703), congenital obstructive uropathies (N=659), focal glomerular sclerosis (N=911), and systemic lupus erythematosus (N=537). In children with ESRD, sickle cell nephropathy, human immunodeficiency virus (HIV) nephropathy, and systemic lupus erythematosus are more common among Blacks compared with other racial groups.
Chapter 8: Pediatric ESRD
242
vol 2 Table 8.1 Distribution of reported incident pediatric ESRD patients by primary cause of ESRD (aged 0-21 years), and by demographic characteristics, 2004-2008 (period A) and 2009-2013 (period B)
Total Incident Age Male White Black African Am Other Race Transplant
first yearDied first
year
Patients % Median % % % % % %
A B A B A B A B A B A B A B A B A B
All ESRD (reference) 8,228 7,713 100.0 100.0 16 16 56.5 55.9 64.9 64.8 25.9 24.6 9.3 10.7 37.5 37.0 3.7 3.1
Diabetes 99 104 1.3 1.5 20 20 43.4 39.4 50.5 44.2 44.4 51.0 5.1 4.8 13.1 13.5 11.1 4.8
Glomerulonephritis (GN) 2,127 1,761 27.0 24.6 18 18 56.6 54.8 60.7 63.5 31.8 29.4 7.4 7.1 32.2 30.1 1.8 1.8
GN (histologically not examined) 405 303 5.1 4.2 19 19 62.0 60.4 64.7 68.6 25.4 21.1 9.9 10.2 23.5 19.1 3.0 1.7
Focal glomerular sclerosis 1,086 911 13.8 12.7 17 17 57.3 56.2 52.9 57.3 41.5 38.2 5.5 4.5 35.2 31.3 1.8 2.0
Membranous nephropathy 49 43 0.6 0.6 18 18 51.0 58.1 61.2 48.8 34.7 44.2 4.1 7.0 28.6 39.5 - -
MPGN GN type 1, diffuse MPGN 106 91 1.3 1.3 17 17 49.1 42.9 75.5 70.3 16.0 20.9 8.5 8.8 40.6 45.1 0.9 2.2
Dense deposit disease, MPGN type 2 31 25 0.4 0.3 15 16 45.2 52.0 100.0 76.0 - 8.0 - 16.0 35.5 8.0 3.2 -
IgA nephropathy 224 205 2.8 2.9 19 19 61.6 60.0 70.1 74.6 17.4 12.2 12.5 13.2 37.9 36.6 0.4 2.0
IgM nephropathy 18 16 0.2 0.2 19 19 55.6 62.5 66.7 68.8 27.8 25.0 5.6 6.3 38.9 12.5 - -
Rapidly progressive GN 75 58 1.0 0.8 15 16 41.3 22.4 70.7 74.1 14.7 19.0 14.7 6.9 17.3 22.4 2.7 1.7
Post infectious GN, SBE 23 25 0.3 0.3 15 19 65.2 44.0 56.5 80.0 39.1 16.0 4.3 4.0 17.4 16.0 - 4.0
Other proliferative GN 110 84 1.4 1.2 16 17 41.8 42.9 71.8 69.0 22.7 25.0 5.5 6.0 27.3 39.3 1.8 1.2
Secondary GN/vasculitis 1,022 922 13.0 12.9 18 18 30.2 26.5 53.5 57.8 38.4 34.8 8.1 7.4 12.6 14.3 6.5 3.7
Lupus nephritis 651 537 8.3 7.5 19 19 20.9 17.9 40.2 38.7 49.9 52.7 9.8 8.6 7.1 5.2 8.1 4.3
Henoch-Schonlein syndrome 26 33 0.3 0.5 17 14 69.2 54.5 88.5 87.9 7.7 3.0 3.8 9.1 42.3 36.4 - 3.0
Hemolytic uremic syndrome 144 115 1.8 1.6 7 9 44.4 35.7 77.1 82.6 18.1 13.0 4.9 4.3 27.1 39.1 2.8 3.5
Polyarteritis and other vasculitis 75 89 1.0 1.2 15 14 32.0 31.5 69.3 80.9 24.0 10.1 6.7 9.0 18.7 20.2 1.3 3.4
Wegeners granulomatosis 53 69 0.7 1.0 17 16 58.5 42.0 77.4 84.1 15.1 10.1 7.5 5.8 20.8 18.8 3.8 1.4
Goodpasture syndrome 40 54 0.5 0.8 20 19 45.0 40.7 87.5 98.1 10.0 - 2.5 1.9 7.5 18.5 5.0 1.9
Secondary GN, other 25 19 0.3 0.3 16 19 56.0 47.4 76.0 78.9 20.0 15.8 4.0 5.3 16.0 31.6 12.0 -
Interstitial nephritis/pyelonephritis 474 363 6.0 5.1 16 17 53.8 51.8 82.3 81.3 11.4 11.6 6.3 7.2 47.5 43.5 2.3 5.0
Nephropathy caused by other agents 44 47 0.6 0.7 16 16 52.3 59.6 86.4 83.0 13.6 10.6 - 6.4 47.7 25.5 11.4 12.8
Nephrolithiasis 15 19 0.2 0.3 18 17 40.0 26.3 80.0 89.5 13.3 5.3 6.7 5.3 66.7 68.4 - 10.5
Acquired obstructive uropathy 59 41 0.8 0.6 16 17 79.7 68.3 74.6 75.6 20.3 17.1 5.1 7.3 39.0 36.6 - -
Chronic pyelonephritis, reflux nephropathy 249 161 3.2 2.2 16 17 46.2 46.0 87.6 87.0 4.8 6.8 7.6 6.2 50.2 49.7 1.6 3.7
Chronic interstitial nephritis 83 77 1.1 1.1 16 17 59.0 53.2 74.7 74.0 19.3 15.6 6.0 10.4 51.8 44.2 2.4 2.6
Hypertensive/large vessel disease 500 522 6.4 7.3 19 20 62.6 61.9 50.8 50.0 44.2 45.6 5.0 4.4 20.0 13.4 2.0 3.1
(Table 8.1 continued on next page)
2015 USRDS Annual Data Report | Volume 2 - ESRD in the United States
243
vol 2 Table 8.1 Distribution of reported incident pediatric ESRD patients by primary cause of ESRD (aged 0-21 years), and by demographic characteristics, 2004-2008 (period A) and 2009-2013 (period B)
Total Incident Age Male White Black African Am Other Race Transplant
first yearDied first
year
Patients % Median % % % % % %
A B A B A B A B A B A B A B A B A B
Cystic/hereditary/congenital diseases 2,252 2,364 28.6 33.0 11 11 67.6 67.1 77.4 75.5 17.0 17.7 5.6 6.7 50.4 49.7 3.1 2.5
Polycystic kidneys, adult type (dominant) 46 51 0.6 0.7 18 18 45.7 47.1 80.4 76.5 17.4 23.5 2.2 - 47.8 49.0 2.2 2.0
Polycystic, infantile (recessive) 146 142 1.9 2.0 8 1 55.5 43.0 78.1 78.2 17.1 14.1 4.8 7.7 51.4 42.3 11.0 9.2
Medullary cystic disease, incl. nephronophthisis 105 112 1.3 1.6 12 13 39.0 46.4 88.6 82.1 3.8 11.6 7.6 6.3 65.7 71.4 1.0 0.9
Hereditary nephritis, Alport's syndrome 184 158 2.3 2.2 17 17 87.0 86.7 71.7 74.7 21.7 17.7 6.5 7.6 46.7 49.4 0.5 -
Cystinosis 65 45 0.8 0.6 12 13 49.2 62.2 95.4 84.4 4.6 13.3 - 2.2 76.9 75.6 - -
Primary oxalosis 22 13 0.3 0.2 12 4 45.5 76.9 81.8 76.9 9.1 - 9.1 23.1 59.1 53.8 - 7.7
Congenital nephrotic syndrome 144 132 1.8 1.8 2 3 57.6 51.5 73.6 81.1 20.1 11.4 6.3 7.6 53.5 43.9 4.2 6.1
Drash syndrome, mesangial sclerosis 14 34 0.2 0.5 0 1 57.1 52.9 85.7 76.5 7.1 20.6 7.1 2.9 50.0 26.5 14.3 2.9
Congenital obstructive uropathy 610 659 7.8 9.2 12 12 82.3 81.0 73.8 72.2 21.0 21.9 5.2 5.9 45.2 47.3 2.8 0.8
Renal hypoplasia, dysplasia, oligonephronia 700 703 8.9 9.8 10 9 61.7 62.0 77.7 75.8 15.6 17.8 6.7 6.4 50.1 50.8 3.1 2.8
Prune belly syndrome 81 87 1.0 1.2 8 6 98.8 98.9 79.0 67.8 18.5 26.4 2.5 5.7 54.3 50.6 1.2 -
Other (congenital malformation syndromes) 126 219 1.6 3.1 16 13 54.8 58.9 84.1 79.0 11.9 9.6 4.0 11.4 49.2 49.3 1.6 4.1
Neoplasms/tumors 195 135 2.5 1.9 15 15 52.3 50.4 73.8 70.4 19.5 19.3 6.7 10.4 37.4 27.4 16.9 15.6
Renal tumor 40 40 0.5 0.6 6 5 42.5 42.5 57.5 72.5 32.5 17.5 10.0 10.0 12.5 20.0 25.0 12.5
Kidney transplant complication 51 * 0.6 0.1 16 19 54.9 50.0 74.5 100.0 19.6 - 5.9 - 66.7 50.0 - -
Other transplant complication 87 75 1.1 1.0 15 17 57.5 56.0 80.5 66.7 14.9 24.0 4.6 9.3 33.3 28.0 20.7 17.3
Miscellaneous conditions 542 494 6.9 6.9 16 16 54.6 54.5 64.9 68.0 31.2 23.3 3.9 8.7 31.9 30.4 8.3 7.7
Sickle cell disease/anemia 26 19 0.3 0.3 19 20 69.2 63.2 3.8 5.3 92.3 94.7 3.8 - 7.7 15.8 23.1 10.5
AIDS nephropathy 64 31 0.8 0.4 19 20 50.0 54.8 9.4 3.2 90.6 96.8 - - - - 18.8 19.4
Traumatic or surgical loss of kidney(s) 17 11 0.2 0.2 8 17 58.8 63.6 88.2 45.5 11.8 27.3 - 27.3 41.2 9.1 11.8 18.2
Tubular necrosis 163 143 2.1 2.0 15 15 50.9 61.5 79.1 74.8 16.6 17.5 4.3 7.7 16.0 16.8 6.7 12.6
Other renal disorders 266 282 3.4 3.9 15 14 56.8 49.6 74.4 77.3 20.7 13.5 4.9 9.2 51.9 41.8 4.5 3.2
Etiology uncertain 655 502 8.3 7.0 16 16 60.0 59.0 73.4 69.7 20.0 21.5 6.6 8.8 32.8 33.3 3.1 1.2
Missing 362 546 4.6 7.6 14 15 59.4 60.6 23.2 31.9 5.2 10.4 71.5 57.7 93.9 77.5 1.1 2.4
Data Source: Special analyses, USRDS ESRD Database. Abbreviations: African Am, African American; AIDS, acquired-immune deficiency syndrome; Congenital obstructive uropathy, combination of congenital ureterpelvic junction obstruction, congenital uretrovesical junction obstruction, and other congenital anomalies; ESRD, end-stage renal disease; GN glomerulonephritis; IgA immunoglobulin A; IgM, immunoglobulin M; incl., including; MPGN, membranoproliferative glomerulonephritis; SBE, sub-acute bacterial endocarditis.
(Table 8.1 continued)
244
Chapter 8: Pediatric ESRD
Hospitalizations
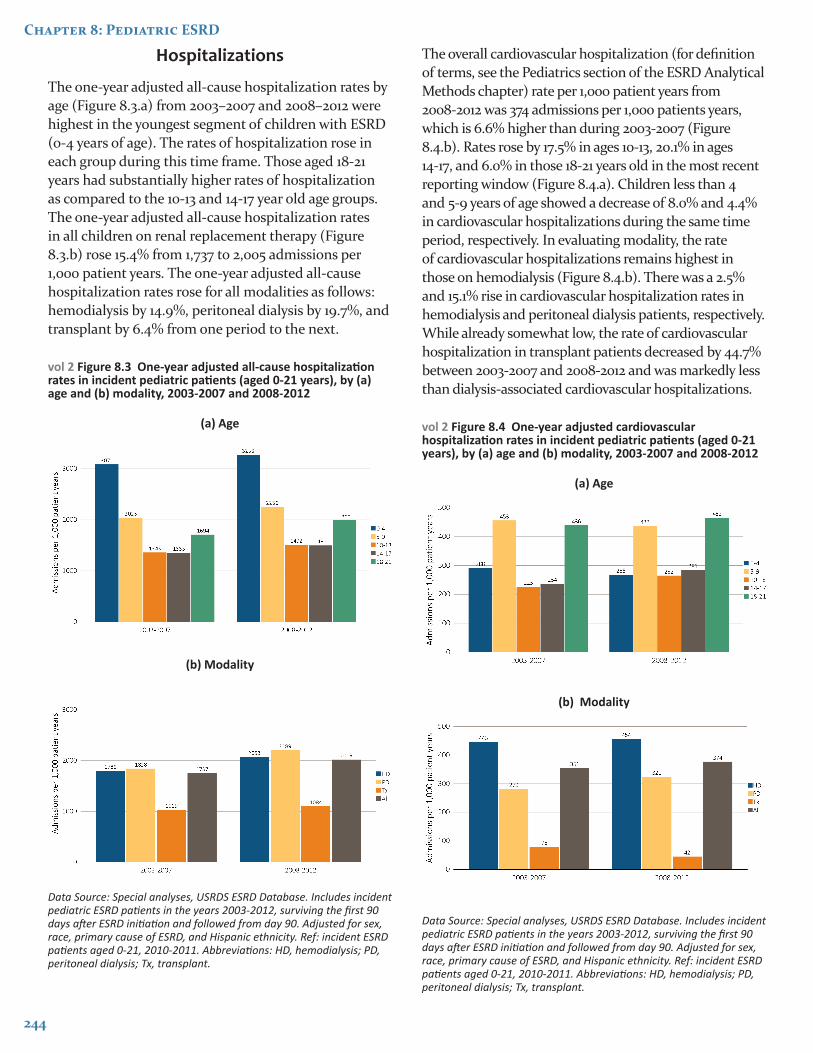
The one-year adjusted all-cause hospitalization rates by age (Figure 8.3.a) from 2003–2007 and 2008–2012 were highest in the youngest segment of children with ESRD (0-4 years of age). The rates of hospitalization rose in each group during this time frame. Those aged 18-21 years had substantially higher rates of hospitalization as compared to the 10-13 and 14-17 year old age groups. The one-year adjusted all-cause hospitalization rates in all children on renal replacement therapy (Figure 8.3.b) rose 15.4% from 1,737 to 2,005 admissions per 1,000 patient years. The one-year adjusted all-cause hospitalization rates rose for all modalities as follows: hemodialysis by 14.9%, peritoneal dialysis by 19.7%, and transplant by 6.4% from one period to the next.
vol 2 Figure 8.3 One-year adjusted all-cause hospitalization rates in incident pediatric patients (aged 0-21 years), by (a) age and (b) modality, 2003-2007 and 2008-2012
(a) Age
(b) Modality
Data Source: Special analyses, USRDS ESRD Database. Includes incident pediatric ESRD patients in the years 2003-2012, surviving the first 90 days after ESRD initiation and followed from day 90. Adjusted for sex, race, primary cause of ESRD, and Hispanic ethnicity. Ref: incident ESRD patients aged 0-21, 2010-2011. Abbreviations: HD, hemodialysis; PD, peritoneal dialysis; Tx, transplant.
The overall cardiovascular hospitalization (for definition of terms, see the Pediatrics section of the ESRD Analytical Methods chapter) rate per 1,000 patient years from 2008-2012 was 374 admissions per 1,000 patients years, which is 6.6% higher than during 2003-2007 (Figure 8.4.b). Rates rose by 17.5% in ages 10-13, 20.1% in ages 14-17, and 6.0% in those 18-21 years old in the most recent reporting window (Figure 8.4.a). Children less than 4 and 5-9 years of age showed a decrease of 8.0% and 4.4% in cardiovascular hospitalizations during the same time period, respectively. In evaluating modality, the rate of cardiovascular hospitalizations remains highest in those on hemodialysis (Figure 8.4.b). There was a 2.5% and 15.1% rise in cardiovascular hospitalization rates in hemodialysis and peritoneal dialysis patients, respectively. While already somewhat low, the rate of cardiovascular hospitalization in transplant patients decreased by 44.7% between 2003-2007 and 2008-2012 and was markedly less than dialysis-associated cardiovascular hospitalizations.
vol 2 Figure 8.4 One-year adjusted cardiovascular hospitalization rates in incident pediatric patients (aged 0-21 years), by (a) age and (b) modality, 2003-2007 and 2008-2012
(a) Age
(b) Modality
Data Source: Special analyses, USRDS ESRD Database. Includes incident pediatric ESRD patients in the years 2003-2012, surviving the first 90 days after ESRD initiation and followed from day 90. Adjusted for sex, race, primary cause of ESRD, and Hispanic ethnicity. Ref: incident ESRD patients aged 0-21, 2010-2011. Abbreviations: HD, hemodialysis; PD, peritoneal dialysis; Tx, transplant.
2015 USRDS Annual Data Report | Volume 2 - ESRD in the United States
245
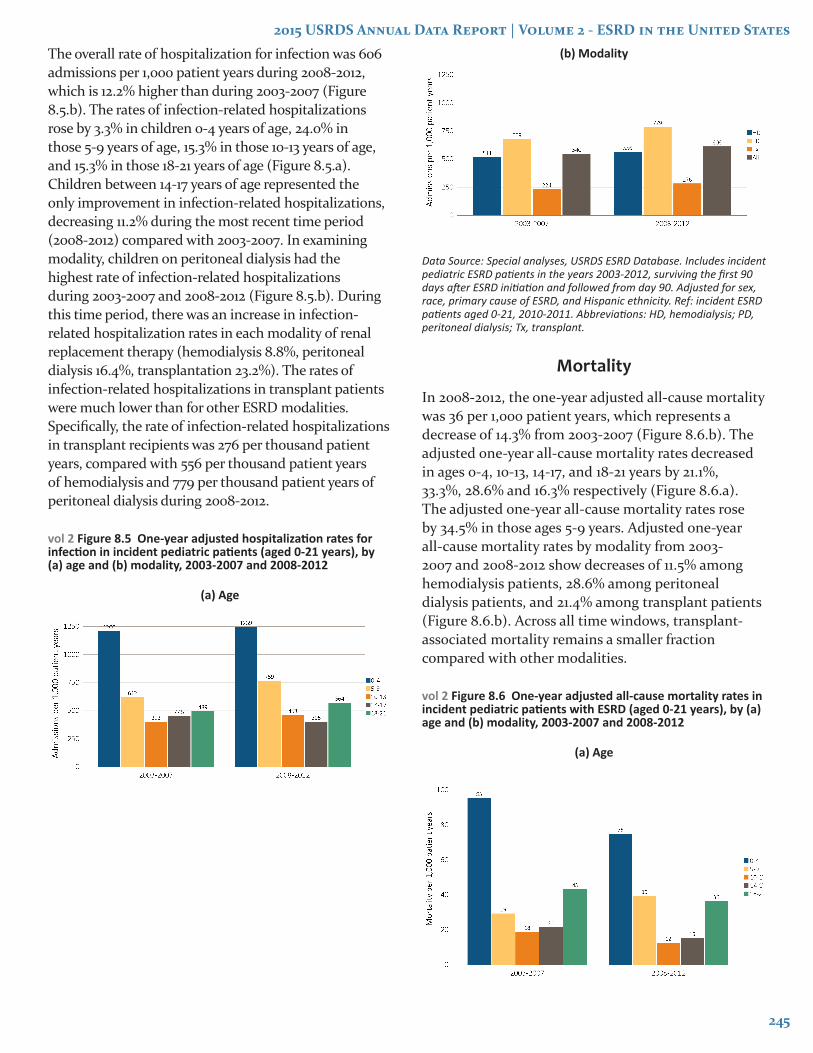
The overall rate of hospitalization for infection was 606 admissions per 1,000 patient years during 2008-2012, which is 12.2% higher than during 2003-2007 (Figure 8.5.b). The rates of infection-related hospitalizations rose by 3.3% in children 0-4 years of age, 24.0% in those 5-9 years of age, 15.3% in those 10-13 years of age, and 15.3% in those 18-21 years of age (Figure 8.5.a). Children between 14-17 years of age represented the only improvement in infection-related hospitalizations, decreasing 11.2% during the most recent time period (2008-2012) compared with 2003-2007. In examining modality, children on peritoneal dialysis had the highest rate of infection-related hospitalizations during 2003-2007 and 2008-2012 (Figure 8.5.b). During this time period, there was an increase in infection-related hospitalization rates in each modality of renal replacement therapy (hemodialysis 8.8%, peritoneal dialysis 16.4%, transplantation 23.2%). The rates of infection-related hospitalizations in transplant patients were much lower than for other ESRD modalities. Specifically, the rate of infection-related hospitalizations in transplant recipients was 276 per thousand patient years, compared with 556 per thousand patient years of hemodialysis and 779 per thousand patient years of peritoneal dialysis during 2008-2012.
vol 2 Figure 8.5 One-year adjusted hospitalization rates for infection in incident pediatric patients (aged 0-21 years), by (a) age and (b) modality, 2003-2007 and 2008-2012
(a) Age
(b) Modality
Data Source: Special analyses, USRDS ESRD Database. Includes incident pediatric ESRD patients in the years 2003-2012, surviving the first 90 days after ESRD initiation and followed from day 90. Adjusted for sex, race, primary cause of ESRD, and Hispanic ethnicity. Ref: incident ESRD patients aged 0-21, 2010-2011. Abbreviations: HD, hemodialysis; PD, peritoneal dialysis; Tx, transplant.
Mortality
In 2008-2012, the one-year adjusted all-cause mortality was 36 per 1,000 patient years, which represents a decrease of 14.3% from 2003-2007 (Figure 8.6.b). The adjusted one-year all-cause mortality rates decreased in ages 0-4, 10-13, 14-17, and 18-21 years by 21.1%, 33.3%, 28.6% and 16.3% respectively (Figure 8.6.a). The adjusted one-year all-cause mortality rates rose by 34.5% in those ages 5-9 years. Adjusted one-year all-cause mortality rates by modality from 2003-2007 and 2008-2012 show decreases of 11.5% among hemodialysis patients, 28.6% among peritoneal dialysis patients, and 21.4% among transplant patients (Figure 8.6.b). Across all time windows, transplant-associated mortality remains a smaller fraction compared with other modalities.
vol 2 Figure 8.6 One-year adjusted all-cause mortality rates in incident pediatric patients with ESRD (aged 0-21 years), by (a) age and (b) modality, 2003-2007 and 2008-2012
(a) Age
246
Chapter 8: Pediatric ESRD(b) Modality
Data Source: Special analyses, USRDS ESRD Database. Incident dialysis and transplant patients defined at the onset of dialysis or the day of transplant without the 60-day rule; followed to December 31, 2013. Adjusted for age, sex, race, Hispanic ethnicity, and primary cause of ESRD. Ref: incident ESRD patients aged 0-21, 2010-2011. Abbreviations: HD, hemodialysis; PD, peritoneal dialysis; Tx, transplant.
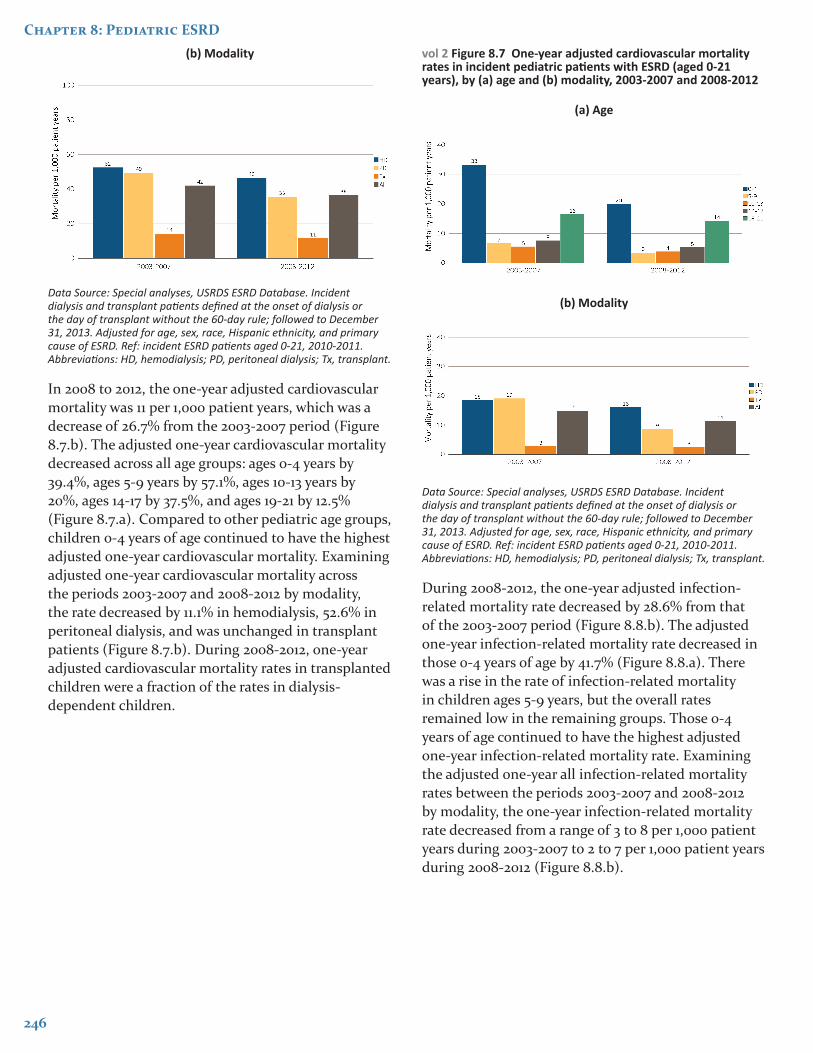
In 2008 to 2012, the one-year adjusted cardiovascular mortality was 11 per 1,000 patient years, which was a decrease of 26.7% from the 2003-2007 period (Figure 8.7.b). The adjusted one-year cardiovascular mortality decreased across all age groups: ages 0-4 years by 39.4%, ages 5-9 years by 57.1%, ages 10-13 years by 20%, ages 14-17 by 37.5%, and ages 19-21 by 12.5% (Figure 8.7.a). Compared to other pediatric age groups, children 0-4 years of age continued to have the highest adjusted one-year cardiovascular mortality. Examining adjusted one-year cardiovascular mortality across the periods 2003-2007 and 2008-2012 by modality, the rate decreased by 11.1% in hemodialysis, 52.6% in peritoneal dialysis, and was unchanged in transplant patients (Figure 8.7.b). During 2008-2012, one-year adjusted cardiovascular mortality rates in transplanted children were a fraction of the rates in dialysis-dependent children.
vol 2 Figure 8.7 One-year adjusted cardiovascular mortality rates in incident pediatric patients with ESRD (aged 0-21 years), by (a) age and (b) modality, 2003-2007 and 2008-2012
(a) Age
(b) Modality
Data Source: Special analyses, USRDS ESRD Database. Incident dialysis and transplant patients defined at the onset of dialysis or the day of transplant without the 60-day rule; followed to December 31, 2013. Adjusted for age, sex, race, Hispanic ethnicity, and primary cause of ESRD. Ref: incident ESRD patients aged 0-21, 2010-2011. Abbreviations: HD, hemodialysis; PD, peritoneal dialysis; Tx, transplant.
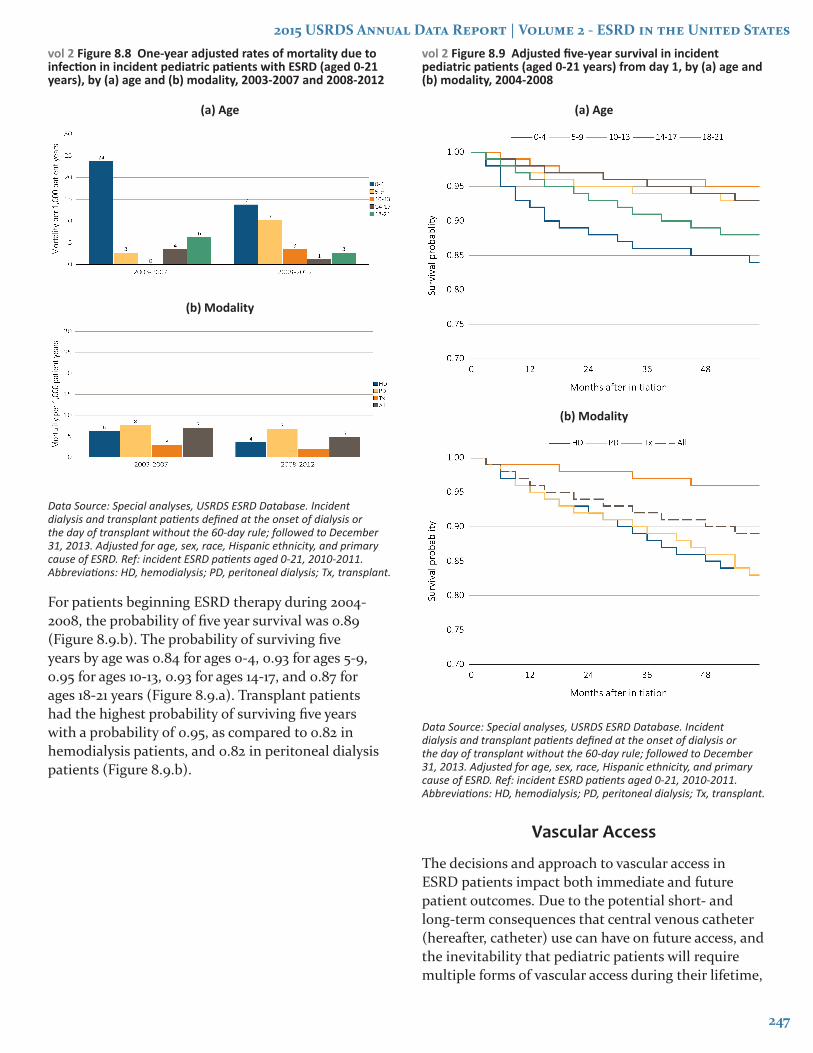
During 2008-2012, the one-year adjusted infection-related mortality rate decreased by 28.6% from that of the 2003-2007 period (Figure 8.8.b). The adjusted one-year infection-related mortality rate decreased in those 0-4 years of age by 41.7% (Figure 8.8.a). There was a rise in the rate of infection-related mortality in children ages 5-9 years, but the overall rates remained low in the remaining groups. Those 0-4 years of age continued to have the highest adjusted one-year infection-related mortality rate. Examining the adjusted one-year all infection-related mortality rates between the periods 2003-2007 and 2008-2012 by modality, the one-year infection-related mortality rate decreased from a range of 3 to 8 per 1,000 patient years during 2003-2007 to 2 to 7 per 1,000 patient years during 2008-2012 (Figure 8.8.b).
2015 USRDS Annual Data Report | Volume 2 - ESRD in the United States
247
vol 2 Figure 8.8 One-year adjusted rates of mortality due to infection in incident pediatric patients with ESRD (aged 0-21 years), by (a) age and (b) modality, 2003-2007 and 2008-2012
(a) Age
(b) Modality
Data Source: Special analyses, USRDS ESRD Database. Incident dialysis and transplant patients defined at the onset of dialysis or the day of transplant without the 60-day rule; followed to December 31, 2013. Adjusted for age, sex, race, Hispanic ethnicity, and primary cause of ESRD. Ref: incident ESRD patients aged 0-21, 2010-2011. Abbreviations: HD, hemodialysis; PD, peritoneal dialysis; Tx, transplant.
For patients beginning ESRD therapy during 2004-2008, the probability of five year survival was 0.89 (Figure 8.9.b). The probability of surviving five years by age was 0.84 for ages 0-4, 0.93 for ages 5-9, 0.95 for ages 10-13, 0.93 for ages 14-17, and 0.87 for ages 18-21 years (Figure 8.9.a). Transplant patients had the highest probability of surviving five years with a probability of 0.95, as compared to 0.82 in hemodialysis patients, and 0.82 in peritoneal dialysis patients (Figure 8.9.b).
vol 2 Figure 8.9 Adjusted five-year survival in incident pediatric patients (aged 0-21 years) from day 1, by (a) age and (b) modality, 2004-2008
(a) Age
(b) Modality
Data Source: Special analyses, USRDS ESRD Database. Incident dialysis and transplant patients defined at the onset of dialysis or the day of transplant without the 60-day rule; followed to December 31, 2013. Adjusted for age, sex, race, Hispanic ethnicity, and primary cause of ESRD. Ref: incident ESRD patients aged 0-21, 2010-2011. Abbreviations: HD, hemodialysis; PD, peritoneal dialysis; Tx, transplant.
Vascular Access
The decisions and approach to vascular access in ESRD patients impact both immediate and future patient outcomes. Due to the potential short- and long-term consequences that central venous catheter (hereafter, catheter) use can have on future access, and the inevitability that pediatric patients will require multiple forms of vascular access during their lifetime,
248
Chapter 8: Pediatric ESRD
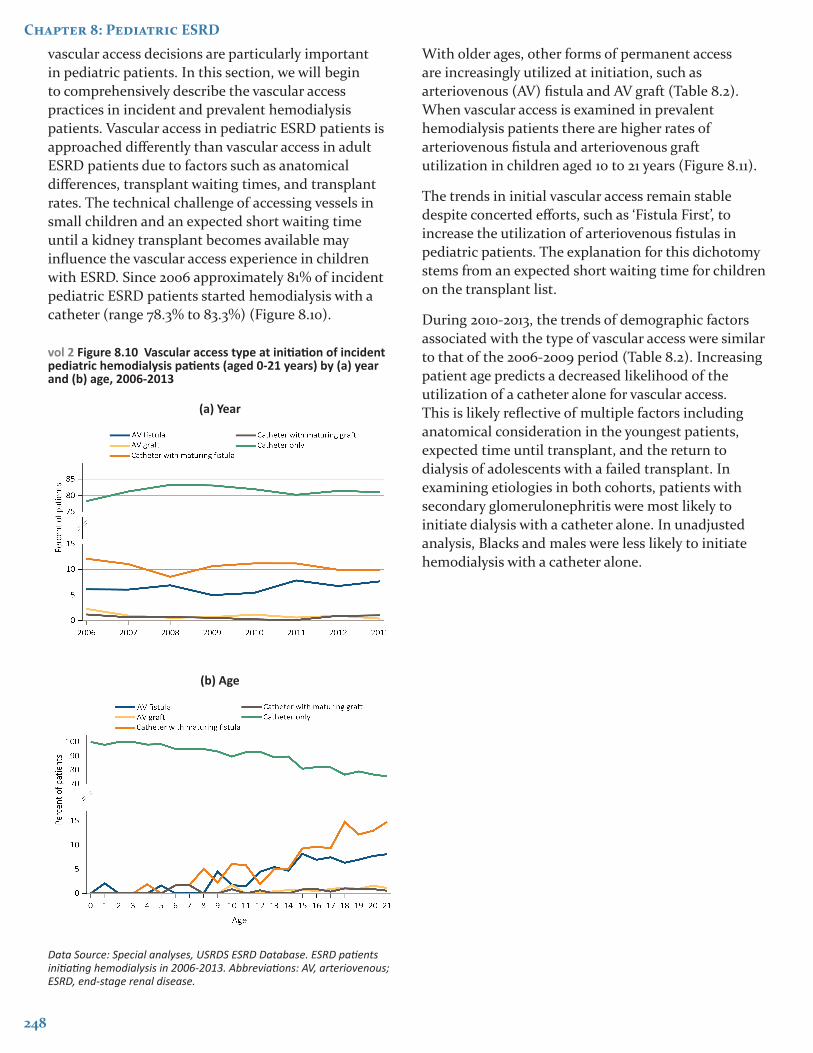
vascular access decisions are particularly important in pediatric patients. In this section, we will begin to comprehensively describe the vascular access practices in incident and prevalent hemodialysis patients. Vascular access in pediatric ESRD patients is approached differently than vascular access in adult ESRD patients due to factors such as anatomical differences, transplant waiting times, and transplant rates. The technical challenge of accessing vessels in small children and an expected short waiting time until a kidney transplant becomes available may influence the vascular access experience in children with ESRD. Since 2006 approximately 81% of incident pediatric ESRD patients started hemodialysis with a catheter (range 78.3% to 83.3%) (Figure 8.10).
vol 2 Figure 8.10 Vascular access type at initiation of incident pediatric hemodialysis patients (aged 0-21 years) by (a) year and (b) age, 2006-2013
(a) Year
(b) Age
Data Source: Special analyses, USRDS ESRD Database. ESRD patients initiating hemodialysis in 2006-2013. Abbreviations: AV, arteriovenous; ESRD, end-stage renal disease.
With older ages, other forms of permanent access are increasingly utilized at initiation, such as arteriovenous (AV) fistula and AV graft (Table 8.2). When vascular access is examined in prevalent hemodialysis patients there are higher rates of arteriovenous fistula and arteriovenous graft utilization in children aged 10 to 21 years (Figure 8.11).
The trends in initial vascular access remain stable despite concerted efforts, such as ‘Fistula First’, to increase the utilization of arteriovenous fistulas in pediatric patients. The explanation for this dichotomy stems from an expected short waiting time for children on the transplant list.
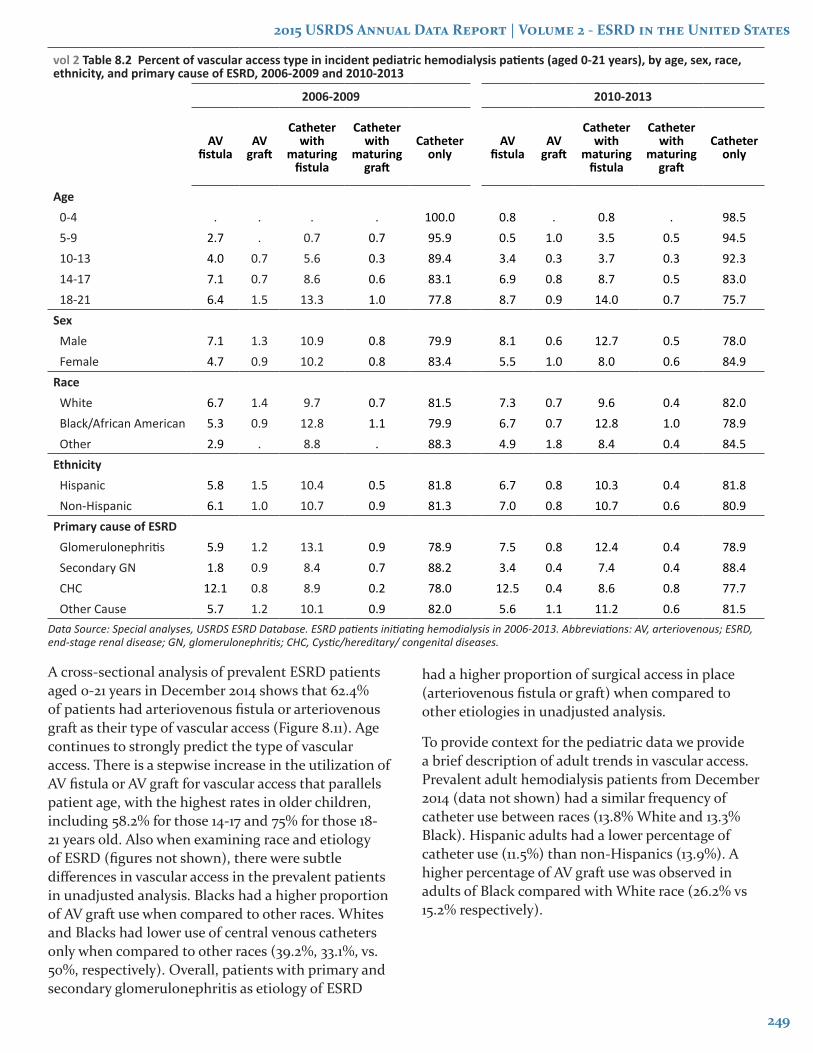
During 2010-2013, the trends of demographic factors associated with the type of vascular access were similar to that of the 2006-2009 period (Table 8.2). Increasing patient age predicts a decreased likelihood of the utilization of a catheter alone for vascular access. This is likely reflective of multiple factors including anatomical consideration in the youngest patients, expected time until transplant, and the return to dialysis of adolescents with a failed transplant. In examining etiologies in both cohorts, patients with secondary glomerulonephritis were most likely to initiate dialysis with a catheter alone. In unadjusted analysis, Blacks and males were less likely to initiate hemodialysis with a catheter alone.
2015 USRDS Annual Data Report | Volume 2 - ESRD in the United States
249
vol 2 Table 8.2 Percent of vascular access type in incident pediatric hemodialysis patients (aged 0-21 years), by age, sex, race, ethnicity, and primary cause of ESRD, 2006-2009 and 2010-2013
2006-2009 2010-2013
AV fistula
AV graft
Catheter with
maturing fistula
Catheter with
maturing graft
Catheter only
AV fistula
AV graft
Catheter with
maturing fistula
Catheter with
maturing graft
Catheter only
Age0-4 . . . . 100.0 0.8 . 0.8 . 98.55-9 2.7 . 0.7 0.7 95.9 0.5 1.0 3.5 0.5 94.510-13 4.0 0.7 5.6 0.3 89.4 3.4 0.3 3.7 0.3 92.314-17 7.1 0.7 8.6 0.6 83.1 6.9 0.8 8.7 0.5 83.018-21 6.4 1.5 13.3 1.0 77.8 8.7 0.9 14.0 0.7 75.7
SexMale 7.1 1.3 10.9 0.8 79.9 8.1 0.6 12.7 0.5 78.0Female 4.7 0.9 10.2 0.8 83.4 5.5 1.0 8.0 0.6 84.9
RaceWhite 6.7 1.4 9.7 0.7 81.5 7.3 0.7 9.6 0.4 82.0Black/African American 5.3 0.9 12.8 1.1 79.9 6.7 0.7 12.8 1.0 78.9Other 2.9 . 8.8 . 88.3 4.9 1.8 8.4 0.4 84.5
EthnicityHispanic 5.8 1.5 10.4 0.5 81.8 6.7 0.8 10.3 0.4 81.8Non-Hispanic 6.1 1.0 10.7 0.9 81.3 7.0 0.8 10.7 0.6 80.9
Primary cause of ESRDGlomerulonephritis 5.9 1.2 13.1 0.9 78.9 7.5 0.8 12.4 0.4 78.9Secondary GN 1.8 0.9 8.4 0.7 88.2 3.4 0.4 7.4 0.4 88.4CHC 12.1 0.8 8.9 0.2 78.0 12.5 0.4 8.6 0.8 77.7Other Cause 5.7 1.2 10.1 0.9 82.0 5.6 1.1 11.2 0.6 81.5
Data Source: Special analyses, USRDS ESRD Database. ESRD patients initiating hemodialysis in 2006-2013. Abbreviations: AV, arteriovenous; ESRD, end-stage renal disease; GN, glomerulonephritis; CHC, Cystic/hereditary/ congenital diseases.
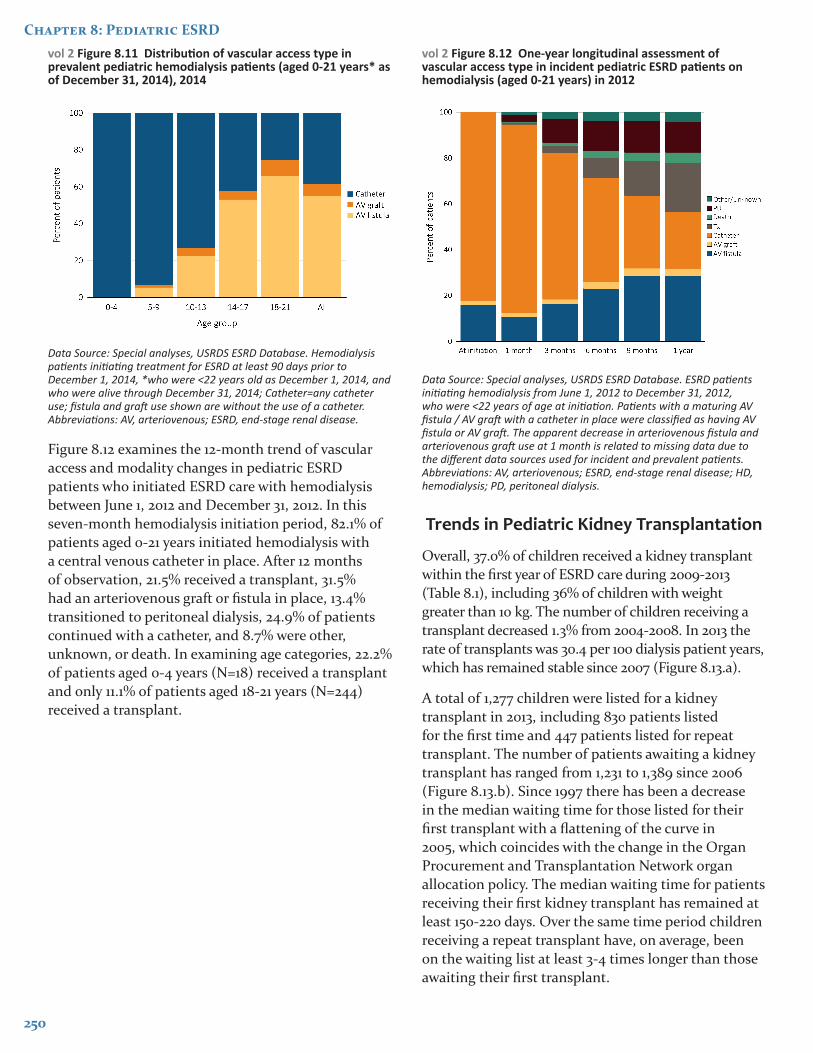
A cross-sectional analysis of prevalent ESRD patients aged 0-21 years in December 2014 shows that 62.4% of patients had arteriovenous fistula or arteriovenous graft as their type of vascular access (Figure 8.11). Age continues to strongly predict the type of vascular access. There is a stepwise increase in the utilization of AV fistula or AV graft for vascular access that parallels patient age, with the highest rates in older children, including 58.2% for those 14-17 and 75% for those 18-21 years old. Also when examining race and etiology of ESRD (figures not shown), there were subtle differences in vascular access in the prevalent patients in unadjusted analysis. Blacks had a higher proportion of AV graft use when compared to other races. Whites and Blacks had lower use of central venous catheters only when compared to other races (39.2%, 33.1%, vs. 50%, respectively). Overall, patients with primary and secondary glomerulonephritis as etiology of ESRD
had a higher proportion of surgical access in place (arteriovenous fistula or graft) when compared to other etiologies in unadjusted analysis.
To provide context for the pediatric data we provide a brief description of adult trends in vascular access. Prevalent adult hemodialysis patients from December 2014 (data not shown) had a similar frequency of catheter use between races (13.8% White and 13.3% Black). Hispanic adults had a lower percentage of catheter use (11.5%) than non-Hispanics (13.9%). A higher percentage of AV graft use was observed in adults of Black compared with White race (26.2% vs 15.2% respectively).
250
Chapter 8: Pediatric ESRDvol 2 Figure 8.11 Distribution of vascular access type in prevalent pediatric hemodialysis patients (aged 0-21 years* as of December 31, 2014), 2014
Data Source: Special analyses, USRDS ESRD Database. Hemodialysis patients initiating treatment for ESRD at least 90 days prior to December 1, 2014, *who were <22 years old as December 1, 2014, and who were alive through December 31, 2014; Catheter=any catheter use; fistula and graft use shown are without the use of a catheter. Abbreviations: AV, arteriovenous; ESRD, end-stage renal disease.
Figure 8.12 examines the 12-month trend of vascular access and modality changes in pediatric ESRD patients who initiated ESRD care with hemodialysis between June 1, 2012 and December 31, 2012. In this seven-month hemodialysis initiation period, 82.1% of patients aged 0-21 years initiated hemodialysis with a central venous catheter in place. After 12 months of observation, 21.5% received a transplant, 31.5% had an arteriovenous graft or fistula in place, 13.4% transitioned to peritoneal dialysis, 24.9% of patients continued with a catheter, and 8.7% were other, unknown, or death. In examining age categories, 22.2% of patients aged 0-4 years (N=18) received a transplant and only 11.1% of patients aged 18-21 years (N=244) received a transplant.
vol 2 Figure 8.12 One-year longitudinal assessment of vascular access type in incident pediatric ESRD patients on hemodialysis (aged 0-21 years) in 2012
Data Source: Special analyses, USRDS ESRD Database. ESRD patients initiating hemodialysis from June 1, 2012 to December 31, 2012, who were <22 years of age at initiation. Patients with a maturing AV fistula / AV graft with a catheter in place were classified as having AV fistula or AV graft. The apparent decrease in arteriovenous fistula and arteriovenous graft use at 1 month is related to missing data due to the different data sources used for incident and prevalent patients. Abbreviations: AV, arteriovenous; ESRD, end-stage renal disease; HD, hemodialysis; PD, peritoneal dialysis.
Trends in Pediatric Kidney Transplantation
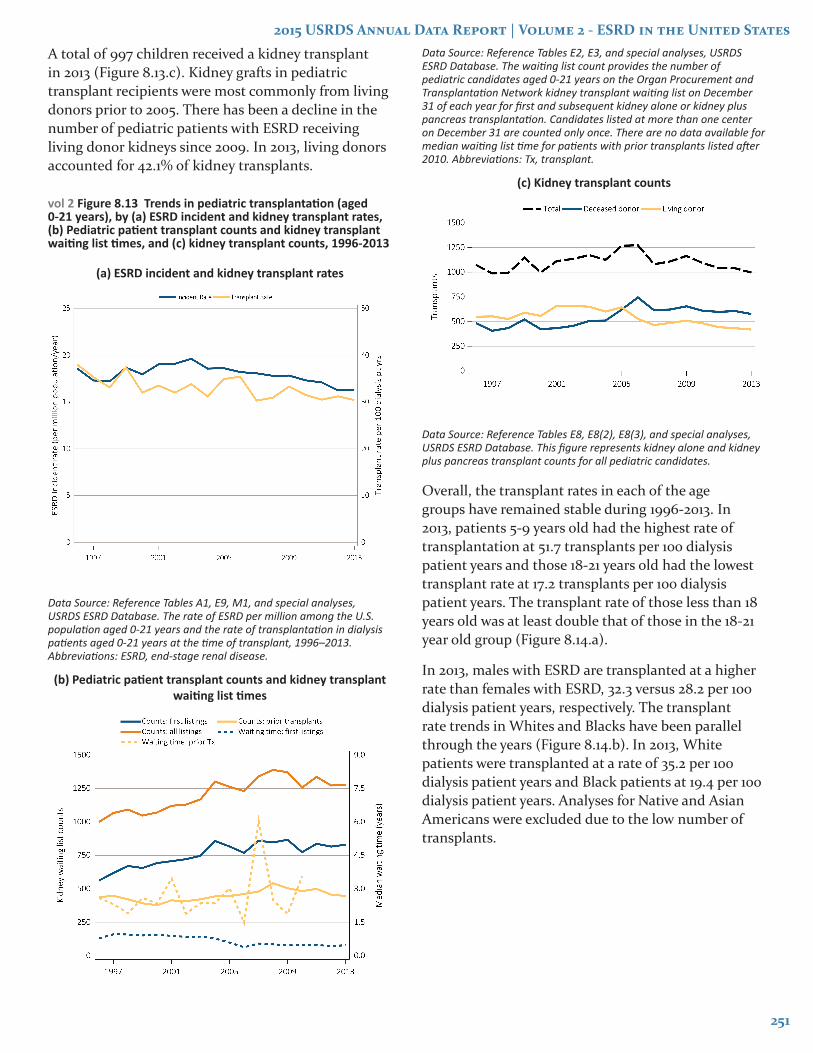
Overall, 37.0% of children received a kidney transplant within the first year of ESRD care during 2009-2013 (Table 8.1), including 36% of children with weight greater than 10 kg. The number of children receiving a transplant decreased 1.3% from 2004-2008. In 2013 the rate of transplants was 30.4 per 100 dialysis patient years, which has remained stable since 2007 (Figure 8.13.a).
A total of 1,277 children were listed for a kidney transplant in 2013, including 830 patients listed for the first time and 447 patients listed for repeat transplant. The number of patients awaiting a kidney transplant has ranged from 1,231 to 1,389 since 2006 (Figure 8.13.b). Since 1997 there has been a decrease in the median waiting time for those listed for their first transplant with a flattening of the curve in 2005, which coincides with the change in the Organ Procurement and Transplantation Network organ allocation policy. The median waiting time for patients receiving their first kidney transplant has remained at least 150-220 days. Over the same time period children receiving a repeat transplant have, on average, been on the waiting list at least 3-4 times longer than those awaiting their first transplant.
2015 USRDS Annual Data Report | Volume 2 - ESRD in the United States
251
A total of 997 children received a kidney transplant in 2013 (Figure 8.13.c). Kidney grafts in pediatric transplant recipients were most commonly from living donors prior to 2005. There has been a decline in the number of pediatric patients with ESRD receiving living donor kidneys since 2009. In 2013, living donors accounted for 42.1% of kidney transplants.
vol 2 Figure 8.13 Trends in pediatric transplantation (aged 0-21 years), by (a) ESRD incident and kidney transplant rates, (b) Pediatric patient transplant counts and kidney transplant waiting list times, and (c) kidney transplant counts, 1996-2013
(a) ESRD incident and kidney transplant rates
Data Source: Reference Tables A1, E9, M1, and special analyses, USRDS ESRD Database. The rate of ESRD per million among the U.S. population aged 0-21 years and the rate of transplantation in dialysis patients aged 0-21 years at the time of transplant, 1996–2013. Abbreviations: ESRD, end-stage renal disease.
(b) Pediatric patient transplant counts and kidney transplant waiting list times
Data Source: Reference Tables E2, E3, and special analyses, USRDS ESRD Database. The waiting list count provides the number of pediatric candidates aged 0-21 years on the Organ Procurement and Transplantation Network kidney transplant waiting list on December 31 of each year for first and subsequent kidney alone or kidney plus pancreas transplantation. Candidates listed at more than one center on December 31 are counted only once. There are no data available for median waiting list time for patients with prior transplants listed after 2010. Abbreviations: Tx, transplant.
(c) Kidney transplant counts
Data Source: Reference Tables E8, E8(2), E8(3), and special analyses, USRDS ESRD Database. This figure represents kidney alone and kidney plus pancreas transplant counts for all pediatric candidates.
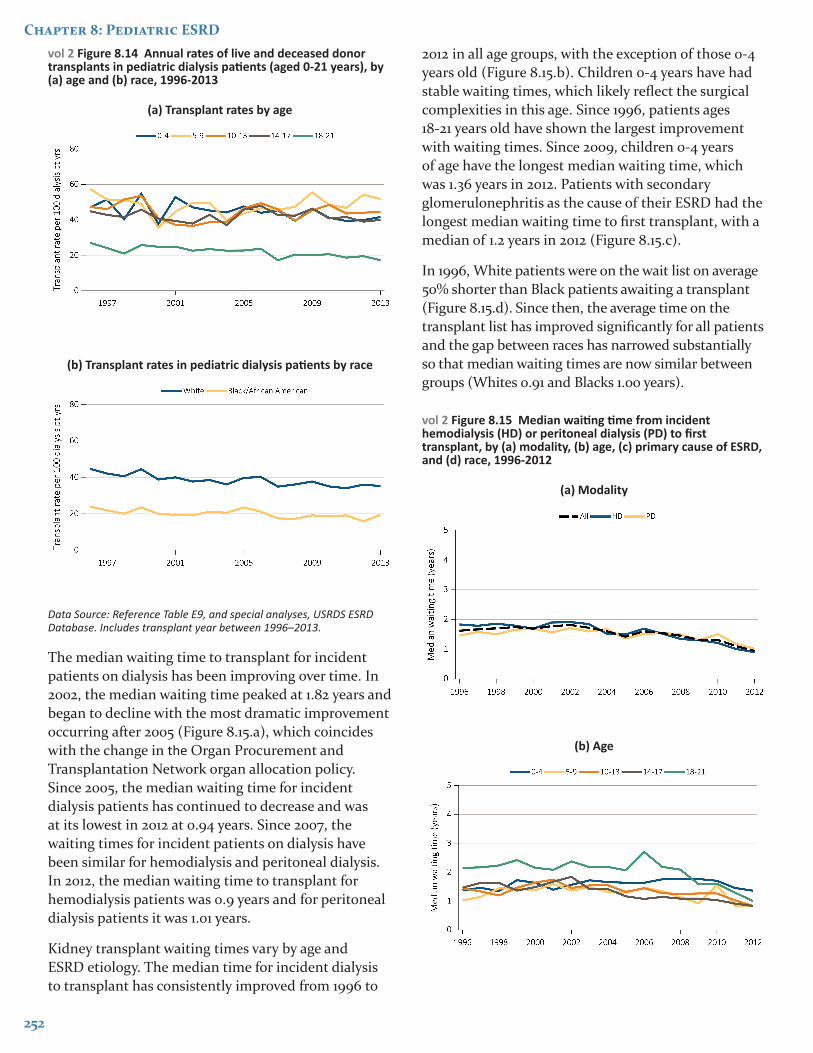
Overall, the transplant rates in each of the age groups have remained stable during 1996-2013. In 2013, patients 5-9 years old had the highest rate of transplantation at 51.7 transplants per 100 dialysis patient years and those 18-21 years old had the lowest transplant rate at 17.2 transplants per 100 dialysis patient years. The transplant rate of those less than 18 years old was at least double that of those in the 18-21 year old group (Figure 8.14.a).
In 2013, males with ESRD are transplanted at a higher rate than females with ESRD, 32.3 versus 28.2 per 100 dialysis patient years, respectively. The transplant rate trends in Whites and Blacks have been parallel through the years (Figure 8.14.b). In 2013, White patients were transplanted at a rate of 35.2 per 100 dialysis patient years and Black patients at 19.4 per 100 dialysis patient years. Analyses for Native and Asian Americans were excluded due to the low number of transplants.
252
Chapter 8: Pediatric ESRDvol 2 Figure 8.14 Annual rates of live and deceased donor transplants in pediatric dialysis patients (aged 0-21 years), by (a) age and (b) race, 1996-2013
(a) Transplant rates by age
(b) Transplant rates in pediatric dialysis patients by race
Data Source: Reference Table E9, and special analyses, USRDS ESRD Database. Includes transplant year between 1996–2013.
The median waiting time to transplant for incident patients on dialysis has been improving over time. In 2002, the median waiting time peaked at 1.82 years and began to decline with the most dramatic improvement occurring after 2005 (Figure 8.15.a), which coincides with the change in the Organ Procurement and Transplantation Network organ allocation policy. Since 2005, the median waiting time for incident dialysis patients has continued to decrease and was at its lowest in 2012 at 0.94 years. Since 2007, the waiting times for incident patients on dialysis have been similar for hemodialysis and peritoneal dialysis. In 2012, the median waiting time to transplant for hemodialysis patients was 0.9 years and for peritoneal dialysis patients it was 1.01 years.
Kidney transplant waiting times vary by age and ESRD etiology. The median time for incident dialysis to transplant has consistently improved from 1996 to
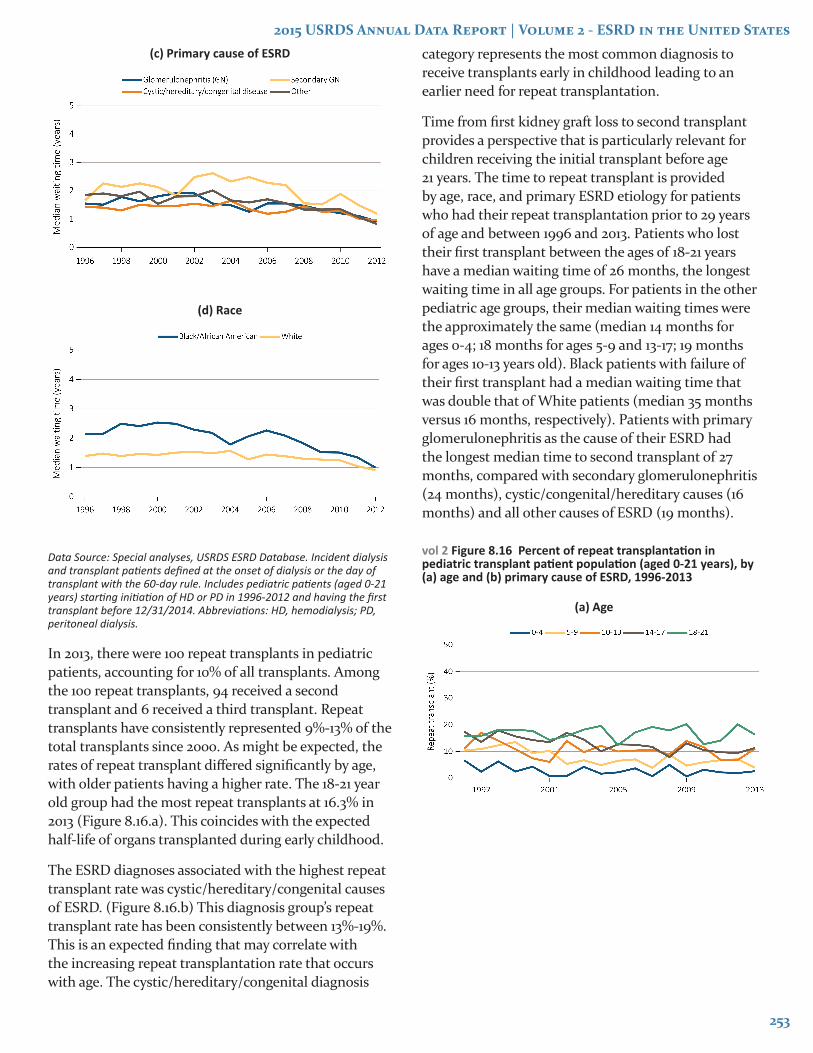
2012 in all age groups, with the exception of those 0-4 years old (Figure 8.15.b). Children 0-4 years have had stable waiting times, which likely reflect the surgical complexities in this age. Since 1996, patients ages 18-21 years old have shown the largest improvement with waiting times. Since 2009, children 0-4 years of age have the longest median waiting time, which was 1.36 years in 2012. Patients with secondary glomerulonephritis as the cause of their ESRD had the longest median waiting time to first transplant, with a median of 1.2 years in 2012 (Figure 8.15.c).
In 1996, White patients were on the wait list on average 50% shorter than Black patients awaiting a transplant (Figure 8.15.d). Since then, the average time on the transplant list has improved significantly for all patients and the gap between races has narrowed substantially so that median waiting times are now similar between groups (Whites 0.91 and Blacks 1.00 years).
vol 2 Figure 8.15 Median waiting time from incident hemodialysis (HD) or peritoneal dialysis (PD) to first transplant, by (a) modality, (b) age, (c) primary cause of ESRD, and (d) race, 1996-2012
(a) Modality
(b) Age
2015 USRDS Annual Data Report | Volume 2 - ESRD in the United States
253
(c) Primary cause of ESRD
(d) Race
Data Source: Special analyses, USRDS ESRD Database. Incident dialysis and transplant patients defined at the onset of dialysis or the day of transplant with the 60-day rule. Includes pediatric patients (aged 0-21 years) starting initiation of HD or PD in 1996-2012 and having the first transplant before 12/31/2014. Abbreviations: HD, hemodialysis; PD, peritoneal dialysis.
In 2013, there were 100 repeat transplants in pediatric patients, accounting for 10% of all transplants. Among the 100 repeat transplants, 94 received a second transplant and 6 received a third transplant. Repeat transplants have consistently represented 9%-13% of the total transplants since 2000. As might be expected, the rates of repeat transplant differed significantly by age, with older patients having a higher rate. The 18-21 year old group had the most repeat transplants at 16.3% in 2013 (Figure 8.16.a). This coincides with the expected half-life of organs transplanted during early childhood.
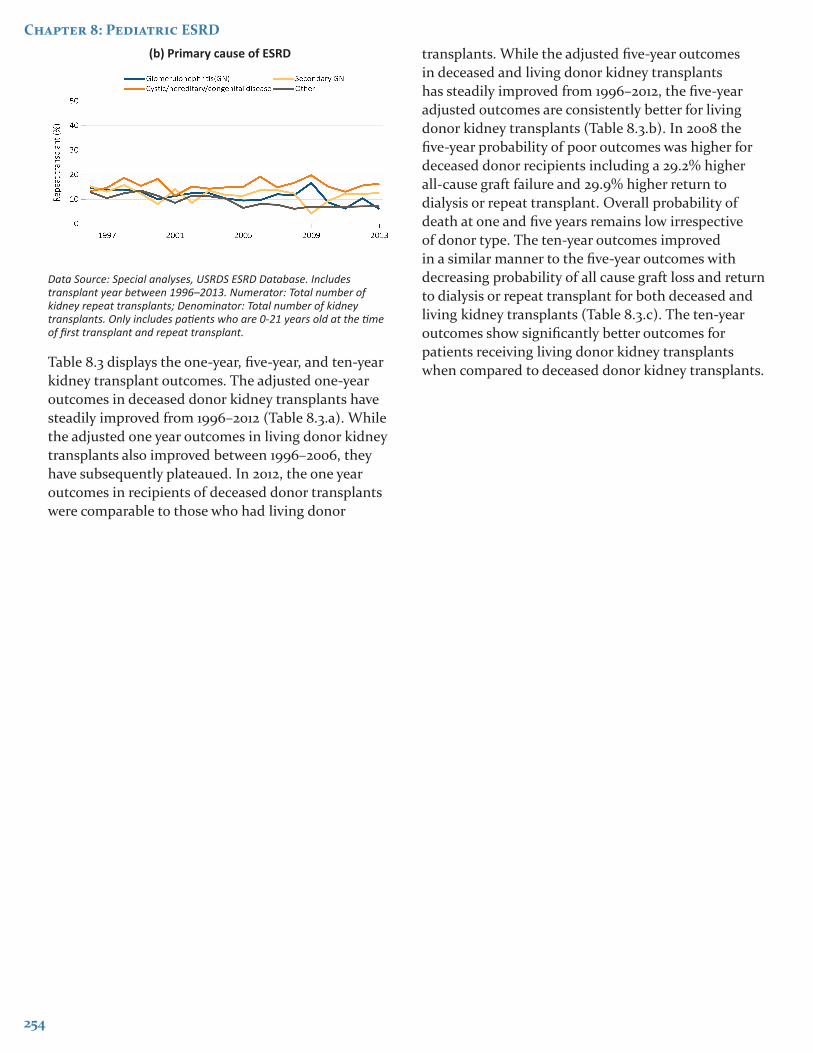
The ESRD diagnoses associated with the highest repeat transplant rate was cystic/hereditary/congenital causes of ESRD. (Figure 8.16.b) This diagnosis group’s repeat transplant rate has been consistently between 13%-19%. This is an expected finding that may correlate with the increasing repeat transplantation rate that occurs with age. The cystic/hereditary/congenital diagnosis
category represents the most common diagnosis to receive transplants early in childhood leading to an earlier need for repeat transplantation.
Time from first kidney graft loss to second transplant provides a perspective that is particularly relevant for children receiving the initial transplant before age 21 years. The time to repeat transplant is provided by age, race, and primary ESRD etiology for patients who had their repeat transplantation prior to 29 years of age and between 1996 and 2013. Patients who lost their first transplant between the ages of 18-21 years have a median waiting time of 26 months, the longest waiting time in all age groups. For patients in the other pediatric age groups, their median waiting times were the approximately the same (median 14 months for ages 0-4; 18 months for ages 5-9 and 13-17; 19 months for ages 10-13 years old). Black patients with failure of their first transplant had a median waiting time that was double that of White patients (median 35 months versus 16 months, respectively). Patients with primary glomerulonephritis as the cause of their ESRD had the longest median time to second transplant of 27 months, compared with secondary glomerulonephritis (24 months), cystic/congenital/hereditary causes (16 months) and all other causes of ESRD (19 months).
vol 2 Figure 8.16 Percent of repeat transplantation in pediatric transplant patient population (aged 0-21 years), by (a) age and (b) primary cause of ESRD, 1996-2013
(a) Age
254
Chapter 8: Pediatric ESRD(b) Primary cause of ESRD
Data Source: Special analyses, USRDS ESRD Database. Includes transplant year between 1996–2013. Numerator: Total number of kidney repeat transplants; Denominator: Total number of kidney transplants. Only includes patients who are 0-21 years old at the time of first transplant and repeat transplant.
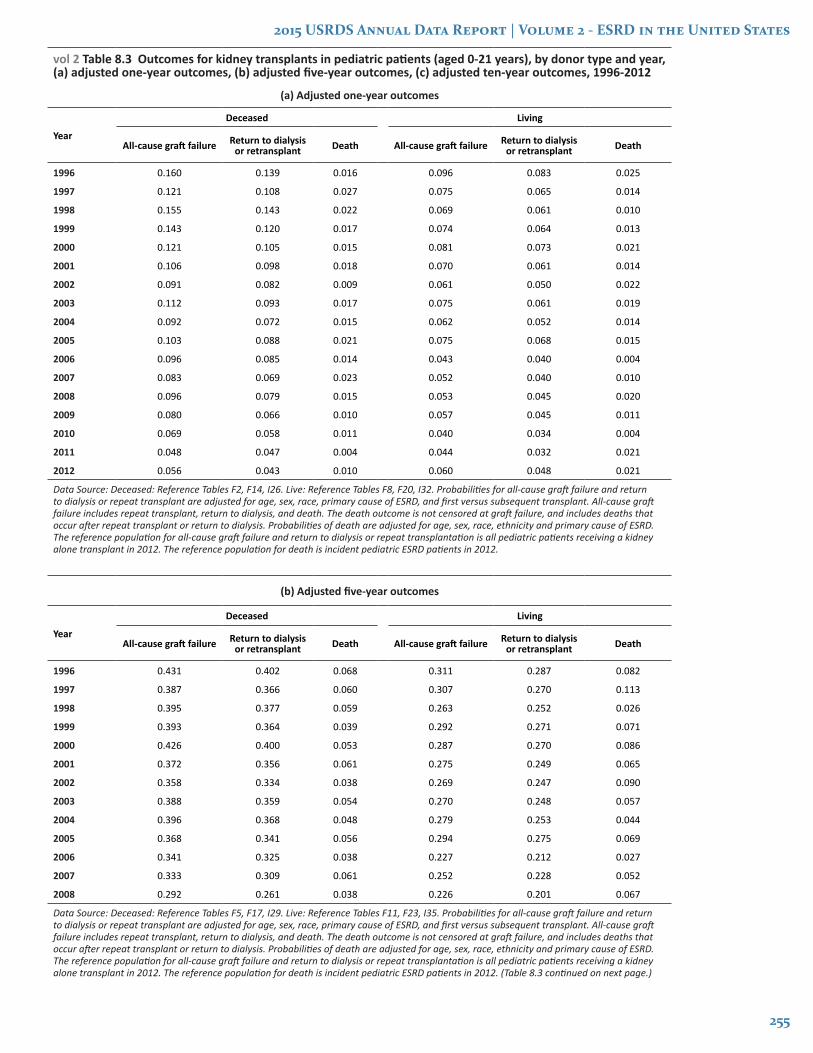
Table 8.3 displays the one-year, five-year, and ten-year kidney transplant outcomes. The adjusted one-year outcomes in deceased donor kidney transplants have steadily improved from 1996–2012 (Table 8.3.a). While the adjusted one year outcomes in living donor kidney transplants also improved between 1996–2006, they have subsequently plateaued. In 2012, the one year outcomes in recipients of deceased donor transplants were comparable to those who had living donor
transplants. While the adjusted five-year outcomes in deceased and living donor kidney transplants has steadily improved from 1996–2012, the five-year adjusted outcomes are consistently better for living donor kidney transplants (Table 8.3.b). In 2008 the five-year probability of poor outcomes was higher for deceased donor recipients including a 29.2% higher all-cause graft failure and 29.9% higher return to dialysis or repeat transplant. Overall probability of death at one and five years remains low irrespective of donor type. The ten-year outcomes improved in a similar manner to the five-year outcomes with decreasing probability of all cause graft loss and return to dialysis or repeat transplant for both deceased and living kidney transplants (Table 8.3.c). The ten-year outcomes show significantly better outcomes for patients receiving living donor kidney transplants when compared to deceased donor kidney transplants.
2015 USRDS Annual Data Report | Volume 2 - ESRD in the United States
255
vol 2 Table 8.3 Outcomes for kidney transplants in pediatric patients (aged 0-21 years), by donor type and year, (a) adjusted one-year outcomes, (b) adjusted five-year outcomes, (c) adjusted ten-year outcomes, 1996-2012
(a) Adjusted one-year outcomes
Year
Deceased Living
All-cause graft failure Return to dialysis or retransplant Death All-cause graft failure Return to dialysis
or retransplant Death
1996 0.160 0.139 0.016 0.096 0.083 0.025
1997 0.121 0.108 0.027 0.075 0.065 0.014
1998 0.155 0.143 0.022 0.069 0.061 0.010
1999 0.143 0.120 0.017 0.074 0.064 0.013
2000 0.121 0.105 0.015 0.081 0.073 0.021
2001 0.106 0.098 0.018 0.070 0.061 0.014
2002 0.091 0.082 0.009 0.061 0.050 0.022
2003 0.112 0.093 0.017 0.075 0.061 0.019
2004 0.092 0.072 0.015 0.062 0.052 0.014
2005 0.103 0.088 0.021 0.075 0.068 0.015
2006 0.096 0.085 0.014 0.043 0.040 0.004
2007 0.083 0.069 0.023 0.052 0.040 0.010
2008 0.096 0.079 0.015 0.053 0.045 0.020
2009 0.080 0.066 0.010 0.057 0.045 0.011
2010 0.069 0.058 0.011 0.040 0.034 0.004
2011 0.048 0.047 0.004 0.044 0.032 0.021
2012 0.056 0.043 0.010 0.060 0.048 0.021
Data Source: Deceased: Reference Tables F2, F14, I26. Live: Reference Tables F8, F20, I32. Probabilities for all-cause graft failure and return to dialysis or repeat transplant are adjusted for age, sex, race, primary cause of ESRD, and first versus subsequent transplant. All-cause graft failure includes repeat transplant, return to dialysis, and death. The death outcome is not censored at graft failure, and includes deaths that occur after repeat transplant or return to dialysis. Probabilities of death are adjusted for age, sex, race, ethnicity and primary cause of ESRD. The reference population for all-cause graft failure and return to dialysis or repeat transplantation is all pediatric patients receiving a kidney alone transplant in 2012. The reference population for death is incident pediatric ESRD patients in 2012.
(b) Adjusted five-year outcomes
Year
Deceased Living
All-cause graft failure Return to dialysis or retransplant Death All-cause graft failure Return to dialysis
or retransplant Death
1996 0.431 0.402 0.068 0.311 0.287 0.082
1997 0.387 0.366 0.060 0.307 0.270 0.113
1998 0.395 0.377 0.059 0.263 0.252 0.026
1999 0.393 0.364 0.039 0.292 0.271 0.071
2000 0.426 0.400 0.053 0.287 0.270 0.086
2001 0.372 0.356 0.061 0.275 0.249 0.065
2002 0.358 0.334 0.038 0.269 0.247 0.090
2003 0.388 0.359 0.054 0.270 0.248 0.057
2004 0.396 0.368 0.048 0.279 0.253 0.044
2005 0.368 0.341 0.056 0.294 0.275 0.069
2006 0.341 0.325 0.038 0.227 0.212 0.027
2007 0.333 0.309 0.061 0.252 0.228 0.052
2008 0.292 0.261 0.038 0.226 0.201 0.067
Data Source: Deceased: Reference Tables F5, F17, I29. Live: Reference Tables F11, F23, I35. Probabilities for all-cause graft failure and return to dialysis or repeat transplant are adjusted for age, sex, race, primary cause of ESRD, and first versus subsequent transplant. All-cause graft failure includes repeat transplant, return to dialysis, and death. The death outcome is not censored at graft failure, and includes deaths that occur after repeat transplant or return to dialysis. Probabilities of death are adjusted for age, sex, race, ethnicity and primary cause of ESRD. The reference population for all-cause graft failure and return to dialysis or repeat transplantation is all pediatric patients receiving a kidney alone transplant in 2012. The reference population for death is incident pediatric ESRD patients in 2012. (Table 8.3 continued on next page.)
256
Chapter 8: Pediatric ESRD
(c) Adjusted ten-year outcomes (Table 8.3 continued)
Year
Deceased Living
All-cause graft failure Return to dialysis or retransplant Death All-cause graft failure Return to dialysis
or retransplant Death
1996 0.646 0.615 0.126 0.500 0.475 0.147
1997 0.629 0.598 0.152 0.489 0.454 0.169
1998 0.588 0.571 0.110 0.490 0.464 0.104
1999 0.613 0.585 0.121 0.502 0.471 0.149
2000 0.613 0.579 0.116 0.503 0.467 0.173
2001 0.590 0.561 0.125 0.490 0.454 0.154
2002 0.529 0.499 0.071 0.425 0.401 0.157
2003 0.570 0.542 0.112 0.440 0.409 0.116
Data Source: Deceased: Reference Tables F6, F18, I30. Live: Reference Tables F12, F24, I36. Probabilities for all-cause graft failure and return to dialysis or repeat transplant are adjusted for age, sex, race, primary cause of ESRD, and first versus subsequent transplant. All-cause graft failure includes repeat transplant, return to dialysis, and death. The death outcome is not censored at graft failure, and includes deaths that occur after repeat transplant or return to dialysis. Probabilities of death are adjusted for age, sex, race, ethnicity and primary cause of ESRD. The reference population for all-cause graft failure and return to dialysis or repeat transplantation is all pediatric patients receiving a kidney alone transplant in 2012. The reference population for death is incident pediatric ESRD patients in 2012.
Young Adults
As a result of improvements in the care of pediatric patients with ESRD and kidney transplants, a larger percentage of these children are surviving into adulthood. The transition of these patients into adulthood represents a truly unique process and has resulted in the development of specific transition programs to improve health care for these individuals. For the first time in the USRDS Annual Data Report, we include a section in the pediatric chapter highlighting the young adult age group (defined in the USRDS as 22-29 years of age) that classically encompasses the transitional age groups. Despite their young age, cardiovascular disease remains the leading cause of mortality in this cohort, similar to older patients with ESRD. This section highlights the young adult population focusing on modality and the cardiovascular disease trends in this population.
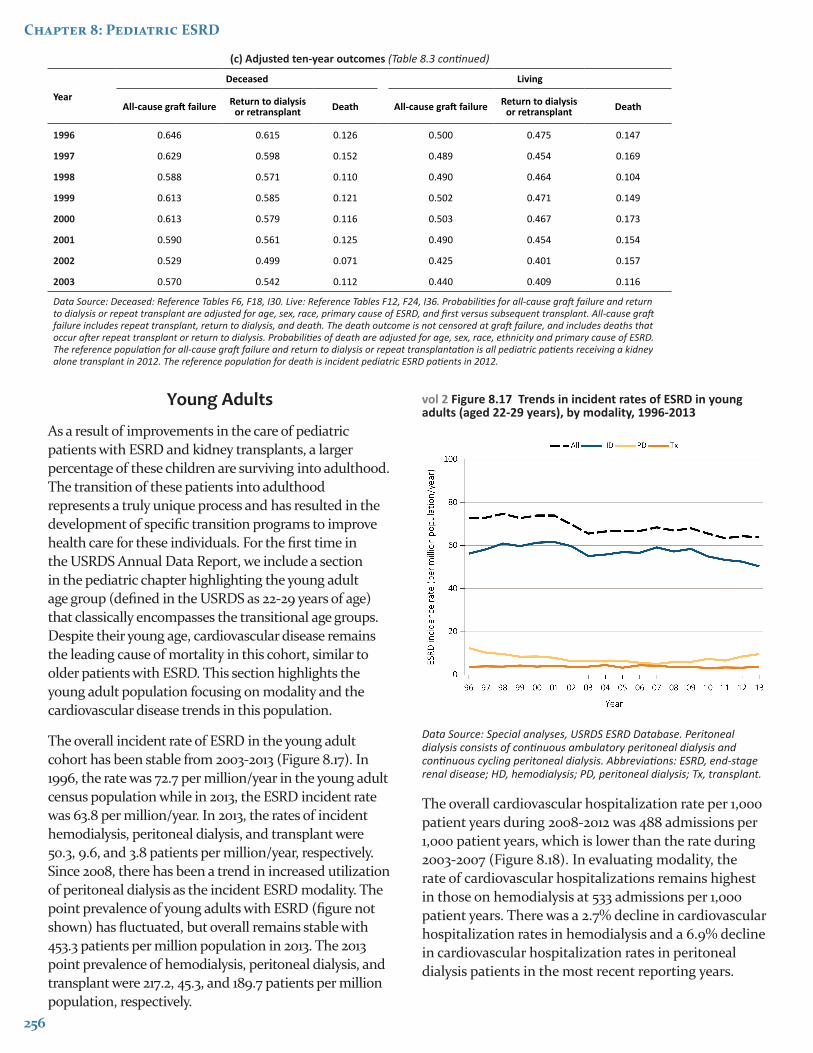
The overall incident rate of ESRD in the young adult cohort has been stable from 2003-2013 (Figure 8.17). In 1996, the rate was 72.7 per million/year in the young adult census population while in 2013, the ESRD incident rate was 63.8 per million/year. In 2013, the rates of incident hemodialysis, peritoneal dialysis, and transplant were 50.3, 9.6, and 3.8 patients per million/year, respectively. Since 2008, there has been a trend in increased utilization of peritoneal dialysis as the incident ESRD modality. The point prevalence of young adults with ESRD (figure not shown) has fluctuated, but overall remains stable with 453.3 patients per million population in 2013. The 2013 point prevalence of hemodialysis, peritoneal dialysis, and transplant were 217.2, 45.3, and 189.7 patients per million population, respectively.
vol 2 Figure 8.17 Trends in incident rates of ESRD in young adults (aged 22-29 years), by modality, 1996-2013
Data Source: Special analyses, USRDS ESRD Database. Peritoneal dialysis consists of continuous ambulatory peritoneal dialysis and continuous cycling peritoneal dialysis. Abbreviations: ESRD, end-stage renal disease; HD, hemodialysis; PD, peritoneal dialysis; Tx, transplant.
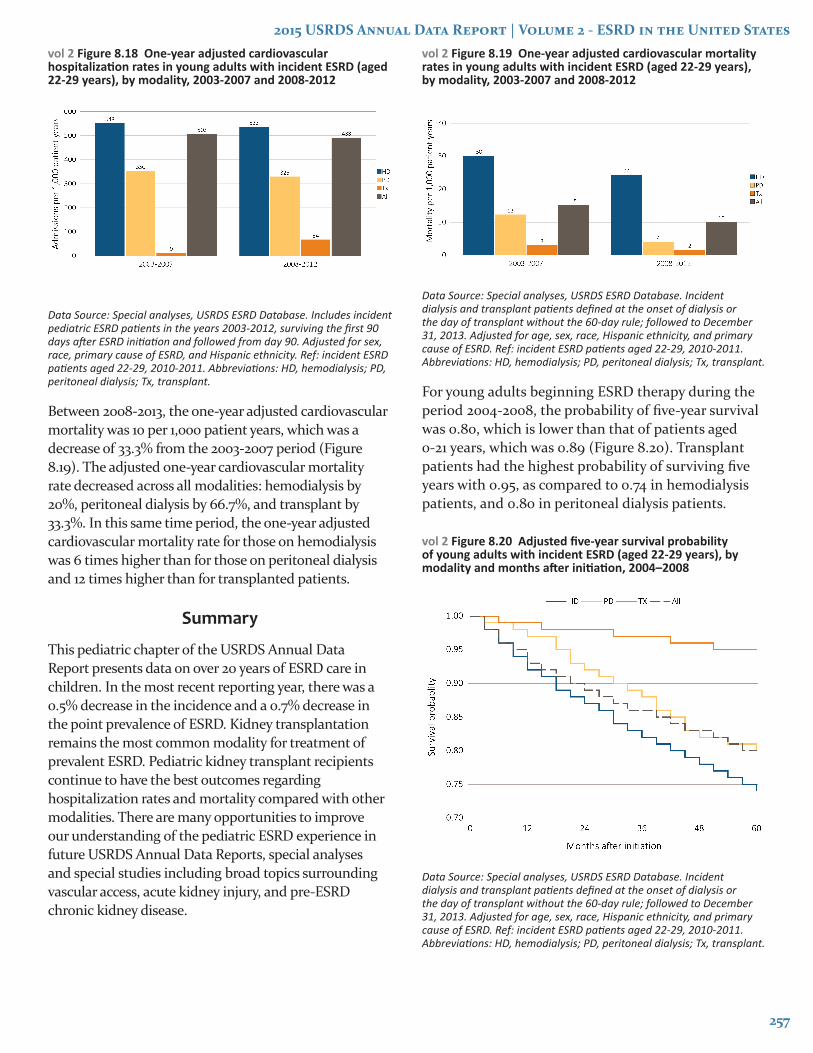
The overall cardiovascular hospitalization rate per 1,000 patient years during 2008-2012 was 488 admissions per 1,000 patient years, which is lower than the rate during 2003-2007 (Figure 8.18). In evaluating modality, the rate of cardiovascular hospitalizations remains highest in those on hemodialysis at 533 admissions per 1,000 patient years. There was a 2.7% decline in cardiovascular hospitalization rates in hemodialysis and a 6.9% decline in cardiovascular hospitalization rates in peritoneal dialysis patients in the most recent reporting years.
2015 USRDS Annual Data Report | Volume 2 - ESRD in the United States
257
vol 2 Figure 8.18 One-year adjusted cardiovascular hospitalization rates in young adults with incident ESRD (aged 22-29 years), by modality, 2003-2007 and 2008-2012
Data Source: Special analyses, USRDS ESRD Database. Includes incident pediatric ESRD patients in the years 2003-2012, surviving the first 90 days after ESRD initiation and followed from day 90. Adjusted for sex, race, primary cause of ESRD, and Hispanic ethnicity. Ref: incident ESRD patients aged 22-29, 2010-2011. Abbreviations: HD, hemodialysis; PD, peritoneal dialysis; Tx, transplant.
Between 2008-2013, the one-year adjusted cardiovascular mortality was 10 per 1,000 patient years, which was a decrease of 33.3% from the 2003-2007 period (Figure 8.19). The adjusted one-year cardiovascular mortality rate decreased across all modalities: hemodialysis by 20%, peritoneal dialysis by 66.7%, and transplant by 33.3%. In this same time period, the one-year adjusted cardiovascular mortality rate for those on hemodialysis was 6 times higher than for those on peritoneal dialysis and 12 times higher than for transplanted patients.
Summary
This pediatric chapter of the USRDS Annual Data Report presents data on over 20 years of ESRD care in children. In the most recent reporting year, there was a 0.5% decrease in the incidence and a 0.7% decrease in the point prevalence of ESRD. Kidney transplantation remains the most common modality for treatment of prevalent ESRD. Pediatric kidney transplant recipients continue to have the best outcomes regarding hospitalization rates and mortality compared with other modalities. There are many opportunities to improve our understanding of the pediatric ESRD experience in future USRDS Annual Data Reports, special analyses and special studies including broad topics surrounding vascular access, acute kidney injury, and pre-ESRD chronic kidney disease.
vol 2 Figure 8.19 One-year adjusted cardiovascular mortality rates in young adults with incident ESRD (aged 22-29 years), by modality, 2003-2007 and 2008-2012
Data Source: Special analyses, USRDS ESRD Database. Incident dialysis and transplant patients defined at the onset of dialysis or the day of transplant without the 60-day rule; followed to December 31, 2013. Adjusted for age, sex, race, Hispanic ethnicity, and primary cause of ESRD. Ref: incident ESRD patients aged 22-29, 2010-2011. Abbreviations: HD, hemodialysis; PD, peritoneal dialysis; Tx, transplant.
For young adults beginning ESRD therapy during the period 2004-2008, the probability of five-year survival was 0.80, which is lower than that of patients aged 0-21 years, which was 0.89 (Figure 8.20). Transplant patients had the highest probability of surviving five years with 0.95, as compared to 0.74 in hemodialysis patients, and 0.80 in peritoneal dialysis patients.
vol 2 Figure 8.20 Adjusted five-year survival probability of young adults with incident ESRD (aged 22-29 years), by modality and months after initiation, 2004–2008
Data Source: Special analyses, USRDS ESRD Database. Incident dialysis and transplant patients defined at the onset of dialysis or the day of transplant without the 60-day rule; followed to December 31, 2013. Adjusted for age, sex, race, Hispanic ethnicity, and primary cause of ESRD. Ref: incident ESRD patients aged 22-29, 2010-2011. Abbreviations: HD, hemodialysis; PD, peritoneal dialysis; Tx, transplant.

258
Chapter 8: Pediatric ESRD
Notes