chapter 6 hydrology and water balance studyopen_jicareport.jica.go.jp/pdf/11785375_02.pdf · the...
TRANSCRIPT
The Study on Capacity Development for Jeneberang River Basin Management
Nippon Koei Co., Ltd. 6-1 Final Report, Volume II CTI Engineering International Co., Ltd. Main Report
CHAPTER 6
HYDROLOGY AND WATER BALANCE STUDY
6.1 Meteorological Conditions in Jeneberang River Basin
The Jeneberang river basin experiences a tropical climate, showing high and rather constant air
temperature throughout the year but with a distinct variation in rainfall in the wet and dry seasons
during the year. The northwest monsoon prevails from December to June, while the southeast
monsoon extends from May to November. The northwest monsoon has a high moisture content,
which is precipitated on Mt. Bawakaraeng, Mt. Lompobatang and their adjacent mountain ranges
at the west edge of the river basin. As a result, the mountainous/hilly area in particular receives a
large volume of rainfall during the northwest monsoon period. On the other hand, the river basin
receives little rainfall during the east monsoon due to the sheltering effect by the mountain ranges.
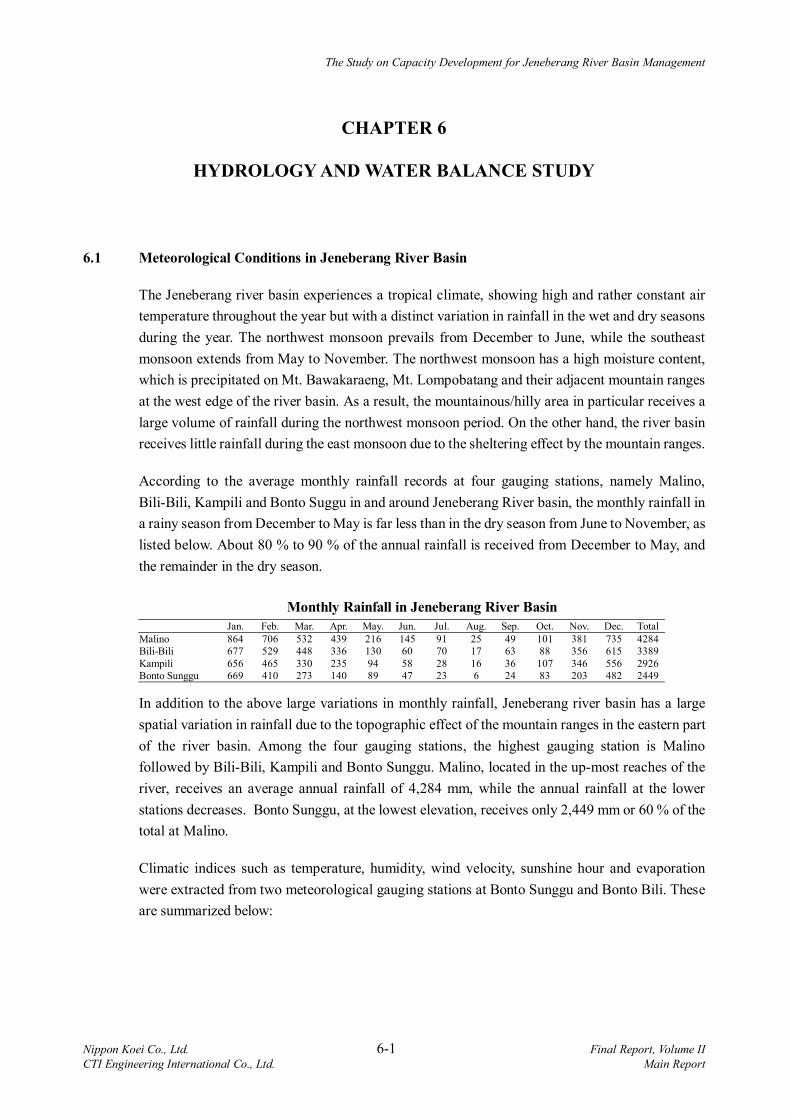
According to the average monthly rainfall records at four gauging stations, namely Malino,
Bili-Bili, Kampili and Bonto Suggu in and around Jeneberang River basin, the monthly rainfall in
a rainy season from December to May is far less than in the dry season from June to November, as
listed below. About 80 % to 90 % of the annual rainfall is received from December to May, and
the remainder in the dry season.
Monthly Rainfall in Jeneberang River Basin Jan. Feb. Mar. Apr. May. Jun. Jul. Aug. Sep. Oct. Nov. Dec. Total
Malino 864 706 532 439 216 145 91 25 49 101 381 735 4284 Bili-Bili 677 529 448 336 130 60 70 17 63 88 356 615 3389 Kampili 656 465 330 235 94 58 28 16 36 107 346 556 2926 Bonto Sunggu 669 410 273 140 89 47 23 6 24 83 203 482 2449
In addition to the above large variations in monthly rainfall, Jeneberang river basin has a large
spatial variation in rainfall due to the topographic effect of the mountain ranges in the eastern part
of the river basin. Among the four gauging stations, the highest gauging station is Malino
followed by Bili-Bili, Kampili and Bonto Sunggu. Malino, located in the up-most reaches of the
river, receives an average annual rainfall of 4,284 mm, while the annual rainfall at the lower
stations decreases. Bonto Sunggu, at the lowest elevation, receives only 2,449 mm or 60 % of the
total at Malino.
Climatic indices such as temperature, humidity, wind velocity, sunshine hour and evaporation
were extracted from two meteorological gauging stations at Bonto Sunggu and Bonto Bili. These
are summarized below:

The Study on Capacity Development for Jeneberang River Basin Management
Nippon Koei Co., Ltd. 6-2 Final Report, Volume II CTI Engineering International Co., Ltd. Main Report
Observed Parameter Bonto Sunggu
In Lower Reaches of Bili-Bili Dam
Bonto Bili Located adjacent to
Bili-Bili dam Mean Temperature (°C) Mean Max. Temperature (°C) Mean Min. Temperature (°C) Relative Humidity (%) Wind Velocity (m/s) Sunshine Hour (hr/day) Evaporation (mm/day)
27.5 31.4 22.4 85.0 0.9 7.0 5.3
23.6 25.9 21.3 81.0 1.3 4.0 4.3
The gauging station at Bonto Sunggu is located in the lower reaches below Bili-Bili dam. The
station at Bonto Bili is located adjacent to Bili-Bili dam, and therefore in the more mountainous
upper reaches. The particular characteristics of the above climatic indices are discussed below:
(1) Temperature
The average monthly temperatures at Bonto Sunggu show small fluctuations with a minimal
difference between the highest, about 28 oC in May and November, and the lowest of about 27oC
in August. On the other hand, Bonto Bili shows more fluctuation with a larger difference between
about 24.5 oC in December to May and 21.4 oC in August and September. Moreover, the annual
average temperature of 23.6 oC at Bonto Bili is much lower than that at Bonto Sunggu of 27.5 oC.
Thus, the temperature in the upper reaches tends to be lower with a greater monthly fluctuation
than in the lower reaches.
(2) Relative Humidity
Both climatic gauging stations show rather small monthly variations in relative humidity, with a
range from about 79 % to 88 %. There is also no distinct difference in the average annual humidity
between the two stations.
(3) Wind
Similar to the relative humidity, there is no distinct variation in the monthly wind velocities at
each of the two gauging stations. The annual average wind velocities between the two stations are
also small with a range of only 0.9 m/s to 1.2 m/s.
(4) Sunshine
Bonto Sunggu has rather larger monthly variations in one-day sunshine hours with a range from
4.4 hours/day in January (rainy season) to 9.2 hours/day in August (dry season). On the other hand,
Bonto Bili tends to show a more constant but shorter duration of sunshine hours with a range of
3.3 to 4.9 hours/day.

The Study on Capacity Development for Jeneberang River Basin Management
Nippon Koei Co., Ltd. 6-3 Final Report, Volume II CTI Engineering International Co., Ltd. Main Report
(5) Evaporation
Bonto Sunggu and Bonto Bili indicate average annual one-day evaporation of 5.3 mm/day (1,930
mm/year) and 4.3 mm/day (1,570 mm/year). Thus, the evaporation at Bonto Bili in the upper
reaches is lower, which could be attributed to the cooler temperature and shorter sunshine hours.
6.2 Rainfall Analysis
6.2.1 Objectives of Analysis and Basic Data
The analysis aimed at clarifying: (a) the variations in long-term rainfall and (b) magnitude of
probable storm rainfall in Jeneberang River Basin. Item (a) is used as the basic data to generate the
long-term basin runoff discharge through a simulation model as described in the following
Subsection 6.3. For item (b), the estimated value could be used as basic information for proposed
flood management.
Rainfall is currently gauged at three climatic gauging stations and thirty-two rainfall stations in
total in the Jeneberang river basin. These stations are under the administration of Meteorology
and Geophysics Agency (BMD), Provincial Water Resources Management (Dinas PSDA) and
JRBDP as listed below.
Meteorological and Rainfall Stations in Jeneberang River Basin
BMG Dinas PSDA JRBDP Total Climatic Gauging Station 1 2 - 3 Rainfall Station 5 (20) 7 (32)
Among the above existing gauging stations, the rainfall gauged at the following nine stations were
selected as the basic data for analysis of long-term average basin rainfall in due consideration of
their locations and the available data length.
(1) Malino (Old non-telemetry station used before 1997);
(2) Malino (New telemetry gauging station shifted from the above old station in 1998);
(3) Jonggoa;
(4) Bili-Bili (Old non-telemetry station installed adjacent to the existing Bili-Bili dam site in
1975);
(5) Bili-Bili (New telemetry gauging station installed at the intake of the Bili-Bili dam in 1998);
(6) Kampili (New telemetry gauging station installed in 1999);
(7) Maccini Sombala;
(8) Limbunga; and
(9) Mangempang.
The irrigation water requirement for three major irrigation areas of Bili-Bili, Bissua, and Kampili
irrigation areas in Jeneberang river basin had been estimated as part of the Bili-Bili Irrigation

The Study on Capacity Development for Jeneberang River Basin Management
Nippon Koei Co., Ltd. 6-4 Final Report, Volume II CTI Engineering International Co., Ltd. Main Report
Project in 1998. The basic rainfall data for the estimation were given from the following seven
gauging stations.
(1) Kampili (Old non-telemetry gauging stations in 1974):
(2) Bontosunggu;
(3) Mandalle;
(4) Kalabajeng;
(5) Bonto Sallang;
(6) Barembeng; and
(7) Sandro Bone.
The estimated irrigation water requirement is essential for water supply-demand balance
simulation, while the length of the estimation is limited to a period from 1972 to 1997. In this
connection, an attempt was made to estimate the irrigation water requirement for the
supplementary years from 1998 to 2001 using the rainfall records at the above seven gauging
stations.
Thus, the rainfall data used in this Study totaled sixteen gauging stations. An inventory list and
location map of these selected stations are shown in Table 6.1 and Figure 6.1, respectively.
6.2.2 Analysis on Long-term Rainfall
The rainfall data at the above gauging stations were collected and processed in the form of annual
rainfall tables. As a result, the average monthly rainfalls for a 30-year period from 1972 to 2003
are estimated as listed below (refer to Table 6.2 and Figure 6.2):
Average Monthly and Annual Rainfall
(Unit: mm) Gauging Station
Jan. Feb. Mar. Apr. May. Jun. Jul. Aug. Sep. Oct. Nov. Dec. Total Gauge Period
Malino 864 706 532 439 216 145 91 25 49 101 381 735 4,284 72 - 03Jonggoa 794 484 386 197 50 106 15 22 5 172 346 677 3,254 99 - 03Bili-Bili 677 529 448 336 130 60 70 17 63 88 356 615 3,389 72 - 03Kampili 656 465 330 235 94 58 28 16 36 107 346 556 2,926 72 - 03M. Sombala 797 561 295 132 42 44 4 0 13 54 184 587 2,712 99 - 03Limbunga 726 602 408 272 99 88 48 9 21 164 223 729 3,388 99 - 03Mangenpang 1057 854 511 330 157 102 38 4 32 197 546 1097 4,925 99 - 03B. Sunggu 669 410 273 140 89 47 23 6 24 83 203 482 2,449 78 - 02
As listed above, the Malino gauging station, which is located upstream from Bili-Bili dam
reservoir, recorded an average annual rainfall of more than 4,000 mm. Mangenpang in the upper
reaches of Jenelata river basin also recorded a similar range to the annual rainfall at Malino. In
contrast to these gauging stations, those in the lower reaches such as Kampili, Bontosunggu and
Maccini Sombala recorded far lower annual rainfalls in the range of 2,400 to 2,500 mm.
The variations in the average annual basin rainfalls from 1972 to 2003 were further estimated
through the Thiessen Polygon Method. As shown in Table 6.3, the annual rainfall at each of the
gauging stations tends to have a large variation year to year. The rainfall gauging station at Malino
in particular shows largest variations in annual rainfall, with a range of 2,344mm in 1972 to

The Study on Capacity Development for Jeneberang River Basin Management
Nippon Koei Co., Ltd. 6-5 Final Report, Volume II CTI Engineering International Co., Ltd. Main Report
7,230mm in 1989. Due to this, the variation of the annual basin mean rainfall also has a large
variation with a range of about 2,500mm to 5,300mm.
The seasonal distribution of rainfall is described by two (2) distinct seasons, dry from June to
November and wet from December to May. Heaviest months of rainfall are December and
January, while lightest rainfalls occur in August. More than 80% of the annual rainfall is
concentrated in the rainy season as listed below:
Rainfall in a Dry Season (Jun.-Nov.) Rainfall in Rainy Season (Dec.-May) Gauging Station Depth
(mm) Share to Annual Total
(%)Depth (mm)
Share to Annual Total (%)
Malino 792 18.5 3,492 81.51 Jonggoa 666 20.5 2,587 79.52 Bili-Bili 654 19.3 2,735 80.69 Kampili 589 20.1 2,337 79.86 Maccini Sombala 299 11.0 2,413 88.98 Limbunga 552 16.3 2,836 83.71 Mangenpang 919 18.7 4,006 81.34 Bonto Sunggu 386 15.8 2,064 84.25
Average 607 17.8 2,809 82.22
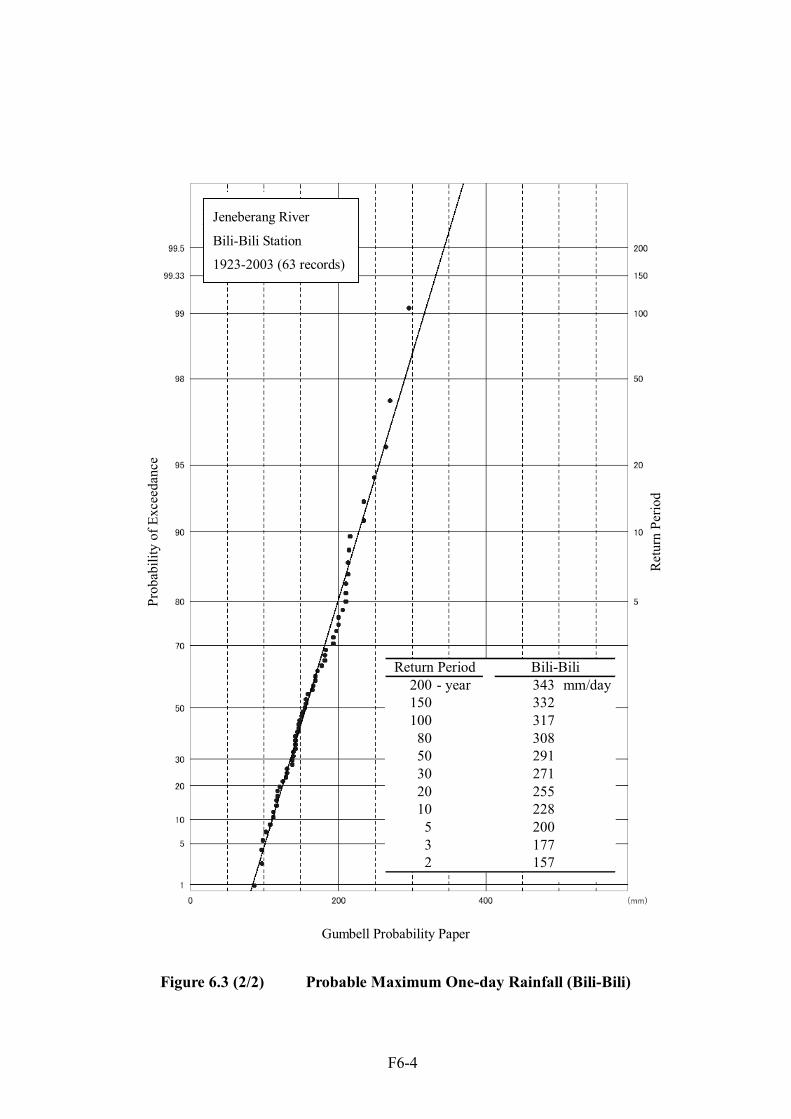
6.2.3 Analysis of Probable Storm Rainfall
The annual one-day maximum rainfalls gauged at the two key gauging stations, Malino and
Bili-Bili, were collected for a period from 1923 to 2003. As listed in Table 6.4, the annual maxim
one-day rainfall has a range from about 70 mm to the recorded maximum rainfall of 296mm.
Based on annual maximum rainfall data, probable one-day rainfall was estimated based on the
Gumbel Distribution Method as listed below (refer to Figure 6.3):
Probable One-day Rainfall
Return Period Malino Bili-Bili
100 -years 333 mm/day 317 mm/day
50 -years 303 mm/day 291 mm/day
20 -years 264 mm/day 255 mm/day
10 -years 234 mm/day 228 mm/day
5 -years 202 mm/day 200 mm/day
2 -years 154 mm/day 157 mm/day
6.3 Runoff Analysis
6.3.1 Objectives of Analysis and Basic Data
The runoff analysis aims at estimating the long-term basin runoff discharge, which is essential for
the water supply-demand balance simulation (refer to Subsection 6.3.2). The analysis was
concentrated on the following two sub-basins, which are the principal water sources in
Jeneberang: (a) upper reaches of Jeneberang River above Bili-Bili dam reservoir, and (b) the
whole of Jenelata river basin.

The Study on Capacity Development for Jeneberang River Basin Management
Nippon Koei Co., Ltd. 6-6 Final Report, Volume II CTI Engineering International Co., Ltd. Main Report
(1) Discharge Data Converted from Gauged Water Level
Before completion of Bili-Bili dam, the water level had been gauged at two key gauging stations.
One is Patarikan Gauging Station on Jeneberang River, which was located near the present
Bili-Bili dam site and the other was Patarikan Gauging Station on Jenelata River, located at the
existing Patarikan Bridge adjacent to the confluence with the mainstream of Jeneberang River.
The reliability of H-Q rating curves for the two gauging stations was verified through the Detailed
Design of Bili-Bili Irrigation Project. The river flow discharge converted from the water levels
gauged at these key gauging stations were therefore applied to the proposed water supply-balance
simulation.
After completion of Bili-Bili dam reservoir, however, the above two gauging stations were
abandoned, and instead, seven telemetry water level gauging stations were newly installed in
Jeneberang river basin, as shown in Figure 6.4. All H-Q rating curves at these new gauging
stations have never been updated since they were originally installed, as shown in Table 6.5. As a
result, the accuracy of the river flow discharge converted from the water level could not be
confirmed and it is difficult to apply the available river flow discharge as a basis for the
runoff-analysis.
Therefore, the available discharge data at the two gauging stations used for the water
supply-demand simulation were adopted for the following gauging periods:
Runoff discharge from Jeneberang river: From 1978 to 1990 gauged at Patarikan gauging
station on Jeneberang River;
Runoff Discharge from Jenelata River: From 1990 to 1997 gauged at Patarikan Station on
Jenelata River.
(2) Rainfall and Evaporation Data Used for Runoff Simulation
In order to generate the daily runoff discharge for the period not covered by the above available
water level gauging periods, a runoff simulation was undertaken based on the following rainfall
and evaporation data:
Rainfall Gauging Data: The rainfall gauging data applied included the sixteen rainfall
gauging stations as described in the Subsection 6.2.1.
Evaporation: The following monthly average evaporation gauged in Bontosunggu station
from 1972 to 1997:
Evaporation for Runoff Simulation
(Unit: mm/day)
Jan. Feb. Mar. Apr. May Jun. Jul. Aug. Sep. Oct. Nov. Dec.
4.3 4.2 4.7 5.1 4.9 4.7 5.1 6.1 6.9 6.7 5.6 4.9

The Study on Capacity Development for Jeneberang River Basin Management
Nippon Koei Co., Ltd. 6-7 Final Report, Volume II CTI Engineering International Co., Ltd. Main Report
6.3.2 Runoff Simulation Model
A runoff simulation was undertaken to generate long-term runoff discharge. The simulation was
based on the “Tank Model Method”, which has been widely practiced to simulate low flow
discharge. The model physically expresses the actual runoff mechanism, which is in nature
non-linear in relation to rainfall and has a function of rain infiltration into the surface or
sub-surface soils.
A serial three-staged tank was applied for the Tank Model in this Study. The model structure and
parameters are presented in Figure 6.5. The process of the simulation is in serial order from the
upper to the middle and lower tanks as presented below:
(1) Upper Tank
Ss1(t) = S11(t-1) + Fc x R (t-1) – Fe.Ev (t-1)
Sql(t) = Alf1 x [Ss1 (t) – Ha1] : upper side outlet
Sq2(t) = Alf2 x [Ss1 (t) – Ha2] : lower side outlet
Sq3(t) = Alf3 x Ss1 (t) : bottom outlet
S11(t) = Ss1(t) – [Sq1(t) + Sq2(t) + Sq3(t)]
(2) Middle Tank
Ss2(t) = S12(t-1) + Sq3 (t)
Sq4(t) = Bet1 x [Ss2 (t) – Hb] : side outlet
Sq5(t) = Bet2 x Ss2 (t) : bottom outlet
S12(t) = Ss2(t) – [Sq4(t) + Sq5(t)]
(3) Lower Tank
Ss3(t) = S13(t-1) + Sq5 (t)
Sq6(t) = Gam1 x [Ss3 (t) – Hg] : side outlet
Sq7(t) = Gam2 x Ss3 (t) : bottom outlet
S13(t) = Ss3(t) – [Sq6(t) + Sq7(t)]
(4) Runoff Discharge
Q (t) = Aa x [Sq1(t) + Sq2(t) + Sq4(t) + Sq6 (t)] / 86.4
Where,
Aa : Catchment area (km²)
Sq1 – Sq6 : Runoff from side outlet or infiltration through bottom outlet
(mm/day)
S11, S12, S13 : Storage depth of previous time in upper, middle and lower tanks
(mm)
Ss1, Ss2, Ss3 : Total storage depth in upper, middle and lower tanks (mm)
Ha1, Ha2 : Height of upper and lower side outlets in upper tank (mm)
Hb : Height of side outlet in middle tank (mm)
Hg : Height of side outlet in lower tank (mm)
Alf1, Alf2, Alf3 : Multiplying constant of upper tank
Bet1, Bet2 : Multiplying constant of middle tank
Gam1, Gam2 : Multiplying constant of lower tank
The Study on Capacity Development for Jeneberang River Basin Management
Nippon Koei Co., Ltd. 6-8 Final Report, Volume II CTI Engineering International Co., Ltd. Main Report
Fc : Effective rainfall ratio
Fe : Evaporation factor
Ev : Evaporation (mm/day)
R : Rainfall (mm/day).
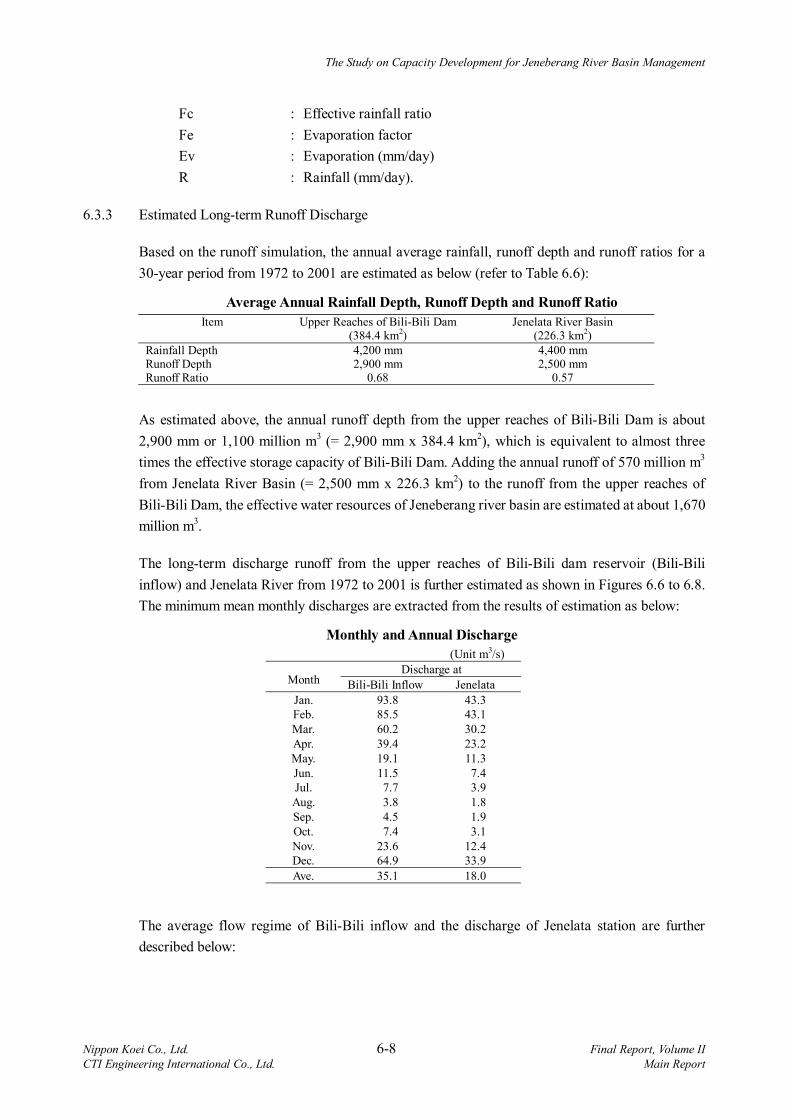
6.3.3 Estimated Long-term Runoff Discharge
Based on the runoff simulation, the annual average rainfall, runoff depth and runoff ratios for a
30-year period from 1972 to 2001 are estimated as below (refer to Table 6.6):
Average Annual Rainfall Depth, Runoff Depth and Runoff Ratio
Item Upper Reaches of Bili-Bili Dam (384.4 km2)
Jenelata River Basin (226.3 km2)
Rainfall Depth 4,200 mm 4,400 mm Runoff Depth 2,900 mm 2,500 mm Runoff Ratio 0.68 0.57
As estimated above, the annual runoff depth from the upper reaches of Bili-Bili Dam is about
2,900 mm or 1,100 million m3 (= 2,900 mm x 384.4 km2), which is equivalent to almost three
times the effective storage capacity of Bili-Bili Dam. Adding the annual runoff of 570 million m3
from Jenelata River Basin (= 2,500 mm x 226.3 km2) to the runoff from the upper reaches of
Bili-Bili Dam, the effective water resources of Jeneberang river basin are estimated at about 1,670
million m3.
The long-term discharge runoff from the upper reaches of Bili-Bili dam reservoir (Bili-Bili
inflow) and Jenelata River from 1972 to 2001 is further estimated as shown in Figures 6.6 to 6.8.
The minimum mean monthly discharges are extracted from the results of estimation as below:
Monthly and Annual Discharge
(Unit m3/s)
Discharge at Month Bili-Bili Inflow Jenelata
Jan. 93.8 43.3 Feb. 85.5 43.1 Mar. 60.2 30.2 Apr. 39.4 23.2 May. 19.1 11.3 Jun. 11.5 7.4 Jul. 7.7 3.9 Aug. 3.8 1.8 Sep. 4.5 1.9 Oct. 7.4 3.1 Nov. 23.6 12.4 Dec. 64.9 33.9
Ave. 35.1 18.0
The average flow regime of Bili-Bili inflow and the discharge of Jenelata station are further
described below:

The Study on Capacity Development for Jeneberang River Basin Management
Nippon Koei Co., Ltd. 6-9 Final Report, Volume II CTI Engineering International Co., Ltd. Main Report
Average Flow Regime
Item Bili-Bili Inflow Jenelata 95-day discharge 47.5 m3/s 26.3 m3/s, 185-day discharge 14.7 m3/s 8.0 m3/s, 275-day discharge 4.8 m3/s 2.2 m3/s 355-day discharge 2.3 m3/s 0.8 m3/s
6.4 Water Balance Simulation
The simulation was made to clarify the balance between the available water supply volume from
and the water demand to the source of Jeneberang River. The available water supply is classified
into: (a) the regulated outflow discharge from Bili-Bili dam reservoir, (b) the non-regulated runoff
discharge from Jenelata River, and (c) the non-regulated runoff discharge from other residual
areas. Among others, the regulated outflow discharge of item (a) is estimated from the aforesaid
simulated long-term inflow discharge to Bili-Bili dam reservoir and the flow regulation effect by
the dam reservoir. On the other hand, the long-term runoff discharge from Jenelata river basin
could be directly assumed as the value of item (b). For the runoff discharge from other residual
area (item (c)), this was assumed to be the average of the simulated runoff discharge from the
upper reaches of Bili-Bili dam (item (a)) and from Jenelata river basin (item (b)).
The water demand to the source of Jeneberang River includes the municipal water demand,
irrigation water demand, private factory water demand and the requirement for river maintenance
flow. The water balance simulation was made on the premise of present and future incremental
water demands. The future water demand is assumed on the premise of the increment of only
municipal water demand. Details of these water requirements are as described in Subsection 6.4.2.
6.4.1 Water Demand
The water demand is classified into irrigation water demand, municipal water demand, and others.
The details of each of these demands are described below:
(1) Irrigation Water Demand
The water demand for irrigation use is exclusively for three irrigation schemes of Bili-Bili, Bissua
and Kampili, which are being developed under the on-going Bili-Bili Irrigation Project (refer to
Chapter 4). The demand could be expressed as the “Net Field Requirement” and was estimated by
the following formula:
(Net Field Requirement) = (Crop Requirement) – (Effective Rainfall for Cropping)
The diversion requirement from the river for the above Net Field Requirement is further estimated
by the following formula:
(Diversion Requirement) = (Net Field Requirement) x (Irrigation Efficiency)
(Irrigation Efficiency) = 1 / (L1 x L2 x L3)

The Study on Capacity Development for Jeneberang River Basin Management
Nippon Koei Co., Ltd. 6-10 Final Report, Volume II CTI Engineering International Co., Ltd. Main Report
where:
L1: Irrigation loss of main irrigation canal (assumed at 0.90)
L2: Irrigation loss of secondary irrigation canal (assumed at 0.90)
L2: Irrigation loss of tertiary irrigation canal (assumed at 0.85)
As presented above, the irrigation water demand varies year by year depending on the effective
rainfall of each year. In this connection, the half-month water demand in each of the 26 years from
1972 to 1997 had been estimated by the Bili-Bili Irrigation Project on the basis of 100% cropping
intensity for both wet and dry season paddy and 40% for palawija (refer to “Design Note on
Bili-Bili Irrigation Project”). In addition to the estimated value, the water demands in each of four
years from 1998 to 2001 were further estimated in this Study on the same basis.
In the above estimation, the effective rainfall was assumed as 70 % of the half-month rainfalls.
The half-month rainfalls from 1972 to 2001 were calculated as the average of the gauged data at
seven gauging stations as mentioned in Sub-section 6.2.1 (i.e., Kampili, Bontosunggu, Mandalle,
Kalabajeng, Bontosallang, Barembeng and Sandrobone) (refer to Table 6.7).
Based on the results of the estimation, the water requirement to Jeneberang River for each year
from 1972 to 2001 was estimated as shown in Figure 6.9 and summarized as listed below:
Average Monthly Crop Requirement and Net Field Requirement
Crop Requirement Net Field Requirement Month
liter/s/ha 106m3 liter/s/ha 106m3
Jan 0.96 61.28 0.13 8.22 Feb 0.94 55.89 0.15 8.88 Mar 0.81 51.66 0.19 12.06 Apr 0.81 49.89 0.35 21.47 May 1.03 65.27 0.80 50.76 Jun 0.94 57.76 0.84 51.44 Jul 0.78 49.67 0.71 44.75 Aug 0.39 24.37 0.34 21.45 Sep 0.20 12.56 0.17 10.38 Oct 0.20 12.51 0.14 8.86 Nov 0.12 7.27 0.02 1.36 Dec 0.49 31.33 0.05 3.20
Annual 479.45 242.83
As listed above, the crop requirement shows two peaks in January and May. The peak in January
is, however, in a rainy season and could be substantially covered by the effective rainfall. On the
other hand, the other peak in May is in the dry season and, therefore, most of the water
requirement needs to be supplied from Jeneberang River. As a result, the peak net field
requirement occurs in May to June.
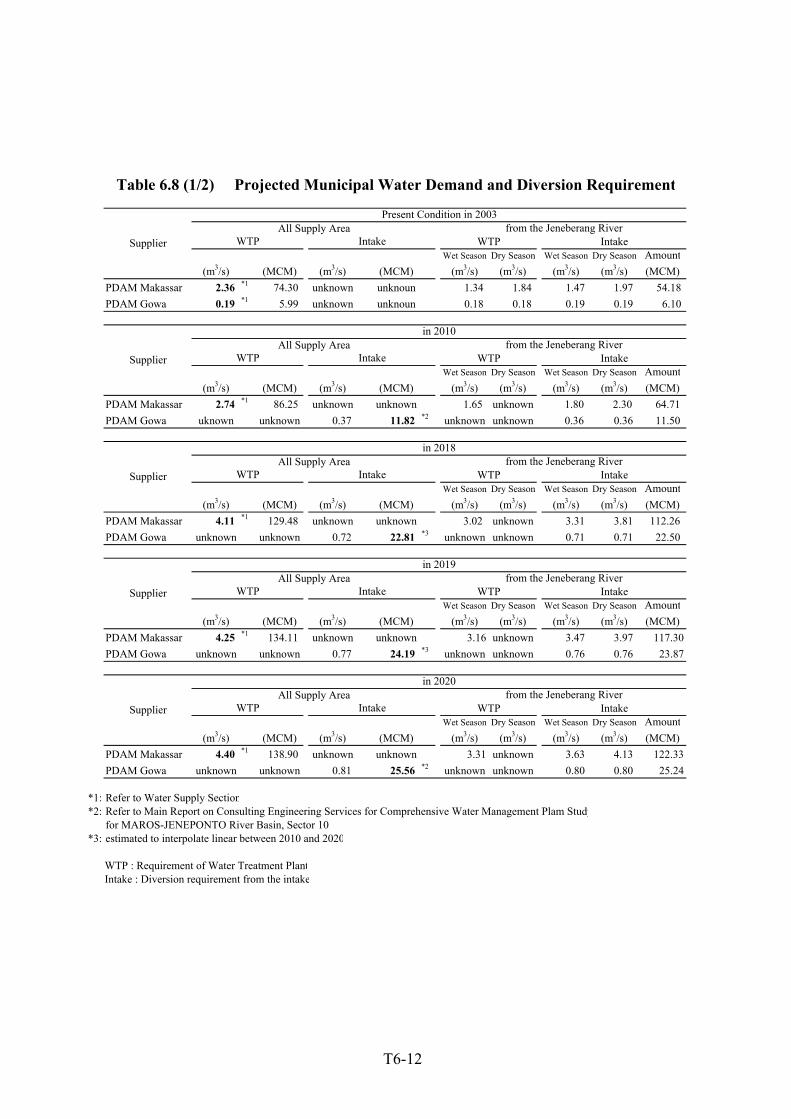
(2) Municipal Water Demand
The following present and future municipal water demands to Jeneberang River are estimated
through clarification and assumptions in items (a) and (b) outlined below (refer to Table 6.8).

The Study on Capacity Development for Jeneberang River Basin Management
Nippon Koei Co., Ltd. 6-11 Final Report, Volume II CTI Engineering International Co., Ltd. Main Report
Present and Future Municipal Water to the Source of Jeneberang River Wet Season Dry Season Annual
Year m3/s m3/s 106m3/year
Present (2004) 1.66 2.16 60.3 2018 4.02 4.52 134.8 2019 4.23 4.73 141.2 2020 4.43 4.93 147.6
(a) Present Water Demand
The actual outputs of the existing water treatment plants (WTP) for Jeneberang River in
year 2003 were clarified in Chapter 5, and were assumed as the present potential municipal
water demand. The actual water demand to Jeneberang River was further estimated on the
premise of the following conveyance losses from the river to WTPs: 10 % for Somba Opu
and Borong Loe WTP and 5 % for other existing WTPs.
(b) Future Water Demand
The future municipal water demand for PDAM Makassar was clarified in Chapter 5 and
was assumed as the future water demand to the source of Jeneberang. In addition, the future
water demand for PDAM Gowa was estimated as part of the future municipal water demand
with reference to the projection in “Consulting Engineering Services for Comprehensive
Water Management Plan Study for Maros-Jeneponto River Basin, Nov. 2001”.
The treatment capacity of WTP was further assumed to increase to meet the future
incremental water demand on the premise of the following conditions:
(a) All existing WTPs would recover to their designed full treatment capacity levels.
(b) The water requirement of Somba Opu WTP would increase from 1.1 m3/s to 3.3 m3/s1,
which corresponds to the present capacity of the raw water transmission line from
Bili-Bili dam reservoir to the WTP;
(c) New WTPs would be constructed to meet part of the future incremental water demand,
which could not be covered by the above two items.
(3) Other Water Demand
The following water demands are regarded as customary water use rights to be promised by
supply from Bili-Bili dam reservoir and incorporated into the water supply-demand simulation:
(a) 0.5 m3/s for water demand of Sugar Factory in Takalar District (refer to Chapter 5); and
(b) 1.0 m3/s for river maintenance flow along the downstream reaches of Jeneberang River
below Sungguminasa Bridge (as programmed under the present reservoir operation
rule of Bili-Bili Dam).
1 Alternatively, water will be partly sent to Panaikang WTP, being branched off from water transmission main

The Study on Capacity Development for Jeneberang River Basin Management
Nippon Koei Co., Ltd. 6-12 Final Report, Volume II CTI Engineering International Co., Ltd. Main Report
6.4.2 Result of Water Supply-Demand Balance Simulation
The results of the water balance simulation for the present water demand are as shown in Table 6.9
and Figure 6.10. As shown in this Table and Figure, among the simulated 30-year period from
1972 to 2001, three years in 1972, 1982 and 1997 are identified as drought years. During these
years Bili-Bili dam reservoir dropped to its Lowest Water Level (EL. 65.0 m) with no available
water supply capacity to meet the present water demand. Thus, the drought years could occur with
a frequency of once every ten years (= 3 years as an identified drought year divided by 30 years of
the simulation period). It was therefore concluded that the present supply capacity of Bili-Bili
dam could satisfy present water demand against a 10-year drought.
The water balance simulation was further made on the premise of the future incremental
municipal water demand. Based on the results of the simulation, the following years were
identified as droughts years (i.e., when Bili-Bili dam reservoir could not satisfy the allocated
water demand):
Drought Years against Water Demand (in Consideration of Growth of Municipal Demand)
Year of Demand Projection
Drought year Number of
Drought Years
Frequency of
Drought Years Present (2003) 1972, 82, 97 3/30 1/10 years 2018 1972, 76, 82, 87, 92, 97 6/30 1/5 years 2019 1972, 76, 82, 83, 87, 91, 92, 97 8/30 1/3.8 years 2020 1972, 76, 82, 83, 87, 91, 92, 97 8/30 1/3.8 years
As estimated above, the frequency of occurrence of drought year would increase from 1 in 10
years at present to 1 in 5 years in 2018 and 1 in 3.8 years in 2019.
The irrigation water demand takes a dominant share of the whole water demand and, therefore, is
a decisive factor in the failure to meet demands during drought years. The typical influence of
irrigation water demand on occurrence of drought is seen in a three-month period from April to
June. The three-month period is regarded as the critical duration such that the period is at the
beginning of the dry season and, at the same time, the crop water requirements start to increase
significantly during this period. The drought years tend to occur when the rainfall during this
critical period is far less than those in ‘normal’ years as below (refer to Table 6.10):
(a) The drought years of 1972, 1982 and 1997 received rainfall of less than 110mm during the
critical three-month period, which is far less than the average of 273 mm from 1972 to 2001
during those same months;
(b) On the other hand, the years of 1985, 1990 and 1993 received an annual rainfall of less than
2,000m, which is rather small value when compared to the average of 2,434 mm from 1972 to
2001. However, these years received a relatively large rainfall during the critical three-month
period from April to June, and therefore did not cause droughts.
The year of 1976 is identified as the marginal non-drought year, during which full supply of the
net field requirement of 381.70m3/year is just met by the supply capacity of Bili-Bili dam
reservoir on the premise that the dam reservoir also needs to meet the full supply for municipal

The Study on Capacity Development for Jeneberang River Basin Management
Nippon Koei Co., Ltd. 6-13 Final Report, Volume II CTI Engineering International Co., Ltd. Main Report
water and other all allocated water demands. Accordingly, the following diversion requirement
for irrigation use in 1976 could be regarded as the marginal limit to be met by the supply capacity
of Bili-Bili dam. This marginal limit of 381.70 million m3 corresponds to about 1.6 times the
average net field requirement from 1972 to 1983 (i.e., 242.83 million m3).
Diversion Requirement for Irrigation in the Standard Drought Year of 1976
Month Bili-Bili Irrigation
Scheme Bissua Irrigation
Scheme Kampili Irrigation
Scheme Total
Jan 2.35 10.72 10.49 23.56 Feb 0.00 0.00 0.00 0.00 Mar 0.00 0.00 0.00 0.00 Apr 5.71 26.11 25.53 57.36 May 7.92 36.17 35.37 79.46 Jun 7.64 34.94 34.16 76.74 Jul 7.21 32.93 32.20 72.33 Aug 3.64 16.63 16.26 36.53 Sep 1.96 8.95 8.75 19.66 Oct 1.22 5.56 5.43 12.21 Nov 0.00 0.00 0.00 0.00 Dec 0.38 1.76 1.72 3.86
Annual 38.03 173.77 169.91 381.70
6.5 Improvement Plan of Hydrological Gauging Network
The improvement plan for the hydrological gauging network was initially proposed to facilitate
river basin management, including low flow and flood management as described in the following
subsections.
6.5.1 Proposed Telemetry Rainfall Gauging Network
JRBDP currently gauge rainfall on a real-time basis through seven telemetry rainfall gauging
station in order to facilitate effective gate operations for Bili-Bili dam, the rubber dam and other
various river structures. Dinas PSDA also gauges daily rainfall through information from gauge
keepers assigned to twenty non-telemetry gauging stations in order to facilitate the water
management for irrigation. Moreover, BMG has six climatic gauging stations in Jeneberang river
basin, of which five are now operational with one being temporarily suspended due to trouble
with gauging equipment. Thus, there exist 33 rainfall-gauging stations in Jeneberang river basin,
but locations are mostly biased to the lower reaches below Bili-Bili dam, as shown in Figure 6.11.
Among these, the telemetry gauging stations in particular are useful for real-time flood
management as well as for low flow management. The density of the telemetry-gauging stations
is 109km2/station (=seven stations/catchment area of 762km2), which satisfies the minimum
density of 100 to 250 km2/station recommended by the World Meteorological Organization
(WMO).
However, there are some hydrological blind areas in Jeneberang river basin, and telemetry
gauging stations are provisionally proposed to remove these areas (refer to Figure 6.12).

The Study on Capacity Development for Jeneberang River Basin Management
Nippon Koei Co., Ltd. 6-14 Final Report, Volume II CTI Engineering International Co., Ltd. Main Report
(a) Upper most area of Jeneberang River: The existing two non-telemetry gauging stations at
Tanralili and Bungabaji operated by Dinas PSDA should be provided with telemetry
equipment. Another new telemetry gauging station is also proposed at Lengkese, which is
located just downstream of the huge sediment deposit produced from the collapse of Mt.
Bawakaraeng.
(b) Upper reaches of Jene Rakikang River: One new gauging station is proposed at Patuku
Village.
(c) Upstream of Jeneberang River between Bili-Bili dam reservoir and the existing Jonggoa
station; Telemetry rainfall equipment should be installed at the existing telemetry water level
gauging station at Bonto Jai.
(d) Upstream of Binanga Tokka; One new gauging station is proposed at Parang-Parang.
An open space with a diameter of around 10m should preferably be selected as being suitable as a
rainfall gauging site. It will also be necessary to avoid narrow passes in topography, where the
deviations in wind direction and velocity would cause difficulties in accurately gauging the
rainfall. It is also necessary to consider accessibility of the gauging site and to avoid the risk of
flood inundation.
6.5.2 Proposed Telemetry Water Level Gauging Network
JRBDP currently gauge the water level of Jeneberang River as well as its tributaries on a real-time
base through seven water level gauging stations. The gauged data are useful for low flow and
flood management including the gate operations of Bili-Bili dam and other various river
structures.
The present water level gauging stations are well distributed to observe all critical river flow
discharges. The gauging station at Bonto Jai on the mainstream of Jeneberang, in particular, is
important to observe the inflow discharge into Bili-Bili dam reservoir. The Jenelata Station
installed at the Patarikan Bridge is also important to observe the natural flow discharge from
Jenelata River. Accordingly, it would not be necessary to expand the existing telemetry gauging
network.
However, Bayang water level gauging station at the estuary of Jeneberang River has been not
operational, as the gauging equipment was stolen in 2002. This gauging station is useful to
observe the salinity intrusion into the river, and therefore, it is important to resume gauging
operations at the earliest opportunity.
Relocation of the gauging site would be also required for Bonto Jai water level gauging station.
The present location of the gauging station is just downstream of the existing Sand Pocket No.1,
where stable river flow is unlikely and the riverbed tends to fluctuate readily. From these
viewpoints, it is preferable to transfer the location of this gauging site to a location above the sand
pocket dam, where the flow channel is fixed and more accurate flow discharge could be estimated
from the gauged water level.

The Study on Capacity Development for Jeneberang River Basin Management
Nippon Koei Co., Ltd. 6-15 Final Report, Volume II CTI Engineering International Co., Ltd. Main Report
In addition to the necessary rehabilitation and relocation of the existing telemetry gauging stations
discussed above, another crucial issue is the renewal of H-Q rating curves derived for the existing
water level gauging stations.
Among the existing seven water level gauging stations, four stations, namely Jonggoa, Bonto Jai,
Kampili and Jenelata station have H-Q rating curves. However, these have never been updated
after their original development in 1999. The riverbeds tend to fluctuate particularly after a flood,
which seriously affects the accuracy of the rating curves. In fact, extensive riverbed fluctuation
has been confirmed after the collapse of Mt. Bawakaraeng in March 2004, and it is indispensable
that existing H-Q rating curves be updated at the same time. This should also be followed on an
ongoing basis by the establishment of a new system of rating curves at the end of the every rainy
season and/or immediately after the occurrence of large floods.

Longitude (E) Latitude (S)- Kalabajen 119 26'00" 5 19'00" 1975 Mnual Dinas *1- Mandalle/Patarungan 119 24'00" 5 18'00" 1975 Mnual Dinas *1- Sandro Bone 119 22'00" 5 26'00" 1975 Mnual Dinas *1- Bontosunggu 119 25'30" 5 16'44" 1977 Automatic Dinas *1 Climetological Station- Bonto Sallang 119 24'51" 5 19'51" 1975 Mnual Dinas *1- Barembeng 119 24'36" 5 20'01" 1975 Mnual Dinas *1
** Malino 119 51'14.6" 5 15'11.5" 1971 Mnual Dinas *2** Malino 119 51'12" 5 15'10" 1998 Telemetring JRDBP *2** Jonggoa 119 44'37" 5 16'26" 1998 Telemetring JRDBP *2** Limbunga 119 44'05" 5 21'48" 1998 Telemetring JRDBP *2** Mangempang 119 40'50" 5 20'07" 1998 Telemetring JRDBP *2** Intake Bili-Bili 119 34'27" 5 17'20" 1975 Mnual Dinas *2** Bili-Bili 119 35'08" 5 16'46" 1998 Telemetring JRDBP *2** Kampili 119 30'40" 5 16'51" 1974 Manual Dinas *1, *2 ** Kampili 119 34'02" 5 17'13" 1998 Telemetring JRDBP *1, *2 ** Macini Sombala 119 24'50" 5 11'41" 1998 Telemetring JRDBP *2
** : in the Jeneberang river basin*1 : utilizede for calculation of Irrigation Water Requirement*2 : utilizede for Runoff calculation by Tank model
T6-1
Table 6.1 Climetological and Rainfall station Collected Data in this Study
AdministrationYear
InstalledType RemarksStation Name
LocationPurpose

Unit : mmYear Jan. Feb. Mar. Apr. May. Jun. Jul. Aug. Sep. Oct. Nov. Dec. Total1972 1624 566 273 221 63 0 0 0 0 0 352 342 34411973 532 315 491 311 292 88 243 110 241 26 730 591 39701974 375 700 1393 313 265 116 181 11 161 527 348 795 51851975 621 621 558 570 275 205 63 64 23 194 472 615 42811976 831 784 912 238 196 46 5 5 0 269 187 495 39681977 900 1476 663 475 195 324 0 17 0 0 241 684 49751978 765 655 378 371 236 237 282 111 154 156 446 987 47781979 771 589 821 287 278 134 26 0 4 70 170 671 38211980 969 1480 1075 868 488 129 32 12 0 252 610 1124 70391981 1026 678 417 498 267 184 253 3 231 46 744 1231 55781982 1114 690 818 954 190 111 1 0 2 2 113 419 44141983 684 552 274 606 542 332 60 18 1 49 613 207 39381984 830 770 694 794 474 220 68 48 232 218 314 1062 57241985 667 486 660 595 411 199 277 0 59 105 566 460 44851986 1453 415 262 416 68 113 174 42 1 134 298 436 38121987 1376 952 373 264 100 11 0 0 0 6 436 1327 48451988 677 1726 622 167 218 52 56 64 75 103 718 2005 64831989 2015 1234 702 1133 466 604 140 105 46 89 197 499 72301990 648 363 404 209 140 92 120 2 0 0 168 549 26951991 1207 584 135 525 86 27 12 3 0 6 343 450 33781992 579 374 328 252 94 103 94 11 46 108 86 269 23441993 1039 608 877 558 176 203 14 0 36 13 357 1104 49851994 575 378 583 373 249 11 3 8 0 66 172 439 28571995 948 475 619 643 169 429 62 7 41 120 986 1110 56091996 871 767 481 351 119 59 127 141 78 310 359 1638 53011997 1028 1244 937 473 23 20 68 0 0 0 0 433 42261998 338 276 474 284 138 142 249 54 124 210 413 677 33791999 786 829 483 202 0 0 0 7 1 169 448 873 3798 *2000 616 636 567 424 224 390 80 35 3 215 379 816 4385 *2001 677 702 410 267 89 219 8 2 0 268 361 1129 4132 *2002 705 583 498 265 173 90 7 0 0 2 125 362 2810 *2003 1005 727 420 132 79 40 23 41 17 80 - - - *Ave. 883 726 581 439 212 154 85 29 49 119 379 768 4424Note : 1972 - 1977 data were obtained from previous report.
* : obtained from telemetric system.
Table 6.2 (1/5) Mean Monthly Rainfall (Malino)
T6-2

Unit : mmYear Jan. Feb. Mar. Apr. May. Jun. Jul. Aug. Sep. Oct. Nov. Dec. Total1972 1175 807 594 152 23 0 0 6 0 0 204 312 32731973 505 135 407 699 193 30 168 26 371 126 772 733 41651974 319 654 919 261 109 53 167 7 124 356 478 702 41491975 416 565 481 737 151 25 213 16 91 52 616 593 39561976 746 496 390 49 73 78 80 55 0 188 264 401 28201977 1177 1527 374 442 36 81 0 24 0 0 258 540 44591978 610 584 350 209 379 101 303 52 211 134 322 664 39191979 877 676 538 249 134 122 0 0 7 0 239 745 35871980 754 703 369 325 70 0 0 15 0 13 384 790 34231981 587 390 276 262 104 88 144 0 162 121 360 824 33181982 566 530 374 328 117 0 0 12 0 0 34 624 25851983 245 160 265 441 184 66 87 0 28 114 445 693 27281984 633 620 612 517 312 91 0 0 144 148 254 557 38881985 315 404 477 405 105 106 70 0 0 102 407 353 27441986 1488 275 350 189 74 58 350 0 0 170 293 479 37261987 1339 384 434 157 57 0 0 0 0 0 109 1272 37521988 278 757 418 218 159 40 0 42 182 129 404 442 30691989 735 460 596 545 78 174 148 53 38 174 208 273 34821990 679 352 257 267 319 0 0 0 0 44 119 648 26851991 760 206 208 415 24 0 0 0 0 0 828 803 32441992 482 422 410 17 41 7 0 0 214 114 490 318 25151993 582 442 336 382 1003 408 9 0 13 45 329 818 4367 **1994 733 523 1205 260 27 15 0 3 0 25 6 380 31771995 975 477 473 381 220 217 43 0 32 86 405 642 39511996 596 872 328 281 24 26 34 59 66 133 526 1166 41111997 435 723 223 71 22 1 24 0 0 39 214 393 21451998 188 148 406 817 221 158 41 96 23 108 714 471 33911999 543 686 377 119 0 0 0 2 5 255 367 577 2931 *2000 787 629 505 299 167 220 72 0 5 274 313 440 3711 *2001 691 758 509 180 78 118 1 0 10 179 270 770 3564 *2002 561 448 400 323 186 31 0 0 0 9 151 497 2606 *2003 725 341 218 154 30 18 3 0 4 61 178 920 2652 *Ave. 672 536 440 317 148 73 61 15 54 100 343 620 3378Note : 1972 - 1998 at Intake Bili-Bili station
* : 1999 - 2003 at Bili-Bili station of telemetric system.
Table 6.2 (2/5) Mean Monthly Rainfall (Intake Bili-Bili & Bili-Bili)
T6-3

Unit : mmYear Jan. Feb. Mar. Apr. May. Jun. Jul. Aug. Sep. Oct. Nov. Dec. Total1972 935 494 383 69 15 - - - - - - - -1973 - - - - - - - - - - - - -1974 - - - - - - - - 94 203 327 452 -1975 362 345 310 381 99 24 82 13 69 154 326 513 26781976 658 379 341 26 37 14 8 0 0 98 255 309 21251977 976 618 128 107 12 82 0 41 0 0 84 393 24411978 470 388 209 212 232 170 140 41 109 44 333 558 29061979 657 627 385 84 135 128 0 28 13 34 69 507 26671980 674 417 330 86 50 0 0 11 14 58 175 614 24291981 408 200 157 198 85 33 70 13 32 62 199 366 18231982 304 241 142 56 28 3 0 0 0 0 26 427 12271983 272 222 120 304 121 51 49 0 3 112 482 557 22931984 506 613 426 303 182 43 17 5 142 57 250 581 31251985 433 273 493 213 89 73 45 3 11 34 214 315 21961986 1018 355 513 143 101 151 11 0 33 348 215 311 31991987 1129 371 385 167 102 10 - 0 0 8 112 1379 -1988 328 473 405 193 168 60 0 15 192 174 342 600 29501989 750 204 285 459 82 118 116 30 24 163 330 397 29581990 673 350 195 112 247 8 25 0 0 90 194 153 20471991 609 489 123 251 15 0 0 0 0 0 289 483 22591992 456 328 720 186 13 91 65 0 245 78 394 318 28941993 873 514 247 370 157 98 0 0 0 80 28 776 31431994 537 517 526 89 105 11 0 0 0 5 344 400 25341995 750 406 241 449 - 7 30 0 11 52 442 798 -1996 483 617 237 184 0 0 0 25 0 40 97 974 26571997 427 638 127 98 56 5 0 0 11 9 75 270 17161998 60 168 380 1129 196 100 100 90 50 498 813 514 40981999 - - 286 127 0 0 0 0 0 122 271 501 1307 *2000 571 651 355 183 81 95 53 4 0 0 192 410 2595 *2001 618 900 468 151 33 76 0 0 0 119 284 817 3466 *2002 617 441 436 168 102 42 1 0 0 0 128 139 2074 *2003 901 406 155 121 61 25 1 0 21 87 228 802 2808 *Ave. 602 436 317 221 90 52 29 11 36 91 251 521 2656
* : 1999 - 2003 Kampili station of telemetric system
Table 6.2 (3/5) Mean Monthly Rainfall (Kampili)
T6-4

Station : Jonggoa Unit : mmYear Jan. Feb. Mar. Apr. May. Jun. Jul. Aug. Sep. Oct. Nov. Dec. Total1999 1019 356 521 138 0 0 0 3 5 224 360 768 33942000 805 398 484 281 139 295 27 40 3 351 537 496 38562001 702 902 440 464 34 131 33 4 3 204 213 488 36182002 464 122 0 0 0 82 1 0 0 1 388 506 15642003 978 640 484 104 76 23 12 65 16 78 233 1128 3837Ave. 794 484 386 197 50 106 15 22 5 172 346 677 3254
Station : Maccini Sombala Unit : mmYear Jan. Feb. Mar. Apr. May. Jun. Jul. Aug. Sep. Oct. Nov. Dec. Total1999 1178 432 318 73 0 0 0 0 7 112 185 521 28262000 510 735 242 226 38 61 12 2 21 75 293 403 26182001 801 729 430 122 50 87 0 0 27 42 244 898 34302002 748 473 396 125 49 57 4 0 0 0 112 409 23732003 749 436 89 112 72 13 4 0 9 43 84 703 2314Ave. 797 561 295 132 42 44 4 0 13 54 184 587 2712
Station : Limbunga Unit : mmYear Jan. Feb. Mar. Apr. May. Jun. Jul. Aug. Sep. Oct. Nov. Dec. Total1999 648 412 492 176 0 0 0 3 49 291 242 682 29952000 673 690 590 349 133 232 137 30 6 196 108 548 36922001 729 956 366 365 73 109 77 4 8 217 367 841 41122002 704 512 347 275 103 79 11 0 0 0 180 534 27452003 878 439 244 195 187 21 13 6 43 114 216 1038 3394Ave. 726 602 408 272 99 88 48 9 21 164 223 729 3388
Station : Mangempang Unit : mmJan. Feb Mar Apr May Jun Jul Aug Sep Oct Nov Dec Total
1999 919 632 577 117 0 0 0 5 29 275 588 662 38042000 772 784 452 313 180 319 156 4 14 227 647 488 43562001 965 1147 503 369 78 21 0 3 19 238 643 1483 54692002 1210 887 499 553 342 137 14 0 0 7 374 1101 51242003 1421 819 525 296 187 34 21 7 98 239 477 1749 5873Ave. 1057 854 511 330 157 102 38 4 32 197 546 1097 4925
Table 6.2 (4/5) Mean Monthly Rainfall
T6-5

Unit : mmYear Jan. Feb. Mar. Apr. May. Jun. Jul. Aug. Sep. Oct. Nov. Dec. Total1978 408 482 220 168 356 78 97 19 49 12 161 626 26751979 805 407 313 90 100 136 0 0 2 5 147 538 25391980 643 524 316 159 32 12 0 0 16 19 111 736 25671981 601 329 138 36 41 35 109 0 16 6 406 - -1982 604 463 374 69 55 0 0 0 0 0 0 159 17231983 126 46 25 170 55 18 0 0 0 31 415 548 14331984 638 599 347 180 150 9 26 0 120 52 145 518 27841985 452 287 470 256 109 27 28 5 106 18 207 56 20201986 866 184 364 170 31 27 46 3 3 85 164 152 20941987 975 388 495 59 63 0 0 0 6 0 66 1181 32321988 480 769 201 184 222 18 15 14 94 186 528 741 34521989 760 756 285 277 87 57 11 12 17 24 181 140 26061990 355 145 155 29 214 0 2 4 0 53 92 335 13841991 726 460 43 211 11 0 5 0 0 8 60 215 17391992 375 241 423 153 13 71 24 15 72 20 114 317 18371993 450 357 227 166 41 25 0 - - 34 202 782 -1994 704 364 497 143 16 10 0 0 0 12 217 232 21931995 772 546 408 333 111 74 11 0 19 37 412 584 33051996 787 782 236 115 0 11 12 0 15 59 317 1398 37311997 410 848 230 214 13 0 12 0 0 0 21 274 20211998 155 53 196 253 64 45 147 74 0 0 0 0 9861999 2791 32 94 36 29 24 18 - - 1190 741 630 -2000 819 244 542 0 322 432 16 0 0 219 211 521 33262001 543 810 202 25 35 39 0 0 3 0 94 682 24332002 472 147 33 12 62 27 5 0 14 0 54 205 1031Ave. 669 410 273 140 89 47 23 6 24 83 203 482 2449
Table 6.2 (5/5) Mean Monthly Rainfall (Bontosunggu)
T6-6

Unit : mm
Pattarn Station nameArea
(km2)Thiessen Ratio Year Malino Jonggoa Bili-Bili Kampili
Macini
SombalaLimbunga Mangempang
Basin
MeanMalino 200.26 0.263 1972 3441 - 3273 - - - - 3356Jonggoa 128.25 0.168 1973 3970 - 4165 - - - - 4069Bili-Bili 81.45 0.107 1974 5185 - 4149 - - - - 4662Kampili 65.74 0.086 1975 4281 - 3956 2678 - - - 3897Macini Sombala 66.18 0.087 1976 3968 - 2820 2125 - - - 3274Limbunga 116.92 0.153 1977 4975 - 4459 2441 - - - 4368Mangempang 103.19 0.135 1978 4778 - 3919 2906 - - - 4173Malino 377.03 0.495 1979 3821 - 3587 2667 - - - 3545Bili-Bili 384.96 0.505 1980 7039 - 3423 2429 - - - 5059Malino 380.98 0.500 1981 5578 - 3318 1823 - - - 4189Bili-Bili 249.12 0.327 1982 4414 - 2585 1227 - - - 3264Kampili 131.90 0.173 1983 3938 - 2728 2293 - - - 3258Malino 200.26 0.263 1984 5724 - 3888 3125 - - - 4674Jonggoa 128.26 0.168 1985 4485 - 2744 2196 - - - 3520Bili-Bili 120.47 0.158 1986 3812 - 3726 3199 - - - 3678Macini Sombala 92.91 0.122 1987 4845 - 3752 - - - - 4293Limbunga 116.91 0.153 1988 6483 - 3069 2950 - - - 4755Mangempang 103.19 0.135 1989 7230 - 3482 2958 - - - 5265Jonggoa 328.20 0.431 1990 2695 - 2685 2047 - - - 2580Bili-Bili 81.46 0.107 1991 3378 - 3244 2259 - - - 3140Kampili 65.74 0.086 1992 2344 - 2515 2894 - - - 2495Macini Sombala 66.18 0.087 1993 4985 - 4367 3143 - - - 4464Limbunga 117.18 0.154 1994 2857 - 3177 2534 - - - 3066Mangempang 103.24 0.135 1995 5609 - 3951 - - - - 4771Bili-Bili 630.10 0.827 1996 5301 - 4111 2657 - - - 4454Kampili 131.90 0.173 1997 4226 - 2145 1716 - - - 3111
1998 3379 - 3391 4098 - - - 3507
C.A. = 762.0 km2 1999 3798 3394 2931 1307 2826 2995 3804 33522000 4385 3856 3711 2595 2618 3692 4356 38062001 4132 3618 3564 3466 3430 4112 5469 40442002 2810 1564 2606 2074 2373 2745 5124 27802003 - 3837 2652 2808 2314 3394 5873 3697
Table 6.3 Thiessen Ratio and Basin mean Rainfall
5
6
1
2
3
4
T6-7

Table 6.4 Maximum One-day RainfallUnit : mm
Year Malino Bili-Bili Year Malino Bili-Bili Year Malino Bili-Bili1923 - 97 1950 - - 1977 208 2351924 - 98 1951 - - 1978 168 1481925 - 235 1952 - - 1979 131 2111926 - 113 1953 225 157 1980 138 1081927 - 143 1954 225 102 1981 135 1181928 - 113 1955 - 182 1982 135 1471929 - 182 1956 193 145 1983 130 2061930 - 152 1957 - 143 1984 190 1291931 117 125 1958 - 143 1985 143 1311932 115 217 1959 150 200 1986 200 2151933 202 156 1960 235 - 1987 133 2961934 150 210 1961 201 - 1988 275 1551935 252 210 1962 169 - 1989 221 1181936 118 97 1963 119 - 1990 86 1691937 154 139 1964 - - 1991 160 1701938 225 165 1965 200 - 1992 99 1431939 181 138 1966 111 147 1993 246 1981940 143 117 1967 190 172 1994 71 1931941 216 - 1968 127 87 1995 177 1401942 - - 1969 88 213 1996 108 1781943 - - 1970 130 131 1997 160 1211944 - - 1971 150 151 1998 101 1381945 - - 1972 205 249 1999 185 2001946 - - 1973 105 271 2000 237 1831947 - - 1974 294 194 2001 130 1671948 - - 1975 86 264 2002 134 2131949 - - 1976 134 160 2003 161 116
Source : 1931 - 1977 Malino and 1923 - 1971 Bili-Bili data are obtained fromSupporting Report on Detailed Design of Bili-Bili Multipurpose Dam ProjectOthers are newly collected
T6-8

Station NameRating
Curve
The Date
of CreationUpdate Formula Remarks
Jonggoa 1999 × Q=12.295(h-0.1826)2 No check for high flows*
Bont Jai 1999 × Q=475.22h3-3961h
2+11046h-10272
Bili-Bili × dam reservoir
Kampili 1999 × Q=205.5(h+0.1451)2
Maccini Sombala ×
Bayang ×Equipment were stallen in 2002
Now Interrupting
Jenelata 1999 × Q=82.93(h-0.614)2 2002.1 Flushed out
2004.2 Reconstruction
* : The water level gauge was not functioning during the peak flood periodSource : JRBDP information
Table 6.5 Rating Curve of Water Level Gauging Station
T6-9

Bili-Bili Dam Site Jenelata Station
C.A. = 384.4 km2
C.A. = 226.3 km2
1972 2594 1806 * 70 788 1972 2635 1174 45 14611973 4782 4034 84 747 1973 5075 2861 56 22141974 4511 3677 82 834 1974 4784 2482 52 23021975 3979 2952 74 1027 1975 4597 2371 52 22261976 4669 3733 80 936 1976 4716 2695 57 20211977 3353 2568 77 785 1977 3671 1893 52 17781978 4916 3405 * 69 1510 1978 5119 2630 51 24891979 5334 4260 * 80 1073 1979 5955 3589 60 23661980 4518 3185 * 70 1333 1980 5045 2870 57 21751981 5784 3554 * 61 2230 1981 6458 3773 58 26851982 2988 833 * 28 2155 1982 3306 1645 50 16611983 4672 3339 * 71 1333 1983 4842 2604 54 22381984 4488 2540 * 57 1947 1984 4981 2573 52 24081985 4075 2610 * 64 1465 1985 4280 2327 54 19531986 4134 2761 * 67 1374 1986 4263 2152 50 21111987 4721 2834 * 60 1887 1987 5190 3189 61 20011988 7445 3288 * 44 4156 1988 8623 5488 64 31351989 3325 2052 * 62 1273 1989 3444 1759 51 16851990 3220 3299 * 102 -78 1990 2800 2489 * 89 3111991 2595 1366 * 53 1229 1991 2810 1524 * 54 12871992 3932 2726 69 1205 1992 3919 1986 * 51 19341993 4128 3054 74 1074 1993 4195 2702 * 64 14931994 3254 2315 71 939 1994 3170 1985 * 63 11861995 4435 3248 73 1187 1995 4181 2403 * 57 17781996 4951 3607 73 1344 1996 4541 2108 * 46 24321997 2241 1344 60 897 1997 2300 1142 * 50 11571998 3971 2683 68 1289 1998 3636 2254 62 13821999 3768 2609 69 1159 1999 3817 2450 64 13672000 4130 2947 71 1183 2000 4144 2796 67 1348Ave. 4169 2849 68 Ave. 4362 2480 57
Note : * the figures are obtained from the discharge converted from gaugied water level
Table 6.6 Railfall and Runoff Depth at each Station
Rainfall
(mm)
Runoff
Depth
(mm)
Ratio
(%)loss
Hydrological
Year
(Jun.-May)
Hydrological
Year
(Jun.-May)
Rainfall
(mm)
Runoff
Depth
(mm)
Ratio
(%)loss
T6-10

Average Rainfall for seven (7) Stations(Kampili, Bontosunggu, Mandalle, Kalabajeng, Bontosallang, Barembeng, Sandro Bone) Unit : mm
Year Jan. Feb. Mar. Apr. May Jun. Jul. Aug. Sept. Oct. Nov. Dec. Total1st 2nd 1st 2nd 1st 2nd 1st 2nd 1st 2nd 1st 2nd 1st 2nd 1st 2nd 1st 2nd 1st 2nd 1st 2nd 1st 2nd
1972 784 38 106 328 216 120 0 61 13 0 0 0 0 0 0 4 0 0 0 0 24 106 78 120 1,998 1973 109 212 76 10 170 89 228 217 72 51 16 3 107 0 10 7 60 176 48 32 111 380 68 398 2,647 1974 192 11 219 196 402 182 126 40 22 47 8 26 27 79 0 4 78 4 137 41 71 216 183 214 2,528 1975 163 156 193 111 178 94 38 285 48 24 41 3 4 53 16 2 62 41 64 147 94 249 421 215 2,698 1976 592 101 226 192 202 250 33 10 55 2 17 17 8 0 0 0 0 0 5 47 105 154 277 147 2,438 1977 366 618 475 577 112 155 133 2 24 15 63 12 0 0 11 0 0 3 0 0 3 97 157 156 2,979 1978 274 198 289 194 95 174 136 43 132 130 48 37 87 9 7 14 43 10 32 8 72 105 159 477 2,774 1979 651 180 237 261 288 56 21 44 87 28 109 3 1 0 5 0 2 2 1 7 33 61 410 129 2,618 1980 365 306 294 192 198 117 86 86 16 11 0 9 1 0 2 0 0 5 4 11 40 44 358 306 2,451 1981 297 298 207 130 47 123 64 33 59 19 2 25 113 14 1 4 13 1 15 10 77 316 393 281 2,543 1982 287 313 412 53 205 137 12 52 34 1 12 0 0 0 0 0 0 0 0 0 1 4 14 185 1,721 1983 165 72 65 36 8 70 85 101 65 4 10 13 10 8 0 0 0 1 19 54 56 361 149 349 1,698 1984 201 389 339 179 189 56 76 70 114 33 7 6 0 13 0 1 55 8 30 30 40 132 186 381 2,536 1985 162 276 164 183 435 10 120 47 70 27 29 0 12 18 0 5 0 35 2 24 54 112 80 98 1,961 1986 534 308 186 155 170 144 109 21 29 1 42 9 8 14 0 0 0 7 52 39 72 115 101 121 2,237 1987 376 566 207 121 82 250 75 9 72 1 2 0 0 0 0 0 0 1 0 5 37 33 290 913 3,040 1988 122 236 682 146 74 274 128 16 103 44 10 6 2 3 11 10 48 35 59 71 150 201 389 204 3,025 1989 57 627 282 278 297 23 84 221 59 4 31 47 15 32 0 9 3 23 41 83 103 94 199 59 2,671 1990 373 299 176 91 172 17 35 31 62 114 7 0 4 3 0 1 0 2 0 50 65 56 80 315 1,953 1991 205 534 244 127 30 76 56 121 0 4 0 1 1 0 0 0 0 0 0 1 25 49 236 48 1,760 1992 258 79 88 94 265 188 86 19 8 3 26 17 26 0 10 1 52 39 9 17 34 111 154 172 1,755 1993 75 346 178 173 86 90 136 42 59 19 28 6 0 0 0 0 0 0 17 5 20 58 147 501 1,987 1994 205 497 175 132 288 210 40 59 36 0 0 11 0 0 0 0 0 0 4 10 41 99 124 127 2,057 1995 305 289 216 190 266 106 285 23 68 12 32 17 8 0 0 0 2 8 5 19 66 177 433 122 2,649 1996 172 432 641 210 104 181 42 38 20 3 8 7 2 2 4 0 4 2 51 24 125 74 470 476 3,092 1997 290 183 209 412 130 5 48 35 12 4 0 1 5 0 0 0 0 2 2 0 0 27 72 172 1,609 1998 65 19 56 11 5 211 226 95 105 57 36 75 32 118 26 30 2 57 45 124 263 204 241 430 2,532 1999 716 583 270 270 183 109 61 113 61 1 2 19 15 0 0 0 0 0 132 95 178 89 290 233 3,419 2000 233 441 453 188 141 231 110 92 36 46 85 46 12 5 1 0 0 0 8 60 12 190 258 121 2,766 2001 498 148 715 101 283 121 47 22 8 10 51 6 0 0 0 0 1 1 3 20 76 112 466 193 2,882
Mean 303 292 269 178 177 129 91 68 52 24 24 14 17 12 3 3 14 15 26 34 68 134 229 255 2,434
Note : Jan.-May 1972, Sep.74-Mar.75 : R(Project Area) = 0.879xR(Kampili) Missing data : Sandro Bone Jan. and Feb. 1998Jun.1972-Aug.74 : R(Project Area) = 0.879x(0.723xR(Bili Bili)) Kampili Jan. and Feb. 1999
Bontosunggu Aug. and Sep. 1999Source : 1972 - 1997 obteined from Supporting Report for Detaile Design on Bili-Bili Irrigation Project in Dec.1999 Bontosallang Jan. - Mar. 2000
: 1998 - 2001 Newly Collecting from Balai PSDA Jeneberang Mandalle Feb. 2000
Table 6.7 Half Monthly Rainfall in the Irrigation Area for Calcuration of Net Field Requirement (NFR)
T6-11
Wet Season Dry Season Wet Season Dry Season Amount
(m3/s) (MCM) (m3/s) (MCM) (m3/s) (m3/s) (m3/s) (m3/s) (MCM)
PDAM Makassar 2.36 *1 74.30 unknown unknoun 1.34 1.84 1.47 1.97 54.18
PDAM Gowa 0.19 *1 5.99 unknown unknoun 0.18 0.18 0.19 0.19 6.10
Wet Season Dry Season Wet Season Dry Season Amount
(m3/s) (MCM) (m3/s) (MCM) (m3/s) (m3/s) (m3/s) (m3/s) (MCM)
PDAM Makassar 2.74 *1 86.25 unknown unknown 1.65 unknown 1.80 2.30 64.71
PDAM Gowa uknown unknown 0.37 11.82 *2 unknown unknown 0.36 0.36 11.50
Wet Season Dry Season Wet Season Dry Season Amount
(m3/s) (MCM) (m3/s) (MCM) (m3/s) (m3/s) (m3/s) (m3/s) (MCM)
PDAM Makassar 4.11 *1 129.48 unknown unknown 3.02 unknown 3.31 3.81 112.26
PDAM Gowa unknown unknown 0.72 22.81 *3 unknown unknown 0.71 0.71 22.50
Wet Season Dry Season Wet Season Dry Season Amount
(m3/s) (MCM) (m3/s) (MCM) (m3/s) (m3/s) (m3/s) (m3/s) (MCM)
PDAM Makassar 4.25 *1 134.11 unknown unknown 3.16 unknown 3.47 3.97 117.30
PDAM Gowa unknown unknown 0.77 24.19 *3 unknown unknown 0.76 0.76 23.87
Wet Season Dry Season Wet Season Dry Season Amount
(m3/s) (MCM) (m3/s) (MCM) (m3/s) (m3/s) (m3/s) (m3/s) (MCM)
PDAM Makassar 4.40 *1 138.90 unknown unknown 3.31 unknown 3.63 4.13 122.33
PDAM Gowa unknown unknown 0.81 25.56 *2 unknown unknown 0.80 0.80 25.24
*1: Refer to Water Supply Section*2: Refer to Main Report on Consulting Engineering Services for Comprehensive Water Management Plam Study
for MAROS-JENEPONTO River Basin, Sector 10*3: estimated to interpolate linear between 2010 and 2020
WTP : Requirement of Water Treatment PlantIntake : Diversion requirement from the intake
Intake
Table 6.8 (1/2) Projected Municipal Water Demand and Diversion Requirement
Intake
WTP
WTP
All Supply Area
Supplier IntakeAll Supply Area
Intake
All Supply AreaWTP
WTP
WTP
All Supply AreaIntake
All Supply AreaWTP IntakeIntake
WTP
Intake
Present Condition in 2003
in 2010
in 2018
in 2019
in 2020
from the Jeneberang River
from the Jeneberang River
from the Jeneberang River
from the Jeneberang River
from the Jeneberang River
Supplier
Supplier
Supplier
Supplier
WTP Intake
WTP Intake
WTP
T6-12

in 2010 in 2018
Facility Name Plant Capacity Actual*5 Actual Actual
(m3/s) (MCM) (m3/s) (m3/s) (m3/s) (MCM) (m3/s) (m3/s) (MCM) (m3/s) (m3/s) (MCM)*1 Somba Opu WTP 3.30 104.07 1.00 1.19 1.31 41.33 1.50 1.64 51.86 2.87 3.15 99.42 Bili-Bili*3
*1 Ratulangi WTP - - 0.05 0.06 0.07 2.07 0.06 0.07 2.07 0.06 0.07 2.07 Ujung Pandang*1 Maccini Sombala WTP - - 0.20 0.09 0.09 2.90 0.09 0.09 2.90 0.09 0.09 2.90 Malingkeli-1*1 the growth*4 - - - - - - 0.00 0.00 0.00 0.00 0.00 0.00 Downstream*1 Panaikang WTP (for dry season) - - 1.00 unknown 0.50 7.88 unknown 0.50 7.88 unknown 0.50 7.88 Malingkeli-2*2 Bajeng WTP - - 0.02 0.02 0.02 0.66 0.02 0.02 0.66 0.02 0.02 0.66 Kampili Weir*2 Borong Loe WTP - - 0.02 0.01 0.01 0.44 0.02 0.02 0.69 0.02 0.02 0.69 Bili-Bili*3
*2 Tompo Balang WTP 0.10 3.15 0.04 0.03 0.03 0.83 0.04 0.04 1.32 0.04 0.04 1.32 Sungguminasa*2 Pandang-Pandang WTP - - 0.20 0.13 0.13 4.17 0.20 0.21 6.62 0.20 0.21 6.62 Padang-Pandang*2 the growth*4 - - - - - - 0.07 0.07 2.20 0.40 0.42 13.19 Downstream
in 2019 in 2020Facility Name Actual Actual
(m3/s) (m3/s) (MCM) (m3/s) (m3/s) (MCM)*1 Somba Opu WTP 2.98 3.28 103.38 2.98 3.28 103.38 Bili-Bili*3
*1 Ratulangi WTP 0.06 0.07 2.07 0.06 0.07 2.07 Ujung Pandang*1 Maccini Sombala WTP 0.12 0.13 3.98 0.20 0.21 6.62 Malingkeli-1*1 the growth*4 0.00 0.00 0.00 0.07 0.08 2.39 Downstream*1 Panaikang WTP (for dry season) unknown 0.50 7.88 unknown 0.50 7.88 Malingkeli-2*2 Bajeng WTP 0.02 0.02 0.66 0.02 0.02 0.66 Kampili Weir*2 Borong Loe WTP 0.02 0.02 0.69 0.02 0.02 0.69 Bili-Bili*3
*2 Tompo Balang WTP 0.04 0.04 1.32 0.04 0.04 1.32 Sungguminasa*2 Pandang-Pandang WTP 0.20 0.21 6.62 0.20 0.21 6.62 Padang-Pandang*2 the growth*4 0.44 0.46 14.57 0.48 0.51 15.94 Downstream
*1 : Operated by PDAM Makassar*2 : Operated by PDAM Gowa*3 : Intake point between Bili-Bili MultipurposeDam and Bili-Bilii Weir*4 : Water Demand Increament which cannot be provided from existing WTP capacity and Somba Opu reinforcementntn*5 : Refer to Water Supply SectorrActual : actual requirement of Water Treatment PlanttIntake : estimated diversion requiremenr from the intakee
Intake
Intake Point
Intake Point
Table 6.8 (2/2) Projected Municipal Water Demand and Diversion Requirement from the Jeneberang River
IntakeIntake
Originally Programmed
Intake
Present Condition
Intake
T6-13

Present
(2003)2018 2019 2020
Present
(2003)2018 2019 2020
1972 65.0 65.0 65.0 65.0 0.0 0.0 0.0 0.01973 87.2 86.3 86.2 86.2 130.5 120.7 119.9 119.61974 91.1 88.9 88.7 88.5 178.2 150.4 148.0 145.61975 89.7 87.3 87.0 86.8 159.9 131.0 128.3 125.61976 73.0 65.0 65.0 65.0 23.5 0.0 0.0 0.01977 82.5 76.2 75.7 75.1 84.1 42.7 39.1 35.61978 98.6 96.6 96.4 96.2 292.1 259.3 255.3 251.91979 83.8 79.1 78.4 77.9 96.1 59.7 56.4 53.21980 81.4 75.7 75.3 74.8 75.3 39.5 36.5 33.61981 90.3 87.5 87.2 87.0 167.5 133.4 130.5 127.91982 65.0 65.0 65.0 65.0 0.0 0.0 0.0 0.01983 67.4 65.0 65.0 65.0 5.2 0.0 0.0 0.01984 89.2 86.0 85.7 85.4 153.4 117.1 114.0 111.21985 89.8 87.4 87.1 86.9 161.0 132.3 129.7 127.41986 84.2 80.3 79.6 78.9 99.2 65.2 61.9 58.61987 75.1 65.9 65.0 65.0 35.6 1.9 0.0 0.01988 87.9 84.5 84.2 83.9 138.3 102.7 99.6 96.51989 98.5 97.9 97.8 97.7 289.4 279.4 278.4 277.41990 93.4 91.8 91.7 91.5 209.6 187.8 186.0 184.01991 76.1 66.4 65.0 65.0 41.9 3.0 0.0 0.01992 72.8 65.0 65.0 65.0 22.8 0.0 0.0 0.01993 86.1 83.0 82.9 82.9 118.6 88.6 88.1 88.01994 76.8 68.2 66.7 65.0 46.5 7.1 3.7 0.31995 86.3 81.5 81.1 80.6 120.3 76.3 72.6 69.31996 79.4 73.3 72.6 71.8 61.4 24.8 21.7 18.51997 65.0 65.0 65.0 65.0 0.0 0.0 0.0 0.01998 81.0 77.8 77.6 77.4 71.9 53.0 51.4 50.21999 82.1 76.6 76.2 75.7 81.3 45.6 42.5 39.42000 95.5 94.0 93.8 93.7 241.1 218.3 216.3 214.32001 95.5 94.0 93.8 93.7 126.5 92.6 89.7 86.7
Table 6.9 Result of Bili-Bili Reservoir Simulation
YearMinimum Water Level (m) Minimum Storage Volume above LWL (MCM)
T6-14

Present 2018 2019 2020 Apr. May Jun Total Annual
1972 * * * * 61 13 0 74 1,998
1973 444 123 19 586 2,647
1974 166 69 34 269 2,528
1975 323 72 44 438 2,698
1976 * * * 42 58 34 134 2,438
1977 135 39 75 249 2,979
1978 178 263 86 527 2,774
1979 65 115 112 292 2,618
1980 172 27 9 208 2,451
1981 97 79 27 203 2,543
1982 * * * * 64 34 12 110 1,721
1983 * * * 186 69 23 277 1,698
1984 146 148 13 306 2,536
1985 166 97 30 293 1,961
1986 130 29 51 211 2,237
1987 * * 84 73 2 158 3,040
1988 144 147 16 307 3,025
1989 305 63 77 446 2,671
1990 66 176 7 249 1,953
1991 * * 177 5 1 183 1,760
1992 * * * 105 11 43 159 1,755
1993 178 79 34 291 1,987
1994 99 36 12 146 2,057
1995 308 80 48 436 2,649
1996 79 23 15 117 3,092
1997 * * * * 83 16 1 100 1,609
1998 321 162 111 595 2,532
1999 174 62 21 257 3,419
2000 202 83 130 415 2,766
2001 69 17 57 144 2,882
Average 159 76 38 273 2,434
* : The year during which the storage volume of Bili-Bili dam reservoir drops to zero.
Table 6.10 Areal Average Raindall in Lower Reaches of Jeneberang River belowBili-Bili Dam in the Drought Year
YearOccurrence of Drought Areal Average Raindall
T6-15

Fig.6.1 The Location of Rainfall Station Collected Data in this Study
20km151050
SCALE
Rivers
Catchment Boundary
LEGEND :
Rainfall Station
Climatology Station
Rainfall Station (telemetric)
Sandro Bone
Barembeng
Bonto Sallang
Kalabajeng
Mandalle KampiliBonto Sunggu
MacciniSombala
Bili-Bili
Mangempang
Limbunga
Jonggoa
MalinoMalino
Kampili
Intake Bili-Bili
F6-1

20km151050
SCALE
Rivers
Catchment Boundary
City/Regional Urban Centers
Bili-Bili Dam
LEGEND :
Rainfall Station
( ) Average Annual Rainfall (mm)
Makassar City
MacciniSombala (2,712)
Kampili(2,656)
Bili-Bili(3,378)
Mangempang (4,925)
Limbunga (3,388)
Jonggoa (3,254)
Malino(4,424)
Bontosunggu (2,449)
0
200
400
600
800
1000
1200
Jan.
Feb
Mar
Apr
May
Jun
Jul
Aug Sep Oct
Nov
Dec
0
200
400
600
800
1000
1200
Jan.
Feb
Mar
Apr
May
Jun
Jul
Aug Sep Oct
Nov
Dec
0
200
400
600
800
1000
1200Ja
n.F
ebM
arA
prM
ayJu
nJu
lA
ug Sep Oct
Nov
Dec
0
200
400
600
800
1000
1200
Jan.
Feb
Mar
Apr
May
Jun
Jul
Aug Sep Oct
Nov
Dec
0
200
400
600
800
1000
1200Ja
n.F
ebM
arA
prM
ayJu
nJu
lA
ug Sep Oct
Nov
Dec
0
200
400
600
800
1000
1200
Jan.
Feb
Mar
Apr
May
Jun
Jul
Aug Sep Oct
Nov
Dec
0
200
400
600
800
1000
1200
Jan.
Feb
Mar
Apr
May
Jun
Jul
Aug Sep Oct
Nov
Dec
0
200
400
600
800
1000
1200
Jan.
Feb
.M
ar.
Apr
.M
ay.
Jun.
Jul.
Aug
.S
ep.
Oct
.N
ov.
Dec
.
F6-2
Figure 6.2 Seasonal Rainfall in the Jeneberang River Basin

Gumbell Probability Paper
Figure 6.3 (1/2) Probable Maximum One-day Rainfall (Malino)
Ret
urn
Perio
d
Prob
abili
ty o
f Exc
eeda
nce
Return Period Malino200 - year 362 mm/day150 350100 333
80 32350 30330 28220 26410 234
5 2023 1772 154
Jeneberang River
Malino Station
1931-2003 (58 records)
F6-3
Gumbell Probability Paper
Figure 6.3 (2/2) Probable Maximum One-day Rainfall (Bili-Bili)
Jeneberang River
Bili-Bili Station
1923-2003 (63 records)
Return Period Bili-Bili200 - year 343 mm/day150 332100 317
80 30850 29130 27120 25510 228
5 2003 1772 157
Ret
urn
Perio
d
Prob
abili
ty o
f Exc
eeda
nce
F6-4
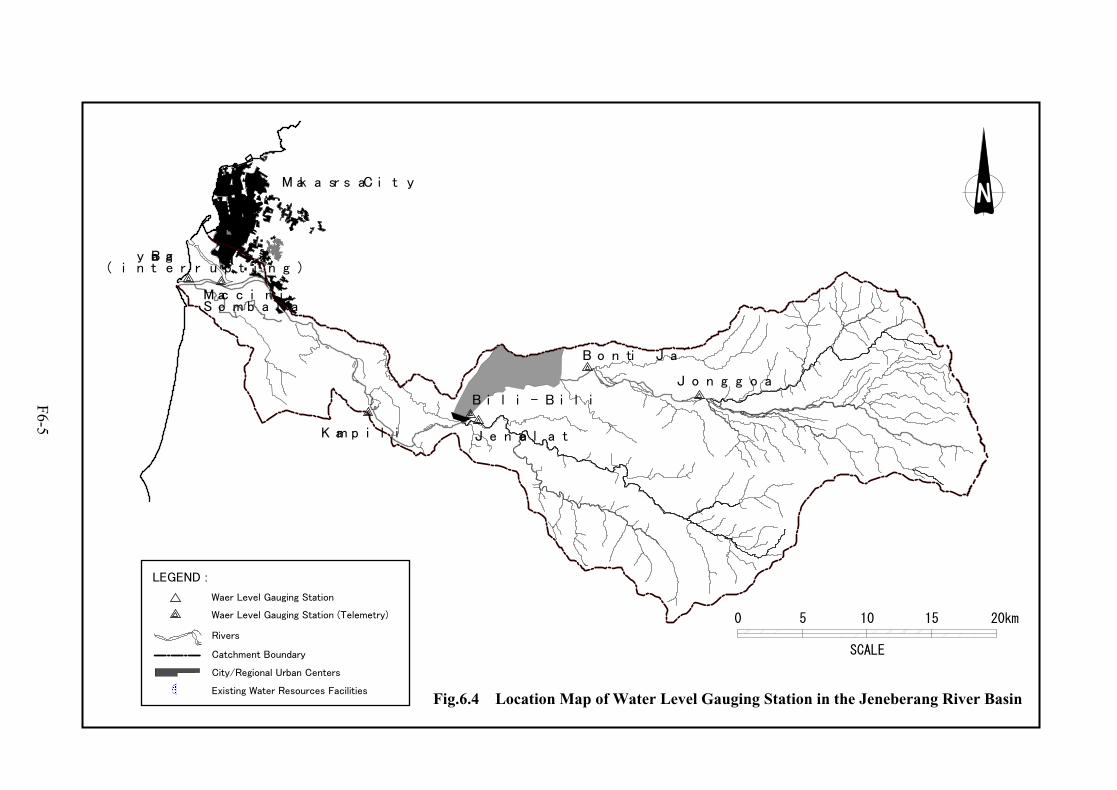
Fig.6.4 Location Map of Water Level Gauging Station in the Jeneberang River Basin
20km151050
SCALERivers
Catchment Boundary
City/Regional Urban Centers
Existing Water Resources Facilities
LEGEND :
Waer Level Gauging Station
Waer Level Gauging Station (Telemetry)
Makassar City
Bayang(interrupting)
MacciniSombala
Kampili
Bili-Bili
Jenelata
Bont Jai
Jonggoa
F6-5

Figure 6.5 Structure and Parameter of Tank Model in this Study
Parameter
Catchment Area (km2) 384.4 226.3
Multiplying Constant of Outlet (mm) - Upper Tank 0.900 0.600 0.200 0.700 0.260 0.130 - Middle Tank 0.050 0.030 0.060 0.020 - Lower Tank 0.004 0.015 0.008 0.001
Height of Outlet (mm) - Upper Tank 50 10 90 20 - Middle Tank 10 20 - Lower Tank 10 20
Evaporation Factor 0.55 0.65
Effective Rainfall Ratio 1.00 0.93
Jeneberang River Jenelata River
UpperTank
MiddleTank
LowerTank
R
Fc * R Fe * EvSs1 = Sl1 + Fc * R - Fe*Ev
Sq1 = Alf1 * (Ss1 - Ha1)
Sq2 = Alf2 * (Ss1 - Ha2)
Sq3 = Alf2 * Ss1
Sl1Ha1
Ha2
Sl2
Hb
Sq5 = Bet2 * Ss2
Sq4 = Bet1 * (Ss2 - Hb)
Ss2 = Sl2 + Sq3
Sl3
Hg
Sq6 = Gam1 * (Ss3 - Hg)
Ss3 = Sl3 + Sq5
Sq7 = gam2 * Ss3
F6-6

Figure 6.6 Flow Regime in the Jeneberang River Basin
Flow Regime at Bili-Bili Damsite
0.0
10.0
20.0
30.0
40.0
50.0
60.0
70.0
80.0
90.0
100.0
1972
1973
1974
1975
1976
1977
1978
1979
1980
1981
1982
1983
1984
1985
1986
1987
1988
1989
1990
1991
1992
1993
1994
1995
1996
1997
1998
1999
2000
2001
disc
harg
e (m
3 /s)
95-day discharge185-day discharge275-day discharge355-day discharge
Flow Regime at Jenelara Station
0.00
10.00
20.00
30.00
40.00
50.00
60.00
70.00
80.00
90.00
100.00
1972
1973
1974
1975
1976
1977
1978
1979
1980
1981
1982
1983
1984
1985
1986
1987
1988
1989
1990
1991
1992
1993
1994
1995
1996
1997
1998
1999
2000
2001
disc
harg
e (m
3 /s)
95-day discharge185-day discharge275-day discharge355-day discharge
F6-7

Figure 6.7 Flow Regime at Kampili Station
95-day discharge fluctuation
0.0
20.0
40.0
60.0
80.0
100.0
120.0
140.0
160.0
1972
1973
1974
1975
1976
1977
1978
1979
1980
1981
1982
1983
1984
1985
1986
1987
1988
1989
1990
1991
1992
1993
1994
1995
1996
1997
1998
1999
2000
2001
disc
harg
e (m
3 /s)
with damwithout dam
185-day discharge fluctuation
0.0
10.0
20.0
30.0
40.0
50.0
60.0
1972
1973
1974
1975
1976
1977
1978
1979
1980
1981
1982
1983
1984
1985
1986
1987
1988
1989
1990
1991
1992
1993
1994
1995
1996
1997
1998
1999
2000
2001
disc
harg
e (m
3 /s)
with damwithout dam
275-day discharge fluctuation
0.0
5.0
10.0
15.0
20.0
25.0
30.0
35.0
40.0
1972
1973
1974
1975
1976
1977
1978
1979
1980
1981
1982
1983
1984
1985
1986
1987
1988
1989
1990
1991
1992
1993
1994
1995
1996
1997
1998
1999
2000
2001
disc
harg
e (m
3 /s)
with damwithout dam
355-day discharge fluctuation
0.0
2.0
4.0
6.0
8.0
10.0
12.0
14.0
16.0
18.0
20.0
1972
1973
1974
1975
1976
1977
1978
1979
1980
1981
1982
1983
1984
1985
1986
1987
1988
1989
1990
1991
1992
1993
1994
1995
1996
1997
1998
1999
2000
2001
disc
harg
e (m
3 /s)
with damwithout dam
F6-8

Data : Averaged from 1972 to 2001based on 5-days discharge
Figure 6.8 Flow Regime Improvement by Bili-Bili Multipurpose Dam
Daily mean discharge at Kampili
0
20
40
60
80
100
120
140
160
180
Jan Feb Mar Apr May Jun Jul Aug Sep Oct Nov Dec
Dis
char
ge (m
3 /s)
with damwithout damirrigation
Discharge Duration Curve at Kampili Station
0
20
40
60
80
100
120
140
160
180
1 5 9 13 17 21 25 29 33 37 41 45 49 53 57 61 65 69
Dis
char
ge (m
3 /s)
with damwithout dam
F6-9

Figure 6.9 Irrigation Water Requirement
0.0
0.2
0.4
0.6
0.8
1.0
1.2
1st
2nd
1st
2nd
1st
2nd
1st
2nd
1st
2nd
1st
2nd
1st
2nd
1st
2nd
1st
2nd
1st
2nd
1st
2nd
1st
2nd
Jan Feb Mar Apr May Jun Jul Aug Sep Oct Nov Dec
Req
uire
men
t (l/s
/ha)
Crop Water RequirementNet Field Requirement
F6-10

Figure 6.10 (1/3) Result of Water Balance Calculation
0
100
200
300
400
500
600
Jan
Feb
Mar
Apr
May Jun Jul
Aug Sep
Oct
Nov Dec Jan
Feb
Mar
Apr
May Jun Jul
Aug Sep
Oct
Nov Dec Jan
Feb
Mar
Apr
May Jun Jul
Aug Sep
Oct
Nov Dec Jan
Feb
Mar
Apr
May Jun Jul
Aug Sep
Oct
Nov Dec Jan
Feb
Mar
Apr
May Jun Jul
Aug Sep
Oct
Nov Dec
1972 1973 1974 1975 1976
Dis
char
ge (M
CM
)
0
20
40
60
80
100
120
Wat
er L
evel
(m)
Bili-Bili Dam Inflow
Jenelata Discharge
Irrigation
Resourvoir Water Level
L.W.L.
0
100
200
300
400
500
600
Jan
Feb
Mar
Apr
May Jun Jul
Aug Sep
Oct
Nov Dec Jan
Feb
Mar
Apr
May Jun Jul
Aug Sep
Oct
Nov Dec Jan
Feb
Mar
Apr
May Jun Jul
Aug Sep
Oct
Nov Dec Jan
Feb
Mar
Apr
May Jun Jul
Aug Sep
Oct
Nov Dec Jan
Feb
Mar
Apr
May Jun Jul
Aug Sep
Oct
Nov Dec
1977 1978 1979 1980 1981
Dis
char
ge (M
CM
)
0
20
40
60
80
100
120
Wat
er L
evel
(m)
Bili-Bili Dam Inflow
Jenelata Discharge
Irrigation
Resourvoir Water Level
L.W.L.
F6-11

Figure 6.10 (2/3) Result of Water Balance Calculation
0
100
200
300
400
500
600
Jan
Feb
Mar
Apr
May Jun Jul
Aug Sep
Oct
Nov Dec Jan
Feb
Mar
Apr
May Jun Jul
Aug Sep
Oct
Nov Dec Jan
Feb
Mar
Apr
May Jun Jul
Aug Sep
Oct
Nov Dec Jan
Feb
Mar
Apr
May Jun Jul
Aug Sep
Oct
Nov Dec Jan
Feb
Mar
Apr
May Jun Jul
Aug Sep
Oct
Nov Dec
1982 1983 1984 1985 1986
Dis
char
ge (M
CM
)
0
20
40
60
80
100
120
Wat
er L
evel
(m)
Bili-Bili Dam Inflow
Jenelata Discharge
Irrigation
Resourvoir Water Level
L.W.L.
0
100
200
300
400
500
600
Jan
Feb
Mar
Apr
May Jun Jul
Aug Sep
Oct
Nov Dec Jan
Feb
Mar
Apr
May Jun Jul
Aug Sep
Oct
Nov Dec Jan
Feb
Mar
Apr
May Jun Jul
Aug Sep
Oct
Nov Dec Jan
Feb
Mar
Apr
May Jun Jul
Aug Sep
Oct
Nov Dec Jan
Feb
Mar
Apr
May Jun Jul
Aug Sep
Oct
Nov Dec
1987 1988 1989 1990 1991
Dis
char
ge (M
CM
)
0
20
40
60
80
100
120
Wat
er L
evel
(m)
Bili-Bili Dam Inflow
Jenelata Discharge
Irrigation
Resourvoir Water Level
L.W.L.
F6-12

Figure 6.10 (3/3) Result of Water Balance Calculation
0
100
200
300
400
500
600
Jan
Feb
Mar
Apr
May Jun Jul
Aug Sep
Oct
Nov Dec Jan
Feb
Mar
Apr
May Jun Jul
Aug Sep
Oct
Nov Dec Jan
Feb
Mar
Apr
May Jun Jul
Aug Sep
Oct
Nov Dec Jan
Feb
Mar
Apr
May Jun Jul
Aug Sep
Oct
Nov Dec Jan
Feb
Mar
Apr
May Jun Jul
Aug Sep
Oct
Nov Dec
1992 1993 1994 1995 1996
Dis
char
ge (M
CM
)
0
20
40
60
80
100
120
Wat
er L
evel
(m)
Bili-Bili Dam Inflow
Jenelata Discharge
Irrigation
Resourvoir Water Level
L.W.L.
0
100
200
300
400
500
600
Jan
Feb
Mar
Apr
May Jun Jul
Aug Sep
Oct
Nov Dec Jan
Feb
Mar
Apr
May Jun Jul
Aug Sep
Oct
Nov Dec Jan
Feb
Mar
Apr
May Jun Jul
Aug Sep
Oct
Nov Dec Jan
Feb
Mar
Apr
May Jun Jul
Aug Sep
Oct
Nov Dec Jan
Feb
Mar
Apr
May Jun Jul
Aug Sep
Oct
Nov Dec
1997 1998 1999 2000 2001
Dis
char
ge (M
CM
)
0
20
40
60
80
100
120
Wat
er L
evel
(m)
Bili-Bili Dam Inflow
Jenelata Discharge
Irrigation
Resourvoir Water Level
L.W.L.
F6-13

Figure 6.11 Rainfall Station Operated by JRBDP and Dinas PSDA
20km151050
SCALE
Rivers
Catchment Boundary
LEGEND :
Rainfall Station (JRBDP)
Water Level Gauging Station (JRBDP)
Rainfall Station (Dinas PSDA)
( ) Unreliable Location
Malino
(Rappolemba)
Tanralili
(Bungabaji)
Kampili
Pakalo Dam(Songkoio)
Sungguminasa
Paku
(Boka)
Cambaya
Tamanyeleng
Kalabajeng
Bonto Sallang
Sandro Bone
Barembeng
Mandalle
Makassar City
Bayang(interrupting)
MacciniSombala
KampiliBili-Bili
Jenelata
Bonto Jai
Mangempang
Limbunga
Jonggoa
Malino
(Borongloe)
Intake Bili-Bili
Lemoe
(Palekoang Tallue)
Lebong
Mangasa
Parang-Parang
(Majannang) F6-14

Figure 6.12 Location Map of Proposed Telemetric Rainfall Station
20km151050
SCALE
Rivers
Catchment Boundary
LEGEND :Rainfall Station
Water Level Gauging Station
Proposed Rainfall Station
Hydrological Blind Area
Rainfall and Water Level Gauging Station
Makassar City
Bayang(interrupting)
MacciniSombala
Kampili
Bili-Bili
Jenelata
Bonto Jai
Mangempang
Limbunga
Jonggoa
Malino
R-6(Parang-Parang)
R-1(Lengkese)
R-2(Tanralili)
R-3(Bungabaji)
R-4(Patuku)
R-5(Bonto Jai)
F6-15

The Study on Capacity Development for Jeneberang River Basin Management
Nippon Koei Co., Ltd. 7-1 Final Report, Volume II CTI Engineering International Co., Ltd. Main Report
CHAPTER 7
RIVER AND INFRASTRUCTURE MANAGEMENT
7.1 Features of Existing River Infrastructures
7.1.1 Structural Features of Existing River Infrastructures
Intensive water resources development in the Jeneberang River basin has been undertaken since
the 1970’s in line with the national economic development policy. As a result many relevant
infrastructures have been constructed (refer to Table 7.1 and Figures 7.1 and 7.2). The total
investment for water resources development is about Rp.935 billion, which includes Rp.668
billion for water sources and distribution, Rp.166 billion for flood control and Rp.101 billion for
watershed management as represented by sabo works. The cost breakdown for each of the major
river infrastructures is listed below.
Investment Cost and Completion Year of Existing River Infrastructures
Purpose Project/Facility Investment Cost (Rp. Million))
Completion Year
Bili-Bili Dam and Raw Water Transmission Main 442,815 /1 Dec. 1999 Rubber Dam 61,045 Dec. 1996 Long Storage 12,158 Nov. 2001 Diversion Weirs for Irrigation /2 152,216 Nov. 2004 /3
Water Source andDistribution
Sub-total 668,234
River Improvement & Drainage Improvement-I /4 96,469 Feb. 1992 Drainage Improvement-II /5 69,577 Dec. 2001 Flood Control
Sub-total 166,046
Sand Pocket Dam and Sabo Dam 101,185 Jan. 2001 Watershed Management Sub-total 101,185
Ground Total 935,465
/1 : Excludes cost for the on-going hydropower plant /2 : Bili-Bili, Bissua and Kampili Diversion Weirs /3 : Scheduled /4 : For Drainage System of Jongaya-Panampu-Sinrijala /5 : For Drainage System of Pampang
Among others, the major structures used for water sources and distribution in the Jeneberang
River basin are represented by Bili-Bili Multipurpose Dam, Rubber Dam, Long Storage and the
three diversion weirs, namely Bili-Bili, Bissua and Kampili Weirs within the Bili-Bili Irrigation
System. There are also a variety of riparian structures and urban drainage facilities for flood
mitigation along the lower Jeneberang River. Five sand pocket dams and three sabo dams in the
upper reaches of Bili-Bili dam also function to minimize the sediment inflow into Bili-Bili dam
reservoir. The principal features of these infrastructures are described below (refer to Supporting
Report-E for detailed structural features):

The Study on Capacity Development for Jeneberang River Basin Management
Nippon Koei Co., Ltd. 7-2 Final Report, Volume II CTI Engineering International Co., Ltd. Main Report
(1) Bili-Bili Multipurpose Dam
Bili-Bili Dam was constructed from 1992 to 1999 for the purposes of flood control, municipal
water supply, irrigation water supply and preservation of sustainable river maintenance flow. The
dam has a catchment area of 384.4 km2, which occupies almost half the entire basin area (762km2),
and an effective storage capacity of 346 million m3. The latter is divided into 41 million m3 for
flood control of the downstream reach of Jeneberang River and 305 million m3 is reserved as a
water source for irrigation, municipal water and river maintenance flow in the lower reaches of
the Jeneberang River.
An additional facility of Bili-Bili Dam, the Raw Water Transmission Main (RWTM), was
constructed in 1996 in order to transfer raw water for municipal supply through a single pipeline.
This is about 17km in length and extends from Bili-Bili Dam to the existing downstream water
treatment plant (named Somba Opu). The maximum transfer capacity is 3.3m3/s.
A hydrological telemetric gauging network was also constructed from 1997 to 1999 in order to
facilitate the monitoring by Bili-Bili Dam Control Office of hydrological conditions in
Jeneberang river basin. This network comprises three rainfall gauging stations, four rainfall/water
level gauging stations (including one reservoir level gauging station) and three water level
gauging stations.
Moreover, the hydropower generation plant (Bili-Bili HEPP) will be completed in November
2005 at the tailwater of Bili-Bili Dam. As Bili-Bili dam does not provide an exclusive storage
capacity for hydropower generation, the power plant could generate power only through
discharge drawn from the dam reservoir to meet downstream water requirements. The rated
capacity and annual energy of the power plant will be 20MW and 77GWh, respectively.
(2) Rubber Dam
An inflatable rubber dam with a width of 210m and height of 2.0m was constructed across the
Jeneberang River 3.65km upstream of the river mouth. The principal function of the rubber dam is
to prevent the intrusion of saline water into the Jeneberang River, and at the same time to stabilize
the riverbed fluctuations.
(3) Long Storage
An old channel about 4km upstream of the river mouth was isolated on the right-bank of the
Jeneberang River through the “Lower Jeneberang River Channel Improvement Project”.
Referred to as “Long Storage”, it is connected with the main stream of the Jeneberang River and
has an effective storage capacity of 1.6 million m3 for storage of water diverted from Jeneberang
River. Long Storage is used as: (a) the water supply source for municipal water demand in
Makassar City, (b) the water source to dilute flows in the primary drainage channels in Makassar
City and (c) an amenity space.

The Study on Capacity Development for Jeneberang River Basin Management
Nippon Koei Co., Ltd. 7-3 Final Report, Volume II CTI Engineering International Co., Ltd. Main Report
(4) Diversion Weirs for Bili-Bili Irrigation System
As a part of Bili-Bili Irrigation Project, the following three diversion weirs were completed as at
November 2004: (a) Bili-Bili Weir placed just downstream of Bili-Bili Dam, (b) Bissua Weir 7km
downstream of Bili-Bili Dam, and (c) Kampili Weir 11km downstream of Bili-Bili Dam. These
weirs divert the necessary water for the following irrigation areas:
Intake Discharge through Intake Weirs of Bili-Bili Irrigation
Name of Weir Intake Discharge (Annual Maximum) (m3/s)
Irrigation Area (ha)
Bili-Bili 4.7 2,360 Bissua 25.0 10,758 Kampili 17.5 10,545
(5) Riparian Structures
River channel improvements along an approximate 9.5km length of the river from the mouth to
Sungguminasa Bridge was implemented from 1988 to 1992. This was part of the “Lower
Jeneberang River Improvement Project” and was constructed to control a design flood discharge
with a 50-year return period in conjunction with the flood control effect of Bili-Bili Dam. The
major structural components of the Project are river dikes about 21 km in total along both right
and left banks, revetments some 8,786 m long, two groundsills, one jetty about 300 m in length at
the river mouth, and 14 sluices.
(6) Urban Drainage Facilities in Makassar City
The storm rainfall in the lowland area in Makassar City (about 64.3km2) is drained through four
primary drainage channels about 33km in length, namely Jongaya, Panampu, Sinrijala and
Pampang (refer to Figure 7.1). The Jongaya, Panampu and Sinrijala channels were completed as
part of the above “Lower Jeneberang River Improvement Project” during the period from 1992 to
1993, while Pampang channel was constructed from 1997 to 2000. All drainage channels were
designed for the 20-year return period flood. The Pampang drainage channel is based on pumping
drainage and has a capacity of 6m3/s, while the remainder are gravity drainage channels.
Jongaya channel is connected to the “Long Storage” through a flush gate, and is also connected to
the Panampu and Sinrijala primary channels (refer to Figure 7.1). During a dry season, the flush
gate is occasionally opened to release the water stored in the Long Storage into the drainage
channels in order to dilute stagnant water in the drainage.
(7) Sand Pockets and Sabo Dams
Five sand pocket dams and three sabo dams were constructed in the upper reaches of Bili-Bili dam
from 1997 to 2001 in order to mitigate the sediment inflow into the Bili-Bili dam reservoir and at
the same time contribute to prevention of the local sediment disaster. However, one sand pocket
dam (“Sand Pocket No.4”) and one sabo dam (“Sabo Dam No.4”) were damaged by the

The Study on Capacity Development for Jeneberang River Basin Management
Nippon Koei Co., Ltd. 7-4 Final Report, Volume II CTI Engineering International Co., Ltd. Main Report
extraordinary flood in January 2002. Sabo Dam No.4, which is the most upstream of the existing
sand pocket and sabo dams, was seriously damaged and abandoned. Sand Pocket No.4 is,
however, to be rehabilitated in 2005.
7.1.2 Power Supply System to River Infrastructures in Jeneberang River Basin
The PLN is the State Electric Company undertaking commercial electric power supply
throughout Indonesia. Most river infrastructures in Jeneberang river basin are connected with the
following three 20 kV PLN feeders as their main power supply sources (refer to Figure 7.3):
PLN Feeders Connected to Water Resources Facilities in Jeneberang River Basin
Name of Feeder Number of Circuits Water Resource Facilities Connected to Feeder
Kampili Feeder Single Circuit Kampili Irrigation Weir Rindam Feeder Single Circuit Bissua Irrigation Weir
GMTDC feeder Double Circuit
Rubber Dam Intake Gate for Long Storage Tidal Gate for Long Storage Pampang Pumping Station
Electric power failures have occasionally occurred in South Sulawesi. The number of trips and
duration of electric power failures of the above three feeders from 2001 to 2003 are listed below:
Electric Power Failure in Jeneberang River Basin
Year Name of Feeder
Trip of Power Failures (times)
Duration of Power Failure (min.)
Unsupplied Power (kWh)
Kampili 3 86 60 Rindam 145 1,101 14,192 2001GMTDC 15 94 1,125 Kampili 26 461 609 Rindam 193 2,911 36,342 2002GMTDC 57 200 6,784 Kampili 9 306 387
Rindam 190 1,452 23,349 2003
GMTDC 81 365 10,542 Kampili 13 284 352 Rindam 176 1,821 24,628 Ave. GMTDC 51 220 6,150
Source : PLN information dated October 2004
As listed above, Rindam Feeder in particular is estimated to have failed as a power supply every
two days on average (=365days/176trips), with each of failure continuing for around 10 minutes
(=1,821minutes/176 times). On the other hand, failure of power supply by the other two feeders is
far less than for the Rindam Feeder. Among the river infrastructures, Bissua Irrigation Weir is
connected to Rindam feeder, and therefore, its diesel engine generator would play a more
important role as an emergency source of power supply than for other irrigation weirs.
Bili-Bili Dam and Bili-Bili Irrigation weir currently use the internal micro-hydro power plant,
which is managed by JRBDP as the dam operator. This has an installed capacity of 325kVA. The
micro-hydro power plant is equipped with a ballast load governor system, which functions to
control a constant power load on the plant. However, this governor system currently does not

The Study on Capacity Development for Jeneberang River Basin Management
Nippon Koei Co., Ltd. 7-5 Final Report, Volume II CTI Engineering International Co., Ltd. Main Report
function well, and the frequency and voltage supplied by the micro-hydro power plant is not
stable, which could in turn lead to damage to the electric equipment. Due to this defect, the main
power source of Bili-Bili Dam and Bili-Bili irrigation weir is going to shift to the Bili-Bili HEPP
upon its completion in November 2005.
7.2 Present River Management in Jeneberang River Basin
7.2.1 Water Quantity Management
The present practices relevant to the water quantity management for Jeneberang River are as
described below:
(1) Present Water Users and Water Requirement
Almost the entire water demand sourced from the Jeneberang River currently depends on a stable
supply based on flow control by Bili-Bili dam reservoir. The water supply capacity of Bili-Bili
Dam (i.e. 305 million m3) was originally designed to meet full supply for a diversion water
requirement of about 541 million m3/year during a 5-year drought (i.e., a drought year with a
5-year return period). However, some of the requirements programmed at the time of dam design
have not yet taken place. As a result, the updated diversion water requirement is limited to about
490 million m3/year. This includes irrigation by the on-going Bili-Bili Irrigation Project (about
382 million m3/year). Due to this limitation in the diversion water requirement, Bili-Bili dam
reservoir could meet full supply for the updated water requirement during a 10-year drought. This
is far higher than the design supply level (based on a 5-year drought) referred to in Chapter 6. The
detailed breakdown of the water requirement originally programmed and the now updated value is
listed below:
Annual Diversion Water Requirement Dependent of Water Source of Bili-Bili Dam Original Program Updated
Item of Water Demand (m3/s) (m3 million/year) (m3/s) (m3 million/year)
1. Municipal Water Demand 1.1 PDAM Makassar*1 3.30 104.07 1.97 54.30 1.2 PDAM Gowa 0.10 3.15 0.19 6.00 2. Demand for Private Factory 2.1 Takalar Sugar Factory 0.40 12.61 0.50 15.77 2.2 Gowa Paper Mill 0.25 7.88 0.00 0.00 3. Irrigation Water Demand*2 Variable 381.70 Variable 381.70 4. Maintenance Flow 1.00 31.54 1.00 31.54
Total 540.95 489.31
Note *1: Of the WTPs owned by PDAM Makassar, Panaikang WTP takes the entire raw water (1,000 liter/sec)from Lekopancing weir throughout the rainy season, and half (500 liter/sec) from Jeneberang Riverduring the dry season.
*2: The irrigation water demand will occur upon completion of the on-going Bili-Bili Irrigation Project. The target completion time was set at November 2004.
The Provincial Regulation of South Sulawesi on November 8, 1991 prescribes that all surface
water abstraction is subject to formal permission of the Governor of South Sulawesi Province. In
accordance with the Regulation, Takalar Sugar Factory, as one of the water users of Jeneberang

The Study on Capacity Development for Jeneberang River Basin Management
Nippon Koei Co., Ltd. 7-6 Final Report, Volume II CTI Engineering International Co., Ltd. Main Report
River, had acquired the formal permit for water abstraction from the Governor. However, other
water users are not likely to acquire any formal document/list regarding permitted water
abstraction, and the above updated water demand is substantially handled as a customary use right.
This implies the water requirement of water users is based on the agreement between JRBDP, as
the dam operator, and the water users. This would be attributed to a particular background in
which Bili-Bili Dam still reserves enough supply capacity for the updated water demand, and
therefore, there has been little need to introduce the formal permit.
In addition to above major water users, upstream village irrigators are also outlined as water users
(refer to Chapter 3). Official permission for water use for village irrigation has never been issued.
Nevertheless, village irrigation has always been managed by traditional leaders through general
community agreement, and therefore, could be regarded as the customary water use right.
Moreover, the abstraction volume of village irrigation is presumed to be far smaller than those of
large-scale irrigation schemes in the lower reaches. This reflects the return of a substantial part of
the abstracted irrigation water to the river due to the hilly/mountainous topography in the area of
village irrigation. Accordingly, village irrigation would not have a substantial influence on the
downstream flow regime or the inflow regime to the Bili-Bili Dam reservoir.1
(2) Present Water Distribution System
JRBDP currently distributes the water necessary to meet downstream water demand through
operation of Bili-Bili Dam reservoir, and other water distribution facilities such as the Raw Water
Transmission Main, intake for Long Storage and Rubber Dam. Water distribution is not, however,
made appropriately due to the following causes and/or defects of monitoring devices:
(a) Bili-Bili Irrigation Project, which is the largest water user of Jeneberang River, has not
commenced and substantial operations. Therefore, Bili-Bili Dam still retains enough supply
capacity to meet downstream water demand with little need to introduce a more precise
water distribution system.
(b) The existing telemetry gauging network for the river water level is essential to monitor the
natural flow discharge and to determine necessary water distribution to meet downstream
requirements. The telemetry gauging monitoring is, however, currently not operational due
to defects at one of the telemetry gauging stations.
(c) H-Q rating curves at the existing telemetry water level gauging stations are also essential to
estimate natural river discharge based on gauged river water levels. However, such curves
have not been updated since they were originally developed in 1999 and there reliability is
now judged to be extremely low.
(d) No definite institutional setup exists to coordinate and define the daily water distribution
1 Moreover, the present estimate of water resources of both Jeneberang and Jenelata Rivers is based on hydrological records taken
at points downstream from village irrigation schemes. Therefore present assessment of water resources has already taken into
account the water abstraction by and return flow from the upstream village irrigations.

The Study on Capacity Development for Jeneberang River Basin Management
Nippon Koei Co., Ltd. 7-7 Final Report, Volume II CTI Engineering International Co., Ltd. Main Report
2,200 m3/s
1,200 m3/s1,100 m3/s Jenelata River
2,300 m3/s
2,300 m3/s
2,300 m3/s
Bili-Bili Dam
Sungguminasa Bridge
Bifurcation Point
River Mouth0 m3/s
Flood Design Discharge (50-year Return Period) of Jeneberang River
volume among JRBDP, which is the present operator of facilities for water distribution, the
various water users and the relevant coordination committees such as PTPA and PPTPA. The
downstream water requirement is informed to JRBDP at irregular intervals and by indefinite
water users.
(4) Drought Management
As described above, Bili-Bili Dam still retains sufficient supply capacity to meet downstream
water demands, and Jeneberang River has not experienced a serious drought since Bili-Bili Dam
started reservoir operations in 2000. Due to these conditions, a definite drought management
system for Jeneberang River including the following items has not yet been established. A
drought management program has also never been implemented since Bili-Bili Dam was
completed in 1999:
(a) Priority of water supply during drought period;
(b) Updating of the Reservoir Operation Curve, which defines daily reservoir operation and
water level during the drought period; and
(c) Definite procedures to coordinate and determine reduction rate of water supply during the
drought period.
7.2.2 Flood Management
The low-lying flood plain area spreads out in the densely populated areas of Makassar and
Sungguminasa City downstream of Sungguminasa Bridge. In order to reduce the risk of flood
overflow from the Jeneberang River to the flood plain area, river channel improvements have
been implemented along a 9.5km stretch from
the river mouth up to Sungguminasa Bridge.
The improved river section currently has a
flow capacity of 2,300m3/s.
Following river channel improvement,
Bili-Bili dam was constructed in 1999. This
provides a flood control capacity of 41 million
m3 between the Normal Water Level (EL.
99.5m) and the Surcharge Water Level (EL.
101.60m). The flood control capacity of
Bili-Bili dam was planned to control the flood
discharge of the 50-year return period event
along the river improvement section, at the
same time maintaining a river flow capacity of
2,300m3/s (refer to the flood design discharge
as shown in the Figure to the right).

The Study on Capacity Development for Jeneberang River Basin Management
Nippon Koei Co., Ltd. 7-8 Final Report, Volume II CTI Engineering International Co., Ltd. Main Report
Two large floods occurred after completion of Bili-Bili dam reservoir, in February 2000 and
February 2002. The flood in February 2000 resulted in a peak dam inflow discharge of 1,670m3/s.
The gauged data of dam inflow discharge and flood runoff discharge of Jenelata River shows that
if no flood control were available through Bili-Bili dam reservoir, the peak discharge at
Sungguminasa Bridge would have reached 2,560m3/s, exceeding the channel river flow capacity
of 2,300m3/s. The actual flood control by Bili-Bili dam was, however, executed in accordance
with the specified gate operation procedures. As a result the release from Bili-Bili dam peaked at
only 900m3/s and used a flood control capacity of 14.6 million m3. As a result, the actual peak
discharge at Sungguminasa Bridge was controlled and reached only 1,650m3/s (refer to Figure
7.4).
During the other flood in February 2002, Bili-Bili dam recorded a peak dam inflow of 1,960m3/s.
This corresponds to a flood with around a 25-year return period and was much larger than the
event in 2000. During this flood, the water level gauging station on Jenelata River was washed
away, and therefore the peak runoff discharge from the river is unknown. Nevertheless, the peak
discharge released from Bili-Bili dam was limited to 850m3/s, and any flood overflow of the
Jeneberang River was not reported.
Judging from the operation records of Bili-Bili dam as described above, the present flood control
operation for Jeneberang River is properly executed. The present flood control is, however, only
possible for floods less than the design level (50-year return period) and no counter measures
against more extreme floods exist. In order to minimize flood damage, including the death of
people, during such extreme flood events, it is indispensable to formulate an emergency flood
warning, fighting and evacuation system.
7.2.3 Control of River Area
“Government Regulation No. 35/1991” and “Provincial Regulation of Government of South
Sulawesi No.5/1999” stipulated that the “River Borderline”, as the outward river boundary to be
managed by the river administrator, should cover the following areas:

The Study on Capacity Development for Jeneberang River Basin Management
Nippon Koei Co., Ltd. 7-9 Final Report, Volume II CTI Engineering International Co., Ltd. Main Report
Legal Outward Boundary of Jurisdiction by River Administrator
English Term Indonesian Term Definition
River Utilization Area
Daerah Manfaat Sungai
The area including: - Water Body: Whole extent of river, lake, and dam
reservoir; - River Corridor: A certain extent of land along the water
body, which has been acquired by the river administrator for the sake of river management; and
- River Retention Area: A certain extent of land, which has been acquired by the river administrator for the specific purpose of flood control.
River Control Area Daerah Penguasaan Sungai
The area including: - River Corridor: A certain extent of land along the water
body, which is important for river administration but has not been acquired by the river administrator;
- River Retention Area: A certain extent of land, which is retained as the future flood control work but has not been acquired by the river administrator.
- Flood Plain: The potential flood inundation area in a certain scale of flood*.
* A probable flood of 50-year return period was applied in south Sulawesi Province Note: The above English terms are based on literal translation of Indonesian terms
Of the above terms, the “Flood Plain” under the “River Control Area” is hardly defined due to
difficulties in estimating the extent of the potential flood inundation area. Moreover, the “Flood
Plain” in Jeneberang river basin would extend over a substantial part of Makassar City, where it is
difficult to demarcate the administrative authorities of the local government and the river
administrator. Due to this background, JRBDP, Dinas PSDA and any other present river
administrative agencies do not currently possess any administrative authority over the flood plain
in Jeneberang river basin.
It is further noted that there does not exist any “River Retention Area” under both River
Utilization Area and River Control Area in Jeneberang River. As a result, the current potential
area under jurisdiction of the river administrator would be limited to the Water Body and River
Corridor both for the River Utilization Area and River Control Area.
The border of the River Corridor (i.e., the cross-sectional borders of the river area to be managed
by the river administrator) is defined in accordance with the above Government and Provincial
Regulations as listed below (refer to Figure 7.5):

The Study on Capacity Development for Jeneberang River Basin Management
Nippon Koei Co., Ltd. 7-10 Final Report, Volume II CTI Engineering International Co., Ltd. Main Report
Borderline of River Corridor
Type of Water Body Borderline of River Corridor
River with dike in urban area 3m from edge of dike
River with dike in non-urban area 5m from edge of the dike
Major river (A>500km2) without dike in non-urban area 100m from the river bank
Minor river (A<500km2) without dike in non-urban area 50m from the river bank
Bili-Bili dam reservoir Both of: The land around the reservoir, which has a ground level between NWL and SWL of Bili-Bili Dam* The land around the reservoir 50 m in distance from the shoreline of reservoir at NWL**
* : The land acquired by JRBDP as the dam operator. ** : The land as specified in the Provincial Government Regulation.
As described in Subsection 7.1.1, a river dike of about 9.5km in length was constructed along the
main stream of Jeneberang River from the river mouth to Sungguminasa. The hinterland along the
river dike is the urban area of Makassar and Sungguminasa. Accordingly, the extent of 3m from
the edge of the river dike should be defined as the outer bound of the River Corridor. Likewise,
upstream of the river channel improvement section is classified as the “major river without dike in
non-urban area”; the 100m extent from the riverbank could be regarded as the outer bounds of the
River Corridor.
JRBDP is currently responsible, as the affix of Ministry Public Works (MPW; former MSRI), to
control these river corridors as well as their extent between the right and left dikes/banks.
However, regular inspection of land use activities in the river area is hardly implemented. As a
result, illegal activities such as sand mining without permit licensing and construction of houses
in the river corridor are often seen along Jeneberang River.
7.2.4 Operation and Maintenance of River Infrastructures
The present practices relevant to the operation and maintenance of river infrastructures in
Jeneberang river basin are described below:
(1) Jurisdiction for O&M Works of Facilities
JRBDP has been the implementing body for construction of all existing river infrastructures in
Jeneberang river basin for over 14 years during which it has accumulated knowledge on the
structures and/or their relevant mechanical facilities. Due to this background, JRBDP has
prepared O&M manuals for the facilities and a substantial part of O&M works are also now being
undertaken by JRBDP. JRBDP is, however, the affix of MPW (the former MSRI), and, therefore,
O&M works in the Jeneberang River basin are apparently now under the jurisdiction of the central
government. Due to the current national policy of decentralization, Dinas PSDA as the affix of the
provincial government has begun to partially overtake the supervisory authority of JRBDP.
Nonetheless, the boundary of supervisory authority between the Ministry of Public Works and

The Study on Capacity Development for Jeneberang River Basin Management
Nippon Koei Co., Ltd. 7-11 Final Report, Volume II CTI Engineering International Co., Ltd. Main Report
Dinas PSDA is not clear for JRBDP. The responsibility for O&M works will further shift to the
provincial and local governments.
(2) Present Activities of JRBDP for O&M of Facilities
The O&M works for the existing river infrastructures are currently implemented by 52 staff
members of JRBDP. The staff belongs to two (2) sections of JRBDP, namely “Jeneberang Water
Resources Development and Management (PPSA)” and “Raw Water Development (PAB)”. The
annual budget of JRBDP in 2004 was Rp. 88 billion, of which Rp. 78 billion (89%) was allocated
to water resources development. Thus, the present works by JRBDP are oriented to development
work rather than O&M work. The budget of JRBDP from 2000 to 2004 are outlined below:
Budget of JRBDP for its Whole Administration Area in 2000 to 2004 (Unit: Rp. million)
Item 2000 2001 2002 2003 2004
Administration 853 897 1,633 1,181 1,483 Guidance/Planning 0 0 4,000 2,656 2,160 Development 80,177 18,601 4,728 16,662 78,465 Maintenance/Management 1,551 1,768 4,315 7,586 6,136
Total 82,582 21,266 14,676 28,085 88,245
The budget for maintenance/management for the whole area of jurisdiction for JRBDP has
gradually increased from Rp. 1,551 million in 2000 to 7,586 million in 2003, although the budget
slightly reduced from 2003 to 2004. Of the maintenance/management cost, the cost for
Jeneberang River basin is summarized below:
Budget of JRBDP for O&M Works in Jeneberang River Basin in 2000 to 2004 (Unit: Rp. million)
Item 2000 2001 2002 2003 2004
O&M for Bili-Bili Dam 0 0 114 857 798
Rehabilitation of River Embankment 144 168 0 0 0
O&M for Rubber Dam/Drainage System 26 38 50 70 118
O&M for Raw Water Transmission Main 30 36 50 102 38
O&M for Long Storage 31 27 0 300 0
Total 230 268 214 1,329 954
As listed above, the cost for O&M works in Jeneberang river basin increased significantly in 2003
due to commencement of O&M for Bili-Bili dam. The O&M cost for Bili-Bili dam accounted for
about 65% of the total O&M cost in 2003 and 84% in 2004. A rather substantial and continuous
O&M cost has also been allocated to the Rubber Dam/Drainage System (Pampang Pumping
Station) and RWTM. In contrast to these river infrastructures, however, the sand pocket dam /sabo
dams and riparian structures such as river revetments, groynes and groundsills are not likely to
have received any notable O&M work. Thus, the present O&M works are deemed to be
inadequate.

The Study on Capacity Development for Jeneberang River Basin Management
Nippon Koei Co., Ltd. 7-12 Final Report, Volume II CTI Engineering International Co., Ltd. Main Report
7.3 Present River Management by PJT I and PJT II in Brantas and Citarum Basins
The present practices for river management by PJT1 and PJT II could be useful references for
formulation of a river management plan by the new Public Corporation for Jeneberang River.
From this point of view, they were reviewed through this Study with the results being summarized
below.
7.3.1 Overview of Management
PJT I and PJT II currently undertake river basin management within the following working areas:
Working Area of PJT I and PJT II
Item PJT-I PJT-II
Name of objective river basin Brantas and Bengawan Solo Citarum and Ciliwung-Cisadane Extent of catchment area 32,125 km2 12,000 km2
Number of rivers managed 64 74
Both PJT I and PJT II currently undertake comprehensive river basin management in the above
working areas. This includes: (1) management of river infrastructures, (2) water quantity and
quality management, (3) flood control management, and (4) river environmental management.
However, there exists a distinct difference in the major concerns of river basin management by
PJT I and PJT II.
PJT II directly undertakes management of hydropower generation and irrigation, which includes
management for all primary, secondary and tertiary canals. On the other hand, PJT I takes a role in
the supply of raw water, but management of hydropower plant as well as irrigation facilities
(except intake weirs on the river) are the responsibility of PLN and Balai PSDA, respectively.
PJT I also plays an important role in the control of negative impacts resulting from floods,
sediment runoff and water pollution. Thus, the principal scope of river basin management by PJT
I is oriented to more comprehensive river basin management, while that by PJT II is to increment
the efficiency and effectiveness of the existing production infrastructures for hydropower
generation and irrigation.
The major issues for river basin management in Jeneberang river basin are associated with raw
water supply rather than management of hydropower generation and irrigation. From this
viewpoint, the actual guidelines, procedures and/or manuals used for river basin management by
PJT I serve as a better reference for management by the water corporation in Jeneberang river
basin.
PJT I has prepared the basic procedures and job instructions certified by ISO 2000 for river basin
management. The procedures and job instructions contain 66 items of categories related to river
basin management including the procedures for O&M works. These were evaluated as being
useful as a reference for preparation of O&M manuals for the water cooperation of Jeneberang
River.

The Study on Capacity Development for Jeneberang River Basin Management
Nippon Koei Co., Ltd. 7-13 Final Report, Volume II CTI Engineering International Co., Ltd. Main Report
7.3.2 Water Quantity Management
PJT I simulates the water supply capacity of water resource development facilities based on
updated water requirements in the year and the gauging record of reservoir water levels and dam
inflows over the last six months. Based on the results of simulation, PJT I prepares a water
allocation plan at the end of every dry and rainy season. The water allocation plan is submitted to
PTPA and Dinas PSDA, and finally approved by the Vice-Governor.
In a drought year, the water demand is not fully supplied and is curtailed to a certain level in
accordance with the water allocation plan. In fact, Brantas river basin has suffered from a critical
drought and water demand has not been fully supplied for the last five years.
The priorities of water supply in a drought year are given in accordance with the “Law No. 11 in
1974” to the following water uses: (1) First priority for domestic & municipal water use, (2)
Second priority for water use for agriculture, animal husbandry, plantation and fishery, and (3)
Third priority for water use for energy, industry, mining, navigation and recreation.
7.3.3 Flood Management
PJT I prepares the “Annual Emergency Action Plan for Flood” once a year and submits to Dinas
PSDA, Kabupatens and Committee for Flood Fighting, which is chaired by the Governor, at the
end of every dry season. The plan contains the following items, which could be used for flood
evacuation and flood fighting:
(1) Areas and residents in danger of flooding, which are identified through inspection of the
river structures as well as land use on the floodplain;
(2) Available communication measures to the residents in danger of flooding;
(3) Procedures for flood forecasting and issue of flood warning, and
(4) Procedures for flood evacuation and flood fighting.
7.3.4 Management of River Infrastructures
Both PJT I and PJT II operate and maintain a full variety of river infrastructures including dam
reservoirs, diversion weirs, intake facilities, check dams, and river structures such as groundsills,
groynes and levees. Among others, PJT I operates eight dams, including Wonogi dam reservoir
(storage capacity of 440 million m3) in Bengawan Solo river basin, and Karankates dam reservoir
(storage capacity of 232.5 million m3) in Brantas river basin. These dams aim to provide some 390
million m3 of raw water for municipal use. In the Citarum river basin being managed by PJT II,
three (3) major dam reservoirs exist, namely: Jatiluhur (storage capacity of 3 billion m3), Cirata
(2.2 billion m3) and Saguling (1 billion m3). These dam reservoirs contribute hydropower
generation based on an installed capacity of 1,888 MW. PJT II is responsible for O&M of
Jatiluhur dam.

The Study on Capacity Development for Jeneberang River Basin Management
Nippon Koei Co., Ltd. 7-14 Final Report, Volume II CTI Engineering International Co., Ltd. Main Report
O&M manuals written in Indonesia for all of the major river infrastructures have been prepared
and updated through several revisions. The revisions are based on the difficulties encountered and
the countermeasures taken in the actual O&M works. These could serve as references for O&M of
water resources facilities in Jeneberang river basin.
7.3.5 Water Quality Management
Both PJT I and II sample river discharge as well as effluent from factories and analyze the water
quality at their own laboratories. They also monitor the water quality of effluent from factories
and collect a monitoring/testing fee from the factories. Based of the results of water quality
monitoring, PJT I and II implement improvement works for water quality through releasing a
river maintenance flow and/or de-clogging of solid wastes accumulated in the river channels.
Nevertheless, they do not possess any legal capacity to enforce or control the effluent from the
factories acting as point pollutant sources.
7.4 Proposed Water Quantity Management Plan for Jeneberang River Basin
7.4.1 Water Allocation Plan
JRBDP has granted an annual water requirement of 489.39 million m3/year in total to be diverted
from Jeneberang River. This granted diversion water requirement could be regarded as the
customary water use right and adopted as the basis of water quantity management by the Public
Corporation. The breakdown of this granted water requirement is listed below (refer to Table 7.2
and Figure 7.6).
Granted Annual Diversion Water Requirement from Jeneberang River
Municipal Water Demand*1
Irrigation Water Demand *2
Takalar Sugar Factory Demand
River Maintenance. Flow
Monthly Total Month
106m3 m3/s 106m3 m3/s 106m3 m3/s 106m3 m3/s 106m3 m3/s
Jan. 4.45 1.66 23.56 8.80 1.34 0.50 2.68 1.00 32.03 11.96Feb. 4.02 1.66 0.00 0.00 1.21 0.50 2.42 1.00 7.65 3.16Mar. 4.45 1.66 0.00 0.00 1.34 0.50 2.68 1.00 8.47 3.16Apr. 4.31 1.66 57.36 22.13 1.30 0.50 2.59 1.00 65.56 25.29May 5.79 2.16 79.46 29.67 1.34 0.50 2.68 1.00 89.27 33.33Jun. 5.60 2.16 76.74 29.61 1.30 0.50 2.59 1.00 86.23 33.27Jul. 5.79 2.16 72.33 27.01 1.34 0.50 2.68 1.00 82.14 30.67
Aug. 5.79 2.16 36.53 13.64 1.34 0.50 2.68 1.00 46.34 17.30Sep. 5.60 2.16 19.66 7.59 1.30 0.50 2.59 1.00 29.15 11.25Oct. 5.79 2.16 12.21 4.56 1.34 0.50 2.68 1.00 22.02 8.22Nov. 4.31 1.66 0.00 0.00 1.30 0.50 2.59 1.00 8.20 3.16Dec. 4.45 1.66 3.86 1.44 1.34 0.50 2.68 1.00 12.33 4.60Total 60.35 381.70 15.79 31.54 489.39
According to results of the water demand-supply balance simulation, the supply capacity of
Bili-Bili Dam reservoir will be barely able to meet the water demand in 2018. At that time,
The Study on Capacity Development for Jeneberang River Basin Management
Nippon Koei Co., Ltd. 7-15 Final Report, Volume II CTI Engineering International Co., Ltd. Main Report
shortage in water supply capacity to meet water demand will occur in a 5-year drought due to the
incremental increase in municipal water demand (refer to Chapter 6). Hence, in order to ensure
the present water demand against future incremental demands, and to establish more effective and
fair rules over water allocation, a water use right (WUR) is necessary for Jeneberang River. From
this viewpoint, it is proposed that the WUR should be granted to the above updated diversion
water requirement of 489.39 m3 million/year, since it prevails over general community
recognition and therefore could be accepted as the customary water use. The proposed WUR
would be based on the following concepts:
(a) The reservoir capacity of Bili-Bili dam could currently ensure full supply of the WUR both
for municipal and irrigation water against a 10-year drought. However, the marginal drought
safety level of the WUR for irrigation water use in particular should be set at the 5-year
return period. Therefore, Bili-Bili dam reservoir capacity still possesses excess supply
capacity for the present WUR.
(b) The excess supply capacity of Bili-Bili dam reservoir should be reserved to secure future
incremental municipal water demand as an essential social need. According to the water
supply-demand simulation, the reservoir capacity of Bili-Bili Dam would still meet full
supply of the future 2018 municipal water demand (133.5 million m3 and a maximum of
4.52 m3/s) assuming the marginal drought safety level associated with a 5-year return period
for irrigation water use (refer to Chapter 6).
(c) Water requirement for irrigation use is variable each year depending on rainfall. Moreover,
the cropping schedules occasionally change, which also influences the variation in water
requirements for irrigation. Thus, the actual water requirement for irrigation use is varied. In
due consideration of these changes, the WUR for irrigation water is provisionally proposed
on the basis of the following conditions:
The WUR should be limited to the above diversion water requirement of 381.7 million
m3/year granted by JRBDP.
The seasonal values of WUR should follow the standard cropping schedules for
Bili-Bili, Bissua and Kampili irrigation schemes.
The actual water distribution for irrigation requirement should be decided annually
through coordination with the irrigators, taking the above WUR grant into account.
7.4.2 Water Distribution Plan
In order to achieve a fair and effective water distribution for the above water allocation, the
following items are proposed.
(1) Monitoring of River Flow Regime and Water Abstraction Volume
The Public Corporation, as the river basin management agency, has an obligation to distribute
water for the requirement of the above WURs. In order to ensure the obligation, it is essential to

The Study on Capacity Development for Jeneberang River Basin Management
Nippon Koei Co., Ltd. 7-16 Final Report, Volume II CTI Engineering International Co., Ltd. Main Report
precisely monitor seasonal variations in both river discharge and requirement of water users, and
determine the appropriate water distribution based on the monitoring results. Such monitoring
works would be more crucial especially after completion of the on-going Bili-Bili irrigation
project.
From the above viewpoints, establishment of the monitoring system for the river flow and water
intake discharge is proposed. The proposed system is used to monitor: (1) inflow/outflow of dam
reservoir, (2) unregulated flow discharge from the Jenelata River, (3) river flow discharge below
major water intake points and (4) water abstraction volume at all intake points, where the WUR is
granted. Among these monitoring items, nos. (1) to (3) should be monitored by the Public
Corporation, and no. (4) by the water users under surveillance of the Public Corporation.
Proposed Monitoring System for River Flow Discharge and Water Use
Objectives of Monitoring Device for Monitoring Monitored by
(1) Inflow discharge to Bili-Bili dam reservoir
Dam Control and Monitoring System at Dam Control Office (Existing)
Public Corporation
(2) Outflow discharge from
Bili-Bili Dam reservoir
Dam Control and Monitoring System at
Dam Control Office (Existing) Public Corporation
(3) PDAM Intake to Somba Opu
WTP
Dam Control and Monitoring System at
Dam Control Office (Existing) Public Corporation
(4) Runoff discharge from Jenelata River
Dam Control and Monitoring System at Dam Control Office (Existing)
Public Corporation
(5) Flow discharge from Kampili
Weir
Dam Control and Monitoring System at
Dam Control Office (Existing) Public Corporation
(6) Overflow discharge of the lower groundsill (at K5.97)
Staff gauge Public Corporation
(7) Inflow discharge to Long
Storage Off-line gate opening gauge (exist) Public Corporation
Mo
nit
ori
ng
of
Flo
w D
isch
arg
e
(8) Overflow discharge of Rubber
Dam Water level gauge at Rubber Dam (Existing) Public Corporation
(9) PDAM Intake other than that
for Soma Opu Flow meter (To be newly installed)
PDAM Makassar
and Gowa
(10) Bili-Bili Irrigation System Staff gauge (Existing) Dinas PSDA
(11) Bissua Irrigation System Staff gauge (Existing) Dinas PSDA
(12) Kampili Irrigation System Staff gauge (Existing) Dinas PSDA
(13) Takalar Sugar Factory Flow meter (To be newly installed) Takalar Sugar Factory M
on
ito
rin
g o
f W
ater
Use
(14) River Maintenance Flow Estimate from (6), (7) and (8) above Public Corporation
The proposed monitoring network above includes water level gauging stations at Patarikan
Gauging Station on the Jenelata River and Kampili Gauging Station on the Jeneberang River. In
order to acquire precise information on the discharge from these water level gauging points, it is
essential to revise the H-Q rating curves at the end of every rainy season.

The Study on Capacity Development for Jeneberang River Basin Management
Nippon Koei Co., Ltd. 7-17 Final Report, Volume II CTI Engineering International Co., Ltd. Main Report
7.4.3 Procedures of Water Distribution
In order to achieve sustainable water distribution throughout the year, the following work
procedures for daily water distribution are proposed with reference to those currently applied by
PJT I:
(1) Preparatory Works
The Public Corporation should undertake the following preparatory works before the end of May
(the end of rainy season) and at the end of November (the end of dry season):
a) To check the updated water supply capacities/workability of water supply facilities,
which include the following items:
Bili-Bili dam reservoir,
PLN hydropower station,
Raw Water Transmission Main (RWTM);
Three irrigation intake weirs, namely, Bili-Bili, Bissua, and Kampili weir.
Rubber dam and intake/outlet facilities for Long Storage; and
PDAM intake facilities.
a) To check and repair all flow meters and hydrological gauging devices to be used to
monitor the daily operation of water allocation
b) To update the H-Q rating curves to be used to monitor the operation of the daily water
allocation, as discussed below
c) To forecast the meteorological conditions for the succeeding six months based on the
information from Meteorology and Geophysics Agency.
(2) Formulation of Water Allocation Plan
The Public Corporation should prepare a draft of the semi-annual water allocation plan at the end
of May (end of the rainy season) and at the end of November (end of dry season). The draft of the
plan should stipulate the updated water users and the seasonal variations of their water abstraction
volumes for the next six months.
The draft plan is to be submitted to, evaluated and finalized by the Water Resources Coordination
Committee (PTPA). PTPA would distribute the finalized semi-annual water allocation plan at
least four (4) days before commencement of the daily operation for water allocation to the
following relevant agencies:
a) Public Corporation
b) Dinas PSDA
c) Balai PSDA
d) PDAM Makassar

The Study on Capacity Development for Jeneberang River Basin Management
Nippon Koei Co., Ltd. 7-18 Final Report, Volume II CTI Engineering International Co., Ltd. Main Report
e) PDAM Gowa
f) Takalar Sugar Factory
g) PLN and
h) Other agencies as required
(3) Daily Operation for Water Distribution
Based on the above semi-annual water allocation plan, the Public Corporation should formulate
the daily operation plan for water distribution, stipulating the time schedule of operation, the
necessary personnel in charge and their duties. The Public Corporation is further required to
undertake the following works:
a) To prepare assignment schedules of staff to be engaged (including the gate operator,
observer/inspector, security force, telecommunications operator, etc.) every month;
b) To collect the bi-monthly water requirement from the following water users:
Balai PSDA, which estimates the water volume to be taken from three
irrigation weirs (Bili-Bili, Bissua, and Kampili) to their respective irrigation
areas taking into account the cropping schedules and effective rainfall;
Takalar Sugar Factory, which estimates the bi-monthly water requirement
necessary for sugar plantations and refining; and
PDAM Makassar and Gowa, which estimate the necessary water intake
volumes for their municipal water supply.
c) To estimate the possible discharge to be released from Bili-Bili dam reservoir to meet
downstream water demand twice monthly, based on the above water requirement, the
water storage volume stored in the reservoir and the necessary river maintenance flow.
d) To instruct PLN to release the discharge passing through the turbines of Bili-Bili
Electric Hydropower Plant in accordance with the above estimation.
e) To monitor and measure the results of daily water allocation.
f) To rearrange water allocation in accordance with Steps 1 to 3 for drought management
on the basis of approval by PTPA as described in the following Subsection 7.4.4, if
difficulties arise in fulfilling the requirement of water users as programmed in the
semi-annual water allocation plan due to the drought.
g) To compile the following records:
Daily reservoir operation record including daily water supply volumes to each
water user
Records of collection of water service fee from the users
h) To review the daily water allocation executed for the foregoing six months, and to
make the necessary revisions on the procedures for daily water allocation, as required.
The Study on Capacity Development for Jeneberang River Basin Management
Nippon Koei Co., Ltd. 7-19 Final Report, Volume II CTI Engineering International Co., Ltd. Main Report
7.4.4 Drought Management Plan
Bili-Bili dam reservoir is operated during normal years to fulfill the entire requirement for
downstream water use. However, should the dam unconditionally release its stored water in
accordance with downstream water requirements, the available supply capacity of the dam
reservoir could possibly drop to zero during an extreme drought year. This would cause a sudden
and drastic reduction in available water supply for the whole water use community.
According to the results of the water demand-supply simulation, of the 30 years from 1972 to
2001, three hydrological years2 in 1972/1973, 1982/1983 and 1997/1998 were identified as being
extreme drought years, that is with a recurrence interval of 10-years or more (refer to Figure 7.7).
During these three years, the dam supply capacity could not meet the entire requirement of the
allocated water demand.
The year of 1972/1973 in particular was recognized as being the most severe drought year, with
less rainfall throughout the rainy season. On the other hand, 1982/1983 and 1997/1998 resulted in
drought conditions only because the dry season lasted about one month longer than usual. If the
Bili-Bili Dam had maintained full supply of the allocated water demand in the year 1972/1973,
the low dam reservoir storage levels would have continued from the later half of June to the end of
November. On the other hand, in 1982/1983 and 1997/1998, the period of the low reservoir
storage was limited to less than one month.
During the above three drought years of 1972/1973, 1982/1983 and 1997/1998, the allocated
water demand could not be fully supplied, and a reduction in water supply would have been
required. In this connection, the priority of water supply and the procedures for its reduction in
drought years are proposed as being essential issues for drought management, as discussed below.
(1) Priority of Water Supply in Drought Years
The priority of supply during the drought years (those exceeding a 10-year return period) should
be given to municipal water supply and supply for river maintenance flow. These priority water
supplies are the basic need for communities, and the objective of reducing water supply in a
drought year should be addressed to the irrigation water supply.
(2) Updating of Reservoir Operation Curve
The Reservoir Operation Curve (RC) defines the lowest daily reservoir water level rule. The dam
operator is required to always maintain the reservoir water level (RWL) above RC so as to
facilitate drought management. The RC was developed as a curve, which envelops the overall
lowest daily reservoir water levels (RWLs) estimated. This was based on the water
2 The hydrological year is herein defined as a hydrological cycle of a year from the beginning of the dry season (June 1st) to the end
of the next rainy season (May 31st).

The Study on Capacity Development for Jeneberang River Basin Management
Nippon Koei Co., Ltd. 7-20 Final Report, Volume II CTI Engineering International Co., Ltd. Main Report
supply-demand simulation under the past low flow regimes from the period from 1972 to 2001,
excluding those in the above extreme drought years of 1972/1973, 1982/1983 and 1997/1998.
Thus, the RC is closely related to the allocated water demand and should be updated according to
every renewal of water allocation. However, the present Bili-Bili dam reservoir operation is based
on the RC established in 1993. No updating of the RC has been made despite changes in
downstream requirements of water users. In this connection, the RC was revised based on the new
water allocation as proposed in the above Subsection 7.4.1 and the past low flow regime from
1972 to 2001 (refer to Figure 7.8). The present and newly revised RCs are listed below. Detailed
reservoir operation plans based on the newly developed RC are described in item (3) below.
Present and Proposed Reservoir Operation Rule Curve
RC on the beginning of the Month (EL. m) Month
Existing Newly Proposed
May 99.0 84.0 Jun. 95.0 88.5 Jul. 88.0 84.0
Aug. 81.0 79.5 Sep. 74.0 75.0 Oct. 66.0 70.5 Nov. 65.0 66.0 Dec. 67.0 66.0
Note: The daily RCs are defined as the values interpolated from the above RCs at the beginning of each month.
(3) Procedures to Reduce Supply to Allocated Water Demand in Drought Years
The operator of the dam reservoir needs to firstly reduce the irrigation water supply in advance
before the RWL drops below the RC. In order to facilitate the appropriate reduction of water
supply, the basic concepts for the necessary procedures were provisionally determined as below:
Basic Concept on Procedures for Reduction of Water Supply
Step1: (Stand by)
A particular dam operation team against drought should be organized when the RWL and/or daily rate of reduction of RWL reach a certain designated level showing an initial incidence of drought. The team should undertake the following tasks: (a) to estimate the expected dam inflow discharge based the long-term weather forecast, (b) to inform the relevant water council and water users about possibility of reduction of irrigation water supply.
Step2: (Coordination)
When the RWL continues to drop at the critical rate, the dam operation team should estimate the necessary reduction of irrigation water supply and propose the estimated value to the water council and water users.
Step3: (Reduction of Irrigation Water Supply)
When the RWL reaches a certain critical level, the dam operation team should execute the necessary reduction of irrigation water supply as estimated in Step2.
Step4: (Stop of Irrigation Water Supply
When the RWL reaches RC, the dam operation team should totally stop the supply of irrigation water.
Based on the above concept, the definite procedures for reduction of water supply were further
examined through trial simulation for the low flow regime in the extreme drought years of

The Study on Capacity Development for Jeneberang River Basin Management
Nippon Koei Co., Ltd. 7-21 Final Report, Volume II CTI Engineering International Co., Ltd. Main Report
1972/1973, 1982/1983 and 1997/1998. As a result, the following drought management
procedures are proposed:
Proposed Procedures to Reduce Water Supply in Drought Years
Steps Approx. Leading
Time to Next Step
Flood Discharge/Water Level to Commence the Steps
Necessary Activities
Step1: Standby 10days {RWL < RC +2.0m} and The daily descending rate of RWL >0.25 m/day
Set up a dam operation team against drought Estimate the expected dam inflow discharge based on the long term weather forecast Inform the relevant water councils/committees and water users about possible reduction of irrigation water supply
Step2: Coordination 5days {RWL < RC + 1.0m} and The daily descending rate of RWL >0.25 m
Estimate the necessary reduction of irrigation water supply Propose the above estimated value to water council and water users
Step3: Reduction of Water Supply for Irrigation
2days {RWL < RC + 0.5m} and The daily descending rate of RWL >0.25 m
Execute the above estimated necessary reduction of irrigation water supply
Step4: Stop of Irrigation Water Supply
- When RWL = RC Reduce 100% of irrigation water supply
Step4 Stop of Whole Water Supply
- When RWL = LWL Reduce a certain volume of municipal water supply from dam reservoir
According to results of the water supply-demand balance simulation, the above-proposed
procedures for reservoir operation would require the following reductions of irrigation water
supply for dry paddy, wet paddy and palawija in case of the drought years experienced in
1972/1973, 1982/1983 and 1997/1998 (refer to Figure 7.9).
Simulated Necessary Reduction Rates of Irrigation Water Supply in Drought Year
Reduction Rate Rates of Irrigation water Drought Year
For Dry Paddy Palawija Wet Paddy 1972/1973 55% 100% 0% 1982/1983 0% 0% 20% 1997/1998 0% 100% 0%
Note: Irrigation Period for Dry Paddy = from June to September for Dry Paddy Irrigation Period for Palawija = from July to December Irrigation Period for Wet Paddy = from November to May
7.5 Proposed Flood Management Plan for Jeneberang River Basin
7.5.1 Plan for Flood Warning, Evacuation and Fighting
As described in the foregoing Subsection 7.2.2, the flood control capacity of Bili-Bili dam
reservoir as well as the river channel flow is limited to being able to cope with the 50-year return
period flood. Once floods exceed the design capacity, disastrous flood damage including death of
people is expected due to floods overflowing the river. Despite this, no flood warning and

The Study on Capacity Development for Jeneberang River Basin Management
Nippon Koei Co., Ltd. 7-22 Final Report, Volume II CTI Engineering International Co., Ltd. Main Report
evacuation plan exits against extreme floods above the design flood. Hence, the following flood
management plan was preliminarily delineated in this Study.
(1) Setup of Flood Warning Levels
The warning levels are classified into: (1) Step1 for Standby, (2) Step2 for Warning, and (3) Step 3
for Evacuation/Flood Fighting. These were determined based on the discharge/water levels
gauged using the following four principal telemetry stations (refer to Figure 7.10):
Principal Hydrological Gauging Stations for Flood Warning and EvacuationCritical Discharge to Initiate Each of Steps for Flood
Warning and Evacuation Name of Gauging
Station Hydrological Data to be Gauged
Step 1 Step 2 Step 3 Bili-Bili Dam Bili-Bili Dam Inflow Discharge 642.3m3/s 1,000.0m3/s 1,200.0m3/s Patarikan bridge Discharge of Jenelata River 400.0m3/s 900.0m3/s 1,100.0m3/s Kampili Weir Discharge of Jeneberang River 1,150.0m3/s 1,800.0m3/s 2,300.0m3/s Maccini Sombala Water Level Below Crown Level 1.5m (EL. 4.7m) 1.0m (EL. 5.2m) 0.6m (El. 5.6m)
Note: Step1 corresponds to the probable flood with about a 2-year return period, Step2 corresponds to the probable flood with about a 20-year return period Step3 corresponds to the probable flood with about a 50-year return period
In addition to the above principal gauging stations, there also exist several water level and rainfall
telemetry gauging stations that transmit their gauging data to the Dam Control Office and
Monitoring Office (refer to Figure 7.10). These should be used as supporting gauging stations and
their gauged data taken into consideration as reference for forecasting of succeeding flood
conditions.
Sub-Hydrological Gauging Stations for Flood Waning and Evacuation
Name of Gauging Station
Hydrological Data to be Gauged
Use of Gauged Data
Jonggoa Bonto Jai
Water level of the upstream of Jeneberang River from Bili-Bili Dam
Evaluate the succeeding tendency of the increase/ decrease of dam inflow based on rise/drop of the gauged water level.
Bayang Tidal level at river mouth of Jeneberang River
Evaluate the succeeding tendency of the rise/drop of the downstream water level of Jeneberang River on rise/drop of the gauged tidal level.
Malino Jonggoa
Rainfall in upper reaches of Bili-Bili Dam
Evaluate the succeeding tendency of the increase/ decrease of dam inflow based on the increase/ decrease of the gauged rainfall.
Limbua Mangepang
Rainfall in Jenelata River Basin
Evaluate the succeeding tendency of the increase/ decrease of the downstream discharge of Jeneberang River based on increase/decrease of the gauged rainfall.
(2) Required Work Activities at Each Flood Warning Level
The Public Corporation would place its flood-warning center at the existing Monitoring Station
for Bili-Bili Dam in Makassar City. This is where the Operation Director of Public Corporation
should be stationed during a flood to make all critical determinations and issue flood warning,
evacuation and fighting statements. A further secondary center would be placed at the Dam
Control Office at Bili-Bili dam site. Its functions would be to undertake the necessary flood
control operation of gate facilities at Bili-Bili Dam based on the flood conditions (flood discharge,

The Study on Capacity Development for Jeneberang River Basin Management
Nippon Koei Co., Ltd. 7-23 Final Report, Volume II CTI Engineering International Co., Ltd. Main Report
rainfall intensity and dam inflow discharge). The Public Corporation for the proposed flood
warning center would undertake the following activities during the flood:
(a) Works for Step 1 of Warning Levels
When the dam inflow discharge, river flow discharge and river water level reach levels
associated with Step 1 of the warning level, the following activities should be implemented:
Monitoring of river flow discharge and water at the principal and sub-flood
monitoring points specified in Subsection 7.5.1,
Forecasting flood conditions based on the above monitoring river flow
discharge and water level stations as well as the meteorological information
provided from Meteorology and Geophysics Agency (BMD),
Start flood control operation of dam reservoir,
Stand by a team for patrol of the potential flood area along the river course, and
Stand by a team to disseminate flood evacuation warnings to the residents.
(b) Works for Step 2 of Warning Levels
When the dam inflow discharge, river flow discharge and river water level reach levels
associated with Step 2 of the warning level, the following activities should be implemented:
Start river patrol along the potential flooding area,
Disseminate the necessity for flood evacuation to the residents,
Stand by a term to carry out emergency protection works against flooding, and
Issue flood warning to the external relevant organizations as required.
(c) Works for Step 3 of Warning Levels
When the dam inflow discharge, river flow discharge and river water level reach levels
associated with Step 3 of the warning level, the following activities should be implemented:
Issue request for flood evacuation to the external relevant organization,
Dispatch a team to facilitate flood evacuation and flood fighting,
Request the Implementation Unit for Disaster Management (SATLAK PB)3 to
mobilize their personnel, heavy equipment and materials to execute necessary
prevention works against flood overflow under technical instruction from the
Public Corporation and the necessary rescue works in case of occurrence of
flood overflow.
(d) Works after Flood
The Operation Director of Public Corporation would announce the end of flood operation,
once the flood is judged to have subsided. This would be based on a comprehensive
evaluation of hydrological information from the telemetry gauging stations and
3 The SATLAK PB is composed of (a) Mayor of Makassar City as the head of SATLAK PB, (b) the territorial
military commander (PALGDAM) and/or the commander of regional military administrative unit (DANREM) as the deputy head of SATLAK PB; (c) the head of provincial police (KAPOLDA) and/or the head of regional police (/KAPOLWIL) as the another deputy head of SATLAK PB; (d) the heads of relevant provincial and regional government agencies such as Water Resources Management Services of Public Works and Housing, Planning and Urban Development Service of Public Works; and (e) the relevant regional communities.

The Study on Capacity Development for Jeneberang River Basin Management
Nippon Koei Co., Ltd. 7-24 Final Report, Volume II CTI Engineering International Co., Ltd. Main Report
metrological information furnished by the Meteorology and Geophysics Agency. The
Operation Director may further need to request the Governor of South Sulawesi Province to
make necessary coordination for the technical/financial support from the central
government, as the member of National Coordination Board of Disaster management
(BOKORNAS PB).
7.5.2 Development and Dissemination of Flood Risk Map
Earth embankment was constructed in 1993 along the right and left bank of Lower Jeneberang
River 9.6km long from the river mouth to Sungguminasa Bridge. The embankment together with
the flood storage capacity of Bili-Bili Dam was designed to cope with the probable flood
discharge of 50-year return period. However, once an extreme flood with a recurrence probability
above 50-year return period occurs, the river flow would overtop the embankment and flow into
the hinterland. The flood could further possibly wash a substantial part of the embankment away,
since the crown level of the embankment is higher than the ground level of the hinterland. Hence,
in order to minimize the disastrous flood damage, which may involve death of the residents,
dissemination of flood risk map is proposed.
Dissemination of the flood risk map has been broadly adapted throughout the world as one of the
useful non-structural flood mitigation measures. Through dissemination of the flood risk map, the
residents are made aware of the extent of the potential flood inundation area and the available
evacuation routes during a flood. The flood risk map can also provide guidance for appropriate
urban planning and land development.
The movement of flood overflow discharge is highly influenced by the topographic conditions
(i.e., undulations and ground levels) in the hinterland. The movement is also varied by the
uncertain factors such as location of flooding over embankment, and flood hydrological
conditions in the river basin (i.e., the spatial and temporal variation of the storm rainfall and the
variations of flood runoff hydrograph). Despite of these complex and uncertain factors on the
movement of flood overflow, the available information on them is limited to the following items
in case of Jeneberang river basin:
(a) Ortho-photo contour maps with ground levels at 1.0 m intervals, which were developed
under the “Bili-Bili Irrigation Project in 2000”,
(b) The existing dike levels and/or design high water levels of Jeneberang River for a design
discharge with a 50-year return period; and
(c) The actual inundation area in the 1976 flood estimated through an interview survey of
residents in the Study on “Jeneberang River Flood Control Project (Phase II), by JICA in
1983”.
Due to the limitation on information, it is virtually difficult to estimate the precise extent of flood
inundation. Nevertheless, the water head of the flood overflow is most likely to be less than the
crown level of the embankment considering that the flood overflow could possibly wash a

The Study on Capacity Development for Jeneberang River Basin Management
Nippon Koei Co., Ltd. 7-25 Final Report, Volume II CTI Engineering International Co., Ltd. Main Report
substantial part of the embankment away as described above. From these viewpoints, the
low-lying areas with the ground levels below the design high water level were preliminarily
outlined as the maximum extent of the potential flood area. Then, the area, where the flood
overflow could be interrupted by the roads, the dikes of drainage channels and other boundaries
with high ground levels, were identified based on the actual flood inundation area in 1976, and
such areas were excluded from the potential flood inundation area.
As a result, potential flood inundation area was preliminarily estimated to cover about 58.5km2
spreading out over a substantial part of Makassar and Sungguminasa City on the right bank of the
Jeneberang River, as shown in Figure 7.11. The areas not inundated would be the east part of
Makassar City surrounded by the dike alignments of Jongaya, Panampu drainage channels, north
of the Jalan Urip Sumoharjo, and the slightly elevated area in and around Kel. Tibung and
Bontomakkio. In contrast to the area on the right bank, the possible inundation area on the left
bank is confined to a rather limited area between the dikes of the Jeneberang River and the Garassi
River.
In addition to the above flood inundation areas, particular attention should be given to illegal
dwellers living in the flood high water channels. The areas of illegal dwellers are designated as
river utilization areas and are exposed to a high risk of flood damage. Accordingly, the Public
Corporation should exert maximum effort to evacuate the illegal dwellers and at the same time,
record the location of all illegal dwellers in advance so at to issue early warnings to them during
periods of flood. The dominant areas of illegal dwellers are outlined below:
(a) The stretch along the left bank 2 to 3 km upstream from the river mouth (just downstream
from the Rubber Dam); and
(b) The stretch along the right bank 5 to 6 km upstream from the river mouth (adjacent to the
existing groundsill).
The evacuation centers as well as evacuation routes would be placed to the west side on the
Sinrijala-Panampu, or east of the Central Ring Road. However, their detailed locations could not
be specified in this Study due to the limited information, and should be designated in the future by
the relevant local government agencies based on the base flood risk map. The flood risk map thus
prepared should be disseminated to the public through a bulletin, an information board and other
available information tools.
7.6 Proposed Management Plan of River Area in Jeneberang River Basin
7.6.1 Extent of River Area
As described in Subsection 7.2.3, the cross-sectional extent of the river area to be managed by the
river administrator would cover the water body and river corridor with a certain width along the
water body. On the other hand, there does not exist any clear definition on the longitudinal extent

The Study on Capacity Development for Jeneberang River Basin Management
Nippon Koei Co., Ltd. 7-26 Final Report, Volume II CTI Engineering International Co., Ltd. Main Report
of the river area. JRBDP is the present principal river administrator for Jeneberang River, and its
authority is likely to prevail over the main stream of Jeneberang River from the river mouth up to
Bili-Bili Dam, at least. Upstream of Jeneberang River and/or along the tributaries of Jeneberang
River, however, there does not exist a clear definition on the administrative boundary between
JRBDP and other possible administrative entities such as Dinas PSDA and local governments at
Kabupaten level. Moreover, when a certain level of river administration authority is handed over
to the Public Corporation, it is extremely difficult for the Corporation to manage the overall river
systems due to its limited manpower and budgetary capacity.
From these viewpoints, it is proposed that the Public Corporation would initially manage the
following river stretches of Jeneberang River, their associated river control areas and river
structures, as proposed in Chapter 9. These proposed river stretches contain the principal river
infrastructures and/or possess significant hydrological/ hydraulic effects on the flood and water
quantity management.
Longitudinal Extent of River Area to be Managed by Public Corporation
River Stretch LengthClassifi-cation*
Remarks
Mainstream (1) From river mouth to Sungguminasa Bridge
9.60 A 1st order River
Mainstream (2) From Sungguminasa Bridge to Lengkese Village
75.90 B 1st order River
Long Storage From river mouth to confluence with the mainstream
4.50 A 2nd order River (old channel of Jeneberang River
Jenelata River Between the confluences with the mainstream and Sapaya Village
38.45 B 2nd order River (the largest tributary)
Binanga Tokka From the confluence with the mainstream to Sapakeke Village
24.26 B 3rd order Ricer (tributary of Jenelata River)
Salo Malino From the confluence with mainstream to Sabo Dam No.6
18.67 B 2nd order River
Kausis From the confluence with mainstream to Sabo Dam No.8
18.91 B 2nd order River
Total 190.29 *: Classification of River A = Land of the river corridor has been acquired by the river administrator. Classification of River B = Land of the river corridor has not been acquired by the river administrator .
7.6.2 Extent of Authority of Public Corporation for Watershed Management
The river administrator would possess direct authority to manage the aforesaid river area, but
would have little authority in terms of watershed management over the entire river basin. Instead,
the principal function of watershed management should be delegated to the organizations relevant
to forest management and soil conservation. These are represented by the Watershed Management
Center (Balai Pengelolaan Daerah Aliran Sungai) and the function of the river administrator is
oriented to collaboration with these organizations. Refer to Chapter 8 for further description of
watershed management.

The Study on Capacity Development for Jeneberang River Basin Management
Nippon Koei Co., Ltd. 7-27 Final Report, Volume II CTI Engineering International Co., Ltd. Main Report
7.6.3 Development of Inventory of River Area
In order to facilitate the management of the river area, it is proposed that the Public Corporation
should develop the inventory of the river stretches and river corridors in its river area. The
inventory should be made based on the following segments of river stretches/corridors:
(1) An approximately uniform morphology for a river and river corridor of about 500 m in
longitudinal length,
(2) A shorter length of river and river corridor displaying a particular problem, if it exists, such
as severe bank erosion, and
(3) A shorter length of river containing a particular structure of interest.
It is further proposed that each of the above segments should contain the following information
(refer to Supporting Report E for details):
(1) Classification for each segment of river corridors including the information of a unique
identity number of the segment, name of river/river basin, type of river corridors (either
with-levee or without-levee), name of adjacent village, riparian structures located along the
river corridor, and GPS coordinates/ channel length of the segment.
(2) Land use states of river corridor including information on land ownership, classification of
land use, type and densities of vegetation and sand mining activity, if any, together with
evaluation on whether or not the activity could cause danger to the levee.
7.6.4 Land Use Control in River Area
As described in Subsection 7.2.3, the river area could be classified into the following three
categories: (a) river utilization area, where land of the river corridor had been acquired by the
river administrator, (b) circumference of Bili-Bili dam reservoir, where the land with ground
levels below SWL (EL.101.6 m) had been acquired by the river administrator; and (c) river
control area, where the land is privately-owned. These three types of river areas would differ in
criteria of land use control as described below:
(1) Land Use Control in River Utilization Area
Land use in the high water channel along the existing river dike from the river mouth to
Sungguminasa (9.5 km in length) should be subject to approval by the Public Corporation, and
any illegal land use therein should be strictly prohibited. The existing illegal dwellers in the flood
channel area in particular are a great hindrance to the safe passage of flood discharge, and at the
same time they are exposed to a high risk of flood damage. Accordingly, major effort for land use
control should be oriented to evacuation of these illegal dwellers.
The allowable land uses in the flood high water channel should be limited to those for public
interest such as river-parks and public grounds. Moreover, structures in the flood high water
channel should be limited to those that would not hamper flood flows and/or riparian structures

The Study on Capacity Development for Jeneberang River Basin Management
Nippon Koei Co., Ltd. 7-28 Final Report, Volume II CTI Engineering International Co., Ltd. Main Report
such as water level gauging stations and drainage sluices, which must be constructed within the
river corridor.
(2) Land Use Control in River Control Area
The river corridor 100m wide along both the right and left river banks of the upstream channel
above the river utilization area could be specified as the river control area. The land of this river
corridor is privately owned, and therefore, the Public Corporation would hardly execute the
authority of land control over the river corridor. Nevertheless, the Public Corporation should
monitor the progress of land exploitation in the river corridor, and control any excessive
exploitation whenever it is judged to have significant effects on the river morphology, river flow
conditions, and/or river environment.
(3) Circumference of Bili-Bili Dam Reservoir
Any removal of grass/trees and/or logging activities in the circumference of the dam reservoir as
designated in Sub-section 7.2.3 should be subject to approval of the Public Corporation so as to
preserve the existing green belt around the dam reservoir. Moreover, all construction works in the
circumference of the dam reservoir should be subject to approval by the Public Corporation on
the basis that construction of structures except those for public interest, such as roads and riparian
structures, should be prohibited in the area.
7.6.5 Plan for Control of Sand-mining
As described in Chapter 3, the current excessive sand mining activities have caused serious
degradation of the downstream riverbed of Jeneberang River below Bili-Bili dam. In order to
minimize this, any sand mining activities below Bili-Bili dam should preferably be prohibited,
and the mining sites should be transferred upstream of the dam. The potential sand mining sites
upstream of Bili-Bili dam could be at the upstream end of the reservoir area and the sabo pocket
dams Nos.1 to 4, as shown in Figure 7.12.
Many difficulties are, however, foreseen in completely ending the downstream mining in due
consideration of accessibility to the upstream mining site and disputes on conventional territories
of each sand miner. From these viewpoints, it is proposed that the relevant authorities should stop
any renewal of mining licenses for the downstream channel below Bili-Bili dam and at the same
time, the Public Corporation should undertake the following activities:
(1) Carry out a river channel survey at the end of every rainy season and clarify the tendencies
of riverbed degradation at each major river structure based on the results of the river channel
survey;
(2) Estimate the sediment deposition on the riverbeds at each of the major river structures after
stopping renewal of mining licenses;

The Study on Capacity Development for Jeneberang River Basin Management
Nippon Koei Co., Ltd. 7-29 Final Report, Volume II CTI Engineering International Co., Ltd. Main Report
(3) Estimate the allowable sand mining volume and available mining sites on the downstream
reach of Jeneberang River based on the results of clarification on the above.
(4) Carry out a river patrol to control illegal sand mining activities.
7.6.6 Prevention Plan against Sediment Runoff from Collapse of Mt. Bawakaraeng
As described in Chapter 3, the collapse of a quay in the caldera of Mt. Bawakaraeng is now
producing a tremendous volume of sediment runoff, which could fill about 90% of the dead
storage capacity of Bili-Bili Dam (29 million m3) within five years. Moreover, the collapse has
produced several natural ponds in the caldera of Mt. Bawakaraeng. Should these ponds break out,
a tremendous volume of impounded water would flow down with debris causing extensive
damage to the residents and houses in the lower reaches. In order to reduce the sediment
accumulation in the dam reservoir and at the same time preventing the water impounded in the
natural ponds from flowing down, JRBDP is going to implement urgent countermeasures as
recommended by the JSUIT, as described below. In this connection, the Public Corporation
would need to undertake monitoring works on the sediment runoff, in parallel with the
implementation of the urgent countermeasures.
(1) To increase sand trap capacity of sand pocket dams and sabo dams based on the following
measures: (a) excavation of the sediment deposits at the existing sand pocket dams/sabo
dams, (b) raising height of the existing sand pocket dams and sabo dams, (c) construction of
the new sabo dams4, and (d) rehabilitation of the existing damaged sand pocket dams and
sabo dams;
(2) To construct a waterway (such as drainage channel and siphon) to drain the water
impounded in the ponds;
(3) To establish a monitoring system including assigning of watchman and setting of telemetry
hydrological gauging stations at critical points;
(4) To establish mudflow warning system including: (a) organizing of the community network5,
(b) setup of the warning siren, and (c) use of the radio broadcast system for early warning;
and
(5) To disseminate the hazard map.
4 Eleven sabo dams are proposed. One is about 1.2 km downstream from Daraha Bridge and other ten dams are
about 1.5 km upstream from the Bridge. 5 The community named “Komunitas Sabo Jeneberang” has already been established for the sake of early
dissemination and evacuation against the mud-flow.

The Study on Capacity Development for Jeneberang River Basin Management
Nippon Koei Co., Ltd. 7-30 Final Report, Volume II CTI Engineering International Co., Ltd. Main Report
7.7 Operation and Maintenance (O&M) Plan of River Infrastructures
7.7.1 Objective River Infrastructures for O&M by Public Corporation
As described in Sub-section 7.2.4, JRBDP currently undertakes O&M of a variety of river
infrastructures. All infrastructures other than the urban drainage facilities are indispensable for the
consistent management of Jeneberang River, functioning as important water source/water
distribution facilities as well as flood mitigation facilities for a wide range of beneficiaries.
On the other hand, the urban drainage facilities contribute to the benefit of Makassar City and
their function is less related to consistent river management. Due to the particular functions of
facilities, the Public Corporation should undertake O&M for all river infrastructures other than
the urban drainage facilities, while O&M for the urban drainage facilities should be handed over
directly to Makassar City.
The limits of O&M by Public Corporation should extend to the Flush Gate placed at the outlet of
Long Storage, and O&M of all drainage facilities located downstream of this site should be under
the authority and responsibility of Makassar City.
7.7.2 Expansion Program of O&M by Public Corporation
Due to the limited potential human resources and budgetary constraints, it is deemed to be
difficult for the Public Corporation to initially undertake O&M for all river infrastructures as
proposed in the above subsection, and the following expansion program of O&M is proposed:
(1) O&M During First Two-year Operation Period
It is proposed that O&M by Public Corporation should focus on the following facilities during its
first two-year period of operation in 2007 and 2008:
- Bili-Bili Dam and its associated Raw Water Transmission Main (RWTM);
- Rubber Dam and Long Storage; and
- Three irrigation weirs of Bili-Bili, Bissua, and Kampili.
All of these river infrastructures are indispensable to ensure the sustainable water supply for the
specific water users such as PLN, PDAM and the farmers, and the higher priority of O&M should
be given to them. Moreover, Public Corporation could collect its water service fee from the water
users other than farmers, which would contribute a substantial part of the revenue for Public
Corporation. It is herein noted that difficulties are foreseeable in collecting the water service fee
from the farmers according to the new water law6. Nevertheless, of the overall water abstraction
6 The new water law in 2004 prescribes that the necessary O&M cost only for the tertiary irrigation channel would be charged to
the farmer but the farmer is not the subject of collection of any irrigation service fee.

The Study on Capacity Development for Jeneberang River Basin Management
Nippon Koei Co., Ltd. 7-31 Final Report, Volume II CTI Engineering International Co., Ltd. Main Report
volume from Jeneberang River the irrigation requirement accounts for about 80%. Accordingly,
operation of irrigation weirs is influential in managing the entire water distribution of Jeneberang
River and indispensable for the consistent river management of Jeneberang River.
(2) O&M After First-Two-year Operation Period
Public Corporation should add the following facilities as additional objectives of their O&M
works after the first two-year operation period (i.e., from 2009 onwards):
- Four sand pocket dams and three sabo dams (other than Sabo Dam No.4, which was
seriously damaged and abandoned) in upper reaches of Bili-Bili dam reservoir, and
- Riparian structures such as embankment, revetment, groyne, and groundsill, and sluices
along the downstream reach of Jeneberang River from the river mouth up to the
Sungguminasa Bridge.
Both sand pocket dams and sabo dams could reduce the sediment inflow into Bili-Bili dam
reservoir contributing to a longer durable life for the reservoir and preservation of a suitable river
channel morphology. The riparian structures also play an important role for flood mitigation in the
low-lying area along the downstream reach of the Jeneberang River. Thus, all facilities are
important for river management but are rather independent from the daily water distribution, and
Public Corporation could hardly obtain revenue through O&M of these facilities. Accordingly,
O&M of the facilities should preferably be undertaken by JRBDP during the initial operation
stage of Public Corporation and turned over from JRBDP to Public Corporation, after the latter
secures a more stable revenue from other service sources.
7.7.3 Development of Inventory and Location Map of Water Resources Facilities
There exist neither a detailed inventory nor detailed location maps for all existing river
infrastructures. In order to achieve the effective inspection and maintenance, an inventory of all
major river infrastructures in Jeneberang river basin should be developed and updated. This
would contain the following information:
(1) A unique identity number (ID) and name of each infrastructure,
(2) Location of the infrastructure and name of river on which the infrastructure is located; and
(3) Structural size, type and quantities of river infrastructures.
A preliminary inventory of river infrastructures as of 2004, as well as the location maps of the
river infrastructures located from the river mouth to Sungguminasa, were developed in this Study
as shown in Table 7.3 and Figure 7.13.

The Study on Capacity Development for Jeneberang River Basin Management
Nippon Koei Co., Ltd. 7-32 Final Report, Volume II CTI Engineering International Co., Ltd. Main Report
7.7.4 Maintenance Plan
The Maintenance Plan aims at detecting and rehabilitating deterioration in the function of
facilities including fatigue/deterioration of facilities and mechanical problems. The works are
broadly classified into the following three categories:
(1) Preventative Maintenance: This aims at keeping the originally designed function of the river
infrastructure through the following three activities:
Routine Maintenance, which includes all repetitive activities to be performed
throughout a year such as lubrication of mechanical facilities, removal of
weed/garbage, and removal of sediment deposit,
Periodic Maintenance, which includes all activities such as overhaul of mechanical
facilities and re-painting of substantial parts of metal sections, to be performed at
intermittent intervals in accordance with a schedule programmed beforehand, and
Small Repair Work, which includes works of a small-scale necessary for restoration of
a facility such as repair of small cracks, holes or detachment on structures and
replacement of damaged facilities.
(2) Corrective Maintenance: This aims at more substantial repair/replacement works than the
Preventative Maintenance to restore a facility, which has considerably reduced its function
as originally designed due to operating beyond the period of durability and/or destructive
damage. The ongoing rehabilitation works for the damaged Rubber Dam, Groundsill No.2
and Sand Pocket dam No.4 are outlined as typical cases of the Corrective Maintenance. It is
herein proposed that the repair works costing more than about Rp. 500 million should be
classified as Corrective Maintenance, while those of less than Rp. 500 million would be
small repairs.
(3) Emergency Maintenance: This is executed against the imminent failure of infrastructures
due to extensive disasters such as floods, landslides and earthquakes.
Among others, the Preventative Maintenance could be performed based on a definite and
consistent maintenance plan. On the other hand, both the Corrective and Emergency Maintenance
are ad-hoc works in nature, and it is extremely difficult to formulate in advance a consistent
annual plan for them. Moreover, when the Preventative Maintenance is adequately achieved,
Corrective Maintenance could at least be minimized. From these viewpoints, the maintenance
plan should be formulated for Preventative Maintenance, and in due consideration of the present
states of river infrastructures, the standard maintenance works were delineated as described in
Volume IV-1 “Part I - Guidelines and Manuals for River Infrastructure Operation and
Maintenance”.
The maintenance works, except for relevant inspection works, could hardly be executed and paid
by Public Corporation, particularly during its initial operation stage, due to difficulties in effective

The Study on Capacity Development for Jeneberang River Basin Management
Nippon Koei Co., Ltd. 7-33 Final Report, Volume II CTI Engineering International Co., Ltd. Main Report
use of heavy equipment and machines. It is commercially better to spend the budget for
maintenance directly on actual mplementation of contracts through the following measures7:
(1) Direct appointment of small Class C2 contractors with contract values up to Rp. 50 million
using highly standardized contracts, and
(2) Award of large proportion of the work to large contractors of more than one year based on
“period contract”, where the unit prices are tendered for and fixed, and there is flexibility in
directing actual work item packages and quantities during the course of the contract.
(3) The small repair work would be executed based on the sketch drawing of the area and a
standard typical drawing together with brief work instruction and technical specification
but without detailed design. It is desirable, whenever possible, to implement the works by
labor-intensive means using local labor.
7.7.5 Operation Plan
The operation procedures for all objective river infrastructures are described in the existing O&M
manuals currently applied by JRBDP. The list of the available O&M manuals is shown in Table
7.4. All O&M manuals, other than those for irrigation intake facilities, were prepared from 1994
to 2001, but no updating of the contents of the manuals has ever been made. As a result, some
instructions for operation in the manuals are not compatible to the present water demand, present
land uses and other existing relevant conditions. Moreover, the manuals contain no definitive
technical instructions against emergency cases such as occurrences of extreme droughts and
floods exceeding design capacity. Given this background, the necessary revisions and updating on
the contents of the existing manuals was made in this Study based on the O&M plan of the
relevant river infrastructures outlined below. Its results are compiled in Volume IV-1 “Part I -
Guidelines and Manuals for River Infrastructure Operation and Maintenance”. The principal
revisions and/or renewals of the existing operation rules and procedures in the Manual are
outlined below:
(1) Bili-Bili Dam
The operation rules of the regular gates/control gate for Bili-Bili dam and the guide vane for
Bili-Bili HEPP were recently revised. Detailed guidance was also made on the configuration and
operation method of the remote monitoring and control system. This renewal of operation rules
and the detailed guidance are required due to the following:
- After Bili-Bili Hydroelectric Power Plant (Bili-Bili HEPP) starts operation in November
2005, integrated gate operation for the above three gates is required.
- The Rule Curve (RC) for Bili-Bili reservoir was revised in accordance with the updated
water demand allocated to Bili-Bili dam in this Study. The drought management rules were
also newly developed based on the revised RC. In accordance with the revision of the RC
7 Recommended in “Guideline Manual for River Infrastructure Maintenance (RIM)” by SMEC in 1997.
The Study on Capacity Development for Jeneberang River Basin Management
Nippon Koei Co., Ltd. 7-34 Final Report, Volume II CTI Engineering International Co., Ltd. Main Report
and the new drought management rules, revisions were also made to the operation rules of
the control gate for Bili-Bili dam and the guide vane for Bili-Bili HEPP.
(2) Rubber Dam and Long Storage
The following contents are compiled in the Manual:
- Detailed guidance on the synchronized operation rules and procedures for Rubber Dam and
the Inlet/Outlet gates of Long Storage;
- Temporary operation rules of the Inlet Gate of Long Storage to control salinity intrusion
during the non-operational period of the Rubber Dam (the current non-operational
conditions of the Rubber Dam are expected to continue until the mid-term of the 2005 dry
season ); and
- Operation rules of the flushing water to dilute stagnant water in the drainage channels of
Jongaya, Sinrijala and Panampu.
(3) Raw Water Transmission Main
The operation rules for butterfly valves, sluice valves and air valves for replacement of pipes are
not described in the present manual and are therefore supplemented in the Manual of this Study.
(4) Bili-Bili, Bissua and Kampili Irrigation Weirs
Operation rules for the gate structures were extracted from the existing manual
(“Bili-Bili-Irrigation Project, Operation & Maintenance Manual by CTI Engineering Co. LTD. in
2001” in which a supplementary explanation on them was given.
(5) Drainage Sluice Gates along the Lower Jeneberang River
The operation rules for the existing eleven sluice gates were recently established on the premise
that local residents would undertake the operation as gatekeepers entrusted by Public Corporation,
and their operation works would be under the supervision and control of Bili-Bili Dam Control
Office.
7.7.6 Required Rehabilitation Works for Existing River Infrastructures
JRBDP currently undertakes rehabilitation of the damaged river infrastructures including Rubber
Dam, Groundsill and Sand Pocket Dam no.4. In addition to these structures, however, other
damaged facilities remain that have not been rehabilitated and/or replaced. The damage to the
facilities results in the potential to cause significant adverse effects on river management.
Therefore, JRBDP would be required as the present administrator of the structures to repair and/or
replace them before hand-over of O&M works of the structures to Public Corporation. The major
required rehabilitation works together with their rehabilitation costs are summarized below:

The Study on Capacity Development for Jeneberang River Basin Management
Nippon Koei Co., Ltd. 7-35 Final Report, Volume II CTI Engineering International Co., Ltd. Main Report
Required Rehabilitation Works for Existing River Infrastructures
Objective Facilities Required Rehabilitation Works Required
Cost (Rp. million)
To replace whole telemetry gauging equipment at Bayang, which was stolen in Nov. 2005
503.8 Telemetry gauging system for monitoring and operation for Bili-Bili Dam To revise the present software system for control
of entire telemetry gauging system 200.0
Flow meter placed at inlet of RWTM
The flow meter should be replaced 7.5
Eleven drainage gates along the downstream reach of Jeneberang River
To replace the gate hoists for all gates; To repair the gate leaf/flame for two gates namely, Bayang (K.1.220-R) and K9.60 (K9.663-R); and To replace the seal rubber at Bayang Gate (K1.22-R).
1,250.0
Total 1,961.3
7.8 Required Cost for O&M of River Infrastructure and River Management
7.8.1 Cost Borne by Public Corporation
The present conditions of river infrastructures were clarified in detail through:
(1) Field reconnaissance,
(2) Interview survey from JRBDP,
(3) Review of the actual budget allocated to O&M by JRBDP, and
(4) Review of the relevant documents such as O&M manuals/completion drawings.
Based on these clarifications, the necessary full-scale O&M cost of the river infrastructures and
the relevant river basin management was estimated at Rp. 4,054 million. This corresponds to
more than three to four times the actual budget disbursed by JRBDP (JRBDP had disbursed O&M
costs of Rp. 1,329 million in 2003 and Rp. 954 million in 2004, as described in Subsection 7.2.4).
The break down of the estimated cost is listed below:
Summary of Cost for O&M of River Infrastructures and Cost for River Management (Unit: Rp. million)
Item Facility/management Field 2007-2008* From 2009 onward
Bili-Bili Dam/RWTM 933 996
Irrigation Intake Weir 566 593
Rubber Dam/Long Storage 353 437
Riparian Structure 0 428
Sand Pocket Dam and Sabo Dam 0 468
O&M of River Infrastructures
Sub-total 1,852 2,917
Water Quantity management 188 259
Flood Management 229 278
Drought Management 227 267
River Conservation Management 209 334
River Management
Sub-total 854 1,137
Total 2,706 4,054
*: In accordance with the proposed expansion Program of O&M as described in Subsection 7.7.2, Public Corporation would not undertake O&M for the sand pocket dam/sabo dam and riparian structures during the first operation period in 2007-2008.

The Study on Capacity Development for Jeneberang River Basin Management
Nippon Koei Co., Ltd. 7-36 Final Report, Volume II CTI Engineering International Co., Ltd. Main Report
The above cost is divided into: (1) routine and periodic maintenance of river infrastructures, (2)
overhaul of mechanical facilities, (3) operation cost of river infrastructures, (4) overhead for
O&M of river infrastructures, and (5) cost for the relevant river management activities as listed in
Table 7.5. The estimating basis for these cost components is given below (refer to Tables E10.2 to
E10.10 in Vol. 3 Supporting Report-E):
(1) Routine and Periodic Maintenance Cost of River Infrastructure: The actual field
maintenance works were assumed to be executed on a contract basis, and the unit cost for
each work item was estimated based on the current prevailing contract price. The annual
work volume for each work quantity was further estimated based on field reconnaissance,
with the necessary maintenance cost finally derived by the annual work volume multiplied
with the unit cost of the work.
(2) Overhaul of Mechanical Facilities: The annual cost for overhaul of mechanical facilities was
estimated based on the necessary time interval of overhaul, work quantity, and unit cost. All
necessary information was derived from the contract price of the facilities, the supplier’s
instruction manual and the standards on the overhaul of mechanical facilities prepared by
Ministry of Land and Transportation in Japan.
(3) Operation Cost of River Infrastructures: The operation cost includes the cost for power
supply, spare parts, materials (such as grease and oil), consumables and personnel
expenditures for gatekeepers. The operation of infrastructures is in principal assumed to be
by internal staff of Public Corporation and required personnel expenditure as well as other
overhead was separately estimated under the following item (4). The exceptional case of this
principal is, however, given to the gatekeepers for eleven drainage sluice gates along the
downstream reach of Jeneberang River and three inlet/outlet gates for Long Storage. It is
assumed that these gatekeeper roles should be entrusted to the local residents, and their
necessary costs were included as part of the operation cost.
(4) Overhead of O&M: The annual salary for the permanent staff of Public Corporation to be
involved in O&M was first estimated. The whole overhead of O&M was then estimated by
adding the incidental costs such as material, equipment, and duty trip costs.
(5) Cost for the Relevant River Management Works: The objective river management herein
includes water quantity management, flood management, drought management and river
conservation management.8 The annual salary for the permanent staff to be involved in these
river management works was firstly estimated. The overall cost necessary for river
management works was then estimated by adding the incidental costs such as material,
equipment, and duty trip costs.
8 O&M costs for water quality and watershed management are separately estimated in Chapter 8

The Study on Capacity Development for Jeneberang River Basin Management
Nippon Koei Co., Ltd. 7-37 Final Report, Volume II CTI Engineering International Co., Ltd. Main Report
7.8.2 Cost for Corrective and Emergency Maintenance
The maintenance cost as estimated above is limited to the preventative maintenance cost. In
addition to this, however, maintenance may cover corrective and emergency maintenance as
described in Subsection 7.7.4.
The ongoing repair of the damaged Rubber Dam, Groundsill No.2 and Sand Pocket Dam No.4 are
as outlined in the typical cases for Corrective Maintenance. However, there still exist other
damaged facilities, which are regarded as objectives of corrective maintenance and are yet to be
rehabilitated and/or replaced. The overall necessary cost for these corrective maintenance works
total Rp. 13,648 million as listed below. In addition to this amount, the Corrective Maintenance
Cost further needs to cover all replacement costs of those facilities extending beyond their period
of service durability. (The period of service durability is in a range of 10 to 25 years).
Corrective Maintenance Cost for River Infrastructures in Jeneberang River Basin
Objective Facilities of Corrective Maintenance
Year of Completion
Occurrence of Damage
Present Status of Corrective Works
Required Corrective Cost (Rp. million)
Sand Pocket Dam No.4 2000 2002 On-going 908
Rubber Dam 1996 2004 On-going 5,343
Groundsill No.2 1992 2003 On-going 5,407
Eleven Drainage Sluice Gates 1992 Unknown Suspended 1,250
Telemetry Gauging System 1997 2002 Suspended 703
RWTM flow meter 1999 Unknown Suspended 7.5
Total 13,648
As described in Chapter 3, the collapse of the enormous caldera-wall at Mt. Bawakaraeng
occurred on 26 March 2004, and Bili-Bili dam reservoir is now in danger of substantially reducing
its reservoir capacity as a result of the huge volume of sediment discharge. In order to cope with
this problem, JRBDP is going to implement an urgent sediment control project with the financial
assistance of JBIC. The sediment control project could be regarded as a type of emergency
maintenance. The cost for the urgent sediment control project is estimated at Rp. 87,000 million.
As described above, both the corrective maintenance and emergency maintenance require huge
implementation costs within a rather short period, and the budgetary arrangement for them is
deemed to be far beyond the capacity of Public Corporation. Thus, the corrective and emergency
maintenance could hardly fall within the scope of Public Corporation and needs to be
implemented as part of the national projects.
Moreover, both the corrective and emergency maintenance are oriented to replacement of the
assets (river infrastructure), which exceeded the period of service durability and/or have been
damaged by extreme natural disasters such as floods, land slides and earthquakes. Such
replacement of the assets is deemed to be under the responsibility of JRBDP as the possessor of
the assets and not the Public Corporation as the executor of O&M for the assets. From these
viewpoints, the cost for both corrective and emergency maintenance was excluded from the
budgetary burden on the Public Corporation.
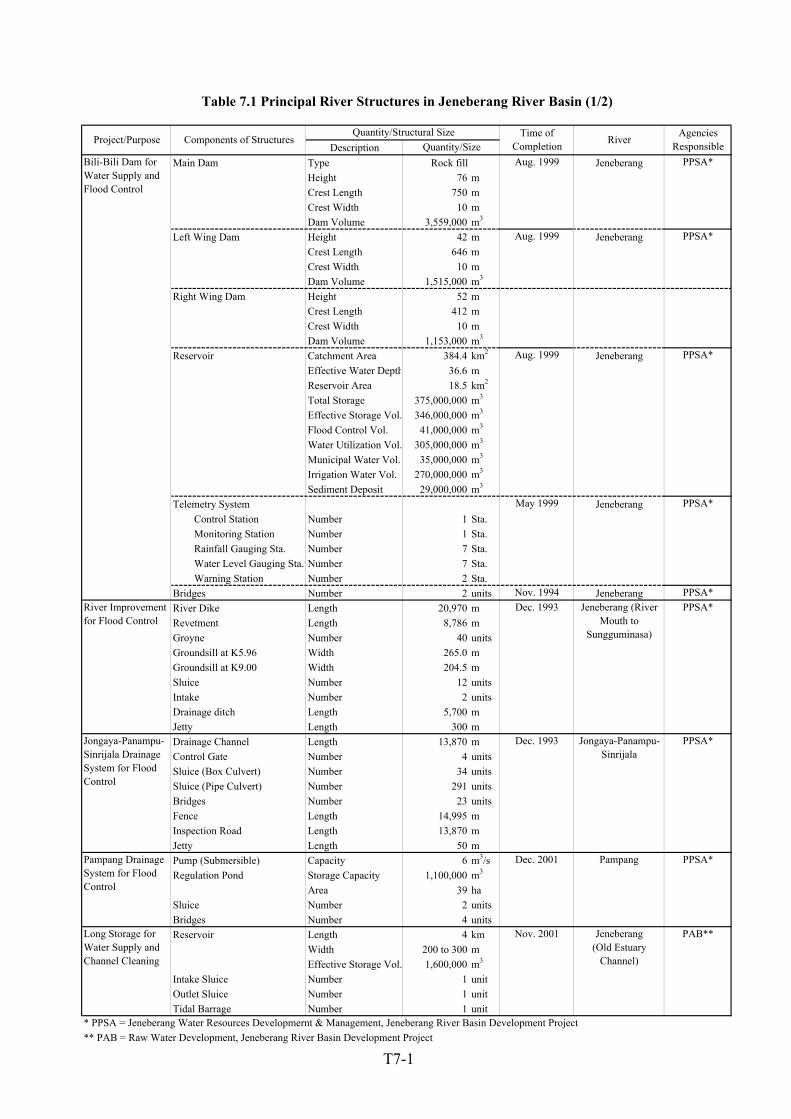
Description
Main Dam Type Rock fill Aug. 1999 Jeneberang PPSA*
Height 76 m
Crest Length 750 m
Crest Width 10 m
Dam Volume 3,559,000 m3
Left Wing Dam Height 42 m Aug. 1999 Jeneberang PPSA*
Crest Length 646 m
Crest Width 10 m
Dam Volume 1,515,000 m3
Right Wing Dam Height 52 m
Crest Length 412 m
Crest Width 10 m
Dam Volume 1,153,000 m3
Reservoir Catchment Area 384.4 km2 Aug. 1999 Jeneberang PPSA*
Effective Water Depth 36.6 m
Reservoir Area 18.5 km2
Total Storage 375,000,000 m3
Effective Storage Vol. 346,000,000 m3
Flood Control Vol. 41,000,000 m3
Water Utilization Vol. 305,000,000 m3
Municipal Water Vol. 35,000,000 m3
Irrigation Water Vol. 270,000,000 m3
Sediment Deposit 29,000,000 m3
Telemetry System May 1999 Jeneberang PPSA*
Control Station Number 1 Sta.
Monitoring Station Number 1 Sta.
Rainfall Gauging Sta. Number 7 Sta.
Water Level Gauging Sta. Number 7 Sta.
Warning Station Number 2 Sta.
Bridges Number 2 units Nov. 1994 Jeneberang PPSA*
River Dike Length 20,970 m Dec. 1993 PPSA*
Revetment Length 8,786 m
Groyne Number 40 units
Groundsill at K5.96 Width 265.0 m
Groundsill at K9.00 Width 204.5 m
Sluice Number 12 units
Intake Number 2 units
Drainage ditch Length 5,700 m
Jetty Length 300 m
Drainage Channel Length 13,870 m Dec. 1993 PPSA*
Control Gate Number 4 units
Sluice (Box Culvert) Number 34 units
Sluice (Pipe Culvert) Number 291 units
Bridges Number 23 units
Fence Length 14,995 m
Inspection Road Length 13,870 m
Jetty Length 50 m
Pump (Submersible) Capacity 6 m3/s Dec. 2001 PPSA*
Regulation Pond Storage Capacity 1,100,000 m3
Area 39 ha
Sluice Number 2 units
Bridges Number 4 units
Reservoir Length 4 km Nov. 2001 PAB**
Width 200 to 300 m
Effective Storage Vol. 1,600,000 m3
Intake Sluice Number 1 unit
Outlet Sluice Number 1 unit
Tidal Barrage Number 1 unit
* PPSA = Jeneberang Water Resources Developmernt & Management, Jeneberang River Basin Development Project
** PAB = Raw Water Development, Jeneberang River Basin Development Project
River Improvement
for Flood Control
Jeneberang (River
Mouth to
Sungguminasa)
Jongaya-Panampu-
Sinrijala Drainage
System for Flood
Control
Jongaya-Panampu-
Sinrijala
Pampang Drainage
System for Flood
Control
Pampang
Long Storage for
Water Supply and
Channel Cleaning
Jeneberang
(Old Estuary
Channel)
Agencies
Responsible
Bili-Bili Dam for
Water Supply and
Flood Control
Project/Purpose River
Table 7.1 Principal River Structures in Jeneberang River Basin (1/2)
Components of StructuresQuantity/Structural Size
Quantity/Size
Time of
Completion
T7-1

Description
Dam Width 210 m Dec. 1996 PAB**
Height 2 m
Main body Length 10 m
Upstream Apron Length 5 m
Downstream Apron Length 12 m
Revetment Length 336 m
Control house Number 1 unit
Pipeline Design Discharge 3.3 m3/s Mar. 1999 PAB**
Pipe of 1600mm dia Length 6,630 m
Pipe of 1,500mm dia Length 10,380 m
Valve Number 30 units
Fire Hydrant Number 15 units
Flow-meter Chamber Number 2 units
Blow-off Chamber Number 5 units
Air Valve Chamber Number 15 units
Fire Hydrant Chamber Number 3 units
Sand Pocket Dam No.1 Dam Volume 31,800 m3 Oct. 1997 Jeneberang PAB**
Length of Dam Crest 620 m
Dam Height 7.5 m
Sediment Capacity 164,000 m3
Mining Capacity 113,000 m3
Sand Pocket Dam No.3 Dam Volume 16,100 m3 Oct. 1997 Jeneberang PPSA*
Length of Dam Crest 336 m
Dam height 7 m
Sediment Capacity 129,000 m3
Mining Capacity 93,000 m3
Sand Pocket Dam No.2 Dam Volume 28,000 m3 Sep. 2000 Jeneberang PPSA*
Length of Dam Crest 465 m
Dam height 7 m
Sediment Capacity 202,000 m3
Mining Capacity 153,000 m3
Sand Pocket Dam No.4 Dam Volume 35,800 m3 Nov. 2000 Jeneberang PPSA*
Length of Dam Crest 644 m
Dam height 7 m
Sediment Capacity 444,000 m3
Mining Capacity 359,000 m3
Sand Pocket Dam No.5 Dam Volume 26,800 m3 Nov. 2000 Jeneberang PPSA*
Length of Dam Crest 441 m
Dam height 7 m
Sediment Capacity 142,000 m3
Mining Capacity 106,000 m3
Sabo Dam No.4 Dam Volume 8,400 m3 Jan. 2001 Jeneberang PPSA*
Length of Dam Crest 150 m
Dam height 8 m
Sediment Capacity 129,000 m3
Mining Capacity 92,000 m3
Sabo Dam No.6 Dam Volume 8,400 m3 Jan. 2001 Marino PPSA*
Length of Dam Crest 230 m
Dam height 10 m
Sediment Capacity 74,400 m3
Mining Capacity 62,000 m3
Sabo Dam No.8 Dam Volume 28,000 m3 Jan. 2001 Salo Bengo PPSA*
Length of Dam Crest 104 m
Dam height 10 m
Sediment Capacity 122,400 m3
Mining Capacity 73,150 m3
* PPSA = Jeneberang Water Resources Developmernt & Management, Jeneberang River Basin Development Project
** PAB = Raw Water Development, Jeneberang River Basin Development Project
Jeneberang
Raw Water
Transmission
System for Water
Supply
-
Sand Pocket and
Sabo Dam
Project/Purpose Components of StructuresQuantity/Structural Size
Rubber Dam for
Water Supply
Table 7.1 Principal River Structures in Jeneberang River Basin (2/2)
Time of
CompletionRiver
Agencies
ResponsibleQuantity/Size
T7-2

(unit: m3/s)
Sector Name of User Intake Point Jan. Feb. Mar. Apr. May Jun. Jul. Aug. Sep. Oct. Nov. Dec.Bili-Bili Irrigation Bili-Bili Weie 0.88 0.00 0.00 2.20 2.96 2.95 2.69 1.36 0.76 0.45 0.00 0.14Bissua Irrigation Bissua Weir 4.00 0.00 0.00 10.07 13.51 13.48 12.29 6.21 3.45 2.08 0.00 0.66Kampili Irrigation Kampili Weir 3.92 0.00 0.00 9.85 13.20 13.18 12.02 6.07 3.38 2.03 0.00 0.64
8.80 0.00 0.00 22.13 29.67 29.61 27.01 13.64 7.59 4.56 0.00 1.44Somba Opu 1.31 1.31 1.31 1.31 1.31 1.31 1.31 1.31 1.31 1.31 1.31 1.31Ratulangi 0.07 0.07 0.07 0.07 0.07 0.07 0.07 0.07 0.07 0.07 0.07 0.07Macchini Simbala 0.09 0.09 0.09 0.09 0.09 0.09 0.09 0.09 0.09 0.09 0.09 0.09Panaikang 0.00 0.00 0.00 0.00 0.50 0.50 0.50 0.50 0.50 0.50 0.00 0.00Bajeng 0.02 0.02 0.02 0.02 0.02 0.02 0.02 0.02 0.02 0.02 0.02 0.02Borong Loe 0.01 0.01 0.01 0.01 0.01 0.01 0.01 0.01 0.01 0.01 0.01 0.01Tompo Balang 0.03 0.03 0.03 0.03 0.03 0.03 0.03 0.03 0.03 0.03 0.03 0.03Pandang-Pandang 0.13 0.13 0.13 0.13 0.13 0.13 0.13 0.13 0.13 0.13 0.13 0.13
1.66 1.66 1.66 1.66 2.16 2.16 2.16 2.16 2.16 2.16 1.66 1.66Industry Takalar Sugar Factory Bissua Weir 0.50 0.50 0.50 0.50 0.50 0.50 0.50 0.50 0.50 0.50 0.50 0.50River Maintenance None None 1.00 1.00 1.00 1.00 1.00 1.00 1.00 1.00 1.00 1.00 1.00 1.00
11.96 3.16 3.16 25.29 33.33 33.27 30.67 17.30 11.25 8.22 3.16 4.60
(unit: 106m3)
Sector Name of User Intake Point Jan. Feb. Mar. Apr. May Jun. Jul. Aug. Sep. Oct. Nov. Dec. AnnualBili-Bili Irrigation Bili-Bili Weie 2.35 0.00 0.00 5.71 7.92 7.64 7.21 3.64 1.96 1.22 0.00 0.38 38.03Bissua Irrigation Bissua Weir 10.72 0.00 0.00 26.11 36.17 34.94 32.93 16.63 8.95 5.56 0.00 1.76 173.77Kampili Irrigation Kampili Weir 10.49 0.00 0.00 25.53 35.37 34.16 32.20 16.26 8.75 5.43 0.00 1.72 169.91
23.56 0.00 0.00 57.36 79.46 76.74 72.33 36.53 19.66 12.21 0.00 3.86 381.70Somba Opu 3.51 3.17 3.51 3.40 3.51 3.40 3.51 3.51 3.40 3.51 3.40 3.51 41.31Ratulangi 0.18 0.17 0.19 0.18 0.19 0.18 0.19 0.19 0.18 0.19 0.18 0.19 2.20Macchini Simbala 0.25 0.22 0.24 0.23 0.24 0.23 0.24 0.24 0.23 0.24 0.23 0.24 2.84Panaikang 0.00 0.00 0.00 0.00 1.34 1.30 1.34 1.34 1.30 1.34 0.00 0.00 7.95Bajeng 0.06 0.05 0.05 0.05 0.05 0.05 0.05 0.05 0.05 0.05 0.05 0.05 0.63Borong Loe 0.04 0.02 0.03 0.03 0.03 0.03 0.03 0.03 0.03 0.03 0.03 0.03 0.33Tompo Balang 0.07 0.07 0.08 0.08 0.08 0.08 0.08 0.08 0.08 0.08 0.08 0.08 0.94Pandang-Pandang 0.35 0.31 0.35 0.34 0.35 0.34 0.35 0.35 0.34 0.35 0.34 0.35 4.11
4.45 4.02 4.45 4.30 5.79 5.60 5.79 5.79 5.60 5.79 4.30 4.45 60.30Industry Takalar Sugar Factory Bissua Weir 1.34 1.21 1.34 1.30 1.34 1.30 1.34 1.34 1.30 1.34 1.30 1.34 15.77River Maintenance None None 2.68 2.42 2.68 2.59 2.68 2.59 2.68 2.68 2.59 2.68 2.59 2.68 31.54
32.03 7.64 8.46 65.55 89.26 86.23 82.14 46.33 29.15 22.01 8.19 12.33 489.31Total
Table 7.2 Diversion Water Requirement Granted by JRBDP for the Source of Jeneberang River
Municipal
PDAM Makassar
PDAM Gowa
Sub-total
Water User Diversion Water Requirement
Irrigation
Total
Sub-total
Municipal
PDAM Makassar
PDAM Gowa
Sub-total
Water User Diversion Water Requirement
Irrigation
Sub-total
T7-3
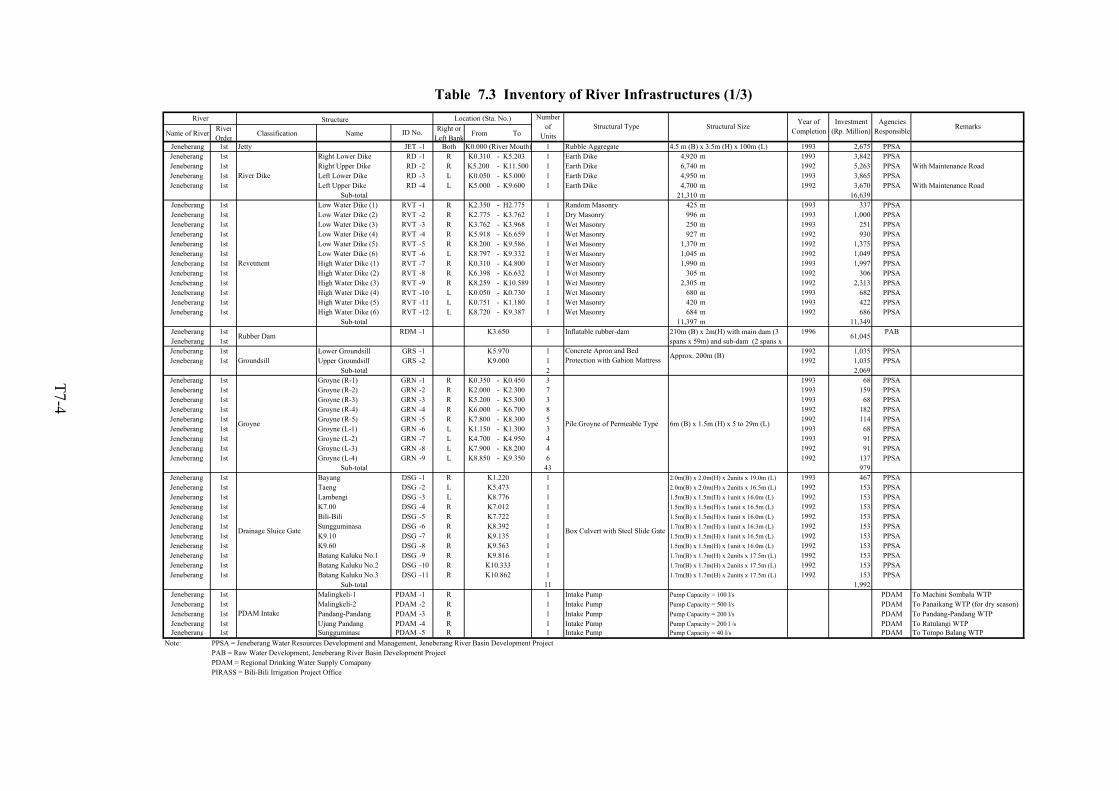
Name of RiverRiver
OrderClassification Name
Right or
Left BankFrom To
Jeneberang 1st Jetty JET -1 Both K0.000 (River Mouth) 1 Rubble Aggregate 1993 2,675 PPSA
Jeneberang 1st Right Lower Dike RD -1 R K0.310 - K5.203 1 Earth Dike 4,920 m 1993 3,842 PPSA
Jeneberang 1st Right Upper Dike RD -2 R K5.200 - K11.500 1 Earth Dike 6,740 m 1992 5,263 PPSA With Maintenance Road
Jeneberang 1st Left Lower Dike RD -3 L K0.050 - K5.000 1 Earth Dike 4,950 m 1993 3,865 PPSA
Jeneberang 1st Left Upper Dike RD -4 L K5.000 - K9.600 1 Earth Dike 4,700 m 1992 3,670 PPSA With Maintenance Road
Sub-total 21,310 m 16,639
Jeneberang 1st Low Water Dike (1) RVT -1 R K2.350 - H2.775 1 Random Masonry 425 m 1993 337 PPSA
Jeneberang 1st Low Water Dike (2) RVT -2 R K2.775 - K3.762 1 Dry Masonry 996 m 1993 1,000 PPSA
Jeneberang 1st Low Water Dike (3) RVT -3 R K3.762 - K3.968 1 Wet Masonry 250 m 1993 251 PPSA
Jeneberang 1st Low Water Dike (4) RVT -4 R K5.918 - K6.659 1 Wet Masonry 927 m 1992 930 PPSA
Jeneberang 1st Low Water Dike (5) RVT -5 R K8.200 - K9.586 1 Wet Masonry 1,370 m 1992 1,375 PPSA
Jeneberang 1st Low Water Dike (6) RVT -6 L K8.797 - K9.332 1 Wet Masonry 1,045 m 1992 1,049 PPSA
Jeneberang 1st High Water Dike (1) RVT -7 R K0.310 - K4.800 1 Wet Masonry 1,990 m 1993 1,997 PPSA
Jeneberang 1st High Water Dike (2) RVT -8 R K6.398 - K6.632 1 Wet Masonry 305 m 1992 306 PPSA
Jeneberang 1st High Water Dike (3) RVT -9 R K8.259 - K10.589 1 Wet Masonry 2,305 m 1992 2,313 PPSA
Jeneberang 1st High Water Dike (4) RVT -10 L K0.050 - K0.730 1 Wet Masonry 680 m 1993 682 PPSA
Jeneberang 1st High Water Dike (5) RVT -11 L K0.751 - K1.180 1 Wet Masonry 420 m 1993 422 PPSA
Jeneberang 1st High Water Dike (6) RVT -12 L K8.720 - K9.387 1 Wet Masonry 684 m 1992 686 PPSA
Sub-total 11,397 m 11,349
Jeneberang 1st RDM -1 K3.650 1 Inflatable rubber-dam 1996 PAB
Jeneberang 1st
Jeneberang 1st Lower Groundsill GRS -1 K5.970 1 1992 1,035 PPSA
Jeneberang 1st Upper Groundsill GRS -2 K9.000 1 1992 1,035 PPSA
Sub-total 2 2,069
Jeneberang 1st Groyne (R-1) GRN -1 R K0.350 - K0.450 3 1993 68 PPSA
Jeneberang 1st Groyne (R-2) GRN -2 R K2.000 - K2.300 7 1993 159 PPSA
Jeneberang 1st Groyne (R-3) GRN -3 R K5.200 - K5.300 3 1993 68 PPSA
Jeneberang 1st Groyne (R-4) GRN -4 R K6.000 - K6.700 8 1992 182 PPSA
Jeneberang 1st Groyne (R-5) GRN -5 R K7.800 - K8.300 5 1992 114 PPSA
Jeneberang 1st Groyne (L-1) GRN -6 L K1.150 - K1.300 3 1993 68 PPSA
Jeneberang 1st Groyne (L-2) GRN -7 L K4.700 - K4.950 4 1993 91 PPSA
Jeneberang 1st Groyne (L-3) GRN -8 L K7.900 - K8.200 4 1992 91 PPSA
Jeneberang 1st Groyne (L-4) GRN -9 L K8.850 - K9.350 6 1992 137 PPSA
Sub-total 43 979
Jeneberang 1st Bayang DSG -1 R K1.220 1 2.0m(B) x 2.0m(H) x 2units x 19.0m (L) 1993 467 PPSA
Jeneberang 1st Taeng DSG -2 L K5.473 1 2.0m(B) x 2.0m(H) x 2units x 16.5m (L) 1992 153 PPSA
Jeneberang 1st Lambengi DSG -3 L K8.776 1 1.5m(B) x 1.5m(H) x 1unit x 16.0m (L) 1992 153 PPSA
Jeneberang 1st K7.00 DSG -4 R K7.012 1 1.5m(B) x 1.5m(H) x 1unit x 16.5m (L) 1992 153 PPSA
Jeneberang 1st Bili-Bili DSG -5 R K7.722 1 1.5m(B) x 1.5m(H) x 1unit x 16.0m (L) 1992 153 PPSA
Jeneberang 1st Sungguminasa DSG -6 R K8.392 1 1.7m(B) x 1.7m(H) x 1unit x 16.3m (L) 1992 153 PPSA
Jeneberang 1st K9.10 DSG -7 R K9.135 1 1.5m(B) x 1.5m(H) x 1unit x 16.5m (L) 1992 153 PPSA
Jeneberang 1st K9.60 DSG -8 R K9.563 1 1.5m(B) x 1.5m(H) x 1unit x 16.0m (L) 1992 153 PPSA
Jeneberang 1st Batang Kaluku No.1 DSG -9 R K9.816 1 1.7m(B) x 1.7m(H) x 2units x 17.5m (L) 1992 153 PPSA
Jeneberang 1st Batang Kaluku No.2 DSG -10 R K10.333 1 1.7m(B) x 1.7m(H) x 2units x 17.5m (L) 1992 153 PPSA
Jeneberang 1st Batang Kaluku No.3 DSG -11 R K10.862 1 1.7m(B) x 1.7m(H) x 2units x 17.5m (L) 1992 153 PPSA
Sub-total 11 1,992
Jeneberang 1st Malingkeli-1 PDAM -1 R 1 Intake Pump PDAM To Machini Sombala WTP
Jeneberang 1st Malingkeli-2 PDAM -2 R 1 Intake Pump Pump Capacity = 500 l/s PDAM To Panaikang WTP (for dry season)
Jeneberang 1st Pandang-Pandang PDAM -3 R 1 Intake Pump PDAM To Pandang-Pandang WTP
Jeneberang 1st Ujung Pandang PDAM -4 R 1 Intake Pump PDAM To Ratulangi WTPJeneberang 1st Sungguminasa PDAM -5 R 1 Intake Pump PDAM To Tompo Balang WTP
Note: PPSA = Jeneberang Water Resources Development and Management, Jeneberang River Basin Development Project
PAB = Raw Water Development, Jeneberang River Basin Development Project
PDAM = Regional Drinking Water Supply Comapany
PIRASS = Bili-Bili Irrigation Project Office
Remarks
Pump Capacity = 200 l /s
Pump Capacity = 40 l/s
Year of
Completion
Investment
(Rp. Million)
Agencies
Responsible
Pump Capacity = 100 l/s
Location (Sta. No.)River
Approx. 200m (B)
Number
of
Units
Structural Size
Concrete Apron and Bed
Protection with Gabion Mattress
Structural Type
4.5 m (B) x 3.5m (H) x 100m (L)
210m (B) x 2m(H) with main dam (3
spans x 59m) and sub-dam (2 spans x
Pump Capacity = 200 l/s
Box Culvert with Steel Slide GateDrainage Sluice Gate
PDAM Intake
River Dike
Revetment
Rubber Dam
Groundsill
Pile Groyne of Permeable Type 6m (B) x 1.5m (H) x 5 to 29m (L)Groyne
Table 7.3 Inventory of River Infrastructures (1/3)
ID No.
Structure
61,045
T7-4

Name of RiverRiver
OrderClassification Name
Right or
Left BankFrom To
Jeneberang 1st Bissua Weir IRRW -1 1 2004 PIRASS Irrigation area of 3,850 ha
Jeneberang 1st (1) Diversion Weir Concrete gravity
Jeneberang 1st (2) Intake Structure L Fixed wheel
Jeneberang 1st Kampili Weir IRRW -2 1 2004 PIRASS Irrigation area of 17,480 ha
Jeneberang 1st (1) Diversion Weir Masonry
Jeneberang 1st (2) Intake Structure L Steel slide
Jeneberang 1st Bili-Bili Weir IRRW -3 1 2004 PIRASS Irrigation area of 2,360 ha
Jeneberang 1st (1) Diversion Weir Concrete gravity
Jeneberang 1st (2) Intake Structure R Fixed wheel
Jeneberang 1st Sub-total 103,539
Jeneberang 1st Bili-Bili BR -1 1 1994 222
Jeneberang 1st Pattalikang BR -2 1 1994 220
Jeneberang 1st Bili-Bili Dam -1 PPSA
Jeneberang 1st (1) Main Dam 1 Center core type rockfill 1999
Jeneberang 1st (2) Left Wing Dam 1 Center core type rockfill 1999
Jeneberang 1st (3) Right Wing Dam 1 Center core type rockfill 1999
Jeneberang 1st (4) Spillway 1 Concrete Chute-way 1999
Jeneberang 1st (5) Intake 1 Inclined 1999
Jeneberang 1st (6) Outlet 1 Jet Flow Gate 1999
Jeneberang 1st Gate Valve
Jeneberang 1st (7) Building 1 RC Building 1999
Jeneberang 1st (8) Micro-power Plant 1 Cross Flow Type of Turbine 2005
Jeneberang 1st
Jeneberang 1st (9) Diversion Tunnel 2 Circular section type 1994 23,346
RWTM -1 PAB
Jeneberang 1st Bayang HYGS -1 1 1997 PPSA
Jeneberang 1st Maccinni Sombala HYGS -2 1 1997
Jeneberang 1st Kampili HYGS -3 1 1997
Jeneberang 1st Bont Jai HYGS -4 1 1997
Jeneberang 1st Jonggoa HYGS -5 1 1997
Jeneberang 1st Sand Pocket Dam SD -1 1 Gravity dam by wet stone masonry 1997 13,035 PPSA
Jeneberang 1st Sand Pocket Dam No.3 SD -2 1 Gravity dam by rubble-concrete 1997 5,887
Jeneberang 1st Sand Pocket Dam No.2 SD -3 1 Gravity dam by wet stone masonry 1998 13,035
Jeneberang 1st Sand Pocket Dam No. 4 SD -4 1 Gravity dam by wet stone masonry 2000 14,725
Jeneberang 1st Sand Pocket Dam No. 5 SD -5 1 Gravity dam by wet stone masonry 2000 12,900
Jeneberang 1st Sabo Dam No. 4 SD -6 1 Gravity dam by wet stone masonry 2000 5,880
Salo Kausisi 2nd Sabo Dam Sabo Dam No. 8 SD -7 1 Gravity dam by wet stone masonry 2001 6,620 PPSA
Jenelata 2nd Jenelata HYGS -6 1 1999 PPSA
Jenelata 2nd Mangempang HYGS -7 1 1997 PPSA
Jenelata 2nd Limbunga HYGS -8 1 1997 PPSA
Salo Malino 2nd Sabo Dam Sabo Dam No. 6 SD -8 1 Gravity dam by wet stone masonry 2001 8,977 PPSA
Salo Malino 2nd Hydrological Gauging Sta. Malino HYGS -9 1 1997 PPSA
Garassi 2nd Bridge Panakkukang BR -3 L K1.247 1 T-Beam 1993 336
Panampu Jetty JET -2 Both K0.000 (River Mouth) 1 RC Boxes/Rubble Stones 1991 1,338 PPSA
Panampu 3rd RVT -13 R 1 4,940 m 1991 1,187 PPSA
Panampu 3rd RVT -14 L 1 4,940 m 1991 1,187 PPSA
Panampu 3rd BR. No.1 BR -4 K0.174 1 Hollow 1991 193
Panampu 3rd BR. No.3 BR -5 K0.796 1 Hollow 1991 460
Panampu 3rd BR. No. D BR -6 K1.295 1 Hollow 1991 216
Panampu 3rd BR. No. 4 BR -7 K2.318 1 Hollow 1991 193
Panampu 3rd BR. No. 5 BR -8 K2.548 1 Hollow 1991 547
Panampu 3rd BR. No. 6 BR -9 K2.926 1 Hollow 1991 539
Panampu 3rd BR. No. 7 BR -10 K3.251 1 Hollow 1991 193
Panampu 3rd BR. No. 8 BR -11 K3.504 1 T-Beam 1991 314
Panampu 3rd BR. No. 10 BR -12 K4.048 1 T-Beam 1991 202Panampu 3rd BR. No. A BR -13 K4.390 1 T-Beam 1991 194Panampu 3rd Pedestrian Bridge BR -14 6 T-Beam 1.5 to 3.0m (B) x 12.0 to 17.1 m (L) 262
Note: PPSA = Jeneberang Water Resources Development and Management, Jeneberang River Basin Development ProjePAB = Raw Water Development, Jeneberang River Basin Development ProjecPDAM = Regional Drinking Water Supply ComapanyPIRASS = Bili-Bili Irrigation Project Office
Trasmission Capacity = 3.3 m3/s1996Raw Water Trasmission
Main (RWTM)
Bili-Bili Dam to
Smba Opu-WTP84,1351
6.63km (L) with 1,650mm in dia.,
10.38km (L) with 1,500mm in dia.Single Pipe LineJeneberang 1st Water Transmission Pipe
Bridge
11.6m (B) x 11.5m (L)
19.8m (B) x 19.0m (L)
7.8m (B) x 17.0m (L)
5.0 m (B) x 3.0m (H) x 50m (L) x 2 unit
7.8m (B) x 17.0m (L)
18.6m (B) x 17.0m (L)
7.8m (B) x 19.0m (L)
7.8m (B) x 17.0m (L)
Gate Valve: 600mm in dia x 2units
9.3m (dia.) X 290m (L) & 300m (L)
Control Gate: 2m in dia
Guard Gate: 3.0m in dia.
1,141 m2, 1-storey
21.8m (B) x 17.0m (L)
18.8m (B) x 11.5m (L)
10m (B) x 73m (H) x 750m (L)
10m (B) x 42m (H) x 646m (L)
10m (B) x 52m (H) x 412m (L)
11.6m (B) x 12.0m (L)
Generator: 380v, 50hz
3m (B) x 465m (L) x 7.0m (H)
4.0m (B) x 29.8m (L)
99.5 to 55m (B) x 225m (L)
47m (H) with
69.0m (L) x 2.0m (H)
239.3m (L) x 8.2m (H)
3.0m (B) x 1.9m (H) x 4gates
3m (B) x 644m (L) x 7.0m (H)
Structural Type Structural Size
Multipurpose Dam
Irrigation Intake
2.5m (B) x 1.2m (H) x 2 gates
2.05m (B) x 1.5m (H) x 4 gates
93,424
10,116
91.0m (L) x 9.0m (H)
River Location (Sta. No.) Number
ofID. No.
Bridge
Hydrological Gauging Sta.
Revetment
Sand Pocket/Sabo Dam
174,797
Hydrological Gauging Sta.
3m (B) x 441m (L) x 7.0m (H)
1,500
900
5.0m (B) x 30.6m (L) (6 spans)
5.0m (B) x 30.4m (L) (6 spans)
3m (B) x 150m (L) x 8.0m (H)
3m (B) x 230m (L) x 10.0m (H)
3m (B) x 104m (L) x 10.0m (H)
3m (B) x 620m (L) x 7.5m (H)
3m (B) x 336m (L) x 7.0m (H)
Table 7.3 Inventory of River Infrastructures (2/3)
Structure Year of
Completion
Investment
(Rp. Million)
Agencies
ResponsibleRemarks
T7-5

Name of RiverRiver
OrderClassification Name
Right or
Left BankFrom To
Panampu 3rd One-box Culvert SCV -1 R Variable 6 Box Culvert 1991 68 PPSA
Panampu 3rd One-box Culvert DSC -2 L Variable 6 1991 68 PPSA
Panampu 3rd Two-box Culvert DSC -3 R K2.015 1 1991 23 PPSA
Jongaya 3rd RVT -15 L 1 6,565 m 1991 1,577 PPSA
Jongaya 3rd RVT -16 R 1 6,565 m 1991 1,577 PPSA
Jongaya 3rd BR. No. B BR -15 K1.000 1 T-Beam 1991 177
Jongaya 3rd BR. No. 11 BR -16 K4.496 1 T-Beam 1991 177
Jongaya 3rd BR. No. 12 BR -17 K4.916 1 T-Beam 1991 119
Jongaya 3rd BR. No. C BR -18 K5.720 1 T-Beam 1991 287
Jongaya 3rd BR. No. 13 BR -19 K6.163 1 T-Beam 1991 349
Jongaya 3rd BR. No. 14 BR -20 K6.772 1 Hollow 1991 316
Jongaya 3rd BR. No. 18 BR -21 K7.235 1 Hollow 1991 216
Jongaya 3rd BR. No. 15 BR -22 K7.773 1 Hollow 1991 354
Jongaya 3rd BR. No. 16 BR -23 K7.982 1 Hollow 1991 354
Jongaya 3rd BR. No. 17 BR -24 K8.153 1 Hollow 1991 216
Jongaya 3rd BR. No. E BR -25 K8.469 1 Hollow 1991 271
Jongaya 3rd BR. No. F BR -26 K9.126 1 Hollow 1991 216
Jongaya 3rd BR. No. H BR -27 K10.147 1 Hollow 1991 216
Jongaya 3rd Pedestrian Bridge BR -28 K11.086 1 T-Beam 1991 76
Jongaya 3rd One-box Culvert DSC -4 L 1 Box Culvert 1.5 m (B) x 1.2m (H) per Box 1991 23 PPSA
Jongaya 3rd One-box Culvert DSC -5 R Variable 2 1991 79 PPSA
Jongaya 3rd Two-box Culvert DSC -6 L Variable 7 1991 91 PPSA
Jongaya 3rd Two-box Culvert DSC -7 R Variable 4 1991 91 PPSA
Sinrijala 4th RVT -17 L Variable 4 2,366 m 1991 569 PPSA
Sinrijala 4th RVT -18 R Variable 1 2,366 m 1991 569 PPSA
Sinrijala 4th Sluice No. 1 DSG -12 L K0.820 Box culvert with movable gates 3.3m(B) x 2.4m(H) x 2units x 48.0m (L) 1991 284 PPSA Intersection with Jl. A.P. Pettarai
Sinrijala 4th Sluice No. 2 DSG -13 L K2.105 1 Box culvert with movable gates 3.3m(B) x 2.4m(H) x 1unit x 12.0m (L) 1991 142 PPSA Intersection with Jl. S. Saddang Baru
Sinrijala 4th One-box Culvert DSC -8 R K0.795 1 Box Culvert 1.5 m (B) x 1.2m (H) per Box 1991 11 PPSA
Sinrijala 4th One-box Culvert DSC -9 K8.835 1 1991 11 PPSA
Sinrijala 4th Fall Fall -1 K2.350 1 RC Structure/Gabion Mattress 3.5m (Upper B) , 5.0m (Lower B), 1.76m (H 1991 2 PPSA
Sinrijala 4th Pedestrian Bridge BR -29 1 T-Beam 1991 151
Pampang 5th Drainage Pump Station DRP -1 2000 PPSA
Pampang 5th (1) Pump 1 Submersible Pump 2000
Pampang 5th (2) Regulation Pond 1 2000
Pampang 5th (3) Spillway 1 Concrete Fix Weir 2000
Pampang 5th Pampang DSG -1 1 Gate with motor drive hoist 1998 PPSA
Pampang 5th Anotong DSG -2 1 Gate with manual operation 1998
Pampang 5th Revetment RVT -19 1 Wet Masonry 1998 PPSA
Pampang 5th Pettarani II BR -30 1 PC girder bridge 1998
Pampang 5th Antong BR -31 1 PC girder bridge 1998
Pampang 5th Sari I BR -32 1 PC girder bridge 1998
Pampang 5th Sari II BR -33 1 PC girder bridge 1998
Pampang 5th Banca BR -34 1 PC girder bridge 1998
Long Storage 2nd Tidal Barrage TB -1 K0.004 to K1.792 5 1993 PAB
Long Storage 2nd (1) Barrage Earth dike 1993
Long Storage 2nd (2) Outlet Sluice Box culvert 1993
Long Storage 2nd (3) Revetment Wet Masonry 1993
Long Storage 2nd (4) Tidal Gate Steel Slide Gate 1993
Long Storage 2nd Gate (A) FG -1 1 Steel Gate 2001 PAB
Long Storage 2nd Gate (B) FG -2 2 Steel Gate 2001 PAB
Long Storage 2nd RVT -19 R 1 Wet Masonry 2300m in length 2001 PAB
Long Storage 2nd RVT -20 L 1 Wet Masonry 2600m in length 2001 PAB
Long Storage 2nd Intake Sluice Gate ISG -1 R K4.054 1 Box culvert with movable gates 1993 1,051 PAB To supply to Long StorageLong Storage 2nd PDAM Intake Maccini Sombala PDAM -6 Intake Pump Pump Capacity = 200 l/s PDAM Closed (To Maccini Sombala WTP)
Note: PPSA = Jeneberang Water Resources Development and Management, Jeneberang River Basin Development Project
PAB = Raw Water Development, Jeneberang River Basin Development Project
PDAM = Regional Drinking Water Supply Comapany
PIRASS = Bili-Bili Irrigation Project Office
11,158
1.0m(B) x 1.6m(H) x 2 gates.
1.1m(B) x 1.3m(H) x 2 gates
L = 22.7 m
L = 22.7 m
L = 22.7 m
1,000m (L)
200m (B) x 200m (L) x 3.5m (H)
11,917
400m in length
2.0m(B) x 2.0m(H) x 2 gates
L = 22.7 m
52,470
17,107L = 33.7 m
2m3/s, (100kw, dia 1m x 3 units)
5.0m (B) x 3.1m (H) x 2 gates
1.5m (B) x 1.5m (H) x 2 gates
11.6m (B) x 10.5m (L)
11.6m (B) x 10.5m (L)
2.5m (B) x 20.9m (L)
360,000m2 (Area) x 3.5m (Depth)
4.3m (H) x 150m (L)
12.8m (B) x 17.0m (L)
7.8m (B) x 19.0m (L)
Table 7.3 Inventory of River Infrastructures (3/3)
River
7.8m (B) x 19.0m (L)
12.8m (B) x 19.0m (L)
12.8m (B) x 19.0m (L)
7.8m (B) x 19.0m (L)
9.8m (B) x 19.0m (L)
2.0m(B) x 2.0m(H) x 2units x 42.74m (L)
1.5 to 3.0m (B) x 10.4m (L)
18.8m (B) x 10.5m (L)
21.8m (B) x 11.0m (L)
Location (Sta. No.) Number
of
Structure
ID. NO
O&M Cost
(Rp.Remarks
Bridge
Revetment
Structural Type Structural SizeYear of
Completion
Investment
(Rp. Million)
7.8m (B) x 10.5m (L)
7.8m (B) x 19.0m (L)
Revetment
Drainage Sluice Culvert
Bridge
Flushing Gate
Revetment
Drainage Sluice Gate
Drainage Sluice Culvert
Drainage Sluice Gate
Drainage Sluice Culvert
1.5 m (B) x 1.2m (H) per Box
T7-6

Table 7.4 Existing Operation and Maintenance Manuals of River Structures
Name of Project Principal Structures in the Project
Principal Contents of O&M Manuals Prepared in
Bili-Bili Dam Bili-Bili Dam Dam operation rule Water control plant Dam control and monitoring system Telecommunication system Micro hydropower plant Dam instrumentation Power supply system Instruction manual of end suction volute pumps
Dec. 1999
Sand Pocket and Sabo Dam
Sand Pocket and Sabo Dam
List of structures and structural features Institutional setup for O&M Budgetary arrangement for O&M Guideline for monitoring on progress of sedimentation Operation guideline for mining of sand trapped in the Structures Maintenance manual of structures
Nov. 2001
Pampang River Improvement Project
Pampang Drainage Pump Regulation Pond Pampang Drainage Channel
List of structures and structural features Institutional setup for O&M Budgetary arrangement for O&M Guideline for the necessary inspection works Guideline for gate and pump operation, Maintenance manual of structures and facilities
Dec. 2001
Lower Jeneberang River Urgent Flood Control Works
Lower Jeneberang Drainage Channel
List of structures and structural features Institutional setup for O&M Budgetary arrangement for O&M Guideline for the necessary inspection works Guideline for operation of drainage sluices Maintenance manual of river channel, structures and facilities
Mar. 1994
Construction of Long Storage
Long Storage List of structures and structural features Organization for O&M Budgetary arrangement for O&M Guideline for the necessary inspection works Guideline for operation of reservoir operation and gate operation Maintenance manual of river channel, structures and facilities
Jan. 2002
Bili-Bili Irrigation Project (Draft)
Bili-Bili Weir Bissua Weir Kampili Weir
List of structures and structural features Organization for O&M Guideline for the necessary inspection works Guideline for operation of Weirs Maintenance manual of structures and facilities Guideline for data collection and evaluation on maintenance works
Aug. 2003
Rubber Dam Construction
Rubber Dam List of structures and structural features Organization for O&M Budgetary arrangement for O&M Guideline for the necessary inspection works Guideline for operation of rubber dam Maintenance manual of structures and facilities
Mar. 1997
Raw Water Transmission Main
Pipe Line List of Structures Operation of gates Maintenance Guideline of gates
Mar. 1999
T7-7

in 2007 in 2011
Routine & Periodical Maintenance 372 372
Overhaul 75 75
Operation 193 193
Overhead 293 356
Sub-total 933 996
Routine & Periodical Maintenance 78 78
Overhaul 21 21
Operation 230 230
Overhead 238 265
Sub-total 566 593
Routine & Periodical Maintenance 103 103
Overhaul 36 36
Operation 132 132
Overhead 82 166
Sub-total 353 437
Routine & Periodical Maintenance - 173
Overhaul - 41
Operation - 84
Overhead - 130
Sub-total - 428
Routine & Periodical Maintenance - 274
Overhaul - -
Operation - -
Overhead - 189
Sub-total - 463
1,852 2,917
188 259
229 278
227 267
209 334
854 1,137
2,706 4,054
Cost in Million Rp.Item Structure/Management Filed Work Item
Bili-Bili Dam/RWTM
Riparian Structure
Sabo Dam
Irrigation Intake Weir
Long Storage/Rubber Dam
Total for O&M
Grand Total
Table 7.5 Summary of O&M Cost of River Infrastructures and Cost for River Management
River
Management
Water Quantity management
Flood Management
Drought Management
River Conservation Management
Total for River Management
O&M
T7-8

000000000
kilometerskilometerskilometerskilometerskilometerskilometerskilometerskilometerskilometers
222222222 444444444
5° 10' S5° 10' S5° 10' S5° 10' S5° 10' S5° 10' S5° 10' S5° 10' S5° 10' S
5° 08' S5° 08' S5° 08' S5° 08' S5° 08' S5° 08' S5° 08' S5° 08' S5° 08' S
5° 12' S5° 12' S5° 12' S5° 12' S5° 12' S5° 12' S5° 12' S5° 12' S5° 12' S
5° 06' S5° 06' S5° 06' S5° 06' S5° 06' S5° 06' S5° 06' S5° 06' S5° 06' S
119
°23
'E119
°23
' E119
°23
' E11
9°23
' E11
9°23
' E11
9°23
' E11
9°23
' E11
9°23
' E11
9°23
' E
119°
27'
E11
9°27'
E11
9°27'
E11
9°27
' E11
9°27'
E11
9°27'
E11
9°27'
E11
9°27'
E11
9°27'
E
119°
25'
E11
9°25'
E11
9°25'
E11
9°25'
E11
9°25'
E11
9°25
' E11
9°25
' E11
9°25
' E11
9°25'
E
5° 04' S5° 04' S5° 04' S5° 04' S5° 04' S5° 04' S5° 04' S5° 04' S5° 04' S
Jl.Ir.
Suta
mi
Jl.Ir.
Suta
mi
Jl.Ir.
Suta
mi
Jl.Ir.
Suta
mi
Jl.Ir.
Suta
mi
Jl.Ir.
Suta
mi
Jl.Ir.
Suta
mi
Jl.Ir.
Suta
mi
Jl.Ir.
Suta
mi
Jl.Je
ndral
Soed
irman
Jl.Je
ndral
Soed
irman
Jl.Je
ndral
Soed
irman
Jl.Je
ndral
Soed
irman
Jl.Je
ndral
Soed
irman
Jl.Je
ndral
Soed
irman
Jl.Je
ndral
Soed
irman
Jl.Je
ndral
Soed
irman
Jl.Je
ndral
Soed
irman
Jl. Sultan Alauddin
Jl. Sultan Alauddin
Jl. Sultan Alauddin
Jl. Sultan Alauddin
Jl. Sultan Alauddin
Jl. Sultan Alauddin
Jl. Sultan Alauddin
Jl. Sultan Alauddin
Jl. Sultan Alauddin
Jl.
AndiPang
era
nPett
ara
ni
Jl.
AndiPang
era
nPett
ara
ni
Jl.
AndiPang
era
nPett
ara
ni
Jl.
AndiPang
era
nPett
ara
ni
Jl.
AndiPang
era
nPett
ara
ni
Jl.
AndiPang
era
nPett
ara
ni
Jl.
AndiPang
era
nPett
ara
ni
Jl.
AndiPang
era
nPett
ara
ni
Jl.
AndiPang
era
nPett
ara
ni
Panam
pu
D/C
Panam
pu
D/C
Panam
pu
D/C
Panam
pu
D/C
Panam
pu
D/C
Panam
pu
D/C
Panam
pu
D/C
Panam
pu
D/C
Panam
pu
D/C
Sinrij
ala
Sinrij
ala
Sinrij
ala
Sinrij
ala
Sinrij
ala
Sinrij
ala
Sinrij
ala
Sinrij
ala
Sinrij
ala
Jonga
yaD/C
Jonga
yaD/C
Jonga
yaD/C
Jonga
yaD/C
Jonga
yaD/C
Jonga
yaD/C
Jonga
yaD/C
Jonga
yaD/C
Jonga
yaD/C
TalloRiver
TalloRiver
TalloRiver
TalloRiver
TalloRiver
TalloRiver
TalloRiver
TalloRiver
TalloRiver
Pampang
Pampang
Pampang
Pampang
Pampang
Pampang
Pampang
Pampang
Pampang
Long Storage
Long Storage
Long Storage
Long Storage
Long Storage
Long Storage
Long Storage
Long Storage
Long Storage
Jeneberang
Jeneberang
Jeneberang
Jeneberang
Jeneberang
Jeneberang
Jeneberang
Jeneberang
JeneberangRive
rRive
rRive
rRive
rRive
rRive
rRive
rRive
rRive
r
Mak
as s a
rSt r a
i t
Mak
as s a
rSt r a
i t
Mak
as s a
rSt r a
i t
Mak
as s a
rSt r a
i t
Mak
as s a
rSt r a
i t
Mak
as s a
rSt r a
i t
Mak
as s a
rSt r a
i t
Mak
as s a
rSt r a
i t
Mak
as s a
rSt r a
i t
Flushing GateFlushing GateFlushing GateFlushing GateFlushing GateFlushing GateFlushing GateFlushing GateFlushing Gate
Tidal GateTidal GateTidal GateTidal GateTidal GateTidal GateTidal GateTidal GateTidal Gate
Rubber DamRubber DamRubber DamRubber DamRubber DamRubber DamRubber DamRubber DamRubber Dam
GroundsillGroundsillGroundsillGroundsillGroundsillGroundsillGroundsillGroundsillGroundsill
Sungguminasa BridgeSungguminasa BridgeSungguminasa BridgeSungguminasa BridgeSungguminasa BridgeSungguminasa BridgeSungguminasa BridgeSungguminasa BridgeSungguminasa Bridge
Control GateControl GateControl GateControl GateControl GateControl GateControl GateControl GateControl Gate
Control GateControl GateControl GateControl GateControl GateControl GateControl GateControl GateControl Gate
Legend:Legend:Legend:Legend:Legend:Legend:Legend:Legend:Legend:
River and Primary Drainage CanalRiver and Primary Drainage CanalRiver and Primary Drainage CanalRiver and Primary Drainage CanalRiver and Primary Drainage CanalRiver and Primary Drainage CanalRiver and Primary Drainage CanalRiver and Primary Drainage CanalRiver and Primary Drainage Canal
Kota/Kabupaten BoundaryKota/Kabupaten BoundaryKota/Kabupaten BoundaryKota/Kabupaten BoundaryKota/Kabupaten BoundaryKota/Kabupaten BoundaryKota/Kabupaten BoundaryKota/Kabupaten BoundaryKota/Kabupaten Boundary
Embankment (River Improvement Section)Embankment (River Improvement Section)Embankment (River Improvement Section)Embankment (River Improvement Section)Embankment (River Improvement Section)Embankment (River Improvement Section)Embankment (River Improvement Section)Embankment (River Improvement Section)Embankment (River Improvement Section)
Figure 7.1 River Control Structures in Lower Jeneberang River Basin
JettyJettyJettyJettyJettyJettyJettyJettyJetty
Jl. Urip Sumohardjo
Jl. Urip Sumohardjo
Jl. Urip Sumohardjo
Jl. Urip Sumohardjo
Jl. Urip Sumohardjo
Jl. Urip Sumohardjo
Jl. Urip Sumohardjo
Jl. Urip Sumohardjo
Jl. Urip Sumohardjo
Control GateControl GateControl GateControl GateControl GateControl GateControl GateControl GateControl Gate
ToTa
kalar To Malino
PumpingPumpingPumpingPumpingPumpingPumpingPumpingPumpingPumping
StationStationStationStationStationStationStationStationStation
Regulation PondRegulation PondRegulation PondRegulation PondRegulation PondRegulation PondRegulation PondRegulation PondRegulation Pond
SwampSwampSwampSwampSwampSwampSwampSwampSwamp
River
River
River
River
RiverRiv
erRiv
erRiverRiver
NNNNNNNNN
Kota MakassarKota MakassarKota MakassarKota MakassarKota MakassarKota MakassarKota MakassarKota MakassarKota Makassar
Kabupaten GowaKabupaten GowaKabupaten GowaKabupaten GowaKabupaten GowaKabupaten GowaKabupaten GowaKabupaten GowaKabupaten Gowa
F7-1

JENE
Salo Manapa
BERANG
Salo
Bula
ng
Salo Malino
JENE BERANG
Salo Malino
SaloAhuw
a
Parang
TakapalaSalo
Salo
KausisiSaloAngasia
SaloPatene
Salo
Kampala
Balang
Jene
BinangaSalo
Bengo
Binanga Patteteang
Rakikang
Bengo
Sapaya
Binanga Jajang
Binanga
Tokka
Binanga
Jene lata
Salo
JENE
BERANG
Garassi
ééééééééé
ééééééééé
ééééééééé
0
kilometers
5 10
Bili Bili ReservoirBili Bili ReservoirBili Bili ReservoirBili Bili ReservoirBili Bili ReservoirBili Bili ReservoirBili Bili ReservoirBili Bili ReservoirBili Bili Reservoir
119°40'
E119°
40'E
119°40'
E119°
40'E
119°40'
E119°
40'E
119°40'
E119°
40'E
119°40'
E
119°45'
E119°
45'E
119°45'
E119°
45'E
119°45'
E119°
45'E
119°45'
E119°
45'E
119°45'
E
19°55'
E119°
55'E
119°55'
E19°
55'E
119°55'
E19°
55'E
119°55'
E119°
55'E
119°55'
E
119°50'
E119°
50'E
119°50'
E119°
50'E
119°50'
E119°
50'E
119°50'
E119°
50'E
119°50'
E
119°35'
E119°
35'E
119°35'
E119°
35'E
119°35'
E119°
35'E
119°35'
E119°
35'E
119°35'
E
119°30'
E119°
30'E
119°30'
E119°
30'E
119°30'
E119°
30'E
119°30'
E119°
30'E
119°30'
E
119°25'
E119°
25'E
119°25'
E119°
25'E
119°25'
E119°
25'E
119°25'
E119°
25'E
119°25'
E
5° 25' S5° 25' S5° 25' S5° 25' S5° 25' S5° 25' S5° 25' S5° 25' S5° 25' S
5° 20' S5° 20' S5° 20' S5° 20' S5° 20' S5° 20' S5° 20' S5° 20' S5° 20' S
5° 15' S5° 15' S5° 15' S5° 15' S5° 15' S5° 15' S5° 15' S5° 15' S5° 15' S
5° 10' S5° 10' S5° 10' S5° 10' S5° 10' S5° 10' S5° 10' S5° 10' S5° 10' S
Legend
River
River Basin Boundary
City/Regional Urban Center
Existing Water Resources Facilities Figure 7.2 River Structures in Upper Jeneberang River Basin
Mak
assa
rSt
rait
NNNNNNNNNRiver StructuresRiver StructuresRiver StructuresRiver StructuresRiver StructuresRiver StructuresRiver StructuresRiver StructuresRiver Structuresin Lower Jeneberang River Basinin Lower Jeneberang River Basinin Lower Jeneberang River Basinin Lower Jeneberang River Basinin Lower Jeneberang River Basinin Lower Jeneberang River Basinin Lower Jeneberang River Basinin Lower Jeneberang River Basinin Lower Jeneberang River Basin
Somba Opu Water Treatment PlantSomba Opu Water Treatment PlantSomba Opu Water Treatment PlantSomba Opu Water Treatment PlantSomba Opu Water Treatment PlantSomba Opu Water Treatment PlantSomba Opu Water Treatment PlantSomba Opu Water Treatment PlantSomba Opu Water Treatment Plant
Raw Main Water TransmissionRaw Main Water TransmissionRaw Main Water TransmissionRaw Main Water TransmissionRaw Main Water TransmissionRaw Main Water TransmissionRaw Main Water TransmissionRaw Main Water TransmissionRaw Main Water Transmission
Kampili Irrigation WeirKampili Irrigation WeirKampili Irrigation WeirKampili Irrigation WeirKampili Irrigation WeirKampili Irrigation WeirKampili Irrigation WeirKampili Irrigation WeirKampili Irrigation Weir
Bissua Irrigation WeirBissua Irrigation WeirBissua Irrigation WeirBissua Irrigation WeirBissua Irrigation WeirBissua Irrigation WeirBissua Irrigation WeirBissua Irrigation WeirBissua Irrigation Weir
Bili Bili Irrigation WeirBili Bili Irrigation WeirBili Bili Irrigation WeirBili Bili Irrigation WeirBili Bili Irrigation WeirBili Bili Irrigation WeirBili Bili Irrigation WeirBili Bili Irrigation WeirBili Bili Irrigation Weir
SP 1SP 1SP 1SP 1SP 1SP 1SP 1SP 1SP 1
SP 2SP 2SP 2SP 2SP 2SP 2SP 2SP 2SP 2
SP 3SP 3SP 3SP 3SP 3SP 3SP 3SP 3SP 3
SP 4SP 4SP 4SP 4SP 4SP 4SP 4SP 4SP 4
SP 5SP 5SP 5SP 5SP 5SP 5SP 5SP 5SP 5SB 6SB 6SB 6SB 6SB 6SB 6SB 6SB 6SB 6
SB 4SB 4SB 4SB 4SB 4SB 4SB 4SB 4SB 4
SB 8SB 8SB 8SB 8SB 8SB 8SB 8SB 8SB 8
Sand Pocket DamSand Pocket DamSand Pocket DamSand Pocket DamSand Pocket DamSand Pocket DamSand Pocket DamSand Pocket DamSand Pocket Dam
Sabo DamSabo DamSabo DamSabo DamSabo DamSabo DamSabo DamSabo DamSabo Dam
F7-2

F7-3

Figure 7.4 Results of Flood Control by Bili- Bili Dam
Feb. 04, 2000 Flood
0
500
1000
1500
2000
2500
Dis
char
ge
(m3
/s)
Feb. 01, 2002 Flood
0
500
1,000
1,500
2,000
2,500D
isch
arg
e (m
3/s
)
Dam Inflow
(Qmax =1,960m3/s)
Dam Outflow
(Qmax =850m3/s)
Flood Control Volume
(=14.6 mil m3)
Dam Inflow
(Qmax =1,670m3/s)
Dam Outflow
(Qmax =900m3/s)
Flood Control Volume
(=14.6 mil m3)
Discharge at Sungguminasa
Br. without control by Dam
(Qmax =2,560m3/s)
Discharge at Sungguminasa
Br. with control by Dam
(Qmax =1,650m3/s)
F7-4

a
River bank River bank
Notes:
a : River area to be managed by Public Corporationb : River Corridorc : W = 3m in urban area, W = 5m in rural aread : River dike areae : Flood channel
River with Dike
a
River bank
Notes:
a : River area to be managed by Public Corporationb : River corridor ( W = 100 m ( A > 500 km2 ), W = 50 m ( A < 500 km2 ) )
River without Dike
Figure 7.5 River Area to be Managed by Public Corporation
c d e cde
b b
b b
F7-5

Malino WTPQ = 10 L /s
Bili-Bili DamRaw water transmission pipefrom Bili-Bili Dam
Borong Loe WTPQ
1 = 0.01 m3/s
Q2 = 0.02 m3/s
Takalar Sugar FactoryQ = 0.5 m3/s
Bissua Weir
Bajeng WTPQ
1 = 0.02 m3/s
Q2 = 0.02 m3/s
Kampiri Weir
Somba Opu WTPQ
1 = 1.31 m3/s
Q2 = 1.00 m3/s
Tompo Balang WTPQ
1 = 0.03 m3/s
Q2 = 0.04 m3/s
Ratulangi WTPQ
1 = 0.07 m3/s
Q2 = 0.05 m3/s
Panaikang WTPQ
2 = 1,000 L/s
Q1 = 500 L/s
(for dry season)
Pandang-Pandang WTPQ
1 = 0.13 m3/s
Q2 = 0.20 m3/s
Maccini Sombala WTPQ1 = 0.09 m3/sQ2 = 0.20 m3/s
Long Storage
Flushing / Dilluting Waterfor dry season
Legend
Water Treatment Plant
Intake Weir
1. WTP : Water Treatment Plant2. Q1: Necessary intake discharge
for up-dated treatmentcapacity of WTPA (includingconveyance loss)
3. Q2: Designed treatment capacityof WTP
Notes
Rubber Dam
Makassar Strait
Figure 7.6 Water Allocation Plan
Bili-Bili WeirBili-Bili Irrigation Area
Qmax = 2.96 m3/s
Irrigation Canal
F7-6
Jene
bera
ng R
iver

Figure 7.7 Fluctuation of Reservoir Water Levels
60.0
70.0
80.0
90.0
100.0
110.0
'72/'73 '73/'74 '74/'75 '75/'76 '76/'77
60.0
70.0
80.0
90.0
100.0
110.0
'77/'78 '78/'79 '79/'80 '80/'81 '81/'82
60.0
70.0
80.0
90.0
100.0
110.0
'82/'83 '83/'84 '84/'85 '85/'86 '86/'87
60.0
70.0
80.0
90.0
100.0
110.0
'87/'88 '88/'89 '89/'90 '90/'91 '91/'92
60.0
70.0
80.0
90.0
100.0
110.0
'92/'93 '93/'94 '94/'95 '95/'96 '96/'97
60.0
70.0
80.0
90.0
100.0
110.0
'97/'98 '98/'99 '99/'00 '00/'01
Reservoir W.L.
Rule Curve
LWL
EL. 66.5m
HWL
EL. 99.5m
LWL
EL. 66.5m
LWL
EL. 66.5m
LWL
EL. 66.5m
LWL
EL. 66.5m
LWL
EL. 66.5m
HWL
EL. 99.5m
HWL
EL. 99.5m
HWL
EL. 99.5m
HWL
EL. 99.5m
HWL
EL. 99.5m
Drought
Period
Drought
Period
Drought
Period
F7-7

Figure 7.8 Simulated Reservoir Water Level and Rule Curve
88.5
84.0
79.5
75.0
70.5
66.0 66.0
70.5
75.0
88.5
66.0
79.5
84.0
60
65
70
75
80
85
90
95
100
105
Jun
July
Aug
Sept
Oct
Nov Dec Ja
n
Feb Mar
Apr
May Ju
n
Month
Wat
er L
evel
(E
L.
m)
Note:
The lines other than "Rule Curve"
presents the simulated reservoir
water levels from 1972 to 2000.Rule Curve
W.L. in '72/73 W.L. in '82/83W.L. in '97/98
LWL (EL. 65m)
NWL (EL. 99.5m)
F7-8

Note:
RWL : Reservoir Water Level
OP: Reservoir Operation Applied to Drought
60
70
80
90
100
110
120
Jun Jul Aug Sep Oct Nov Dec Jan Feb Mar Apr May
Res
erv
oir
Wat
er L
evel
(E
L.
m)
0102030405060708090100110120130140150160170180190200210220230240250260270280290300310320330340350360370380390400
Bas
in R
unof
f D
isch
arge
(10
6m
3)
0
5
10
15
20
Wat
er D
eman
d f
or
Irri
gat
ion
(m
illi
on
m3)
Requirement to Wet Paddy
Requirement to Dry Paddy
Requirement to Palawija
Reduced Supply
Rule Curve
RWL w/ OP
RWL w/o OP
Period of OP:
Figure 7.9 (1/3)
Reservoir Water Level with- and without
Drought Operation against Flow Regime in
1972
(1) 55% reduction of supply for dry paddy
(2) 100% reduction of supply for parawija
F7-9

Note:
RWL : Reservoir Water Level
OP: Reservoir Operation Applied to Drought
60
70
80
90
100
110
120
Jun Jul Aug Sep Oct Nov Dec Jan Feb Mar Apr May
Res
erv
oir
Wat
er L
evel
(E
L. m
)
0102030405060708090100110120130140150160170180190200210220230240250260270280290300310320330340350360370380390400
Bas
in R
un
off
Dis
char
ge
(106
m3)
0
5
10
15
20
Wat
er D
eman
d f
or
Irri
gat
ion
(m
illi
on
m3)
Requirement to W. Paddy
Requirement to D. Paddy
Requirement to Palawija
Reduced Supply
Rule Curve
RWL w/ OP
RWL w/o OP
Figure 7.9 (2/3)
Reservoir Water Level with- and without
Drought Operation against Flow Regime in
1982
Peiod of OP
(1) 20% reduction of supply for wet
paddy
F7-10

Note:
RWL : Reservoir Water Level
OP: Reservoir Operation Applied to Drought
60
70
80
90
100
110
120
Jun Jul Aug Sep Oct Nov Dec Jan Feb Mar Apr May
Res
ervo
ir W
ater
Lev
el (
EL
. m
)
0102030405060708090100110120130140150160170180190200210220230240250260270280290300310320330340350360370380390400
Bas
in R
unof
f D
isch
arge
(10
6m
3)
0
5
10
15
20
Wat
er D
eman
d f
or
Irri
gat
ion
(m
illi
on
m3)
Requirement to W. Paddy
Requirement to D. Paddy
Requirement to Palawija
Reduced Supply
Rule Curve
RWL w/ OP
RWL w/o OP
Figure 7.9 (3/3)
Reservoir Water Level with- and without
Drought Operation against Flow Regime in
1997/1998
Peiod of 1st OP
100% reduction of supply for parawija
F7-11

SaloSaloSaloSaloSaloSaloSaloSaloSalo Garassi
Garassi
Garassi
Garassi
Garassi
Garassi
Garassi
Garassi
Garassi
Burunguntea
Burunguntea
Burunguntea
Burunguntea
Burunguntea
Burunguntea
Burunguntea
Burunguntea
Burunguntea
Salo
Salo
SaloSalo
SaloSalo
Salo
SaloSalo
SaloSaloSaloSaloSaloSaloSaloSaloSaloBo
ntorea
Bonto
rea
Bonto
rea
Bonto
rea
Bonto
rea
Bonto
rea
Bonto
rea
Bonto
rea
Bonto
rea
JENE
JENE
JENE
JENE
JENE
JENE
JENE
JENE
JENE
BERANGBERANGBERANG
BERANGBERANG
BERANGBERANGBERANG
BERANG
latalatalatalatalatalatalatalatalataJeneJeneJeneJene
JeneJeneJeneJeneJene
Binanga Jajang
Binanga Jajang
Binanga Jajang
Binanga Jajang
Binanga Jajang
Binanga Jajang
Binanga Jajang
Binanga Jajang
Binanga Jajang
Be laBe laBe laBe laBe laBe laBe laBe laBe la
PunranganPunranganPunranganPunranganPunranganPunranganPunranganPunranganPunrangan
BinangaBinangaBinanga
BinangaBinanga
BinangaBinangaBinanga
Binanga
SapayaSapayaSapaya
SapayaSapaya
SapayaSapayaSapaya
Sapaya
TokkaTokkaTokkaTokkaTokkaTokkaTokkaTokkaTokka
BinangaBinangaBinangaBinangaBinangaBinangaBinangaBinangaBinanga
JeneJeneJeneJeneJeneJeneJeneJeneJene RakikangRakikangRakikangRakikang
RakikangRakikangRakikangRakikangRakikang
ManggunturuManggunturuManggunturuManggunturuManggunturuManggunturuManggunturuManggunturuManggunturu
Binanga Patteteang
Binanga Patteteang
Binanga Patteteang
Binanga Patteteang
Binanga Patteteang
Binanga Patteteang
Binanga Patteteang
Binanga Patteteang
Binanga Patteteang
Binanga
Binanga
Binanga
Binanga
Binanga
Binanga
Binanga
Binanga
Binanga
Tallan
ggantarang
Tallan
ggantarang
Tallan
ggantarang
Tallan
ggantarang
Tallan
ggantarang
Tallan
ggantar ang
Tallan
ggantar ang
Tallan
ggantar ang
Tallan
ggantarangBinanga
Binanga
Binanga
Binanga
Binanga
Binanga
Binanga
Binanga
Binanga
SaloBengo
SaloBengo
SaloBengo
SaloBengo
SaloBengo
SaloBengo
SaloBengo
SaloBengo
SaloBengo
Parig
i/Asan
a
Parig
i/Asan
a
Parig
i/Asan
a
Parig
i/Asan
a
Parig
i/Asan
a
Parig
i/Asan
a
Parig
i/Asan
a
Parig
i/Asan
a
Parig
i/Asan
a
Bulu
Tan
ete
lang
Bulu
Tan
ete
lang
Bulu
Tan
ete
lang
Bulu
Tan
ete
lang
Bulu
Tan
ete
lang
Bulu
Tan
ete
lang
Bulu
Tan
ete
lang
Bulu
Tan
ete
lang
Bulu
Tan
ete
lang
Balan
g
Balan
g
Balan
gBa
lang
Balan
gBa
lang
Balan
g
Balan
gBa
lang
Bengo
Beng
oBe
ngo
Bengo
Be
ngo
Bengo
Beng
oBe
ngo
Beng
o
KampalaKampalaKampalaKampalaKampalaKampalaKampalaKampalaKampala
Salo Malino
Salo Malino
Salo MalinoSalo Malino
Salo MalinoSalo Malino
Salo Malino
Salo Malino
Salo Malino
JENE BERANGJENE BERANGJENE BERANGJENE BERANGJENE BERANGJENE BERANGJENE BERANGJENE BERANGJENE BERANG
Salo Angasia
SaloAngasia
Salo Angasia
Salo Angasia
Salo Angasia
Salo Angasia
SaloAngasia
Salo Angasia
SaloAngasia
SaloPatene
SaloPatene
SaloPatene
SaloPatene
SaloPatene
SaloPatene
SaloPatene
SaloPatene
SaloPatene
SaloSaloSaloSaloSaloSaloSaloSaloSaloKausisi
Kausisi
Kausisi
KausisiKausisi
Kausisi
Kausisi
Kausisi
Kausisi
SaloKan
ipa
SaloKan
ipa
SaloKan
ipa
SaloKan
ipa
SaloKan
ipa
SaloKan
ipa
SaloKan
ipa
SaloKan
ipa
SaloKan
ipa
Salo Malino
Salo Malino
Salo Malino
Salo Malino
Salo Malino
Salo Malino
Salo Malino
Salo Malino
Salo Malino
SaloAh
uwa
SaloAh
uwa
SaloAh
uwa
SaloAh
uwa
SaloAh
uwa
SaloAh
uwa
SaloAh
uwa
SaloAh
uwa
SaloAh
uwa
Salo
Bula
ng
Salo
Bula
ng
Salo
Bula
ng
Salo
Bula
ng
Salo
Bula
ng
Salo
Bula
ng
Salo
Bula
ng
Salo
Bula
ng
Salo
Bula
ng
TakapalaTakapalaTakapalaTakapalaTakapalaTakapalaTakapalaTakapalaTakapalaSa
loSa
loSa
loSalo
SaloSalo
Salo
SaloSalo
Pa rangPa rangPa rangPa rangPa rangPa rangPa rangPa rangPa rang
JENEJENEJENE
JENEJENE
JENEJENEJENEJENE
SaloSaloSaloSaloSaloSaloSaloSaloSalo
BERANGBERANGBERANG
BERANGBERANG
BERANGBERANGBERANG
BERANG
000000000 101010101010101010
kilometerskilometerskilometerskilometerskilometerskilometerskilometerskilometerskilometers
202020202020202020
Bili Bili ReservoirBili Bili ReservoirBili Bili ReservoirBili Bili ReservoirBili Bili ReservoirBili Bili ReservoirBili Bili ReservoirBili Bili ReservoirBili Bili Reservoir
119
°45'
E119
°45'E
119
°45'E
119
°45'
E119
°45'E
119
°45'
E119
°45'E
119
°45'E
119
°45'E
119
°35'
E119
°35'E
119
°35'E
119
°35'
E119
°35'E
119
°35'
E119
°35'E
119
°35'E
119
°35'E
119
°40 '
E119
°40'E
119
°40'E
119
°40 '
E119
°40'E
119
°40'
E119
°40' E
119
°40' E
119
°40'E
5° 25' S5° 25' S5° 25' S5° 25' S5° 25' S5° 25' S5° 25' S5° 25' S5° 25' S
119
°55
'E119
°55
'E11
9°
5 5'E
119
°55
'E11
9°
5 5'E
119
°55
'E119
°55
'E11
9°
5 5'E
119
°55
'E
119
°50
' E119
°50
' E119
°50
' E11
9°
50
' E119
°50
' E11
9°
50
'E119
°50
'E119
°50
'E119
°50
' E
119
°30 '
E119
°30'E
119
°30'E
119
°30 '
E119
°30'E
119
°30'
E119
°30' E
119
°30' E
119
°30'E
119
°25'
E119
°25'E
119
°25'E
119
°25'
E119
°25'E
119
°25'
E119
°25'E
119
°25'E
119
°25'E
5° 10' S5° 10' S5° 10' S5° 10' S5° 10' S5° 10' S5° 10' S5° 10' S5° 10' S
5° 20' S5° 20' S5° 20' S5° 20' S5° 20' S5° 20' S5° 20' S5° 20' S5° 20' S
5° 15' S5° 15' S5° 15' S5° 15' S5° 15' S5° 15' S5° 15' S5° 15' S5° 15' S
5 05 S5 05 S5 05 S5 05 S5 05 S5 05 S
JonggoaJonggoaJonggoaJonggoaJonggoaJonggoaJonggoaJonggoaJonggoa
BontojaiBontojaiBontojaiBontojaiBontojaiBontojaiBontojaiBontojaiBontojai
JenelataJenelataJenelataJenelataJenelataJenelataJenelataJenelataJenelata
Bili-biliBili-biliBili-biliBili-biliBili-biliBili-biliBili-biliBili-biliBili-biliKampiliKampiliKampiliKampiliKampiliKampiliKampiliKampiliKampili
Macini SombalaMacini SombalaMacini SombalaMacini SombalaMacini SombalaMacini SombalaMacini SombalaMacini SombalaMacini SombalaBayangBayangBayangBayangBayangBayangBayangBayangBayang
MalinoMalinoMalinoMalinoMalinoMalinoMalinoMalinoMalino
LimbungaLimbungaLimbungaLimbungaLimbungaLimbungaLimbungaLimbungaLimbunga
MangempangMangempangMangempangMangempangMangempangMangempangMangempangMangempangMangempang
01261261261261261261261261260124124124
124124124124124124
NORTH NORTH NORTH NORTH NORTH NORTH NORTH NORTH NORTH SULAWESISULAWESISULAWESISULAWESISULAWESISULAWESISULAWESISULAWESISULAWESI
CENTRAL SULAWESICENTRAL SULAWESICENTRAL SULAWESICENTRAL SULAWESICENTRAL SULAWESICENTRAL SULAWESICENTRAL SULAWESICENTRAL SULAWESICENTRAL SULAWESI
KendariKendariKendariKendariKendariKendariKendariKendariKendari
ManadoManadoManadoManadoManadoManadoManadoManadoManado
GorontaloGorontaloGorontaloGorontaloGorontaloGorontaloGorontaloGorontaloGorontalo
GORONTALOGORONTALOGORONTALOGORONTALOGORONTALOGORONTALOGORONTALOGORONTALOGORONTALO
WatamponeWatamponeWatamponeWatamponeWatamponeWatamponeWatamponeWatamponeWatampone
SOUTH EASTSOUTH EASTSOUTH EASTSOUTH EASTSOUTH EASTSOUTH EASTSOUTH EASTSOUTH EASTSOUTH EASTSULAWESISULAWESISULAWESISULAWESISULAWESISULAWESISULAWESISULAWESISULAWESIMakassarMakassarMakassarMakassarMakassarMakassarMakassarMakassarMakassar
MamujuMamujuMamujuMamujuMamujuMamujuMamujuMamujuMamuju
WESTWESTWESTWESTWESTWESTWESTWESTWESTSULAWESISULAWESISULAWESISULAWESISULAWESISULAWESISULAWESISULAWESISULAWESI
NNNNNNNNN
0120120120120120120120120120118118118
118118118118118118 122122122
122122122122122122
PalopoPalopoPalopoPalopoPalopoPalopoPalopoPalopoPalopo
SOUTH SULAWESISOUTH SULAWESISOUTH SULAWESISOUTH SULAWESISOUTH SULAWESISOUTH SULAWESISOUTH SULAWESISOUTH SULAWESISOUTH SULAWESI
0
PosoPosoPosoPosoPosoPosoPosoPosoPoso
PaluPaluPaluPaluPaluPaluPaluPaluPalu
STUDY AREA0
0
666666666
0000000000
0444444444
2222222220
Legend
Bili Bili Reservoir
Study Area Boundary
Road
River
Telemetry Rain Gauge Station
Telemetry Water Level Gauge Station
Telemetry Rain/Water Level Gauge Station
Mak
assa
r Stra
it
Mak
assa
r Stra
it
Mak
assa
r Stra
it
Mak
assa
r Stra
it
Mak
assa
r Stra
it
Mak
assa
r Stra
it
Mak
assa
r Stra
it
Mak
assa
r Stra
it
Mak
assa
r Stra
it
Data Source: Bili-Bili Multipurpose Dam Project, 2004Data Source: Bili-Bili Multipurpose Dam Project, 2004Data Source: Bili-Bili Multipurpose Dam Project, 2004Data Source: Bili-Bili Multipurpose Dam Project, 2004Data Source: Bili-Bili Multipurpose Dam Project, 2004Data Source: Bili-Bili Multipurpose Dam Project, 2004Data Source: Bili-Bili Multipurpose Dam Project, 2004Data Source: Bili-Bili Multipurpose Dam Project, 2004Data Source: Bili-Bili Multipurpose Dam Project, 2004
Patalikang BridgePatalikang BridgePatalikang BridgePatalikang BridgePatalikang BridgePatalikang BridgePatalikang BridgePatalikang BridgePatalikang Bridge
Principal Monitoring PointsPrincipal Monitoring PointsPrincipal Monitoring PointsPrincipal Monitoring PointsPrincipal Monitoring PointsPrincipal Monitoring PointsPrincipal Monitoring PointsPrincipal Monitoring PointsPrincipal Monitoring Points
Figure 7.10 Telemetry Flood Monitoring Point
F-12

2.52.52.5
2.52.5
2.52.52.5
2.5
1.25
1.25
1.25
1.25
1.25
1.25
1.25
1.25
1.25
KilometersKilometersKilometersKilometersKilometersKilometersKilometersKilometersKilometers
000000000
MakassarMakassarMakassarMakassarMakassarMakassarMakassarMakassarMakassar
Ujung PandangUjung PandangUjung PandangUjung PandangUjung PandangUjung PandangUjung PandangUjung PandangUjung Pandang
PanakkukangPanakkukangPanakkukangPanakkukangPanakkukangPanakkukangPanakkukangPanakkukangPanakkukang
Somba OpuSomba OpuSomba OpuSomba OpuSomba OpuSomba OpuSomba OpuSomba OpuSomba Opu
TamalateTamalateTamalateTamalateTamalateTamalateTamalateTamalateTamalate
MarisoMarisoMarisoMarisoMarisoMarisoMarisoMarisoMariso
PallanggaPallanggaPallanggaPallanggaPallanggaPallanggaPallanggaPallanggaPallangga
Bonto alaBonto alaBonto alaBonto alaBonto alaBonto alaBonto alaBonto alaBonto ala
Tallo
Tallo
Tallo
Tallo
Tallo
Tallo
Tallo
Tallo
Tallo
BiringkanayaBiringkanayaBiringkanayaBiringkanayaBiringkanayaBiringkanayaBiringkanayaBiringkanayaBiringkanaya
Galesong UtaraGalesong UtaraGalesong UtaraGalesong UtaraGalesong UtaraGalesong UtaraGalesong UtaraGalesong UtaraGalesong Utara
Ujung TanahUjung TanahUjung TanahUjung TanahUjung TanahUjung TanahUjung TanahUjung TanahUjung Tanah
WajoWajoWajoWajoWajoWajoWajoWajoWajo
MamajangMamajangMamajangMamajangMamajangMamajangMamajangMamajangMamajang
Legend
Potential Flooding Area(Flooded in 1976)
Potential Flooded Area(Not flooded in 1976)
Road
River
Kabupaten Boundary
Kecamatan BoundaryFigure 7.11 Potential Flood Area
NNNNNNNNN
F7-13
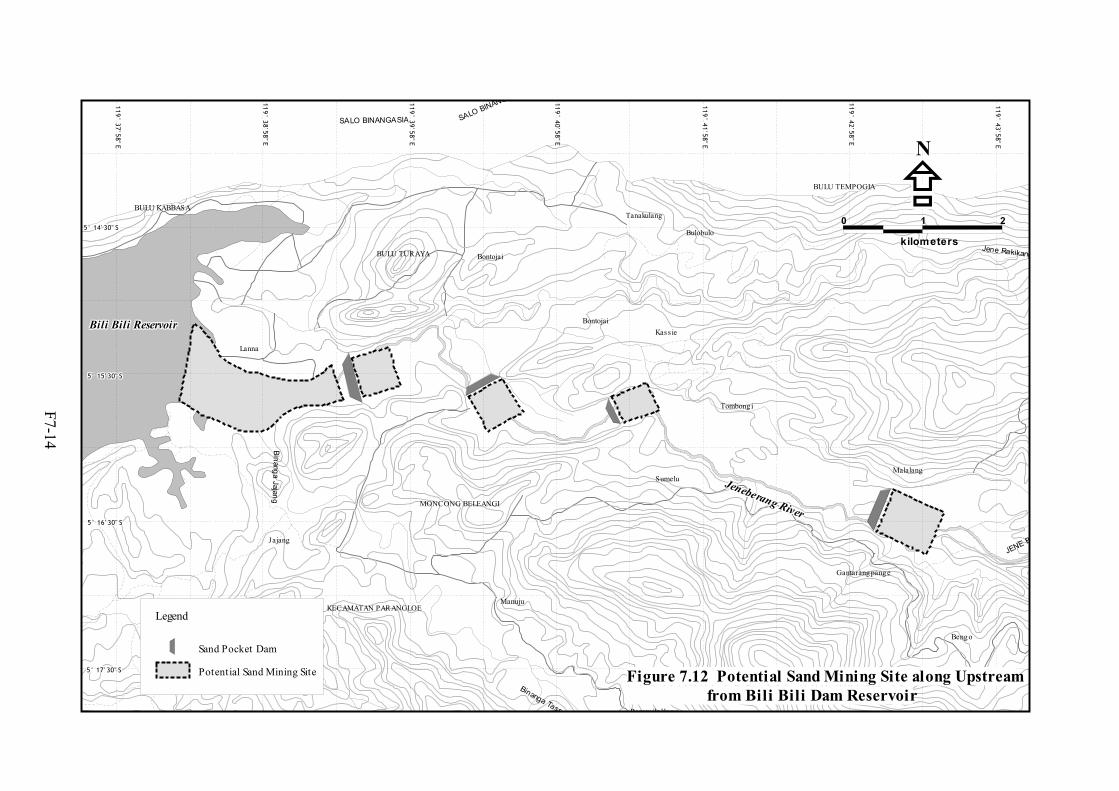
Porong
Bontojai
Jajang
Lanna
MONCONG BELEANGI
Kass ie
Sumelu
Manuju
Bin
anga
Jajang
JENE BERANG
KECAMATAN PARANGLOE
Panynyikokkang
Bengo
Binanga Tasse
Tombong i
Gantarang pang e
Malalang
JENE BE
Parang
BULU KABBASA
Jene Bontomalangngere BontojaiBULU TURAYA
SALO BINANGA
SALO BINANGASIA
Bulobulo
Tanakulang
BULU TEMPOGIA
Jene Rakikang
0 1
kilometers
2
5° 17' 30" S5° 17' 30" S5° 17' 30" S5° 17' 30" S5° 17' 30" S5° 17' 30" S5° 17' 30" S5° 17' 30" S5° 17' 30" S
5° 16' 30" S5° 16' 30" S5° 16' 30" S5° 16' 30" S5° 16' 30" S5° 16' 30" S5° 16' 30" S5° 16' 30" S5° 16' 30" S
5° 15' 30" S5° 15' 30" S5° 15' 30" S5° 15' 30" S5° 15' 30" S5° 15' 30" S5° 15' 30" S5° 15' 30" S5° 15' 30" S
5° 14' 30" S5° 14' 30" S5° 14' 30" S5° 14' 30" S5° 14' 30" S5° 14' 30" S5° 14' 30" S5° 14' 30" S5° 14' 30" S
119°
43'5
8"E
119°
43'5
8"E
119°
43'5
8"E
119°
43'5
8"E
119°
43'5
8"E
119°
43'5
8"E
119°
43'5
8"E
119°
43'5
8"E
119°
43'5
8"E
119°
42'5
8"E
119°
42'5
8"E
119°
42'5
8"E
119°
42'5
8"E
119°
42'5
8"E
119°
42'5
8"E
119°
42'5
8"E
119°
42'5
8"E
119°
42'5
8"E
119°
41'5
8"E
119°
41'5
8"E
119°
41'5
8"E
119°
41'5
8"E
119°
41'5
8"E
119°
41'5
8"E
119°
41'5
8"E
119°
41'5
8"E
119°
41'5
8"E
119°
40'5
8"E
119°
40'5
8"E
119°
40'5
8"E
119°
40'5
8"E
119°
40'5
8"E
119°
40'5
8"E
119°
40'5
8"E
119°
40'5
8"E
119°
40'5
8"E
119°
39'5
8"E
119°
39'5
8"E
119°
39'5
8"E
119°
39'5
8"E
119°
39'5
8"E
119°
39'5
8"E
119°
39'5
8"E
119°
39'5
8"E
119°
39'5
8"E
119°
38'5
8"E
119°
38'5
8"E
119°
38'5
8"E
119°
38'5
8"E
119°
38'5
8"E
119°
38'5
8"E
119°
38'5
8"E
119°
38'5
8"E
119°
38'5
8"E
119°
37'5
8"E
119°
37'5
8"E
119°
37'5
8"E
119°
37'5
8"E
119°
37'5
8"E
119°
37'5
8"E
119°
37'5
8"E
119°
37'5
8"E
119°
37'5
8"E NNNNNNNNN
Figure 7.12 Potential Sand Mining Site along Upstreamfrom Bili Bili Dam Reservoir
Sand Pocket DamSand Pocket DamSand Pocket DamSand Pocket DamSand Pocket DamSand Pocket DamSand Pocket DamSand Pocket DamSand Pocket Dam
Potential Sand Mining SitePotential Sand Mining SitePotential Sand Mining SitePotential Sand Mining SitePotential Sand Mining SitePotential Sand Mining SitePotential Sand Mining SitePotential Sand Mining SitePotential Sand Mining Site
LegendLegendLegendLegendLegendLegendLegendLegendLegend
Bili Bili ReservoirBili Bili ReservoirBili Bili ReservoirBili Bili ReservoirBili Bili ReservoirBili Bili ReservoirBili Bili ReservoirBili Bili ReservoirBili Bili Reservoir
Jeneberang River
Jeneberang River
Jeneberang River
Jeneberang River
Jeneberang River
Jeneberang River
Jeneberang River
Jeneberang River
Jeneberang River
F7-14

000000000 500500500500500500500500500
metersmetersmetersmetersmetersmetersmetersmetersmeters
1,0001,0001,0001,0001,0001,0001,0001,0001,000
Right Revetment 2
Right Revetment 2
Right Revetment 2
Right Revetment 2
Right Revetment 2
Right Revetment 2
Right Revetment 2
Right Revetment 2
Right Revetment 22425 m2425 m2425 m2425 m2425 m2425 m2425 m2425 m2425 m
Left Revetment 1Left Revetment 1Left Revetment 1Left Revetment 1Left Revetment 1Left Revetment 1Left Revetment 1Left Revetment 1Left Revetment 1
1179 m1179 m1179 m1179 m1179 m1179 m1179 m1179 m1179 m
Right Revetment 1Right Revetment 1Right Revetment 1Right Revetment 1Right Revetment 1Right Revetment 1Right Revetment 1Right Revetment 1Right Revetment 1
1001 m1001 m1001 m1001 m1001 m1001 m1001 m1001 m1001 m
RDM
RDM
RDM
RDM
RDM
RDM
RDM
RDM
RDM
GRN-R2GRN-R2GRN-R2GRN-R2GRN-R2GRN-R2GRN-R2GRN-R2GRN-R2
GRN-R1GRN-R1GRN-R1GRN-R1GRN-R1GRN-R1GRN-R1GRN-R1GRN-R1
GRN-L1GRN-L1GRN-L1GRN-L1GRN-L1GRN-L1GRN-L1GRN-L1GRN-L1
DSG (R-1)DSG (R-1)DSG (R-1)DSG (R-1)DSG (R-1)DSG (R-1)DSG (R-1)DSG (R-1)DSG (R-1)
JettyJettyJettyJettyJettyJettyJettyJettyJetty
JettyJettyJettyJettyJettyJettyJettyJettyJetty
K.3
.00
K.3
.00
K.3
.00
K.3
.00
K.3
.00
K.3
.00
K.3
.00
K.3
.00
K.3
.00
K.2
.00
K.2
.00
K.2
.00
K.2
.00
K.2
.00
K.2
.00
K.2
.00
K.2
.00
K.2
.00
K.1
.00K.1
.00K.1
.00K.1
.00K.1
.00K.1
.00K.1
.00K.1
.00K.1
.00
K.0
.00
K.0
.00
K.0
.00
K.0
.00
K.0
.00
K.0
.00
K.0
.00
K.0
.00
K.0
.00
5° 11' 30" S5° 11' 30" S5° 11' 30" S5° 11' 30" S5° 11' 30" S5° 11' 30" S5° 11' 30" S5° 11' 30" S5° 11' 30" S
119°
24'3
0"E
119°
24'3
0"E
119°
24'3
0"E
119°
24'3
0"E
119°
24'3
0"E
119°
24'3
0"E
119°
24'3
0"E
119°
24'3
0"E
119°
24'3
0"E
119°
24'0
0"E
119°
24'0
0"E
119°
24'0
0"E
119°
24'0
0"E
119°
24'0
0"E
119°
24'0
0"E
119°
24'0
0"E
119°
24'0
0"E
119°
24'0
0"E
119°
23'3
0"E
119°
23'3
0"E
119°
23'3
0"E
119°
23'3
0"E
119°
23'3
0"E
119°
23'3
0"E
119°
23'3
0"E
119°
23'3
0"E
119°
23'3
0"E
5° 11' 00" S5° 11' 00" S5° 11' 00" S5° 11' 00" S5° 11' 00" S5° 11' 00" S5° 11' 00" S5° 11' 00" S5° 11' 00" S
119°
23'0
0"E
119°
23'0
0"E
119°
23'0
0"E
119°
23'0
0"E
119°
23'0
0"E
119°
23'0
0"E
119°
23'0
0"E
119°
23'0
0"E
119°
23'0
0"E
5° 12' 00" S5° 12' 00" S5° 12' 00" S5° 12' 00" S5° 12' 00" S5° 12' 00" S5° 12' 00" S5° 12' 00" S5° 12' 00" S
Legend
Sluice Gate
PDAM Intake
Groyne
Jetty
Groundsill
Rubber Dam
Revetment
Dike Embankment
NNNNNNNNN
Figure 7.13 Location Map of River Structure
F7
-15

000000000 500500500500500500500500500
metersmetersmetersmetersmetersmetersmetersmetersmeters
1,0001,0001,0001,0001,0001,0001,0001,0001,000Right Dike EmbankmentRight Dike EmbankmentRight Dike EmbankmentRight Dike EmbankmentRight Dike EmbankmentRight Dike EmbankmentRight Dike EmbankmentRight Dike EmbankmentRight Dike Embankment
11.69 km11.69 km11.69 km11.69 km11.69 km11.69 km11.69 km11.69 km11.69 km
Left Dike EmbankmentLeft Dike EmbankmentLeft Dike EmbankmentLeft Dike EmbankmentLeft Dike EmbankmentLeft Dike EmbankmentLeft Dike EmbankmentLeft Dike EmbankmentLeft Dike Embankment
9.28 km9.28 km9.28 km9.28 km9.28 km9.28 km9.28 km9.28 km9.28 km
GRN-R4GRN-R4GRN-R4GRN-R4GRN-R4GRN-R4GRN-R4GRN-R4GRN-R4
GRN-R3GRN-R3GRN-R3GRN-R3GRN-R3GRN-R3GRN-R3GRN-R3GRN-R3
GRN-L2GRN-L2GRN-L2GRN-L2GRN-L2GRN-L2GRN-L2GRN-L2GRN-L2
GRN-L3GRN-L3GRN-L3GRN-L3GRN-L3GRN-L3GRN-L3GRN-L3GRN-L3
GRN-R5GRN-R5GRN-R5GRN-R5GRN-R5GRN-R5GRN-R5GRN-R5GRN-R5
PDAM-2PDAM-2PDAM-2PDAM-2PDAM-2PDAM-2PDAM-2PDAM-2PDAM-2
PDAM-1PDAM-1PDAM-1PDAM-1PDAM-1PDAM-1PDAM-1PDAM-1PDAM-1
DSG (R-4)DSG (R-4)DSG (R-4)DSG (R-4)DSG (R-4)DSG (R-4)DSG (R-4)DSG (R-4)DSG (R-4)
ISGISGISGISGISGISGISGISGISG
DSG (L-1)DSG (L-1)DSG (L-1)DSG (L-1)DSG (L-1)DSG (L-1)DSG (L-1)DSG (L-1)DSG (L-1)
K.8.00K.8.00K.8.00K.8.00K.8.00K.8.00K.8.00K.8.00K.8.00
K.7.00K.7.00K.7.00
K.7.00K.7.00
K.7.00K.7.00K.7.00K.7.00
K.6
.00K.6
.00K.6
.00K.6
.00K.6
.00K.6
.00K.6
.00K.6
.00K.6
.00
K.5
.00K.5
.00K.5
.00K.5
.00K.5
.00K.5
.00K.5
.00K.5
.00K.5
.00
K.4
.00K.4
.00K.4
.00K.4
.00K.4
.00K.4
.00K.4
.00K.4
.00K.4
.00
119°
26'
119°
26'3
119°
26'3
119 °
26'
119 °
26'3
119°
26'
119°
26'3
119°
26'3
119 °
26'3
119°
26'
119°
26'
119°
26'0
119°
26'
119°
26'0
119°
26'
119°
26'
119°
26'0
119°
26'
119°
25'
119°
25'
119°
25'3
119°
25'
119°
25'3
119°
25'
119°
25'
119°
25' 3
119°
25'
119°
25'
119°
25'
119°
25'
119°
25'
119°
25'
119°
25'
119°
25'
119°
25'
119°
25'
5° 12' 00" S5° 12' 00" S5° 12' 00" S5° 12' 00" S5° 12' 00" S5° 12' 00" S5° 12' 00" S5° 12' 00" S5° 12' 00" S
5° 11' 30" S5° 11' 30" S5° 11' 30" S5° 11' 30" S5° 11' 30" S5° 11' 30" S5° 11' 30" S5° 11' 30" S5° 11' 30" S
5° 11' 00" S5° 11' 00" S5° 11' 00" S5° 11' 00" S5° 11' 00" S5° 11' 00" S5° 11' 00" S5° 11' 00" S5° 11' 00" S
MMM
GRS-1
GRS-1
GRS-1
GRS-1
GRS-1
GRS-1
GRS-1
GRS-1
GRS-1
PDAM-3PDAM-3PDAM-3PDAM-3PDAM-3PDAM-3PDAM-3PDAM-3PDAM-3
DSG (R-2)DSG (R-2)DSG (R-2)DSG (R-2)DSG (R-2)DSG (R-2)DSG (R-2)DSG (R-2)DSG (R-2)
DSG (R-3)DSG (R-3)DSG (R-3)DSG (R-3)DSG (R-3)DSG (R-3)DSG (R-3)DSG (R-3)DSG (R-3)
Legend
Sluice Gate
PDAM Intake
Groyne
Jetty
Groundsill
Rubber Dam
Revetment
Dike Embankment
NNNNNNNNN
F7
-16
Figure 7.13 Location Map of River Structure

000000000 500500500500500500500500500
metersmetersmetersmetersmetersmetersmetersmetersmeters
1,0001,0001,0001,0001,0001,0001,0001,0001,000
Left Revetment
2
LeftRevetm
ent2
LeftRevetm
ent2
Left Revetment
2
LeftRevetm
ent2
Left Revetment
2
LeftRevetm
ent2
LeftRevetm
ent2
LeftRevetm
ent2
1050m
1050m
1050m
1050m
1050m
1050m
1050m
1050m
1050m
GRN-L4GRN-L4GRN-L4GRN-L4GRN-L4GRN-L4GRN-L4GRN-L4GRN-L4
DSG (l-2)DSG (l-2)DSG (l-2)DSG (l-2)DSG (l-2)DSG (l-2)DSG (l-2)DSG (l-2)DSG (l-2)
K.1
1.00
K.1
1.00
K.1
1.00
K.1
1.00
K.1
1.00
K.1
1.00
K.1
1.00
K.1
1.00
K.1
1.00
K.10.00
K.10.00
K.10.00
K.10.00
K.10.00
K.10.00
K.10.00
K.10.00
K.10.00
K.9.00
K.9.00
K.9.00
K.9.00
K.9.00
K.9.00
K.9.00
K.9.00
K.9.00
K.8.00K.8.00K.8.00
K.8.00K.8.00
K.8.00K.8.00K.8.00
K.8.00 119°
28'0
0"E
119°
28'0
0"E
119°
28'0
0"E
119°
28'0
0"E
119°
28'0
0"E
119°
28'0
0"E
119°
28'0
0"E
119°
28'0
0"E
119°
28'0
0"E
119°
27'3
0"E
119°
27'3
0"E
119°
27'3
0"E
119°
27'3
0"E
119°
27'3
0"E
119°
27'3
0"E
119°
27'3
0"E
119°
27'3
0"E
119°
27'3
0"E
119°
27'0
0"E
119°
27'0
0"E
119°
27'0
0"E
119°
27' 0
0"E
119°
27' 0
0"E
119°
27'0
0"E
119°
27'0
0"E
119°
27'0
0"E
119°
27' 0
0"E
119°
26'3
0"E
119°
26'3
0"E
119°
26'3
0"E
119°
26'3
0"E
119°
26'3
0"E
119°
26'3
0"E
119°
26'3
0"E
119°
26'3
0"E
119°
26'3
0"E
5° 13' 00" S5° 13' 00" S5° 13' 00" S5° 13' 00" S5° 13' 00" S5° 13' 00" S5° 13' 00" S5° 13' 00" S5° 13' 00" S
5° 12' 30" S5° 12' 30" S5° 12' 30" S5° 12' 30" S5° 12' 30" S5° 12' 30" S5° 12' 30" S5° 12' 30" S5° 12' 30" S
RightRevetm
ent4
RightRevetm
ent4
Right Revetment
4
RightRevetm
ent4
Right Revetment
4
RightRevetm
ent4
RightRevetm
ent4
Right Revetment
4
RightRevetm
ent4
2360m
2360m
2360m
2360m
2360m
2360m
2360m
2360m
2360m
GRS-2
GRS-2
GRS-2
GRS-2
GRS-2
GRS-2
GRS-2
GRS-2
GRS-2
PDAM-4PDAM-4PDAM-4PDAM-4PDAM-4PDAM-4PDAM-4PDAM-4PDAM-4
PDAM-5PDAM-5PDAM-5PDAM-5PDAM-5PDAM-5PDAM-5PDAM-5PDAM-5
DSG (R-4)DSG (R-4)DSG (R-4)DSG (R-4)DSG (R-4)DSG (R-4)DSG (R-4)DSG (R-4)DSG (R-4)
DSG (R-5)DSG (R-5)DSG (R-5)DSG (R-5)DSG (R-5)DSG (R-5)DSG (R-5)DSG (R-5)DSG (R-5)
DSG (R-6)DSG (R-6)DSG (R-6)DSG (R-6)DSG (R-6)DSG (R-6)DSG (R-6)DSG (R-6)DSG (R-6)
DSG (R-7)DSG (R-7)DSG (R-7)DSG (R-7)DSG (R-7)DSG (R-7)DSG (R-7)DSG (R-7)DSG (R-7)
DSG (R-8)DSG (R-8)DSG (R-8)DSG (R-8)DSG (R-8)DSG (R-8)DSG (R-8)DSG (R-8)DSG (R-8)
DSG (R-9)DSG (R-9)DSG (R-9)DSG (R-9)DSG (R-9)DSG (R-9)DSG (R-9)DSG (R-9)DSG (R-9)
Legend
Sluice Gate
PDAM Intake
Groyne
Jetty
Groundsill
Rubber Dam
Revetment
Dike Embankment
NNNNNNNNN
F7
-17
Figure 7.13 Location Map of River Structure