chapter 5. - western cape government · the area of “strong winter rainfall” is limited to a...
TRANSCRIPT


Final Report, August 2014 51
CHAPTER 5. ENVIRONMENTAL BASELINE DESCRIPTION
It is important to determine and understand the environmental baseline conditions of an area in which
the project footprint falls to determine the constraints associated with the proposed LNG facility and
pipeline routing. The understanding of the environmental constraints provides insight into
management implications and design considerations that should be included during the location,
design and final layout of the proposed LNG facility and proposed transmission and distribution
pipeline network.
This study area extends from St Helena Bay to Saldanha includes a 10 km corridor, within which the
position of the pipeline may be adjusted to avoid sensitive “no-go” areas. Detailed descriptions for all
the vegetation types which could be affected by the proposed pipeline routes have been included
Chapter 6 as part of the sensitivity assessment.
5.1. GENERAL DESCRIPTION
5.1.1. Location
The proposed LNG facility and associated pipeline routing project footprint falls within the Western
Cape Province and will traverse over various district and local municipalities (Figures 5.1 and 5.2). The
province has six district or metropolitan municipalities and 25 local municipalities.
Figure 5.1: Western Cape Province locality map (Western Cape Government, 2013)

Final Report, August 2014 52
Figure 5.2: Municipalities affected by the proposed pipeline
The site lies on the coastal plain of the south-western part of the Western Cape Province. It includes
land falling within ten magisterial districts from Piketberg in the north to Simon’s Town in the
southwest and Somerset West in the southeast. By virtue of the distances involved, much of this land
is rural and agricultural in nature, but urban areas within the greater Cape Town and Winelands
regions will also be affected.
5.1.2. Climate
The Western Cape Province characteristically has a Mediterranean climate characterised by dry, hot
summers and cold, wet winters but because of the influence of the Indian and Atlantic oceans’
influence, inland and coastal temperatures differ over short distances, and macro- and micro climates
are created.
The Western Cape has two dominant rainfall zones, namely the winter and the bimodal (spring and
autumn) rainfall regimes. The area of “strong winter rainfall” is limited to a section of the west coast

Final Report, August 2014 53
centred on Saldanha and St Helena Bays. The eastern boundary of the winter rainfall zone extends
roughly to the lower Breede River Valley. The “even rainfall or bimodal, includes much of the Southern
Cape as well as the Renosterveld areas along the Nuweveld Escarpment. The Province has the highest
rainfall variation of any of the South African provinces, with a low of 60mm and a peak of 3345mm per
year with most areas receiving between about 350 and 1 000 mm per year.
5.1.3. Meteorology
The description of the meteorology in the study area is based on inputs extracted from the risk
assessment study undertaken by Riscom (Riscom, 2014). Meteorological mechanisms govern the
dispersion, transformation and eventual removal of hazardous vapours from the atmosphere. The
extent to which hazardous vapours will accumulate or disperse in the atmosphere is dependent on the
degree of thermal and mechanical turbulence within the earth's boundary layer. Dispersion comprises
of vertical and horizontal components of motion. The stability of the atmosphere and the depth of the
surface, i.e. the mixing layer, define the vertical component. The horizontal dispersion of hazardous
vapours in the boundary layer is primarily a function of wind field.
Wind speed determines both the distance of downwind transport and the rate of dilution as a result of
plume stretching. Similarly, the generation of mechanical turbulence is a function of the wind speed in
combination with surface roughness. Wind direction and variability in wind direction both determine
the general path hazardous vapours will follow and the extent of crosswind spreading. Concentration
levels of hazardous vapours therefore fluctuate in response to changes in atmospheric stability, to
concurrent variations in the mixing depth and to shifts in the wind field.
5.1.3.1 Langebaanweg
Surface Winds
Surface meteorological data, including hourly average wind speed and wind direction recorded at
Langebaanweg, was obtained from the South African Weather Service for the period from the 1st of
January 2005 to the 31st of December 2009. The wind roses depicted in Figure 5.3 depict the seasonal
variances of the measured wind speeds. In the summer months, the wind blows predominantly from
the south-westerly quadrant at wind speeds of up to 5.6 m/s being a common phenomenon. During
the winter months, the calm periods increase to 11.5%, with mostly low wind speed from the south
and higher wind speeds from the north.

Final Report, August 2014 54
Figure 5.3: Seasonal wind speed as a function of wind direction at Langebaanweg for the period 2005 to
2010
Precipitation, Relative Humidity and Cloud Cover
The long-term rainfall, relative humidity and cloud cover at Langebaanweg, as measured by the South
African Weather Service over the period between 1961 and 1990, is given in Table 5.1. Langebaanweg
is relatively dry, with an average annual rainfall of 278 mm and the dry seasons ranging from October
to July. The annual average relative humidity is 50% and 76% for day and night respectively, with
±10% variance over the yearly average. The annual average cloud cover is 35% and 29% for day and
night respectively.
Table 5.1: Long-term rainfall at Langebaanweg
Month
Precipitation Relative
humidity (%) Cloud Cover (%)
Average
Monthly
(mm)
Average No of
days with >=1mm
Highest 24h
rainfall
(mm)
Day Night Day Night
January 8 1.9 14 44 66 24 24
February 4 1.2 10 43 66 21 20
March 11 2.2 21 44 71 26 21
Wind Speed (m/s) – 0.5-2.5 2.5-3.5 3.5-5.6 5.6-8.0 8.0-10.7 >10.7

Final Report, August 2014 55
Month
Precipitation Relative
humidity (%) Cloud Cover (%)
Average
Monthly
(mm)
Average No of
days with >=1mm
Highest 24h
rainfall
(mm)
Day Night Day Night
April 24 3.9 30 48 76 38 30
May 40 6.3 30 54 82 44 33
June 41 6.4 27 58 85 44 29
July 47 7.1 35 59 86 45 31
August 45 6.8 57 57 85 45 31
September 24 4.9 29 52 78 45 33
October 12 2.8 40 46 71 38 33
November 12 2.4 23 44 70 31 29
December 10 2.4 14 44 67 26 26
Year 278 48 57 50 76 35 29
Temperature
Langebaanweg experiences a temperate climate, with an average daily maximum between 19°C and
30°C. Temperatures very rarely extend below freezing point, with the yearly mean average of daily
temperatures being above 10°C. The long-term temperatures measured at Langebaanweg between
1961 and 1990 by the South African Weather Service are given in Table 5.2.
Table 5.2: Long-term temperatures measured at Langebaanweg
Month
Temperature (°C)
Highest Recorded Average Daily Maximum Average Daily Minimum
January 42 28 15
February 41 28 15
March 39 27 14
April 38 25 12

Final Report, August 2014 56
Month
Temperature (°C)
Highest Recorded Average Daily Maximum Average Daily Minimum
May 33 21 10
June 31 19 8
July 29 18 7
August 33 19 7
September 35 20 9
October 39 23 10
November 42 25 12
December 39 26 14
Year 42 23 11
Atmospheric Stability
Atmospheric stability is frequently categorised into one of six stability classes. These are briefly
described in Table 5.3. The atmospheric stability, in combination with the wind speed, is important in
determining the extent of a pollutant from a release. A very stable atmospheric condition, typically at
night, would have a low wind speed and produce the greatest endpoint for a dense gas. Conversely, a
buoyant gas would have the greatest endpoint distance at a high wind speed.
Table 5.3: Atmospheric stability classification scheme
Stability Class Stability Classification Description
A Very unstable Calm wind, clear skies, hot daytime
conditions
B Moderately unstable Clear skies, daytime conditions
C Unstable Moderate wind, slightly overcast
daytime conditions
D Neutral Strong winds or cloudy days and nights
E Stable Moderate wind, slightly overcast night-
time conditions
F Very stable Low winds, clear skies, cold night-time
conditions

Final Report, August 2014 57
The atmospheric stability for Langebaanweg, as a function of the wind direction, was calculated from
hourly weather values supplied by the South African Weather Service from the 1st of January 2005 to
the 31st of December 2010 and given in Figure 5.4.
Figure 5.4: Atmospheric stability, as a function of wind direction
Risk assessments are calculated on six represented weather classes covering the stability conditions of
stable, neutral and unstable as well as low and high wind speeds. In terms of Pasquill classes, the
representative conditions are given in Table 5.4.
Table 5.4: Representative weather classes
Stability Class Wind (m/s)
B 3
D 1.5
D 5
D 9
E 5
F 1.5

Final Report, August 2014 58
As wind velocities are a vector quantities (i.e. have speed and direction) and blow preferentially in
certain directions, it is mathematically incorrect to give an average wind speed over the 360°C of wind
direction and will result in incorrect risk calculations. It would also be incorrect to base the risk
calculations on one wind category, e.g. 1.5/F. In order to obtain representative risk calculations, hourly
weather data of wind speed and wind direction were analysed over a five year period and categorised
into the six wind classes for day and night time conditions for 16 wind directions. The risk was then
determined using the contributions of each wind class in various wind directions.
The allocation of observations into the six weather classes is summarised in Table 5.5, with the
representative weather classes for Langebaanweg given in Figure 5.5, and used as input for the risk
calculations.
Table 5.5: Allocation of observations into six weather classes
Wind Speed A B B/C C C/D D E F
< 2.5 m/s B 3 m/s D 1.5 m/s F 1.5 m/s
2.5 - 6 m/s D 5 m/s E 5 m/s
> 6 m/s D 9 m/s
Figure 5.5: Representative weather classes for Langebaanweg (2005-2010)

Final Report, August 2014 59
5.1.3.2 Cape Town
Surface Winds
Surface meteorological data, including hourly average wind speed and wind direction recorded at
Cape Town International Airport, was obtained by the South African Weather Service for the period of
the 1st of January 2007 to the 31st of December 2011. The wind roses in Figure 5.6 depict the seasonal
variances of the measured wind speeds. In the summer months, the wind blows predominantly from
the south and south-southwest, with wind speeds of over 10 m/s being common. During the winter
months, the calm periods increase to 8.9%, with low to medium wind speeds from the southerly and
northerly directions.
Figure 5.6: Seasonal wind speed as a function of wind direction at Cape Town International Airport for the
period of 2007 to 2011
Precipitation and Relative Humidity
The long-term rainfall at Cape Town International Airport, as measured by the South African Weather
Service over the period between 1961 and 1990, is given in Table 5.6. Cape Town is relatively dry, with
an average annual rainfall of 515 mm and the dry seasons ranging from November to March.
Wind Speed (m/s) – 0.5-2.5 2.5-3.5 3.5-5.6 5.6-8.0 8.0-10.7 >10.7

Final Report, August 2014 60
Table 5.6: Long-term rainfall at Cape Town International Airport
Month Precipitation
Average Monthly
(mm)
Average No. of Days with
>= 1 mm
Highest 24 hour Rainfall
(mm)
January 15 6 41
February 17 5 27
March 20 5 42
April 41 8 39
May 69 11 65
June 93 13 58
July 82 12 61
August 77 14 56
September 40 10 29
October 30 9 53
November 14 5 30
December 17 6 21
Year 515 103 65
The relative humidity typically ranges, as shown in Figure 5.7, from 44% (comfortable) to 97% (very
humid) over the course of the year, rarely dropping below 29% (dry) or reaching as high as 100% (very
humid).
The air is driest around December, at which time the relative humidity drops below 51% (mildly
humid) three days out of four. It is most humid around July, exceeding 95% (very humid) three days
out of four.

Final Report, August 2014 61
Figure 5.7: The average daily high (blue) and low (brown) relative humidity with percentile bands (inner
bands from 25th to 75th percentile, outer bands from 10th to 90th percentile)
Temperature
Air temperature, as shown in Table 5.7, is important, for determining the effect of plume buoyancy (the
larger the temperature difference between the plume and the ambient air, the higher the plume is
able to rise), estimating evaporation rates and determining the development of the mixing and
inversion layers. Over the course of a year, temperatures typically vary from 7°C to 27°C and are rarely
below 4°C or above 31°C.
Table 5.7: Long-term temperatures measured at Cape Town International Airport
Month Temperature (°C)
Highest Recorded Lowest Recorded Average Daily
Maximum
Average Daily
Minimum
January 39 7 26 16
February 38 6 27 16
March 41 5 25 14
April 39 2 23 12
May 34 1 20 9
June 30 -1 18 8
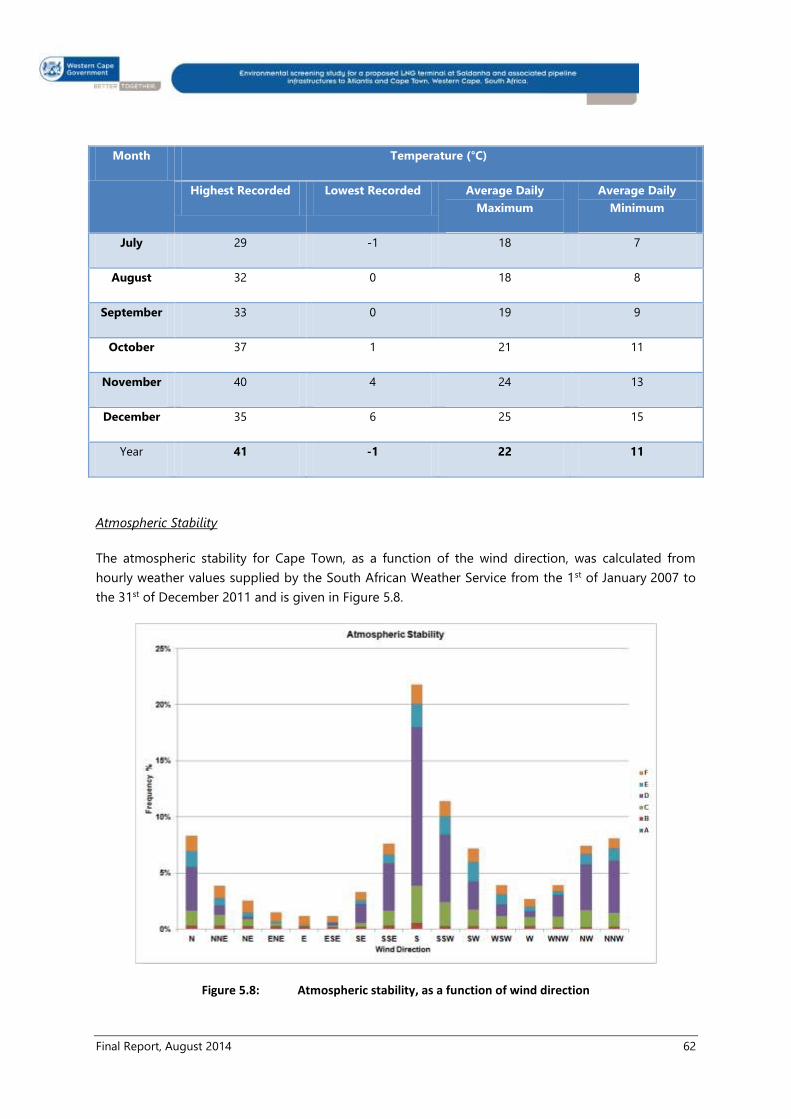
Final Report, August 2014 62
Month Temperature (°C)
Highest Recorded Lowest Recorded Average Daily
Maximum
Average Daily
Minimum
July 29 -1 18 7
August 32 0 18 8
September 33 0 19 9
October 37 1 21 11
November 40 4 24 13
December 35 6 25 15
Year 41 -1 22 11
Atmospheric Stability
The atmospheric stability for Cape Town, as a function of the wind direction, was calculated from
hourly weather values supplied by the South African Weather Service from the 1st of January 2007 to
the 31st of December 2011 and is given in Figure 5.8.
Figure 5.8: Atmospheric stability, as a function of wind direction

Final Report, August 2014 63
The representative weather classes for Cape Town are given in Figure 5.9Figure .
Figure 5.9: Representative weather classes for Cape Town (2007-2012)
5.1.4. Topography
The immediate context of the study area is generally flat to gently rolling countryside. The study area
can be broadly described as follows (Figures 5.10a and b):
Section 1 - St Helena Bay: This area has Baboon Point and the hills of Elands Bay in the far
north. For the rest it is flat and generally sandy and ends at the Berg River in the south;
Section 2 - Vredenburg Peninsula: This short stretch crosses the low-lying part of the eastern
Vredenburg Peninsula as far as the R45;
Section 3 - Saldanha Bay and Langebaan: This section starts from the R45 and then covers the
western shores of Saldanha Bay and the Langebaan Lagoon as well as the Elandsfontein and
Geelbek Dunefields. The Saldanha Bay area has a gently undulating plain with low hills. Within
the first 3-5 kilometres from the coast, the land rises by 100m.
Section 4 - Western Swartland: This area extends along the western edge of the granitic and
shale soils of the Swartland but overlaps with white aeolian sands along the coast. It is
undulating in places with the darling Hills present to the east;
Section 5 - Atlantis Dunes: The Atlantis Dunefield and the now vegetated aeolian dune plume
stretches from there to the coast north of Melkbosstrand;
Section 6 - Southern Swartland and adjacent coastline: This short section comprises of the
southernmost parts of the Swartland up to the northern edge of the urban sprawl of Cape

Final Report, August 2014 64
Town and includes the coastal stretch of Melkbosstrand and Bloubergstrand. The topography
is generally low rolling hills and the majority of the land is cultivated except near the coast
which is either urban or aeolian dunes;
Section 7 - Cape Flats: This section is largely built up, with the Cape Flats and urban areas of
Cape Town; and
Section 8 - Wine Lands: The final area considered includes the towns of Wellington, Paarl,
Stellenbosch and Somerset west in the south-eastern part of the study area.
Figure 5.10a The northernmost section of the proposed project.
1
2

Final Report, August 2014 65
Figure 5.10b The proposed transmission and distribution pipeline network between Saldanha Bay and the
greater Cape own area.
N 3
4
5
6
7
8

Final Report, August 2014 66
5.2. COASTAL AND MARINE ENVIRONMENT
5.2.1. Background
The broad area under study extends from Table Bay in the south to Baboon Point at the northern
extremity of St. Helena Bay in the north. Three focal areas for the location of the FSRU have been
identified: Option 1, between Robben Island and Dassen Island (Figure 2.7); Option 2, offshore in St.
Helena Bay (Figure 2.8); and Option 3, within Saldanha Bay i.e. east of a line drawn between North
Head and South Head (Figure 2.9).
The entire study area lies on the west coast of South Africa within the southern Benguela upwelling
region in the Namaqua marine biogeographical province which extends from Cape point in the south
to Luderitz, Namibia in the north (Emanuel et al., 1992). The winds in summer are predominantly from
the south whereas in winter the wind, associated with cold fronts, is from the northwest.
The marine fauna and flora of the study area are typical of the west coast which is dominated by the
high energy southwesterly swell regime (Stephenson and Stephenson, 1972). In contrast the more
sheltered conditions within Saldanha Bay support species and communities that prefer calmer
conditions. The shallow Langebaan Lagoon at the southern end of Saldanha Bay is a much warmer
environment and its biota has many similarities to that of the South Coast Warm-temperate region
(Day, 1981). The whole of Langebaan Lagoon and the islands of Saldanha Bay lie within the West
Coast National Park and this area is also designated as a wetland of international importance in terms
of the Ramsar Convention.
5.2.2. Physical features
The coast between Table Bay and Baboon Point is characterised by an open coastline exposed to a
generally high energy wave regime and includes long stretches of sandy beach interspersed with
rocky shores (Figures 5.11 to 5.14). Three prominent features are Table Bay, the Saldanha Bay -
Langebaan Lagoon system, and St. Helena Bay. This area includes islands: Robben, Dassen, Vondeling
and the islands within Saldanha Bay, estuaries (Berg River), river mouths and other coastal wetlands
that may at times be connected to the sea.
Table Bay is a half-heart bay facing north and west (Figure 5.11) with Robben Island marking its
northern extremity. Most of the shoreline between Table Bay and Saldanha Bay is sandy with
infrequent short sections of rocky coast (Figure 5.12).
Saldanha Bay and Langebaan Lagoon form a large enclosed marine system. Saldanha is the largest
enclosed Bay on the west coast of southern Africa with an area of 57 square kilometres. The system is
open to the Atlantic Ocean near its northern end with two islands, Marcus and Malgas, on the north
side and Jutten Island on the south side at the entrance to the bay (Figure 5.13). Originally the width
of the connection between the bay and the open sea was about 4.6 km but this has been reduced to
some 2.4 km since the construction in 1974 of the spending beach/breakwater between Hoedtjies
Point and Marcus Island as part of the Port of Saldanha Bay. The 39 square kilometre Langebaan
Lagoon is essentially an enclosed arm of the sea and extends southwards from Saldanha Bay for a
distance of about 14 km. The lagoon is shallow, with an average depth of between one and two

Final Report, August 2014 67
metres and has a maximum depth of six metres. No rivers flow into the lagoon although there is
considerable fresh groundwater seepage along the eastern shore southwards of Oosterwal which
supports extensive salt marshes and gives the lagoon some estuarine characteristics.
St. Helena Bay is an extensive half-heart bay facing north and west (Figure 5.14). Its westernmost
extremity is Cape St. Martin but its northernmost limit is more difficult to define since there is no
northern headland to enclose it short of Baboon Point some 50 km to the north of the Berg River
mouth in the southeastern corner of the bay. The southern shore between from Cape St. Martin to the
Berg River mouth is characterised by mixed rocky and sandy shores whereas the coast from the Berg
River mouth to Baboon Point consists of a continuous sandy beach.
5.2.3. Wind regime
Wind data recorded by voluntary observing ships (VOS) provide a general picture of the wind regime.
VOS data for the Robben Island to Dassen Island area, the entrance to Saldanha Bay, and St. Helena
Bay are presented in Figures 5.15 to 5.17. The general pattern of the dominant wind directions is
mostly southerly and southeasterly in summer whereas during winter the wind pattern is more
variable reflecting the frequent passage of cold fronts and low pressure systems. The average annual
maximum offshore wind speed of around 6 m/s decreases towards the coast (Figure 5.18; Kamstra,
1985). The coastal area north of Cape Columbine is characterised by lower wind speeds, mainly during
summer, probably as a result of Cape Columbine sheltering St. Helena Bay from the south -
southeasterly winds (Kamstra, 1985).

Final Report, August 2014 68
Figure 5.11: Coastal geomorphology and sensitivity: Table Bay to Bokpunt.
(Source: Jackson and Lipschitz, 1984)

Final Report, August 2014 69
Figure 5.12: Coastal geomorphology and sensitivity: Dassen Island to Saldanha Bay.
(Source: Jackson and Lipschitz, 1984)

Final Report, August 2014 70
Figure 5.13: Coastal geomorphology and sensitivity: Jacobsbaai to St Helen Bay.
(Source: Jackson and Lipschitz, 1984)

Final Report, August 2014 71
Figure 5.14: Coastal geomorphology and sensitivity: Northern St Helena Bay to Lambert's Bay.
(Source: Jackson and Lipschitz, 1984)

Final Report, August 2014 72
Period 1960-01-09 to 2014-03-26
Station VOS data: Robben to Dassen
Position 33.3 to 33.7 S, 17.8 to 18.2 E
Sensor Height 0 m
Records 3616
Figure 5.15: Wind speed and direction for the Robben Island to Dassen Island area.
Source: Southern Africa Data Centre for Oceanography (SADCO), Voluntary Observing Ships (VOS) data.

Final Report, August 2014 73
Period 1960-01-01 to 2014-02-14
Station VOS data: Saldanha
Position 32.8 to 33.2 S, 17.5 to 17.9 E
Sensor Height 0 m
Records 3951
Figure 5.16: Wind speed and direction for the coast adjacent to the entrance of Saldanha Bay.
Source: Southern Africa Data Centre for Oceanography (SADCO), Voluntary Observing Ships (VOS) data.

Final Report, August 2014 74
Period 1961-01-08 to 2014-02-12
Station VOS data: St Helena Bay
Position 32.3 to 32.7 S, 17.8 to 18.1 E
Sensor Height 0 m
Records 393
Figure 5.17: Wind speed and direction for St. Helena Bay.
Source: Southern Africa Data Centre for Oceanography (SADCO), Voluntary Observing Ships (VOS) data.

Final Report, August 2014 75
Figure 5.18: Average annual wind speed (m/s) offshore of the West Coast derived from VOS data
(Source: Kamstra, 1985).
5.2.4. Wave climate
VOS wave data provide a general picture of the swell regime. VOS wave data the locations of the three
LNG discharge options, i.e.Robben Island to Dassen Island, the entrance to Saldahna Bay, and St.
Helena Bay, are presented in Figures 5.19 to 5.21. These data show that the west coast is dominated
by southwesterly swells. Although Saldanha Bay is relatively sheltered when compared with the
adjacent exposed coast, large waves can penetrate the bay. Flemming (1977) identified the shore
between the root of the iron ore jetty and Lynch point as the portion of Saldanha Bay most exposed
to wave action.
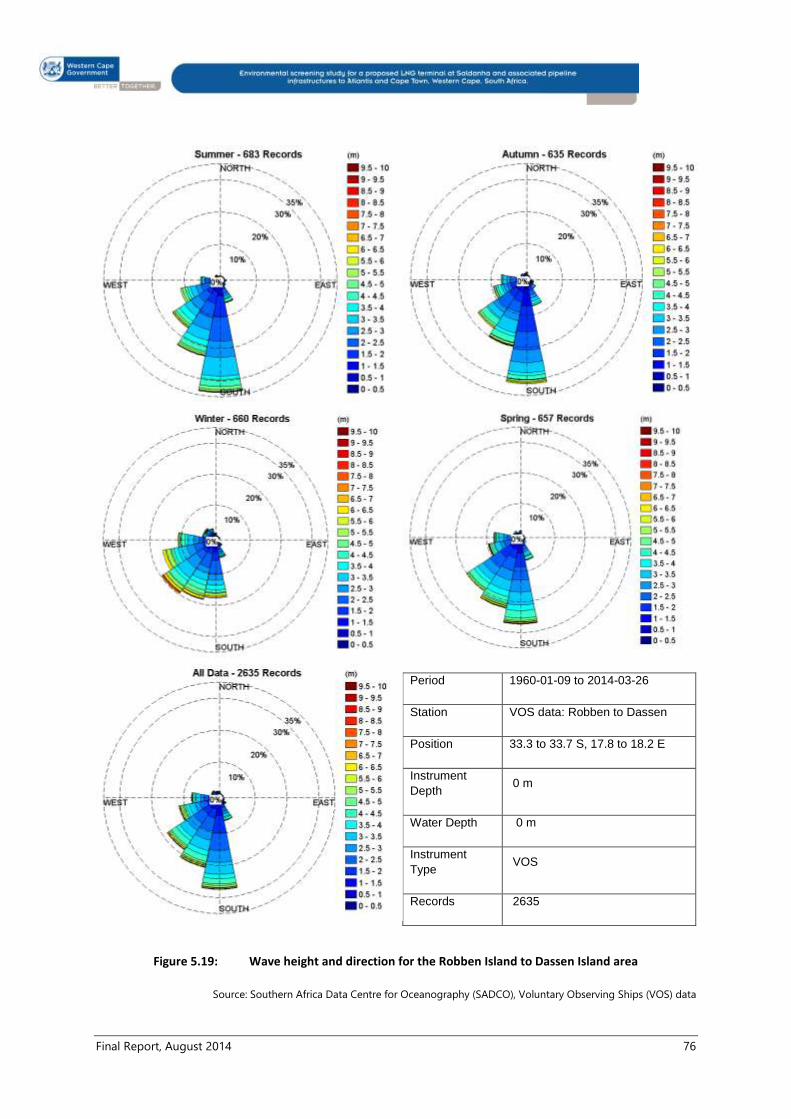
Final Report, August 2014 76
Period 1960-01-09 to 2014-03-26
Station VOS data: Robben to Dassen
Position 33.3 to 33.7 S, 17.8 to 18.2 E
Instrument
Depth 0 m
Water Depth 0 m
Instrument
Type VOS
Records 2635
Figure 5.19: Wave height and direction for the Robben Island to Dassen Island area
Source: Southern Africa Data Centre for Oceanography (SADCO), Voluntary Observing Ships (VOS) data

Final Report, August 2014 77
Period 1960-01-21 to 2014-02-12
Station VOS data: Saldanha
Position 32.8 to 33.2 S, 17.5 to 17.9 E
Instrument Depth 0 m
Water Depth 0 m
Instrument Type VOS
Records 2822
Figure 5.20: Wave height and direction for the coast adjacent to the entrance of Saldanha Bay.
Source: Southern Africa Data Centre for Oceanography (SADCO), Voluntary Observing Ships (VOS) data

Final Report, August 2014 78
Period 1960-01-21 to 2014-02-12
Station VOS data: St Helena Bay
Position 32.3 to 32.7 S, 17.8 to 18.1 E
Instrument Depth 0 m
Water Depth 0 m
Instrument Type VOS
Records 204
Figure 5.21: Wave hieght and direction for St. Helena Bay.
Source: Southern Africa Data Centre for Oceanography (SADCO), Voluntary Observing Ships (VOS) data

Final Report, August 2014 79
5.2.5. Tides
Recorded and predicted tidal characteristics at Saldanha Bay are presented in Table 5.8. Extreme tidal
levels (Highest Astronomical Tide and Lowest Astronomical Tide) only occur about once every three
years. The annual extreme water levels are estimated to be 2.0 m and 0.0 m relative to chart datum
(CD) respectively. The tidal regimes in Table Bay and St. Helena Bay do not differ significantly from
that in Saldanha Bay.
Table 5.8: Tidal heights at Saldanha Bay (Source: South African Tide Tables).
Tidal characteristic Tidal levels in metres relative to Chart
Datum - 0.90 m below mean sea level
Highest Astronomical Tide (HAT) 2.09
Mean High Water Spring Tide (MHWS) 1.76
Mean High Water Neap Tide (MHWN) 1.26
Mean Water Level (ML) 1.01
Mean Low Water Neap Tide (MLWN) 0.76
Mean Low Water Spring Tide (MLWS) 0.26
Lowest Astronomical Tide (LAT) -0.06
5.2.6. Currents
The dominant ocean current of the African southwest coast is the Benguela which is a complex
northward-drifting system of eddies of variable intensity (Shannon, 1985). Southeasterly to southerly
winds along the coast cause the flow of water along and away from the coastline; this results in an
inshore lowering and an offshore increase in sea level and the replacement of inshore surface water by
upwelled cooler water from below. Upwelling is a notable feature of the Benguela System occurring
mainly between spring and autumn.
Currents in Table Bay are generally northwards – setting driven by the south-westerly swell and by
south-easterly winds in summer.
The hydrodynamics of the Saldanha Bay - Langebaan Lagoon system are complex. Apart from the
adjacent ocean processes as forcing factors, the circulation and currents within the system are
influenced by: the varied geometry of the bay and lagoon; the combination of wind and tides; and the
variation in temperature between the surface and bottom water (thermal stratification).
Past studies suggest that wind-forcing is the dominant mechanism controlling surface current
direction and magnitudes within the inner bay at Saldanha. Current velocities are generally low; for
example, Weeks et al. (1991) recorded some 80 percent of surface currents less than 0.12 m/s and 75
percent of subsurface currents below 0.06 m/s. The relatively shallow Langebaan Lagoon system,
consisting of extensive sand and mud flats exposed at low tide is tidally dominated. Currents are
strongest in the tidal channels and velocities as high as 1 m/s have been observed at the entrance to
the lagoon (Shannon and Stander, 1977). The currents within the Langebaan Lagoon are significantly
higher than those in Saldanha Bay, especially in the channels around Skaapeiland, where the

Final Report, August 2014 80
maximum current velocities have been measured (up to 1 m/s). High current velocities, which are
mainly due to tidal forcing, also occur at the entrance to Small Bay and between Elands Point and
Marcus Island.
The predominant south-southeasterly wind results in a weak clockwise circulation in Small Bay and a
stronger anti-clockwise circulation in Big Bay; water from Big Bay flows down the east side of the iron
ore jetty and then enters Small Bay during the incoming tide. South-westerly winds cause a well-
defined clockwise circulation in Small Bay, with the water flowing out of the bay along the iron ore
jetty. North-westerly winds (which typically occur during winter) cause water to enter Small Bay down
the centre of the bay and to leave it against its east and west margins; circulation in Big Bay under
north-westerly wind conditions is clockwise.
Currents in St Helena Bay show a generally northward flow, with a cyclonic gyre and associated eddies
in the coastal region south of Elands Bay (Holden 1985). In summer during typical south-east wind
driven upwelling events the surface currents in St Helena Bay flow northwards in a shore-parallel
fashion as far north as Lambert’s Bay whereafter they tend to diverge from the coast in a
northwesterly direction (Viljoen, 2006). When the wind relaxes the inshore waters may flow southward
towards the Berg River mouth area of the bay.
5.2.7. Marine and coastal ecology
Table Bay, Saldanha Bay and St Helena Bay lie within the cold West Coast biogeographic province.
The bays have no unique biotic attributes that would distinguish them from the broader West Coast
biogeographic province (McQuaid and Branch, 1984; McQuaid et al., 1985; Van Erkom Schurink and
Griffiths, 1990; Emmanuel et al., 1992; Bustamante and Branch, 1995; Kruger and Griffiths, 1098; Harris
et al., 1998; Bolton and Stegenga, 2002). However Langebaan Lagoon at the southern end of Saldanha
Bay is a shallow, much warmer, environment and its biota has many similarities to that of the South
Coast Warm-temperature biogeographic regions (Day, 1981).
5.2.7.1 Marine plants
Seaweeds occur on the rocky shores and in the subtidal areas along the West Coast from Table Bay to
St Helena Bay. Kelp beds (Ecklonia and Laminaria species) are present along the rocky stretches of
open coastline and around some of the islands in the area. Within Saldanha Bay, the kelp Laminaria
pallida is dominant. The commercially important seaweed Gracilaria verrucosa occurs on the subtidal
soft substratum within Saldanha Bay. Within Langebaan Lagoon Gracilaria is replaced by the eel grass
Zostera capensis which extends over approximately 130 ha in the middle and northern reaches of the
lagoon.
Langebaan Lagoon supports extensive areas of reedbeds, intertidal saltmarsh and mudflats. Reedbeds
and sedge communities occur mainly above the high water level and are characterised by dominant
species, such as the bullrush Typha capensis, the reed Phragmites australis and sedges such as Juncus
kraussii and Scirpus species. The intertidal saltmarshes (covering approximately 13 km2) are composed
of a mosaic of different communities, each of which are characterised by dominant species; for
example, the grass, Spartina maritima, and succulent species such as Chenolea diffusa, Sarcocornia
perennis, Sarcocornia pillansii and Salicornia meyerana. Saltmarsh is most abundant at the southern

Final Report, August 2014 81
end of the lagoon where nutrients are highest and the velocity of tidal currents is reduced. The Berg
River estuary in St Helena Bay also supports extensive reedbeds and saltmarsh vegetation and the
communities here are similar to those at Langebaan.
5.2.7.2 Salt marshes and seagrass beds
Beds of the eelgrass Zostera capensis dominate the southern end of Langebaan Lagoon. The fauna
associated with the eelgrass beds and mudflats are an important food source for Palaearctic migrant
shorebirds which over-winter in the southern hemisphere. This importance of Langebaan Lagoon for
these Palaearctic migrants has resulted in the Lagoon being designated a wetland of international
importance in terms of the Ramsar Convention.
The Langebaan Lagoon saltmarsh vegetation is classified as Dwarf Succulent Shrubland and includes
the marine grass Spartina maritima (which may be a non-indigenous species) and various succulents.
Associated with saltmarsh vegetation is the alga Bostrychietum sp. which only occurs on the West
Coast in Langebaan Lagoon. Most of algae in this genus have a broad geographical distribution and
commonly occur in tropical mangrove forests.
5.2.7.3 Sandy intertidal and subtidal substrates
Sandy substrates can be divided into: (i) supratidal which only receives water at high spring tide; (ii)
intertidal which lies within the approximately 2 m tidal range; and (iii) subtidal which lies below the
low water spring tide mark.
The benthic biota inhabiting soft bottom substrates comprises invertebrates living on, or burrowing in,
the sediments. These are generally subdivided into megafauna (animals exceeding 10 mm),
macrofauna (animals > 1 mm) and meiofauna (animals smaller than 1 mm).
The supratidal zone is characterised by a mixture of air-breathing terrestrial and semi-
terrestrial invertebrates associated mainly with cast-up kelp and other seaweeds. Terrestrial species
include beetles and kelp flies and semi-terrestrial animals include isopods and amphipods. The actual
species community composition depends on how much seaweed is cast-up and its species
composition besides the physical nature of the shoreline.
The intertidal zone is characterised by cirolanid isopods, amphipods, a polychaete worm Scololepis
squamata and the ribbon worm Cerebratulus fuscus. In the appropriate conditions large numbers of
the white sand mussel Donax serra may occur.
The subtidal zone can be divided into an inner turbulent zone extending from the low water spring
tide mark to approximately two metres depth. Typical organisms occurring in this zone include a
variety of polychaete worms, the ribbon worm, the mysid Gastrosaccus psammodytes and the
cumacean Cumopsis robusta. Below the turbulent zone the nature and composition of the soft bottom
communities primarily depends on sediment grain size, water depth and the current regime although
the availability and abundance of food can also be a significant factor. In Saldahna Bay itself it is
difficult to place the present benthic communities into a historic perspective since the construction of
the Hoedtjies Point - Marcus Island breakwater and the introduction of oyster and mussel farming has

Final Report, August 2014 82
caused irreversible changes in the benthic fauna. For example the formerly widespread filter-feeding
sea pen Virgularia schultzei has not been recorded since 1989 (Clark et al. 2011). Major dredging
associated with the development of the Port of Saldanha has also caused fluctuations in the benthic
faunal abundance and composition. Before any heating water from the LNG regasification plant
can be discharged into Saldanha Bay a comprehensive benthic faunal survey will have to be done to
provide a valid baseline against which any changes resulting from the discharge can be measured.
5.2.7.4 Intertidal rocky shores
The benthic communities on the rocky shores of the West Coast show clear vertical zonation
according to height on the shore which governs the degree of exposure to wave action and, at low
tide, to desiccation. The zonation from top to bottom is:
Littorina zone: this is the supratidal fringe which is prone to desiccation and has a
depauperate biota, i.e. very low species diversity
Upper balanoid zone: despite being named after a barnacle, this zone is characterised by the
limpets Scutellastra granularis and Siphonaria capensis. The alien acorn barnacle Balanus
glandula is common in Saldanha Bay where it may occupy up to 70% of the semi-exposed
midlittoral shores (Clark et al. 2011). The sea lettuce Ulva sp. and the red alga Hildenbrandia
rubra are the main plants found in this zone.
Lower balanoid zone: this zone can be divided by the degree of exposure to wave action. In
sheltered areas the community is diverse, particularly the algae, with a relatively low biomass
and is dominated by grazers. On shores more exposed to wave action filter-feeders
predominate taking advantage of the high food availability. The indigenous black mussel
Chromytilus meridionalis and the very similar invasive Mytilus galloprovincialis are
characteristic of this zone in company with the reef building polychaete worm Gunnarea
capensis.
Argenvillei (or sublittoral) zone: this zone is almost never exposed at low tide and is
dominated by the limpet Scutellastra argenvillei . More striking is the presence of the two
large kelps, Ecklonia maxima and Laminaria pallida.The tunicate Pyura stolonifera ("red bait")
often occurs at the lower edge of this zone.
5.2.7.5 Rocky subtidal habitats
From the lower edge of the sublittoral zone to depth of 5 - 10 m the large kelps Ecklonia maxima and
Laminaria pallida dominate. The former extends down to about 10 m depth whereas the latter is can
occur in depths of up to 30 m. The kelp beds act as natural breakwaters and shelter many species
from the heavy wave action typical of the West Coast. The kelps also act as substrate for epiphytic and
coralline algae. The kelp beds are the home of the commercially important rock lobster Jasus lalandii.
5.2.7.6 Fish
The pelagic and demersal fisheries which operate out of St Helena Bay and Saldanha Bay mainly
exploit species such as hake, snoek, anchovy and pilchard. In this respect, the region is considered to
be important for several species of spawning pelagic and demersal fish.

Final Report, August 2014 83
A line fishery which operates out of Saldanha targets the white stumpnose, which is the most
important commercial species caught mainly within the bay (average catch of about 39 tonnes per
year). Other fish taken in and outside the bay by this fishery and by recreational anglers include
steentjie, blacktail, hottentot, kob, geelbek, elf and sharks (none of which is considered resident within
Saldanha Bay). Species of commercial importance which occur in shoals of juveniles within Saldanha
Bay include mackerel and maasbanker and the system serves as a nursery area for these and other
non-resident species caught by the line fishery.
Commercial gill netting takes place in St Helena and Saldanha bays and the Berg River estuary.
Targeted species are southern mullet or harders Liza richardsoni and the elephant fish or St Joseph
Callorhinchus capensis (de Villiers 1987, 1989, Freer & Griffiths, 1993).
Twenty-nine species of fish have been recorded within Langebaan Lagoon (Day et al., 1981), 11 of
which are associated with eel grass habitat (Whitfield et al., 1989). Dominant and common lagoon
species include the southern mullet, silversides and sand sharks. Fish are not particularly abundant
within the lagoon, although the southern part of the system is an important nursery area for juveniles
of several species.
Thirty-one species of fish have been recorded from the Berg River estuary, of which eight are
considered residents, 17 are marine visitors or vagrants and six are freshwater species (Bennett, 1994).
The Southern mullet is the most abundant species and is gill-netted for the local dried fish industry.
5.2.7.7 Birds
Nine species of seabirds endemic to southern Africa occur in the study area (Table 5.9) of which the
status of the African Penguin is of the greatest concern with respect to aspects of the development of
the LNG importation facility.
Table 5.9 Red Data Book status of Southern African endemic seabirds in the study area.
Bird Scientific name Status
African Penguin Spheniscus demersus Endangered
Cape Gannet Morus capensis Vulnerable
White breasted Cormorant Phalacrocorax carbo Least concern
Cape Cormorant Phalacrocorax capensis Endangered
Bank Cormorant Phalacrocorax neglectus Endangered
Crowned Cormorant Phalacrocorax coronatus Near-threatened
Kelp Gull Larus dominicanus Least concern
Hartlaub's Gull Chroicocephalus hartlaubi Least concern
Swift Tern Thalasseus bergii Least concern
Source: IUCN 2013. IUCN Red List of Threatened Species. Version 2013.2
<www.iucnredlist.org>. Downloaded 11.06.2014

Final Report, August 2014 84
The African Penguin breeds on Robben and Dassen Islands and all the islands of Saldanha Bay except
for Schaapen and Meeuw at the entrance to Langebaan Lagoon. The African penguins that breed on
Marcus Island are most vulnerable to the impact of blasting (Cooper, 1995).
Langebaan Lagoon, which potentially could be affected by sediments mobilised by dredging
operations, supports high numbers of resident and Palaearctic migrant waders: summer and winter
populations of waterbirds at Langebaan total about 35 000 and 10 000 birds respectively. The number
of waders in the region represents about 10% of the summer coastal wader population of South Africa
and this emphasises the conservation importance of the lagoon in a national and international context
(Ryan et al., 1988).
5.2.7.8 Marine Mammals
Twenty species of whales and dolphins have been recorded along the Cape West Coast of which five
species have been observed within Saldanha Bay (Findlay et al., 1992). These include killer Orcinus
orca, humpback Megaptera novaeangliae,southern right Eubalaena australis whales. Infrequent visitors
to the study area include the pygmy sperm whale Kogia breviceps and the dwarf sperm whale K.
simus. Minke whales Balaenoptera acutorostratus commonly occur close inshore. Large numbers of
dusky dolphins Lagenorhynchus obscurus and fewer Heaviside's dolphins Cephalorhynchus
heavisidii occur in the inshore waters of the study area. The Heaviside's or Benguela dolphin is
endemic to the west coast of southern Africa and occurs in relatively small numbers.
The Cape fur seal Arctocephalus pusillus pusillus occurs throughout the study area.
5.3. TERRESTRIAL AND AQUATIC ECOLOGY, RIVERS AND WETLANDS
The following description has been compiled using existing literature such as the Vegetation of South
Africa, Lesotho and Swaziland (Mucina & Rutherford, 2006), as well as spatial information sources
obtained from The South African National Biodiversity Institute Biodiversity Geographical Information
System (SANBI BGIS - http://bgis.sanbi.org) and the associated metadata and reports.
5.3.1. Sourcing of information
The BGIS is a South African National Biodiversity Institute initiative that is responsible for South
African spatial biodiversity planning information. The spatial data obtained from various databases
provide a good representation of the current condition and extent of terrestrial and aquatic ecological
features (Table 5.10). However, we recommended that the status of natural vegetation remnants that
may be affected by the construction of the LNG storage, regasification, and gas transmission
infrastructure be ground truthed by relevant specialists in order to confirm in-the-field conditions and
to identify any additional environmental sensitive areas.

Final Report, August 2014 85
Table 5.10: Spatial data sources used for assessing the potential impacts on terrestrial and aquatic ecological features.
Spatial dataset Source
Cape Nature Stewardship Sites Cape Nature Scientific Services
Cape Town Biodiversity Network BGIS website, SANBI
Critical Biodiversity Areas (CBAs) - Terrestrial &
Aquatic
BGIS website, SANBI
Cape Nature Scientific Services (for 2014 Western Cape
update)
Field Crop Boundaries Department of Agriculture, Forestry and Fisheries
National Freshwater Ecosystem Priority Areas (NFEPA) BGIS website, SANBI
NFEPA wetlands BGIS website, SANBI
NFEPA wetland clusters BGIS website, SANBI
Ramsar Sites BGIS website, SANBI
River FEPA's BGIS website, SANBI
Phase 2 FEPA's BGIS website, SANBI
Fish support areas BGIS website, SANBI
National Land Cover 2009 BGIS website, SANBI
National Protected Areas (NPA) BGIS website, SANBI
Marine Protected Areas BGIS website, SANBI
Formal Protected Areas BGIS website, SANBI
Informal Protected Areas BGIS website, SANBI
National Protected Areas Expansion Strategy
(NPEAS) focus areas
BGIS website, SANBI
Threatened Ecosystems (remaining extent) BGIS website, SANBI
Cape Nature Scientific Services (for 2014 Western Cape
update)
Vegetation map 2009 Cape Nature Scientific Services (update of the
Vegetation of South Africa, Lesotho and Swaziland
(Mucina & Rutherford, 2006))
5.3.1.1 National Land Cover
The 2009 National Land Cover provides seven aggregated land cover classes namely: natural,
degraded, waterbodies, cultivation, urban built-up, plantations, and mines. Land cover and –use
change may result in major impacts on biodiversity, mainly due to agricultural and urban
development.
5.3.1.2 Vegetation
Vegetation data was obtained from the most recent national vegetation map prepared by the South
African National Biodiversity Institute (Mucina and Rutherford, 2006). This map has been utilised as
the basis for numerous conservation planning initiatives. The vegetation descriptions provided in
Mucina and Rutherford (2006) are substantiated by comprehensive reference lists which can be
consulted for more detailed information if necessary.

Final Report, August 2014 86
5.3.1.3 Threatened ecosystems (remaining extent)
The concept of threatened ecosystems was formally introduced into South African legislation in the
National Environmental Management Act (Act No. 10 of 2004) with the aim of giving protection to
entire ecosystems rather than just particular species. This led to the classification of the vegetation
types in the national vegetation map as threatened ecosystems based on their current status (Driver et
al. 2005). The National Biodiversity Assessment of 2011 (Driver et al., 2012) identified threatened
terrestrial ecosystems which are in danger of significant or further loss of ecosystem structure,
function and composition due to human activities and other factors under the National Environmental
Management: Biodiversity Act (No. 10 of 2004). A national list of threatened ecosystems is provided
for in The National Environmental Management: Biodiversity Act (Act 10 of 2004). There are three
classes of threatened ecosystems namely: i) Critically endangered (CR) vegetation types which have
less than 25 % of its original cover remaining, have undergone severe degradation of ecological
structure, function or composition due to human activities, and are subject to an extremely high risk of
irreversible transformation; ii) Endangered (EN) vegetation types have lost more than 60% of its
original extent and have undergone degradation of ecological structure, function, or composition due
to human activities, although they are not critically endangered ecosystems; and iii) Vulnerable (VU)
vegetation types that have lost approximately 50 % of its original extent and are at a high risk of
undergoing significant degradation of ecological structure, function or composition due to human
activities, although they are not critically endangered ecosystems or endangered ecosystems. A key
criterion in the assessment of the national vegetation types involved how much cover had not been
irreversibly transformed. For CR ecosystems the threshold is a biodiversity target of 16-36% (with
higher values for more species-rich vegetation types like fynbos), for EN ecosystems it is the
biodiversity target +15% remaining, and for VU it is <60% remaining.
The listing of threatened ecosystems has planning implications and should therefore be considered in
municipal Integrated Development Plans (IDPs) and Spatial Development Frameworks (SDFs).
According to the NEMA and Environmental Impact Assessment (EIA) regulations, developments that
affect threatened ecosystems may necessitate Environmental Authorisations. Furthermore, listed
threatened ecosystems may also have proactive management, monitoring, and reporting
requirements as specified in the National Environmental Management: Biodiversity Act (NEMBA).
5.3.1.4 Critical Biodiversity Areas (CBA’s)
Terrestrial and aquatic CBA’s (terrestrial and aquatic) identified by the C.A.P.E. Fine-Scale Biodiversity
Planning (FSP) projects as areas that need to be managed in a manner compatible with biodiversity
conservation, and should preferably remain in, or be restored to, a natural state (Pence, 2008). They
include cultivated lands and degraded and natural remnants, the principle being that current land-use
patterns and the connectivity they provide should be maintained or improved through restoration.
Areas may be proclaimed CBAs based on the cumulative irreplaceability of a vegetation type. The loss
of a single remnant would therefore hamper the meeting of biological and ecological conservation
objectives. For CBAs natural land must be maintained, degraded land must be rehabilitated to a
natural or near-natural state and should be managed for no further degradation. The Aquatic CBA
spatial layer also contains Critical Ecological Support Areas (ESAs) within which ecological processes
must be maintained.

Final Report, August 2014 87
Cape Town Biodiversity Network
The City of Cape Town Biodiversity Network (CCT BioNet) employed a systematic biodiversity
planning approach to prioritise remnants of indigenous vegetation based on factors such as habitat
connectivity and condition, as well as the distribution of threatened flora (City of Cape Town
Municipality, 2012). The Cape Town Biodiversity Network spatial information includes Protected Areas,
Critical Biodiversity Areas (CBAs), and Ecological Support Areas (ESAs). The protected areas are divided
into i) conservation areas that have not yet been proclaimed, ii) protected areas proclaimed in
perpetuity, and iii) protected areas proclaimed for a limited period. CCT BioNet also includes levels of
CBAs and ESAs such as areas critical for landscape connectivity, irreplaceable core flora sites, and
natural / transformed ecosystems of conservation significance (Table 5.11).For the purpose of this
screening study BioNet CBA 1A and 1B was extracted and considered as “no-go” / fatal flaw areas
because they have been identified by the City of Cape Town as irreplaceable sites.
Western Cape Biodiversity Framework
The Western Cape Biodiversity Framework (Kirkwood et al., 2010) provides CBAs and CESAs, as well as
habitat condition for the Western Cape to inform land-use decision making. This data layer was used
to indicate CBAs in the Stellenbosch and Drakenstein Municipalities.

Final Report, August 2014 88
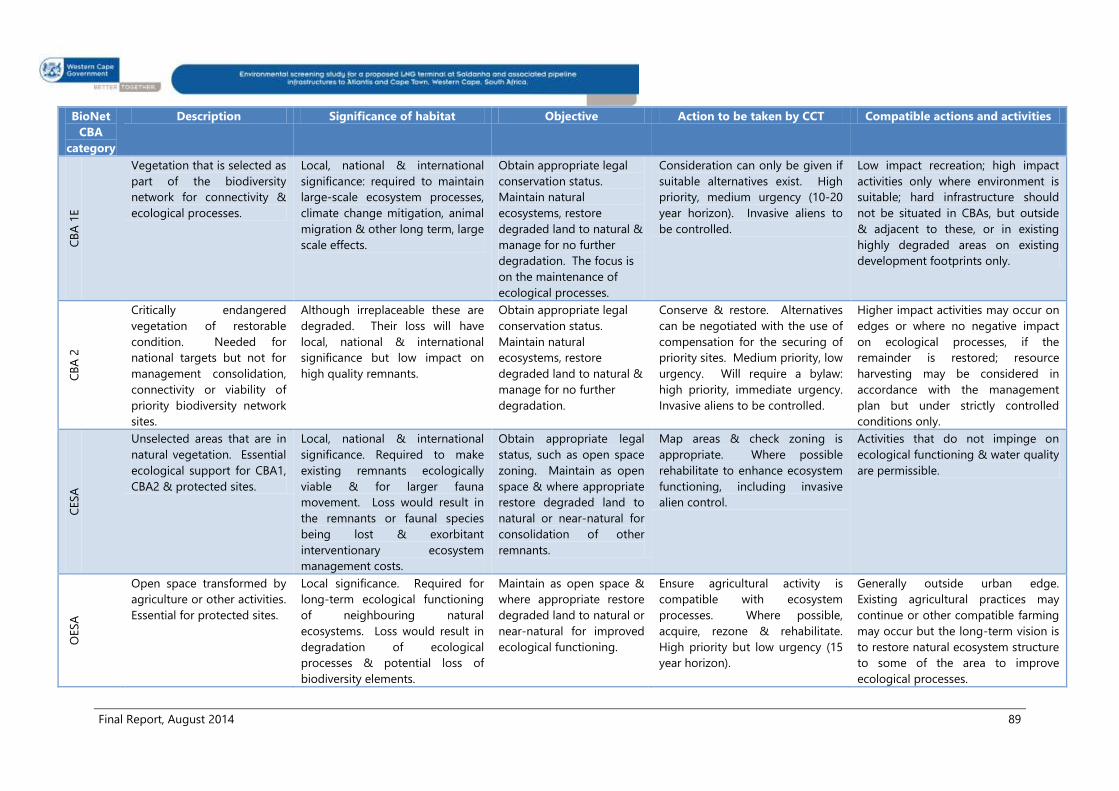
Table 5.11: Description, significance and permissible actions for the Critical Biodiversity Areas as defined by the City of Cape Town (CCT) Biodiversity Network (adapted from City of Cape
Town Municipality, 2012).
BioNet
CBA
category
Description Significance of habitat Objective Action to be taken by CCT Compatible actions and activities
CB
A 1
A
Core flora sites: irreplaceable
sites of historical significance
& very high priority.
Local, national & international
significance. Loss of habitat will
probably result in extinction of
some species & inability to attain
conservation targets.
Obtain appropriate legal
conservation status.
Maintain natural
ecosystems, restore
degraded land to natural &
manage for no further
degradation.
Core flora sites to be gazetted as
soon as possible. High priority.
Very high urgency (immediate).
Land owner negotiations. Invasive
aliens to be controlled.
Conservation, low impact recreation
& environmental education as
outlined in the management plan for
the site; hard infrastructure should
not be situated in CBAs, but outside
& adjacent to these, or in existing
highly degraded areas only.
CB
A 1
B
Critically endangered
vegetation of high &
medium quality. Needed for
national targets. Any loss is
a permanent & irrevocable
loss.
Needed for national targets. High
priority, very high urgency
(immediate). Invasive aliens to be
controlled.
CB
A 1
C
High & medium condition
vegetation that is
endangered or vulnerable &
selected on the biodiversity
network for meeting national
targets (c-plan). Loss can be
replaced by obtaining
specific unselected natural
vegetation sites.
Local, national & international
significance: any loss will require
specific alternative areas to be
targeted for conservation, but
these sites are not negotiable
unless alternative, equivalent sites
not on the biodiversity network
are secured first.
Needed for national targets. High
priority, high urgency (5-10 year
horizon). Invasive aliens to be
controlled.
CB
A 1
D
Critically endangered
vegetation of low/ restorable
condition. Essential for
management consolidation
& viability of CBA 1A, CBA 1B
& protected sites.
Local, national & international
significance. Required to make
existing remnants ecologically
viable. Loss would equal loss of
higher condition remnants
through degradation of ecological
processes & exorbitant
interventionary ecosystem
management costs.
Needed for national targets. High
priority, high urgency (10 year
horizon). Invasive aliens to be
controlled.
Final Report, August 2014 89
BioNet
CBA
category
Description Significance of habitat Objective Action to be taken by CCT Compatible actions and activities
CB
A 1
E
Vegetation that is selected as
part of the biodiversity
network for connectivity &
ecological processes.
Local, national & international
significance: required to maintain
large-scale ecosystem processes,
climate change mitigation, animal
migration & other long term, large
scale effects.
Obtain appropriate legal
conservation status.
Maintain natural
ecosystems, restore
degraded land to natural &
manage for no further
degradation. The focus is
on the maintenance of
ecological processes.
Consideration can only be given if
suitable alternatives exist. High
priority, medium urgency (10-20
year horizon). Invasive aliens to
be controlled.
Low impact recreation; high impact
activities only where environment is
suitable; hard infrastructure should
not be situated in CBAs, but outside
& adjacent to these, or in existing
highly degraded areas on existing
development footprints only.
CB
A 2
Critically endangered
vegetation of restorable
condition. Needed for
national targets but not for
management consolidation,
connectivity or viability of
priority biodiversity network
sites.
Although irreplaceable these are
degraded. Their loss will have
local, national & international
significance but low impact on
high quality remnants.
Obtain appropriate legal
conservation status.
Maintain natural
ecosystems, restore
degraded land to natural &
manage for no further
degradation.
Conserve & restore. Alternatives
can be negotiated with the use of
compensation for the securing of
priority sites. Medium priority, low
urgency. Will require a bylaw:
high priority, immediate urgency.
Invasive aliens to be controlled.
Higher impact activities may occur on
edges or where no negative impact
on ecological processes, if the
remainder is restored; resource
harvesting may be considered in
accordance with the management
plan but under strictly controlled
conditions only.
CESA
Unselected areas that are in
natural vegetation. Essential
ecological support for CBA1,
CBA2 & protected sites.
Local, national & international
significance. Required to make
existing remnants ecologically
viable & for larger fauna
movement. Loss would result in
the remnants or faunal species
being lost & exorbitant
interventionary ecosystem
management costs.
Obtain appropriate legal
status, such as open space
zoning. Maintain as open
space & where appropriate
restore degraded land to
natural or near-natural for
consolidation of other
remnants.
Map areas & check zoning is
appropriate. Where possible
rehabilitate to enhance ecosystem
functioning, including invasive
alien control.
Activities that do not impinge on
ecological functioning & water quality
are permissible.
OESA
Open space transformed by
agriculture or other activities.
Essential for protected sites.
Local significance. Required for
long-term ecological functioning
of neighbouring natural
ecosystems. Loss would result in
degradation of ecological
processes & potential loss of
biodiversity elements.
Maintain as open space &
where appropriate restore
degraded land to natural or
near-natural for improved
ecological functioning.
Ensure agricultural activity is
compatible with ecosystem
processes. Where possible,
acquire, rezone & rehabilitate.
High priority but low urgency (15
year horizon).
Generally outside urban edge.
Existing agricultural practices may
continue or other compatible farming
may occur but the long-term vision is
to restore natural ecosystem structure
to some of the area to improve
ecological processes.

Final Report, August 2014 90
BioNet
CBA
category
Description Significance of habitat Objective Action to be taken by CCT Compatible actions and activities
Co
nse
rvati
o
n a
rea
Non-proclaimed local &
private conservation areas
Local, national & international
significance. Loss of habitat will
probably result in extinction of
some species & inability to attain
conservation targets.
Maintain natural
ecosystems, restore
degraded land to natural &
manage for no further
degradation.
Pursue appropriate stewardship
conservation status (contractual or
biodiversity agreement). Ensure
management plans are in place,
implemented & audited.
Conservation, low impact recreation
& environmental education as
outlined in the management plan for
the site; hard infrastructure should
not be situated in CBAs, but outside
& adjacent to these, or in existing
highly degraded areas only.
Pro
tect
ed
:
in p
erp
etu
ity
Protected areas (national,
provincial, local &
contractual nature reserves)
Maintain natural
ecosystems, restore
degraded land to natural &
manage for no further
degradation. Ensure site is
an asset to the surrounding
communities.
Statutory conservation areas.
Ensure management plans are in
place, implemented and audited.
Pro
tect
ed
:
no
t in
perp
etu
ity These areas are currently
being managed as part of
existing reserves or core flora
sites, but have no legal status
as yet.
Maintain natural
ecosystems, restore
degraded land to natural &
manage for no further
degradation.
Secure legal conservation status
under the protected areas act.
Consolidate into existing
provincial or local authority
reserves where they lie adjacent.
Ensure management plans are in
place, implemented & audited.
Oth
er
natu
ral
veg
eta
tio
n
Natural vegetation status is
endangered, vulnerable and
least concern in good or
restorable condition.
Local significance. Will result in
impaired ability to meet targets,
given that higher categories will
not always be achievable.
Sustainable management
within general rural land-
use principles.
Negotiable. Low priority, no
urgency. Invasive alien control.
Until BioNet is secured elsewhere,
these areas may become important if
required as biodiversity offset sites.
Higher impact activities could be
considered on degraded portions.
Vegetation in good condition should
be subject to low impact activities
only.

Final Report, August 2014 91
5.3.1.5 National Protected Areas (NPA’s)
The NPA’s that were included for this screening study encompass formal (e.g. national Parks), informal
(e.g. private nature reserves), and marine protected areas. Furthermore, the National Protected Areas
Expansion Strategy (NPAES) focus areas were also included. These areas are extensive, intact and
unfragmented areas with significant biological importance and ecological resilience which are under
consideration for the creation or expansion of protected areas.
5.3.1.6 CapeNature Stewardship Sites
The CapeNature Stewardship Sites programme facilitates conservation on privately owned land by
setting up contractual agreements between the landowners and CapeNature to conserve the unique
biodiversity of the Cape Floral Kingdom. The landowners undertake to protect and manage their
properties or parts thereof according to sound conservation management principles. CapeNature
undertakes to support this management by providing advice, management plans and assistance in
planning invasive alien species clearing and fire management schedules. The CapeNature Stewardship
Sites spatial dataset was obtained directly from CapeNature Scientific Services on 24 February, 2014,
after a data request was submitted to them.
5.3.1.7 National Freshwater Ecosystem Priority Areas (NFEPA) and Ramsar sites
NFEPA areas indicate rivers, wetlands and estuaries that need to stay in a healthy condition to
conserve freshwater ecosystems and protect water resources for human use (Nel et al., 2011). Ramsar
sites are wetlands of international importance as ratified by the National Department of Environmental
Affairs under the Convention on Wetlands (Ramsar, Iran, 1971). South Africa is a party to this
intergovernmental treaty that expresses the commitment to maintain the ecological character of
Ramsar sites and to plan for sustainable use of all of the wetlands in their territories. The FEPA’s used
for this study include wetlands, wetland clusters, rivers, phase 2 river FEPA’s, and fish support areas.
Ramsar sites are not classified as wetland FEPAs, but are protected as aquatic conservation priority
areas. Wetlands are considered to be ecologically sensitive and wetland clusters consist of sets of
wetlands surrounded with relatively natural landscapes which act as dispersal corridors for the
migration of aquatic fauna, giving the a greater importance for conservation. River FEPA’s are rivers
that are considered to currently be in a good condition which should be preserved, whilst Phase 2
FEPA’s are moderately modified rivers, which should not be degraded and are targets for
rehabilitation. Fish sanctuaries are portions of catchments that are essential for protecting threatened
and near-threatened indigenous freshwater fish.
5.3.1.8 Field Crop Boundaries
This spatial dataset was compiled by the Departments of Agriculture of the Western Cape from aerial
photographs and has been extensively verified in the field. It indicates all agricultural areas classified
as horticulture and viticulture, pivots, shadenets, tea plantations, and annual crop cultivation / planted
pastures rotation. The Field Crop Boundaries dataset forms part of the CSIR’s spatial data archives and
was originally obtained from the AGIS (Agricultural Geo-referenced Information System) website
(http://www.agis.agric.za/agisweb/agis.html).

Final Report, August 2014 92
5.3.2. Terrestrial Ecology
5.3.2.1 Land Cover
Land cover is an important factor in assessing the environmental impacts as the effects of the pipeline
construction and maintenance will differ depending on land uses and the state of the environment.
The SANBI National Land Cover 2009 spatial database contains the following seven land cover classes
(Figure 5.22):
Built-up / urban
Cultivated – all areas where there is evidence of recent and continuing cultivation whether for
dryland or irrigated crops
Degraded – where the vegetation shows a clear reduction in canopy cover and changes in
dynamics that are typical of intensive and prolonged overgrazing or other factors which have
reduced the vegetation cover; restoration of vegetation in this state will require active
interventions
Mines
Natural – this includes all the remaining areas of natural vegetation which had close to the
expected vegetation cover and where seasonal contrasts showed that the seasonal dynamics
of the vegetation were still present (e.g. the flush of annual plants and geophytes in the
spring)
Plantations
Waterbodies
Degraded, cultivated, plantations, mines, and built-up / urban land cover classes are regarded as
transformed land. Degraded vegetation remnants will still have the threat status of the respective
vegetation type. The resulting map (Figure 5.22) clearly shows how extensively many of the vegetation
types have been transformed to predominantly cultivation land uses. The proposed gas transmission
pipeline routes are predominantly situated in natural and cultivated land cover classes (Figure 5.22).
Cultivated areas classified as viticulture or horticulture may be considered as sensitive or “no-go
areas”, as these crops are often woody, perennial vegetation (e.g. vineyards or orchards) and are not
as quick to recover after disturbance as, for instance, annual crops. They also have deep root systems
which may compromise the integrity of the pipeline and should therefore not be replanted within the
pipeline servitude (which may entail greater compensation payments to farmers). The horticultural and
viticultural areas in the pipeline buffer area are indicated in the more detailed maps used to identify
any constraints regarding the gas transmission pipeline routes (refer to Chapter 6: Identification and
evaluation of key issues and fatal flaws).

Final Report, August 2014 93
Figure 5.22: Land cover classification for the area proposed for the infrastructure associated with the
importation of LNG into the Western Cape.

Final Report, August 2014 94
5.3.2.2 Vegetation
The vegetation found along the proposed transmission pipeline route (from a possible position along
the western coast at St. Helena Bay to Saldanha bay to Cape Town via Atlantis and eventually to
Paarl/Wellington and Stellenbosch) consists primarily of vegetation belonging to the Fynbos Biome as
defined by the national vegetation map (Mucina and Rutherford, 2006). Azonal Vegetation types also
form part of the vegetation of the study area. Biomes are extensive ecological units distinguished
primarily by their vegetation characteristics and the driving forces that determine the functioning and
dynamics of these ecological units (Rutherford et al., 2006).
The Fynbos Biome is characterised by winter rainfall (Mucina and Rutherford 2006). A key driver in
most of the vegetation types in the Fynbos Biome is the periodic and recurrent fires. These regenerate
the vegetation provided that the fires occur at roughly the right intervals and in the right season.
The defining characteristic of the Azonal Vegetation is that the different types are not limited to single
biomes, bioregions or vegetation types (Rutherford et al. 2006). Their distribution and dynamics are
determined mainly by dominant habitat factors, for example, the mix of salt and freshwater inundation
and flushing which determines the location of salt marshes, or the frequency and duration of the
inundation of river floodplains which controls the distribution of different kinds of floodplain wetlands
(Bornman et al. 2008). The Azonal Vegetation types are floristically and dynamically similar to each
other even though they occur in biomes which may be very different.
Bioregions are subdivisions of biomes which are defined based on similar biotic and physical factors
to those used to define biomes (Rutherford et al. 2006). They form a level between biomes and
vegetation types based on the similarities of those vegetation types, and typically comprise regional
groupings. The Fynbos Biome vegetation is divided into three broad groups above the level of the
bioregion: the fynbos itself, the renosterveld and the strandveld (Rebelo et al. 2006).
The fynbos occurs largely on the nutrient poor, sandy soils derived from the sandstones of the Table
Mountain Group but is also found on granite and shale derived soils in high rainfall areas. It is
generally characterised by the presence of members of one or more of the three plant families:
Proteaceae, Ericaceae and Restionaceae. The fynbos, in turn can be divided into the sandstone fynbos,
which occurs mainly on sandstones and the generally shallow soils derived directly from them, and the
sand fynbos which is found on the generally deep, acidic, sandy soils of the coastal plains.
The renosterveld occurs on the relatively fertile shale and granite-derived soils on the coastal plains
and lower slopes of the mountains. Strandveld vegetation is found mainly in the coastal areas on
sandy soils usually with a moderate to high lime content (i.e. calcareous soils).
Both renosterveld and fynbos vegetation types generally require fire to regenerate the plants and
maintain their rich flora. The strandveld can burn during hot, windy summer days but generally does
not burn nor require fire for regeneration. Annual plants are generally rare in fynbos but are more
abundant in the coastal sand-plain fynbos and in the strandveld vegetation types (e.g. Langebaan
Dune Strandveld). Annual plants respond strongly to rainfall and they reduce the risk of poor

Final Report, August 2014 95
flowering and seed production in dry years by having seed banks with variable germination
requirements (Van Rooyen et al. 1990, Von Willert et al. 1990).
The specific vegetation types which may possibly be affected by infrastructure associated with the
importation of LNG into the Western Cape are indicated in Figure 5.23 and further investigated in
Chapter 6 Identification and evaluation of key issues and potential fatal flaws.
5.3.2.3 Threatened Ecosystems Status
Ecosystem threat status is based on degree to which ecosystems are still intact or alternatively losing
vital aspects of their structure, function and composition, which could compromise their ability to
provide ecosystem services. The threatened ecosystems spatial data consists of three levels namely:
Vulnerable, Endangered, and Critically Endangered, based primarily on the proportion of each
ecosystem type that remains in good ecological condition relative to a series of thresholds. Vulnerable
vegetation types generally have lost more than about 50% of their original extent although other
factors such as the numbers of threatened species can also play a role (South Africa, 2011). The same
applies to Endangered (>60% lost) and Critically Endangered (>75% lost). The major cause of the loss
of these vegetation types has been the transformation of the land into cultivated fields, primarily for
growing dryland crops such as wheat but also for irrigation. The Renosterveld vegetation types are the
most threatened in the study area, with some having lost about 90% of their original area due to
conversion into wheat fields.
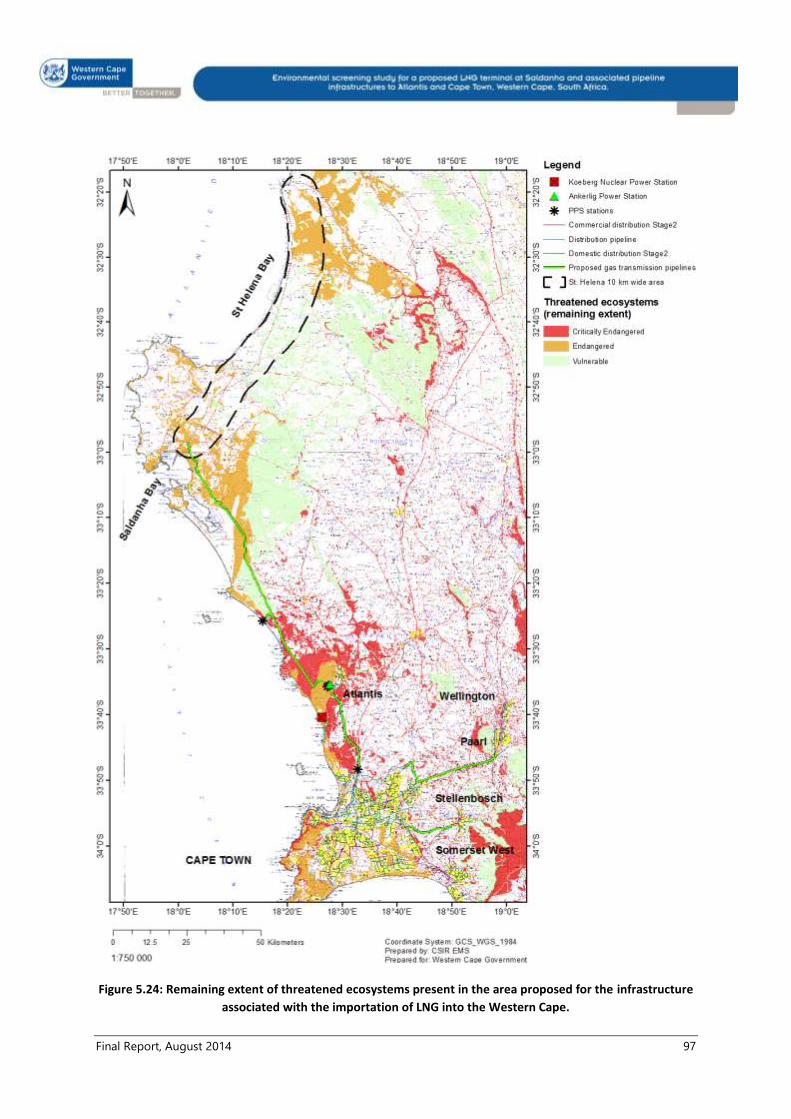
The remaining extent of threatened ecosystems was used for the purpose of this study (Figure 5.24). It
should be noted that detailed “in-the-field” ground-truthing of the areas that may be affected by the
gas transmission pipeline may reveal areas that may be mapped as being remaining natural
vegetation but are in reality transformed, and vice versa.
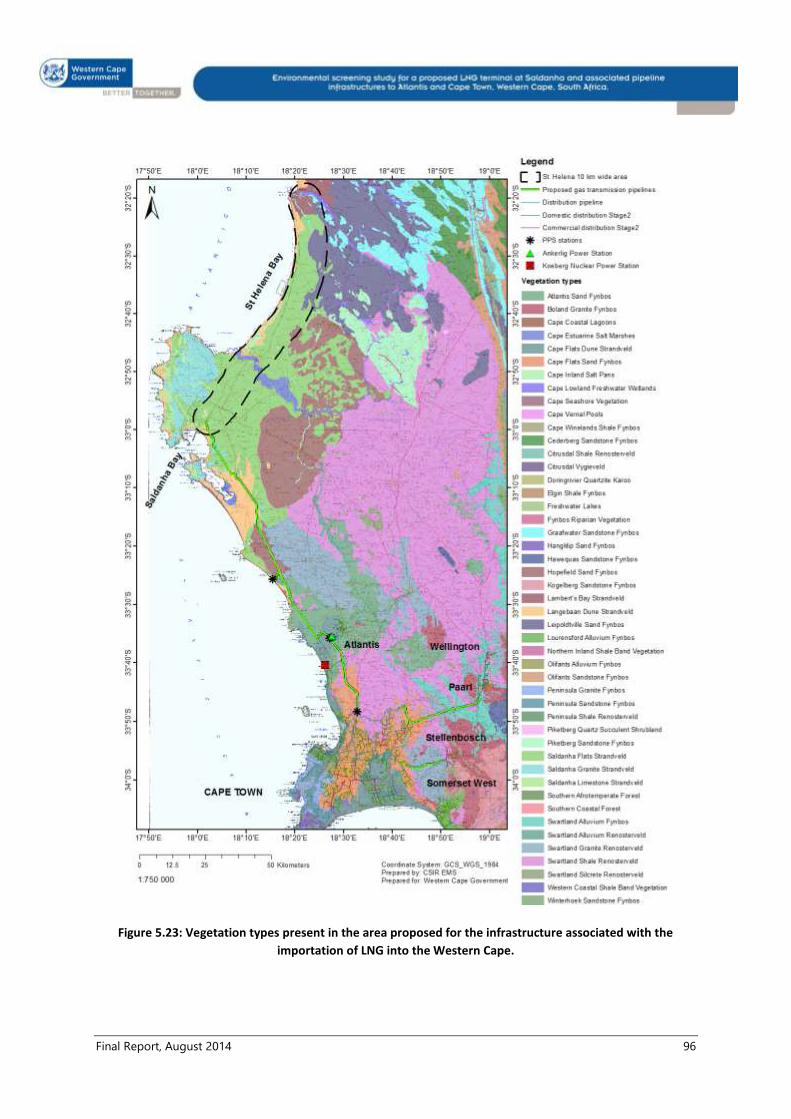
Final Report, August 2014 96
Figure 5.23: Vegetation types present in the area proposed for the infrastructure associated with the
importation of LNG into the Western Cape.
Final Report, August 2014 97
Figure 5.24: Remaining extent of threatened ecosystems present in the area proposed for the infrastructure
associated with the importation of LNG into the Western Cape.

Final Report, August 2014 98
5.3.2.4 Conservation planning
This environmental screening study also had to take into account the outputs of the various
conservation planning studies, which focus on the identification and delineation of Critical Biodiversity
Areas (Figure 5.25) and Protected Areas (Figure 5.26). Background information on the conservation
planning data is provided in Section 5.3.1: Sourcing of spatial information. The overall aim of the
conservation planning is twofold: i) to ensure that the best remnants are included in the plans,
whether or not they are protected; and ii) to provide for migration and movement corridors that link
adjacent remnants and connect remnants from the coast to the interior and parallel to the coast
(Pence, 2008).
National Protected Areas (NPA’s) are divided into areas declared as being formally protected
according to South African legislation (i.e. South African National Parks, local nature reserves,
provincial nature reserves) and informally protected areas which mainly comprise private nature
reserves. National Protected Areas Expansion Strategy (NPAES) focus areas, and CapeNature
stewardship sites are also indicated (Figure 5.26). All these areas contribute to identifying conservation
areas that are intended to be protected, as far as possible, from ecological alterations and are often
hubs for ecotourism. Some of the NPAES focus areas may not be selected for protection, therefore
provincial and municipal development plans should be consulted in order to determine which NPEAS
focus areas are going to be proclaimed and gazetted.
The protected areas that are included within the 10 km buffer area either side of the proposed LNG
transmission pipeline route are listed in Table 5.12.
Table 5.12: National Protected Areas, NPAES focus areas, and CapeNature Stewardship Sites occurring in the study area.
Local Protected Areas are those proclaimed and managed by Local Authorities.
Reserve name Type Management Municipality
Fo
rmal
pro
tecte
d a
reas
Assegaaibosch Nature Reserve Provincial Nature
Reserve Cape Nature Stellenbosch
Blaauwberg Nature Reserve Provincial Nature
Reserve Cape Nature City of Cape Town
Blouberg Provincial Nature
Reserve
Provincial Nature
Reserve Cape Nature City of Cape Town
Brackenfell Local Nature
Reserve Local Nature Reserve Local Protected Area City of Cape Town
Darling Renosterveld Local
Nature Reserve Local Nature Reserve Local Protected Area Swartland
Darling Veldblomme Local
Nature Reserve Local Nature Reserve Local Protected Area Swartland
Dassen Island Reserve Island Reserve Cape Nature Swartland
Driftsands Nature Reserve Provincial Nature
Reserve Cape Nature City of Cape Town
Durbanville Local Nature
Reserve Local Nature Reserve Local Protected Area City of Cape Town
Elandsbaai Nature Reserve Forest Act Protected
Area Cape Nature Cederberg
False Bay Seal Island Reserve Island Reserve Cape Nature City of Cape Town

Final Report, August 2014 99
Groenberg Nature Reserve Forest Act Protected
Area Cape Nature Drakenstein
Groenlandberg Nature Reserve Forest Act Protected
Area Cape Nature Drakenstein
Harmony Flats Nature Reserve Provincial Nature
Reserve Local Protected Area City of Cape Town
Hawequas Mountain
Catchment Area
Mountain Catchment
Area Private Drakenstein
Haweqwa Nature Reserve Forest Act Protected
Area Cape Nature Drakenstein
Helderberg Local Nature
Reserve Local Nature Reserve Local Protected Area City of Cape Town
Helderberg MPA MPA Cape Nature City of Cape Town
Helderberg Nature Reserve Forest Act Protected
Area Cape Nature
City of Cape Town,
Stellenbosch
Hottentots-Holland Mountain
Catchment Area
Mountain Catchment
Area Private
City of Cape Town,
Stellenbosch
Hottentots-Holland Nature
Reserve
Forest Act Protected
Area Cape Nature
City of Cape Town,
Stellenbosch
Jan Marais Local Nature
Reserve Local Nature Reserve Local Protected Area Stellenbosch
JN Briers Louw Nature Reserve Provincial Nature
Reserve Cape Nature Drakenstein
Jonkershoek Nature Reserve Forest Act Protected
Area Cape Nature Stellenbosch
Kalbaskraal Local Authority
Nature Reserve Local Nature Reserve Local Protected Area Swartland
Kogelberg Nature Reserve Forest Act Protected
Area Cape Nature Stellenbosch
Lourens River Local Nature Reserve Local Protected Area City of Cape Town
Mont Rochelle Local Nature Reserve Local Protected Area Stellenbosch
Paardenberg Local Nature Reserve Local Protected Area Swartland
Paarl Mountain Local Nature
Reserve Local Nature Reserve Local Protected Area Drakenstein
Pela Nature Reserve
(Riverlands)
Provincial Nature
Reserve Cape Nature Swartland
Raapenberg Bird Sanctuary
Nature Reserve Local Nature Reserve Local Protected Area City of Cape Town
Rietvlei Local Nature Reserve Local Protected Area City of Cape Town
Riverlands Nature Reserve Provincial Nature
Reserve Cape Nature Swartland
Rocherpan Nature Reserve Provincial Nature
Reserve Cape Nature Bergrivier
Rondevlei Bird Sanctuary Local Nature Reserve Local Protected Area City of Cape Town
SAS Saldahna Contractual
Nature Reserve
Provincial Nature
Reserve Cape Nature Saldanha Bay
Seal Ledges Island Reserve Island Reserve Cape Nature Saldanha Bay
Simonsberg Nature Reserve Forest Act Protected
Area Cape Nature Stellenbosch
Table Mountain National Park National Park South African National
Parks City of Cape Town

Final Report, August 2014 100
Table Mountain National Park
MPA MPA
South African National
Parks City of Cape Town
Theewaters Nature Reserve Forest Act Protected
Area Cape Nature City of Cape Town
Tygerberg (Bellville) Local Nature Reserve Local Protected Area City of Cape Town
Vondeling Island Reserve Island Reserve Cape Nature Saldanha Bay
West Coast National Park National Park South African National
Parks Saldanha Bay
West Coast National Park MPA MPA South African National
Parks Saldanha Bay
Wolfgat Local Nature Reserve Local Protected Area City of Cape Town
Zandvlei Bird Sanctuary Local Nature Reserve Local Protected Area City of Cape Town
Info
rmal
pro
tecte
d a
reas
Blouberg Private Nature
Reserve Private Nature Reserve Private City of Cape Town
Elandsfontein Private Nature
Reserve Private Nature Reserve Private Saldanha Bay
Grotto Bay Private Nature
Reserve Private Nature Reserve Private Swartland
Hopefield Rivate Nature
Reserve Private Nature Reserve Private Saldanha Bay
Jakkalsfontein Private Nature
Reserve Private Nature Reserve Private Swartland
Koeberg Private Nature
Reserve Private Nature Reserve Private City of Cape Town
Langerug Private Nature
Reserve Private Nature Reserve Private Drakenstein
Pierre-jeanne Gerber Nr. 2
Private Natu Private Nature Reserve Private Swartland
Rondeberg Private Nature
Reserve Private Nature Reserve Private Swartland
NP
AES
fo
cu
s
are
as
Boland Koggelberg - - City of Cape Town
West Coast Leipoldville
Pensinsula - -
Cederberg, Bergrivier,
Saldanha Bay
Cap
eN
atu
re S
tew
ard
ship
sit
es
Bo-kloof Biodiversity Agreement - City of Cape Town
Burgherspost Wine Estate and
Cloof
Voluntary Conservation
Area - Swartland
Contermanskloof Voluntary Conservation
Area - City of Cape Town
De Grendel Biodiversity Agreement - City of Cape Town
Fairview Diamant Biodiversity Agreement - Drakenstein
Harmony Flats Biodiversity Agreement - City of Cape Town
High Slent Contract Nature
Reserve - Swartland
Intaka Island Voluntary Conservation
Area - City of Cape Town
Lourensford Voluntary Conservation
Area - City of Cape Town

Final Report, August 2014 101
Paarl Mountain Contract Nature
Reserve - Drakenstein
Rhenosterkop Contract Nature
Reserve - Drakenstein
Ridgeback Wines Voluntary Conservation
Area - Drakenstein
Rust Roes Biodiversity Agreement - Bergrivier
Simson Simons Contract Nature
Reserve - Swartland
Summervale Biodiversity Agreement - City of Cape Town
Valencia Voluntary Conservation
Area - Drakenstein
Vensterklip Contract Nature
Reserve - Cederberg
Vleikraal Contract Nature
Reserve - Cederberg
Waterkloof Voluntary Conservation
Area - City of Cape Town
Wedderwill Voluntary Conservation
Area - City of Cape Town
Note: The above protected areas are in the close vicinity of the proposed transmission and
distribution pipelines and other infrastructure, and all may not necessarily be impacted.
The protected mountain areas managed by CapeNature, notably the reserves in the Boland Mountain
Complex (e.g. Jonkershoek Nature Reserves, Hottentots Holland Nature Reserve, Kogelberg Nature
Reserve) and the Table Mountain National Park (Table 5.12) form part of The Cape Floral World
Heritage Area (UNESCO, 2009). If any of these areas are affected by the proposed gas transmission
pipeline, the relevant World Heritage authorities would have to be notified about these impacts.

Final Report, August 2014 102
Figure 5.25: Critical Biodiversity Areas present in the area proposed for the infrastructure associated with
the importation of LNG into the Western Cape.

Final Report, August 2014 103
Figure 5.26: Protected areas present in the area proposed for the infrastructure associated with the
importation of LNG into the Western Cape
Final Report, August 2014 104
5.3.3. Aquatic ecology, rivers, estuaries and wetlands
The proposed pipeline route crosses several perennial and non-perennial rivers, estuaries as well as a
number of natural and artificial wetlands.
The types of rivers that will be traversed by the proposed pipeline in the study area are diverse mainly
due to their flow regimes which are determined largely by the size and location of their catchments
(Table 5.13). The volume of the water flows and the flow regime are key drivers of the ecology of the
river system, both for the aquatic systems and the associated riverine (riparian or floodplain)
ecosystems. Most of the rivers are perennial because they drain high rainfall areas in the adjacent
mountains, the exceptions being those that drain low rainfall areas such as the Modder River on the
west coast near Atlantis. There is a wide range in the mean annual runoff which is strongly influenced
by size and rainfall, with the Berg River having the highest runoff.
Of South Africa's large rivers and associated ecosystems, 84% are threatened, of which 44% of the
rivers are Critically Endangered, 27% Endangered, 11% vulnerable and 18% are least threatened. A
Critically Endangered river means that the river has little to no intact/natural features, thus putting the
biodiversity patterns and ecological processes associated with that river at risk. The majority of the
river crossings for this project are classified as Critically Endangered, highlighting how extensively
these river systems have been transformed, with very little of their length in a near natural state. Most
of the rivers, particularly the large ones like the Berg River, have wide floodplains with distinct
ecosystems recognised as Azonal alluvial vegetation types. The smaller rivers also have distinct
vegetation types in their riparian areas but these are not extensive enough to be shown in the national
vegetation map.
The pipeline will also cross various estuaries, estuarine functional zones (which include the open water
area, estuarine habitat and floodplain area) and wetlands. The South African definition of an estuary
differs from the traditional Northern Hemisphere definition in that any river, ephemeral, seasonal or
perennial, that reaches the sea however infrequently is considered to be an estuary. An estuarine
functional zone is defined by the 5m topographical contour in most cases and includes the most
dynamic and environmental sensitive area of an estuary.
In the study area, only the Berg Estuary is a "textbook" estuary, being tidal and receiving a fluvial input
for most of the year (or would have done if the catchments had not been developed extensively). The
Berg River Estuary is characterised by a large (5 000 ha) floodplain across which the 50 km-long
estuarine channel meanders. During winter floods, the estuary is fresh throughout but as the river flow
decreases seawater progressively penetrates further and further up the estuarine channel. Almost all
of the estuarine channel can become saline by the end of a long dry summer (DWAF 2007). In most
years, the Berg River floodplain is flooded in winter and is an important breeding area for waterfowl.
In summer the floodplain provides dry season grazing. The area downstream of the Sishen-Saldanha
railway bridge is one of the most important wintering areas for Palaearctic migrant bird species on the
south west coast of Africa. The Berg has been proposed as a Ramsar site (DWAF 2007).
Several artificial and natural wetlands are present within the proposed pipeline routing. The largest
and most important wetland that falls within the pipeline routing is the Verlorenvlei wetland which is

Final Report, August 2014 105
one of the largest natural wetlands along the West Coast connected to the sea by a seasonal estuarine
channel. Verlorenvlei is a coastal lake some 14.5 km long and 1.4 km wide covering an area of
approximately 1 000 ha. Its mean depth is 2.5 m and reaches a maximum of 5.0 m. It is connected to
the sea by a narrow channel which runs over a rocky sill near the high water mark. Seawater, therefore,
enters the system only on high spring tides. After good winter rains the outflow channel can contain
water for several months and allows mullet and white steenbras to enter and leave the vlei.
Abstraction of water for irrigation leads to a considerable drop in water levels in summer resulting in
extensive muddy areas being exposed (Sinclair et al. 1986). This coastal lake also plays an important
role in ecosystems services and biodiversity within the area.
Verlorenvlei is a proclaimed Ramsar site (designated 28 June 1991) although the system is afforded no
formal protection. It is important both nationally and regionally for waterbirds. At least 62 species of
waterfowl, wading, and water-associated birds have been recorded. The seaward half of the vlei is the
most important for waterbirds although these species may be encountered throughout the system.
(http://www.ngo.grida.no/soesa/nsoer/resource/wetland/verlorenvlei.htm)
The Langebaan lagoon lies to the west of the proposed pipeline and is entirely marine and includes
the lagoon, intertidal sandflats, marshlands and Geelbek annex and the inshore islands: Jutten, Marcus
and Scaapen. It is also classified as a Ramsar site.

Final Report, August 2014 106
Table 5.13: The main rivers that will be crossed by the proposed pipeline with information on the area of the catchments, river flows, size (order), threat status at the crossing
and the number of crossings
Name Location of
mouth or
tributary of
Approximate
catchment area
(km2)
Flow regime
(perennial/non-
perennial)
Mean annual
runoff*
(million m³)
Order Conservation
status
No. of
crossings
Tra
nsm
issi
on
St.
Hele
na c
orr
ido
r Verlorevlei Die Mond (Elands
Bay)
1 895 Perennial 1.9 3 CR Possibly
1
Papkuil Die Vlei
(Rocherpan)
26 325 Perennial 4.8 1 CR Possibly
1
Great Berg Bergriviermond 8 909 Perennial 679.6 4 CR Possibly
1
Sald
an
ha –
Cap
e T
ow
n g
as
pip
elin
e
Dwars Rondeberg 44 361 Non-perennial 0.7 1 CR 1
Modder Bakkies se Bank 154 484 Perennial 2.3 2 CR 1
Sout Kapteinsbaai 82 141 Non-perennial 0.9 1 CR 1
Diep Woodbridge Island 1 501 Perennial 87 3 CR 1
Tra
nsm
issi
on
gas
pip
elin
es
to
Paarl
/Wellin
gto
n g
an
d S
tellen
bo
sch
Mosselbank Diep 159 330 Perennial 9.5 1 CR 1
Great Berg Bergriviermond 8 909 Perennial 413 3 CR 1
Eerste
(Plankenbrug)
False Bay 103 970 Perennial 14.3 3 CR 1
Eerste
(Jonkershoek)
False Bay 27 100 Perennial 14.1 3 CR 1
Dis
trib
uti
on
Do
mest
ic d
istr
ibu
tio
n (
Cap
e
To
wn
)
Bottelary False Bay 78 190 Perennial 6 1 CR Multiple
Kuils** False Bay 54 692 Perennial 4.2 1 CR Multiple
Soutvlei Table Bay 10 030 Perennial 1.2 2 EN Multiple
Elsieskraal Table Bay 87 830 Perennial 10.8 1 CR Multiple
Black** Table Bay 2 715 Perennial 0.3 2 EN Multiple
Vyekraal Black 97 950 Perennial 4 1 EN Multiple
Liesbeek Table Bay 25 875 Perennial 3.2 1 EN
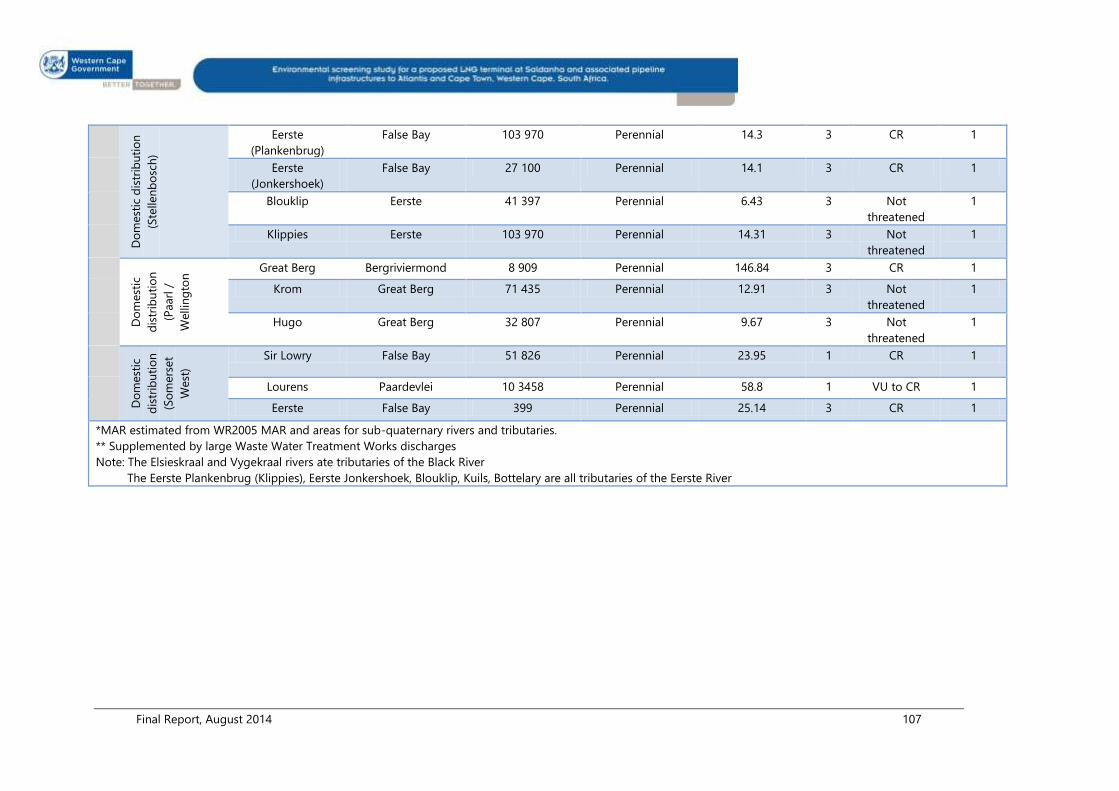
Final Report, August 2014 107
Do
mest
ic d
istr
ibu
tio
n
(Ste
llen
bo
sch
)
Eerste
(Plankenbrug)
False Bay 103 970 Perennial 14.3 3 CR 1
Eerste
(Jonkershoek)
False Bay 27 100 Perennial 14.1 3 CR 1
Blouklip Eerste 41 397 Perennial 6.43 3 Not
threatened
1
Klippies Eerste 103 970 Perennial 14.31 3 Not
threatened
1
Do
mest
ic
dis
trib
uti
on
(Paarl
/
Wellin
gto
n Great Berg Bergriviermond 8 909 Perennial 146.84 3 CR 1
Krom Great Berg 71 435 Perennial 12.91 3 Not
threatened
1
Hugo Great Berg 32 807 Perennial 9.67 3 Not
threatened
1
Do
mest
ic
dis
trib
uti
on
(So
mers
et
West
)
Sir Lowry False Bay 51 826 Perennial 23.95 1 CR 1
Lourens Paardevlei 10 3458 Perennial 58.8 1 VU to CR 1
Eerste False Bay 399 Perennial 25.14 3 CR 1
*MAR estimated from WR2005 MAR and areas for sub-quaternary rivers and tributaries.
** Supplemented by large Waste Water Treatment Works discharges
Note: The Elsieskraal and Vygekraal rivers ate tributaries of the Black River
The Eerste Plankenbrug (Klippies), Eerste Jonkershoek, Blouklip, Kuils, Bottelary are all tributaries of the Eerste River

Final Report, August 2014 108
5.4. HERITAGE RESOURCES
This section is based on the specialist study undertaken by Dr Jayson Orton from ASHA Consulting
(Pty) Ltd, under appointment to CSIR, as part of the Environmental Screening study for a proposed
LNG terminal in Saldanha or offshore and associated transmission and distribution pipeline network to
Atlantis, Cape Town, Stellenbosch, Paarl and Wellington.
5.4.1 Palaeontological resources
The SAHRIS database includes a palaeontological sensitivity map and it is this which is used to identify
those parts of the study area that are palaeontologically sensitive. Since fossils are seldom visible at
the surface, the map is colour-coded as shown in Table 5.14 according to the sensitivity of the
underlying geological strata. Extracts of this map are reproduced in Figures 5.27 to 5.29.
Table 5.14: Sensitivity and actions required for palaeontology in South Africa. The colours reflect the SAHRIS
palaeontological sensitivity map coding (refer to http://www.sahra.org.za/map/palaeo).
Colour Sensitivity Required Action
Red Very high Field assessment and protocol for finds is required.
Orange/yellow High Desktop study is required and based on the outcome of
the desktop study, a field assessment is likely.
Green Moderate Desktop study is required.
Blue Low No palaeontological studies are required however a
protocol for finds is required.
Grey Insignificant/zero No palaeontological studies are required.
5.4.1.1 Section 1: St Helena Bay
The western shores of St Helena Bay are generally of low palaeontological sensitivity (Figure 5.27). It is
only in the far north, in the hills to the south of the Verlorenvlei, that small patches of geology rated
as being of medium significance occur. One notable palaeontological feature of this area is the
extensive raised beach deposits exposed in excavations along the western shores of St Helena Bay.
These deposits are known as the ‘Veldrif Formation’ and pertain largely to the last interglacial (120-
127 000 years ago) high sea levels when the ocean was approximately 6 m higher than it is at present
(Pether 2006). Miller et al. (1993) have also documented mid-Holocene raised beach deposits from
this area. Excavations into the coastal plain have shown that the Holocene deposits are substantial
(approximately 6 m deep; Pether 2004).
5.4.1.2 Section 2: Vredenburg Peninsula
The majority of the assessment corridor in this area is indicated as being of low palaeontological
sensitivity (Figure 5.27). Only in the west is there a strip shown as being of high sensitivity. Broadly
following the R27 road alignment here is unlikely to cause any significant impacts. The most important
geological deposits containing fossils in this area occur at depth and are unlikely to be impacted
(Pether 2010).

Final Report, August 2014 109
Figure 5.27: Extract from the SAHRIS palaeomap showing Sections 1 and 2.
5.4.1.3 Section 3: Saldanha Bay and Langebaan
Most of the Saldanha bay area is marked on SAHRIS as having high palaeontological significance
(Figure 5.28). The iron ore terminal area and the first 30 km of the pipeline route to the south are
probably the most significant in terms of fossil heritage with vast numbers of academic papers
published on the findings of research projects in the area. A number of surface surveys close to and
north of the terminal site have yielded nothing of interest (e.g. Hart 2003a; Hart & Pether 2008; Orton
2011a, 2011b, 2012b), probably largely due to the thin mantle of white aeolian sand that generally
covers the surface in areas close to Saldanha Bay, but one survey located an extensive low density
scatter of shellfish said by John Pether (pers. comm in Kaplan 2007a) to represent a late Pleistocene
raised beach deposit. A similar raised beach deposit was located on another site close to the iron ore
terminal (Kaplan 2007b). Although the aeolian sand deposits can contain sporadic relatively recent
fossils, Pether (2011) has noted that several of the subsurface geological formations in the area are
palaeontologically significant for varying reasons – deep excavations in this region have yielded fossils
at several locations. The world famous Langebaanweg fossil site (Halkett & Hart 1999; Hendey 1969,
1982; Singer 1961) lies some 10 km northeast of the iron ore terminal area and just 2 km east of the
Section 1
Section 2
Final Report, August 2014 110
R27, while 22 km inland of the terminal location and some 10 km east of the pipeline route is the
equally well-known Elandsfontein (a.k.a. Hopefield) fossil site (Klein 1988; Singer & Wymer 1968;
Figure 3). While these sites, and particularly Langebaanweg, have provided finds in good context,
Pether (2011) notes that the vertebrate fossils revealed in deep excavations at Saldanha Steel may be
from reworked contexts. A field survey to the north of the Elandsfontein fossil site yielded large
numbers of small fossil bone fragments that had likely been brought to the surface by moles (Orton
2007). These bones, and the presence of thousands of others in the dunes to the south, are strong
indicators of the subsurface fossil potential of this area. In recognition of its significance, the
Elandsfontein site is presently being declared a provincial heritage site by Heritage Western Cape.
Calcrete beds occur throughout the area and these can be fossiliferous themselves, but might also
have provided shelter for humans and/or burrowing animals (including hyenas) in the past. The
remains of their prey might now be fossilised beneath the calcrete capping. Sea Harvest (Grine & Klein
1993) and Hoedjiespunt (Berger & Parkington 1995), two sites on the north-western shores of the bay,
both provide examples of fossil and archaeological material preserved beneath calcrete caps with
both including hominin material. Elandsfontein has also produced a single hominin bone. Two
kilometres to the south of the iron ore terminal area fossils have been found and sampled from
Spreeuwal where they are present in a layer just below current mean sea level (Klein & Avery
unpublished, in Klein et al. 2007; personal observation).
On the western side of Langebaan Lagoon the fossil sensitivity map also indicates areas of high
sensitivity along with some areas rated as moderate. Similar deposits will no doubt occur in that area
to what are present in the better studied eastern part of this division.
5.4.1.4 Section 4 : Western Swartland
The area between Langebaan and Atlantis is less sensitive with the vast majority of this area rated as
being of low palaeontological sensitivity (Figure 5.28). To the east of the R27 road lie the granitic
Darling Hills. Granite is completely unfosiliferous, although isolated younger fossils may be found in
the overlying aeolian sediments. The surrounding geology is Malmesbury Shale which is of low
significance with the coastal strip having recent aeolian cover sands that again might trap isolated
fossils. One small area near Grotto Bay carries high significance. Surveys along the coast, where
calcrete is found, have shown that fossils can be preserved there. Several exposures of fossil bone
were found in dune deflations at Tygerfontein (Avery et al. 1990; Kaplan 2005b). These fossil
exposures are up to about 5 km of the proposed landfall site to its northwest.

Final Report, August 2014 111
Figure 5.28: Extract from the SAHRIS palaeomap showing Sections 3 and 4.
5.4.1.5 Section 5: Atlantis Dunes
Just north of Atlantis the proposed pipeline route crosses the north-eastern part of the Atlantis dune
field which is rated as being of moderate sensitivity, although one section closer to the coast has very
high sensitivity (Figure 5.29). At an unknown location in the vicinity of Atlantis, Peringuey (1911)
reported fossil bones in association with recent stone artefacts from a spring on a farm then known as
Bloembosch. This is likely in the south of Atlantis where a road of that name currently runs. This site
has not been located in recent times and its whereabouts and significance remain unknown. A little
further to the southwest, in the Koeberg Nature Reserve, are the Duinefontein fossil sites – these lie in
the area with very high sensitivity. At Duinefontein 2, small numbers of ESA stone artefacts were found
alongside an extensive faunal assemblage in an area thought to have been a wetland some 300 000
years ago (Cruz-Uribe et al. 2003; Klein et al. 1999). Just north of this site a similar exposure also
revealed ESA artefacts and animal bones (Avery & Klein 2011), while nearby Hendey (1968, 1969) had
located another occurrence of fossil bone which he thought might be associated with MSA artefacts.
While some of these sites are technically archaeological, the general frequency of fossil bones in the
sites points to the overall generally high sensitivity of the dune field area.
Section 2
Section 3
Section 4

Final Report, August 2014 112
5.4.1.6 Section 6 : Southern Swartland
Because this area is largely underlain by Malmesbury shale, the fossil potential is indicated as low,
although one section of the coast between Melkbosstrand and Blouberg is given a moderate
significance rating (Figure 5.29). Fossil bones (and rare stone artefacts) are found on the beach from
time to time indicating the presence of fossiliferous deposits beneath the present land surface and
which are exposed sub-tidally. Given that fossils are regularly found along the shoreline all the way to
Woodstock beach, it is possibly, though perhaps not very likely, that deposits like those found at
Duinefontein could be uncovered in this region.
5.4.1.7 Section 7 : Cape Flats
An extensive network of pipelines is planned across the Cape Flats and extending into Cape Town in
the west. In this area the pipelines will be placed within areas already disturbed by development
activities and impacts are unlikely. However, the chance does still exist of intersecting ex situ fossils
that might be trapped within fills relating to earlier development activities and these may retain some
scientific value. These would generally be relatively recent fossils such as tortoises. In general, most of
the Cape Flats region is given a low to moderate palaeontological significance on the SAHRIS
palaeomap (Figure 5.29), however small areas in the south, close to the False Bay Coast are indicated
as being of high significance. These areas relate to deposits of calcrete and aeolianite which are
particularly well exposed at the Wolfgat Nature Reserve at a site known as Swartklip (Almond &
Pether 2008; Hendey 1969; Hendey & Hendey 1968). The reserve is named after the brown hyena (or
strandwolf), since old lairs have been found in the cliffs. It is late Pleistocene examples of these lairs
that have yielded some of the most important fossils to have been found in the area. Particularly
important is a hard ‘palaeosurface’ of calcrete/limestone belonging to the Wolfgat Member of the
Langebaan Limestone Formation. This surface may have been covered and uncovered several times by
aeolian sands with the result that many fossils could be accumulated on its surface (Pether 2007).
5.4.1.8 Section 8: Winelands
The south-eastern part of the study area is all marked as being of low to no palaeontological
significance (Figure 5.29). This is because the geological deposits are either sandstone (generally low
significance) or granite (no significance). It is possible that isolated fossils of relatively recent age
might be found in river valleys where they have become trapped in alluvial deposits. Within the towns
pipes would likely be laid along roads where the substrate is largely already disturbed.

Final Report, August 2014 113
Figure 5.29: Extract from the SAHRIS palaeomap showing the area containing Sections 5 to 8.
5.4.2 Terrestrial pre-colonial archaeological resources
Archaeological resources are widespread throughout southern Africa but have strongly varying
frequencies from place to place. Along the coast archaeological resources are generally denser and of
higher significance, while in open, unsheltered landscapes away from the coast artefacts ascribable to
“background scatter” are more frequently encountered. This section deals with pre-colonial resources,
while historical archaeology will be discussed under Section 5.4.4 below.
5.4.2.1 Section 1: St Helena Bay
The northernmost part of this section of the study area carries very high archaeological significance.
To this effect, Baboon Point has been declared a Provincial Heritage Site for the wealth of
archaeological resources present there. Most famous is Elands Bay Cave initially excavated in the late
1970s by John Parkington and colleagues, with recent excavations and research having been
conducted by Guillaume Porraz (pers. comm. 2013). Parkington (1977, 1986, 1990, 1992) and Orton
(2006) have described the site and its stone artefact sequence, while numerous other publications
Section 5
Section 6
Section 7
Section 8

Final Report, August 2014 114
have been produced documenting the extensive research that has been carried out on other sites at
Baboon Point, along the southern shore of Verlorenvlei and in the dunes to its north.
The rocky headland is unlikely to be suitable for the proposed development and of more relevance is
the sandy stretch of coastline extending to the south. Also a Provincial Heritage Site, Mike Taylor’s
Midden lies behind the small, low-lying rocky outcrop some 2.5 km south of Cape Deseada. It is an
example of what has become known as a ‘megamidden’ and preserves vast quantities of shellfish
collected by people as food between about 3000 and 1000 years ago (Jerardino & Yates 1997).
Further south, a number of smaller shell scatters and middens have been documented along the
dunes within a few hundred meters of the coast (Jerardino 2003; Kaplan 2006; Orton 2009a). Some of
these were deeply buried with intact shell middens being found up to 1 m below the modern sand
surface. These sites dated to between 3500 and 2500 years ago and may have related to a time when
the sea level was slightly different such that patches of rock were exposed along the coastline (Orton
2009a). Alternatively, people may have been collecting black mussels dislodged and washed up from
submerged rocky reefs (Stassen 2010). Such sites would be highly unlikely to occur further inland
away from the sensitive coastal dune cordons; only isolated background scatter artefacts are likely to
be found there.
5.4.2.2 Section 2: Vredenburg Peninsula
This section is essentially inland and, as such, is far less likely to contain any highly significant
archaeological sites. A survey just outside the western edge of the proposed corridor found only
occasional isolated artefacts and shell fragments (Orton 2012a), although low-density archaeological
sites have been located in open areas further west on the peninsula (Fauvelle-Aymar et al. 2006;
Webley et al. 2010). One survey lying just east of the R27 and some 12 km from the St Helena Bay
coast revealed the presence of Later Stone Age material on a granite hill. The site was unusual in that
it contained both Stone Age and historical material (Kaplan 2005a). Many significant sites are located
on the Kasteelberg Hill in the central part of the Vredenburg Peninsula (Sadr et al. 2003; Smith 2006a,
2006b; Smith et al. 1991) but these lie west of the proposed corridor.
5.4.2.3 Section 3: Saldanha Bay and Langebaan
A number of surveys have been carried out in close proximity to the iron ore terminal where the land-
based LNG terminal option might be sited. These have all failed to yield archaeological remains of
high sensitivity. A survey of an area just south of the ore terminal (Orton 2012c) revealed a number of
shell scatters dominated by various species of white mussels and the land snail, Trigonephrus
globulus. These are animals not frequently collected by people suggesting that the vast majority
originated through natural means: the snails, which frequently inhabit dune areas, would have died
there, while the mussels were probably collected and dropped by gulls to break them open. These
finds are thus technically palaeontological but are too recent to be of much interest. However, a few
items supporting an anthropogenic component to the assemblages were noted. These include
occasional limpets (C. granatina and S. argenvillei), some Turbo sarmaticus operculae, a fish tooth,
some ostrich eggshell fragments, some animal bones (including small bovid), occasional flaked stone
artefacts and some burnt fragments of calcrete which are highly suggestive of cooking hearths similar
to those found in other localities nearby, such as the Geelbek dunes to the south (Conard & Kandel
2006) and the Holbaai area to the northwest (Hine 2004). Orton’s (2012d) survey also yielded one

Final Report, August 2014 115
small, clearly anthropogenic shell scatter on the crest of a dune some 490 m from the coast. This site
shows that there is potential for archaeological sites in the vicinity of the proposed LNG terminal but
such sites generally carry low significance. Three kilometres to the south, where the rocky shore
occurs, a large number of shell middens have been recorded with several having been excavated (Hart
2001; Hart & Gribble 1998; Hart & Jerardino 1998). As before, similar sites will not be found further
inland where the proposed pipeline is likely to be laid, although ephemeral scatters of marine shell
have been noted in one area some 1.5 km from the coast and very close to the proposed pipeline
route (e.g. Orton 2008).
Moving west onto the Churchhaven Peninsula we also find a large number of Later Stone Age
archaeological sites. Excavations at some were reported by Smith et al. (1991) and Robertshaw (1978).
Robertshaw (1978) also mapped the locations of many other known sites on the peninsula, one of
which falls within the area demarcated for the LNG terminal at the northern tip of the peninsula.
The vast majority of Stone Age archaeological resources described from the area is LSA in age.
However, older artefacts pertaining to the Early (ESA) and Middle (MSA) Stone Ages have been found
at several sites. These include Hoedjiespunt and Sea Harvest already discussed above, as well as
Elandsfontein (Archer & Braun 2010; Singer & Crawford 1958; Singer & Wymer 1968), the Geelbek
Dunes and the Anyskop Blowout (Kandel & Conard 2012). Anyskop lies very close to Langebaanweg,
while the Geelbek Dunes are within 1 to 2 km of the N7 at the south end of the Langebaan Lagoon. At
Elandsfontein, Geelbek and Anyskop the materials recovered are in fact from all three ages with
deflation having left the artefacts on a common surface.
5.4.2.4 Section 4: Western Swartland
The Swartland area is generally poor in archaeological remains, while along the coastal stretch sites
would only likely be found close to the coast itself. In some places in the Swartland a rock type called
silcrete occurs in the overlying sand bodies. This rock is ideal for manufacture of stone artefacts and
where such outcrops occur archaeological sites may be documented. Many silcrete outcrops have
been mapped in the Swartland (Rogers 2003: fig. 4.2a), although a strong relationship between them
and archaeological sites has only been well demonstrated in the far south of the region, southeast of
Atlantis (e.g. Orton 2013a).
North of Darling an inspection of land bordering the R27 did not yield any archaeological heritage
(Hart 2008), while in the vicinity of the Darling Hills few archaeological sites are known, although
isolated artefacts appear to be scattered throughout the area. One contact period site,
Rheboksfontein 1, is known. At this site there are both Stone Age and historical artefacts showing
contact between the Khoekhoe and the European colonists. The site also had an MSA bifacial point on
it which was no doubt collected as a curio from somewhere else (Orton 2010e, 2012d).
Although the coastal stretch in this division is very remote, several surveys have been conducted,
particularly along the coast. This is particularly relevant here as the off-shore terminal option in this
area would require a pipeline making landfall in this vicinity. In the far north, LSA sites have been
located around the Salt Pans and on the adjacent coastline (Avery 1994; Kaplan 1996), while the MSA
site close to the harbour is well known (Avery et al. 2008; Halkett et al. 2003; Klein et al. 2004). The
rocky shore south of Yzerfontein has also yielded significant archaeological resources (Orton 2009).

Final Report, August 2014 116
Avery et al. (1990) and Kaplan (2005b) documented several LSA shell scatters and middens along the
coast at Tygerfontein. The next farm south, Jakkalsfontein, is where the proposed landfall is. This farm
has also been found to contain archaeological traces with two sites revealing ostrich eggshell, pottery,
stone artefacts and shell, of which the latter likely originated through a combination of human and
kelp gull actions (Van Rijssen et al. 1989). Further south, the rocky headlands at Grotto Bay,
Ganzekraal, Bokbaai and Springfontein have been found to house many shell middens that include
stone artefacts, pottery, stone hearths and animal bones (Halkett 2008; Kaplan 1991; Rudner & Rudner
1955; J.O. personal observation 2011).
5.4.2.5 Section 5: Atlantis Dunes
Peringuey’s (1911) finds in the Atlantis area have already been noted. The artefacts reported by him
appear to date to the Holocene and are therefore unrelated to the fossil bones. A few other small LSA
sites have been reported in the area (Hart 2005; Kaplan 2007c, 2008), while the dunefield is also
known to contain archaeological sites (G. Avery pers. comm. 2011) but has never been formally
studied. Extensive sites with high significance are not generally expected far from the coast, but the
presence of a natural water source could certainly have encouraged pre-colonial settlement in the
dunes of Atlantis.
5.4.2.6 Section 6: Southern Swartland and adjacent coastline
From Atlantis the proposed transmission pipeline route runs further inland than was the case to the
north. The nature of the archaeological environment is rather different now as the study area is
underlain by Malmesbury shale. Archaeological remains are nonetheless relatively commonly
encountered in this area with numerous instances of scatters of ESA and MSA artefacts on record
(Halkettt 2006; Orton 2010d; Orton & Hart 2004, 2007, 2011). Two deflation hollows with high
significance have been found along the Sout River between the N7 and R304 within 900 m and 1400
m of the pipeline route respectively (Kaplan, pers. comm. 2012; Orton & Hart 2011). Towards the
south-western part of this sector ephemeral scatters of shell and stone artefacts as well as an artefact-
filled deflation hollow have been recorded on the farm Blaauwberg, 3.5 km west of the pipeline route
(Kaplan 2012; Orton & Hart 2007). These finds, particularly the deflation hollows, suggest that
subsurface archaeological material is likely to be widespread, although patchy, in this area. Significant
archaeological resources are also to be located around silcrete outcrops of which many are known to
occur in the area (Roberts 2003). Several such outcrops have been found to have been used as quarry
sites during the MSA and LSA (Orton 2010d, 2013a; Orton & Hart 2007).
The coastal stretch around Melkbosstrand and Bloubergstrand where distribution pipelines may be
laid is sensitive in that shell middens and associated human remains are frequently encountered
during building operations in this area (Gray 2000; Kaplan 2000, 2002, 2003, 2012; Orton 2010a, 2010c,
2013b; Orton & Hart 2007; Sealy et al. 2004; Yates 2001). In recent years several mitigation projects
have had to be carried out in this area in order to rescue archaeological material and burials
accidentally exposed during construction work.
Given its position on Malmesbury shales rather than on white aeolian sands, the Durbanville area is
perhaps best considered as part of the Swartland division. Several surveys in this region have yielded
few to no archaeological remains, but one survey did record several scatters of LSA stone artefacts

Final Report, August 2014 117
along a river on the northern outskirts of the built-up area (Orton 2009d). LSA artefacts were also
noted in a dune environment in Kuils River (JO, personal observation 2008). However, such sites are
highly unlikely to be encountered in the built-up areas that will be the focus of the proposed pipeline
development.
5.4.2.7 Section 7: Cape Flats
Despite many surveys on the Cape Flats, particularly in the Philippi area, archaeological remains have
yet to be found. This is probably because the area was a wasteland of drifting sand before alien
vegetation was introduced to stabilise it. In all likelihood, people crossing the Flats would have moved
as quickly as possible from one side to the other, perhaps stopping only at water sources. The
extensive disturbance to virtually the entire Cape Flats area means that archaeological traces are
highly unlikely to be found.
5.4.2.8 Section 8: Winelands
The majority of archaeological occurrences to have been recorded in this area are ESA artefact
scatters. Such artefacts are well known to occur in a belt along the foot of the Cape Fold Mountains
stretching from Gordons Bay in the south all the way to Porterville in the north. Numerous commercial
surveys have documented such artefacts including surveys in all the areas included within this division
(Deacon 2005; Kaplan 1998; Orton 2004, 2009b, 2010b; Orton & Hart 2008). Early on, such artefacts
found in Stellenbosch were used to describe what was then known as the “Stellenbosch Industry” of
the ESA (Goodwin & Van Riet Lowe 1929). These artefacts are accommodated within the period now
known as the Acheulean. The site at Bosman’s Crossing (Seddon 1966) is an archaeological reserve
(and possibly a Provincial Heritage Site but no trace of this could be found in the online records).
Although the pipes would be laid alongside roads where disturbance has already taken place, it is still
highly likely that ESA artefacts will be revealed in any excavations in these areas.
5.4.3 Maritime archaeological resources
Although a large number of vessels is recorded as having sunk off the Cape coast, very few specific
locational data are given. This is because no comprehensive surveys have been undertaken and the
listing is based primarily on historical documentation (J. Boschoff, pers. comm. 2014) and known
wrecks. Some locations that are supplied are inaccurate, while others may have been assigned a
location that is not logical to search for on the database. Nevertheless, the discussion below will give a
good indication of the extent of maritime heritage likely to be of concern.
A number of ships have been lost in St Helena Bay with most being during the 19th and 20th
centuries. Table 5.15 lists those predating 1850. The Gouden Buys is notable for the quantity of gold it
was carrying, approximately 2 tons. It had a difficult journey from Holland with many of the crew
being lost to scurvy. It eventually limped into St Helena Bay where most of the remaining crew
perished (Gribble 2009a). Ultimately, just two men survived. The cargo was rescued by two other
vessels but one, the Dageraad, ran aground and sank off Robben Island on its return to Table Bay.
Although all the gold was recovered in St Helena Bay, only nine of seventeen chests were recovered
from the wreck of the Dageraad. Another ship, the Britannia (Figure 5.30) struck a reef that has since
been known as Britannia Blinder.

Final Report, August 2014 118
Table 5.15: List of vessels lost before 1850 in St Helena Bay
(Source: Marine Casualty Database Southern African Coast n.d.).
Date Vessel Type Location Manner lost
October 1683 Goude Bay* St Helena Bay Vessel abandoned, crew down with
Scurvey
February 1731 Huis te Vlotter St Helena Bay Grounded
October 1826 Britania* Barque St Helena Bay Grounded
February 1840 Friends Goodwill Cutter St Helena Bay Grounded
Note: *Gribble (2009a) uses the correct spellings of ‘Gouden Buys’ and ‘Britannia’.
Figure 5.30: The Britannia (Source: Anonymous 2009:88).
Many ships have been lost in Saldanha Bay over the years. Three well-known and older examples
include the grounding and sinking of the treasure-laden Merestein in 1702 at Jutten Island (Turner
2009), the accidental burning of the Nagel in 1709 (Gribble 2009b) and the loss of the Middelburg
during the 1781 battle of Saldanha (Figure 5.31; Aldridge 1974; Burman & Levin 1974; Gribble 2009a).
Although the Marine Casualty Database Southern African Coast (n.d.) lists numerous vessels as having
foundered in Saldanha Bay, very few specific locational data are given (Table 5.16). This is because no
comprehensive survey of the bay has ever been undertaken and the listing is based primarily on
historical documentation (J. Boschoff, pers. comm. 2014). Burman and Levin (1974) note, however, that
the vast majority of vessels were lost outside of the bay itself.
Much of the northern part of the bay, around and north of the iron ore jetty (Small Bay) located just to
the north of the presently proposed jetty site, has been dredged on several occasions since the mid-
1970s (Clark et al. 2009) so shipwrecks will not be preserved in that area. Hart (2007) noted that no

Final Report, August 2014 119
maritime heritage was located during studies for the iron ore terminal. Further south, in the area of
concern to the present study, the presence of shipwrecks remains unknown but possible.
Figure 5.31: Painting of a battle between the Dutch and English in 1781. Four Dutch ships were captured by
the British while one, the Middelburg, was destroyed by the Dutch to prevent its capture. It is seen burning
here before it sank near Hoedjiespunt (source: Aldridge 1973: fig. 45).
Table 5.16: List of vessels lost before 1850 in Saldanha Bay
(Source: Marine Casualty Database Southern African Coast n.d.).
Date Vessel Type Location Manner lost
April 1702 Merestijn Jutten Island Grounded
May 1709 Nagel** Saldanha Bay Fire
July 1781 Middelburg Saldanha Bay Grounded
March 1830 Dauphin Whaler Saldanha Bay Grounded
March 1838 St Clair Saldanha Bay Grounded
January 1839 Pescadora Schooner Saldanha Bay Grounded
May 1843 Adventurer West of Saldanha Bay Sank
April 1845 Cottager Brig Saldanha Bay* Grounded
Note: *This entry was sourced from The Wrecksite (2014). **Gribble (2009d) notes this wreck’s
location to have been near Ganze Kraal.

Final Report, August 2014 120
The Spreeuwal fossil site already mentioned needs to also be borne in mind at this point, since fossil
material may well be unearthed from the sea bed during any work that may occur in that area.
Further south, along the open coast between Yzerfontein and Duinefontein, ships have also been lost.
The Marine Casualty Database (n.d.) indicates a large number of vessels having foundered in this
region. Many date to the 19th and 20th centuries but notable older ones are listed in Table 5.17. Of
these, the Haarlem is famous as its crew were marooned at the Cape for a time before being rescued.
They were the first Europeans to spend some time there and were able to recommend the area as
suitable for the establishment of a permanent station at Table Bay (Noble 1893).
Table 5.17: List of vessels lost before 1850 in the Dassen Island to Robben Island area
(Source: Marine Casualty Database Southern African Coast n.d.).
Date Vessel Type Location Manner lost
March 1647 Haarlem Blaauwberg Grounded
August 1660 Schapenjacht Robben Island Grounded
May 1668 Scholvert Between Robben and Dassen Islands Sank
December 1683 Haagman Whaler Dassen Island Grounded
January 1694 Dageraad Table Bay* Grounded
March 1756 Cybella Slaver Blaauwberg Grounded
March 1821 Cerberus Blaauwberg Grounded
September 1821 Flora Robben Island Grounded
May 1826 Perseverance Robben Island Grounded
February 1830 Lady Holland Dassen Island Grounded
February 1836 Gondolier Robben Island Grounded
March 1839 Shylock Cutter Dassen Island Grounded
January 1848 Bittern Robben Island Grounded
Note: *Gribble (2009a) notes this as being on Robben Island. Note also the Cottager (1845) listed in Table 5.15.

Final Report, August 2014 121
5.4.4 Historical resources, the built environment and graves
Significant built environment resources do occur throughout the study area in varying densities,
particularly in central Cape Town and the Stellenbosch and Paarl/Wellington areas. Fransen (2004) has
mapped significant built structures in the region and excerpts of his maps are shown in Figures 5.32 to
40 below. It should be remembered that his book lists many more than are shown on the maps,
particularly in the older built-up areas (like central Cape Town or Stellenbosch). However, the maps do
give an idea of which areas are more sensitive from a built environment perspective.
In addition, areas with higher densities of historical structures will have proportionally higher densities
of historical archaeological remains. These remains are generally kitchen dumps where food refuse
and broken glass and crockery were dumped, but could also include the foundations of historical
buildings and boundary walls. The District Six area is notable in this regard, since many old
foundations and historical features are known to have existed and have indeed been uncovered there
(Clift 2003; Halkett 1996; Le Grange 2003; Patrick and Poggenpoel 2008). Since the gas pipelines
would mostly follow roads where the substrate would have already been disturbed to some degree, it
is unlikely that historical material of high significance would be intersected during trenching.
5.4.5 Graves and graveyards
It is assumed that demarcated graveyards would be avoided during construction, although these are
not always known about or marked on maps to allow for easy identification during the planning stage.
This should be borne in mind during planning as farm and family graveyards could be present in
places along the routes. In general, they are less likely to occur close to roads, although in some cases
road alignments may have been shifted or expanded such that graveyards are now in proximity.
Unmarked, generally pre-colonial graves can be found almost anywhere where the substrate is
suitable for hand excavation. The locations of such graves cannot be predicted, although it is true that
many more are encountered in coastal environments than inland ones. Melkbosstrand and
Bloubergstrand are particularly significant in this regard with large numbers of pre-colonial burials
having been rescued from this area over the years (Morris 1992; Orton 2010a; Yates 2001). On
occasion historical human remains may also be intersected in built-up areas as has frequently
occurred in Cape Town which is undoubtedly the most sensitive in this regard. The vicinity of the well-
known 18th and 19th century Greenpoint graveyards (Cox 1999; Finnegan et al. 2012; Halkett 2000; Hart
2003b, 2014) is highly sensitive. Elsewhere in the city, many isolated burials have been found along
Strand Street (Morris 1992) in particular, probably because of the sand dunes once present there.
These appear to be a mixture of historical and pre-colonial burials (A. Morris, pers. comm. 2013).
5.4.6 Scenic routes and the cultural landscape
Because of the subsurface nature of the proposed pipeline development, these aspects of heritage will
not be of concern. Any visual impacts to these resources would be temporary and of little or no
significance. However, the LNG plant, whether out at sea or above ground on land, would cause visual
impacts. This would be particularly the case for the site on the northern tip of the Churchhaven
Peninsula, while the sites within the Port of Saldanha Bay are of very low sensitivity because of the
established heavy industrial presence in that area. It is noted that a similar facility for the importation
and storage of liquid petroleum gas is currently under construction in the vicinity of the iron ore

Final Report, August 2014 122
terminal to the north of the present site (De Bruyn 2013). Offshore locations for the LNG terminal are
not likely to be highly sensitive since the form of the terminal (essentially a ship) is one that would be
expected in that context and is thus not out of place.
Figure 5.32: Map showing significant built environment resources (labelled red circles) in the Swartland and
Atlantis areas. Three more occur just north of this map (source: Fransen 2004: 329).

Final Report, August 2014 123
Figure 5.33: Map showing significant built environment resources (labelled red circles) in the Cape Peninsula
and Cape Flats areas (source: Fransen 2004: 62)

Final Report, August 2014 124
Figure 5.34: Map showing significant built environment resources (labelled red circles) in the Cape Town city
bowl and surrounds (source: Fransen 2004: 28).

Final Report, August 2014 125
Figure 5.35: Map showing significant built environment resources (labelled red circles) in the
Wellington/Paarl and Stellenbosch areas (source: Fransen 2004: 272).
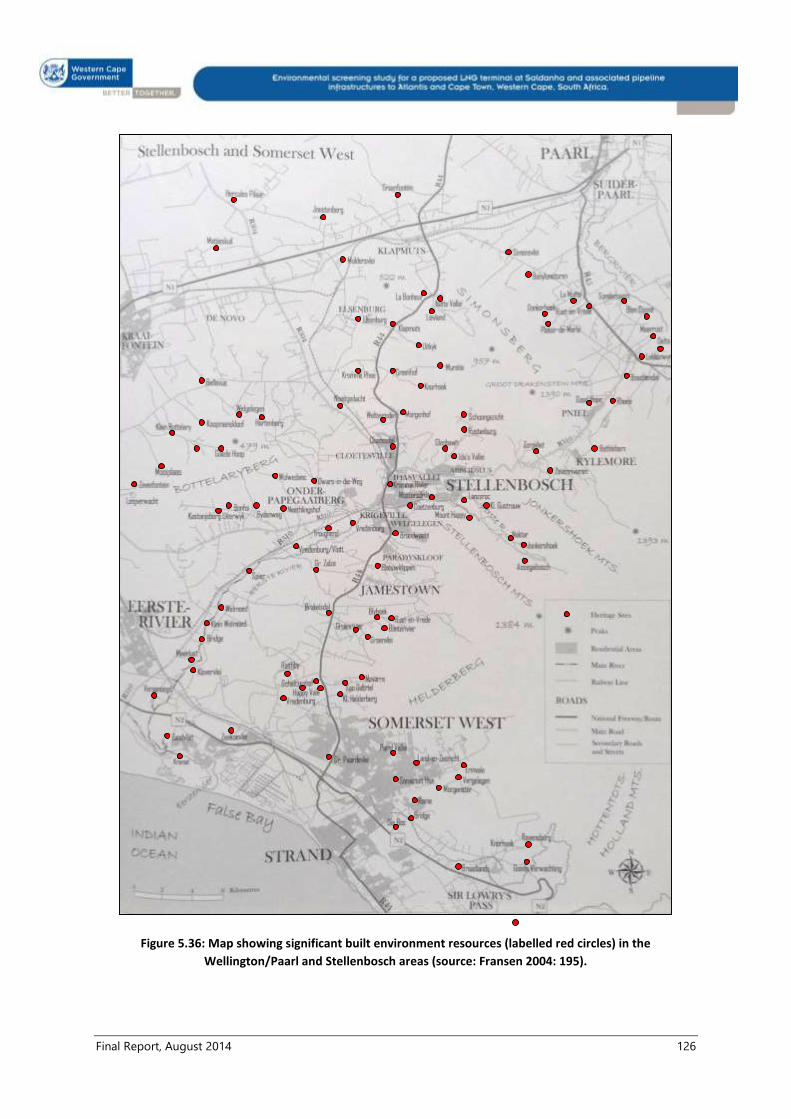
Final Report, August 2014 126
Figure 5.36: Map showing significant built environment resources (labelled red circles) in the
Wellington/Paarl and Stellenbosch areas (source: Fransen 2004: 195).

Final Report, August 2014 127
Figure 5.37: Map showing significant built environment resources (labelled red circles) in Wellington
(source: Fransen 2004: 304).
Figure 5.38: Map showing significant built environment resources (labelled red circles) in northern Paarl
(source: Fransen 2004: 257).

Final Report, August 2014 128
Figure 5.39: Map showing significant built environment resources (labelled red circles) in northern Paarl
(source: Fransen 2004: 257).
Figure 5.40: Map showing significant built environment resources (labelled red circles) in Stellenbosch
(source: Fransen 2004: 172).

Final Report, August 2014 129
5.5. PLANNING CONTEXT
The term “planning” is used in this section to denote that disciplines of land-use planning,
development planning and spatial planning; traditionally located within relevant municipal authorities.
Planning, as with all forms of intelligent behaviour, requires an understanding of (i) what has been, (ii)
what is, and (iii) what is likely to happen in the future. Put differently, an integration of relevant history,
the present and the probable future is required in order to execute any planning activity. As a result,
planning consists of a concrete, present component which is informed and directed by abstract past
and future conditions. The abstract component of planning allows the discipline to remain flexible to
emerging issues which might be radically different from past and existing realities. Subsequently, fatal
flaws related to planning are rare and difficult to accurately assess within a screening study as current
planning realities are prone to change over time.
This section will discuss the planning baseline according to the relevant municipal areas present in the
study area and will conclude with the identification and assessment of possible planning constraints
pertinent to the project. The planning baseline is primarily informed by the various Integrated
Development Plans (IDP), Spatial Development Plans (SDF) and, where applicable, Environmental
Management Frameworks (EMF) of each municipality.
5.5.1. National planning context
The National Government of South Africa recently adopted an Infrastructure Plan that is intended to
transform the economic landscape of South Africa, create a significant number of new jobs,
strengthen the delivery of basic services and support the integration of African communities. For this
purpose the Cabinet took a decision to establish a body to integrate and coordinate the plan, namely
the Presidential Infrastructure Coordinating Commission (PICC) with its supporting management
structures (CSIR, 2012).
The PICC reports back on work to assess the infrastructure gaps through spatial mapping which
analyses future population growth, projected economic growth and areas of South Africa not served
with sufficient water, electricity, roads, sanitation and communication. Based on this work, seventeen
(17) Strategic Integrated Projects (SIPs) have been developed and approved to support economic
development and address service delivery in the poorest of the nine provinces in South Africa. Each
SIP comprise of a large number of specific infrastructure components and programs. The work will be
aligned with human settlement planning and with skills development as key cross-cutting areas (CSIR,
2012).
SIP 5 relates to the integrated development of the Saldanha-Northern Cape Province to ensure that
the linked regions become an integrated value-adding entity, rather than simply a transit corridor for
iron-ore export from the Sishen iron-ore mines in the Northern Cape. For the Port of Saldanha Bay,
which is the only natural deep sea port in South Africa, this entails developing back of port industrial
capacity (including an Industrial Development Zone – IDZ, refer to Figure 5.42) and strengthening
maritime support capacity to create economic opportunities from the gas and oil activities along the
African West Coast (CSIR, 2012).

Final Report, August 2014 130
The expansion of the Sishen-Saldanha iron-ore export rail line capacity to beyond 60 million tonnes
per year is being investigated by Transnet and will have a significant impact on the port facilities at
Saldanha Bay.
Other key planning elements at Saldanha Bay include:
Infrastructure development to serve the Offshore Oil & Gas Industry;
The back of port industrial projects aligned with ‘green energy’ and minerals beneficiation
(including rare minerals processing); and
The construction of liquid fuels loading facilities (CSIR, 2012).
5.5.1.1 Transnet National Ports Authority
Transnet Limited is responsible for ensuring that the country’s port, rail and pipeline assets operate
according to world class standards and form an integral part of the national economy. In this regard
port planning and management falls under the custodianship of Transnet National Ports Authority
(TNPA).
TNPAs management responsibilities are defined by the National Port’s Act (2003) and includes:
Planning, providing, maintaining and improving port infrastructure.
Preparing and updating PDF plans for each port.
Ensuring that adequate, affordable and efficient port services are provided.
Providing road and rail access within the ports.
In pursuant the requirements of the National Ports Act (2003), TNPA defined the following planning
objectives related to the Port of Saldanha Master Plan:
Optimize capital investment across all ports in order to meet the long term national demand
for cargo throughput.
Reduce the operational costs of transferring freight through the port system by targeted
capital investments.
Provide for reliable, safe and cost effective freight handling services that meet world-class
standards at all ports.
Maintain flexibility in order to respond to changing technological and economic conditions.
Respond to prevailing environmental constraints.
Minimize the disruption of existing port activities during implementation.
Ensure adequate provision for all non-freight port services and facilities.
Figures 5.41a and b reflect the short term development plan for the Port of Saldanha.

Final Report, August 2014 131
Figure 5.41a Short Term Development plan (CSIR, 2013)

Final Report, August 2014 132
Figure 5.41b Short Term Layout (Source: TNPA)
5.5.1.2 Saldanha Bay IDZ
The Saldanha Bay Industrial Development Zone (IDZ) was officially launched in late 2013 (Figure 5.42).
It utilises IDZ-enabling legislation to act as a catalyst to create and sustain economic development
trough industrial investment and effective planning in the Saldanha Bay region.
The IDZ sets itself the goal of creating a highly functional and self-sustaining industry, which consist of
several international and domestic investors contributing to economic development and sustainable
employment in the area. This goal will be achieved through:
Consolidation and/or elimination of inefficient and bureaucratic administration processes.
Focus initially on the establishment of a single cluster i.e. the Oil & Gas and Marine Repair
Cluster within the Saldanha Bay port precinct and surrounding area.
Provide supporting infrastructure that differentiates the Cluster in Saldanha Bay from
competitors e.g. logistics, land availability, utilities etc.
Provide efficient free zone operations and customs processes that facilitate timeous and cost
effective operations for both international and domestic investors.
Provide a single point-of-contact for investors to address their concerns and queries.
The TNPA Master Plan and the Saldanha Bay IDZ project overlap on various levels. The following
objectives are shared by both parties:

Final Report, August 2014 133
Optimise the strategic importance of Saldanha Bay as a deep sea harbour exposed to large
tracks of undeveloped land “back of port”;
Create a Master Plan consisting of a concept, design principles and development guidelines
that will inform future development and infrastructure investment decisions;
Optimise accessibility to the quay and harbour;
Optimising development potential through assessment of spatial policy directives, transport
services and infrastructure capacity assessment, development of options, etc.;
Creating economic development and jobs through industrial development in the Saldanha
Bay region.
Figure 5.42: Location of the Saldanha Bay Industrial Development zone (Source: Government Gazette, Notice
1081 of 2013)

Final Report, August 2014 134
5.5.2. Regional planning context
Environmental Management Frameworks (EMFs) are decision support tools designed in terms of
Section 24 (3) of the National Environmental Management Act (Act 107 of 1998). The primary purpose
of the EMF is to support the competent authority in the Western Cape, which is the Department of
Environmental Affairs and Development Planning (DEA&DP), in making decisions regarding
environmental management. The EMF achieves this purpose through a range of information maps
indicating environmental attributes and characteristics of the study area which must be considered
during development planning and environmental decision-making.
The EMF uses spatial data to divide the relevant municipal area in to Environmental Management
Zones (EMZs). Three zones are identified with increasingly strict conservation requirements; namely:
Zone 1 - Keep assets intact: Environmental resources deemed to be of critical and/or
irreplaceable value to the area’s sustainability falls within this zone. No negative change to
these resources is allowed and development in this zone is heavily constrained.
Zone 2 - Be careful zone: This zones is comprised of environmental resources fulfilling a
support function. The strategic development objective of these areas is to maintain the quality
of environmental resources. Limited development will be allowed in this zone.
Zone 3 - Limited constraints: This zone comprises areas which do not contain significant
environmental and cultural attributes. Development in this zone should be undertaken in a
way that avoids any threats to valued environmental resources.
5.5.3. Local planning context
5.5.3.1 Integrated Development Plans (IDP)
Though not an Act, the Integrated Development Plan (IDP) represents the primary local-level strategic
planning tool with which the proposed project will need to conform. Integrated development
planning is a process by which a municipality prepares its strategic development plan for a 5 year
financial planning period. Integrated development planning as an instrument lies at the centre of
developmental local government in South Africa and represents the driving force for making
municipalities more strategic, inclusive, responsive and performance-driven in character. As such, the
IDP is the strategic planning instrument which guides and informs all planning, budgeting and
development in the various municipal areas. Importantly, the IDP document lists the goals and
strategic objectives relevant to the specific municipal area; thereby providing an indication of the
planning context of the municipality in question.
5.5.3.2 Spatial Development Frameworks (SDF)
The Spatial Development Framework (SDF) is one of the Sectoral Plans contained in the various
municipal IDPs. The Municipal Systems Act 2000 (Act 32 of 2000), explains the purpose of an SDF as
the provision of general direction to inform decision-making on an on-going basis, with the aim of
creating integrated, sustainable and habitable regions, cities, towns and residential areas (WSP, 2013).
As with the IDP, the SDF contains spatial and management objectives which highlights the spatial
planning context of the relevant municipal area. The following areas are designated by an SDF:

Final Report, August 2014 135
Core 11: Formally protected areas.
Core 1 areas enjoy formal protection and largely consist of extensive sections of Critical
Biodiversity area’s (CBAs). No development (construction) except for scientific research is
allowed in this area;
Core 1: River and wetland corridors
This area aims to protect critical Aquatic Biodiversity and Support area’s by restricting
development in riparian zones and high altitude catchment areas. No development is allowed
within 30m of a river bank or wetland;
Core 21: Critical Biodiversity Areas outside Core 1 areas
Core 2 areas contain fragmented CBAs which are not formally protected. However,
development in these areas is limited to ecotourism only;
Buffer areas: These areas fall outside formal conservation areas and are not designated as
CBAs but they are considered as conservation worthy and require responsible management.
Development in these areas is allowed but must be in accordance with provincial guidelines;
and
Intensive agriculture: Intensively farmed areas form the economic back-bone of the municipal
area and should be protected to the greatest extent possible to ensure continued
productivity.
5.5.4. Saldanha Bay area
The Saldanha Bay Local municipality is located within the West Coast District Municipality and extends
over an area of 2 015km2, including 238 km of coastline. The municipality contains 7 urban nodes as
well as the West Coast National Park, and forms part of the West Coast Biosphere Reserve. The
Saldanha Bay - Langebaan Lagoon system provides a range of beneficial uses including: (i) a sheltered
port used for industrial shipping and fishing craft; (ii) suitable conditions for seaweed harvesting
and mariculture, primarily oyster and mussel farming; (iii) industrial processes such as water
extraction for fish processing; (iv) recreation, tourism and conservation.
5.5.4.1 Beneficial uses
Shipping
The Port of Saldanha was established for the export of iron ore mined at Sishen some 600 km inland
in the Northern Cape Province. Subsequently it has been expanded to serve as the crude oil import
terminal for western South Africa and for the export of high-value minerals. A general cargo quay was
built especially for this purpose. Most recently construction has commenced on a terminal for the
importation of liquid petroleum gas (LPG). Traffic in and out of Saldanha is strictly controlled with only
one large vessel being permitted in the entrance channel at a time.
Inshore and offshore fishing vessels operate from Saldanha where their catches are processed for the
local market and for export. The South African Navy also operates out of Saldanha and also maintains
a small facility at Langebaan.
1 Core Areas have statutory conservation status

Final Report, August 2014 136
Industrial water use
The four seafood processing companies in Saldanha Bay draw process water from the bay and
discharge their effluent into it. The effluent contains: inorganic nitrogen; organic carbon and nitrogen;
suspended solids; and micro-organisms. Water quality in the bay is monitored by the Saldanha Bay
Water Quality Forum which was fully endorsed by the Department of Water Affairs at the time of its
inception. Subsequently responsibility for the management of marine discharges has been transferred
to the Department of Environment Affairs which has continued the arrangement with the Water
Quality Forum.
Marine aquaculture, seaweed harvesting and important fisheries
The Saldanha Bay area, the only natural sheltered embayment in South Africa, is regarded as a major
area for marine aquaculture, or mariculture. In 1997 approximately 1 000 ha were demarcated for
mariculture (Figure 5.43) and to date approximately 221.50 ha have been allocated to twelve
mariculture operators (Figure 5.44). All the operators farm mussels and six of the operators also farm
oysters (Anchor Environmental, 2011).
Farming of oysters and mussels takes place in the northern half of Small Bay (130 ha) and in the lee of
the Marcus Island breakwater (65 ha). Both the indigenous black mussel Choromytlius meridionalis and
the alien Mediterranean mussel Mytilus galloprovincialis are cultivated and rely on natural settlement
of spat (larvae) except in poor recruitment years when spat may be scraped from the caissons at the
iron-ore jetty. Oyster farming is based on the Pacific oyster Crassostrea gigas.
The seaweed Gracilaria gracilis is collected from the beaches in Small Bay and dried before being sold
for use primarily in the pharmaceutical and confectionary industries. The construction of the Marcus
Island breakwater and the iron-ore terminal had a major impact on the Gracilaria beds reducing the
harvest from over 1 000 tonnes per annum to the present ca. 300 tonnes (Rothman et al. 2009).
Commercial exploitation of fish within the Saldanha Bay area dates back to the 1600’s by which time
the Dutch colonists had established beach-seine fishing operations in the region. Today commercial
net fishing comprises mainly gillnetting (Hutchings and Lamberth, 2002) within specific areas of the
bay (Figure 5.43). Numerous species also support large shore angling, recreational and commercial
boat line-fisheries which contribute significantly to the tourism appeal and regional economy of the
area (Anchor Environmental, 2011)

Final Report, August 2014 137
Figure 5.43 Proposed mariculture areas, removal of mussels for human consumption and commercial
fisheries in Saldanha Bay and Langebaan Lagoon (adapted from CSIR, 2002)
R27
Langebaan
DufercoSaldanha Steel
Saldanha Bay
SFF
Club Mykonos
R45
Commercial and Recreational line fishing = throughout the Bay
Location of Gracilaria beds
Commercial fishery: Gill netting
Proposed mariculture areas
R27
0 2 4 6 km
N
S
W E Removal of alien mussel species for human consumption

Final Report, August 2014 138
Figure 5.44 Allocated mariculture concession areas in Saldanha Bay in 2012 (Source: Pisces, 2012)
Tourism, recreation & Conservation
The 2011 SDF for the Saldanha Bay Municipality (SBM, 2011) provides extensive information regarding
the nature and importance of tourism in the area. With regard to tourist attractions, the SDF notes
that these are all primarily orientated towards the environmental assets in the municipal area: seasonal
wild flowers, the Berg River, sea, whales, mountains, protected fauna and flora species, proximity to
the West Coast Nature Reserve, fossil sites and fossil museum. Marine assets are particularly important
and support aesthetic quality along with a number of activities including swimming, fishing, boating,
wind surfing, kite boarding, kayaking and birding.
The Saldanha Bay - Langebaan Lagoon system is an important area for water-based recreation from
deep sea yachting, mainly based at Club Mykonos, to dinghy sailing, kite-surfing and canoeing. The
sheltered beaches at Langebaan and the Lagoon are popular family recreation areas. For all these
contact water sport and recreation activities high water quality standards are critical.

Final Report, August 2014 139
The Saldanha Bay - Langebaan Lagoon system is an important conservation area. The Lagoon and the
islands of Saldanha Bay and a considerable area of land in its environs constitute the West Coast
National Park. The Park is famous for its shows of spring flowers and the Lagoon was designated in
1988 a Wetland of International Importance in terms of the Ramsar Convention in recognition of its
importance for both migrant and resident shore and water birds. The Ramsar site comprises the
Lagoon, Schaapen, Marcus, Malgas, and Jutten islands plus an extensive part of the Atlantic shoreline
abutting the Langebaan Peninsula.
5.5.4.2 Planning priorities and spatial objectives
The Saldanha Bay IDP (2012-2017) identifies the following development planning priorities for the
municipal area:
Strategic Focus Area Strategic Objective
Local Economic Development
To diversify the economic base of the municipality
through industrialisation, whilst at the same time
nurturing traditional economic sectors.
Basic Service Delivery
To develop an integrated transport system to facilitate
the seamless movement of goods and people within
the municipal area and linkages with the rest of the
district and the City of Cape Town.
To develop safe, integrated and sustainable
neighbourhoods
To maintain and expand basic infrastructure as a
catalyst for economic development.
Municipal Transformation & Organisational
Development
To be an innovative municipality on the cutting edge in
respect of the use of technology and best practice
Municipal Financial Viability & Transformation An effective, efficient and sustainable developmental
oriented municipal administration
Good Governance & Public Participation
To develop and use a multi-platform communication
system to ensure swift and accurate dissemination of
information
To provide ethical and effective leadership that
engenders trust in the municipality amongst its
stakeholders
To ensure compliance with the tenets of good
governance as prescribed by legislation and best
practice
The current spatial development pattern of the Saldanha Bay Municipality is depicted on Figure 5.45.
The Spatial Objectives of the Saldanha Bay SDF 2011 (Section 12.2.3 of the SDF) are: (i) urban
containment (containing outward sprawl into sensitive natural and agricultural areas); and (ii)
intensification and compacting of urban development patterns within existing urban boundaries. The
following management objectives are identified to give effect to these spatial objectives:

Final Report, August 2014 140
1. Protect indigenous biodiversity and sensitive ecosystems;
2. Protect high potential agricultural land;
3. Promote local economic development, tourism and industrial development opportunities;
4. Promote the growth of the Saldanha port facility and related industrial development;
5. Ensure the efficient and feasible provision and maintenance of infrastructure, without placing
an inordinate consumptive pressure on natural resources, e.g. groundwater; and
6. Utilise existing designated urban land in an efficient and appropriate manner, ensuring
integration and equitable access to community facilities.
Figure 5.45 Spatial development pattern for Saldanha Bay Municipality (Source: Saldanha Bay SDF, 2011)
Industrial Policy Objectives
The Saldanha Bay Municipality recognises the importance of industrial development, especially
development related to the expansion of the Port of Saldanha; identifying it as the most important
asset in the municipal area. As a result, the SDF is lenient in terms of industrial expansion within the
municipal boundaries. However, a major conflict exists between the natural environment and industrial
development. Such conflict is of particular concern in areas containing pristine natural vegetation;
especially along the coastal zone of the municipality, e.g. the coast between the ore-berth and Lynch
Point (Saldanha Bay SDF, 2011). This conflict was recognized as far back as 1994 when the EIA for the
Saldanha Steel project was being undertaken. The steel plant was moved inland to its present location

Final Report, August 2014 141
in order to protect the sensitive coastal vegetation and environment south of the shoreward end of
the ore-berth (K Wiseman, CSIR Project Manager, Saldanha Steel EIA, personal comment).
Conservation Policy Objectives
The key conservation issues which the Saldanha Bay SDF (2011) seeks to redress are:
Several untransformed conservation worthy natural areas within the municipal area that are
threatened by future agricultural or urban related development; and
The potential contribution of the area’s natural resources towards eco-tourism and economic
development within the municipal area is underestimated.
The vast majority of the Greater Saldanha Bay Area’s coastal belt also falls within Zone 1 – Keep assets
intact (Saldanha EMF, 2011) (Figures 46a&b). Other significant land portions falling in this zone
includes the Berg River valley and the land immediately north-east of the West Coast National Park.
Activities that are to be avoided (i.e. that should not be considered) in Zone 1 include the Storage,
treatment or handling of any dangerous or hazardous substance. Linear infrastructure that would be
located underground (by virtue of the fact that the disturbance would be short-term and the
disturbance footprint would be limited) may be considered, where there is certainty that search and
rescue and rehabilitation the disturbed area would be successful (Saldanha EMF, 2011).

Final Report, August 2014 142
Figure 5.46a Environmental attributes that make up the Zone 1 – Keep Assets Intact
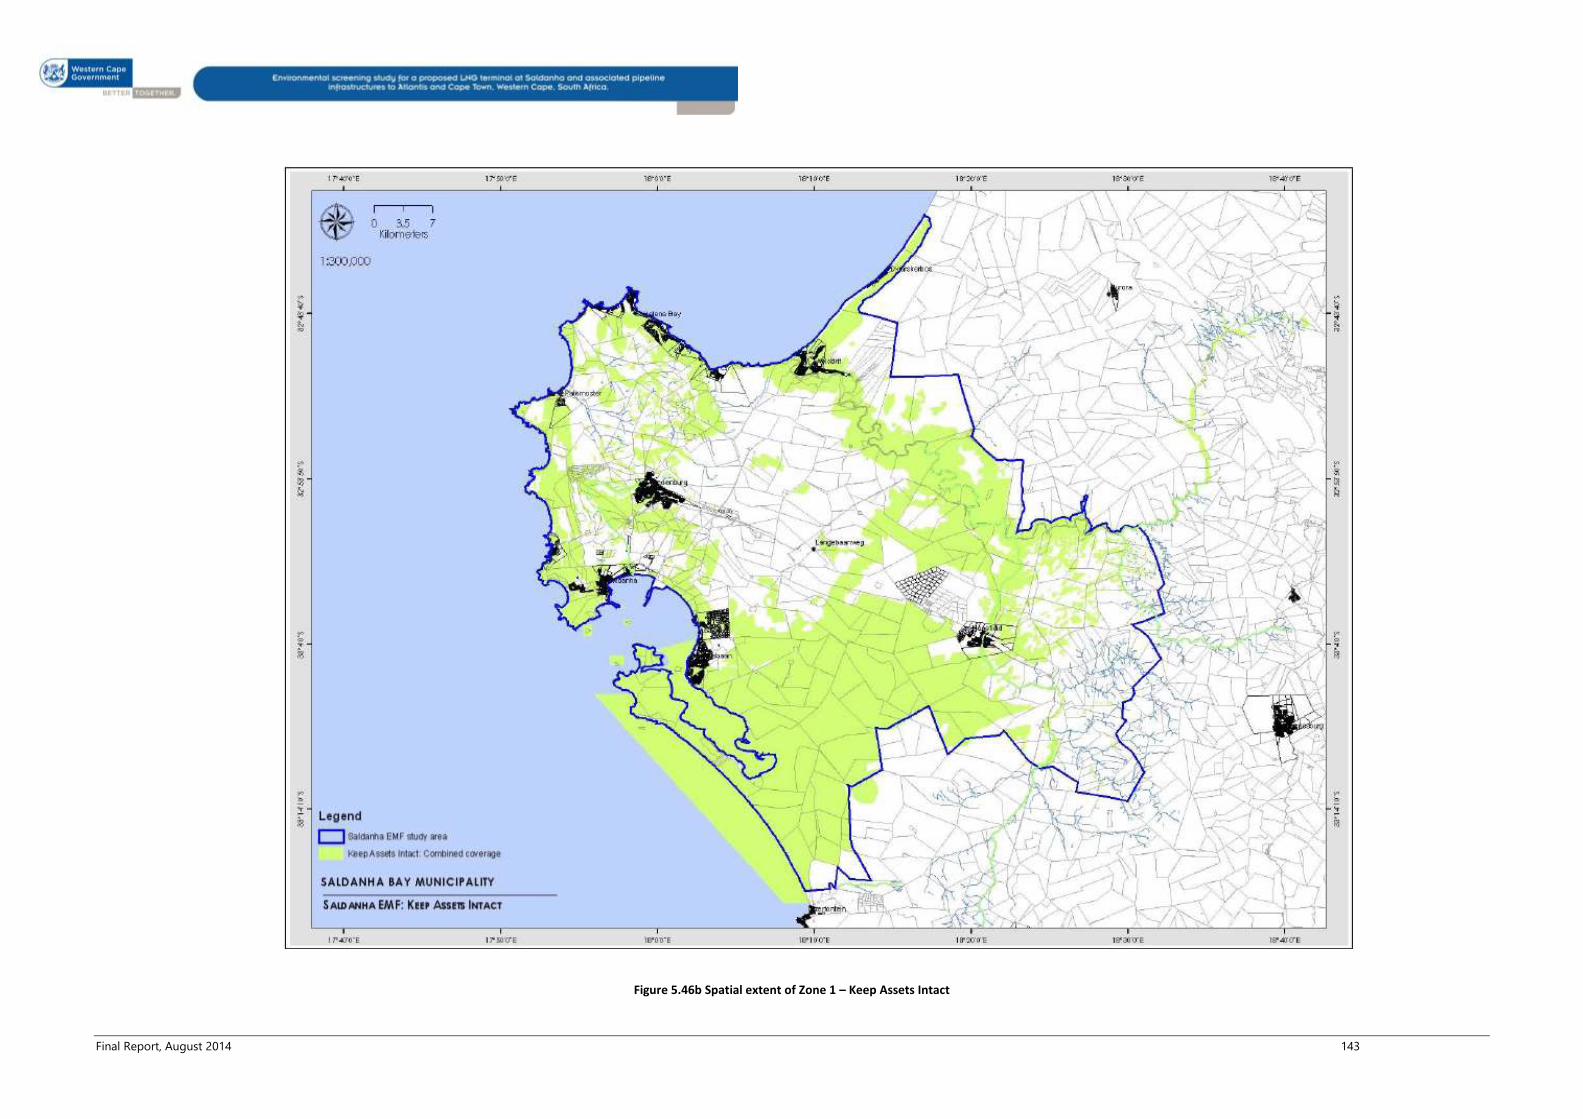
Final Report, August 2014 143
Figure 5.46b Spatial extent of Zone 1 – Keep Assets Intact

Final Report, August 2014 144
Tourism Development Policy Objectives
The SDF review of the tourism economy in the Saldanha Bay Area found that economic conditions
have changed over the years resulting in the potential of the manufacturing industry and the tourism
industry being emphasised whereas in the past fishing and agriculture were more prominent. The
economy of the scenic coastal towns of Saldanha Bay, Paternoster, St. Helena Bay and Langebaan
already rely heavily on what should be a year round flow of tourists (SBM, 2011).
Tourism therefore offers significant socio-economic benefits to the Saldanha Bay Municipal area, with
an expected growth rate of 50% (over the planning timeframe of the 2011 SDF). Tourism’s potential to
offer a year-round source of economic activity associated with areas and socio-economic groups not
generally beneficiated by industrial development, which places considerable emphasis on maintaining
the areas bio-physical integrity. Conservation of the coastline is identified as a key concern in the
Saldanha Bay SDF (SDF, 2011).
The Saldanha Bay Tourism Organisation (SBTO), in collaboration with the Saldanha Bay Municipality, is
undertaking an exercise aimed at generating data on the size of the tourism sector in the area. Using
surveys and other tools it is expected that reasonable estimates will soon be available for figures such
as total visitor numbers, total annual tourism expenditure and the number of jobs in tourism. This will
assist with shedding more light on how important the sector is in the area.

Final Report, August 2014 145
5.5.5. Berg River Municipality
The Berg River Municipality extends over an area of 4 407 km2 and includes 9 urban nodes. The
proposed project will impact on Ward 6 of the municipality (Figure 5.47). This ward is predominantly
rural in character and includes the towns of Aurora, Redelinghuys and Dwarskersbos.
The Berg River IDP (2012-2017) identifies the following goals and strategic objectives:
Goal Strategic objectives
1. A financially viable and sustainable Municipality
that provides an enabling environment for the
development of the Bergrivier economy
To budget strategically, grow and diversify our
revenue and ensure value for money services
2. A quality living environment for all residents that
is conducive to development and investment
To provide and maintain bulk and service
infrastructure that will address backlogs and provide
for future development
3. An effectively managed institution that renders
effective and efficient service delivery
To promote good governance and access to services
Development and capacitation of the municipality’s
human resources
To create an efficient effective, productive and
accountable administration
4. A well-managed built environment that is in
harmony with the natural environment
To develop, manage and regulate the built and
natural environment
To conserve and manage the natural environment
and mitigate the impacts of climate change
5. A safe, healthy and secure environment To promote the safety and security of our citizens
6. An environment that that is conducive to the
wellbeing and development of our community
To promote the wellbeing and social development of
our citizens
Figure 5.47 Berg River Municipality divided according to relevant wards

Final Report, August 2014 146
According to the Berg River SDF (2013), the following spatial objectives are of relevance:
Protect and strengthen the natural environment by protecting high potential agriculture land
to secure food production;
Protect and strengthen the natural environment through the identification and protection of
indigenous biodiversity and sensitive ecosystems within and outside the urban areas as
identified in the Bergrivier Critical Biodiversity Areas Map & Report (Figure 5.48);
Protect and strengthen the built environment through delineating definite urban edges;
Promote and support of local economic development (specifically Tourism, Agriculture and
Industry);
Provide an effective social environment through planning, supplying and maintaining bulk
infrastructure;
Provide an effective social environment through allowing equal access to all facilities
enhancing integration and sustainable settlements.
It is important to note that the coastal belt, wherein the gas pipeline is proposed, contains vegetation
types designated by the SDF as Core 1 areas. These vegetation types are Cape Seashore Vegetation
and Cape Inland Saltpans.

Final Report, August 2014 147
Figure 5.48 Berg River critical Biodiversity Rears Map (source: Berg River IDP 2013)

Final Report, August 2014 148
5.5.6. Swartland Municipality
Swartland Local Municipality is located within the West Coast District Municipality and constitutes and
geographic area of 3700km2. The municipal area has a rural character consisting of predominantly
natural, agricultural and coastal landscapes. Swartland Municipality contains 13 urban nodes scattered
among 12 wards. Of importance to this study is Ward 5, which is located along the coastal belt of the
municipal area (Figure 5.49).
The Swatland IDP (2012 -2017) identifies the following key goals and strategic objectives:
Goal Strategic objectives
1. A financially sustainable municipality with well-
maintained assets
Secured and increased sources of income
Affordable and well managed budget
Curtailing expenditure
Well managed and maintained assets
2. Satisfied, involved and well informed clients Prompt, courteous and responsive service that is
sensitive to the needs/concerns of the public and
respectful of individual rights
External and internal clients that are well informed on
municipal matters
Citizens that are actively participating in municipal
decision-making
3. An effective, efficient, motivated and
appropriately skilled work force
A motivated, productive work force pursuing Swartland
Municipality’s vision, mission, philosophy and values
A well trained and appropriately skilled work force,
striving towards service excellence
Safe and healthy working environment
4. Access to affordable and reliable municipal
infrastructure
Access for all clients to basic municipal infrastructure
Sufficient capacity in respect of infrastructure
Affordable municipal infrastructure
Reliable, safe and well operated and maintained
municipal infrastructure
5. Sustainable development of the municipal area
(with special emphasis on previously neglected
areas)
Social development that improves people’s quality of
life
Sound management of the urban and rural
environment
Economic growth that benefits all
6. A lean, integrated, stable and corruption free
organisation
Improved organisational focus and performance
Improved organisational control environment
Sound work ethics
An effective, efficient and well-disciplined institution
with sustainable capacity
Relevant and efficient IT service and infrastructure
7. Increased community safety through traffic
policing, by-law enforcement and disaster
management
Increase in law compliance
Strengthening of firefighting service
Establishment and maintenance of a Disaster
Management Structure within the Municipality

Final Report, August 2014 149
Figure 5.49 Swartland Municipality divided according to relevant wards
The Swartland SDF (2013) identifies the following planning objectives for the municipal area:
Objective 1: Conservation of agricultural resources and the agricultural landscape
Objective 2: Conservation of natural areas and biodiversity
Objective 3: Conservation of the coastal belt.
Objective 4: Promotion of responsible exploitation and rehabilitation of mineral resources
Objective 5: Conservation of water resources and catchment areas.
Objective 6: Conservation of heritage resources.
Objective 7: Promotion of training, education and sport development (including social
infrastructure)
Objective 8: Promotion of economic development and job creation
Objective 9: Promotion of sustainable land reform and ownership/ establishment of
smallholdings
Objective 10: Provision of adequate housing and promotion of title ownership
Objective 11: Provision and maintenance of adequate social infrastructure
Objective 12: Provision of adequate infrastructure and waste management
Objective 13: Promotion of alternative energy generation and use
Objective 14: Promotion and maintenance of movement networks and multiple transport
modes
Objective 15: Promotion of multi-sectoral activities such as tourism
Objective 16: Protection and promotion of “sense of place” and character
Objective 17: Promotion and maintenance of open space networks

Final Report, August 2014 150
According to the Swartland SDF (2013), the Pretoria Portland Cement (PPC) Factory (located in Ward 4,
close to the town of Riebeeck West) is earmarked for an upgrade which will extend the operational life
of the facility by 30 years. This upgrade, driven by increased international demand for cement,
presents a potential market for LPG as an alternative energy source in the cement manufacturing
process. PPC’s energy policy calls for 10% of its energy requirements to be sourced from renewable or
alternative energy sources by 2017 (PPC Integrated Investors Report, 2013). It also identifies
greenhouse gas emissions as a major threat to its business due to the proposed carbon tax currently
being drafted by government. As a result, greenhouse gas reduction and coal substitution is
prioritized under PPC’s environmental policy. Should PPC consider the use of LPG as an energy
source; DEA&DP should contemplate the amendment of the proposed LPG transmission line to
service this industrial node.
5.5.7. City of Cape Town
The City of Cape Town Metropolitan Municipality extends over an area of 2 461 km2 and has a
population of 3.7 million people. The diverse development needs of the municipality’s large
population, as summarized in the City of cape Town IDP (2012-2017), are as follow:
Strategic Focus Area (SFA) Objective
SFA 1: The Opportunity City Objective 1.1: Create an enabling environment to attract investment that
generates economic growth and job creation
Objective 1.2: Provide and maintain economic and social infrastructure to
ensure infrastructure-led economic growth and development
Objective 1.3: Promote a sustainable environment through the efficient
utilisation of resources
Objective 1.4: Ensure mobility through the implementation of an effective
public transport system
Objective 1.5: Leverage the City’s assets to drive economic growth and
sustainable development
Objective 1.6: Maximise the use of available funding and programs for
training and skills development
SFA 2: The Safe City Objective 2.1: Expanding staff and capital resources in policing
departments and emergency services to provide improved services to all,
especially the most vulnerable communities
Objective 2.2: Resource departments in pursuit of optimum operational
functionality
Objective 2.3: Enhance information-driven policing with improved
information-gathering capacity and functional specialisation
Objective 2.4: Improve efficiency of policing and emergency staff through
effective training
Objective 2.5: Improve safety and security through partnerships
SFA 3: The Caring City Objective 3.1: Provide access to social services for those who need it
Objective 3.2: Ensure increased access to innovative human settlements
for those who need it
Objective 3.3: Assess the possible sale or transfer of rental stock to
identified beneficiaries, using established criteria
Objective 3.4: Provide for the needs of informal settlements and backyard
residences through improved services

Final Report, August 2014 151
Objective 3.5: Provide effective environmental health services
Objective 3.6: Provide effective air quality management and pollution
(including noise) control programs
Objective 3.7: Provide effective primary health-care services
Objective 3.8: Provide substance abuse outpatient treatment and
rehabilitation services
SFA 4: The Inclusive City Objective 4.1: Ensure responsiveness by creating an environment where
citizens can be communicated with and responded to
Objective 4.2: Provide facilities that make citizens feel at home
SFA 5: The Well-run City Objective 5.1: Ensure a transparent government, and work towards
eradicating corruption
Objective 5.2: Establish an efficient and productive administration that
prioritises delivery
Objective 5.2: Establish an efficient and productive administration that
prioritises delivery
The City of Cape Town’s SDF (2012) document focuses on 3 key strategies aimed at achieving the
City’s 2040 vision. This vision is: “To, by 2040, turn Cape Town into one of the world’s greatest cities in
which to live and learn, work, invest and discover – a place of possibility and innovation, with a diverse
urban community and all the opportunities and amenities of city life, within a natural environment that
supports economic vibrancy and inspires a sense of belonging in all.” (City of Cape Town SDF, 2012).
The 3 key strategies and its relevant supporting policy statements are listed below:

Final Report, August 2014 152
Key strategy 1: Plan for employment, and improve access to economic opportunities

Final Report, August 2014 153
Key Strategy 2: Manage urban growth, and create a balance between urban development and
environmental protection
Figure 5.50 indicates the undeveloped/ partially developed areas potentially suited to urban
development in the short to medium term, and areas towards which development could be directed in
the longer term (15 to 50 years) if the need arises and the infrastructure is in place to sustain such
growth. The locations most suited to urban development in the short-to medium term are located
outside the core 1 and 2, buffer 1 and 2, intensive agriculture, smallholding and industrial areas, and
the areas affected by development hazards.
Of interest for the proposed project is the location of the Koeberg Nuclear power station and the
associated safety zones governed by the Regulations on Development in the Formal Emergency
Planning Zone of the Koeberg Nuclear Power Station to Ensure Effective Implementation of the
Koeberg Nuclear Emergency Plan (Regulation N0 962, GG 33678, 2010). These regulations prohibit any
development in respect of properties situated within the precautionary action planning zone (5km
zone around the power station), which may result in an increase in the population, including
permanent residential or transient population. Similarly, no approval shall be given for any
development within or intersecting the formal emergency planning zone (16km zone), which may
result in an increase in the population, including permanent residential or transient population, unless
demonstrated by means of a traffic evacuation model approved by the municipal council which must
comply with the evacuation time criteria.

Final Report, August 2014 154
The Regulations for the sea-shore and the sea opposite the farm Duynefontyn 34, situated near
Melkboschstrand, administrative district of the Cape, on which the electricity supply commission is
establishing a nuclear power station (No 522, April 1977) prohibit any activity (vessels, sailing,
swimming etc.) on that portion of the sea-shore for a distance of 2 km seawards from the low-water
mark (Figure 5.51).
Key Strategy 3: Build an inclusive, integrated, vibrant city

Final Report, August 2014 155
Figure 5.50 Areas potentially suited to urban development (City of Cape Town SDF, 2012)

Final Report, August 2014 156
Figure 5.51 Prohibited areas (Sea-shore Act Regulations, No 522 of April 1977)

Final Report, August 2014 157
5.5.8. Drakenstein Local Municipality
Drakenstein Municipality is located within the Cape Winelands District Municipality and extends over
an area of 1 538 km2 and comprises of 4 urban nodes, namely; Paarl, Wellington, Gouda and Harmon.
The Drakenstein IDP (2012-2017) identifies the following Key Performance Areas (KPAs), which are
sub-divided into Key Focus Areas (KFA):
Key Performance Area (KPA) Key Focus Areas (KFA)
KPA 1: Governance and Stakeholder Participation Governance Structures
Stakeholder Participation
Risk Management
Policies, Strategies and Plans
By-laws
Monitor and Evaluation
IGR
Communications (Internal and External)
KPA 2: Physical Infrastructure and Energy
Efficiency
Energy Efficiency
Roads and Storm Water Infrastructure
Water and Sanitation Infrastructure
Solid Waste Infrastructure
City Entrances
Local Amenities and Public Places
KPA 3: Services and Customer Care Water and Sanitation
Electricity
Cleansing and Waste Management
Customer Relations
Public Transport
Branding and Website
Building Regulations & Municipal Planning
KPA 4: Economic Growth and Development Growth
Job creation
Investment (domestic and foreign)
Socioeconomic Status
Urban Renewal
Skills and Education
Trade and Industry
Stability and Sustainability
Rural Development
Tourism
KPA 5: Health, Safety and Environment Traffic, Vehicle Licensing and Parking
Environmental Management
Disaster Management
Firefighting Services
Municipal Law Enforcement
Parks, Cemeteries and Open Spaces
KPA 6: Social and Community Development Sustainable Human Settlements (housing)
Sport and Recreation

Final Report, August 2014 158
Arts, Crafts and Culture
Libraries
Cemeteries and Crematoria
Poverty Alleviation
Special Programmes (Gender, Elderly, Youth and
Disabled)
Child Care Facilities(ECD)
Control of Public Nuisances
KPA 7: Institutional Transformation Organisational Structure
Human Capital and Skills Development
Programme and Project Management
Performance Management
Systems and Technology
Processes and Procedures
Facilities
Equipment and Fleet Management
KPA 8: Financial Sustainability Revenue Enhancement
Cost Containment / Management
Asset Management
Capital Expenditure
Supply Chain Management
Financial Reporting
Budgeting / Funding
The Drakenstein SDF (2010) identifies the following KPAs for the municipal area:
Economic Development: Stimulate and maximize effective and efficient economic
development and entrepreneurial opportunities to facilitate economic growth, job creation,
the upliftment of living standards and poverty alleviation
Quality Environments: Enhance the environmental quality through sustainable practices to
create a quality, safe and healthy living environment
Social Development and Community Services: Respond to the social development and
community services needs of communities through increased access to quality and equitable
facilities and services for the upliftment and integration of communities
Safety and Security: Increase the safety and security and quality of living environments
through the combating of crime, effective law enforcement, road safety, civil protection
services, disaster management and related awareness programmes and community
involvement
Engineering Infrastructure and related Services: Meet basic community needs through the
provision of affordable and sustainable engineering infrastructure and related facilities and
services to all inhabitants
Institutional Development: Develop the municipality into a democratic, enabling, efficient and
financially viable institution by capacitating and structuring the organization to meet the
people’s needs within functional duties that are developmental orientated and performance
driven and facilitates the involvement of private sector and civil society in the development of
the area, also with reference to the lowering of operational cost, smarter work practices and

Final Report, August 2014 159
culture, the enhancement of and securing of the income base and the creation of strategic
partnerships
A Draft Environmental Management Framework (EMF) was compiled for the Drakenstein municipality
in 2012. Chapter 10 (Environmental Management Zones) of the EMF identifies areas to be avoided by
future development due to socio-ecological sensitivity. The proposed project does not appear to fall
within any Zone 1 (Keep intact) areas (Figure 5.52). However, ground-truthing of this finding must be
conducted during the Scoping Phase of future EIA process connected to this project. In this regard it is
useful to note that linear infrastructure is not allowed in Zone 1 areas; except if such infrastructure is
essential to basic needs and if no spatial alternative is available for such infrastructure (page 101 of
the DEA&DP Draft EMF for the Darkenstein Municipality, 2012). It appears reasonable to argue that
the proposed project will not have any viable spatial/locational alternative due to the need for gas
distribution within the towns of Paarl and Wellington. The issue of whether or not the proposed
infrastructure is considered essential is however unclear at this stage.

Final Report, August 2014 160
Figure 5.52 Zone 1 areas (green areas) within the Drakenstein Municipal area

Final Report, August 2014 161
5.5.9. Stellenbosch Local Municipality
The Stellenbosch Municipality is located within the Cape Winelands District Municipality and covers an
area of 900 km2. It houses a population of 270 000 people and contains 10 urban nodes and various
informal settlements. According to the Stellenbosch Municipality IDP (2012-2017); the following
strategic goals have been identified as relevant to the municipal area:
Strategic goal 1: a leader in governance, partnership and citizen participation
Strategic goal 2: a skilled and customer focused administration
Strategic goal 3: sound and sustainable municipal financials
Strategic goal 4: a treasured, protected environment
Strategic goal 5: responsible spatial and development management
Strategic goal 6: opportunity for enterprise, creativity and business development
Strategic goal 7: self-help action to dignified living
Strategic goal 8: efficient infrastructure and services
Strategic goal 9: a safe town
A SDF was compiled in 2012 to guide the future spatial form of the Stellenbosch Municipal area. The
Stellenbosch Municipality SDF (2012) identifies the following 7 strategic perspectives applicable to the
area:
Interconnected nodes
Car Free Transport
Inclusive Economic Growth
Optimal Land Use
Resource Custodianship
Food And Agriculture
Heritage
The following broad proposals are offered by the SDF to guide future development in the town of
Stellenbosch, which would be directly affected by the proposed development:
Reconceptualise the town as a complex of 5 mixed income, mixed use interdependent urban
villages focusing on the following centres:
o North: Cloetesville/Kayamandi on intersection (to be extended) of Bassi
Street/R304/Cloesteville Roads.
o Centre: Existing town centre.
o East: Idasvallei/Uniepark on intersection of Helshoogte/Cluver Roads.
o West: Onderpapegaaiberg/SFW on intersection of Devon Valley/Adam Tas/Oude
Libertas Roads.
o South: Paradyskloof on intersection of Blaauklippen/Strand Roads.
Encourage social and GAP housing in these centres.
Redevelopment, infill and new development are possible on 460 ha of government, municipal
and privately owned land identified to increase thresholds for public transport and prevent
sprawl.

Final Report, August 2014 162
Encourage low key densification of existing suburbs through 2nd dwellings and subdivision
down to minimum erf size.
Encourage redevelopment to densities from 100 to 200 dwelling units/ha gross (2 - 4 storey
townhouses and apartment buildings) along main transport routes and around public open
spaces.
Rivers and canals should be declared river conservation corridors with 10 to 30m setbacks
from the river bank.
Protect important heritage buildings and precincts and support current heritage areas to
extend into surrounding suburbs so as to promote outward growth of high quality urban
areas.
Encourage continuous street trading and business along Bird Street and extended into
Khayamandi, Cloetesville and Idasvallei along Cluver and Merriman Streets.
Upgrade main streets with trees, landscaping, cycling and pedestrian facilities similar to that
already completed in Dorp, Plein and Church Streets.
Consider the special needs of the university and ensure that its development follows the same
principles as the rest of the town and that the campus does not become a gated complex
blocking movement through its precincts.
Define an urban edge that seeks to limit outward growth of the town (but accommodates new
development areas likely to be required over the next decade).
5.5.10. The Cape West Coast Biosphere reserve
The Cape West Coast Biosphere reserve (Figure 5.53) was established in November 2000 and is
registered by the United Nations Educational, Scientific and Cultural Organisation (UNESCO). The
reserve comprises both marine and terrestrial ecosystems, which enjoys 3 different levels of
protection. Core zones are statutory conserved areas; Buffer zones consist of privately owned veld on
which limited development is allowed; while Transition zones are areas which have already been
developed to some extent (Figure 5.54). These zones provide workable management zones according
to the relevant levels of conservation, development and degradation and are incorporated into the
Saldanha Bay SDF and IDP.

Final Report, August 2014 163
Figure 5.53 Saldanha Bay, Spatial Development Framework, Cape West Coast Biosphere Reserve, 2011
Figure 5.54: Type of land-use and intensity of land-use allowed in different zones of Biosphere reserve
(Source: Dennis Moss Partnership: 1999)